Embed Size (px)
Citation preview
Hospital discharges andlength of stay statistics Statistics Explained
Source Statistics Explained (httpseceuropaeueurostatstatisticsexplained) - 28112019 1
Data extracted in November 2019Planned article update November 2020
This article presents an overview of European Union (EU) statistics related to the number and rate of hospitaldischarges and the average length of stay for patients in hospitals It provides information relating to hospitaldischarges of in-patients and day care patients providing analyses for the age and gender of patients and theirdiagnoses this may be used as an indicator for the level of healthcare activity in hospitals A similar collectionof analyses is presented for the average length of stay for in-patients
This article is one of a set of statistical articles concerning healthcare activities in the EU which forms part ofan online publication on health statistics
Hospital dischargesA hospital discharge occurs when a hospital patient is formally released after an episode of care The reasons fordischarge include finalisation of treatment signing out against medical advice transfer to another healthcareinstitution or because of death The data should cover all types of hospitals including general hospitals mentalhealth hospitals and other specialised hospitals as well as all types of diagnosis and treatment including dis-charges of healthy new-borns For reasons of comparability discharges of healthy new-borns have been excludedfrom the data presented in this article
In practice data availability is more limited in some national statistics and a summary of the main devi-ations from the standard coverage is provided in the Data sources section below In cases where nationalstatistics exclude any types of hospitals this will understate to a greater or lesser extent the number and rateof discharges This is particularly true for certain types of diagnoses if the exclusions are related specialisationsfor example the exclusion of psychiatric hospitals or mental health care institutions impacts on the data fordischarges of patients diagnosed with mental and behavioural disorders
Ireland France the United Kingdom Croatia Belgium and Portugal reported more day carepatients than in-patients
Among the 26 EU Member States for which recent data are available for in-patients and day care patients(incomplete data for Bulgaria and Greece) only Ireland France the United Kingdom (2016 data) CroatiaBelgium and Portugal (2015 data) reported more discharges of day care patients than in-patients in 2017 Bycontrast there were around 10 times as many in-patient discharges as discharges of day care patients in Lithua-nia and Sweden and this ratio reached a level between 29 and 41 times as high in Czechia Germany and Slovakia
Relative to population size discharge rates in 2017 for in-patients were generally in the range of 10 000 to20 000 per 100 000 inhabitants for most EU Member States (see Figure 1) Romania Lithuania GermanyAustria and particularly Bulgaria (32 342 per 100 000 inhabitants) reported higher rates the NetherlandsPortugal (2015 data) and Cyprus (7 720 per 100 000 inhabitants) reported the lowest rates Comparing thehighest and lowest values the in-patient discharge rate in Bulgaria was 42 times as high as in Cyprus
Figure 1 Hospital discharges in-patients 2012 and 2017(per 100 000 inhabitants)Source Euro-stat (hlth_co_disch2)
Turning to discharges of day care patients relative to population size (see Figure 2) the discharge rates amongthe EU Member States in 2017 were generally in the range of 1 200 to 10 100 per 100 000 inhabitants RomaniaBelgium the United Kingdom (2016 data) Croatia Ireland and France reported rates that were higher (15 800to 24 600 per 100 000 inhabitants) Germany Czechia and Slovakia reported much lower rates than the otherMember States at 669 660 and 456 day care discharges per 100 000 inhabitants respectively
Hospital discharges and length of stay statistics 2
Figure 2 Hospital discharges day care patients 2012 and 2017(per 100 000 inhabitants)SourceEurostat (hlth_co_disch4)
The highest discharge rate for all hospitalised patients was in France
Combining discharge rates in 2017 for in-patients and day care patients the highest discharge rate for allhospitalised patients was in France which was the only EU Member State with a rate over 40 000 per 100 000inhabitants (incomplete data for Bulgaria and Greece) Romania Ireland Croatia Belgium Bulgaria (exclud-ing day care patients) and Austria reported rates between 32 000 and 36 000 per 100 000 inhabitants while allother Member States (for which data are available) reported rates below 30 000 per 100 000 inhabitants withthe lowest rate of all in Cyprus 9 800 per 100 000 inhabitants
Between 2012 and 2017 discharge rates for in-patients decreased for a majority of the EU Member States(19 out of 27 incomplete data for Greece) The highest relative increases were registered in Bulgaria andFrance while the biggest contractions were recorded in Luxembourg (2012-2016) Sweden (2013-2017) and theNetherlands By contrast a majority of the EU Member States (no data or incomplete data for Bulgaria andGreece) reported an increase in discharge rates for day care patients during the period from 2012 to 2017 theexceptions being Finland (2013-2017) Lithuania Slovakia Portugal (2012-2015) Italy the Netherlands andSweden (2013-2017)
Hospital discharges by sex and ageFewer discharges of male patients than of female patients in nearly all EU Member States
Hospital discharges and length of stay statistics 3
Among the EU Member States for which data are available (no data for Greece) in all but one mdash Cyprusmdash there were more discharges of female in-patients than male in-patients in 2017 as was also the case in mostof the non-member countries shown in Figure 3 Montenegro being the only exception For day care patientsCyprus France and Germany reported more discharges of male patients than female patients
Figure 3 Ratio of male to female hospital discharges 2017(ratio)Source Eurostat(hlth_co_disch1) and (hlth_co_disch3)
Tables 1 and 2 provide an analysis of discharge rates in 2017 by age distinguishing male and female patientsas well as in-patients and day care patients Due to space constraints only a selection of age ranges is shownwhereas the full set of data mdash available online mdash has been used for the following commentary
Among in-patients discharge rates were generally high for infants aged less than one year then fell to alow between late teenage years or early adulthood for men or later adulthood for women before increasingagain in old age Discharge rates for infants aged less than one year exceeded 100 000 per 100 000 inhabitants inEstonia and Romania for both males and females and in Lithuania for males note that these data do not includedischarges of healthy new-borns The lowest discharge rates for infants aged less than one year mdash below 20 000per 100 000 inhabitants mdash were recorded in Portugal (2015 data) for males and females and in Luxembourg(2016 data) for females
Hospital discharges and length of stay statistics 4
Table 1 Hospital discharges of in-patients by age (selected age ranges) and by sex 2017(per 100000 inhabitants)Source Eurostat (hlth_co_disch2)
Different age pattern to in-patient discharge rates for males and females mainly characterisedby high discharge rates for women in the typical child-bearing age range
Leaving aside the youngest age group and focusing on discharge rates of in-patients aged one year or overthere were clearly different age patterns for males and females For males in-patient discharge rates generallyfell from higher rates among very young males to lower rates among men in their teens twenties and early thir-ties before rising again to peak amongst the oldest age groups For females the in-patient discharge rates alsofell from high rates among the youngest girls to low rates among girls in their early and late teens In-patientdischarge rates for women then increased again to peak in womenrsquos early thirties Thereafter the dischargerates dropped back down to a relatively low rate for women in their early forties before increasing again in olderage ranges in a similar manner to that observed for males although with generally lower discharge rates forolder females The increase and subsequent decrease observed for females in early adult years is focused in thetypical age ranges for child-bearing
Discharge rates for day care patients quite similar for males and females
While for in-patients the highest discharge rates were normally recorded for infants aged less than one yearfor day care patients this was only the case in Denmark (2016 data) Germany Slovakia and Sweden (no dataor incomplete data for Bulgaria Estonia and Greece) In fact a quite large minority of EU Member Statesrecorded their lowest discharge rates for day care patients among infants aged less than one year BelgiumLatvia and Austria just for females and France Luxembourg (2016 data) Hungary Malta the Netherlandsand Portugal (2015 data) for males and females
Hospital discharges and length of stay statistics 5
Table 2 Hospital discharges of day care patients by age (selected age ranges) and by sex2017(per 100 000 inhabitants)Source Eurostat (hlth_co_disch4)
For males day care discharge rates for many EU Member States fell from a high rate for infants aged less thanone year through to their lowest level for one of the age groups between 10-14 and 35-39 and then graduallyincreased to their highest level for the age group 75-79 years (or a slightly older or slightly younger age group)Some exceptions to this pattern included Germany where the highest day care discharge rates for males wererecorded for the 95 years and over age group while as noted above in France Luxembourg (2016 data)Hungary Malta the Netherlands and Portugal (2015 data) the lowest day care discharge rates for males wererecorded among infants aged less than one year Denmark Slovakia and Sweden were also notable exceptions inthat the day care discharge rates for older generations of males never passed those for infants aged less than oneyear (which therefore had the highest rates) while in Lithuania the highest day care discharge rate for maleswas for those aged 1-4 years
For females the pattern was somewhat different The lowest day care discharge rates for females were mostoften recorded in some of the youngest age groups particularly aged 5-9 years and 10-14 years or even throughto 20-24 Atypically the lowest rates were recorded mdash as noted above mdash for infants aged less than one yearin Belgium France Latvia Luxembourg (2016 data) Hungary Malta the Netherlands Austria and Portugal(2015 data) and for the age group 95 years and over in Czechia Croatia Italy and Romania There was analmost universal pattern for day care discharge rates for females to rise again from the age group 15-19 yearsIn line with what was observed for men day care discharge rates for females most commonly peaked for the agegroup 75-79 years (or a slightly older or slightly younger age group) before dipping back down for the older agegroups A small number of Member States recorded their highest day care discharge rates for women amongmuch younger age groups for infants aged less than one year (Denmark (2016 data) Germany Slovakia andSweden) or for the age groups 30-34 years or 35-39 years (Czechia Italy Lithuania and Slovenia)
Hospital discharges and length of stay statistics 6
Hospital discharges by diagnosisDischarges by diagnosis mdash as presented in Tables 3 and 4 as well as Figure 4 mdash refer to the principal diagnosisin other words the main condition diagnosed at the end of the hospitalisation The main condition is the oneprimarily responsible for the patientrsquos need for treatment or investigation
Table 3 Hospital discharges of in-patients by diseaseinjury 2017(per 100 000 inhabi-tants)Source Eurostat (hlth_co_disch2)
In nearly all EU Member States circulatory diseases were the most common main diagnosis forin-patients
For in-patients the main diagnosis in 2017 across EU Member States was circulatory diseases as shown inTable 3 and Figure 4 The rare exceptions to this were Ireland where pregnancy and childbirth was the mostcommon Luxembourg (2016 data) where diseases of the musculo-skeletal system and connective tissue werethe most common and the United Kingdom (2016 data) where diseases of the respiratory system were themost common In Luxembourg circulatory diseases were the second most common diagnosis whereas in theUnited Kingdom and Ireland they were only the third and fourth most common Across all of the MemberStates other diagnoses that were also common included diseases of the digestive system neoplasms (benign ormalignant cancers) diseases of the respiratory system injuries and other external causes as well as pregnancyand childbirth
Hospital discharges and length of stay statistics 7
Figure 4 Hospital discharges of in-patients diseases of the circulatory system 2017(per 100 000inhabitants)Source Eurostat (hlth_co_disch2)
The most common main diagnoses for day care patients were neoplasms and diseases of the di-gestive or genitourinary systems
For day care patients the most common main diagnosis was less clear cut with a majority of the EU MemberStates reporting their highest discharge rates for either neoplasms or for diseases of the genitourinary systemreflecting the use of day care for some cancer treatments (such as chemotherapy) and some kidney diseasetreatments (such as dialysis) Other common diagnoses included diseases of the digestive system in BelgiumIreland and Malta diseases of the circulatory system in Denmark (2016 data) Germany and Sweden injuriesand other external causes in Poland and Finland and mental and behavioural disorders in France
Hospital discharges and length of stay statistics 8
Table 4 Hospital discharges of day care patients by diseaseinjury 2017(per 100 000 inhabi-tants)Source Eurostat (hlth_co_disch4)
Average length of hospital stay for in-patientsThe average length of stay for in-patients is calculated from the total number of nights spent in hospitals byin-patients divided by the total number of discharges As such the average length of stay may be less influencedby coverage issues (insofar as the average length of stay in the institutions excluded from the coverage can beassumed to be similar to that in the institutions that are covered) This is clearly not the case when only acutecare institutions are covered but not those providing long-term care and in these cases the average length ofstay is likely to be underestimated A summary of the main deviations from the standard coverage is providedin the Data sources section below and highlights those national statistics where some of these issues can be found
The average length of hospital stays fell in most EU Member States during the five years between2012 and 2017
In 2017 (or the latest year for which data are available see Figure 5) the average length of a hospital stay forin-patients ranged from 53 days in Bulgaria to 91 days in France with the Netherlands below this range (45days note the data for the Netherlands exclude all long-stay hospitals) and Czechia (96 days) and Hungary(98 days) above Among the non-member countries for which data are available Turkey (42 days 2016 data)reported a particularly low average length of stay and Serbia (97 days) a particularly high average
Hospital discharges and length of stay statistics 9
Figure 5 Average length of stay for hospital in-patients 2012 and 2017(days)Source Eurostat(hlth_co_inpst)
Comparing the average length of stay in 2017 (or latest year) with the situation in 2012 about half of the EUMember States mdash 13 out of 27 (incomplete data for Greece) mdash observed a reduction in the average lengthof time that patients spent in hospital By far the largest decrease was in Finland where the average fellfrom 106 days to 78 days between 2013 and 2017 By contrast 11 Member States recorded an increaseduring this period and by far the largest was in France (up from 57 days to 91 days) Consequently therewere three Member States where there was no change mdash Poland (2013-2017) Romania and Sweden (2013-2017)
Males generally spent longer than females in hospital
Although there were generally more female in-patients than male in-patients (see Figure 3) the average lengthof stay for male in-patients in 2017 was generally longer in most of the EU Member States The main exceptionsto this pattern as can be seen from Figure 6 were Malta Hungary and to a lesser extent Belgium where femalein-patients recorded clearly longer hospital stays By contrast in Germany and Austria the average length ofstays for female and male patients was the same
Hospital discharges and length of stay statistics 10
Figure 6 Average length of stay for hospital in-patients by sex 2017(days)Source Eurostat(hlth_co_inpst)
while the average length of in-patient stays tended to be shortest for children aged 1-9 yearsand highest for people aged 85 years or over
A detailed age group analysis of the average length of in-patient hospitals stays is presented in Table 5 Theaverage length of stay in 2017 was generally lower for young children aged 1-4 years or 5-9 years than it was forthe youngest age group in other words infants aged less than one year Between the age groups 5-9 years and10-14 years there was an increase in the average length of stay in all EU Member States but the average thenremained relatively stable through to the age group 30-34 years Thereafter the average length of in-patientstays increased through to the age group 55-59 years after which it stabilised briefly From the age group 65-69years upwards the average length of stay tended to get higher with each age group until it peaked in mostMember States in one of the higher age groups specifically 85-89 90-94 or 95 years and over Nevertheless inGermany the longest average stays were recorded for the age groups 55-59 years for Cyprus and Sweden forinfants aged less than one year and for Denmark (2016 data) among infants aged less than one year and peopleaged 20-24 years Hungary had the biggest difference in average length of stay between the age groups withan average of 34 days for children aged 1-4 years rising up to an average of 328 days for people aged 95 yearsand over
Hospital discharges and length of stay statistics 11
Table 5 Average length of stay for hospital in-patients by age group 2017(days)Source Eurostat(hlth_co_inpst)
In-patients with mental and behavioural disorders generally spent the longest time in hospitalper stay
Among the nine diagnoses presented in Table 6 the average length of stay for in-patients was notably longer formental and behavioural disorders Note that in several Member States the data presented in Table 6 excludedischarges from some or all psychiatric hospitals or mental health care institutions The longest average stays forin-patients with mental and behavioural disorders were reported for Czechia the United Kingdom (2016 data)Spain Poland and Slovenia where the average stay was greater than 340 days Among the other diagnoses theaverage lengths of stay were generally highest for patients being diagnosed or receiving treatment for diseasesof the circulatory system or neoplasms
Hospital discharges and length of stay statistics 12
Table 6 Average length of stay for hospital in-patients by diseaseinjury 2017(days)SourceEurostat (hlth_co_inpst)
For several of the diagnoses shown in Table 6 there was a relatively high degree of uniformity in the averagelength of stay reported by each EU Member State For example in-patients diagnosed with diseases of thedigestive system spent on average between 41 days (in Malta) and 67 days (in Italy) in hospital patientsdiagnosed with diseases of the respiratory system those diagnosed with diseases of the genitourinary systemand those diagnosed with neoplasms also reported quite similar average lengths of stay across the MemberStates By contrast for diseases of the circulatory system the average length of stay for in-patients ranged from43 days in Bulgaria to 126 days in Hungary For mental and behavioural disorders the average length of stayvaried even more although this is influenced to some extent by the fact that the length of stay of patients insome or all psychiatric hospitals or mental health care institutions are excluded in several Member States
Source data for tables and graphsbull Hospital discharges and length of stay tables and figures
Data sources
Hospital discharges and length of stay statistics 13
Key conceptsAn in-patient is a patient who is formally admitted (or rsquohospitalisedrsquo) to an institution for diagnosis treatmentandor care and stays for a minimum of one night or more than 24 hours in the hospital or other institutionproviding in-patient care In contrast to in-patient care the intention for day care is to discharge the patient onthe same day as admitted Day care comprises planned medical and paramedical services delivered to patientswho have been formally admitted for diagnosis treatment or other types of health care
An in-patient or day care patient is discharged from hospital when formally released after a procedure orcourse of treatment (episode of care) A discharge may occur because of the finalisation of treatment signingout against medical advice transfer to another healthcare institution or because of death
The average length of stay of in-patients in hospitals is computed by first calculating the number of hospi-tal days (or bed-days or in-patient days) from the date of admission to an in-patient institution as the date ofdischarge minus date of admission and then dividing this by the number of discharges during the year
Healthcare resources and activitiesStatistics on healthcare activities such as information on discharges and average length of stay are documentedin this background article which provides information on the scope of the data its legal basis the methodologyemployed as well as related concepts and definitions
For country specific notes on this data collection please refer to this background information document Data do not always cover all hospitals treatments or types of patients The main exceptions noted for 2017data (or the latest available year when 2017 data are not available) by EU Member States and non-membercountries are listed below
The main diagnosis for discharges is based on the International Statistical Classification of Diseases andRelated Health Problems (ICD-10) The diagnoses presented in this article include
bull C00-D48 Neoplasms
bull F00-F99 Mental and behavioural disorders
bull I00-I99 Diseases of the circulatory system
bull J00-J99 Diseases of the respiratory system
bull K00-K93 Diseases of the digestive system
bull M00-M99 Diseases of the musculo-skeletal system and connective tissue
bull N00-N99 Diseases of the genitourinary system
bull O00-O99 Pregnancy childbirth and the puerperium
bull S00-T98 Injury poisoning and certain other consequences of external causes
SymbolsNote on tables
bull a colon rsquorsquo is used to show where data are not available
bull a dash rsquondashrsquo is used to show where data are not applicablerelevant
Hospital discharges and length of stay statistics 14
Types of institutions Main exception(s)
Belgium Excludes long-stay hospitals (covers only acute care hospitals) and psychi-atricmental health hospitals
Germany Excludes prevention and rehabilitation facilities with less than 100 beds
Ireland Excludes private hospitals long-stay hospitals (covers only acute care hospi-tals) and psychiatricmental health hospitals
Spain Day cases excludes psychiatric and long-stay hospitals unless they form ahospital complex
France Excludes long-term care hospitals
Croatia and Latvia Excludes prison hospitals
Italy and Poland Excludes military hospitals
Cyprus Excludes private hospitals and psychiatricmental health hospitals
The Netherlands Excludes private and semi-private hospitals mental health and substanceabuse hospitals epilepsy clinics and long-stay hospitals (covers only acutecare hospitals)
Portugal Excludes hospitals not on the mainland and private hospitals
Slovenia and Iceland Excludes rehabilitative care in specialised centres
The United Kingdom Excludes private hospitals except insofar as they are providing services com-missioned by the public sector (national health service)
Norway Excludes private hospitals
Switzerland Excludes prison and military hospitals
Serbia Excludes private hospitals prison hospitals and military hospitals
Types of activity treatment Main exception(s)
The Netherlands Excludes part-time psychiatric treatments in general or university hospitalswith a psychiatric ward rehabilitation day-treatment day care admissionsfor normal deliveries of babies
Types of patient Main exception(s)
Belgium (184 days) Italy (365days) and Slovakia (700 days)
Excludes long-term patients
France and Luxembourg Excludes non-residents
Hospital discharges and length of stay statistics 15
ContextStatistics on hospital discharges and the average length of hospital stays reflect the balance between the demandfor and supply of hospital services They represent how many patients were actually admitted (as in-patientsor day care patients) and how long they were treated they can be complemented by other supply side statisticssuch as occupancy rates (see an article on hospital beds ) the frequency of operations and procedures health-care expenditure as well as demand side statistics (see the article on unmet medical needs )
The balance between in-patient and day care patient discharges as well as the number of out-patients andthe average length of hospital stays reflect a number of factors including
bull demographic changes such as an ageing population which pushes up demand for hospital services
bull budgetary pressures to keep costs down and
bull changes in practices and technology impacting on the length of acute care andor the balance betweenin-patient care day care and out-patient care
The European core health indicators (ECHI) shortlist includes indicators on hospital in-patient discharges hos-pital day cases and average length of stay in the chapter on health services
Other articlesOnline publications
bull Health in the European Union mdash facts and figures
bull Disability statistics
Healthcare activities and expenditure
bull Beds
bull Consultations
bull Healthcare expenditure
bull Surgical operations and procedures
bull Unmet needs for health care
Methodology
bull Healthcare non-expenditure
General health statistics articles
bull Health statistics introduced
bull Health statistics at regional level
bull The EU in the world mdash health
Main tablesbull Health (t_hlth)
Health care (t_hlth_care)
Hospital discharges and length of stay statistics 16
Databasebull Health (hlth)
Health care (hlth_care)
Health care activities (hlth_act)Hospital discharges and length of stay for in-patient and curative care (hlth_co_dischls)
Hospital discharges - national data (hlth_hosd)Hospital discharges by diagnosis in-patients total number (hlth_co_disch1)Hospital discharges by diagnosis in-patients per 100 000 inhabitants (hlth_co_disch2)Hospital discharges by diagnosis day cases total number (hlth_co_disch3)Hospital discharges by diagnosis day cases per 100 000 inhabitants (hlth_co_disch4)
Length of stay in hospital (hlth_hostay)In-patient average length of stay (days) (hlth_co_inpst)
Dedicated sectionbull Health
Methodologybull Healthcare resources (ESMS metadata file mdash hlth_res_esms)
External linksbull European Commission mdash Directorate-General for Health and Food Safety mdash European core health indi-
cators (ECHI)
bull European Commission mdash Directorate-General for Health and Food Safety mdash Health systems performanceassessment
bull European Commission mdash Directorate-General for Health and Food Safety mdash Public health
bull OECD mdash Health policies and data
bull WHO Global Health Observatory (GHO)
bull World Health Organisation (WHO) mdash Health systems
Hospital discharges and length of stay statistics 17
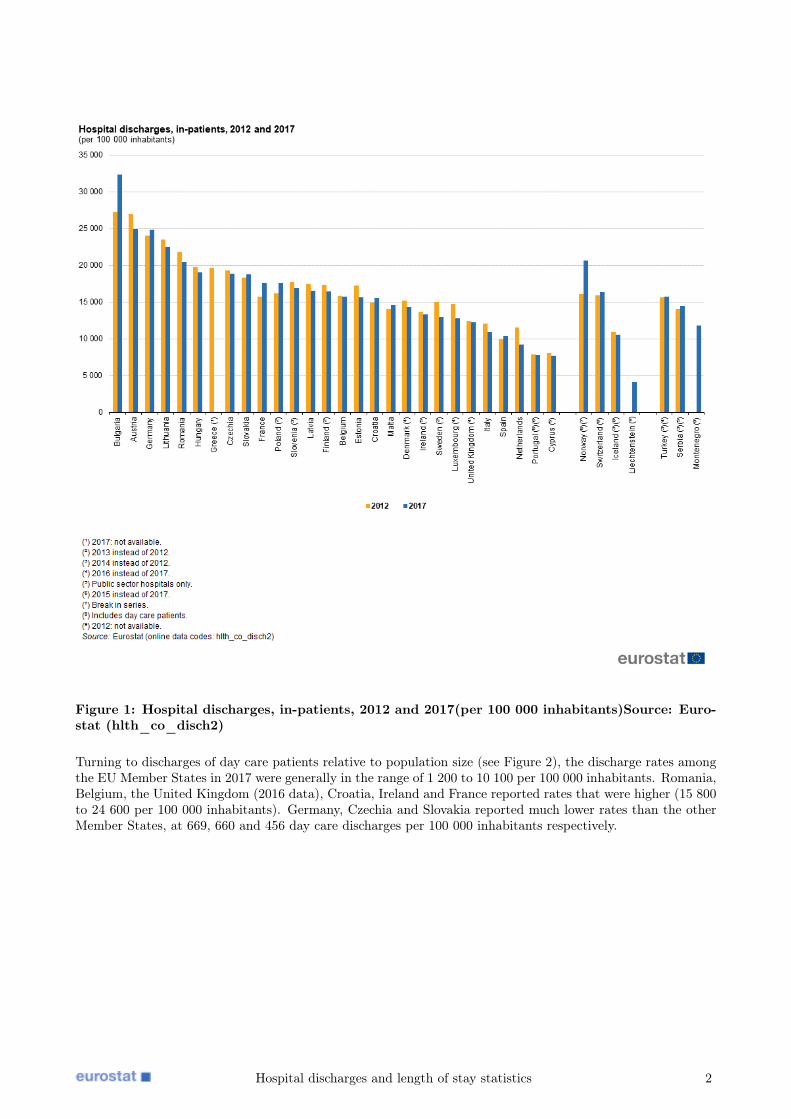
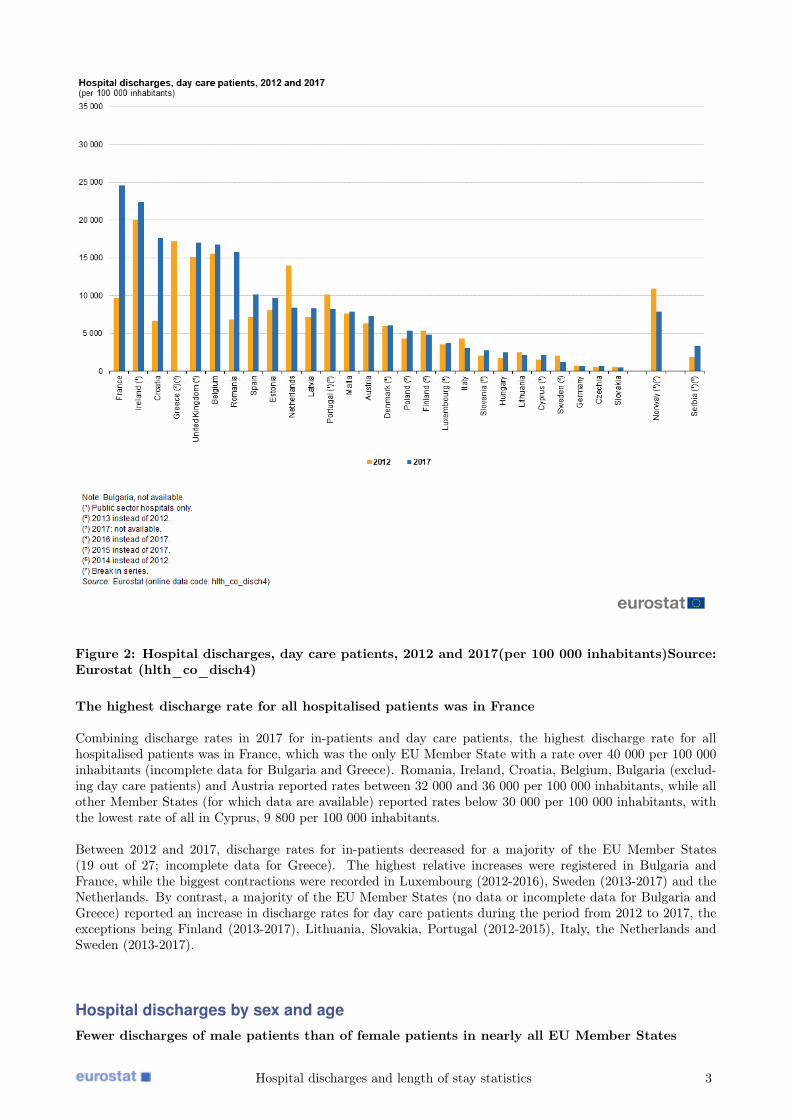
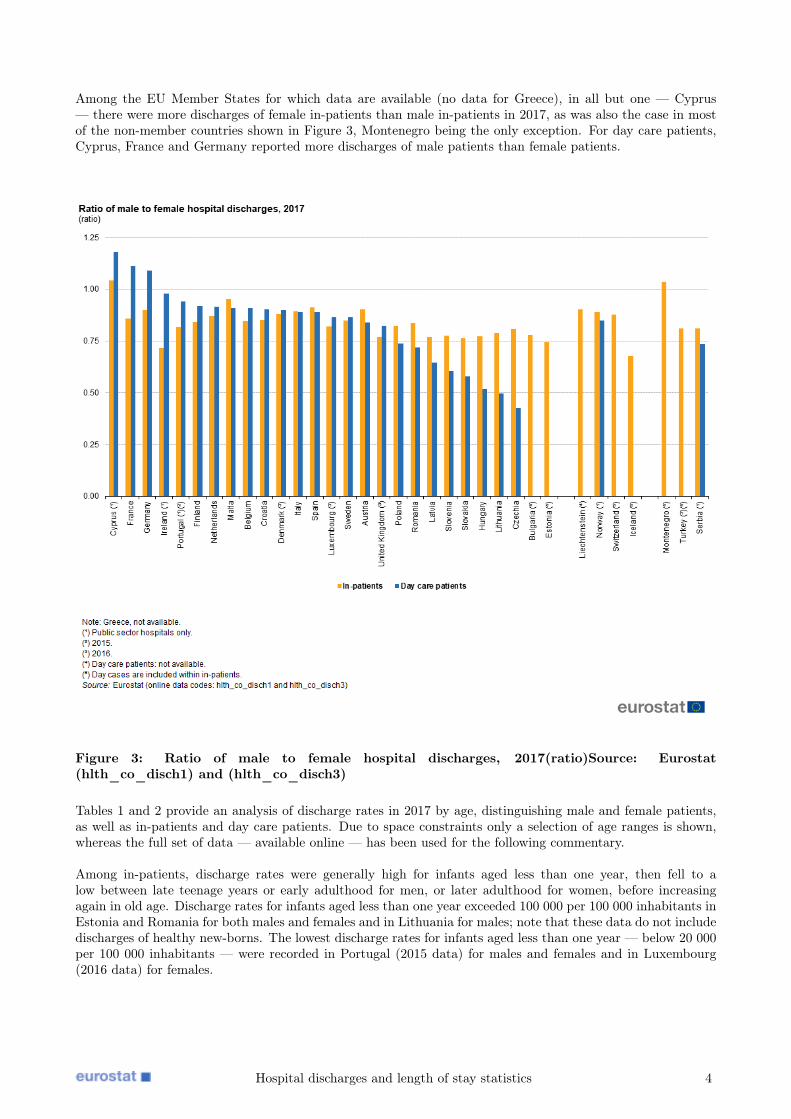
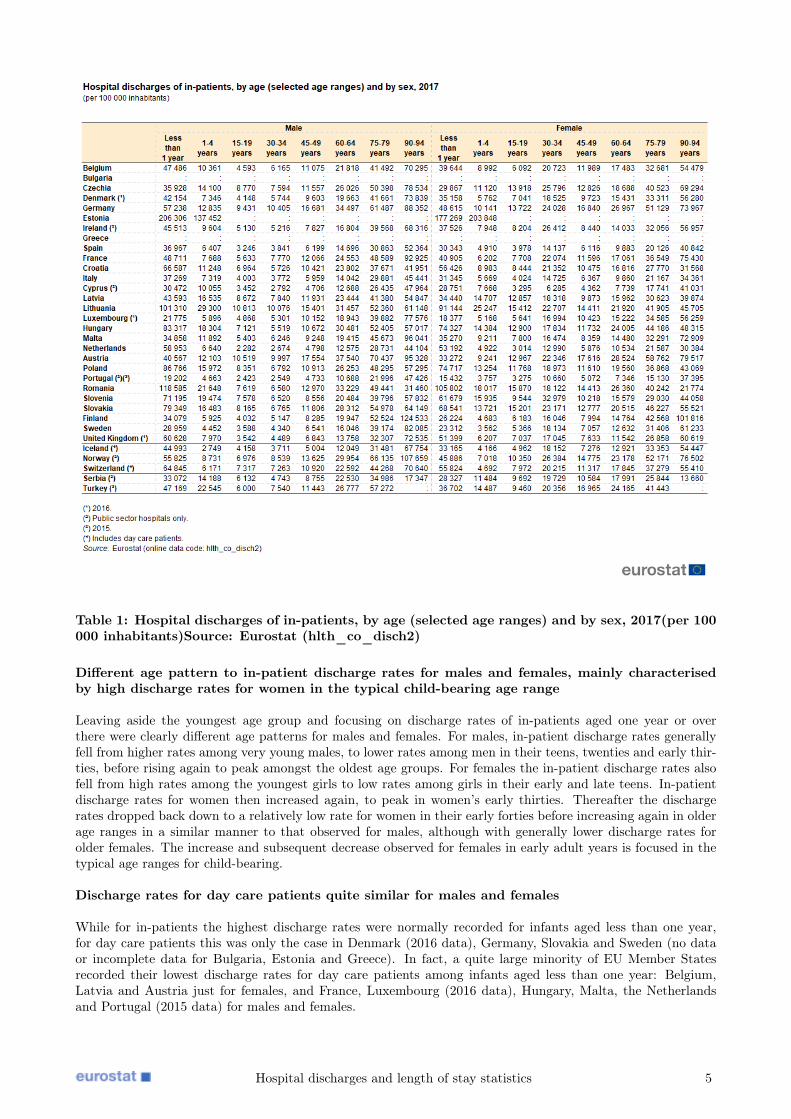
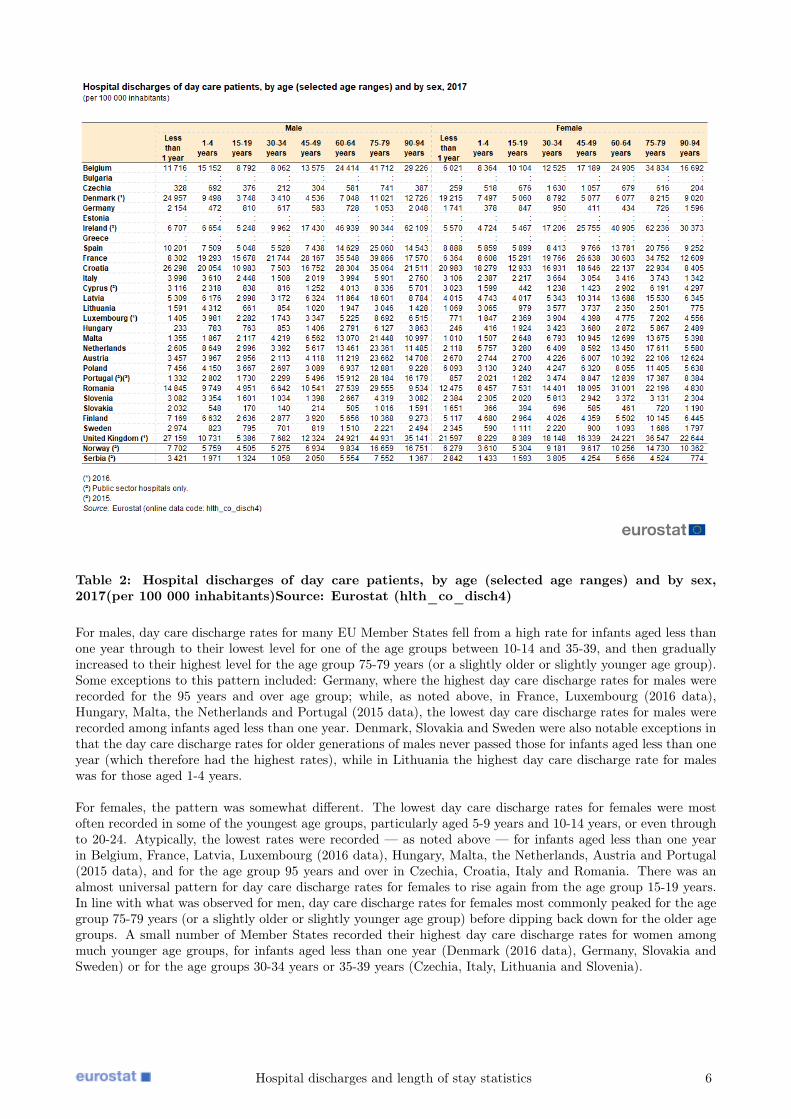
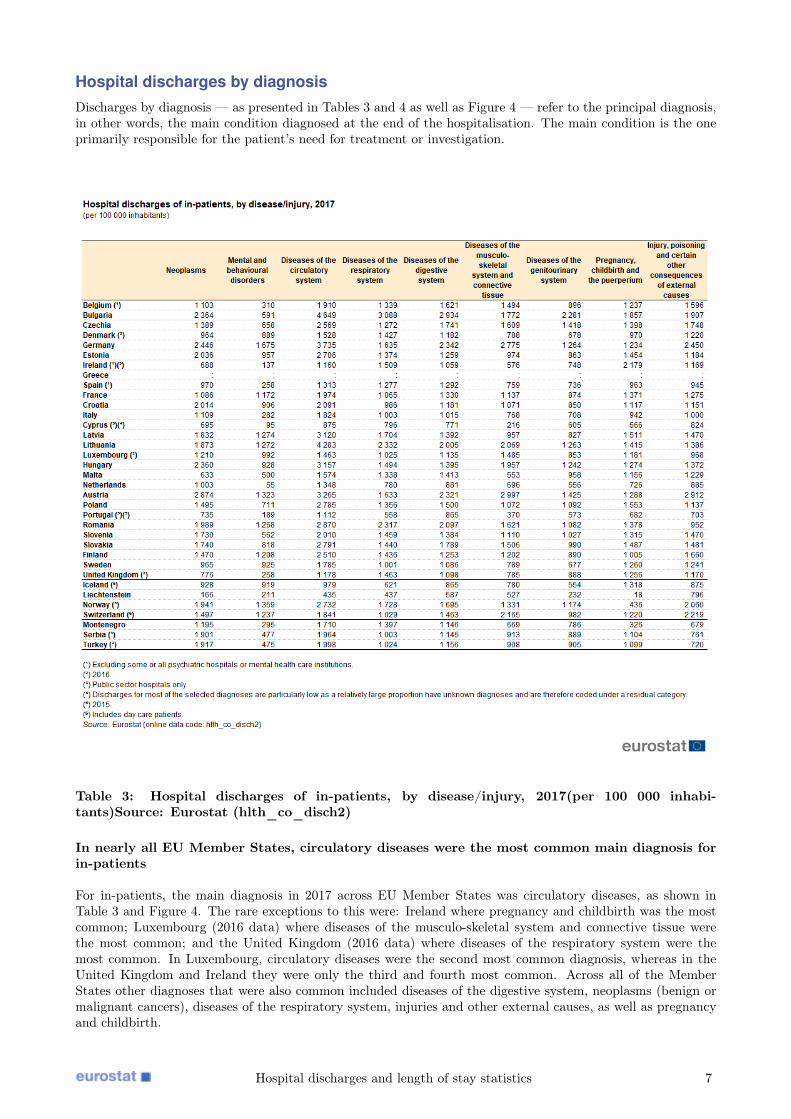
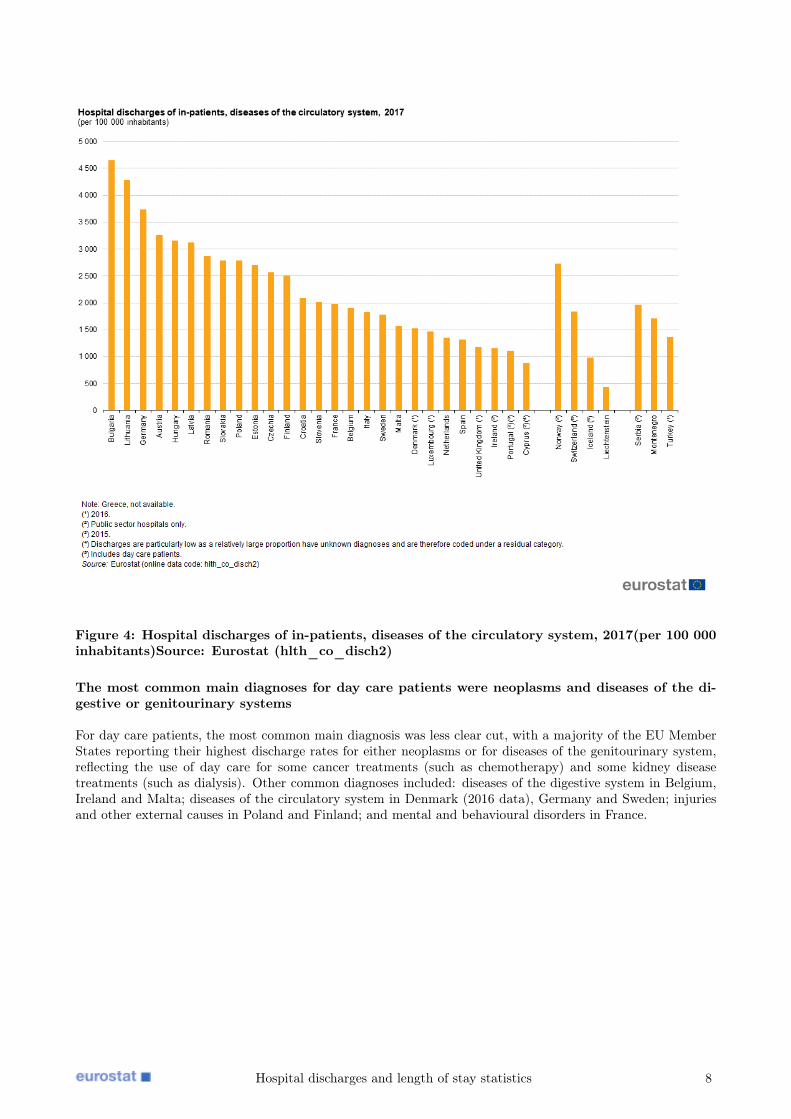
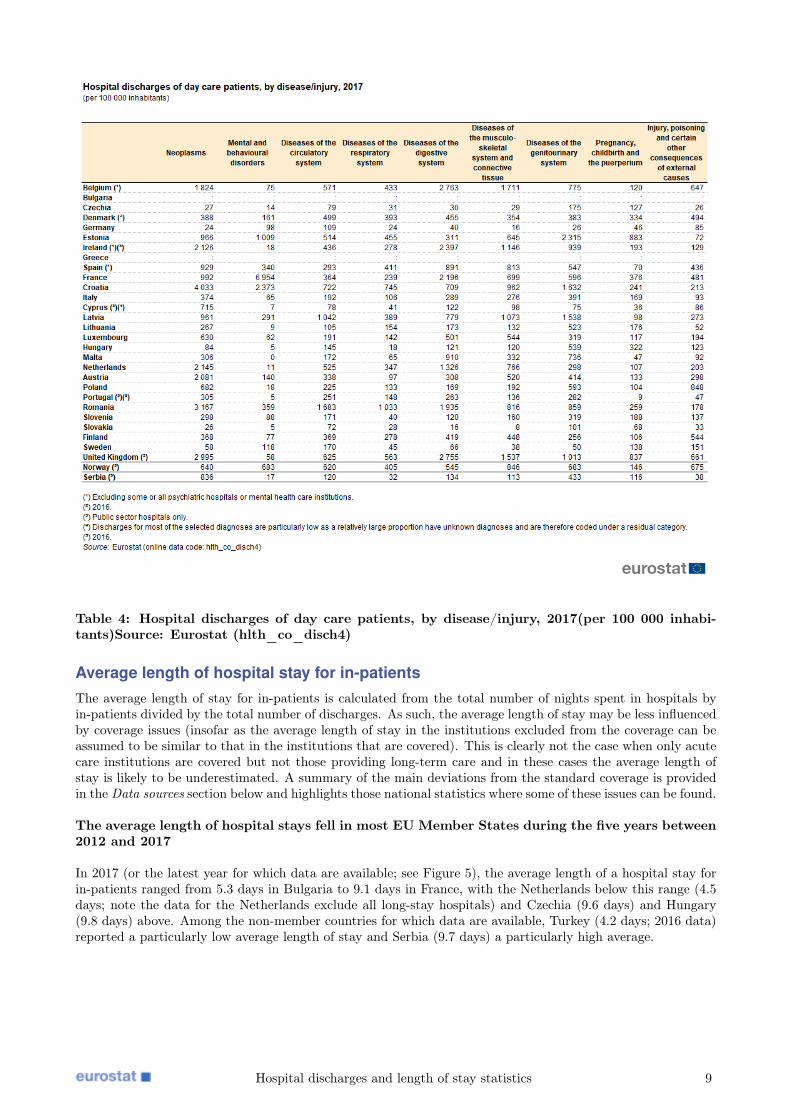
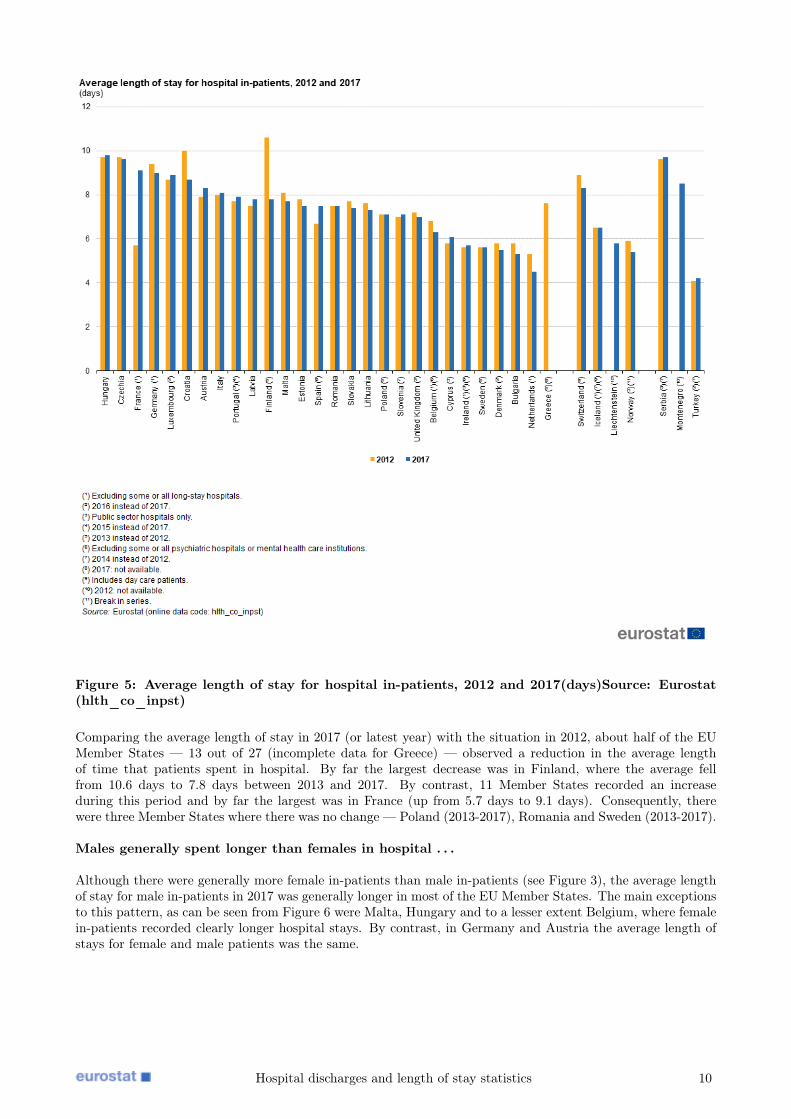
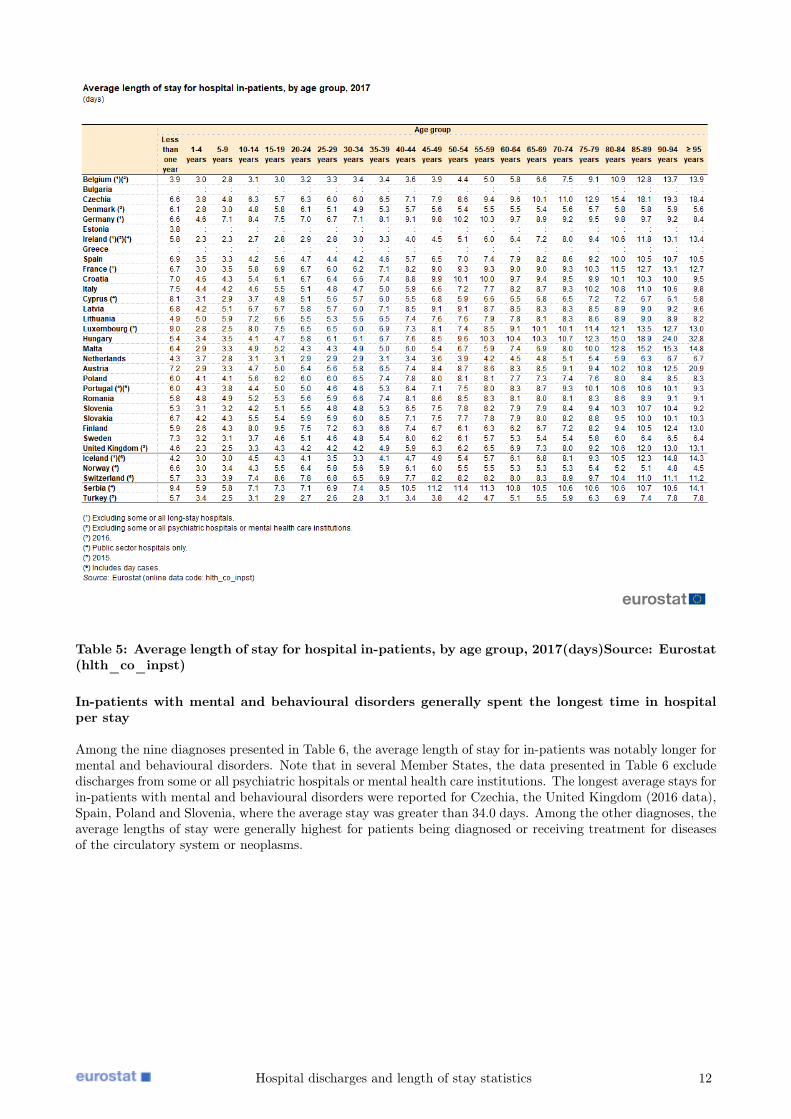
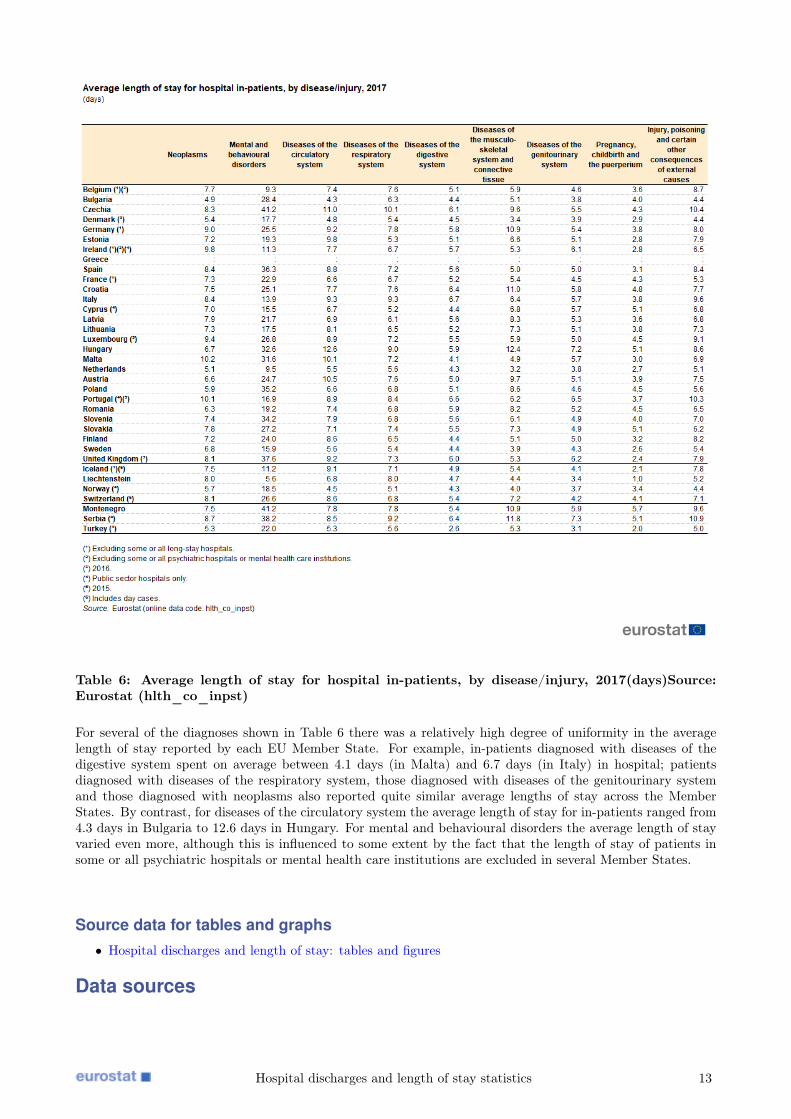
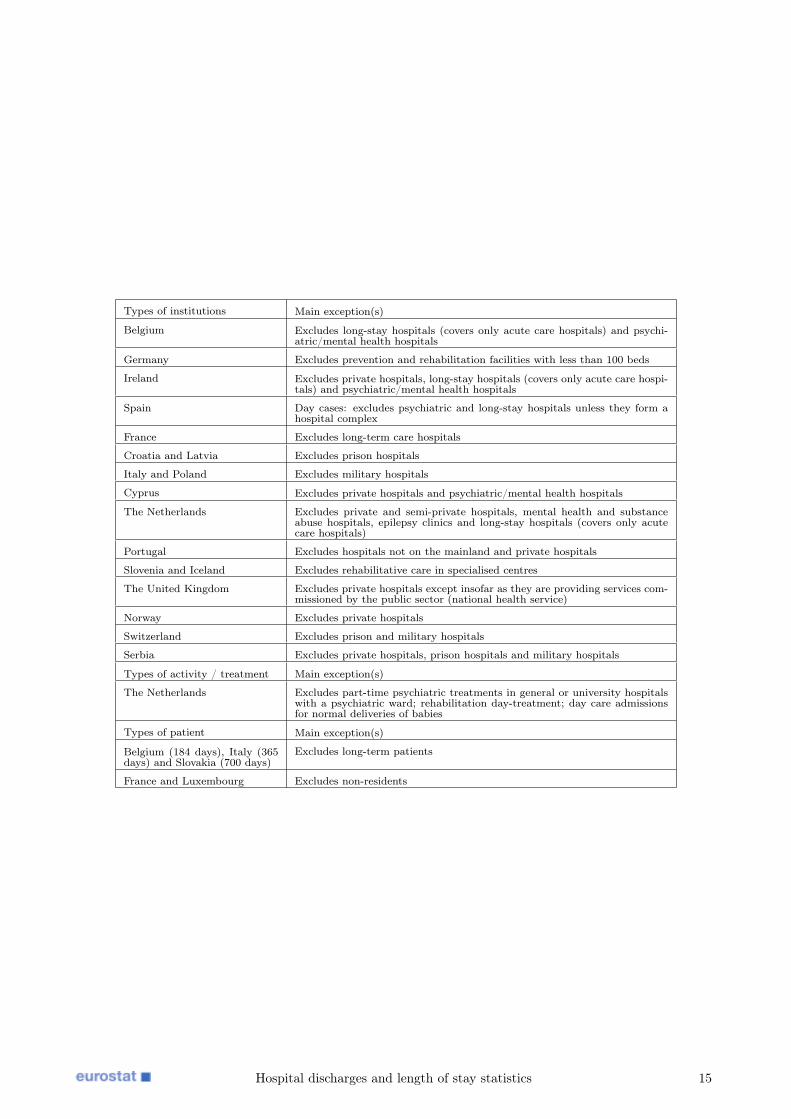