Embed Size (px)
Citation preview

Hospital Length of Stay Initiatives & Post-Acute Support
Bryan Gargano, MD, FACEPAssociate Chair, Emergency Services &Associate CMO Patient Throughput/Capacity Management
Mark F. Klyczek, FACHEVP, Long Term Care Division
1

Rochester Regional Health
2,500+medical staff
16K+system employees
87+primary care & ambulatory locations
5hospital locations
936long term care beds
8senior living facilities
370Kbehavioral health visits
54Patient lab testing sites
1M+clinical trials tests
245K+emergency room visits
1,600+system volunteers

RRH Introduction
• New York State Regulations
– CON State
– Local Health Services Agency
• No LTACH presence in Upstate NY
• Acute Occupancy typically > 95%
– ED Boarders, Floor Transition Spaces
3

Who We Serve
4

Style of System
• Relatively New (3 Years)
• Rapidly Growing and Expanding
• Matrixed Organization
• Financial Cost Allocation Silos
• Staff Vacancies
• ED Boarding and Lack of Inpatient Beds
5

Do you have our problems?
• Significant ED Boarding?
• Inpatient transitional hallway beds?
• Seemingly long Lengths of Stay?
• More patients than hospital beds?
6

Hospital Must Acknowledge
• Emergency Department Boarding is not an Emergency Department problem
• It is an indication that your hospital is queuing patients
• All volume is good volume
• Systemic solutions must be brought forward
7

Hospital Capacity Management
• Focus on throughput issues that cross service lines
• Provide guidance for service line initiatives
8
Clinical Optimization• CHF• Sepsis• Ortho - TJR• Neuro
Hospital Operations• Discharge Planning • Extended IV Antibiotic • Transportation Contract• Long Term Care
• EVS Bed TAT
Service Line/Program Leaders• Volume Growth • LOS Efforts• Clinical Protocols • Readmission
24 x 7 Hospital• Supply/Demand Analysis• Delays in Care

Identify and Advocate for ImprovementsOrtho TJR Initiatives
0.00
0.50
1.00
1.50
2.00
2.50
3.00
3.50
4.00
4.50
0
20
40
60
80
100
120
Jan Mar May Jul Sep Nov Jan Mar May Jul* Sep Nov Jan Mar May Jul Sep
2015 2016 2017
LOS - Primary Hips & Knees
Cases Avg LOS Goal (< 2 Days)
Linear (Cases) Linear (Avg LOS)
0%
10%
20%
30%
40%
50%
60%
Jan Mar May Jul Sep Nov Jan Mar May Jul* Sep Nov Jan Mar May Jul Sep
2015 2016 2017
Overall - Discharge to SNF
% to SNF Goal (< 20%)

One Step at a Time
• Spend time establishing metrics
• Understand what is important to your stakeholders– Initially all LOS
– Utilization Management minimized Observation
– Then Inpatient LOS• Ensure stabilization of LOC
– Don’t have blind spots: Extended Recovery, Outpatient in a Bed, Hospice, etc.
10

Dashboards
11

Next Steps
• Focused on throughput issues that cross service lines
• Metrics are established AND understood
– Goals are clear and measurable
• Look at your data for opportunities
– Use a metric that quantifies your capacity need
– Bed Days = LOS X Volume
12

Discharge Streams
22,859
6,772
3,262
513 442 436 242 114 85 65 36 33 160%
20%
40%
60%
80%
100%
120%
0
5000
10000
15000
20000
25000
Pareto of Discharges by Disposition
Discharges % of Total
Data Source: ADT0162 from 1/1/17-9/30/17

Discharge Streams by Bed Days
55,131
38,690
32,806
6,4744,582
991 815 576 219 208 200 186 1650
0.2
0.4
0.6
0.8
1
1.2
0
10000
20000
30000
40000
50000
60000
Home or SelfCare
Home w/Care
SNF Expired Hospice AgainstMedicalAdvice
PsychiatricHospital
Short TermHospital
Other ED Only IntermediateCare Facility
Transfer toAnotherFacility
Jail
Pareto of Bed Days by Disposition
Bed Days % of Total
Data Source: ADT0162 from 1/1/17-9/30/17

Discharge Disposition – Pareto Chart Bed Days in Excess of IP LOS Goal
Data Source: ADT0172 Throughput Summary Dashboard
Data Timeframe: 01/01/2017 – 02/25/2017

Quantifying the Barrier to Discharge
• Wasted Bed Days
– Manual Documentation in Epic by providers
– Avoidable Hospital Days
• Discharge barrier quantification
• Benchmarking
– Selecting benchmark and applying
16

Hospital Initiated Improvements for SNF Discharge
• Value Stream Mapping Sessions
– SNF Selection Process
– Directed Choice
• Expectations with Metrics for Return
• Accountability with Utilization Management
• Automated Choice Expansion
• Transportation
– Lessons Learned
• Use as foundation to earlier discharge plan
17
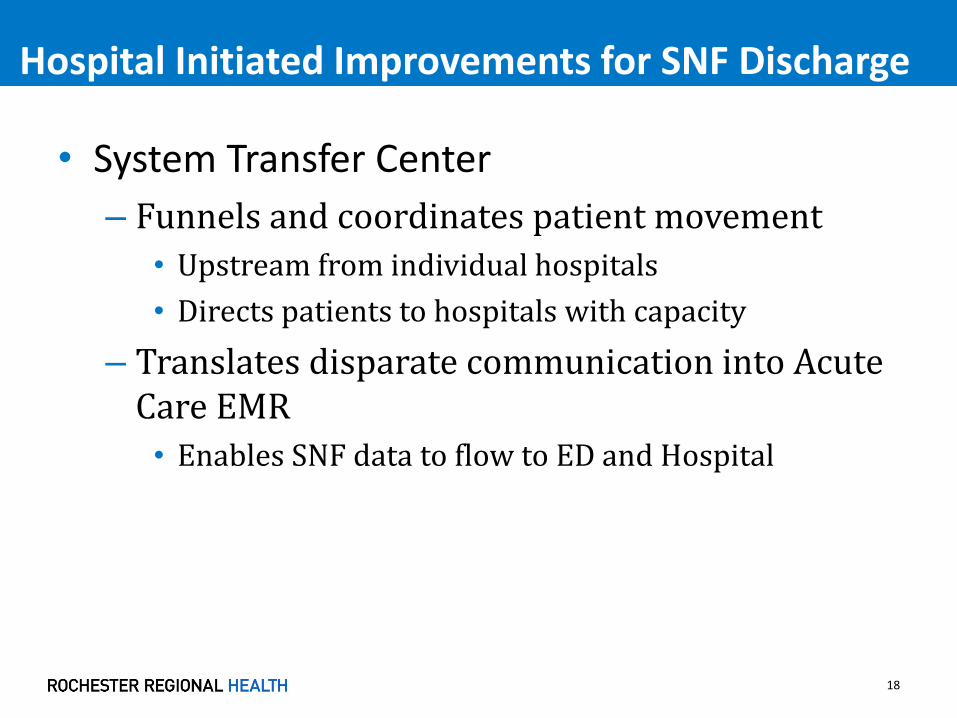
Hospital Initiated Improvements for SNF Discharge
• System Transfer Center
– Funnels and coordinates patient movement
• Upstream from individual hospitals
• Directs patients to hospitals with capacity
– Translates disparate communication into Acute Care EMR
• Enables SNF data to flow to ED and Hospital
18

Support of Acute LOS Through Post-Acute Care
19
Twitter Summary
The 936 bed LTC Division has improved quality and partnered with HCM. 2018 focus will be complex medical and clinical integration while improving ops.
MLTCGA!!

Composition of LTC Division

Clifton Springs Hospital
Extended Care
UnityLiving
Center
Park Ridge Living Center
Hill Haven Transitional Care
LONG TERM CARE DIVISION
Edna Tina Wilson
Living Center
Neuro –Behavioral
CareDialysisWound
CareDementia
Care Transitional
Care(Rehab)
Ventilator Care
Service Line Overview

Regional Post-Acute Gaps
• LTACHs not Operating in Our Region– NYS Regulations
– For-Profit Status
• Lower Acuity Housing Without Restrictions– Age
– Diagnosis
– Income
• Drives longer LOS for Acute & LTC Patients who do not require the respective services
23

LTC Overall Occupancy Trends
Source: NYS DOH

RGH Complex Care Discharges 2016/2017

Utilizing Our LTC Asset
• Blood Transfusions
• Chest Tubes
• Complex Wounds with Plastics
• Hemodialysis & Peritoneal Dialysis
• Life Vests
• LVAD (developing)
• Milrinone
• Oncology
• Pharmacy Services
• Power PICC
• Respiratory
• Suboxone
• Telemedicine
• TPN
• Ventilator
26
Current Services for Complex Patient Support

LTC 2018 - 2020 Focus
• Hospital Capacity Management
• Complex Medical Conditions
• Service Lines Support & Integration
• Primary Post-Acute Network Contact
• Improve Quality Within RRH Facilities
• Physician Recruitment
27

2018 HCM Support Initiatives
• LTC Division/System Integration
–EPIC Implementation
–Telemedicine Expansion
–Collaborative Nursing with Acute Care
–Post-Acute Network Engagement
–Physician/APP Recruitment
28

Imbedded LTC Coordination
• SNF discharges are a significant LOS challenge
• Census patients with a LOS >10 days
– Account for 64% of the patient days
– But only represents 17% of the total patients
• Completed gap analysis for SNF discharges
• Discharges to SNF require focus & knowledge
29

Imbedded LTC Coordinator Initial Results
30
0
25
50
75
100
125
150
175
200
225
1 2 3 4 5 6 7 8 9 10 11 12 13 14 15 16 17 18 19 20 21 22 23 24 25 26 27 28 29 30 31 32 33 34 35 36 37 38 39 40 41 42 43
LTC Placement Coordinator at RGH ImpactWasted Bed Days Reduction Jan - Oct 2017
Implemented 4/9/17
1Q17 Average: 167 days2Q17 Average: 119 days3Q17 Average: 109 days
Weeks
Was
ted
Day
s

IP LOS - 0 to 90 Day Discharge Groupings

IP LOS Grouping @ Midnight Census

Discharges to SNF LOS & Adjusted LOS for >20 Day LOS
33
13.06
10.21
13.13
9.52
9.05
10.02
11.50
9.699.73
11.39
10.05
12.12
8.84
9.89
8.66
9.349.15
7.34
8.07
10.85
9.92
10.58
12.10
9.72
10.04
8.32
11.38
12.53
9.499.69
9.07
11.03
9.57
10.34
9.62
10.81
7.38
8.37
9.27
7.76
7.31
6.82
7.26
6.59
6.97
7.41
7.117.33
7.07
6.42
7.006.86
7.387.41
6.17
7.17
6.38
6.706.706.55
7.997.93
6.967.076.99
6.24
7.82
7.23
6.26
6.957.09
5.68
6.146.11
7.18
7.71
6.12
6.69
7.42
6.13
5.50
6.50
7.50
8.50
9.50
10.50
11.50
12.50
13.50
14.50
1/1/
2017
1/8/
2017
1/15
/201
7
1/22
/201
7
1/29
/201
7
2/5/
2017
2/12
/201
7
2/19
/201
7
2/26
/201
7
3/5/
2017
3/12
/201
7
3/19
/201
7
3/26
/201
7
4/2/
2017
4/9/
2017
4/16
/201
7
4/23
/201
7
4/30
/201
7
5/7/
2017
5/14
/201
7
5/21
/201
7
5/28
/201
7
6/4/
2017
6/11
/201
7
6/18
/201
7
6/25
/201
7
7/2/
2017
7/9/
2017
7/16
/201
7
7/23
/201
7
7/30
/201
7
8/6/
2017
8/13
/201
7
8/20
/201
7
8/27
/201
7
9/3/
2017
9/10
/201
7
9/17
/201
7
9/24
/201
7
10/1
/201
7
All Patients Exc. Outliers Goal Linear (All Patients) Linear (Exc. Outliers)

Service Line Integration
• Current LTC Division Clinical Integration Opportunities:
– Orthopaedics
– Neurovascular
– Sepsis
– Cardiology
– Surgery
• Service Line planning beyond acute care
• Thou shalt not hospitalize a patient without a discharge plan
34
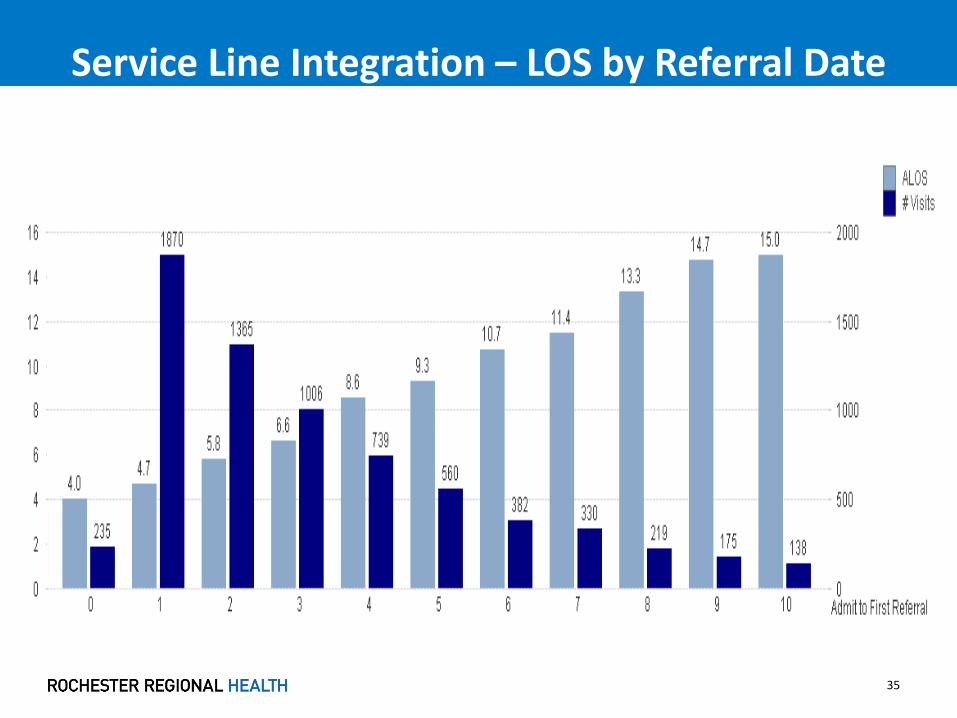
Service Line Integration – LOS by Referral Date
35
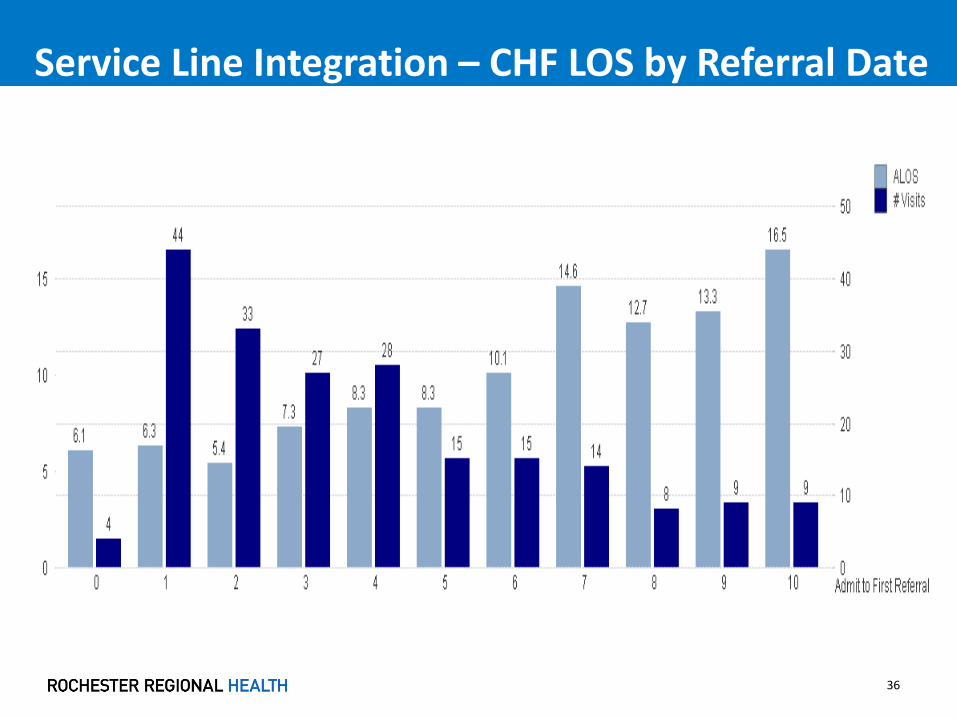
Service Line Integration – CHF LOS by Referral Date
36

Improving Quality While Supporting LOS
37

38
3545 3580
4421
5275 53655490
56155755
6040
0
1000
2000
3000
4000
5000
6000
7000
Jan-16 Apr-16 Jul-16 Oct-16 Jan-17 Apr-17 Jul-17 Oct-17 Jan-18
CMS Reporting Period
RRH LTC Quality Measures Points ImprovementQ1 2015 - Q2 2017
Data Source (Equip & CMS.gov)

CMS 5 Star Ratings
FacilityHealth
Inspection Quality Measures Staffing Overall
Clifton Springs
DeMay LivingCenter
Edna Tina Wilson
Hill Haven
Park Ridge Living Center
Unity Living Center
Source (www.medicare.gov/nursinghomecompare/search.html) Updated September, 2017) = 2017 Gain
as of 10/10/17

Post Acute Network Development
Goals of Post Acute Network Development
• Create a reliable network of owned and community skilled nursing facilities to accept discharges from the 5 RRH acute care hospitals
• Reduce Hospital Length of Stay for Nursing Home eligible patients
• Reduce cost & increase quality care delivered by network facilities
• Develop services to support discharges and reduce readmissions
• Facilitate LTC discharges to lower levels of care
• Align incentives and opportunities with network facilities
40

Post Acute Network Development
Align Incentives and Opportunities with Network Facilities
• LTC preferred facilities to join GRIPA, and/or LTC IPA
• Utilize GRIPA to manage the care of all LTC patients
• Network inclusion stabilizes referrals to LTC facilities
• Review potential for group purchasing and other cost reduction areas for community facilities
41
Post Acute Network Development
Initial Inclusion Criteria
• Rochester Regional Health Owned Facilities
• Rochester Regional Health Physician Relationship
• Historical Volume of Shared Patients
• 5 Star Quality Rating
• Clinical Capacity
• Readmission Rate – EQUIP Measure
• Geography
42

Post Acute Network Development
Proposed Dashboard Measures
• Hospitalization/Re-hospitalization Rates
• Response time to each referral – Curaspan
• 5 Star Quality Measures
• Payor Mix of Patients Accepted
• Number of Declinations
• Hospital LOS
• Cost per Patient Day
43

Navi Health Hospital Dashboard
44
Facility
Discharge Year 2016
Discharge Month Jul Aug Sep Total
# Vis i ts with a Referra l 4,723 385 421 420 3,719
# Referra ls 24742 1916 2371 4037 22243
# Bookings 3900 312 335 338 3040
ALOS-a l l referred patients 11.26 11.17 10.64 9.85 11.16
LOS when medica l ly ready at Accept
(accepted pts )9.89 9.59 9.69 8.64 9.89
LOS when not medica l ly ready at
accept (accepted pts )10.82 11.76 10.66 9.89 10.66
Accepts/Patient (that are accepted) 1.22 1.19 1.25 1.28 1.23
Avg. Referra ls/Patient 5.24 4.98 5.63 9.61 5.98
Hospita l Admit Time to Fi rs t Referra l
Target in days= 55.89 5.17 4.99 4.9 5.27
Referra l to Discharge booked patients
** Target in hrs= 6097.82 117.75 101.1 83.6 103.75
Avg.Time Referra l to Provider Accept
(booked Patient) ** Target in hrs= 2453.29 54.46 60.25 41.04 55.05
Provider Accept to Discharge(booked
patients) ** Target in hrs= 3641.53 66.29 47.29 44.36 50.02
Rochester General Hospita l
2017

Navi Health Hospital Dashboard
45
Facility
Discharge Year 2016
Discharge Month Jul Aug Sep Total
Avg. Accept to Discharge when
Medica l ly Ready at Accept time30 33.11 32.94 31.22 30.58
Avg Accept to Discharge when Not
medica l ly Ready at Accept58.78 86.23 57.69 53.09 67.25
Median Accept to Discharge Booked
Patients23.17 25.37 23.04 24.67 24.2
%Referred Patients who were never
booked17% 19% 21% 20% 18%
Avg Medica l ly Ready to Discharge(Yes
va lues ,Care Connect)4.51 2.19 2.23 1.65 2.89
#>30 day Outl iers 280 19 19 17 204
% 30 Day Readmiss ions 19% 21% 19% 13% 19%
Avg.Accept to Booked ** Target in hrs=
1230.93 55.76 28.2 28.65 37.45
Avg Booked to Discharge ** Target in
hrs= 24 10.34 14.22 17.83 18.01 14.4
Rochester General Hospita l
2017
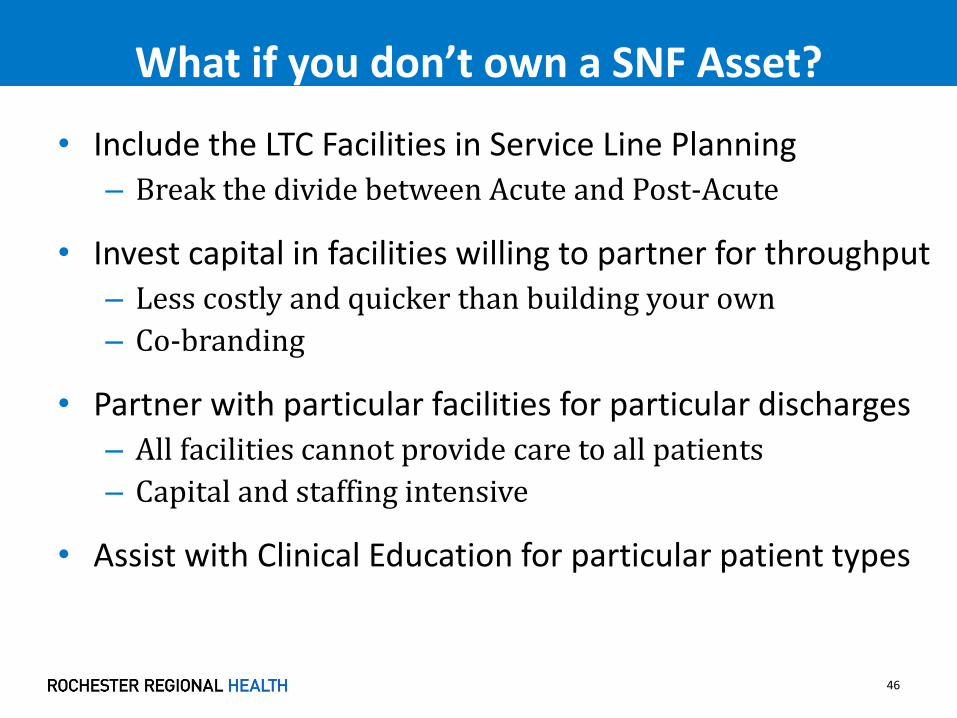
What if you don’t own a SNF Asset?
• Include the LTC Facilities in Service Line Planning– Break the divide between Acute and Post-Acute
• Invest capital in facilities willing to partner for throughput– Less costly and quicker than building your own
– Co-branding
• Partner with particular facilities for particular discharges– All facilities cannot provide care to all patients
– Capital and staffing intensive
• Assist with Clinical Education for particular patient types
46

What if you don’t own a SNF Asset?
• Identify and correct discharge planning issues raised by Acute & LTC providers
• Consider a LTC focused position or team in care management to improve transitions
• Contract for Medical Directors, Attendings and APPs to assist with Transitions of Care
• Utilize Telemedicine
• Share information regarding risk sharing agreements & post-acute’s impact
47

Key Take-Aways
• Prioritize & Resource Hospital Capacity Management
• Research patient types & discharge destinations driving LOS
• Determine the key metrics that support LOS Initiatives
• Although not perfect, Wasted Bed Days and LOS groups offer objective starting points for data review
• Clarifying who is responsible for each data point
48

Questions?
Contact Information:
Bryan Gargano, MD
Mark Klyczek
49


![“I go I die, I stay I die, better to stay and die in my ... · Policy [5], and the 2007 Basic Services Package for Primary Health Care and Hospitals [6], each outline policy initiatives](https://img.pdfslide.net/doc/110x75/603bb3eae7b2d6687b39921b/aoei-go-i-die-i-stay-i-die-better-to-stay-and-die-in-my-policy-5-and-the.jpg)