Embed Size (px)
Citation preview

Hospital Surveillance

Impact of infectious diseases
IDs are considered to be the leading cause of death
Mass population movement Emerging and re-emerging microorganisms Food poisoning Antimicrobial drugs resistance Media attention

Why do we need to study hospital infections? Not all hospital infections are
preventable, but they are associated with Excess length of hospital stay Excess cost Excess mortality Law suits

What kinds of hospital infections exit?
Device-relatedBlood stream infections (BSI)Urinary tract infections (UTI)Ventilator-associated pneumonia (VAP)
Procedure-relatedSurgical site infections (SSI)
Environmental contaminationWater, disinfectant, etc.

Surveillance
Definition It is the continuous systematic collection, analysis,
interpretation and dissemination of data. That is essential to the planning, implementation and
evaluation of PH practice.

What are hospital infections? Two types of infections you find in
the hospitalHospital-acquired infectionsCommunity-acquired infections
How can we distinguish them?By latency periodCDC definition for NIs:
development of infections after 48 hours of admission

Surveillance
Why to do it? To know where you are To see if you are heading in the right direction
Importance Identification of cases Determination of infection sites Identification of factors contributing to infection

Purposes of surveillance
Reducing infection rates within the hospital Establishing endemic baseline rate Identifying outbreaks Convincing medical personnel Evaluating control measures Satisfying regulators Defending malpractice claims Comparing infection rates between hospitals

Data collection
Confirm that the “caught case” is truly nosocomial.Reviewing charts.Talking to the staff (doctors and nurses).

Numerator
What data to collect?
Demography
NameAgeGender
MRNService
WardAdmission date
Infection
Onset date
Site of infection
Laboratory
Pathogen(s)
Antibiogram

Cont…numerator
Who should collect the data? Infection control practitioner Personnel who interact with patients or review charts

Cont…numerator
Data can be collected for all patients care area: Hospital-wide surveillance
Data can be collected for certain groups in the hospital: Targeted surveillance

Cont…numerator
Source of dataAdmission dept., lab., wards, patients, charts.
How to collect data?Review laboratory records & then patients’
charts (this is to achieve case finding)

Denominator
What data to collect Patients-days, device-days (catheter, ventilator,
drainage, etc…). Data source and collection technique
mid-night census can be used You may seek the help of others to collect
denominators (admission office or computer dept.)

Data entry
Collect only necessary data Record data in a systematic formatting Organize data in a meaningful way:
Flow sheet or line-list. Computer data-base (excel, Epi-info, SPSS or
STATA).

Data analysis
Put the results of data collected into rates and ratios: A / B x 100 or 1000
For the numerator A use the number of nosocomial infection in particular group at risk.

Cont…
For the denominator B you may use one of the following: Number of admission or discharge in an interval Number of person undergoing a procedure Patient-days in the hospital or on a particular unit Number of device-days

Cont…
What are you approaching here is: Defining and calculating rates
Prevalence which include point prevalence and period prevalence
Both types count active cases of a disease in a defined population
Incidence which is the total number of a new cases of disease that occurs among given population during a specified period of time

Cont…
Comparing rates among patient groups The denominator must reflect the population at risk
Intrinsic risk factors Extrinsic risk factors
Comparing rates overtime The importance is risk related as major risks varies
overtime e.g. SSI are getting less than before as of hospital stay is getting
less

Cont…
Identifying outbreaks Looking at your trends
Assessing appropriateness of medical care Comparing different devices

Dissemination of data
Data should not be used for punitive purposes but rather to augment quality improvement efforts.
Narrative summaries and tabular graphic reports of surveillance data will be provided to the hospital infection control committee, executive director, general manager and head of departments.

Methods for hospital surveillance
Methods Sensitivity
Fever curve 47%
Antibiotic use 48%
Microbiology reports 33 – 65%
Review kardex 85%
Total chart review 90%
Clinical wards rounds Up to 100%

Why?
10 ICU beds in January 10 ICU beds in February 100 admissions Each patients stays for 1
day
10 NI
What is the rate of NI?
100 admissions
Each patient stays for 3 days
10 NI What is the rate of NI?

It is a 10% It is a 10%
But with a rate of 100/1000 days
But with a rate of 33.3/1000 days

Devices and procedures as major sources of hospital infections
Surgeries
Arterial/VenousCatheters
Urinary Catheters
Respirators
Cross-infections:
20-40%
Changes in flora due to antibiotic therapy :20-25% Others
: 20%
Patients’ own flora:
40-60%

BSI/1000 DDs
02468
1012141618
March April May June July
Months
IR /10
00 d
evic
e d
ays

UTI/1000 DDs
0
5
10
15
20
25
30
March April May June July
Months
IR /10
00 c
ath
eter
day
s

VAP/1000 VD
0
5
10
15
20
25
30
35
March April May June July
Months
IR /10
00 v
enti
lato
r d
ays

SSI/1000 Procedure
0
2
4
6
8
10
12
14
March April May June July
Months
SS
I
/
1000
Pro
ced
ure

0
1
2
3
4
5
6
7
BSI Pneumo SSI UTI Mixed Total
Aug

0
1
2
3
4
5
6
7
BSI Pneumo SSI UTI Mixed Total
Aug
Sept

0
1
2
3
4
5
6
7
8
BSI Pneumo SSI UTI Mixed Total
Aug
Sept
Oct

0
1
2
3
4
5
6
7
8
BSI Pneumo SSI UTI Mixed Total
Aug
Sept
Oct
Nov
0
1
2
3
4
5
6
7
8
BSI Pneumo SSI UTI Mixed Total
Aug
Sept
Oct
Nov
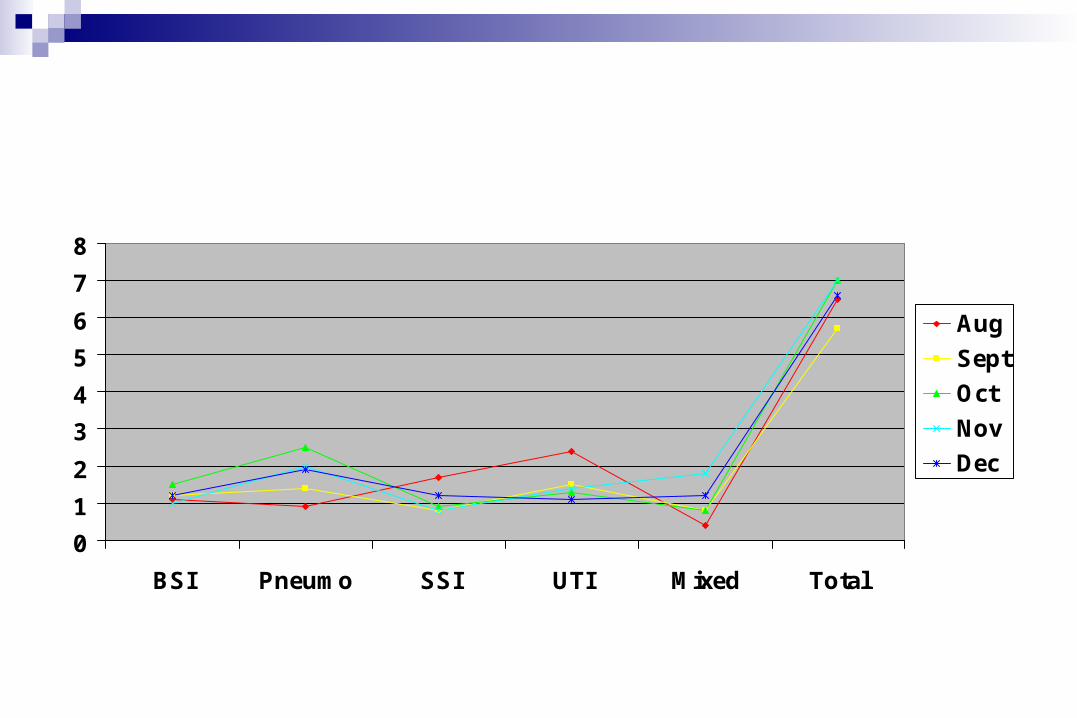
Dec

0
1
2
3
4
5
6
7
8
BSI Pneumo SSI UTI Mixed Total
Aug
Sept
Oct
Nov
Dec
Jan

0
1
2
3
4
5
6
7
8
BSI Pneumo SSI UTI Mixed Total
Aug
Sept
Oct
Nov
Dec
Jan
Feb