Embed Size (px)
Citation preview
8/8/2019 Hotel and Tourism
http://slidepdf.com/reader/full/hotel-and-tourism 1/106
Edelweiss Securities LimitedManoj Bahety, CFA+91 22 6623 [email protected]
Manav Vijay+91 22 4063 [email protected]
8/8/2019 Hotel and Tourism
http://slidepdf.com/reader/full/hotel-and-tourism 2/106
Executive Summary
Demand-supply economics favourable in India
World Travel & Tourism Council (WTTC) expects travel and tourism (T&T) demand in
India to grow at 8.2% annually till 2019, the highest growth after China in the bigcountries league. Owing to various supply bottlenecks, the 13% CAGR growth till FY12E
in demand of premium category rooms is expected to outpace the 10% CAGR growth in
supply; HVS estimates ongoing construction work on only 60% of the 1,00,000
announced rooms. Demand is expected to remain robust as the Indian economy gathers
pace and with many sporting events lined up in the next 12-18 months.
ARRs to rise and ORs to stay firm till FY12
Owing to the increasing demand across many categories/locations, we expect occupancy
rates (ORs) to firm up to 65% and further to 70% in FY11E and FY12E, respectively.
After a difficult H1FY10, when average room rates (ARRs) declined as much as 35-40%
in many locations, marked improvement witnessed by hotel companies in Q3FY10 instills
confidence to estimate an increase of 10% each in FY11E and FY12E. By 2012, we
estimate addition of 9,000-10,000 rooms in the five star and above category. We expect
above 85% of the incremental capacity to be utilised due to better demand.
International hotel chains eye Indian hospitality
According to WTTC, India’s T&T market is expected to grow more than 100% by 2018 to
USD 61 bn against USD 28 bn in 2008. To tap this opportunity, ~25 major international
hotel companies like Accor, Marriott, Claridges, Shangri-la, and Carlson Hospitality are
looking to enter India, either independently or in collaboration with a local party. Also,
GoI’s conscious efforts towards promoting India as a leading leisure destination are likely
to increase the country’s share in the foreign tourist arrivals (FTAs).
Outlook: Good long-term opportunity
Considering that the US offers 40x and China 10x hotel rooms as compared to the
110,000 hotel rooms in India, the Indian hospitality industry has huge potential to grow
structurally. However, high land prices, low FSI, plethora of taxes, and low incentive
from government are some key hurdles for hotel companies in India.
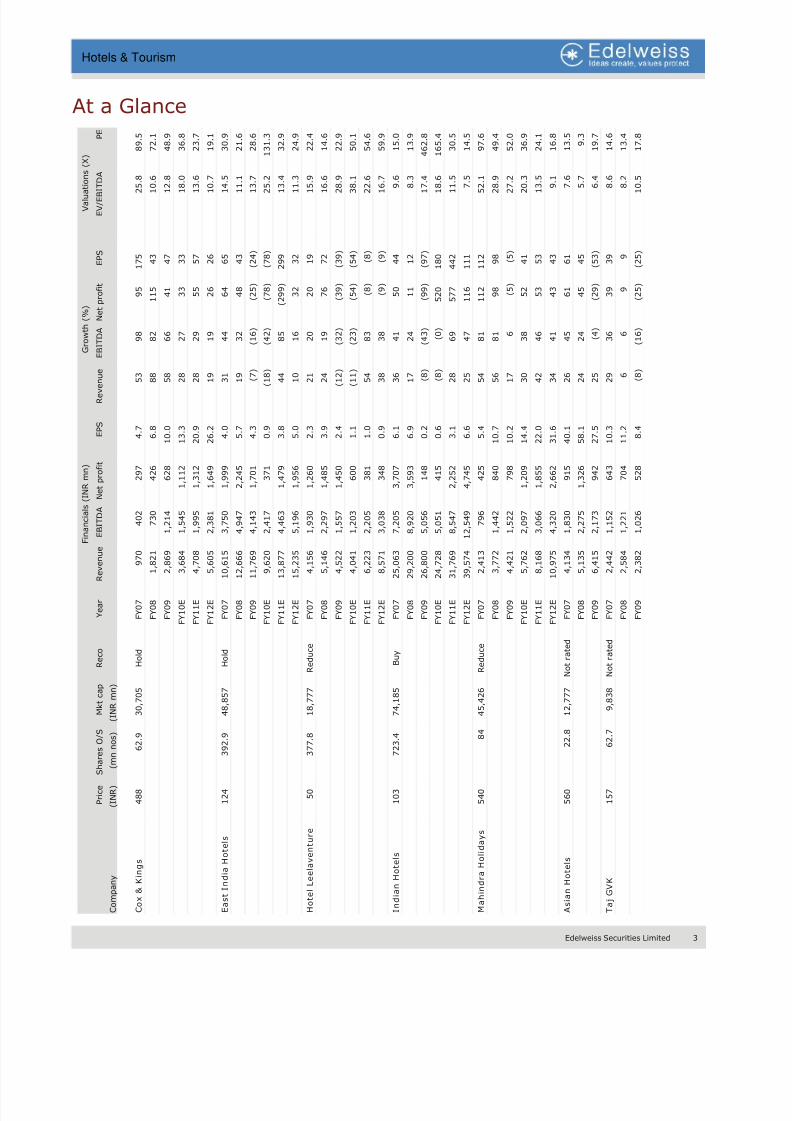
In this report, we have discussed listed hospitality companies. We initiate coverage on
Cox & Kings and EIH with ‘HOLD’ recommendations, and on Hotel Leela with ‘REDUCE’
recommendation. Also featured in this report are Indian Hotels (BUY), Mahindra
Holidays & Resorts India (REDUCE), Asian Hotels (NOT RATED), and TAJ GVK (NOT
RATED).
Edelweiss Research is also available on www.edelresearch.com, Bloomberg EDEL <GO>, Thomson First Call, Reuters and Factset. Edelweiss Securities Limited
Hotels & Tourism
8/8/2019 Hotel and Tourism
http://slidepdf.com/reader/full/hotel-and-tourism 3/106
2 Edelweiss Securities Limited
Hotels & Tourism
Contents
At a glance ................................................................................................................. 3
Indian Travel & Tourism Industry: Overview ................................................................... 4
Demand-Supply Economics Favourable .......................................................................... 5
Improving ARRs and ORs during 2010-12..................................................................... 20
Global Player’s Indian Venture .................................................................................... 22
Vacation Ownership ................................................................................................... 23
Global Travel & Tourism ............................................................................................. 26
Key Trends ............................................................................................................... 28
Business Analysis ...................................................................................................... 30
Valuation Methodology ............................................................................................... 33
Key Risks ................................................................................................................. 35
Challenges ............................................................................................................... 36
Annexure I ............................................................................................................... 37
Annexure II .............................................................................................................. 38
Annexure III ............................................................................................................. 39
Companies
Cox & Kings ............................................................................................................ 41
EIH .......................................................................................................................... 53
Hotel Leelaventure .................................................................................................... 67
Indian Hotels Company .............................................................................................. 81
Mahindra Holidays & Resorts India............................................................................... 87
Asian Hotels ............................................................................................................. 95
Taj GVK Hotels & Resorts ........................................................................................... 99
8/8/2019 Hotel and Tourism
http://slidepdf.com/reader/full/hotel-and-tourism 4/106
Edelweiss Securities Limited 3
Hotels & Tourism
At a Glance
P r i c e
S h a r e
s O / S
M k t c a p
R e c o
Y e a r
R e v e
n u e
E B I T D A
N e t p r o f i t
E P S
R e v e n u
e
E B I T D A
N e t p r o f i t
E P S
E V / E B I T D A
P E
C o m p a n y
( I N R )
( m n
n o s )
( I N R m n )
C o x
& K i n g s
4 8 8
6 2 . 9
3 0 , 7
0 5
H o l d
F Y 0 7
9
7 0
4 0 2
2 9 7
4 . 7
5 3
9 8
9 5
1 7 5
2 5 . 8
8 9 . 5
F Y 0 8
1 , 8
2 1
7 3 0
4 2 6
6 . 8
8 8
8 2
1 1 5
4 3
1 0 . 6
7 2 . 1
F Y 0 9
2 , 8
6 9
1 , 2
1 4
6 2 8
1 0 . 0
5 8
6 6
4 1
4 7
1 2 . 8
4 8 . 9
F Y 1 0 E
3 , 6
8 4
1 , 5
4 5
1 , 1
1 2
1 3 . 3
2 8
2 7
3 3
3 3
1 8 . 0
3 6 . 8
F Y 1 1 E
4 , 7
0 8
1 , 9
9 5
1 , 3
1 2
2 0 . 9
2 8
2 9
5 5
5 7
1 3 . 6
2 3 . 7
F Y 1 2 E
5 , 6
0 5
2 , 3
8 1
1 , 6
4 9
2 6 . 2
1 9
1 9
2 6
2 6
1 0 . 7
1 9 . 1
E a s t I n d i a
H o t e l s
1 2 4
3
9 2 . 9
4 8 , 8
5 7
H o l d
F Y 0 7
1 0 , 6
1 5
3 , 7
5 0
1 , 9
9 9
4 . 0
3 1
4 4
6 4
6 5
1 4 . 5
3 0 . 9
F Y 0 8
1 2 , 6
6 6
4 , 9
4 7
2 , 2
4 5
5 . 7
1 9
3 2
4 8
4 3
1 1 . 1
2 1 . 6
F Y 0 9
1 1 , 7
6 9
4 , 1
4 3
1 , 7
0 1
4 . 3
( 7
)
( 1 6 )
( 2 5 )
( 2 4 )
1 3 . 7
2 8 . 6
F Y 1 0 E
9 , 6
2 0
2 , 4
1 7
3 7 1
0 . 9
( 1 8
)
( 4 2 )
( 7 8 )
( 7 8 )
2 5 . 2
1 3 1 . 3
F Y 1 1 E
1 3 , 8
7 7
4 , 4
6 3
1 , 4
7 9
3 . 8
4 4
8 5
( 2 9 9 )
2 9 9
1 3 . 4
3 2 . 9
F Y 1 2 E
1 5 , 2
3 5
5 , 1
9 6
1 , 9
5 6
5 . 0
1 0
1 6
3 2
3 2
1 1 . 3
2 4 . 9
H o t e l L e e l a v e n t u r e
5 0
3
7 7 . 8
1 8 , 7
7 7
R e d u c e
F Y 0 7
4 , 1
5 6
1 , 9
3 0
1 , 2
6 0
2 . 3
2 1
2 0
2 0
1 9
1 5 . 9
2 2 . 4
F Y 0 8
5 , 1
4 6
2 , 2
9 7
1 , 4
8 5
3 . 9
2 4
1 9
7 6
7 2
1 6 . 6
1 4 . 6
F Y 0 9
4 , 5
2 2
1 , 5
5 7
1 , 4
5 0
2 . 4
( 1 2
)
( 3 2 )
( 3 9 )
( 3 9 )
2 8 . 9
2 2 . 9
F Y 1 0 E
4 , 0
4 1
1 , 2
0 3
6 0 0
1 . 1
( 1 1
)
( 2 3 )
( 5 4 )
( 5 4 )
3 8 . 1
5 0 . 1
F Y 1 1 E
6 , 2
2 3
2 , 2
0 5
3 8 1
1 . 0
5 4
8 3
( 8 )
( 8 )
2 2 . 6
5 4 . 6
F Y 1 2 E
8 , 5
7 1
3 , 0
3 8
3 4 8
0 . 9
3 8
3 8
( 9 )
( 9 )
1 6 . 7
5 9 . 9
I n d i a n
H o t e l s
1 0 3
7
2 3 . 4
7 4 , 1
8 5
B u y
F Y 0 7
2 5 , 0
6 3
7 , 2
0 5
3 , 7
0 7
6 . 1
3 6
4 1
5 0
4 4
9 . 6
1 5 . 0
F Y 0 8
2 9 , 2
0 0
8 , 9
2 0
3 , 5
9 3
6 . 9
1 7
2 4
1 1
1 2
8 . 3
1 3 . 9
F Y 0 9
2 6 , 8
0 0
5 , 0
5 6
1 4 8
0 . 2
( 8
)
( 4 3 )
( 9 9 )
( 9 7 )
1 7 . 4
4 6 2 . 8
F Y 1 0 E
2 4 , 7
2 8
5 , 0
5 1
4 1 5
0 . 6
( 8
)
( 0 )
5 2 0
1 8 0
1 8 . 6
1 6 5 . 4
F Y 1 1 E
3 1 , 7
6 9
8 , 5
4 7
2 , 2
5 2
3 . 1
2 8
6 9
5 7 7
4 4 2
1 1 . 5
3 0 . 5
F Y 1 2 E
3 9 , 5
7 4
1 2 , 5
4 9
4 , 7
4 5
6 . 6
2 5
4 7
1 1 6
1 1 1
7 . 5
1 4 . 5
M a h i n d r a
H o l i d a y s
5 4 0
8 4
4 5 , 4
2 6
R e d u c e
F Y 0 7
2 , 4
1 3
7 9 6
4 2 5
5 . 4
5 4
8 1
1 1 2
1 1 2
5 2 . 1
9 7 . 6
F Y 0 8
3 , 7
7 2
1 , 4
4 2
8 4 0
1 0 . 7
5 6
8 1
9 8
9 8
2 8 . 9
4 9 . 4
F Y 0 9
4 , 4
2 1
1 , 5
2 2
7 9 8
1 0 . 2
1 7
6
( 5 )
( 5 )
2 7 . 2
5 2 . 0
F Y 1 0 E
5 , 7
6 2
2 , 0
9 7
1 , 2
0 9
1 4 . 4
3 0
3 8
5 2
4 1
2 0 . 3
3 6 . 9
F Y 1 1 E
8 , 1
6 8
3 , 0
6 6
1 , 8
5 5
2 2 . 0
4 2
4 6
5 3
5 3
1 3 . 5
2 4 . 1
F Y 1 2 E
1 0 , 9
7 5
4 , 3
2 0
2 , 6
6 2
3 1 . 6
3 4
4 1
4 3
4 3
9 . 1
1 6 . 8
A s i a n
H o t e l s
5 6 0
2 2 . 8
1 2 , 7
7 7
N o t r a t e d
F Y 0 7
4 , 1
3 4
1 , 8
3 0
9 1 5
4 0 . 1
2 6
4 5
6 1
6 1
7 . 6
1 3 . 5
F Y 0 8
5 , 1
3 5
2 , 2
7 5
1 , 3
2 6
5 8 . 1
2 4
2 4
4 5
4 5
5 . 7
9 . 3
F Y 0 9
6 , 4
1 5
2 , 1
7 3
9 4 2
2 7 . 5
2 5
( 4 )
( 2 9 )
( 5 3 )
6 . 4
1 9 . 7
T a j G V K
1 5 7
6 2 . 7
9 , 8
3 8
N o t r a t e d
F Y 0 7
2 , 4
4 2
1 , 1
5 2
6 4 3
1 0 . 3
2 9
3 6
3 9
3 9
8 . 6
1 4 . 6
F Y 0 8
2 , 5
8 4
1 , 2
2 1
7 0 4
1 1 . 2
6
6
9
9
8 . 2
1 3 . 4
F Y 0 9
2 , 3
8 2
1 , 0
2 6
5 2 8
8 . 4
( 8
)
( 1 6 )
( 2 5 )
( 2 5 )
1 0 . 5
1 7 . 8
F i n a n c i a l s ( I N R m n )
G r o w t h ( % )
V a l u a t i o n s ( X )
8/8/2019 Hotel and Tourism
http://slidepdf.com/reader/full/hotel-and-tourism 5/106
8/8/2019 Hotel and Tourism
http://slidepdf.com/reader/full/hotel-and-tourism 6/106
Edelweiss Securities Limited 5
Hotels & Tourism
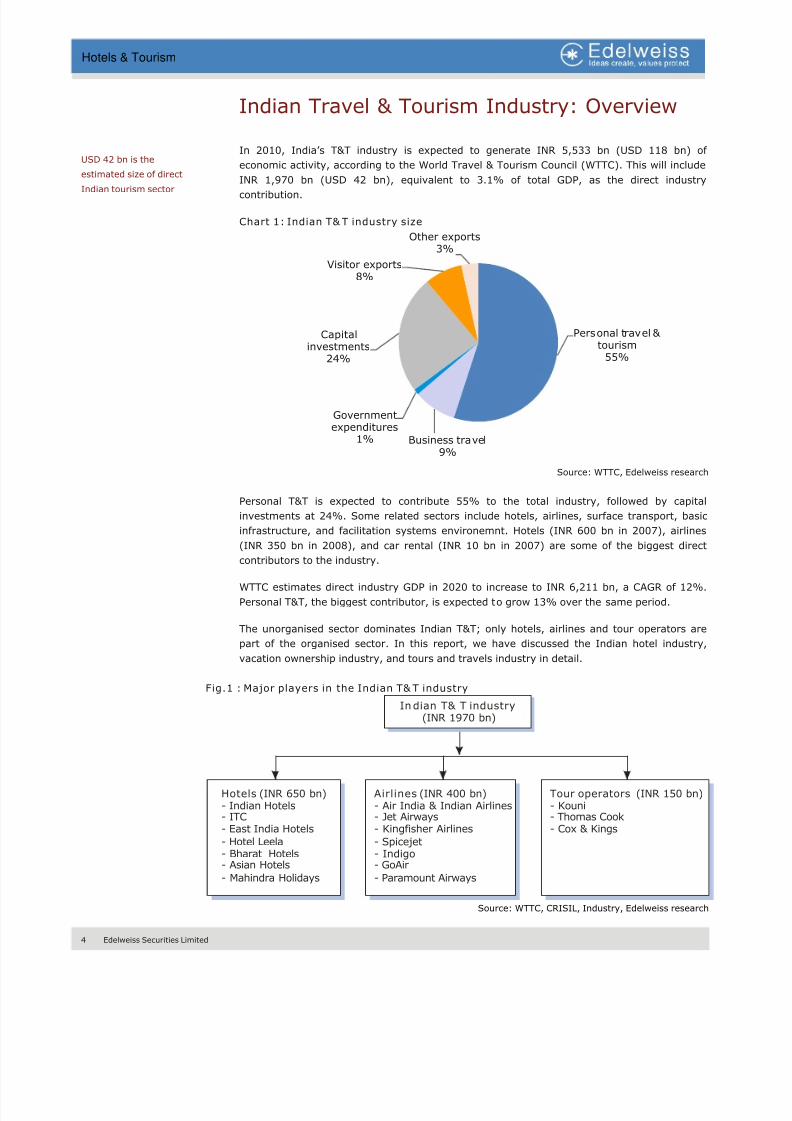
Demand-Supply Economics Favourable
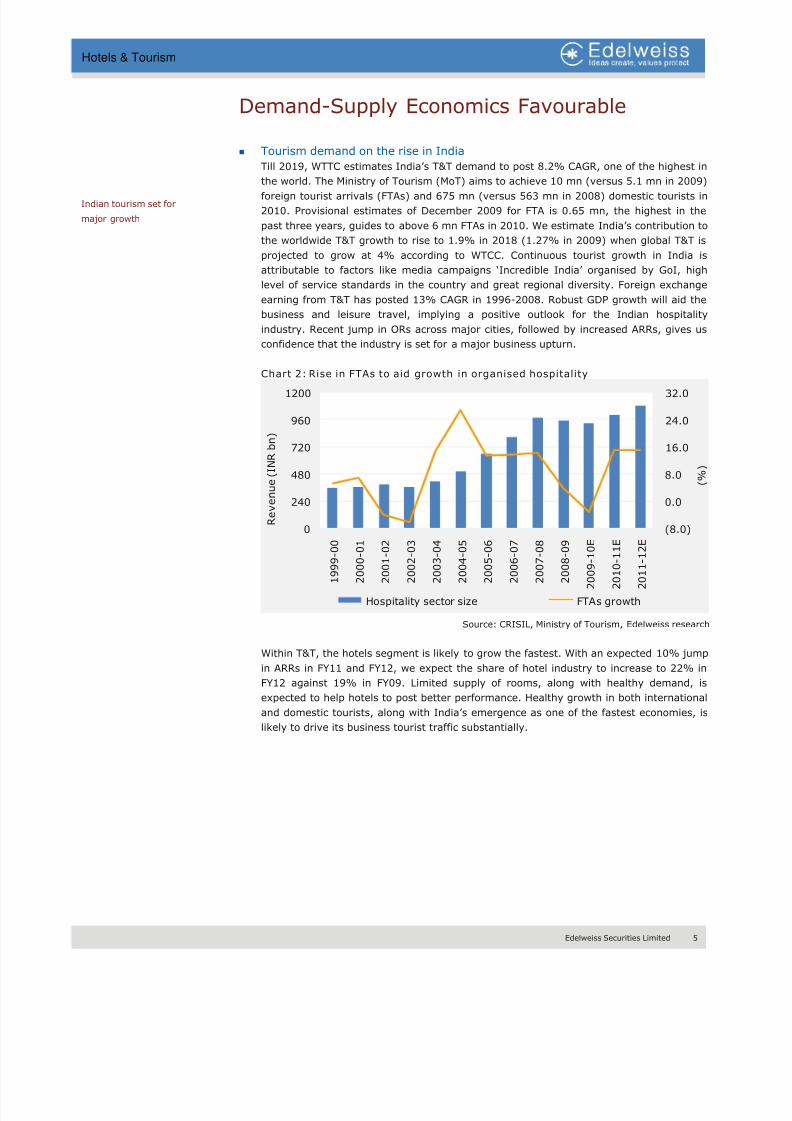
Tourism demand on the rise in India
Till 2019, WTTC estimates India’s T&T demand to post 8.2% CAGR, one of the highest in
the world. The Ministry of Tourism (MoT) aims to achieve 10 mn (versus 5.1 mn in 2009)
foreign tourist arrivals (FTAs) and 675 mn (versus 563 mn in 2008) domestic tourists in
2010. Provisional estimates of December 2009 for FTA is 0.65 mn, the highest in the
past three years, guides to above 6 mn FTAs in 2010. We estimate India’s contribution to
the worldwide T&T growth to rise to 1.9% in 2018 (1.27% in 2009) when global T&T is
projected to grow at 4% according to WTCC. Continuous tourist growth in India is
attributable to factors like media campaigns ‘Incredible India’ organised by GoI, high
level of service standards in the country and great regional diversity. Foreign exchange
earning from T&T has posted 13% CAGR in 1996-2008. Robust GDP growth will aid the
business and leisure travel, implying a positive outlook for the Indian hospitality
industry. Recent jump in ORs across major cities, followed by increased ARRs, gives us
confidence that the industry is set for a major business upturn.
Chart 2: Rise in FTAs to aid growth in organised hospitality
(8.0)
0.0
8.0
16.0
24.0
32.0
0
240
480
720
960
1200
1 9 9 9 - 0 0
2 0 0 0 - 0 1
2 0 0 1 - 0 2
2 0 0 2 - 0 3
2 0 0 3 - 0 4
2 0 0 4 - 0 5
2 0 0 5 - 0 6
2 0 0 6 - 0 7
2 0 0 7 - 0 8
2 0 0 8 - 0 9
2 0 0 9 - 1 0 E
2 0 1 0 - 1 1 E
2 0 1 1 - 1 2 E
( % )
R e v e n u e ( I N R b n )
Hospitality sector size FTAs growth
Source: CRISIL, Ministry of Tourism, Edelweiss research
Within T&T, the hotels segment is likely to grow the fastest. With an expected 10% jump
in ARRs in FY11 and FY12, we expect the share of hotel industry to increase to 22% in
FY12 against 19% in FY09. Limited supply of rooms, along with healthy demand, is
expected to help hotels to post better performance. Healthy growth in both international
and domestic tourists, along with India’s emergence as one of the fastest economies, is
likely to drive its business tourist traffic substantially.
Indian tourism set for
major growth
8/8/2019 Hotel and Tourism
http://slidepdf.com/reader/full/hotel-and-tourism 7/106
6 Edelweiss Securities Limited
Hotels & Tourism
Chart 3: Increased ARRs and tourist influx to aid hotel industry
0.0
5.0
10.0
15.0
20.0
25.0
0
60
120
180
240
300
2 0 0 0 - 0 1
2 0 0 1 - 0 2
2 0 0 2 - 0 3
2 0 0 3 - 0 4
2 0 0 4 - 0 5
2 0 0 5 - 0 6
2 0 0 6 - 0 7
2 0 0 7 - 0 8
2 0 0 8 - 0 9
2 0 0 9 - 1 0 E
2 0 1 0 - 1 1 E
2 0 1 1 - 1 2 E
( %
)
R e v e n u e (
I N R )
Total mkt size Hotel industry as a % of total T&T demand
Source: CRISIL, Ministry of Tourism, Edelweiss research
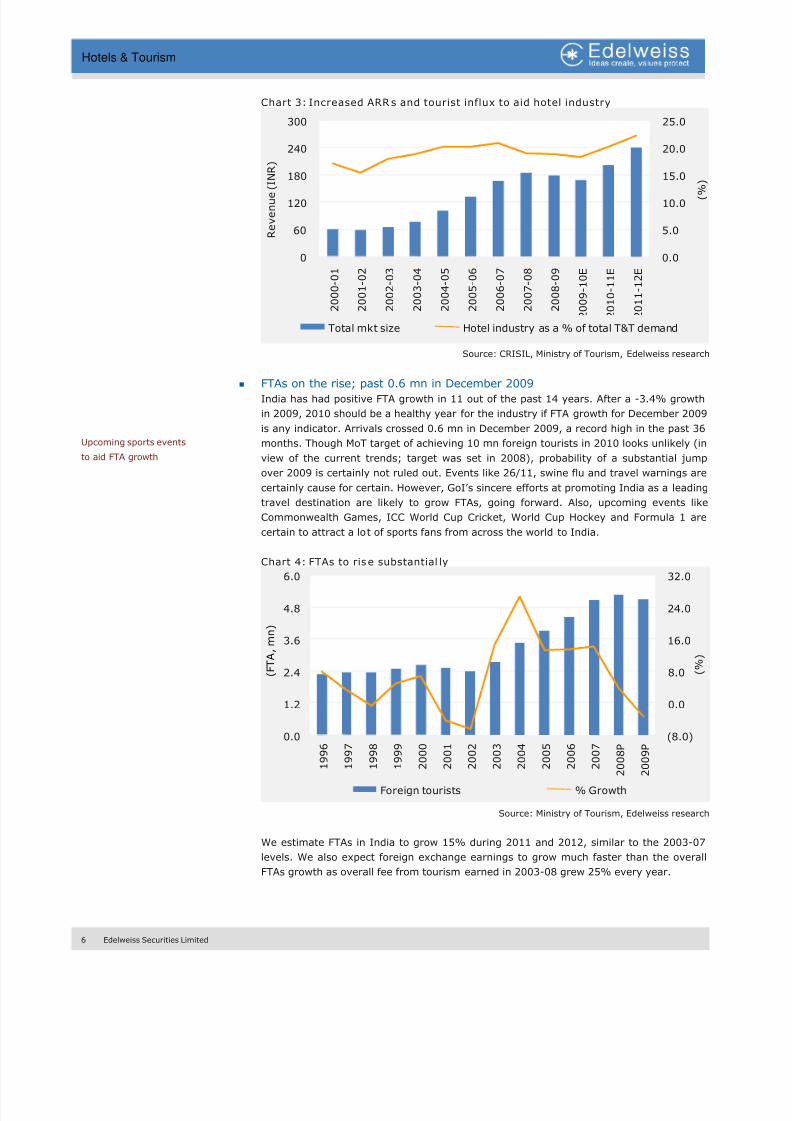
FTAs on the rise; past 0.6 mn in December 2009
India has had positive FTA growth in 11 out of the past 14 years. After a -3.4% growth
in 2009, 2010 should be a healthy year for the industry if FTA growth for December 2009
is any indicator. Arrivals crossed 0.6 mn in December 2009, a record high in the past 36
months. Though MoT target of achieving 10 mn foreign tourists in 2010 looks unlikely (in
view of the current trends; target was set in 2008), probability of a substantial jump
over 2009 is certainly not ruled out. Events like 26/11, swine flu and travel warnings are
certainly cause for certain. However, GoI’s sincere efforts at promoting India as a leading
travel destination are likely to grow FTAs, going forward. Also, upcoming events like
Commonwealth Games, ICC World Cup Cricket, World Cup Hockey and Formula 1 are
certain to attract a lot of sports fans from across the world to India.
Chart 4: FTAs to rise substantial ly
(8.0)
0.0
8.0
16.0
24.0
32.0
0.0
1.2
2.4
3.6
4.8
6.0
1 9 9
6
1 9 9
7
1 9 9
8
1 9 9
9
2 0 0
0
2 0 0
1
2 0 0
2
2 0 0
3
2 0 0
4
2 0 0
5
2 0 0
6
2 0 0
7
2 0 0 8
P
2 0 0 9
P
( % )
( F T A , m n )
Foreign tourists % Growth
Source: Ministry of Tourism, Edelweiss research
We estimate FTAs in India to grow 15% during 2011 and 2012, similar to the 2003-07
levels. We also expect foreign exchange earnings to grow much faster than the overall
FTAs growth as overall fee from tourism earned in 2003-08 grew 25% every year.
Upcoming sports events
to aid FTA growth
8/8/2019 Hotel and Tourism
http://slidepdf.com/reader/full/hotel-and-tourism 8/106
Edelweiss Securities Limited 7
Hotels & Tourism
Moreover, what has helped improve India’s image on the world tourism map is its
improving infrastructure that has connected the remotest of the places within the
country. Further, low-cost airlines, highway development and better power situation
have buoyed India’s tourism prospects.
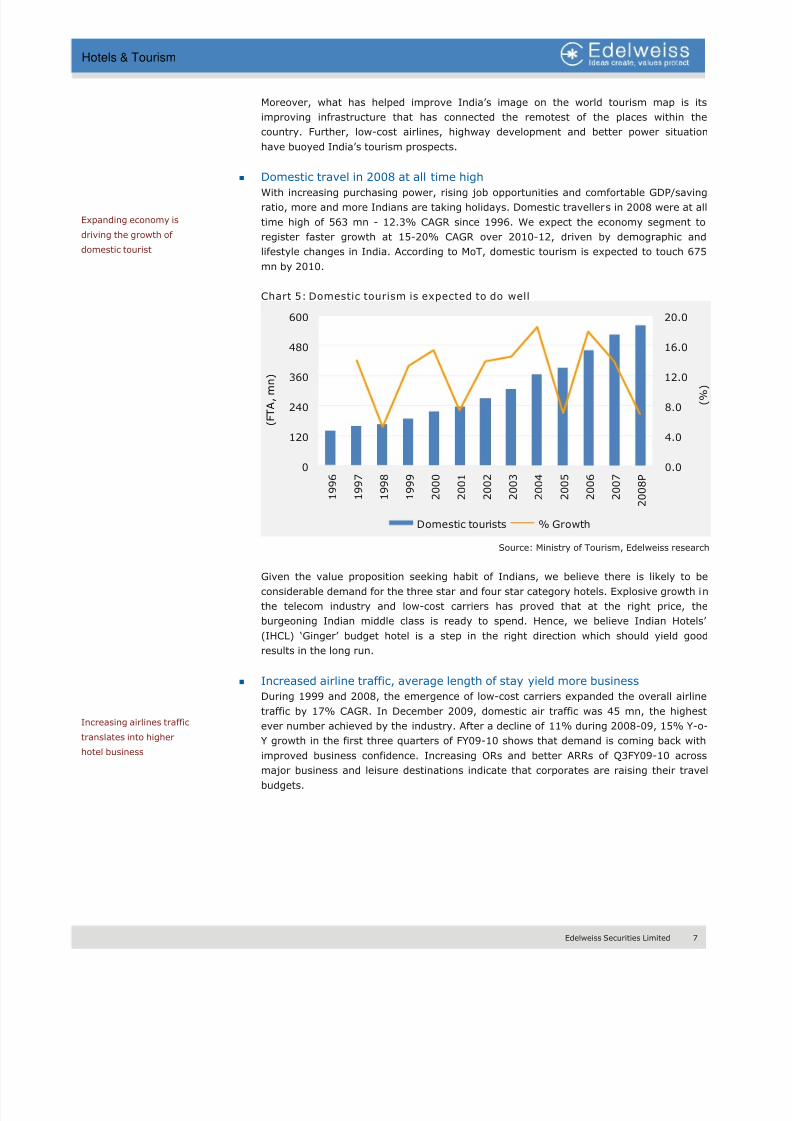
Domestic travel in 2008 at all time high
With increasing purchasing power, rising job opportunities and comfortable GDP/saving
ratio, more and more Indians are taking holidays. Domestic travellers in 2008 were at all
time high of 563 mn - 12.3% CAGR since 1996. We expect the economy segment to
register faster growth at 15-20% CAGR over 2010-12, driven by demographic and
lifestyle changes in India. According to MoT, domestic tourism is expected to touch 675
mn by 2010.
Chart 5: Domestic tourism is expected to do well
0.0
4.0
8.0
12.0
16.0
20.0
0
120
240
360
480
600
1 9 9 6
1 9 9 7
1 9 9 8
1 9 9 9
2 0 0 0
2 0 0 1
2 0 0 2
2 0 0 3
2 0 0 4
2 0 0 5
2 0 0 6
2 0 0 7
2 0 0 8 P
( % )
( F T A , m n )
Domestic tourists % Growth
Source: Ministry of Tourism, Edelweiss research
Given the value proposition seeking habit of Indians, we believe there is likely to be
considerable demand for the three star and four star category hotels. Explosive growth in
the telecom industry and low-cost carriers has proved that at the right price, the
burgeoning Indian middle class is ready to spend. Hence, we believe Indian Hotels’
(IHCL) ‘Ginger’ budget hotel is a step in the right direction which should yield good
results in the long run.
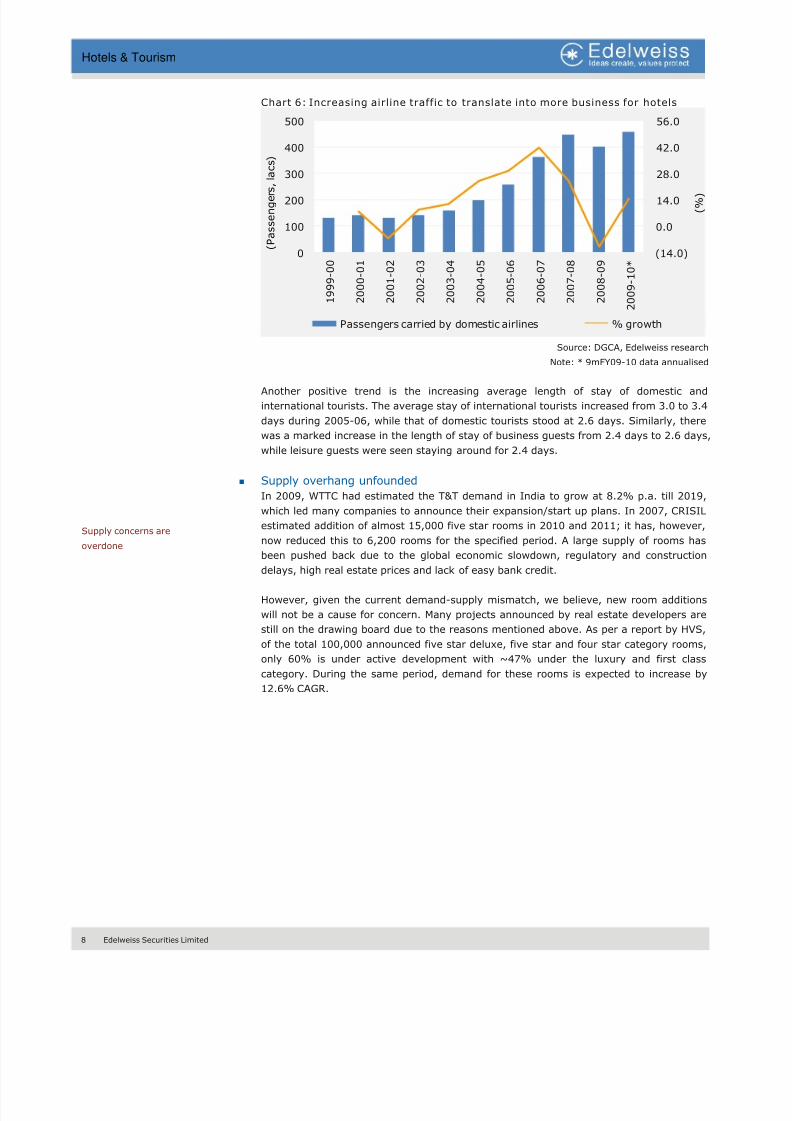
Increased airline traffic, average length of stay yield more business
During 1999 and 2008, the emergence of low-cost carriers expanded the overall airline
traffic by 17% CAGR. In December 2009, domestic air traffic was 45 mn, the highest
ever number achieved by the industry. After a decline of 11% during 2008-09, 15% Y-o-
Y growth in the first three quarters of FY09-10 shows that demand is coming back with
improved business confidence. Increasing ORs and better ARRs of Q3FY09-10 acrossmajor business and leisure destinations indicate that corporates are raising their travel
budgets.
Expanding economy is
driving the growth of
domestic tourist
Increasing airlines traffic
translates into higher
hotel business
8/8/2019 Hotel and Tourism
http://slidepdf.com/reader/full/hotel-and-tourism 9/106
8 Edelweiss Securities Limited
Hotels & Tourism
Chart 6: Increasing airline traffic to translate into more business for hotels
(14.0)
0.0
14.0
28.0
42.0
56.0
0
100
200
300
400
500
1 9 9 9 - 0 0
2 0 0 0 - 0 1
2 0 0 1 - 0 2
2 0 0 2 - 0 3
2 0 0 3 - 0 4
2 0 0 4 - 0 5
2 0 0 5 - 0 6
2 0 0 6 - 0 7
2 0 0 7 - 0 8
2 0 0 8 - 0 9
2 0 0 9 - 1 0 *
( % )
( P a s s e n g e r s , l a c s )
Passengers carried by domestic airlines % growth
Source: DGCA, Edelweiss research
Note: * 9mFY09-10 data annualised
Another positive trend is the increasing average length of stay of domestic and
international tourists. The average stay of international tourists increased from 3.0 to 3.4
days during 2005-06, while that of domestic tourists stood at 2.6 days. Similarly, there
was a marked increase in the length of stay of business guests from 2.4 days to 2.6 days,
while leisure guests were seen staying around for 2.4 days.
Supply overhang unfounded
In 2009, WTTC had estimated the T&T demand in India to grow at 8.2% p.a. till 2019,
which led many companies to announce their expansion/start up plans. In 2007, CRISIL
estimated addition of almost 15,000 five star rooms in 2010 and 2011; it has, however,
now reduced this to 6,200 rooms for the specified period. A large supply of rooms has
been pushed back due to the global economic slowdown, regulatory and construction
delays, high real estate prices and lack of easy bank credit.
However, given the current demand-supply mismatch, we believe, new room additions
will not be a cause for concern. Many projects announced by real estate developers are
still on the drawing board due to the reasons mentioned above. As per a report by HVS,
of the total 100,000 announced five star deluxe, five star and four star category rooms,
only 60% is under active development with ~47% under the luxury and first class
category. During the same period, demand for these rooms is expected to increase by
12.6% CAGR.
Supply concerns are
overdone
8/8/2019 Hotel and Tourism
http://slidepdf.com/reader/full/hotel-and-tourism 10/106
Edelweiss Securities Limited 9
Hotels & Tourism
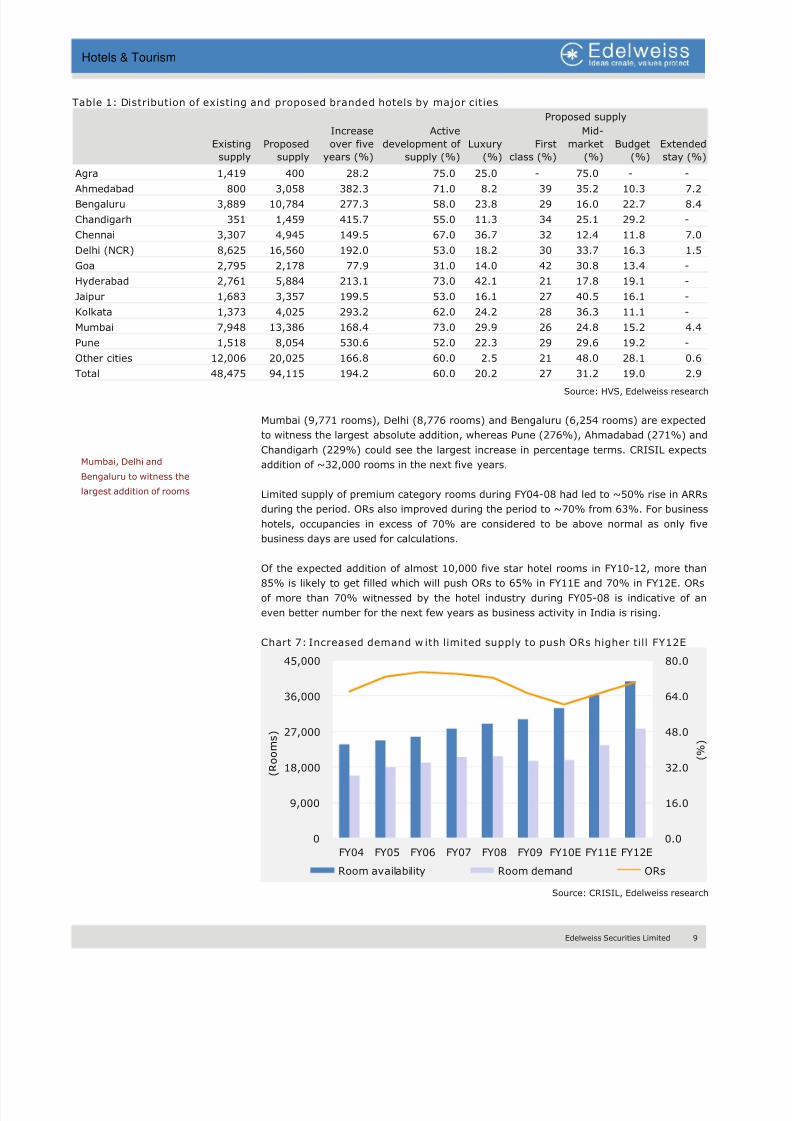
Table 1: Distribution of existing and proposed branded hotels by major cities
Existing
supply
Proposed
supply
Increase
over five
years (%)
Active
development of
supply (%)
Luxury
(%)
First
class (%)
Mid-
market
(%)
Budget
(%)
Extended
stay (%)
Agra 1,419 400 28.2 75.0 25.0 - 75.0 - -
Ahmedabad 800 3,058 382.3 71.0 8.2 39 35.2 10.3 7.2 Bengaluru 3,889 10,784 277.3 58.0 23.8 29 16.0 22.7 8.4
Chandigarh 351 1,459 415.7 55.0 11.3 34 25.1 29.2 -
Chennai 3,307 4,945 149.5 67.0 36.7 32 12.4 11.8 7.0
Delhi (NCR) 8,625 16,560 192.0 53.0 18.2 30 33.7 16.3 1.5
Goa 2,795 2,178 77.9 31.0 14.0 42 30.8 13.4 -
Hyderabad 2,761 5,884 213.1 73.0 42.1 21 17.8 19.1 -
Jaipur 1,683 3,357 199.5 53.0 16.1 27 40.5 16.1 -
Kolkata 1,373 4,025 293.2 62.0 24.2 28 36.3 11.1 -
Mumbai 7,948 13,386 168.4 73.0 29.9 26 24.8 15.2 4.4
Pune 1,518 8,054 530.6 52.0 22.3 29 29.6 19.2 -
Other cities 12,006 20,025 166.8 60.0 2.5 21 48.0 28.1 0.6
Total 48,475 94,115 194.2 60.0 20.2 27 31.2 19.0 2.9
Proposed supply
Source: HVS, Edelweiss research
Mumbai (9,771 rooms), Delhi (8,776 rooms) and Bengaluru (6,254 rooms) are expected
to witness the largest absolute addition, whereas Pune (276%), Ahmadabad (271%) and
Chandigarh (229%) could see the largest increase in percentage terms. CRISIL expects
addition of ~32,000 rooms in the next five years.
Limited supply of premium category rooms during FY04-08 had led to ~50% rise in ARRs
during the period. ORs also improved during the period to ~70% from 63%. For business
hotels, occupancies in excess of 70% are considered to be above normal as only five
business days are used for calculations.
Of the expected addition of almost 10,000 five star hotel rooms in FY10-12, more than
85% is likely to get filled which will push ORs to 65% in FY11E and 70% in FY12E. ORs
of more than 70% witnessed by the hotel industry during FY05-08 is indicative of an
even better number for the next few years as business activity in India is rising.
Chart 7: Increased demand w ith limited supply to push ORs higher till FY12E
0.0
16.0
32.0
48.0
64.0
80.0
0
9,000
18,000
27,000
36,000
45,000
FY04 FY05 FY06 FY07 FY08 FY09 FY10E FY11E FY12E
( %
)
( R o o
m s )
Room availability Room demand ORs
Source: CRISIL, Edelweiss research
Mumbai, Delhi and
Bengaluru to witness the
largest addition of rooms
8/8/2019 Hotel and Tourism
http://slidepdf.com/reader/full/hotel-and-tourism 11/106
10 Edelweiss Securities Limited
Hotels & Tourism
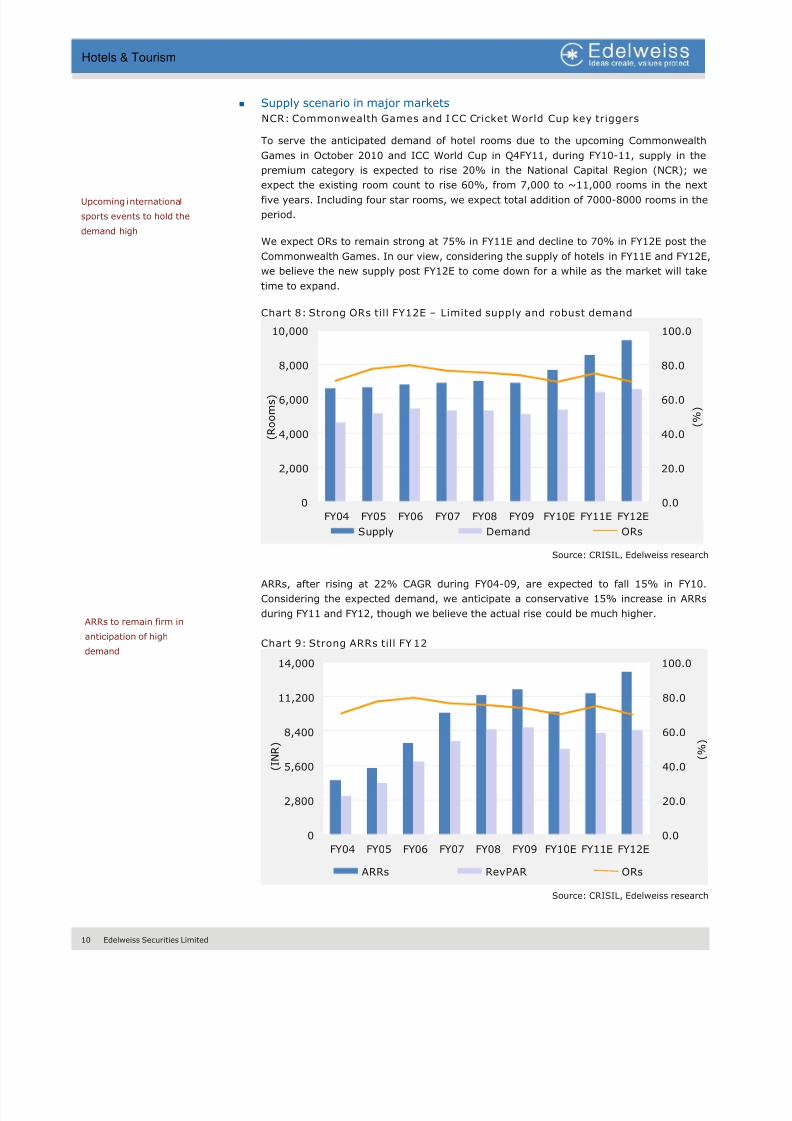
Supply scenario in major markets
NCR: Commonwealth Games and ICC Cricket World Cup key triggers
To serve the anticipated demand of hotel rooms due to the upcoming Commonwealth
Games in October 2010 and ICC World Cup in Q4FY11, during FY10-11, supply in the
premium category is expected to rise 20% in the National Capital Region (NCR); we
expect the existing room count to rise 60%, from 7,000 to ~11,000 rooms in the nextfive years. Including four star rooms, we expect total addition of 7000-8000 rooms in the
period.
We expect ORs to remain strong at 75% in FY11E and decline to 70% in FY12E post the
Commonwealth Games. In our view, considering the supply of hotels in FY11E and FY12E,
we believe the new supply post FY12E to come down for a while as the market will take
time to expand.
Chart 8: Strong ORs till FY12E – Limited supply and robust demand
0.0
20.0
40.0
60.0
80.0
100.0
0
2,000
4,000
6,000
8,000
10,000
FY04 FY05 FY06 FY07 FY08 FY09 FY10E FY11E FY12E
( % )
( R o o m s )
Supply Demand ORs
Source: CRISIL, Edelweiss research
ARRs, after rising at 22% CAGR during FY04-09, are expected to fall 15% in FY10.
Considering the expected demand, we anticipate a conservative 15% increase in ARRs
during FY11 and FY12, though we believe the actual rise could be much higher.
Chart 9: Strong ARRs till FY 12
0.0
20.0
40.0
60.0
80.0
100.0
0
2,800
5,600
8,400
11,200
14,000
FY04 FY05 FY06 FY07 FY08 FY09 FY10E FY11E FY12E
( %
)
( I N R )
ARRs RevPAR ORs
Source: CRISIL, Edelweiss research
Upcoming international
sports events to hold the
demand high
ARRs to remain firm in
anticipation of high
demand
8/8/2019 Hotel and Tourism
http://slidepdf.com/reader/full/hotel-and-tourism 12/106
Edelweiss Securities Limited 11
Hotels & Tourism
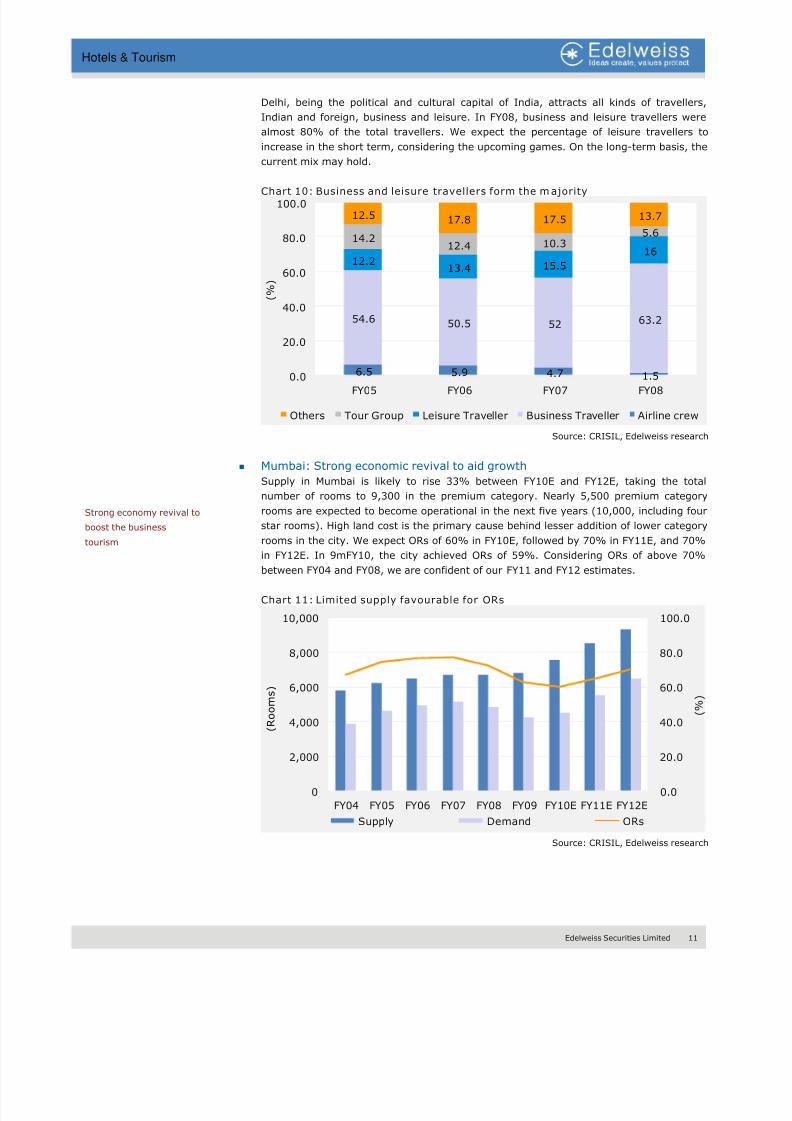
Delhi, being the political and cultural capital of India, attracts all kinds of travellers,
Indian and foreign, business and leisure. In FY08, business and leisure travellers were
almost 80% of the total travellers. We expect the percentage of leisure travellers to
increase in the short term, considering the upcoming games. On the long-term basis, the
current mix may hold.
Chart 10: Business and leisure travellers form the majority
6.5 5.9 4.7 1.5
54.6 50.5 52 63.2
12.213.4 15.5
16
14.212.4 10.3
5.6
12.5 17.8 17.5 13.7
0.0
20.0
40.0
60.0
80.0
100.0
FY05 FY06 FY07 FY08
( % )
Others Tour Group Leisure Traveller Business Traveller Airline crew
Source: CRISIL, Edelweiss research
Mumbai: Strong economic revival to aid growth
Supply in Mumbai is likely to rise 33% between FY10E and FY12E, taking the total
number of rooms to 9,300 in the premium category. Nearly 5,500 premium category
rooms are expected to become operational in the next five years (10,000, including four
star rooms). High land cost is the primary cause behind lesser addition of lower category
rooms in the city. We expect ORs of 60% in FY10E, followed by 70% in FY11E, and 70%
in FY12E. In 9mFY10, the city achieved ORs of 59%. Considering ORs of above 70%
between FY04 and FY08, we are confident of our FY11 and FY12 estimates.
Chart 11: Limited supply favourable for ORs
0.0
20.0
40.0
60.0
80.0
100.0
0
2,000
4,000
6,000
8,000
10,000
FY04 FY05 FY06 FY07 FY08 FY09 FY10E FY11E FY12E
( % )
( R o o m s )
Supply Demand ORs
Source: CRISIL, Edelweiss research
Strong economy revival to
boost the business
tourism
8/8/2019 Hotel and Tourism
http://slidepdf.com/reader/full/hotel-and-tourism 13/106
12 Edelweiss Securities Limited
Hotels & Tourism
Till FY13, Shangrila (414 rooms) is the only addition expected in South Mumbai. Owing
to shortage of large vacant land parcels in South Mumbai, North Mumbai is expected to
witness the majority addition. Emergence of Bandra Kurla Complex (BKC) as an
alternative business destination is expected to shift a lot of business traffic over a period
of time to North Mumbai from South Mumbai.
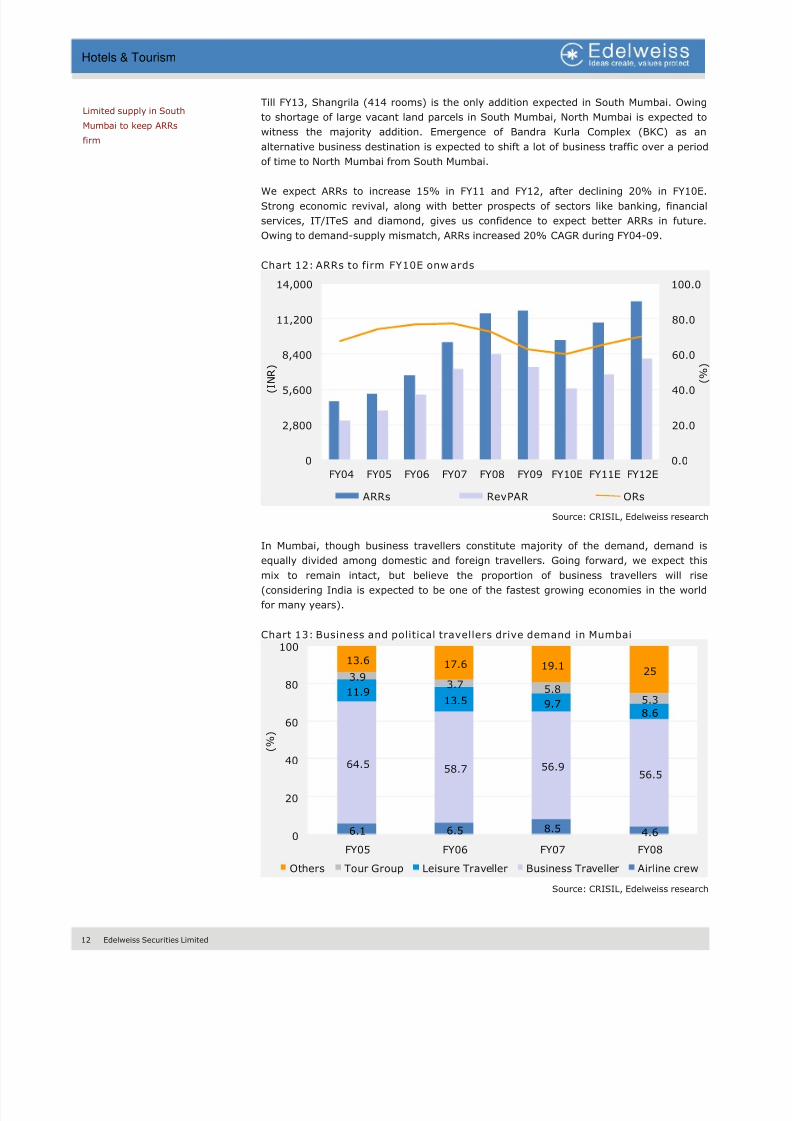
We expect ARRs to increase 15% in FY11 and FY12, after declining 20% in FY10E.
Strong economic revival, along with better prospects of sectors like banking, financial
services, IT/ITeS and diamond, gives us confidence to expect better ARRs in future.
Owing to demand-supply mismatch, ARRs increased 20% CAGR during FY04-09.
Chart 12: ARRs to firm FY10E onw ards
0.0
20.0
40.0
60.0
80.0
100.0
0
2,800
5,600
8,400
11,200
14,000
FY04 FY05 FY06 FY07 FY08 FY09 FY10E FY11E FY12E
( %
)
( I N R )
ARRs RevPAR ORs
Source: CRISIL, Edelweiss research
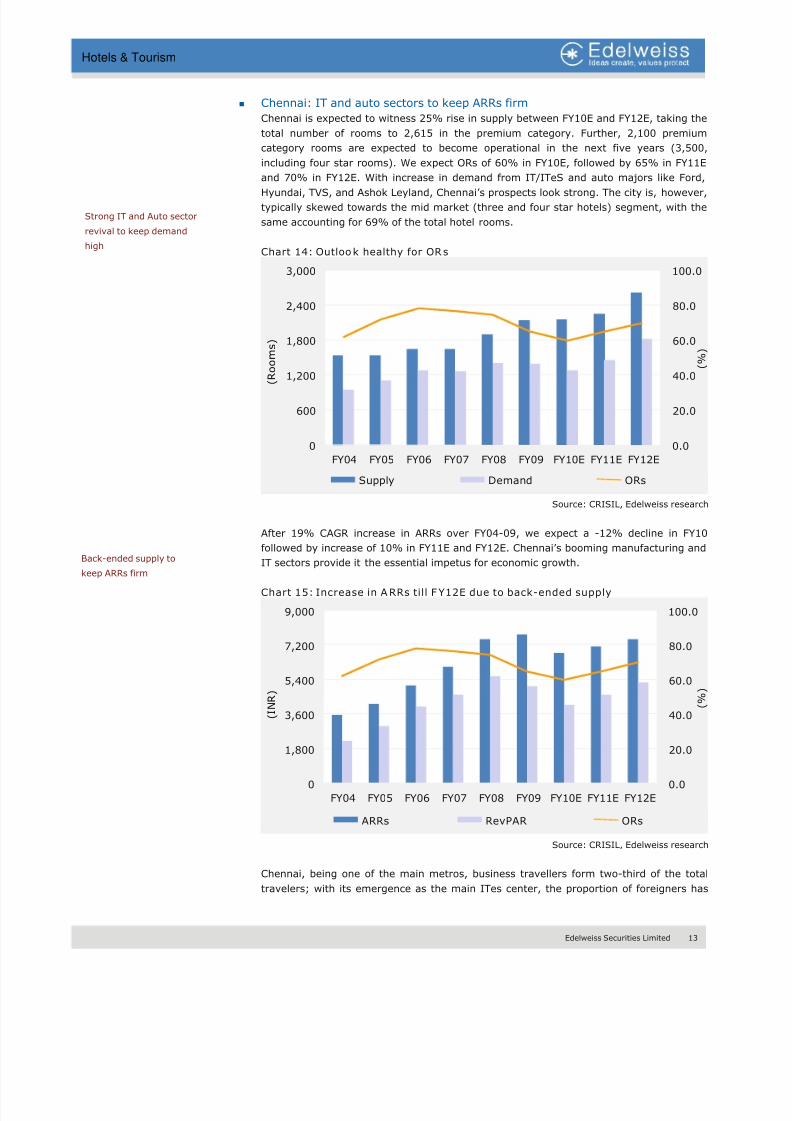
In Mumbai, though business travellers constitute majority of the demand, demand is
equally divided among domestic and foreign travellers. Going forward, we expect thismix to remain intact, but believe the proportion of business travellers will rise
(considering India is expected to be one of the fastest growing economies in the world
for many years).
Chart 13: Business and political travellers drive demand in Mumbai
6.1 6.5 8.5 4.6
64.5 58.7 56.956.5
11.913.5 9.7
8.6
3.93.7 5.8
5.3
13.6 17.6 19.125
0
20
40
60
80
100
FY05 FY06 FY07 FY08
( % )
Others Tour Group Leisure Traveller Business Traveller Airline crew
Source: CRISIL, Edelweiss research
Limited supply in South
Mumbai to keep ARRs
firm
8/8/2019 Hotel and Tourism
http://slidepdf.com/reader/full/hotel-and-tourism 14/106
Edelweiss Securities Limited 13
Hotels & Tourism
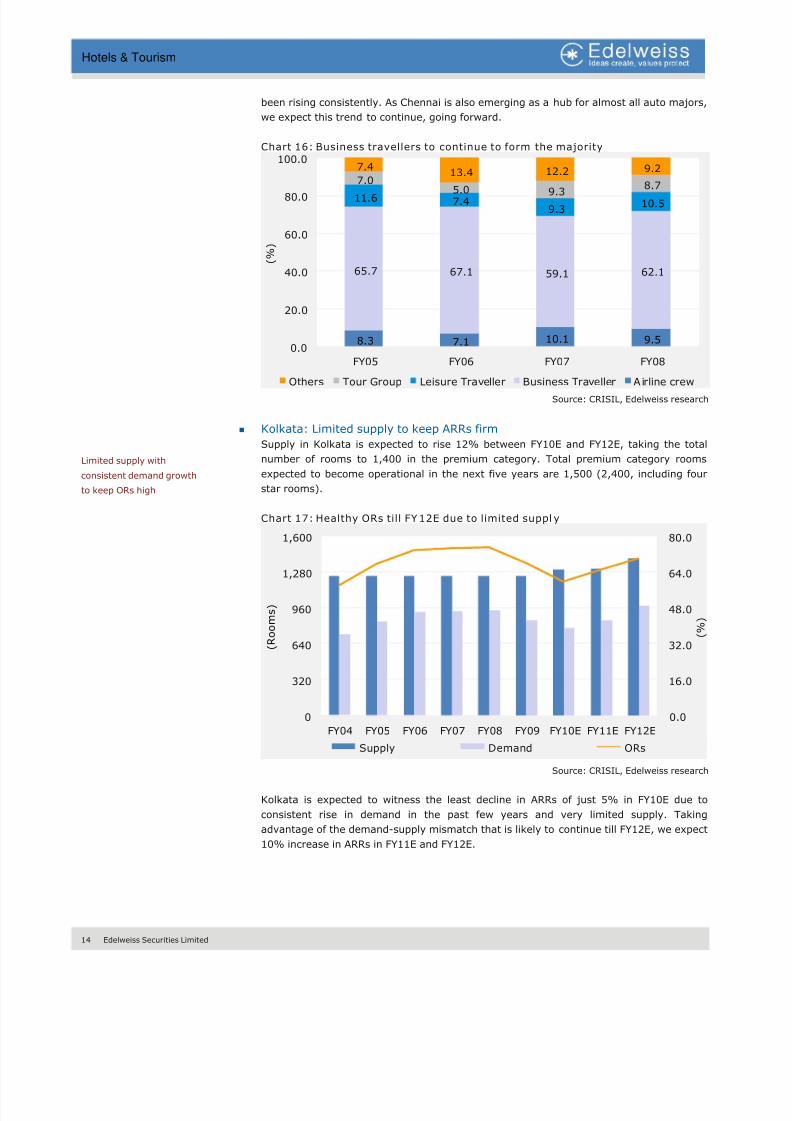
Chennai: IT and auto sectors to keep ARRs firm
Chennai is expected to witness 25% rise in supply between FY10E and FY12E, taking the
total number of rooms to 2,615 in the premium category. Further, 2,100 premium
category rooms are expected to become operational in the next five years (3,500,
including four star rooms). We expect ORs of 60% in FY10E, followed by 65% in FY11E
and 70% in FY12E. With increase in demand from IT/ITeS and auto majors like Ford,
Hyundai, TVS, and Ashok Leyland, Chennai’s prospects look strong. The city is, however,
typically skewed towards the mid market (three and four star hotels) segment, with the
same accounting for 69% of the total hotel rooms.
Chart 14: Outlook healthy for ORs
0.0
20.0
40.0
60.0
80.0
100.0
0
600
1,200
1,800
2,400
3,000
FY04 FY05 FY06 FY07 FY08 FY09 FY10E FY11E FY12E
( % )
( R
o o m s )
Supply Demand ORs
Source: CRISIL, Edelweiss research
After 19% CAGR increase in ARRs over FY04-09, we expect a -12% decline in FY10
followed by increase of 10% in FY11E and FY12E. Chennai’s booming manufacturing and
IT sectors provide it the essential impetus for economic growth.
Chart 15: Increase in ARRs till F Y12E due to back-ended supply
0.0
20.0
40.0
60.0
80.0
100.0
0
1,800
3,600
5,400
7,200
9,000
FY04 FY05 FY06 FY07 FY08 FY09 FY10E FY11E FY12E
( % )
( I N R )
ARRs RevPAR ORs
Source: CRISIL, Edelweiss research
Chennai, being one of the main metros, business travellers form two-third of the total
travelers; with its emergence as the main ITes center, the proportion of foreigners has
Strong IT and Auto sector
revival to keep demand
high
Back-ended supply to
keep ARRs firm
8/8/2019 Hotel and Tourism
http://slidepdf.com/reader/full/hotel-and-tourism 15/106
14 Edelweiss Securities Limited
Hotels & Tourism
been rising consistently. As Chennai is also emerging as a hub for almost all auto majors,
we expect this trend to continue, going forward.
Chart 16: Business travellers to continue to form the majority
8.3 7.1 10.1 9.5
65.7 67.1 59.1 62.1
11.6 7.49.3
10.5
7.05.0 9.3 8.7
7.413.4 12.2 9.2
0.0
20.0
40.0
60.0
80.0
100.0
FY05 FY06 FY07 FY08
( % )
Others Tour Group Leisure Traveller Business Traveller A irline crew
Source: CRISIL, Edelweiss research
Kolkata: Limited supply to keep ARRs firm
Supply in Kolkata is expected to rise 12% between FY10E and FY12E, taking the total
number of rooms to 1,400 in the premium category. Total premium category rooms
expected to become operational in the next five years are 1,500 (2,400, including four
star rooms).
Chart 17: Healthy ORs till FY12E due to limited suppl y
0.0
16.0
32.0
48.0
64.0
80.0
0
320
640
960
1,280
1,600
FY04 FY05 FY06 FY07 FY08 FY09 FY10E FY11E FY12E
( % )
( R o o m s )
Supply Demand ORs
Source: CRISIL, Edelweiss research
Kolkata is expected to witness the least decline in ARRs of just 5% in FY10E due to
consistent rise in demand in the past few years and very limited supply. Taking
advantage of the demand-supply mismatch that is likely to continue till FY12E, we expect
10% increase in ARRs in FY11E and FY12E.
Limited supply with
consistent demand growth
to keep ORs high
8/8/2019 Hotel and Tourism
http://slidepdf.com/reader/full/hotel-and-tourism 16/106
Edelweiss Securities Limited 15
Hotels & Tourism
Chart 18: Strong ARRs till F Y12E
0.0
16.0
32.0
48.0
64.0
80.0
0
1,600
3,200
4,800
6,400
8,000
FY04 FY05 FY06 FY07 FY08 FY09 FY10E FY11E FY12E
( % )
( I N R )
ARRs RevPAR ORs
Source: CRISIL, Edelweiss research
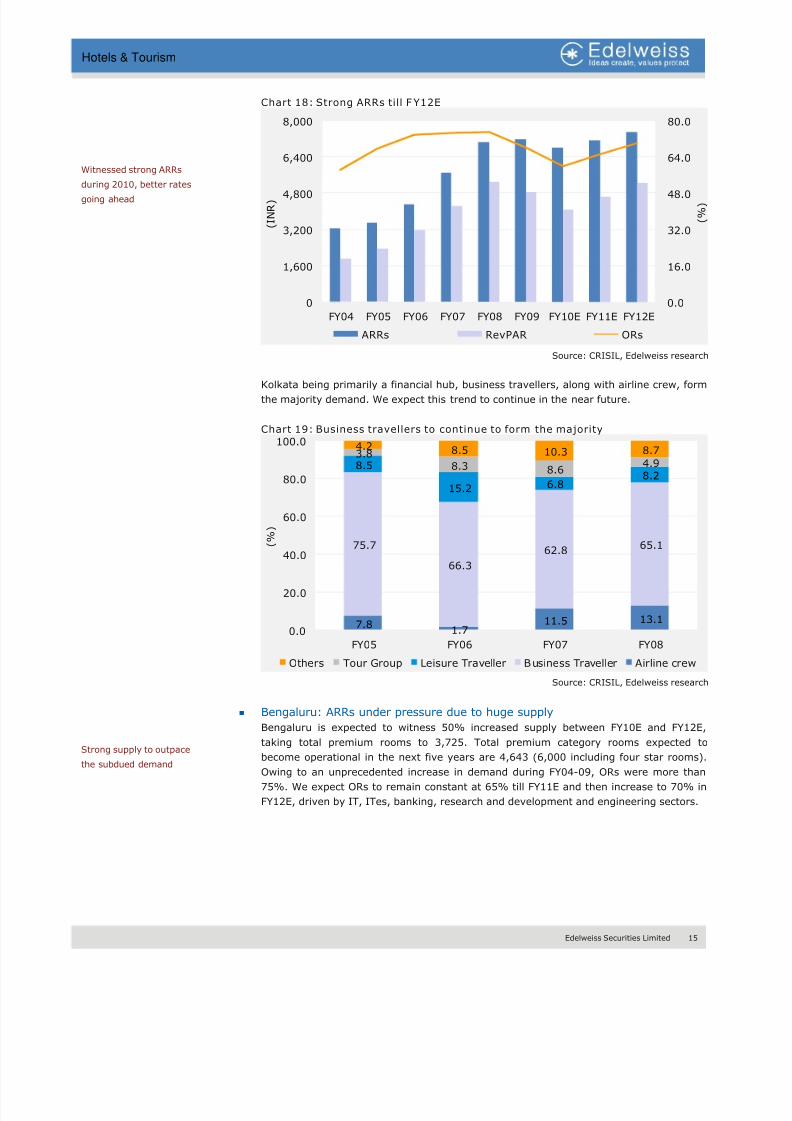
Kolkata being primarily a financial hub, business travellers, along with airline crew, form
the majority demand. We expect this trend to continue in the near future.
Chart 19: Business travellers to continue to form the majority
7.81.7
11.5 13.1
75.7
66.3
62.865.1
8.5
15.2 6.88.2
3.88.3 8.6
4.9
4.2 8.5 10.3 8.7
0.0
20.0
40.0
60.0
80.0
100.0
FY05 FY06 FY07 FY08
( % )
Others Tour Group Leisure Traveller Business Traveller Airline crew
Source: CRISIL, Edelweiss research
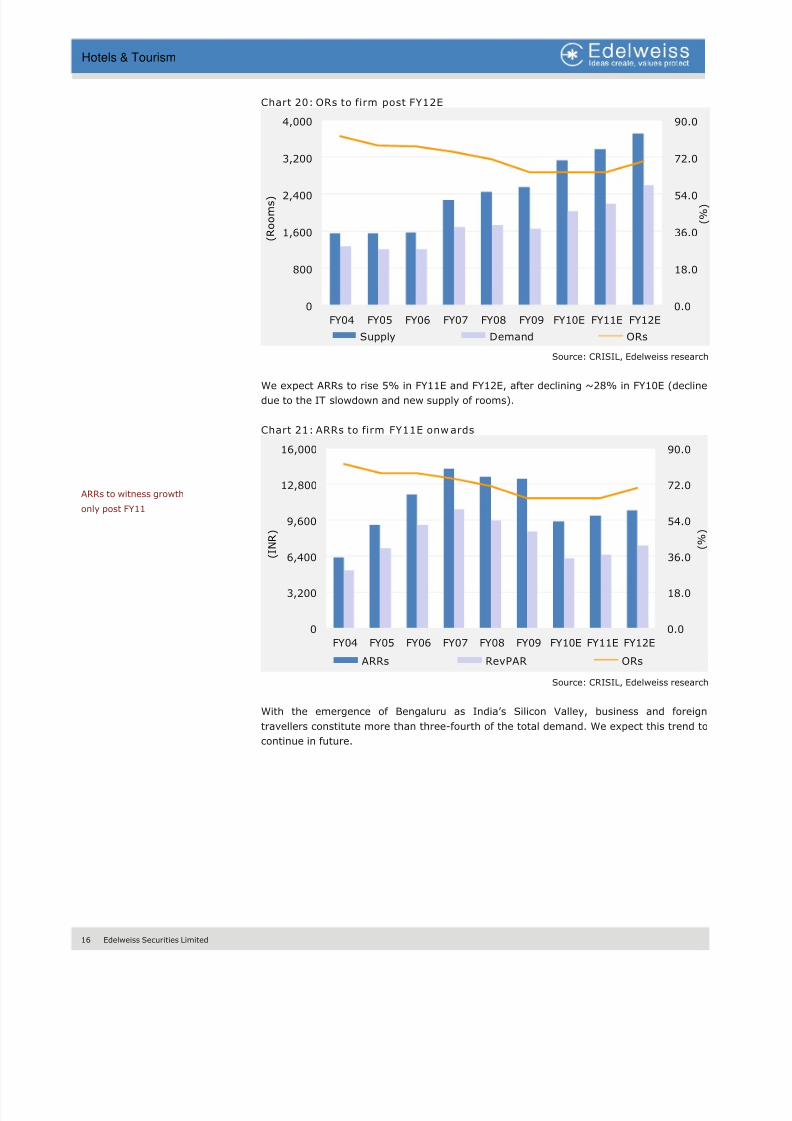
Bengaluru: ARRs under pressure due to huge supply
Bengaluru is expected to witness 50% increased supply between FY10E and FY12E,
taking total premium rooms to 3,725. Total premium category rooms expected to
become operational in the next five years are 4,643 (6,000 including four star rooms).
Owing to an unprecedented increase in demand during FY04-09, ORs were more than
75%. We expect ORs to remain constant at 65% till FY11E and then increase to 70% in
FY12E, driven by IT, ITes, banking, research and development and engineering sectors.
Strong supply to outpacethe subdued demand
Witnessed strong ARRs
during 2010, better ratesgoing ahead
8/8/2019 Hotel and Tourism
http://slidepdf.com/reader/full/hotel-and-tourism 17/106
16 Edelweiss Securities Limited
Hotels & Tourism
Chart 20: ORs to firm post FY12E
0.0
18.0
36.0
54.0
72.0
90.0
0
800
1,600
2,400
3,200
4,000
FY04 FY05 FY06 FY07 FY08 FY09 FY10E FY11E FY12E
( % )
( R o o m s )
Supply Demand ORs
Source: CRISIL, Edelweiss research
We expect ARRs to rise 5% in FY11E and FY12E, after declining ~28% in FY10E (decline
due to the IT slowdown and new supply of rooms).
Chart 21: ARRs to firm FY11E onw ards
0.0
18.0
36.0
54.0
72.0
90.0
0
3,200
6,400
9,600
12,800
16,000
FY04 FY05 FY06 FY07 FY08 FY09 FY10E FY11E FY12E
( % )
( I N R )
ARRs RevPAR ORs
Source: CRISIL, Edelweiss research
With the emergence of Bengaluru as India’s Silicon Valley, business and foreign
travellers constitute more than three-fourth of the total demand. We expect this trend to
continue in future.
ARRs to witness growth
only post FY11
8/8/2019 Hotel and Tourism
http://slidepdf.com/reader/full/hotel-and-tourism 18/106
Edelweiss Securities Limited 17
Hotels & Tourism
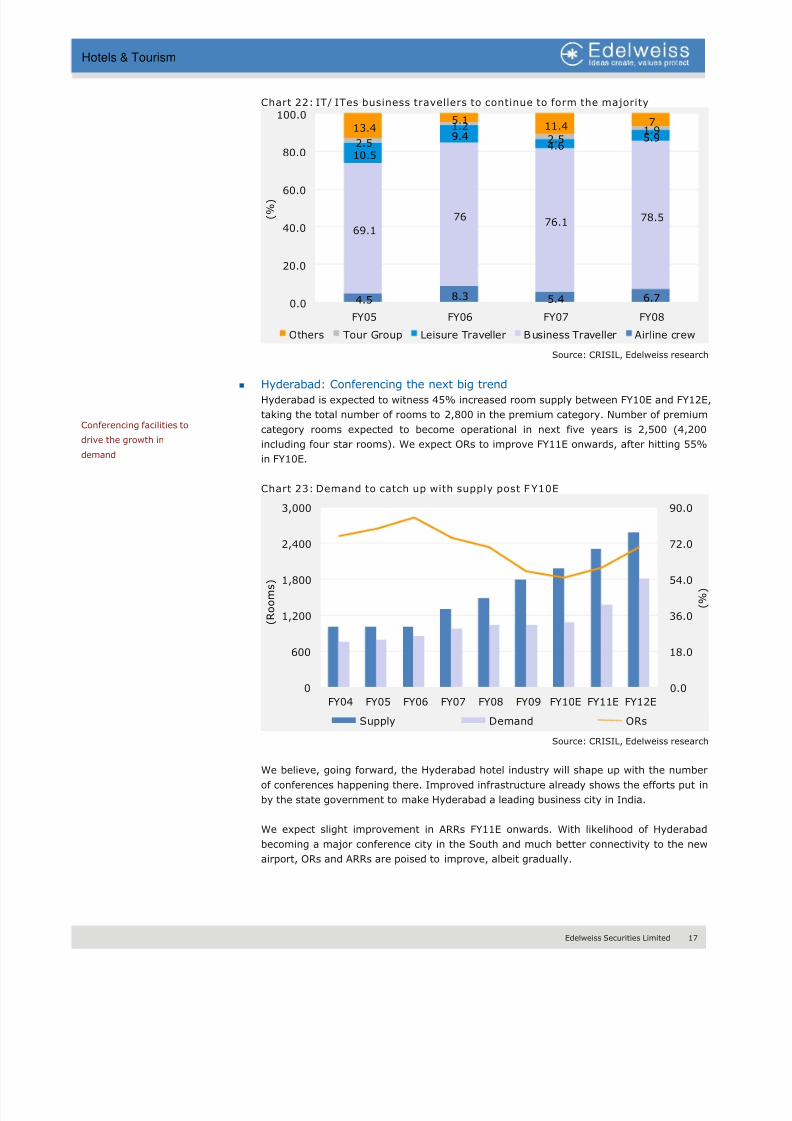
Chart 22: IT/ ITes business travellers to continue to form the majority
4.5 8.3 5.4 6.7
69.1
7676.1 78.5
10.5
9.44.6
5.92.5
1.2
2.51.913.4
5.111.4 7
0.0
20.0
40.0
60.0
80.0
100.0
FY05 FY06 FY07 FY08
( % )
Others Tour Group Leisure Traveller Business Traveller Airline crew
Source: CRISIL, Edelweiss research
Hyderabad: Conferencing the next big trend
Hyderabad is expected to witness 45% increased room supply between FY10E and FY12E,
taking the total number of rooms to 2,800 in the premium category. Number of premium
category rooms expected to become operational in next five years is 2,500 (4,200
including four star rooms). We expect ORs to improve FY11E onwards, after hitting 55%
in FY10E.
Chart 23: Demand to catch up with supply post FY10E
0.0
18.0
36.0
54.0
72.0
90.0
0
600
1,200
1,800
2,400
3,000
FY04 FY05 FY06 FY07 FY08 FY09 FY10E FY11E FY12E
( % )
( R o o m s )
Supply Demand ORs
Source: CRISIL, Edelweiss research
We believe, going forward, the Hyderabad hotel industry will shape up with the number
of conferences happening there. Improved infrastructure already shows the efforts put in
by the state government to make Hyderabad a leading business city in India.
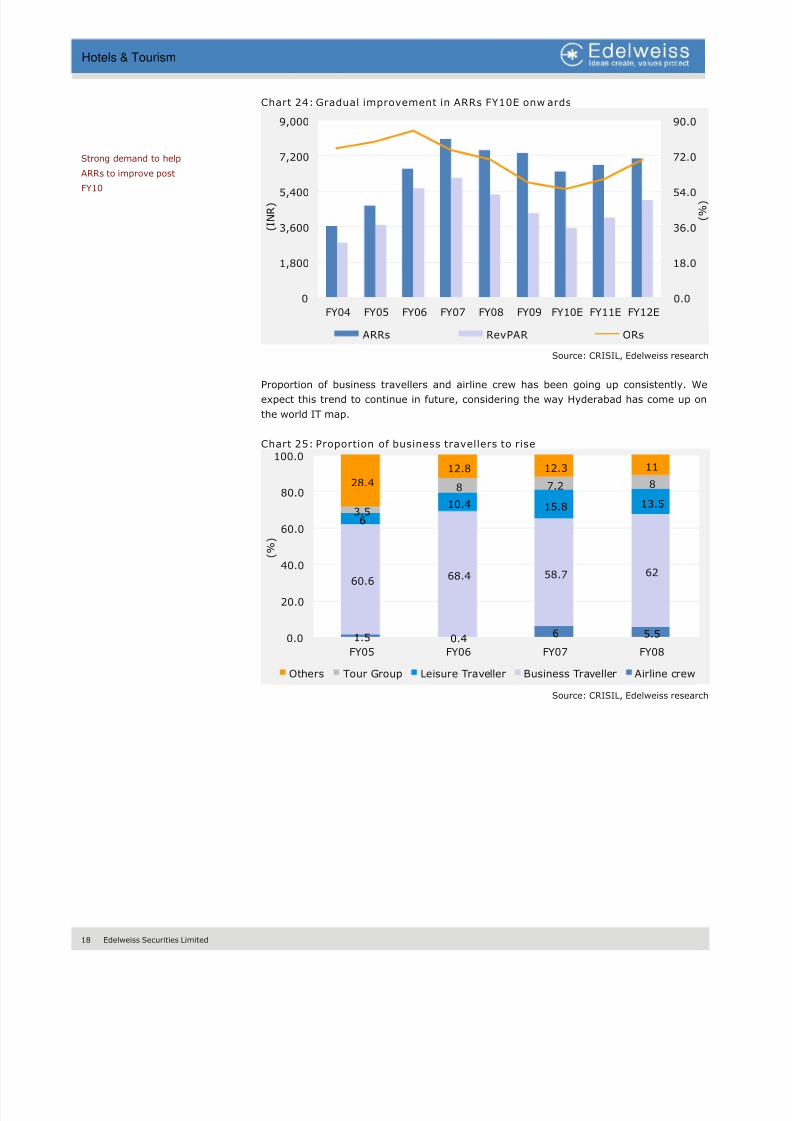
We expect slight improvement in ARRs FY11E onwards. With likelihood of Hyderabad
becoming a major conference city in the South and much better connectivity to the new
airport, ORs and ARRs are poised to improve, albeit gradually.
Conferencing facilities to
drive the growth in
demand
8/8/2019 Hotel and Tourism
http://slidepdf.com/reader/full/hotel-and-tourism 19/106
18 Edelweiss Securities Limited
Hotels & Tourism
Chart 24: Gradual improvement in ARRs FY10E onw ards
0.0
18.0
36.0
54.0
72.0
90.0
0
1,800
3,600
5,400
7,200
9,000
FY04 FY05 FY06 FY07 FY08 FY09 FY10E FY11E FY12E
( % )
( I N R )
ARRs RevPAR ORs
Source: CRISIL, Edelweiss research
Proportion of business travellers and airline crew has been going up consistently. We
expect this trend to continue in future, considering the way Hyderabad has come up on
the world IT map.
Chart 25: Proportion of business travellers to rise
1.5 0.4 6 5.5
60.6 68.4 58.7 62
6
10.4 15.8 13.53.5
8 7.2 828.4
12.8 12.3 11
0.0
20.0
40.0
60.0
80.0
100.0
FY05 FY06 FY07 FY08
( % )
Others Tour Group Leisure Traveller Business Traveller Airline crew
Source: CRISIL, Edelweiss research
Strong demand to help
ARRs to improve post
FY10
8/8/2019 Hotel and Tourism
http://slidepdf.com/reader/full/hotel-and-tourism 20/106
Edelweiss Securities Limited 19
Hotels & Tourism
Outlook on other major cities
Pune: We expect Pune to add 4,000 rooms over the next five years, growing more than
250%. In the premium category, ~1,000 rooms are expected to come up in the next five
years. Owing to IT slowdown and the swine flu scare, ARRs are expected to fall 25% in
FY10E and ORs to sub 50% levels. Likelihood of excess supply in the city is certain to
keep the pressure on ORs and ARRs in FY11E and FY12E.
Pune has become highly popular because of its biotechnology, pharmaceutical, IT, ITeS
and BPO industries, which will eventually drive growth in its hospitality industry.
Goa: The city is expected to register 30% jump in supply till FY12E, taking the total
supply close to 3,900 rooms. Tough real estate laws are to be blamed for the slow
development of hotels across the city. Including four star hotels, the total supply
expected in the next five years is 2,178 rooms. We expect Goa to witness continuous
rise in ARRs during FY11-12E, as we expect domestic travellers to replace the gap left by
foreign travellers to some extent. Recent trends show increased demand for hotel rooms
in Goa all year round, reducing the impact of seasonality on the local hotel market. This
is also evident from the fact that ORs, FY04 onwards, have been moving up consistently.
Long-term positive
outlook on demand-supply and ARRs on many
Indian cities
8/8/2019 Hotel and Tourism
http://slidepdf.com/reader/full/hotel-and-tourism 21/106
20 Edelweiss Securities Limited
Hotels & Tourism
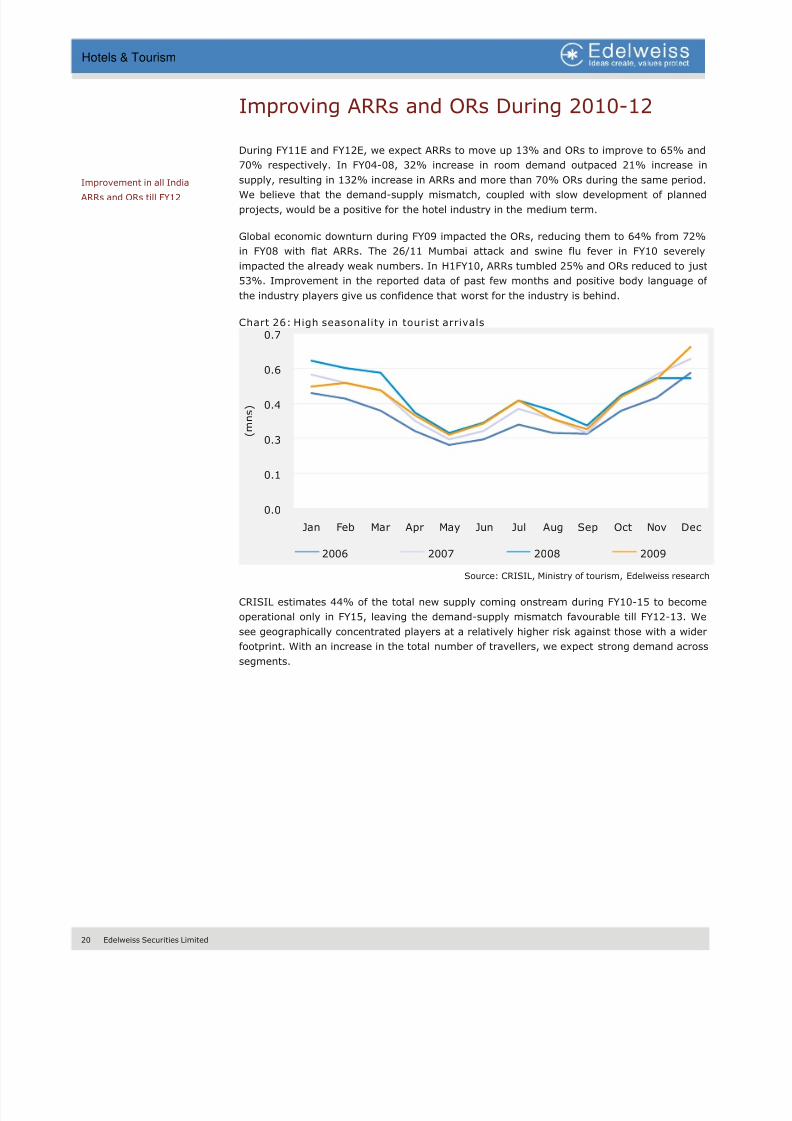
Improving ARRs and ORs During 2010-12
During FY11E and FY12E, we expect ARRs to move up 13% and ORs to improve to 65% and
70% respectively. In FY04-08, 32% increase in room demand outpaced 21% increase in
supply, resulting in 132% increase in ARRs and more than 70% ORs during the same period.
We believe that the demand-supply mismatch, coupled with slow development of planned
projects, would be a positive for the hotel industry in the medium term.
Global economic downturn during FY09 impacted the ORs, reducing them to 64% from 72%
in FY08 with flat ARRs. The 26/11 Mumbai attack and swine flu fever in FY10 severely
impacted the already weak numbers. In H1FY10, ARRs tumbled 25% and ORs reduced to just
53%. Improvement in the reported data of past few months and positive body language of
the industry players give us confidence that worst for the industry is behind.
Chart 26: High seasonality in tourist arrivals
0.0
0.1
0.3
0.4
0.6
0.7
Jan Feb Mar Apr May Jun Jul Aug Sep Oct Nov Dec
( m n s )
2006 2007 2008 2009
Source: CRISIL, Ministry of tourism, Edelweiss research
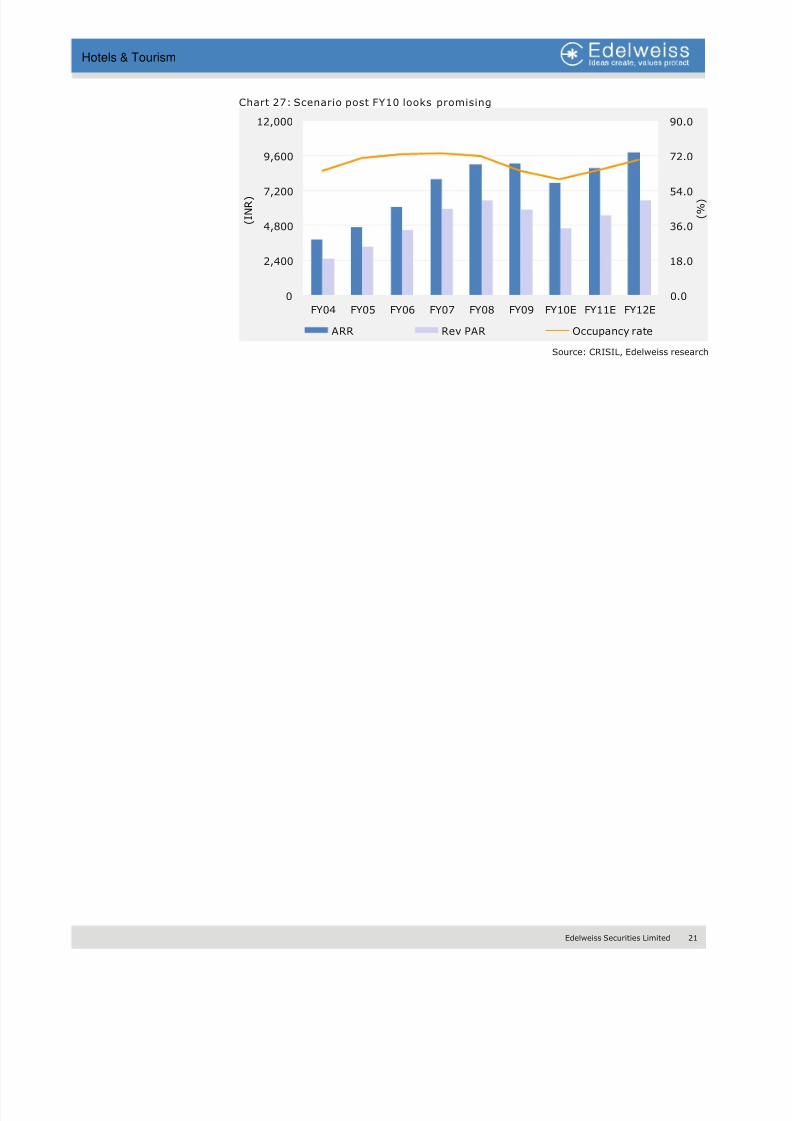
CRISIL estimates 44% of the total new supply coming onstream during FY10-15 to become
operational only in FY15, leaving the demand-supply mismatch favourable till FY12-13. We
see geographically concentrated players at a relatively higher risk against those with a wider
footprint. With an increase in the total number of travellers, we expect strong demand across
segments.
Improvement in all India
ARRs and ORs till FY12
8/8/2019 Hotel and Tourism
http://slidepdf.com/reader/full/hotel-and-tourism 22/106
Edelweiss Securities Limited 21
Hotels & Tourism
Chart 27: Scenario post FY10 looks promising
0.0
18.0
36.0
54.0
72.0
90.0
0
2,400
4,800
7,200
9,600
12,000
FY04 FY05 FY06 FY07 FY08 FY09 FY10E FY11E FY12E
( % )
( I N R )
ARR Rev PAR Occupancy rate
Source: CRISIL, Edelweiss research
8/8/2019 Hotel and Tourism
http://slidepdf.com/reader/full/hotel-and-tourism 23/106
22 Edelweiss Securities Limited
Hotels & Tourism
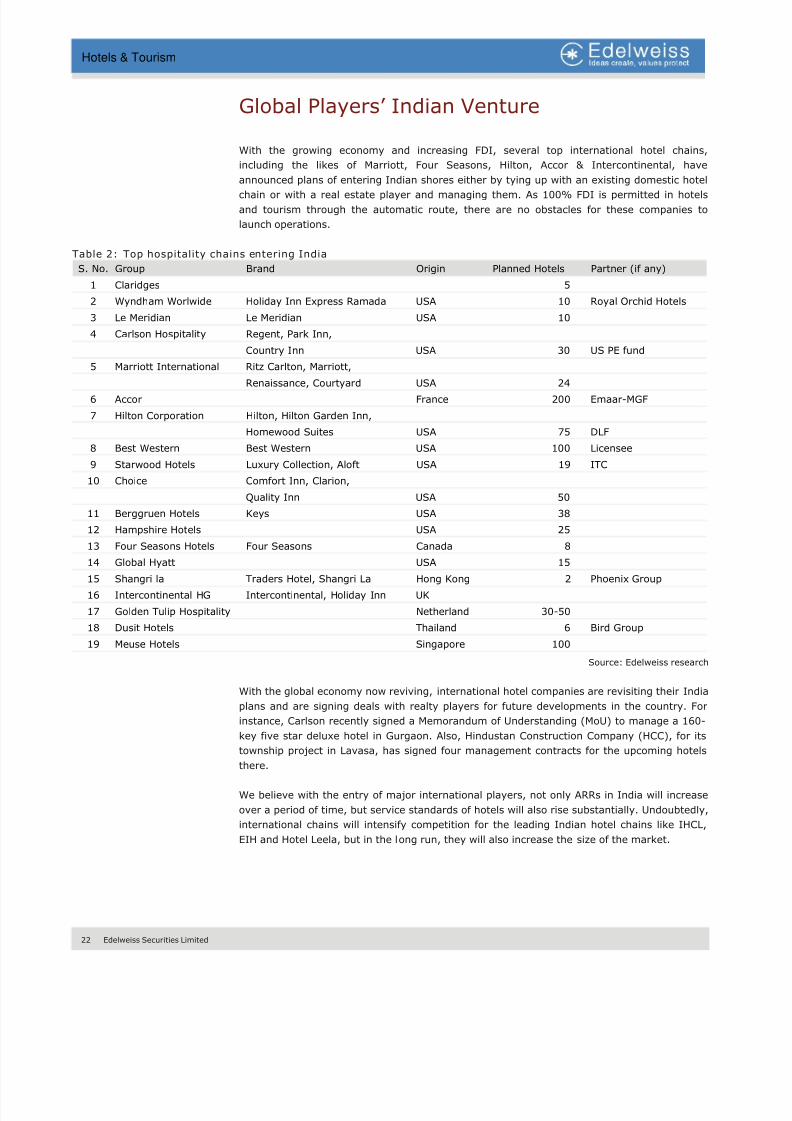
Global Players’ Indian Venture
With the growing economy and increasing FDI, several top international hotel chains,
including the likes of Marriott, Four Seasons, Hilton, Accor & Intercontinental, have
announced plans of entering Indian shores either by tying up with an existing domestic hotel
chain or with a real estate player and managing them. As 100% FDI is permitted in hotels
and tourism through the automatic route, there are no obstacles for these companies to
launch operations.
Table 2: Top hospitality chains entering India
S. No. Group Brand Origin Planned Hotels Partner (if any)
1 Claridges 5
2 Wyndham Worlwide Holiday Inn Express Ramada USA 10 Royal Orchid Hotels
3 Le Meridian Le Meridian USA 10
4 Carlson Hospitality Regent, Park Inn,
Country Inn USA 30 US PE fund
5 Marriott International Ritz Carlton, Marriott,
Renaissance, Courtyard USA 24
6 Accor France 200 Emaar-MGF
7 Hilton Corporation Hilton, Hilton Garden Inn,
Homewood Suites USA 75 DLF
8 Best Western Best Western USA 100 Licensee
9 Starwood Hotels Luxury Collection, Aloft USA 19 ITC
10 Choice Comfort Inn, Clarion,
Quality Inn USA 50
11 Berggruen Hotels Keys USA 38
12 Hampshire Hotels USA 25
13 Four Seasons Hotels Four Seasons Canada 8
14 Global Hyatt USA 15 15 Shangri la Traders Hotel, Shangri La Hong Kong 2 Phoenix Group
16 Intercontinental HG Intercontinental, Holiday Inn UK
17 Golden Tulip Hospitality Netherland 30-50
18 Dusit Hotels Thailand 6 Bird Group
19 Meuse Hotels Singapore 100
Source: Edelweiss research
With the global economy now reviving, international hotel companies are revisiting their India
plans and are signing deals with realty players for future developments in the country. For
instance, Carlson recently signed a Memorandum of Understanding (MoU) to manage a 160-
key five star deluxe hotel in Gurgaon. Also, Hindustan Construction Company (HCC), for its
township project in Lavasa, has signed four management contracts for the upcoming hotelsthere.
We believe with the entry of major international players, not only ARRs in India will increase
over a period of time, but service standards of hotels will also rise substantially. Undoubtedly,
international chains will intensify competition for the leading Indian hotel chains like IHCL,
EIH and Hotel Leela, but in the long run, they will also increase the size of the market.
8/8/2019 Hotel and Tourism
http://slidepdf.com/reader/full/hotel-and-tourism 24/106
Edelweiss Securities Limited 23
Hotels & Tourism
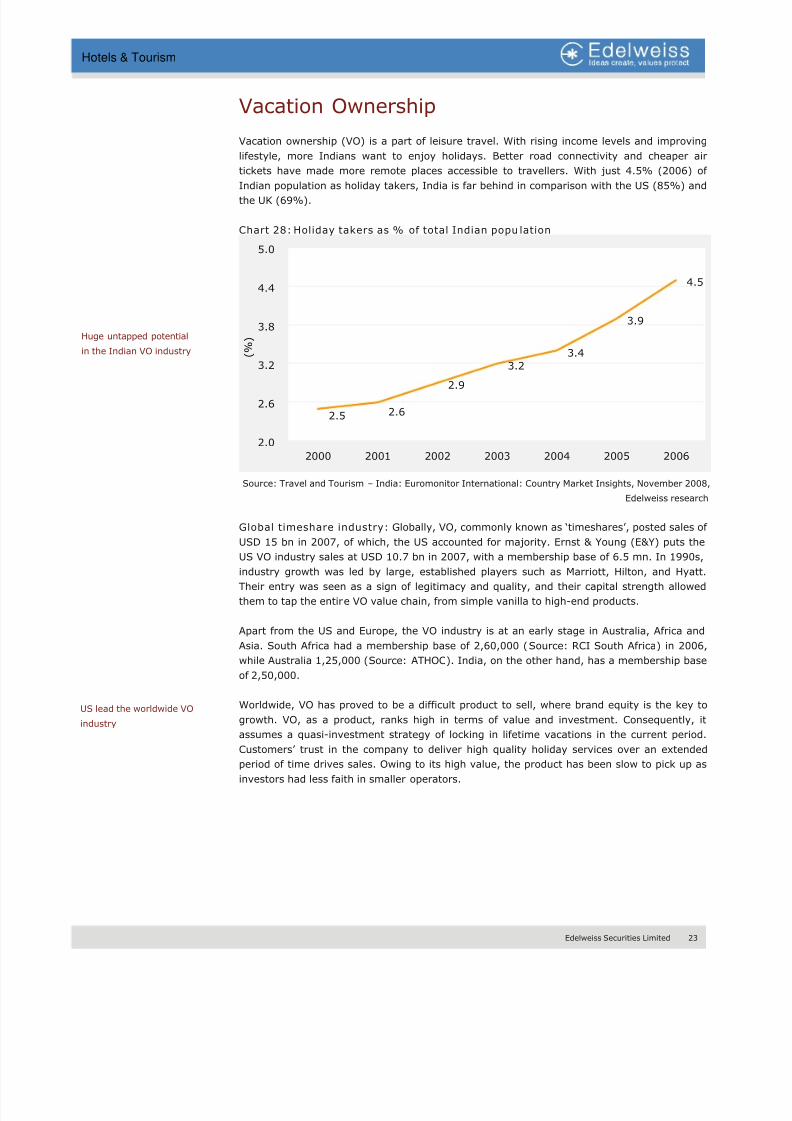
Vacation Ownership
Vacation ownership (VO) is a part of leisure travel. With rising income levels and improving
lifestyle, more Indians want to enjoy holidays. Better road connectivity and cheaper air
tickets have made more remote places accessible to travellers. With just 4.5% (2006) of
Indian population as holiday takers, India is far behind in comparison with the US (85%) andthe UK (69%).
Chart 28: Holiday takers as % of total Indian popu lation
2.5 2.6
2.9
3.2
3.4
3.9
4.5
2.0
2.6
3.2
3.8
4.4
5.0
2000 2001 2002 2003 2004 2005 2006
( % )
Source: Travel and Tourism – India: Euromonitor International: Country Market Insights, November 2008,
Edelweiss research
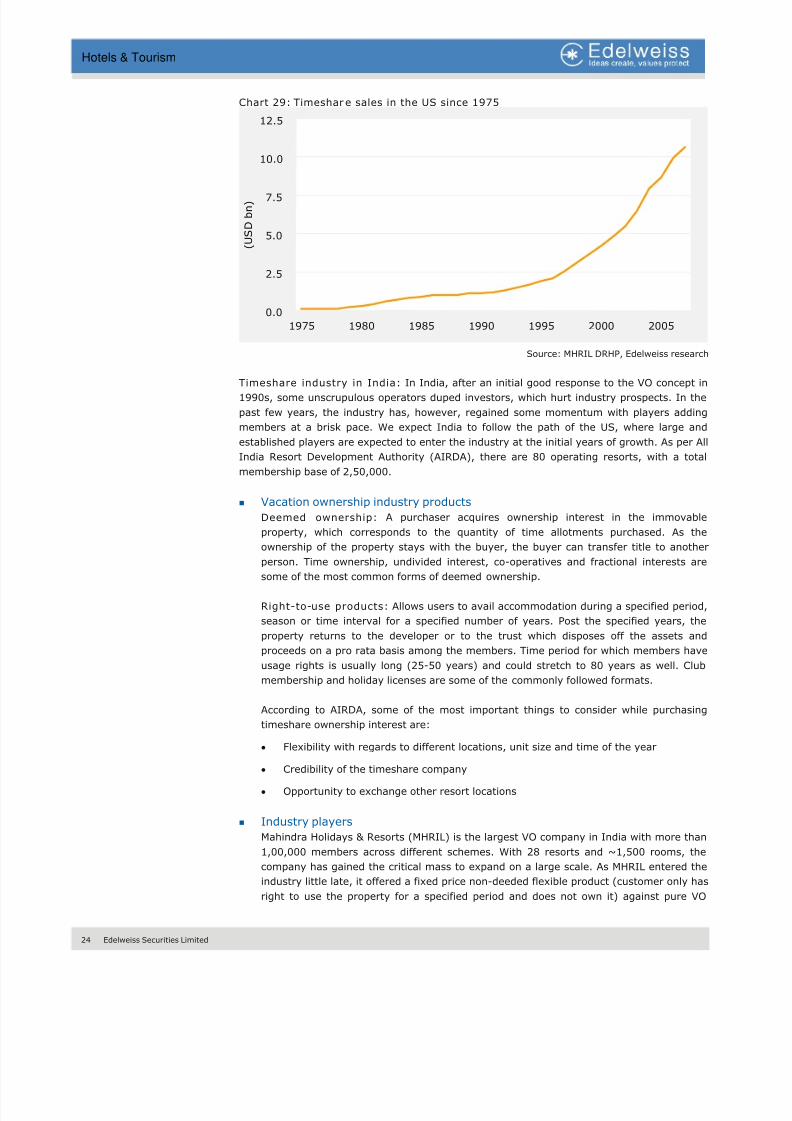
Global timeshare industry: Globally, VO, commonly known as ‘timeshares’, posted sales of
USD 15 bn in 2007, of which, the US accounted for majority. Ernst & Young (E&Y) puts the
US VO industry sales at USD 10.7 bn in 2007, with a membership base of 6.5 mn. In 1990s,
industry growth was led by large, established players such as Marriott, Hilton, and Hyatt.
Their entry was seen as a sign of legitimacy and quality, and their capital strength allowed
them to tap the entire VO value chain, from simple vanilla to high-end products.
Apart from the US and Europe, the VO industry is at an early stage in Australia, Africa and
Asia. South Africa had a membership base of 2,60,000 (Source: RCI South Africa) in 2006,
while Australia 1,25,000 (Source: ATHOC). India, on the other hand, has a membership base
of 2,50,000.
Worldwide, VO has proved to be a difficult product to sell, where brand equity is the key to
growth. VO, as a product, ranks high in terms of value and investment. Consequently, it
assumes a quasi-investment strategy of locking in lifetime vacations in the current period.
Customers’ trust in the company to deliver high quality holiday services over an extendedperiod of time drives sales. Owing to its high value, the product has been slow to pick up as
investors had less faith in smaller operators.
Huge untapped potential
in the Indian VO industry
US lead the worldwide VO
industry
8/8/2019 Hotel and Tourism
http://slidepdf.com/reader/full/hotel-and-tourism 25/106
24 Edelweiss Securities Limited
Hotels & Tourism
Chart 29: Timeshare sales in the US since 1975
0.0
2.5
5.0
7.5
10.0
12.5
1975 1980 1985 1990 1995 2000 2005
( U S D b n )
Source: MHRIL DRHP, Edelweiss research
Timeshare industry in India: In India, after an initial good response to the VO concept in
1990s, some unscrupulous operators duped investors, which hurt industry prospects. In the
past few years, the industry has, however, regained some momentum with players adding
members at a brisk pace. We expect India to follow the path of the US, where large and
established players are expected to enter the industry at the initial years of growth. As per All
India Resort Development Authority (AIRDA), there are 80 operating resorts, with a total
membership base of 2,50,000.
Vacation ownership industry products
Deemed ownership: A purchaser acquires ownership interest in the immovable
property, which corresponds to the quantity of time allotments purchased. As the
ownership of the property stays with the buyer, the buyer can transfer title to another
person. Time ownership, undivided interest, co-operatives and fractional interests aresome of the most common forms of deemed ownership.
Right-to-use products: Allows users to avail accommodation during a specified period,
season or time interval for a specified number of years. Post the specified years, the
property returns to the developer or to the trust which disposes off the assets and
proceeds on a pro rata basis among the members. Time period for which members have
usage rights is usually long (25-50 years) and could stretch to 80 years as well. Club
membership and holiday licenses are some of the commonly followed formats.
According to AIRDA, some of the most important things to consider while purchasing
timeshare ownership interest are:
• Flexibility with regards to different locations, unit size and time of the year
• Credibility of the timeshare company
• Opportunity to exchange other resort locations
Industry players
Mahindra Holidays & Resorts (MHRIL) is the largest VO company in India with more than
1,00,000 members across different schemes. With 28 resorts and ~1,500 rooms, the
company has gained the critical mass to expand on a large scale. As MHRIL entered the
industry little late, it offered a fixed price non-deeded flexible product (customer only has
right to use the property for a specified period and does not own it) against pure VO
8/8/2019 Hotel and Tourism
http://slidepdf.com/reader/full/hotel-and-tourism 26/106
Edelweiss Securities Limited 25
Hotels & Tourism
product (customer owns a share of the unit, and can use it for the designated holiday
period).
MHRIL offers 25-year 7 nights holidays to its members where membership rates range
from INR 0.15 to INR 1.00 mn. It offers purple, red, white and blue seasons as per the
membership rates. MHRIL charges its members upfront and uses that cash to build its
fixed assets inventory. The company also offers Zest (targeting young urban consumers
seeking short breaks), Club Mahindra Fundays (targeting corporate customers) and
Mahindra Homestays (targeting vacation travellers who prefer to stay with an Indian
family). Further, the company plans to launch more schemes like Mahindra Heritage (for
senior citizens), Gypsy (targeting teenagers) and fractional ownership property products
(for high-end customers seeking a holiday home).
MHRIL derives its revenues from membership fee, annual subscription fee, resort income,
securitization income and interest income. As MHRIL charges customers upfront to build
its resorts. The company gains as ownership of the property stays with it and the
member gains over a period of time as the value of membership increases which is
transferable.
Country Club and Sterling Holiday Resorts are some of the competitors in the listed
space, but their scale and operations are no comparison for MHRIL.
Mahindra Holidays
dominates the Indian VO
industry
8/8/2019 Hotel and Tourism
http://slidepdf.com/reader/full/hotel-and-tourism 27/106
26 Edelweiss Securities Limited
Hotels & Tourism
Global Travel & Tourism
T&T is currently one of the world’s largest economic activities. It is the leading industry in
many countries as well as the fastest growing economic sector worldwide in terms of job
creation, according to the World Tourism Organization (UNWTO). Encompassing all
components of T&T consumption, investment, government spending and exports, T&T isestimated to have generated ~USD 7,892 bn of economic activity worldwide in 2008. In 2008,
global T&T is expected to have accounted for USD 5,890 bn of economic activity, equivalent
to 9.9% of total GDP. In the same year, there were 230.5 mn jobs in the industry, making up
8.2% of the total employment worldwide. Rising economic importance of the industry has
been fuelled by the large and growing number of international travellers. According to
UNWTO, the number of international arrivals grew from 25 mn in 1950 to an estimated 763
mn in 2004, corresponding to an average annual growth rate of 6.5%.
T&T is divided into inbound and outbound tourism, where inbound refers to countries
attracting the largest number of tourists and outbound refers to countries from where the
largest number of tourist originate.
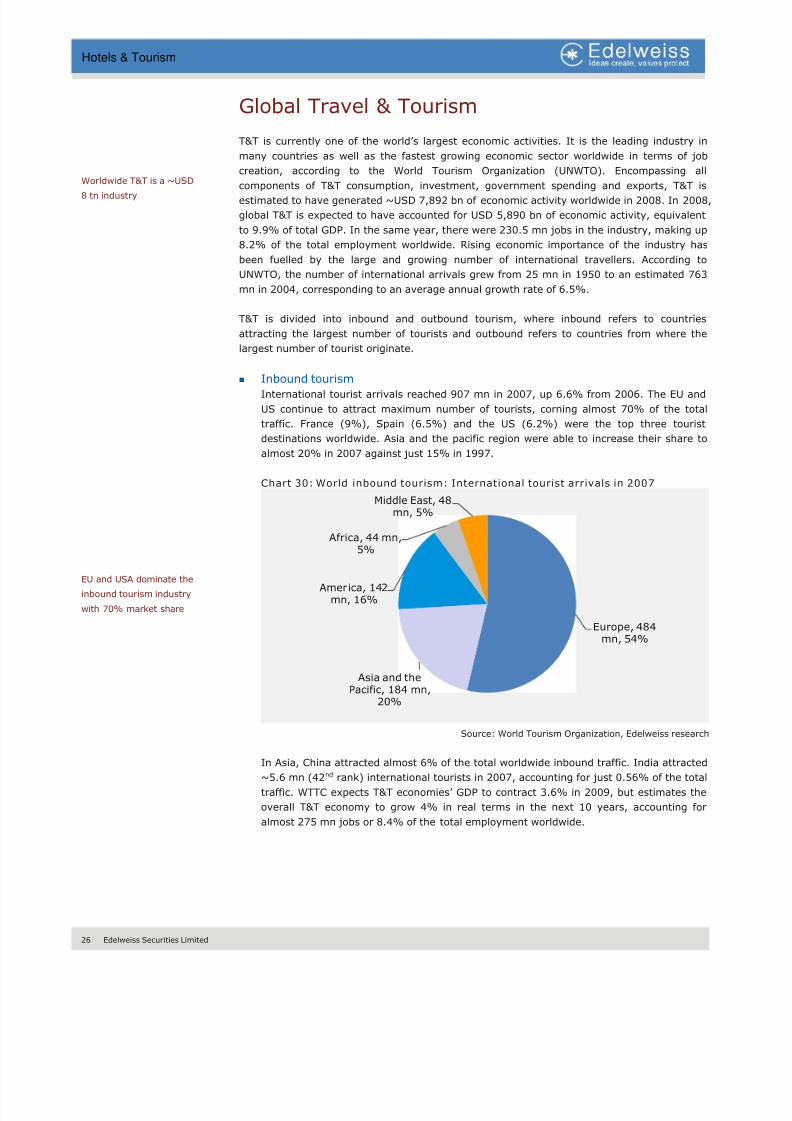
Inbound tourismInternational tourist arrivals reached 907 mn in 2007, up 6.6% from 2006. The EU and
US continue to attract maximum number of tourists, corning almost 70% of the total
traffic. France (9%), Spain (6.5%) and the US (6.2%) were the top three tourist
destinations worldwide. Asia and the pacific region were able to increase their share to
almost 20% in 2007 against just 15% in 1997.
Chart 30: World inbound tourism: International tourist arrivals in 2007
Europe, 484mn, 54%
Asia and thePacific, 184 mn,
20%
America, 142mn, 16%
Africa, 44 mn,5%
Middle East, 48mn, 5%
Source: World Tourism Organization, Edelweiss research
In Asia, China attracted almost 6% of the total worldwide inbound traffic. India attracted
~5.6 mn (42nd rank) international tourists in 2007, accounting for just 0.56% of the total
traffic. WTTC expects T&T economies’ GDP to contract 3.6% in 2009, but estimates the
overall T&T economy to grow 4% in real terms in the next 10 years, accounting for
almost 275 mn jobs or 8.4% of the total employment worldwide.
Worldwide T&T is a ~USD
8 tn industry
EU and USA dominate the
inbound tourism industry
with 70% market share
8/8/2019 Hotel and Tourism
http://slidepdf.com/reader/full/hotel-and-tourism 28/106
Edelweiss Securities Limited 27
Hotels & Tourism
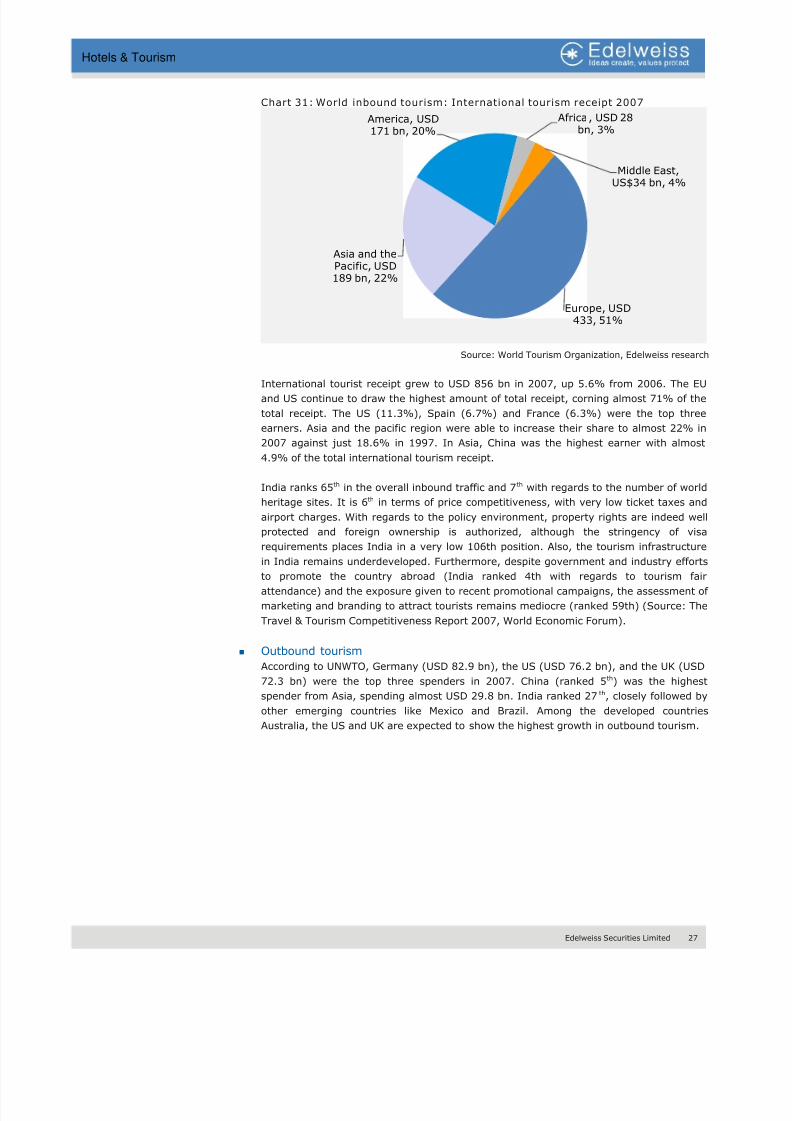
Chart 31: World inbound tourism: International tourism receipt 2007
Europe, USD433, 51%
Asia and thePacific, USD189 bn, 22%
America, USD171 bn, 20%
Africa, USD 28bn, 3%
Middle East,US$34 bn, 4%
Source: World Tourism Organization, Edelweiss research
International tourist receipt grew to USD 856 bn in 2007, up 5.6% from 2006. The EU
and US continue to draw the highest amount of total receipt, corning almost 71% of the
total receipt. The US (11.3%), Spain (6.7%) and France (6.3%) were the top three
earners. Asia and the pacific region were able to increase their share to almost 22% in
2007 against just 18.6% in 1997. In Asia, China was the highest earner with almost
4.9% of the total international tourism receipt.
India ranks 65th in the overall inbound traffic and 7th with regards to the number of world
heritage sites. It is 6th in terms of price competitiveness, with very low ticket taxes and
airport charges. With regards to the policy environment, property rights are indeed well
protected and foreign ownership is authorized, although the stringency of visa
requirements places India in a very low 106th position. Also, the tourism infrastructure
in India remains underdeveloped. Furthermore, despite government and industry effortsto promote the country abroad (India ranked 4th with regards to tourism fair
attendance) and the exposure given to recent promotional campaigns, the assessment of
marketing and branding to attract tourists remains mediocre (ranked 59th) (Source: The
Travel & Tourism Competitiveness Report 2007, World Economic Forum).
Outbound tourism
According to UNWTO, Germany (USD 82.9 bn), the US (USD 76.2 bn), and the UK (USD
72.3 bn) were the top three spenders in 2007. China (ranked 5th) was the highest
spender from Asia, spending almost USD 29.8 bn. India ranked 27 th, closely followed by
other emerging countries like Mexico and Brazil. Among the developed countries
Australia, the US and UK are expected to show the highest growth in outbound tourism.
8/8/2019 Hotel and Tourism
http://slidepdf.com/reader/full/hotel-and-tourism 29/106
8/8/2019 Hotel and Tourism
http://slidepdf.com/reader/full/hotel-and-tourism 30/106
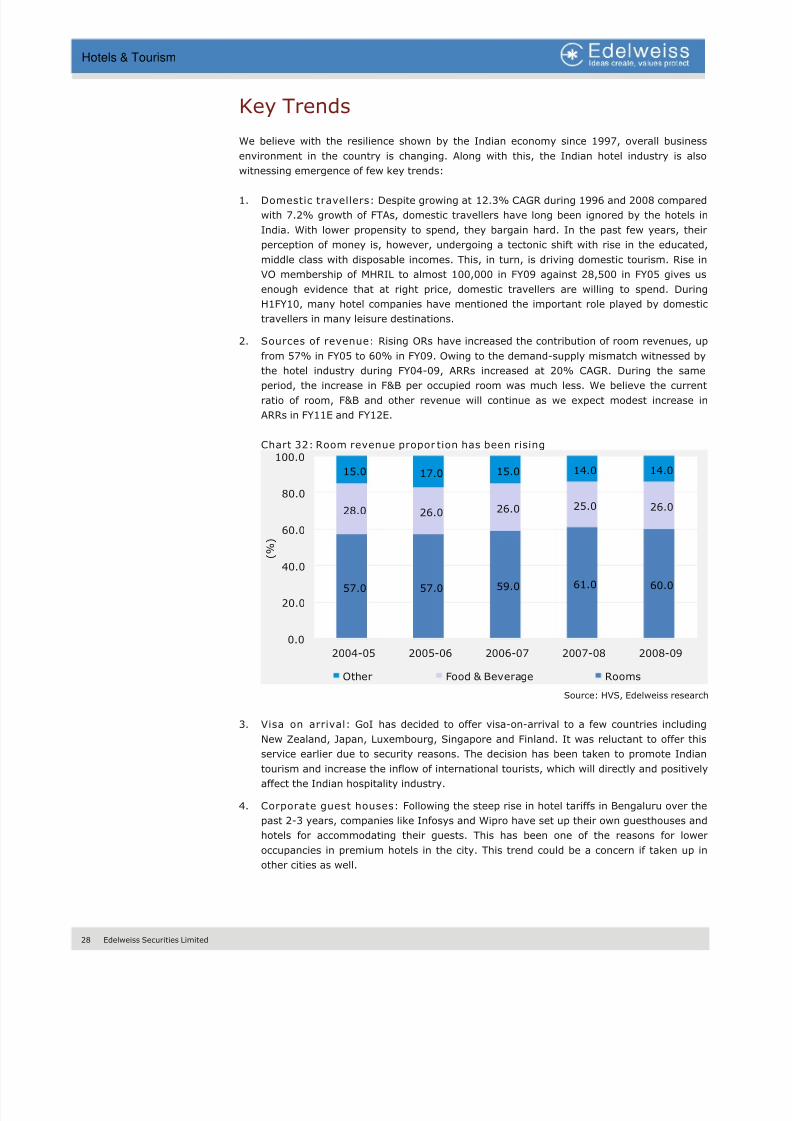
Edelweiss Securities Limited 29
Hotels & Tourism
5. Hotel brand growth in India: With the emergence of India as one of the leading T&T
destinations worldwide, more than 25 leading international hotel names are lined up to
have a presence in one of the fastest growing economies. This is a far cry from 2000
when IHCL, EIH, ITC, and ITDC (government owned) used to dominate the hospitality
sector in India. Growth of Indian middle class offers a large consumer base for hotel
chains ranging from luxury to budget. With the lower end of the market still in the hands
of unorganized players, we expect huge scope for the organised sector.
6. Emerging MICE business opportunity: Convention or meetings tourism accounts for
over 20% of all international arrivals worldwide. The US and Europe dominate this space,
although several Asian countries have successfully captured a growing portion of MICE
business in recent years. The Hyderabad International Convention Centre (HICC) is
India's only branded (Novotel), large scale convention facility with a capacity of 5,000
which has been able to attract some business. IHCL is also planning to have a world-
class convention center in Mumbai. We believe with the growth of science and technology
related industries like biotechnology and pharmaceuticals (wherein companies host large
conferences), India needs to successfully replicate the model of HICC to tap the
emerging MICE business opportunity.
7. Food & beverage (F&B) concepts: With the emergence of standalone eating joints
selling their own USPs, five star hotels are expected to face a tough competition going
ahead. As diners are always ready to test different concepts with fine dining experience,
restaurants like Indigo, Tote, Olives, Tetsuma, Trishna, Zest and Smoke House Grill are
making marks in small pockets. We believe over a period of time, many more individual
restaurants with different concepts and superior interiors will come into India and expand
the market exponentially.
8/8/2019 Hotel and Tourism
http://slidepdf.com/reader/full/hotel-and-tourism 31/106
30 Edelweiss Securities Limited
Hotels & Tourism
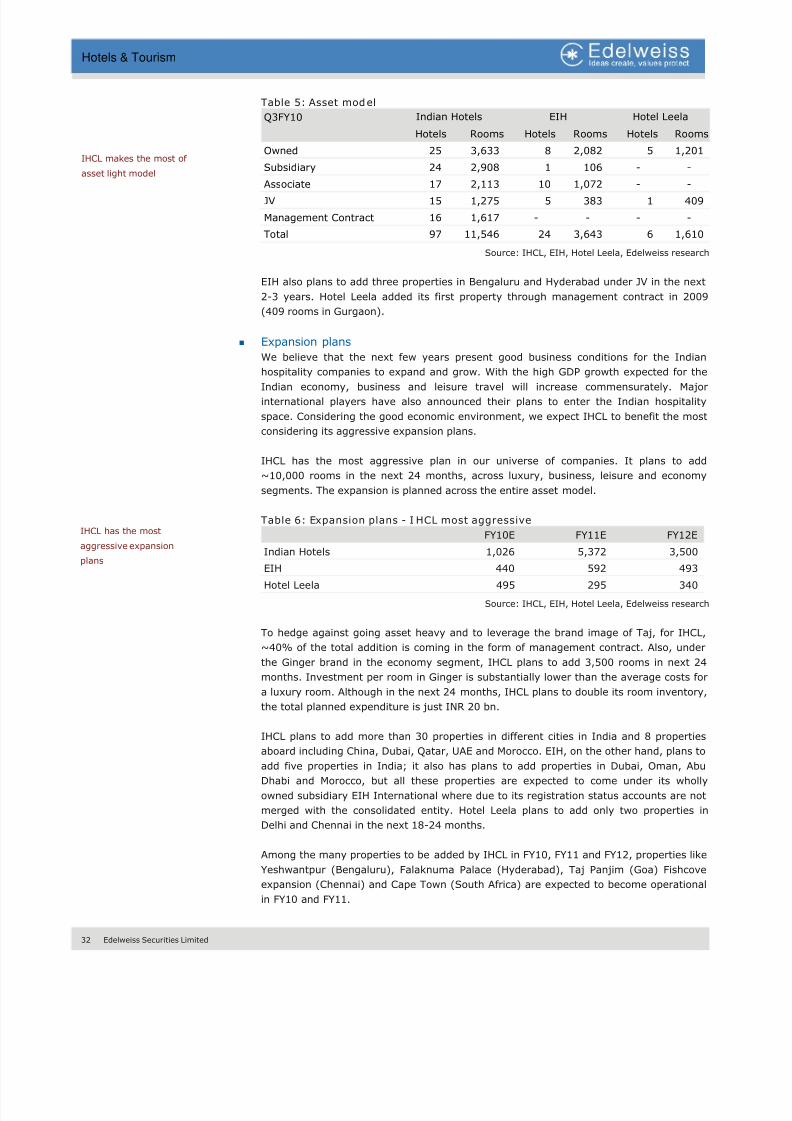
Business Analysis
We have evaluated companies under our coverage on two important parameters: (1)
geographical diversification and (2) asset model. For geographical diversification, IHCL, with
its presence in both India and abroad along with wide coverage of Indian cities is much better
placed in comparison to EIH and Hotel Leela. EIH and Hotel Leela are dependent on theperformance of couple of cities which form majority of their rooms and revenues. On the
asset model as well, IHCL seems to be better placed as 48 out of its 97 properties are with
associates/JV/Management contract. EIH and Hotel Leela perform poorly on this aspect as
well. Going forward, IHCL plans to follow the asset-light model aggressively and intends to
add 4,200 rooms under management contract in FY11E and FY12E.
Following is a comparative snapshot of the companies under our coverage:
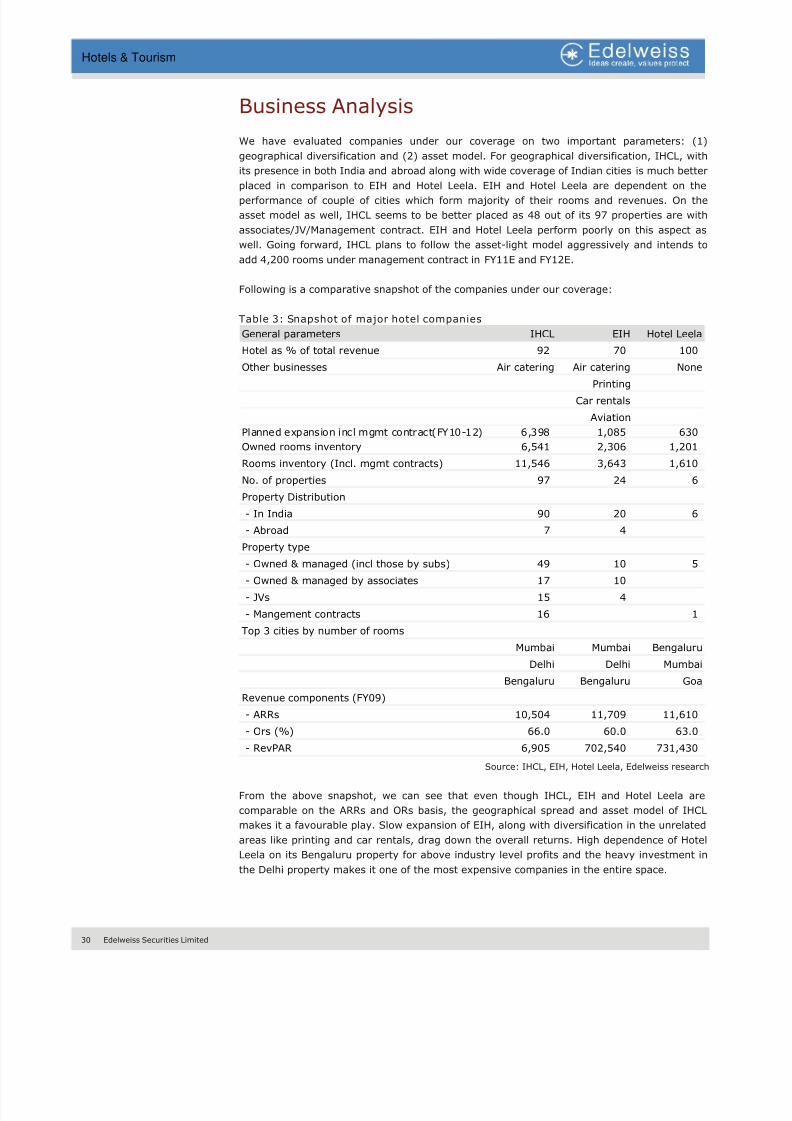
Table 3: Snapshot of major hotel companies
General parameters IHCL EIH Hotel Leela
Hotel as % of total revenue 92 70 100
Other businesses Air catering Air catering None
Printing
Car rentals
Aviation
Planned expansion incl mgmt contract(FY10-12) 6,398 1,085 630
Owned rooms inventory 6,541 2,306 1,201
Rooms inventory (Incl. mgmt contracts) 11,546 3,643 1,610
No. of properties 97 24 6
Property Distribution
- In India 90 20 6
- Abroad 7 4
Property type
- Owned & managed (incl those by subs) 49 10 5 - Owned & managed by associates 17 10
- JVs 15 4
- Mangement contracts 16 1
Top 3 cities by number of rooms
Mumbai Mumbai Bengaluru
Delhi Delhi Mumbai
Bengaluru Bengaluru Goa
Revenue components (FY09)
- ARRs 10,504 11,709 11,610
- Ors (%) 66.0 60.0 63.0
- RevPAR 6,905 702,540 731,430
Source: IHCL, EIH, Hotel Leela, Edelweiss research
From the above snapshot, we can see that even though IHCL, EIH and Hotel Leela are
comparable on the ARRs and ORs basis, the geographical spread and asset model of IHCL
makes it a favourable play. Slow expansion of EIH, along with diversification in the unrelated
areas like printing and car rentals, drag down the overall returns. High dependence of Hotel
Leela on its Bengaluru property for above industry level profits and the heavy investment in
the Delhi property makes it one of the most expensive companies in the entire space.
8/8/2019 Hotel and Tourism
http://slidepdf.com/reader/full/hotel-and-tourism 32/106
8/8/2019 Hotel and Tourism
http://slidepdf.com/reader/full/hotel-and-tourism 33/106
8/8/2019 Hotel and Tourism
http://slidepdf.com/reader/full/hotel-and-tourism 34/106
Edelweiss Securities Limited 33
Hotels & Tourism
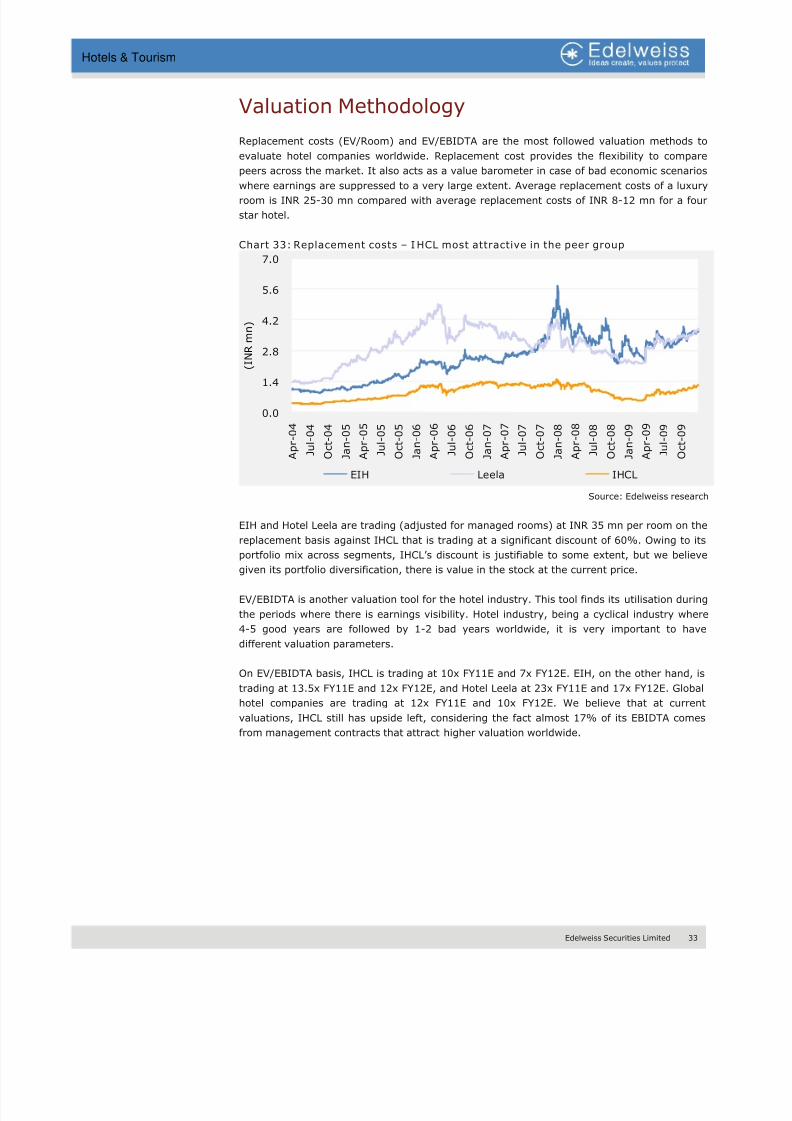
Valuation Methodology
Replacement costs (EV/Room) and EV/EBIDTA are the most followed valuation methods to
evaluate hotel companies worldwide. Replacement cost provides the flexibility to compare
peers across the market. It also acts as a value barometer in case of bad economic scenarios
where earnings are suppressed to a very large extent. Average replacement costs of a luxuryroom is INR 25-30 mn compared with average replacement costs of INR 8-12 mn for a four
star hotel.
Chart 33: Replacement costs – IHCL most attractive in the peer group
0.0
1.4
2.8
4.2
5.6
7.0
A p r - 0 4
J u l - 0 4
O c t - 0 4
J a n - 0 5
A p r - 0 5
J u l - 0 5
O c t - 0 5
J a n - 0 6
A p r - 0 6
J u l - 0 6
O c t - 0 6
J a n - 0 7
A p r - 0 7
J u l - 0 7
O c t - 0 7
J a n - 0 8
A p r - 0 8
J u l - 0 8
O c t - 0 8
J a n - 0 9
A p r - 0 9
J u l - 0 9
O c t - 0 9
( I N R m n )
EIH Leela IHCL
Source: Edelweiss research
EIH and Hotel Leela are trading (adjusted for managed rooms) at INR 35 mn per room on the
replacement basis against IHCL that is trading at a significant discount of 60%. Owing to its
portfolio mix across segments, IHCL’s discount is justifiable to some extent, but we believe
given its portfolio diversification, there is value in the stock at the current price.
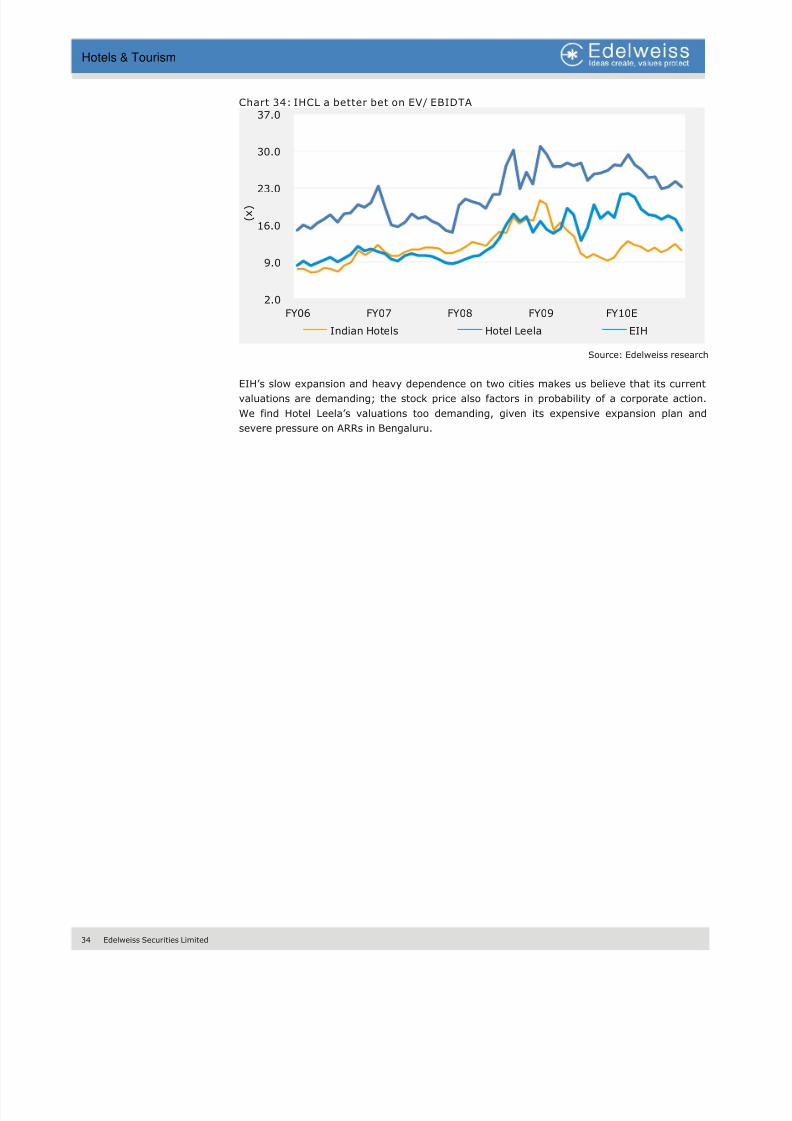
EV/EBIDTA is another valuation tool for the hotel industry. This tool finds its utilisation during
the periods where there is earnings visibility. Hotel industry, being a cyclical industry where
4-5 good years are followed by 1-2 bad years worldwide, it is very important to have
different valuation parameters.
On EV/EBIDTA basis, IHCL is trading at 10x FY11E and 7x FY12E. EIH, on the other hand, is
trading at 13.5x FY11E and 12x FY12E, and Hotel Leela at 23x FY11E and 17x FY12E. Global
hotel companies are trading at 12x FY11E and 10x FY12E. We believe that at current
valuations, IHCL still has upside left, considering the fact almost 17% of its EBIDTA comes
from management contracts that attract higher valuation worldwide.
8/8/2019 Hotel and Tourism
http://slidepdf.com/reader/full/hotel-and-tourism 35/106
34 Edelweiss Securities Limited
Hotels & Tourism
Chart 34: IHCL a better bet on EV/ EBIDTA
2.0
9.0
16.0
23.0
30.0
37.0
FY06 FY07 FY08 FY09 FY10E
( x )
Indian Hotels Hotel Leela EIH
Source: Edelweiss research
EIH’s slow expansion and heavy dependence on two cities makes us believe that its current
valuations are demanding; the stock price also factors in probability of a corporate action.
We find Hotel Leela’s valuations too demanding, given its expensive expansion plan and
severe pressure on ARRs in Bengaluru.
8/8/2019 Hotel and Tourism
http://slidepdf.com/reader/full/hotel-and-tourism 36/106
8/8/2019 Hotel and Tourism
http://slidepdf.com/reader/full/hotel-and-tourism 37/106
36 Edelweiss Securities Limited
Hotels & Tourism
Challenges
Scores of agencies and licenses major hurdle
As per ICRA, to start a new hotel in India, clearances from roughly 40 agencies and 110
licenses are required. Considering the state of bureaucracy in India, the time and costs
involved in getting the required approvals is quite high. We believe that the country
needs a single window clearance system, so that the industry can focus on getting the
operational issues right, then doing the paperwork.
Low FSI + high land costs: A dangerous combination
Considering the high costs of prime land in India, the current permissible FSI for hotels is
woefully inadequate. Manhattan allows FSI of 15 for hotels; whereas, in Mumbai it is
3.45 at Nariman Point, 2.66 in the city and 1 in suburbs. Higher FSI will allow hotels to
construct higher number of rooms, in turn, increasing the profitability of the property.
We realise that higher FSI will increase the already heavy pressure on the existing
inadequate infrastructure facilities. However, considering the importance of hotel
industry to the overall economy and the fact that it doesn’t receive any kind of benefit
from the government, we believe higher FSI is very much needed in India. In one of therecent development, Mumbai Metropolitan Region Development Authority (MMRDA)
recently sanctioned an FSI of 9.34 in G block of BKC, Mumbai. The higher FSI was
redistributed by MMRDA as the FSI in the area was underutilized.
Taxes: A complex issue
1. Section 80 I A (infrastructure status for the hotel industry): The Indian hotel
industry was asking for the infrastructure status under Section 80 IA of the IT Act.
In 2010 budget, the government has included hotels under section 35 AD where any
capex (excl. land, goodwill and financial instruments) incurred post 1.4.2010 is
eligible for 100% deduction as investment linked tax incentive in the year of
expenditure. We believe the benefit to help the industry in the long-term, even
though the land costs forms a major part of total capex.
In fact, under Section 10 (23) g of the IT Act, hotels were added to the
infrastructure list so that the interest received by financial institutions and banks for
loans extended to hotels were tax exempted. However, the section itself was
discontinued from April 1, 2007.
2. Luxury tax: Luxury tax, which is a state level tax, is levied on the published rates
without taking into consideration the discount given on the rack rates and
commission paid to agents. Luxury tax in India varies from 5% to 15%. The industry
has been asking for the tax to be reduced to a maximum of 5%.
3. VAT, sales tax, excise duty, custom duty and service taxes are some of the other
issues which the industry has been grappling with.
Infrastructure bottlenecks
Woefully inadequate infrastructure has been one of the biggest problems for India to
emerge as the topmost travel and tourism destination. In comparison to some of the
leading tourist destinations of South East Asia, the infrastructure in India scores poorly.
Inadequate infrastructure is one of the main reasons why many Indian cities with great
potential remain untapped on the world tourism map.
8/8/2019 Hotel and Tourism
http://slidepdf.com/reader/full/hotel-and-tourism 38/106
Edelweiss Securities Limited 37
Hotels & Tourism
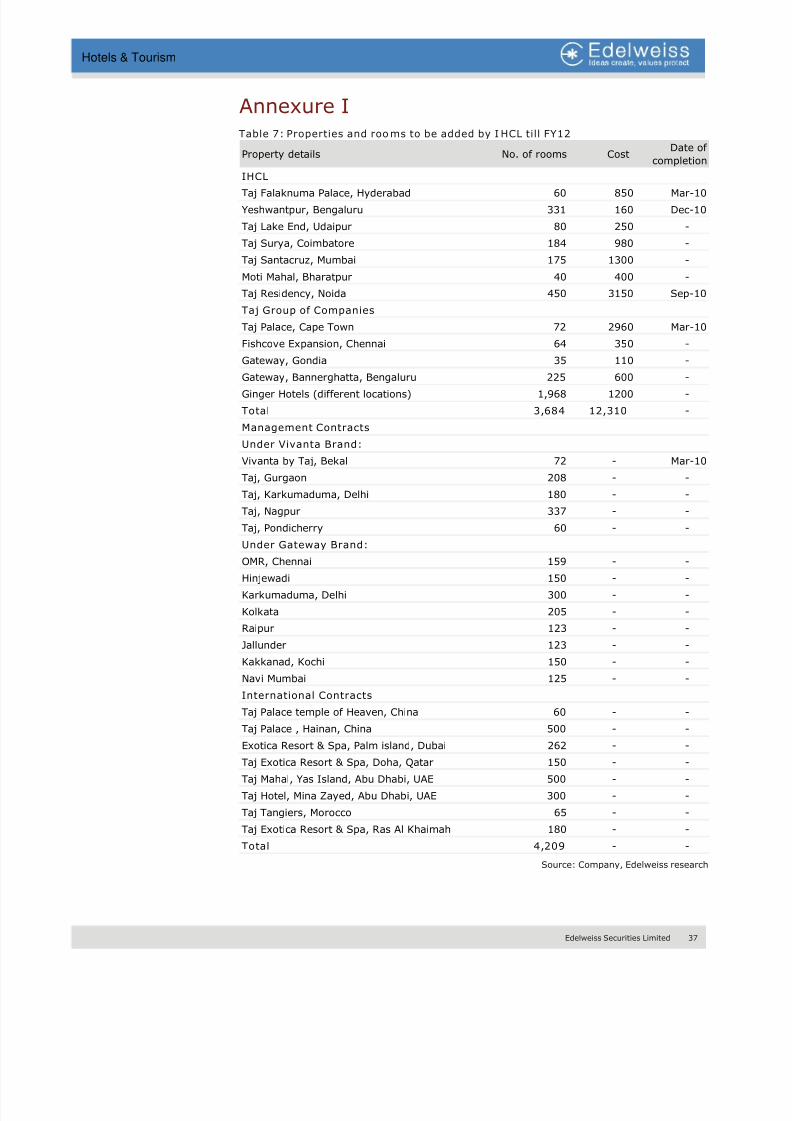
Annexure ITable 7: Properties and rooms to be added by I HCL till FY12
Property details No. of rooms CostDate of
completion
IHCL
Taj Falaknuma Palace, Hyderabad 60 850 Mar-10
Yeshwantpur, Bengaluru 331 160 Dec-10
Taj Lake End, Udaipur 80 250 -
Taj Surya, Coimbatore 184 980 -
Taj Santacruz, Mumbai 175 1300 -
Moti Mahal, Bharatpur 40 400 -
Taj Residency, Noida 450 3150 Sep-10
Taj Group of Companies
Taj Palace, Cape Town 72 2960 Mar-10
Fishcove Expansion, Chennai 64 350 -
Gateway, Gondia 35 110 -
Gateway, Bannerghatta, Bengaluru 225 600 -
Ginger Hotels (different locations) 1,968 1200 -
Total 3,684 12,310 -
Management Contracts
Under Vivanta Brand:
Vivanta by Taj, Bekal 72 - Mar-10
Taj, Gurgaon 208 - -
Taj, Karkumaduma, Delhi 180 - -
Taj, Nagpur 337 - -
Taj, Pondicherry 60 - -
Under Gateway Brand:
OMR, Chennai 159 - - Hinjewadi 150 - -
Karkumaduma, Delhi 300 - -
Kolkata 205 - -
Raipur 123 - -
Jallunder 123 - -
Kakkanad, Kochi 150 - -
Navi Mumbai 125 - -
International Contracts
Taj Palace temple of Heaven, China 60 - -
Taj Palace , Hainan, China 500 - -
Exotica Resort & Spa, Palm island, Dubai 262 - -
Taj Exotica Resort & Spa, Doha, Qatar 150 - -
Taj Mahal, Yas Island, Abu Dhabi, UAE 500 - -
Taj Hotel, Mina Zayed, Abu Dhabi, UAE 300 - -
Taj Tangiers, Morocco 65 - -
Taj Exotica Resort & Spa, Ras Al Khaimah 180 - -
Total 4,209 - -
Source: Company, Edelweiss research
8/8/2019 Hotel and Tourism
http://slidepdf.com/reader/full/hotel-and-tourism 39/106
38 Edelweiss Securities Limited
Hotels & Tourism
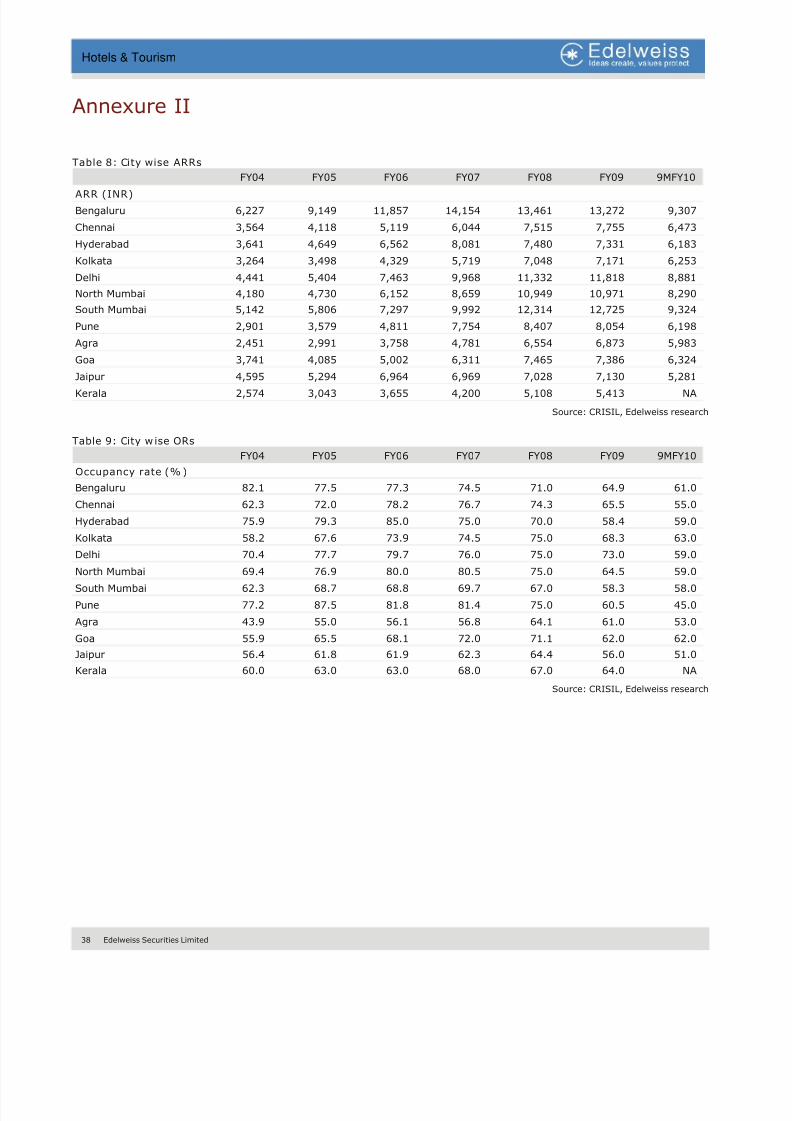
Annexure II
Table 8: City wise ARRs
FY04 FY05 FY06 FY07 FY08 FY09 9MFY10
ARR (INR)
Bengaluru 6,227 9,149 11,857 14,154 13,461 13,272 9,307
Chennai 3,564 4,118 5,119 6,044 7,515 7,755 6,473
Hyderabad 3,641 4,649 6,562 8,081 7,480 7,331 6,183
Kolkata 3,264 3,498 4,329 5,719 7,048 7,171 6,253
Delhi 4,441 5,404 7,463 9,968 11,332 11,818 8,881
North Mumbai 4,180 4,730 6,152 8,659 10,949 10,971 8,290
South Mumbai 5,142 5,806 7,297 9,992 12,314 12,725 9,324
Pune 2,901 3,579 4,811 7,754 8,407 8,054 6,198
Agra 2,451 2,991 3,758 4,781 6,554 6,873 5,983
Goa 3,741 4,085 5,002 6,311 7,465 7,386 6,324
Jaipur 4,595 5,294 6,964 6,969 7,028 7,130 5,281
Kerala 2,574 3,043 3,655 4,200 5,108 5,413 NA
Source: CRISIL, Edelweiss research
Table 9: City w ise ORs
FY04 FY05 FY06 FY07 FY08 FY09 9MFY10
Occupancy rate (% )
Bengaluru 82.1 77.5 77.3 74.5 71.0 64.9 61.0
Chennai 62.3 72.0 78.2 76.7 74.3 65.5 55.0
Hyderabad 75.9 79.3 85.0 75.0 70.0 58.4 59.0
Kolkata 58.2 67.6 73.9 74.5 75.0 68.3 63.0
Delhi 70.4 77.7 79.7 76.0 75.0 73.0 59.0
North Mumbai 69.4 76.9 80.0 80.5 75.0 64.5 59.0
South Mumbai 62.3 68.7 68.8 69.7 67.0 58.3 58.0
Pune 77.2 87.5 81.8 81.4 75.0 60.5 45.0
Agra 43.9 55.0 56.1 56.8 64.1 61.0 53.0
Goa 55.9 65.5 68.1 72.0 71.1 62.0 62.0
Jaipur 56.4 61.8 61.9 62.3 64.4 56.0 51.0
Kerala 60.0 63.0 63.0 68.0 67.0 64.0 NA
Source: CRISIL, Edelweiss research
8/8/2019 Hotel and Tourism
http://slidepdf.com/reader/full/hotel-and-tourism 40/106
Edelweiss Securities Limited 39
Hotels & Tourism
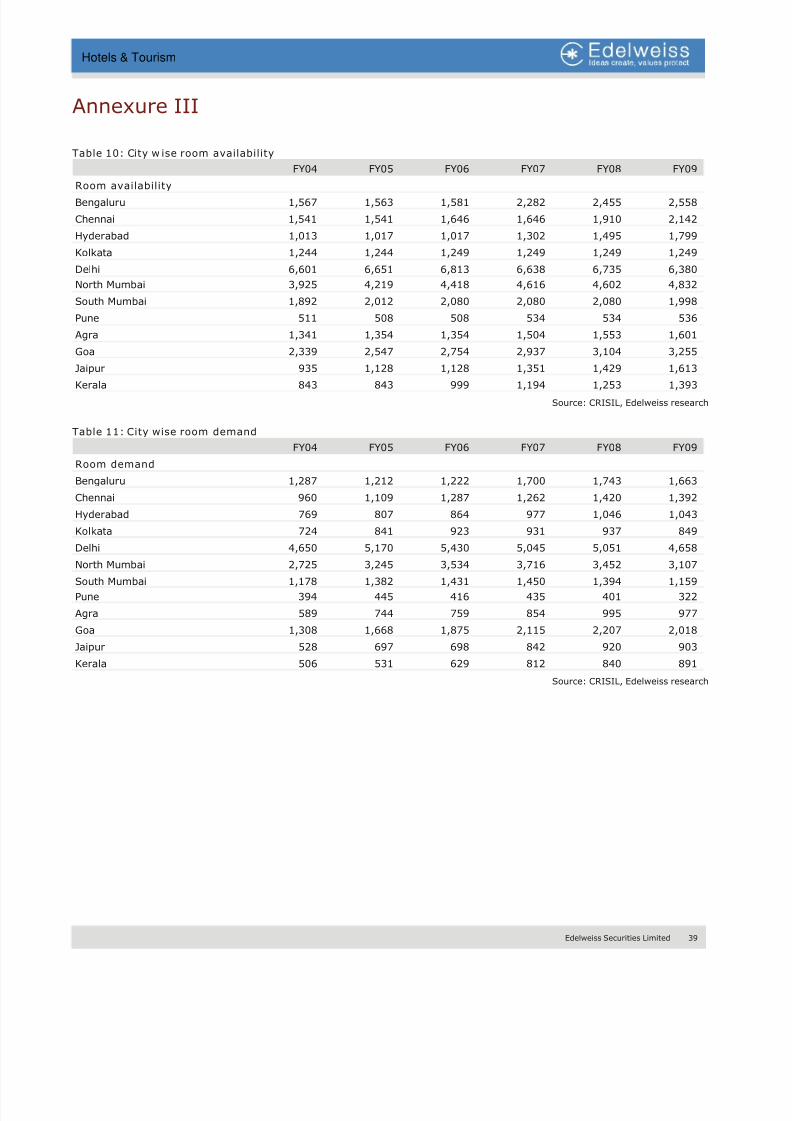
Annexure III
Table 10: City w ise room availability
FY04 FY05 FY06 FY07 FY08 FY09
Room availabilityBengaluru 1,567 1,563 1,581 2,282 2,455 2,558
Chennai 1,541 1,541 1,646 1,646 1,910 2,142
Hyderabad 1,013 1,017 1,017 1,302 1,495 1,799
Kolkata 1,244 1,244 1,249 1,249 1,249 1,249
Delhi 6,601 6,651 6,813 6,638 6,735 6,380
North Mumbai 3,925 4,219 4,418 4,616 4,602 4,832
South Mumbai 1,892 2,012 2,080 2,080 2,080 1,998
Pune 511 508 508 534 534 536
Agra 1,341 1,354 1,354 1,504 1,553 1,601
Goa 2,339 2,547 2,754 2,937 3,104 3,255
Jaipur 935 1,128 1,128 1,351 1,429 1,613
Kerala 843 843 999 1,194 1,253 1,393
Source: CRISIL, Edelweiss research
Table 11: City wise room demand
FY04 FY05 FY06 FY07 FY08 FY09
Room demand
Bengaluru 1,287 1,212 1,222 1,700 1,743 1,663
Chennai 960 1,109 1,287 1,262 1,420 1,392
Hyderabad 769 807 864 977 1,046 1,043
Kolkata 724 841 923 931 937 849
Delhi 4,650 5,170 5,430 5,045 5,051 4,658
North Mumbai 2,725 3,245 3,534 3,716 3,452 3,107 South Mumbai 1,178 1,382 1,431 1,450 1,394 1,159
Pune 394 445 416 435 401 322
Agra 589 744 759 854 995 977
Goa 1,308 1,668 1,875 2,115 2,207 2,018
Jaipur 528 697 698 842 920 903
Kerala 506 531 629 812 840 891
Source: CRISIL, Edelweiss research

8/8/2019 Hotel and Tourism
http://slidepdf.com/reader/full/hotel-and-tourism 41/106
40 Edelweiss Securities Limited
Hotels & Tourism
THIS PAGE IS INTENTIONALLY LEFT BLANK
8/8/2019 Hotel and Tourism
http://slidepdf.com/reader/full/hotel-and-tourism 42/106
Edelweiss Securities Limited 41
Hotels & Tourism
Geographical diversification minimises event risk
Cox & Kings (CNK), with operations in 19 countries, is geographically diversified
for an event risk. We expect India to account for just 50% of its FY11E revenues
and PAT. A combination of inbound, outbound, and domestic tourist growth is
expected to drive the company’s Indian operations. Entry into new segments like
rail tourism and visa processing is expected to further enhance revenue diversity.
We expect UK, Japan, Australia, Dubai, and US to account for almost 75-80% of
subsidiaries revenue.
Consistent innovation and acquisitions driving revenues
Innovative product offerings like Duniya Dekho, Bharat Dekho, and FlexiHol are
some of CNK’s most popular schemes. To capture the high end tourist outside
India, the company has made sizable acquisitions in the UK, Australia, and US. To
drive growth further, it has launched a pan-India luxury train in JV with IRCTC
along with an ambitious visa processing project. We expect the luxury train and
visa processing initiative to contribute 7% to FY11E revenues.
Increasing leisure travel to reduce working capital requirement
We expect the additional working capital deployment to dip going forward as the
share of leisure travel increases in the overall portfolio. CNK is likely to generate
approximately INR 3.8 bn of positive operating cash flow in FY11E and FY12E.
With its strong brand equity, the company can negotiate better terms with
corporates and in turn reduce working capital deployed.
Outlook and valuations: Positive; initiating coverage with ‘HOLD’
CNK, due to its strong brand equity and vast knowledge of various geographies,
has created a niche for itself in the T&T space. Although it is poised to exploit the
high growth expected in the worldwide T&T space, we believe, a lot of these
expectations are already factored in the share price at current levels. We expect
the stock to trade at 25.0x FY11E and 20.0x FY12E P/E. At CMP of INR 488, CNK
is trading at 23.4x and 18.6x consolidated P/E of FY11E and FY12E, respectively.
Using the target P/E, we arrive at a target price of INR 520, and initiate coverage
on the stock with a ‘HOLD’ recommendation.
Edelweiss Research is also available on www.edelresearch.com, Bloomberg EDEL <GO>, Thomson First Call, Reuters and Factset. Edelweiss Securities Limited
India Midcap Research Initiating Coverage
COX AND KINGS
Making holidays more organised April 1, 2010
Reuters : COKI.BO Bloomberg : COXK IN
Absolute Rating HOLD
MARKET DATA CMP : INR 488
52-week range (INR) : 505 / 304
Share in issue (mn) : 62.9
M cap (INR bn/USD mn) : 30.6 / 683.6
Avg. Daily Vol. BSE/NSE (‘000) : 1,734.2
SHARE HOLDING PATTERN (%)
Promoters* : 63.6
MFs, FIs & Banks : 8.5
FIIs : 18.7
Others : 9.0
* Promoters pledged shares : Nil
(% of share in issue)
RELATIVE PERFORMANCE (%)
Sensex Stock Stock over
Sensex
1 month 5.5 10.8 5.3
3 months 0.8 8.7 7.9
Manoj Bahety, CFA
+91-22- 6623 3362
Manav Vijay
+91-22- 4063 5413
EDELWEISS RATING
FinancialsYear to March FY09 FY10E FY11E FY12E
Revenues (INR mn) 2,869 3,684 4,708 5,605
Growth (%) 57.5 28.4 27.8 19.1
EBIDTA (INR mn) 1,214 1,545 1,995 2,381
Net profit (INR mn) 634 845 1,297 1,611
Share outstanding (mn) 28 63 63 63
EPS (INR) 10.0 13.3 20.6 25.6
EPS growth (%) 47.4 33.0 55.3 24.2
Diluted P/E (x) 48.9 36.8 23.7 19.1
ROAE (%) 32.7 16.5 15.1 16.3
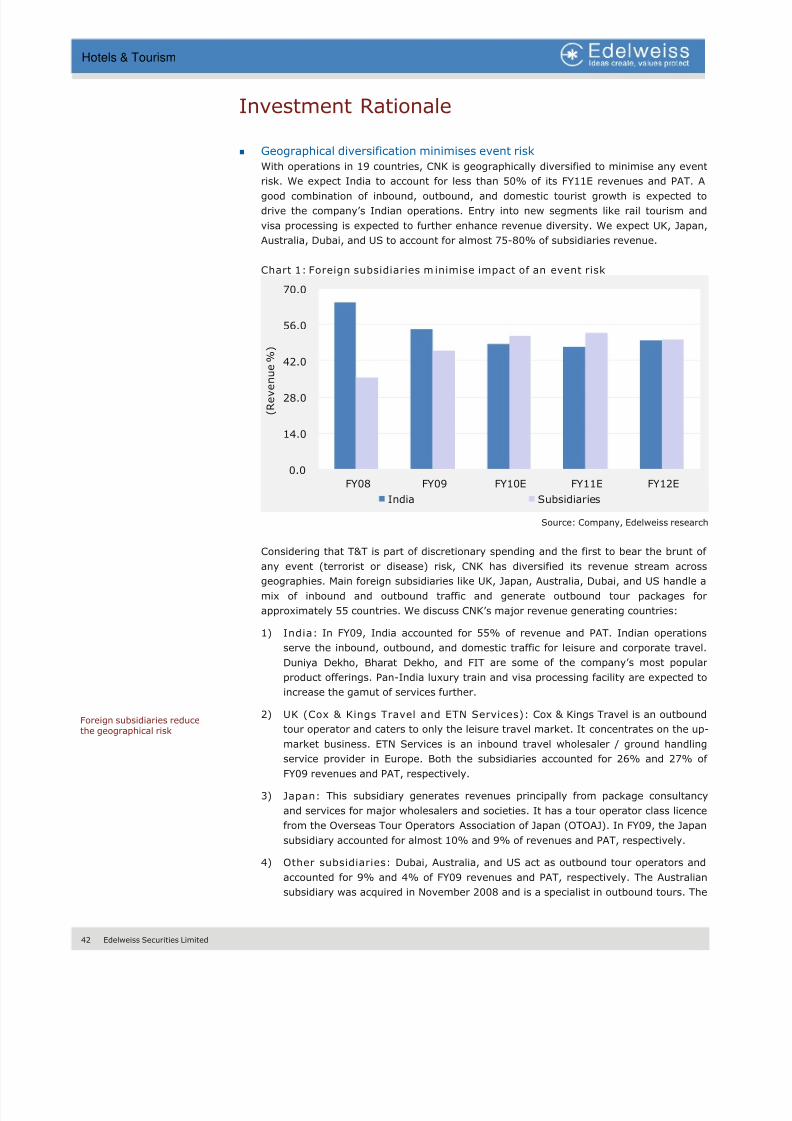
8/8/2019 Hotel and Tourism
http://slidepdf.com/reader/full/hotel-and-tourism 43/106
42 Edelweiss Securities Limited
Hotels & Tourism
Investment Rationale
Geographical diversification minimises event risk
With operations in 19 countries, CNK is geographically diversified to minimise any event
risk. We expect India to account for less than 50% of its FY11E revenues and PAT. A
good combination of inbound, outbound, and domestic tourist growth is expected to
drive the company’s Indian operations. Entry into new segments like rail tourism and
visa processing is expected to further enhance revenue diversity. We expect UK, Japan,
Australia, Dubai, and US to account for almost 75-80% of subsidiaries revenue.
Chart 1: Foreign subsidiaries m inimise impact of an event risk
0.0
14.0
28.0
42.0
56.0
70.0
FY08 FY09 FY10E FY11E FY12E
( R e v e n u
e % )
India Subsidiaries
Source: Company, Edelweiss research
Considering that T&T is part of discretionary spending and the first to bear the brunt of
any event (terrorist or disease) risk, CNK has diversified its revenue stream acrossgeographies. Main foreign subsidiaries like UK, Japan, Australia, Dubai, and US handle a
mix of inbound and outbound traffic and generate outbound tour packages for
approximately 55 countries. We discuss CNK’s major revenue generating countries:
1) India: In FY09, India accounted for 55% of revenue and PAT. Indian operations
serve the inbound, outbound, and domestic traffic for leisure and corporate travel.
Duniya Dekho, Bharat Dekho, and FIT are some of the company’s most popular
product offerings. Pan-India luxury train and visa processing facility are expected to
increase the gamut of services further.
2) UK (Cox & Kings Travel and ETN Services): Cox & Kings Travel is an outbound
tour operator and caters to only the leisure travel market. It concentrates on the up-
market business. ETN Services is an inbound travel wholesaler / ground handling
service provider in Europe. Both the subsidiaries accounted for 26% and 27% of
FY09 revenues and PAT, respectively.
3) Japan: This subsidiary generates revenues principally from package consultancy
and services for major wholesalers and societies. It has a tour operator class licence
from the Overseas Tour Operators Association of Japan (OTOAJ). In FY09, the Japan
subsidiary accounted for almost 10% and 9% of revenues and PAT, respectively.
4) Other subsidiaries: Dubai, Australia, and US act as outbound tour operators and
accounted for 9% and 4% of FY09 revenues and PAT, respectively. The Australian
subsidiary was acquired in November 2008 and is a specialist in outbound tours. The
Foreign subsidiaries reducethe geographical risk
8/8/2019 Hotel and Tourism
http://slidepdf.com/reader/full/hotel-and-tourism 44/106
Edelweiss Securities Limited 43
Hotels & Tourism
US subsidiary was acquired in April 2009 and is a boutique travel company offering
private travel and group travel to high net worth clients.
Consistent innovation and acquisitions driving revenues
Product offerings like Duniya Dekho for outbound travel, Bharat Dekho for domestic
travel, and FlexiHol for flexible individual travelers are some of CNK’s most popular
schemes. To capture the high end tourist outside India, the company has made sizableacquisitions in the UK, Australia, and US. In FY07, India accounted for 92% and 100% of
revenues and PAT, respectively. Strategic acquisitions in UK (2007), Australia (2008),
and the US (2009) along with new companies started in Dubai and Singapore accounted
for almost 50% of FY09 revenue. We consider the acquisitions and new starts as
innovative steps by the management.
Table 1: Acquired companies are complementary to existing services
Year Company acquired Added services
2006 Clearmine (along with subsidiary ETN
Services)
Destination management services for tours to Europe and
inbound tours in Europe for other tour operators
2007 Cox & Kings.,UK (along with its subsidiary
Cox & Kings Travel)
Outbound specialist tour operator that caters to leisure travel
market of Europe
2007 Cox & Kings (Japan) Dedictated wholesaler of products and services to other tour
operators and offer ground handling capabilities in select
geographies
2008 Quoprro Global Services Visa processing [appovals from Singapore, Athens (Greece)
and Hong Kong] for outsourcing their visa processing
activities to C&K
2008 Tempo Holidays Pty., Australia (along with
its sub Tempo Holidays NZ in NZ)
Significant part of its business is in European countries
2009 East India Travel Company Selling upmarket tours and travel packages in the US
Source: Company, Edelweiss research
To drive growth, the company has launched a pan-India luxury train in JV with IRCTC.
The train will run from September to April and carry 84 passengers per journey for 7-8
nights with fares starting at USD 800 per night and make 16 journeys every year. The
service is aimed at the very high end tourist. We expect the initiative to contribute
approximately 5% to FY11E revenue. The visa processing initiative is another ambitious
project to drive growth. We expect the luxury train and visa processing initiative to
contribute 7% to FY11E revenues.
Increasing leisure travel to reduce working capital requirement
We expect the additional working capital deployment to dip going forward as the share of
leisure travel in the overall portfolio increases. The company is likely to generate
approximately INR 3.9 bn of positive operating cash flow in FY11 and FY12. With its
strong brand equity, CNK can negotiate better terms with corporates and in turn reduce
the working capital deployed.
Meetings, incentives, conferences, and exhibitions (MICE); corporate travel; and forex
are the business segments where the company needs to provide credit period to
customers. CNK has become selective in taking on the corporate travel business and is
ready to forego potential business if the same is coming at an incremental working
capital deployment.
Acquisitions and innovationsdrive revenue growth
Reduced working capitalgoing forward
8/8/2019 Hotel and Tourism
http://slidepdf.com/reader/full/hotel-and-tourism 45/106
44 Edelweiss Securities Limited
Hotels & Tourism
Table 2: MICE and corporate business travel requires w orking capital
Business % of total
revenue
Average credit
days
India - Leisure (Inbound, outbound, domestic) 36.1 Zero
India - Leisure (MICE) 13.5 10 days
India - Corporate / business travel 2.7 20 - 25 daysIndia - Forex 2.7 7 -8 days
Foreign - Leisure 45 Zero
Source: Company, Edelweiss research
CNK has also loans and advances and debtors worth INR 2.5 bn that have been extended
to various subsidiaries, associates, and group companies. We believe as the subsidiaries
attain reasonable size, future fund deployment will be limited in comparison to the past.
Management is confident of turning around the working capital cycle and aims to report
a positive working capital going forward. One of the stated purposes of IPO proceedings
was to invest INR 625 mn into subsidiaries. We believe future deployment of funds post
this round of investment will be minimal.
Bulk buying advantage
Due to its strong brand image and geographical reach, CNK gets bulk buying discounts
for air travel, hotel accommodations, car rentals, and ground handling. This enables the
company to offer competitive packages to clients and customers. This bulk buying
happens without any capital commitment on the part of CNK. Constant innovation of new
schemes helps the company fulfill commitments to hotels, airlines, and other partners
involved. In the earlier years, small travel operators earned nearly 80-90% of total
revenues from airline ticket bookings where margins were as high as 10%. However,
with the emergence of online booking portals like yatra, ezeego, and makemytrip and to
some extent with the weak financial condition of airlines, the mom and pop shops are
under severe threat. CNK is also active in this space with its associate company Ezeego
One Travel & Tours, where it holds 14.98%. Ezeego is a neutral market place which
showcases products of all companies including CNK and its competitors and offerscustomers the flexibility to choose what they deem fit.
Global reach and alliances
CNK has global presence with operations in 19 countries besides India through its
subsidiaries, branch and representative offices. In India, it has 255 points of presence
covering 164 locations through a mix of 14 branch sales offices, 75 franchised sales
shops, and a mix of 185 general sales agents (GSAs) and preferred sales agents (PSAs).
As a member of Radius, a global travel company, CNK is connected to a network of 90
Radius members from more than 80 prominent countries with over 3,600 locations and
service clients originating through them within India.
The company enhances its global presence through a network of GSAs and PSAs
covering other countries. Taking advantage of its global network, the company offers
outbound travel products to almost 150 countries.
Strong brand equity
CNK has evolved over 250 years and is one of the oldest and recognized holiday brands,
catering to the travel requirements of Indian and international travelers. The brand was
ranked No. 1 in India and 152 amongst top 1,000 brands in the Asia Pacific region in
2008 by Media Magazine & TNS.
Big discounts due to bulkbuying
Rooms and revenue lopsidedtowards Mumbai
8/8/2019 Hotel and Tourism
http://slidepdf.com/reader/full/hotel-and-tourism 46/106
8/8/2019 Hotel and Tourism
http://slidepdf.com/reader/full/hotel-and-tourism 47/106
46 Edelweiss Securities Limited
Hotels & Tourism
Key Risks
Bulk buying advantage could prove to be transient
CNKs ability to deliver volumes to its business partners is the prime reason behind it
earning good discounts from hotels, airlines, and car rental agencies. Also, as the
discount is without any kind of capital commitment from CNK, failure to drive volumes
could spell end of this advantage. To continue to enjoy the discounts and in turn offer
lower prices to customers, the company needs to consistently innovate schemes and
prices.
Deployment of further working capital
The company has an exposure of INR 2.5 bn in its subsidiaries and group companies as
investments, debtors, and loans and advances. As the subsidiaries are making efforts to
attain suitable size, the investment was necessary. But going forward also if CNK
continues to provide resources to these companies, then its working capital requirement
will grow manifold. Including the above, in another promoter owned company Ezeego
One Travel & Tours, CNK has advanced approximately INR 900 mn for the losses
incurred as Ezeego is writing off the goodwill for a swap of share equity to advertisementspace. Further assistance by CNK to this entity could add to the existing debt.
CNK has advanced approximately INR 350 mn to two of its loss making group companies
viz., Tulip Star Hotels and V Hotels, in the form of investments and advances. The
amount is part of the overall INR 2.5 bn exposure mentioned above.
Unforeseen events like war or disease
Outbreak of any disease like swine flu on a worldwide basis can affect business severely
even though CNK’s revenue stream is diversified in terms of geographies. As 90-95% of
revenue is from leisure travel, in case of any unforeseen event, leisure travel can face a
big decline.
Future acquisitions turning sourAlthough CNK has the history of integrating acquisitions quite well with existing
operations, in 2010 the company needs to get the US and Australian acquisitions correct.
Also, as the company has raised funds for more acquisitions, any uncertainty on this
front could prove to be a major dampener.
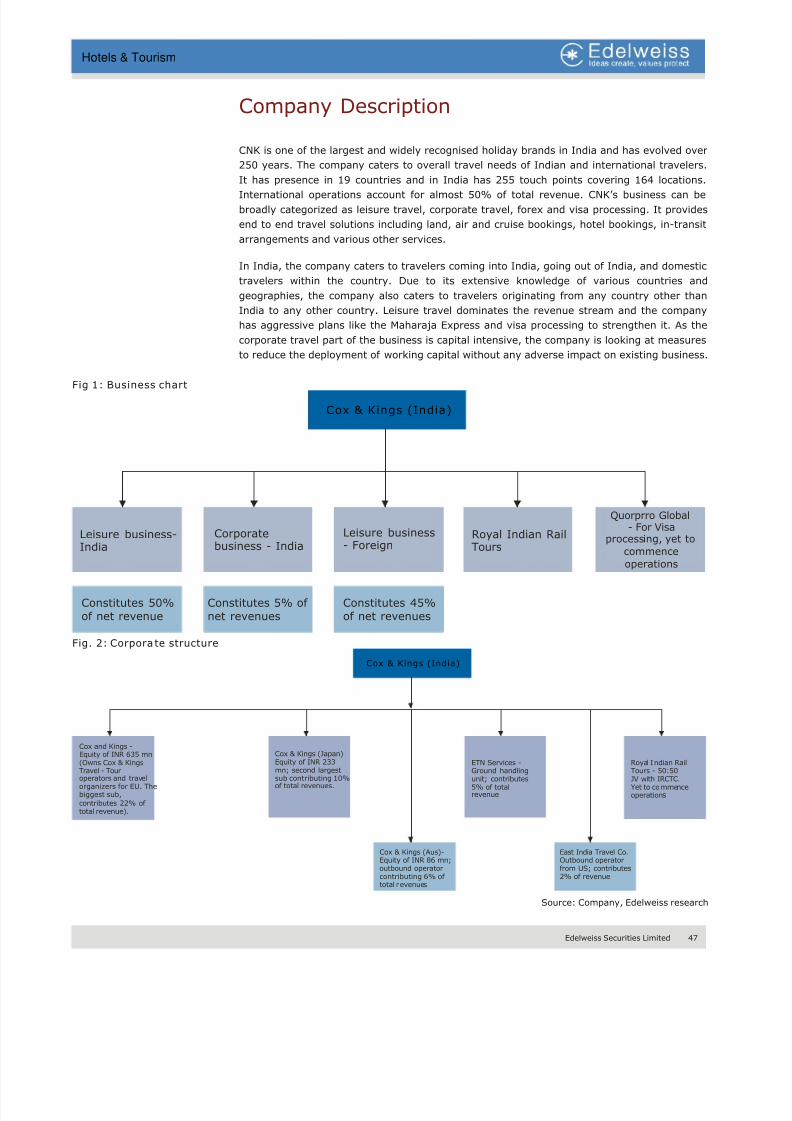
8/8/2019 Hotel and Tourism
http://slidepdf.com/reader/full/hotel-and-tourism 48/106
Edelweiss Securities Limited 47
Hotels & Tourism
Company Description
CNK is one of the largest and widely recognised holiday brands in India and has evolved over
250 years. The company caters to overall travel needs of Indian and international travelers.
It has presence in 19 countries and in India has 255 touch points covering 164 locations.
International operations account for almost 50% of total revenue. CNK’s business can be
broadly categorized as leisure travel, corporate travel, forex and visa processing. It provides
end to end travel solutions including land, air and cruise bookings, hotel bookings, in-transit
arrangements and various other services.
In India, the company caters to travelers coming into India, going out of India, and domestic
travelers within the country. Due to its extensive knowledge of various countries and
geographies, the company also caters to travelers originating from any country other than
India to any other country. Leisure travel dominates the revenue stream and the company
has aggressive plans like the Maharaja Express and visa processing to strengthen it. As the
corporate travel part of the business is capital intensive, the company is looking at measures
to reduce the deployment of working capital without any adverse impact on existing business.
Fig 1: Business chart
Corporatebusiness - India
Cox & Kings (India)
Leisure business-India
Leisure business- Foreign
Royal Indian RailTours
Quorprro Global- For Visa
processing, yet to
commence
operations
Constitutes 50%
of net revenue
Constitutes 5% of
net revenues
Constitutes 45%
of net revenues
Fig. 2: Corpora te structure
Cox & Kings (India)
Cox and Kings -
Equity of INR 635 mn(Owns Cox & KingsTravel - Touroperators and travelorganizers for EU. Thebiggest sub,
contributes 22% of total revenue).
Cox & Kings (Japan)Equity of INR 233mn; second largestsub contributing 10%of total revenues.
ETN Services -Ground handlingunit; contributes5% of totalrevenue
Cox & Kings (Aus)-Equity of INR 86 mn;outbound operatorcontributing 6% of total revenues
East India Travel Co.Outbound operatorfrom US; contributes2% of revenue
Royal Indian RailTours - 50:50JV with IRCTC.Yet to commenceoperations
Source: Company, Edelweiss research
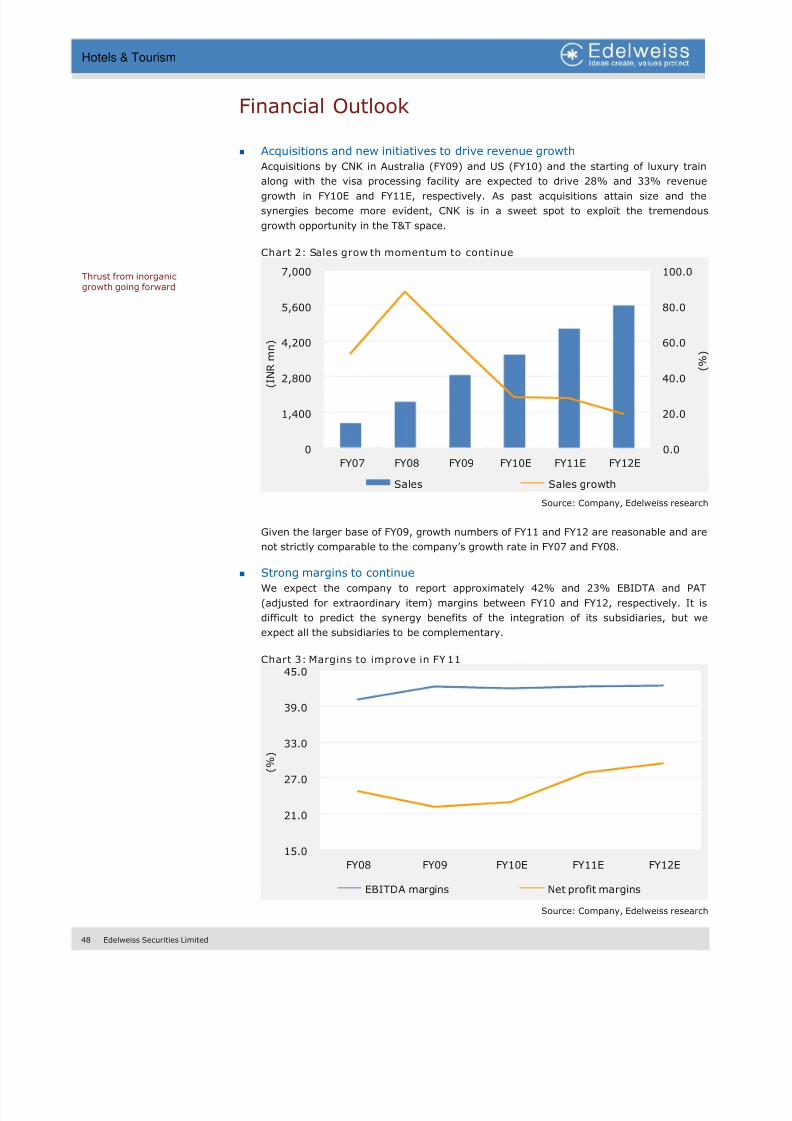
8/8/2019 Hotel and Tourism
http://slidepdf.com/reader/full/hotel-and-tourism 49/106
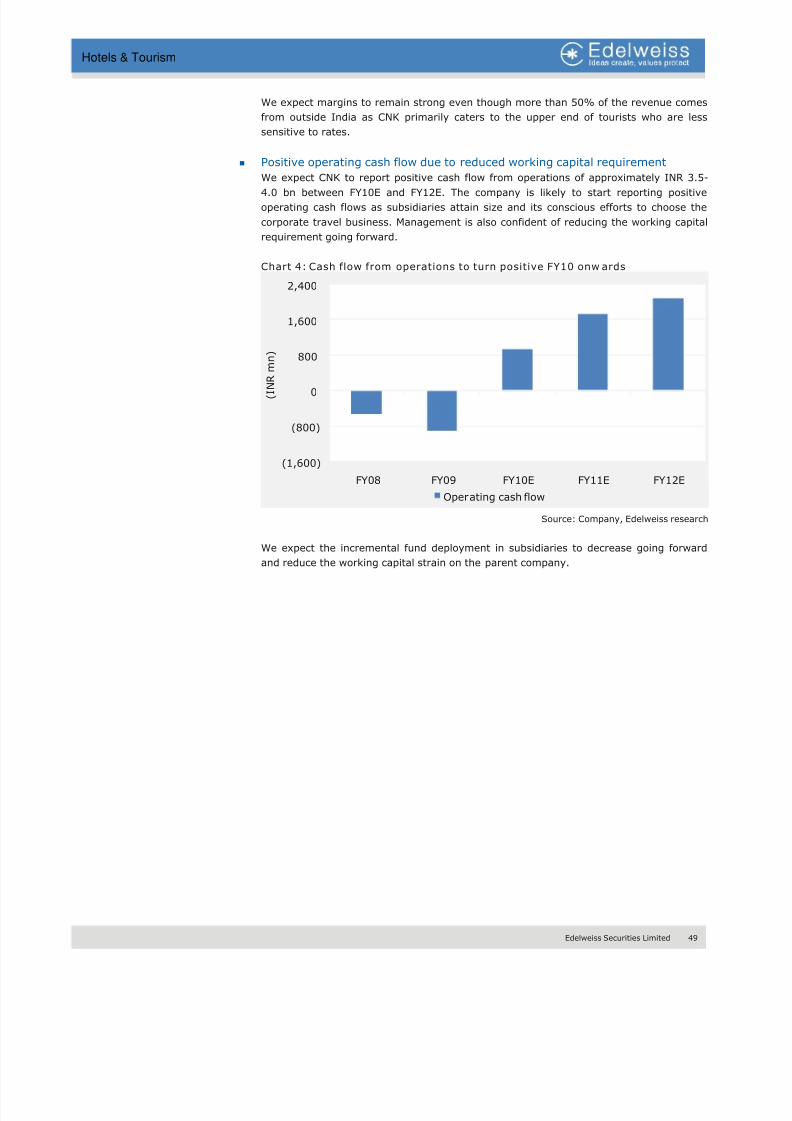
8/8/2019 Hotel and Tourism
http://slidepdf.com/reader/full/hotel-and-tourism 50/106
Edelweiss Securities Limited 49
Hotels & Tourism
We expect margins to remain strong even though more than 50% of the revenue comes
from outside India as CNK primarily caters to the upper end of tourists who are less
sensitive to rates.
Positive operating cash flow due to reduced working capital requirement
We expect CNK to report positive cash flow from operations of approximately INR 3.5-
4.0 bn between FY10E and FY12E. The company is likely to start reporting positive
operating cash flows as subsidiaries attain size and its conscious efforts to choose the
corporate travel business. Management is also confident of reducing the working capital
requirement going forward.
Chart 4: Cash flow from operations to turn positive FY10 onw ards
(1,600)
(800)
0
800
1,600
2,400
FY08 FY09 FY10E FY11E FY12E
( I N R
m n )
Operating cash flow
Source: Company, Edelweiss research
We expect the incremental fund deployment in subsidiaries to decrease going forward
and reduce the working capital strain on the parent company.
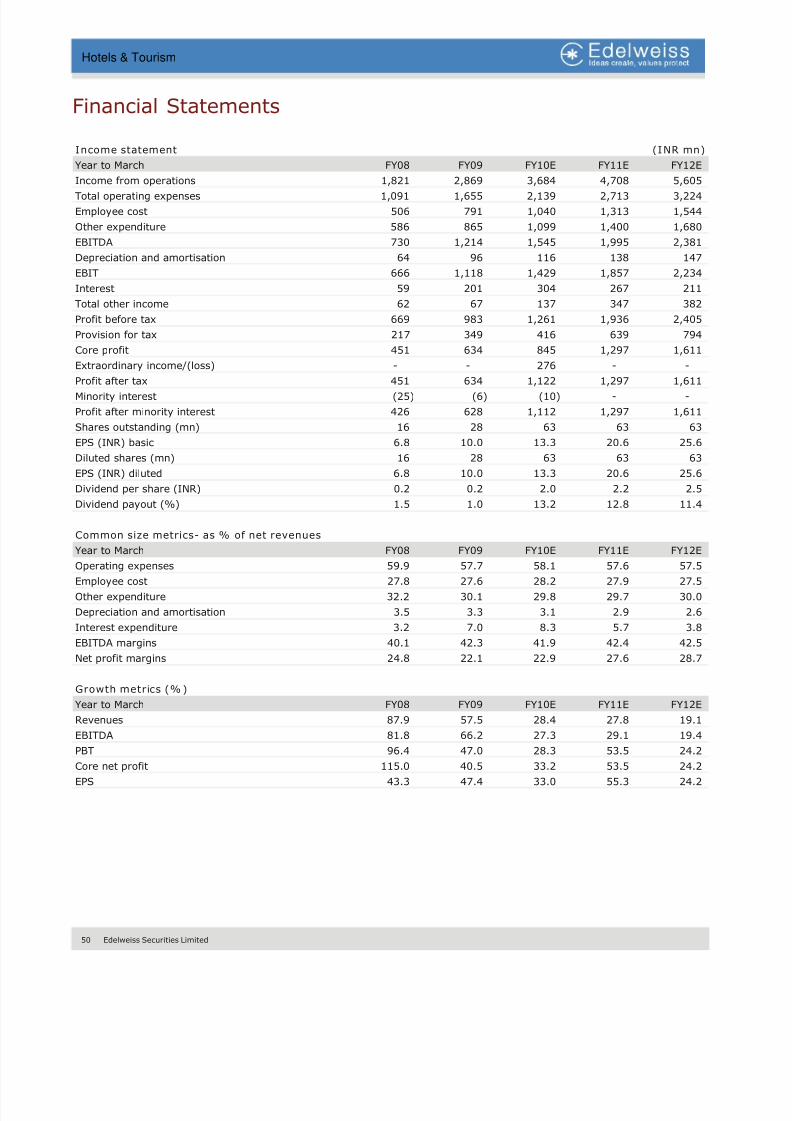
8/8/2019 Hotel and Tourism
http://slidepdf.com/reader/full/hotel-and-tourism 51/106
50 Edelweiss Securities Limited
Hotels & Tourism
Financial Statements
Income statement (INR mn)
Year to March FY08 FY09 FY10E FY11E FY12E
Income from operations 1,821 2,869 3,684 4,708 5,605
Total operating expenses 1,091 1,655 2,139 2,713 3,224
Employee cost 506 791 1,040 1,313 1,544
Other expenditure 586 865 1,099 1,400 1,680
EBITDA 730 1,214 1,545 1,995 2,381
Depreciation and amortisation 64 96 116 138 147
EBIT 666 1,118 1,429 1,857 2,234
Interest 59 201 304 267 211
Total other income 62 67 137 347 382
Profit before tax 669 983 1,261 1,936 2,405
Provision for tax 217 349 416 639 794
Core profit 451 634 845 1,297 1,611
Extraordinary income/(loss) - - 276 - -
Profit after tax 451 634 1,122 1,297 1,611
Minority interest (25) (6) (10) - -
Profit after minority interest 426 628 1,112 1,297 1,611
Shares outstanding (mn) 16 28 63 63 63
EPS (INR) basic 6.8 10.0 13.3 20.6 25.6
Diluted shares (mn) 16 28 63 63 63
EPS (INR) diluted 6.8 10.0 13.3 20.6 25.6
Dividend per share (INR) 0.2 0.2 2.0 2.2 2.5
Dividend payout (%) 1.5 1.0 13.2 12.8 11.4
Common size metrics- as % of net revenues
Year to March FY08 FY09 FY10E FY11E FY12E
Operating expenses 59.9 57.7 58.1 57.6 57.5 Employee cost 27.8 27.6 28.2 27.9 27.5
Other expenditure 32.2 30.1 29.8 29.7 30.0
Depreciation and amortisation 3.5 3.3 3.1 2.9 2.6
Interest expenditure 3.2 7.0 8.3 5.7 3.8
EBITDA margins 40.1 42.3 41.9 42.4 42.5
Net profit margins 24.8 22.1 22.9 27.6 28.7
Growth metrics (% )
Year to March FY08 FY09 FY10E FY11E FY12E
Revenues 87.9 57.5 28.4 27.8 19.1
EBITDA 81.8 66.2 27.3 29.1 19.4
PBT 96.4 47.0 28.3 53.5 24.2 Core net profit 115.0 40.5 33.2 53.5 24.2
EPS 43.3 47.4 33.0 55.3 24.2
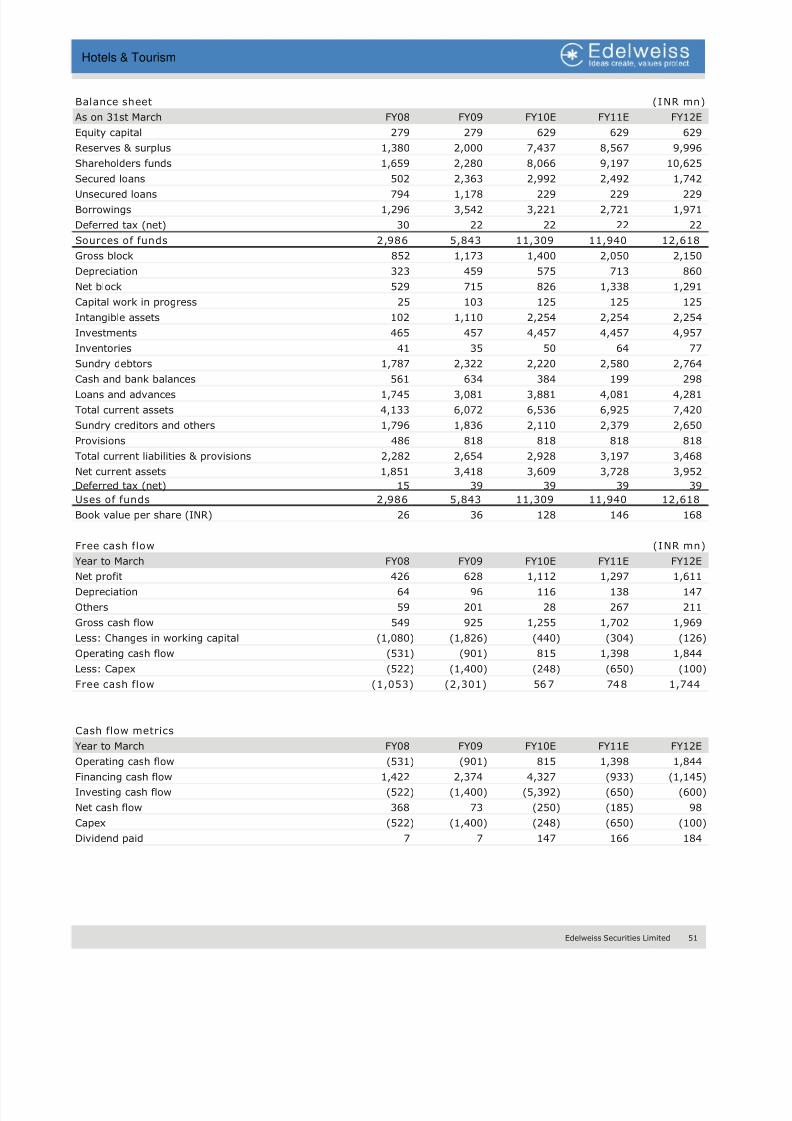
8/8/2019 Hotel and Tourism
http://slidepdf.com/reader/full/hotel-and-tourism 52/106
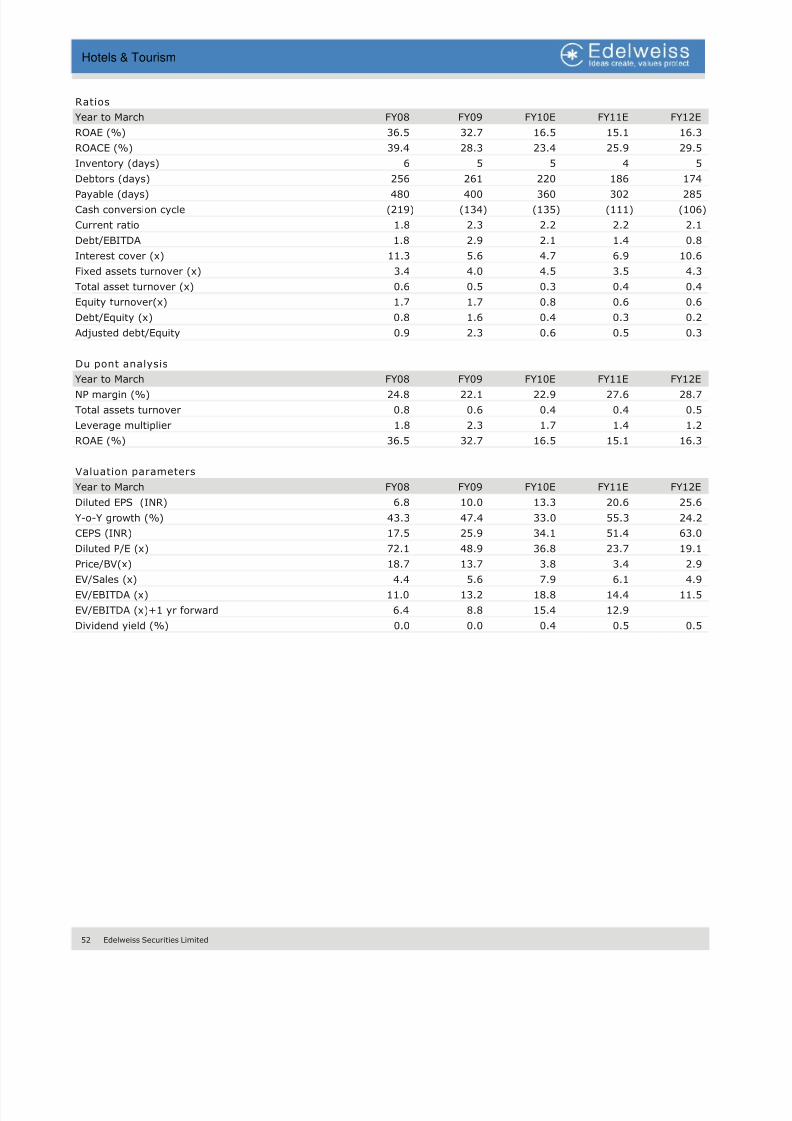
8/8/2019 Hotel and Tourism
http://slidepdf.com/reader/full/hotel-and-tourism 53/106
8/8/2019 Hotel and Tourism
http://slidepdf.com/reader/full/hotel-and-tourism 54/106
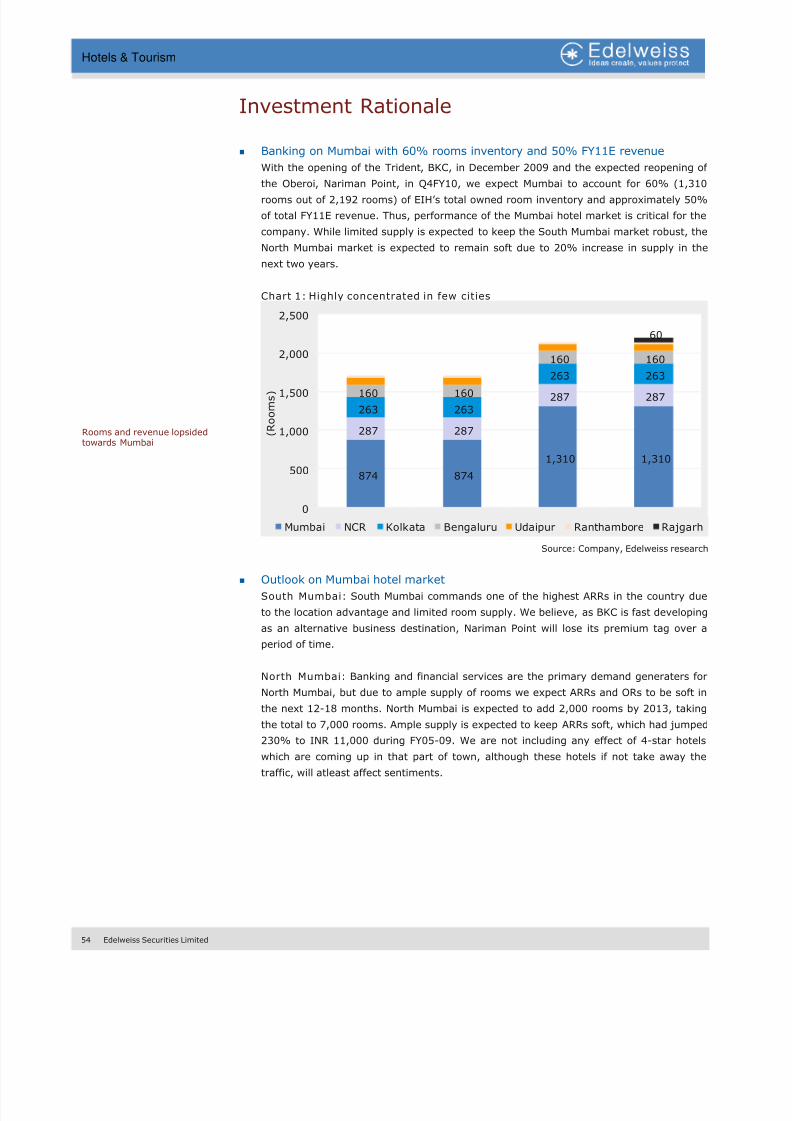
8/8/2019 Hotel and Tourism
http://slidepdf.com/reader/full/hotel-and-tourism 55/106
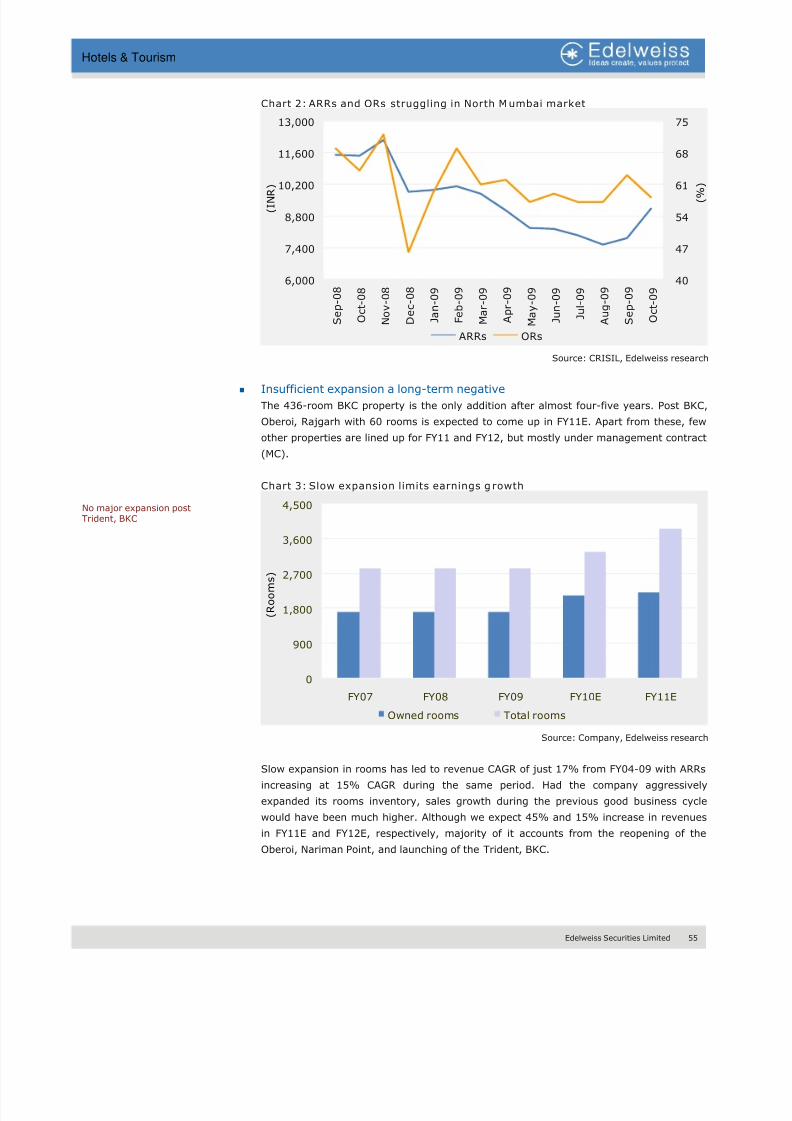
8/8/2019 Hotel and Tourism
http://slidepdf.com/reader/full/hotel-and-tourism 56/106
Edelweiss Securities Limited 55
Hotels & Tourism
Chart 2: ARRs and ORs struggling in North Mumbai market
40
47
54
61
68
75
6,000
7,400
8,800
10,200
11,600
13,000
S e p - 0 8
O c t - 0 8
N o v - 0 8
D e c - 0 8
J a n - 0 9
F e b - 0 9
M a r - 0 9
A p r - 0 9
M a y - 0 9
J u n - 0 9
J u l - 0 9
A u g - 0 9
S e p - 0 9
O c t - 0 9
( % )
( I N R )
ARRs ORs
Source: CRISIL, Edelweiss research
Insufficient expansion a long-term negative
The 436-room BKC property is the only addition after almost four-five years. Post BKC,
Oberoi, Rajgarh with 60 rooms is expected to come up in FY11E. Apart from these, few
other properties are lined up for FY11 and FY12, but mostly under management contract
(MC).
Chart 3: Slow expansion limits earnings g rowth
0
900
1,800
2,700
3,600
4,500
FY07 FY08 FY09 FY10E FY11E
( R o o m s )
Owned rooms Total rooms
Source: Company, Edelweiss research
Slow expansion in rooms has led to revenue CAGR of just 17% from FY04-09 with ARRs
increasing at 15% CAGR during the same period. Had the company aggressively
expanded its rooms inventory, sales growth during the previous good business cycle
would have been much higher. Although we expect 45% and 15% increase in revenues
in FY11E and FY12E, respectively, majority of it accounts from the reopening of the
Oberoi, Nariman Point, and launching of the Trident, BKC.
No major expansion postTrident, BKC
8/8/2019 Hotel and Tourism
http://slidepdf.com/reader/full/hotel-and-tourism 57/106
56 Edelweiss Securities Limited
Hotels & Tourism
Till FY12, EIH plans to add approximately 1,000 rooms through MC, increasing its total
rooms to approximately 1,600. In FY11E, although we expect MC to contribute 7% to the
consolidated EBIDTA, its impact on return ratios is not significant.
International operations go unaccounted
EIH International, a wholly owned subsidiary of EIH, with an investment of INR 1.8 bn,holds stakes in various international properties. Since properties in which investments
are made through EIH International are not considered as an associate or subsidiary,
EIH’s consolidated numbers do not reflect actual performance of these properties.
EIH, through EIH International, has presence in Indonesia, Mauritius, and Egypt and
across four properties has approximately 300 rooms. Due to the registration of this
subsidiary in the British Virgin Islands, EIH recognises only dividend income from it.
Although the inherent value of these properties is high, due to regulations, the real effect
of this is not visible. Through EIH International, EIH is also planning to increase its
presence internationally by adding properties in Dubai, Abu Dhabi, Morocco, and Oman.
We expect further flow of funds to this subsidiary due to the current expansion plans.
As the management of these properties is not with EIH or EIH International, the
company also does not report any MC income from them.
Mashobra Resort: Uncertainty continues
Due to the ongoing dispute with its JV partner, the Government of Himachal Pradesh, the
resort has been losing money. This has created uncertainty over EIH’s total investment
of INR 1.4 bn (comprising INR 0.26 bn in equity and INR 1.13 bn in loans and
advances). The dispute in regard to cost over runs and EIH’s subsequent request to
convert its debt into equity is with the high court. The dispute has resulted in Mashobra
losing INR 482 mn in the past five years on net basis. In the meantime, the company
continues to pay the debt and interest obligations. EIH is expected to provide another
INR 100 mn in FY10E towards the interest and the principal due to banks.
Airport and flight services: Tepid growth
Oberoi Flight Services (OFS) and Oberoi Airport Services (OAS) with an estimated annual
revenue of INR 1.8-1.9 bn (16% of consolidated revenue of FY09) in FY09 is not showing
any signs of growth. The company is expected to end FY10 with flat growth and
profitability is likely to be under stress considering the doddering financial condition of
the airline industry.
EIH caters to only foreign airlines. Growth in the business has been tepid and the
company is not enthusiastic to pursue the business. In H1FY10, the estimated top line
for the business was INR 860 mn and the company expects similar performance in
H2FY10 as well.
Printing and car services business: The minions
We consider EIH’s car rental (Mercury Car Rentals; EIH holds 66.67%) and printing press
businesses as non core areas and believe the total investment of approximately INR 2 bn
in them to be overall dilutive for profitability. We believe it is difficult for these segments
to generate the hotel business EBIDTA margin of 25-30%.
The car rental business is a JV with Avis of Europe, wherein the latter holds one third
equity. In FY09, on sales of INR 776 mn, it posted a negative PBT of INR 73.4 mn as
many of the company’s initiatives did not yield the desired results. In FY10, the company
No income frominternational operations
No growth in flight cateringbusiness
Substandard returns fromprinting and car rentalbusinesses

8/8/2019 Hotel and Tourism
http://slidepdf.com/reader/full/hotel-and-tourism 58/106
Edelweiss Securities Limited 57
Hotels & Tourism
is expected to post marginal profits, both due to improved business conditions and
measures to cut loss making segments.
EIH generated revenue of INR 500 mn from the printing business where approximately
20% of the business is in house. Till 2008, the business operated out of Maiden Hotels in
Delhi. In FY09, the company invested INR 1 bn to expand and shift the business to
Manesar (close to Gurgaon, Haryana). The company has aggressive plans for this
business, but we believe its overall profitability is not more than 10-15%.
8/8/2019 Hotel and Tourism
http://slidepdf.com/reader/full/hotel-and-tourism 59/106
58 Edelweiss Securities Limited
Hotels & Tourism
Valuation
We have used valuation parameters like EV/EBIDTA, EV/sales, P/B, and DCF to value EIH.
The stock is currently available at 13.4x and 11.3x consolidated EV/EBIDTA of FY11E and
FY12E, respectively, while its global peers are trading at 12.0x and 10.0x their EV/EBIDTA of
FY11E and FY12E, respectively. With a target price of INR 120, we believe the 10-15%
current premium over other comparables is not justified and expect EIH to trade at similar
multiple as peers. As we don’t have any light on the financial details of its overseas company,
we have valued the investments at 2x, which adds another INR 10 to our target price.
At CMP of INR 124, EIH is currently trading at 3.2x FY11E P/B. Although it is less than its
historical P/B of 4.1x over FY06-09, we believe at the current price, the stock fully factors in
better business performance. Disappointment on any of these fronts can adervsely impact
stock sentiments.
Our sensitivty analysis for the main valuation parameters like EV/EBIDTA and EPS also shows
a limited upside to our estimates.
Table 1: Sensitivtiy of EV/ EBIDTA – FY12E
ARR increase 60% 65% 70% 75%
5% 13.8 12.7 11.7 10.9
10% 13.3 12.2 11.3 10.5
15% 12.8 11.8 10.9 10.1
20% 12.4 11.4 10.53 9.8
ORs
Source: Edelweiss research
Table 2: Sensitivity of EPS – FY12E
ARR increase 60% 65% 70% 75%
5% 3.5 4.1 4.7 5.3
10% 3.7 4.4 5.0 5.6
15% 4.0 4.6 5.3 5.9
20% 4.3 4.9 5.57 6.2
ORs
Source: Edelweiss reserarch
We have assumed 70% ORs and 15% growth in ARRs for calculations. This is considering the
fact that 60% of its owned rooms are located in Mumbai, EIH has better chances of
increasing overall ARRs. The sensivity table clearly demostrates that even with ORs of 70%
and 15% growth in ARRs in FY12E, the company would be trading at EV/EBIDTA of 11.3x,
which is a 10% premium than peers. We initiate coverage on the stock with a ‘HOLD’
recommendation.
Insufficient expansion toaffect the earnings growth
8/8/2019 Hotel and Tourism
http://slidepdf.com/reader/full/hotel-and-tourism 60/106
Edelweiss Securities Limited 59
Hotels & Tourism
Key Risks
Further stake increase by ITC
With ITC’s stake in EIH at 14.98%, further acquisition of shares by the former through
the open offer route will increase its involvement in the company. Even though ITC has
been holding this stake for the past five-six years, any open offer will affect the share
price.
Announcement of major projects
An aggressive expansion plan by the current management can propel the current slow
expansion to a fast track. As the company’s balance sheet is not highly leveraged, it is
possible for EIH to increase its rooms inventory under the ownership structure.
Sale of land bank
Sale of any land parcels by EIH may give access to substantial cash. We do not have
exact details of its land bank.
Monetisation of international operations
Efforts to monetise the value of EIH International may provide the much needed clarity
on international operations. As contribution of the international subsidiary is currently
minimal due to the registration regulation, we have assumed investment under the same
only at its book value.
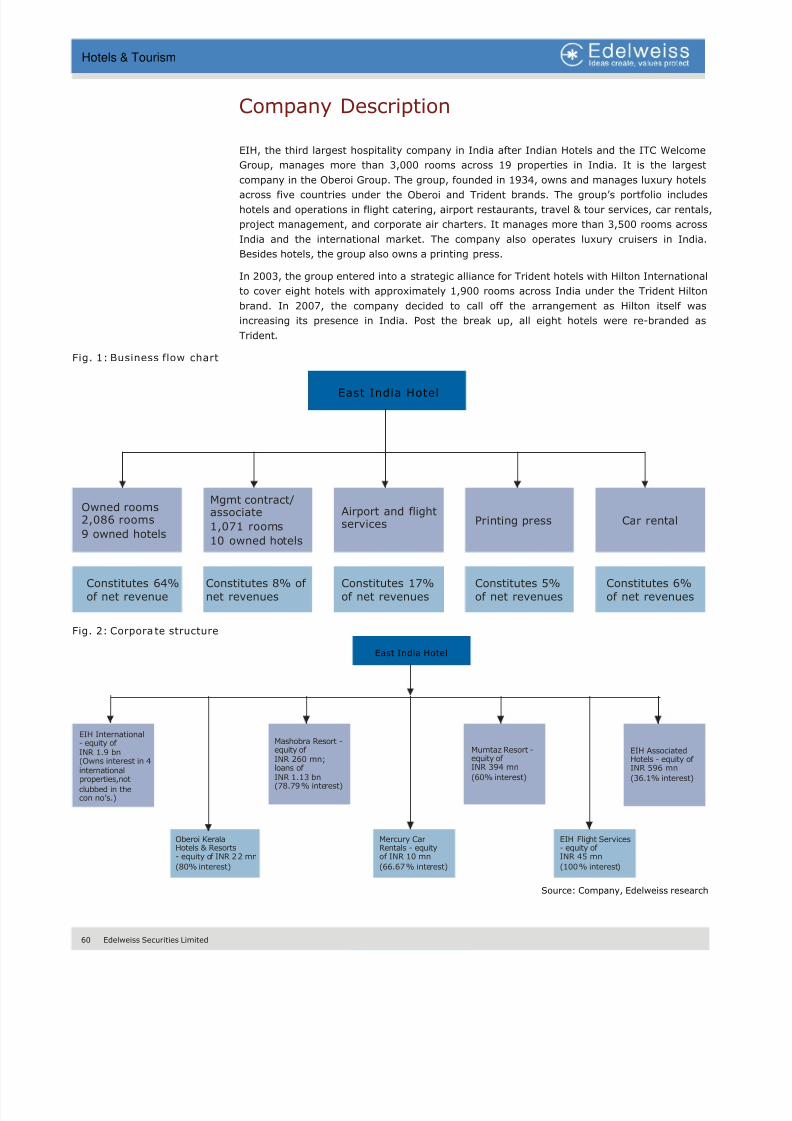
8/8/2019 Hotel and Tourism
http://slidepdf.com/reader/full/hotel-and-tourism 61/106
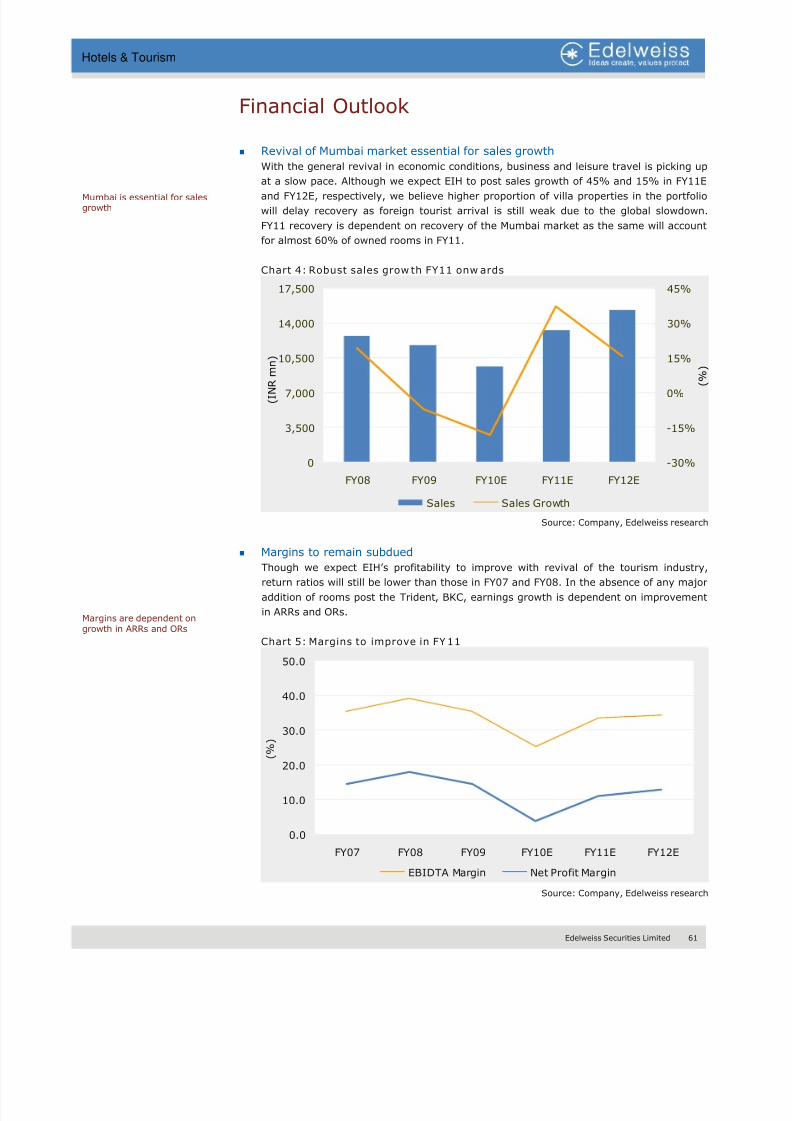
8/8/2019 Hotel and Tourism
http://slidepdf.com/reader/full/hotel-and-tourism 62/106
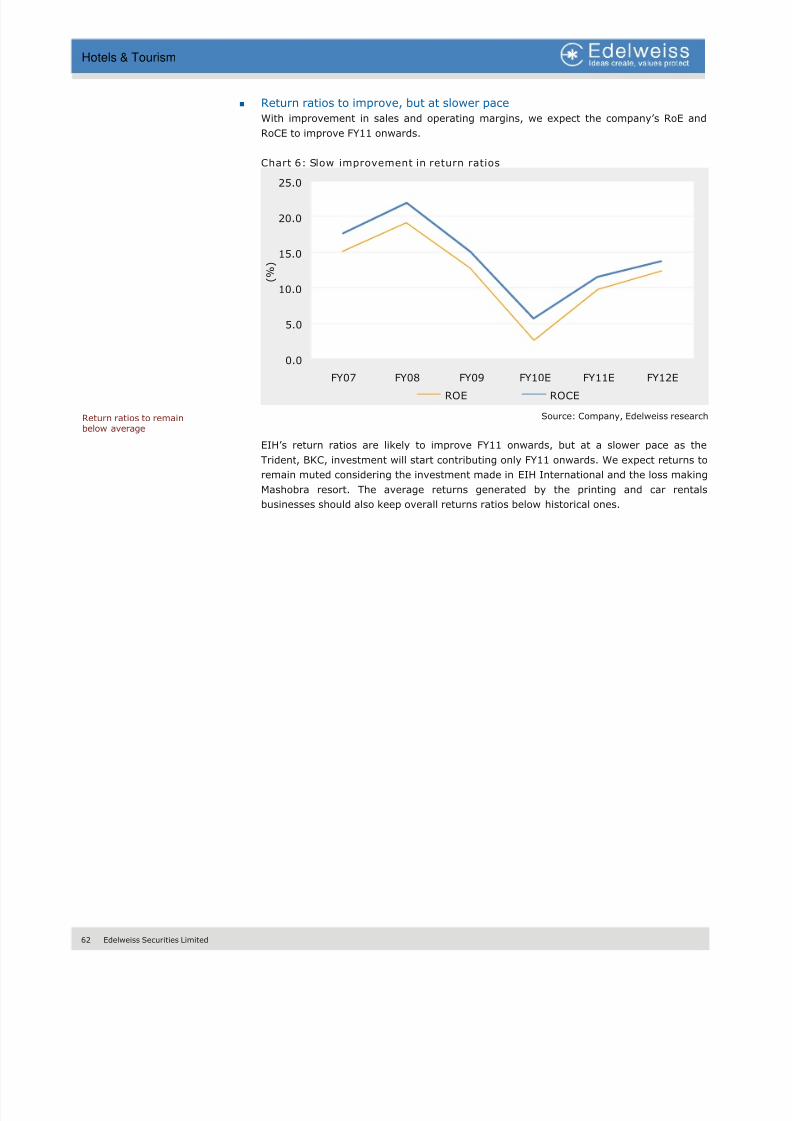
8/8/2019 Hotel and Tourism
http://slidepdf.com/reader/full/hotel-and-tourism 63/106
62 Edelweiss Securities Limited
Hotels & Tourism
Return ratios to improve, but at slower pace
With improvement in sales and operating margins, we expect the company’s RoE and
RoCE to improve FY11 onwards.
Chart 6: Slow improvement in return ratios
0.0
5.0
10.0
15.0
20.0
25.0
FY07 FY08 FY09 FY10E FY11E FY12E
( % )
ROE ROCE
Source: Company, Edelweiss research
EIH’s return ratios are likely to improve FY11 onwards, but at a slower pace as the
Trident, BKC, investment will start contributing only FY11 onwards. We expect returns to
remain muted considering the investment made in EIH International and the loss making
Mashobra resort. The average returns generated by the printing and car rentals
businesses should also keep overall returns ratios below historical ones.
Return ratios to remainbelow average
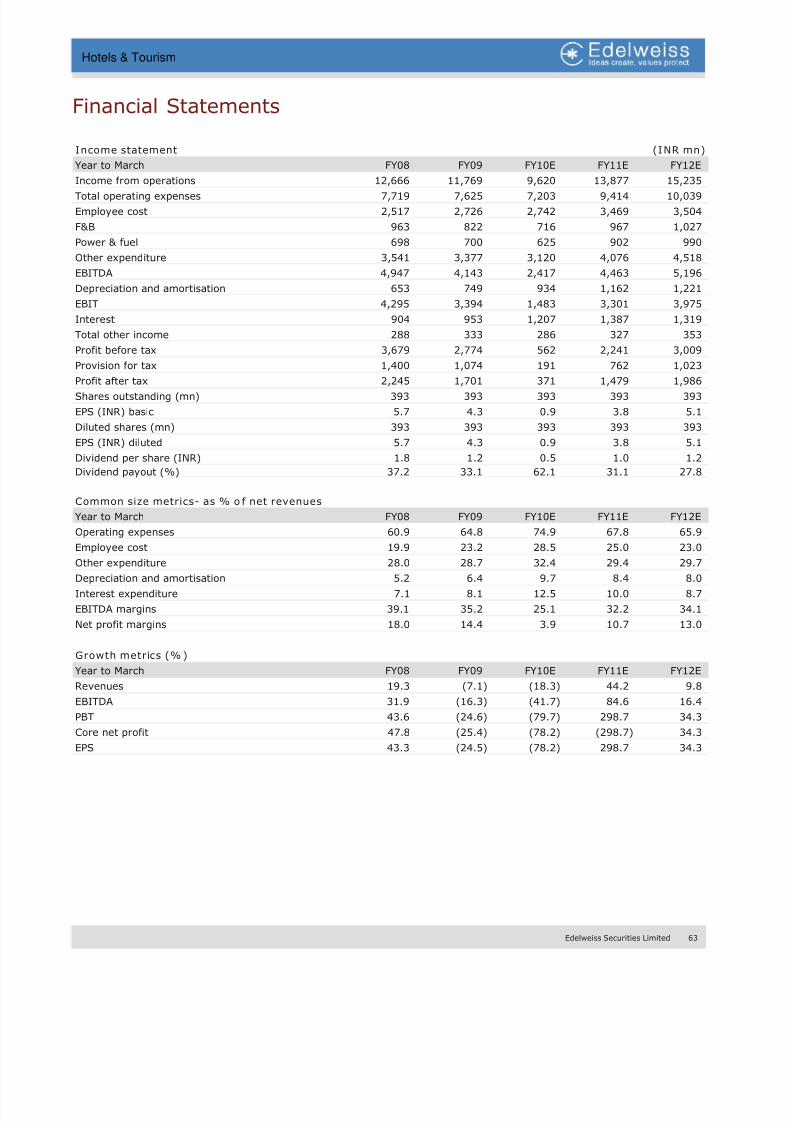
8/8/2019 Hotel and Tourism
http://slidepdf.com/reader/full/hotel-and-tourism 64/106
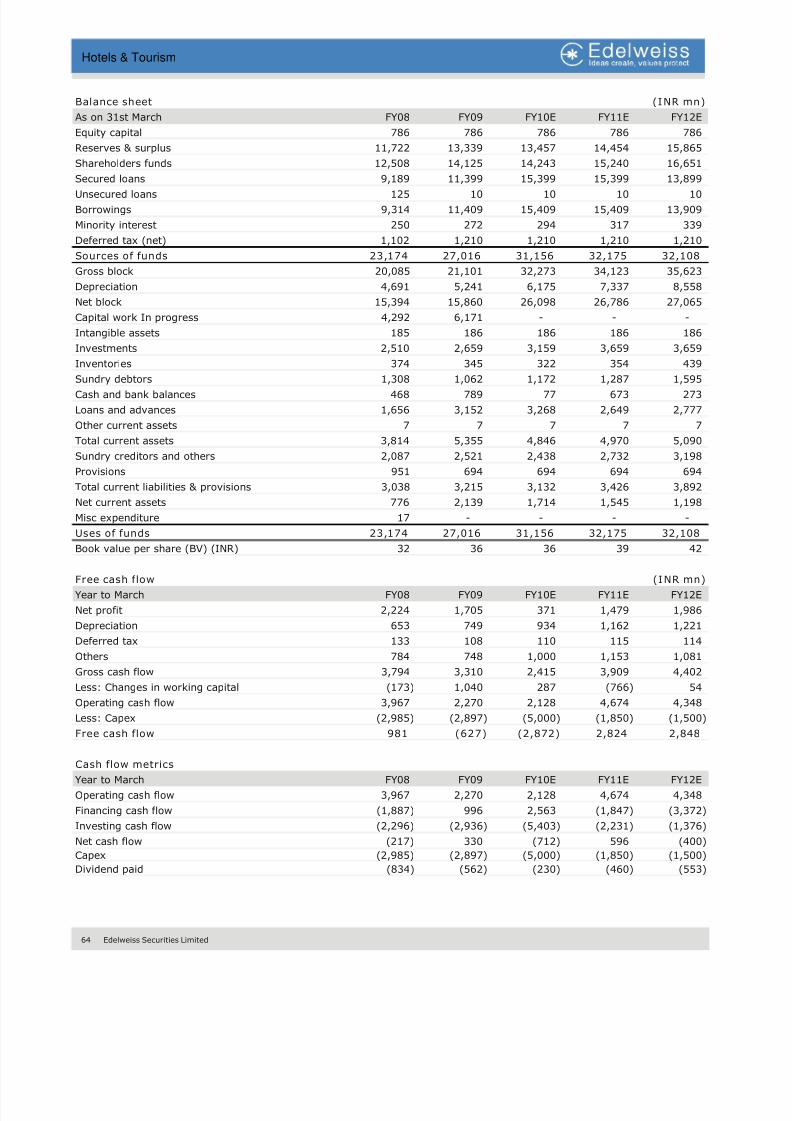
8/8/2019 Hotel and Tourism
http://slidepdf.com/reader/full/hotel-and-tourism 65/106
64 Edelweiss Securities Limited
Hotels & Tourism
Balance sheet (INR mn)
As on 31st March FY08 FY09 FY10E FY11E FY12E
Equity capital 786 786 786 786 786
Reserves & surplus 11,722 13,339 13,457 14,454 15,865
Shareholders funds 12,508 14,125 14,243 15,240 16,651
Secured loans 9,189 11,399 15,399 15,399 13,899
Unsecured loans 125 10 10 10 10
Borrowings 9,314 11,409 15,409 15,409 13,909
Minority interest 250 272 294 317 339
Deferred tax (net) 1,102 1,210 1,210 1,210 1,210
Sources of funds 23,174 27,016 31,156 32,175 32,108
Gross block 20,085 21,101 32,273 34,123 35,623
Depreciation 4,691 5,241 6,175 7,337 8,558
Net block 15,394 15,860 26,098 26,786 27,065
Capital work In progress 4,292 6,171 - - -
Intangible assets 185 186 186 186 186
Investments 2,510 2,659 3,159 3,659 3,659
Inventories 374 345 322 354 439
Sundry debtors 1,308 1,062 1,172 1,287 1,595
Cash and bank balances 468 789 77 673 273
Loans and advances 1,656 3,152 3,268 2,649 2,777
Other current assets 7 7 7 7 7
Total current assets 3,814 5,355 4,846 4,970 5,090
Sundry creditors and others 2,087 2,521 2,438 2,732 3,198
Provisions 951 694 694 694 694
Total current liabilities & provisions 3,038 3,215 3,132 3,426 3,892
Net current assets 776 2,139 1,714 1,545 1,198
Misc expenditure 17 - - - -
Uses of funds 23,174 27,016 31,156 32,175 32,108
Book value per share (BV) (INR) 32 36 36 39 42
Free cash flow (INR mn)
Year to March FY08 FY09 FY10E FY11E FY12E
Net profit 2,224 1,705 371 1,479 1,986
Depreciation 653 749 934 1,162 1,221
Deferred tax 133 108 110 115 114
Others 784 748 1,000 1,153 1,081
Gross cash flow 3,794 3,310 2,415 3,909 4,402
Less: Changes in working capital (173) 1,040 287 (766) 54
Operating cash flow 3,967 2,270 2,128 4,674 4,348
Less: Capex (2,985) (2,897) (5,000) (1,850) (1,500)
Free cash flow 981 (627) (2,872) 2,824 2,848
Cash flow metrics
Year to March FY08 FY09 FY10E FY11E FY12E
Operating cash flow 3,967 2,270 2,128 4,674 4,348
Financing cash flow (1,887) 996 2,563 (1,847) (3,372)
Investing cash flow (2,296) (2,936) (5,403) (2,231) (1,376)
Net cash flow (217) 330 (712) 596 (400)
Capex (2,985) (2,897) (5,000) (1,850) (1,500)
Dividend paid (834) (562) (230) (460) (553)

8/8/2019 Hotel and Tourism
http://slidepdf.com/reader/full/hotel-and-tourism 66/106
Edelweiss Securities Limited 65
Hotels & Tourism
Ratios
Year to March FY08 FY09 FY10E FY11E FY12E
ROAE (%) 19.1 12.8 2.6 10.0 12.5
ROACE (%) 21.9 15.1 5.7 11.7 14.0
Inventory (days) 10 11 13 9 9
Debtors (days) 36 37 42 32 35
Payable (days) 91 110 126 100 108
Cash conversion cycle (45) (62) (71) (59) (64)
Current ratio 0.3 0.2 0.2 0.3 0.3
Debt/EBITDA 1.9 2.8 6.4 3.5 2.7
Interest cover (x) 4.8 3.6 1.2 2.4 3.0
Fixed assets turnover (x) 0.9 0.8 0.5 0.5 0.6
Total asset turnover (x) 0.6 0.5 0.3 0.4 0.5
Equity turnover(x) 1.1 0.9 0.7 0.9 1.0
Debt/Equity (x) 0.7 0.8 1.1 1.0 0.8
Adjusted debt/Equity 0.7 0.8 1.1 1.0 0.8
Du pont analysis
Year to March FY08 FY09 FY10E FY11E FY12E
NP margin (%) 17.8 14.5 3.9 10.7 13.0
Total assets turnover 0.6 0.5 0.3 0.4 0.5
Leverage multiplier 1.9 1.9 2.1 2.1 2.0
ROAE (%) 19.1 12.8 2.6 10.0 12.5
Valuation parameters
Year to March FY08 FY09 FY10E FY11E FY12E
Diluted EPS (INR) 5.7 4.3 0.9 3.8 5.1
Y-o-Y growth (%) 43.3 (24.5) (78.2) 298.7 34.3
CEPS (INR) 7.4 6.2 3.3 6.7 8.2
Diluted P/E (x) 21.6 28.6 131.3 32.9 24.5
Price/BV(x) 3.9 3.4 3.4 3.2 2.9 EV/Sales (x) 4.3 4.8 6.3 4.3 3.9
EV/EBITDA (x) 11.1 13.7 25.2 13.4 11.3
EV/EBITDA (x)+1 yr forward 13.3 23.5 13.6 11.5 NA
Dividend yield (%) 1.5 1.0 0.4 0.8 1.0

8/8/2019 Hotel and Tourism
http://slidepdf.com/reader/full/hotel-and-tourism 67/106
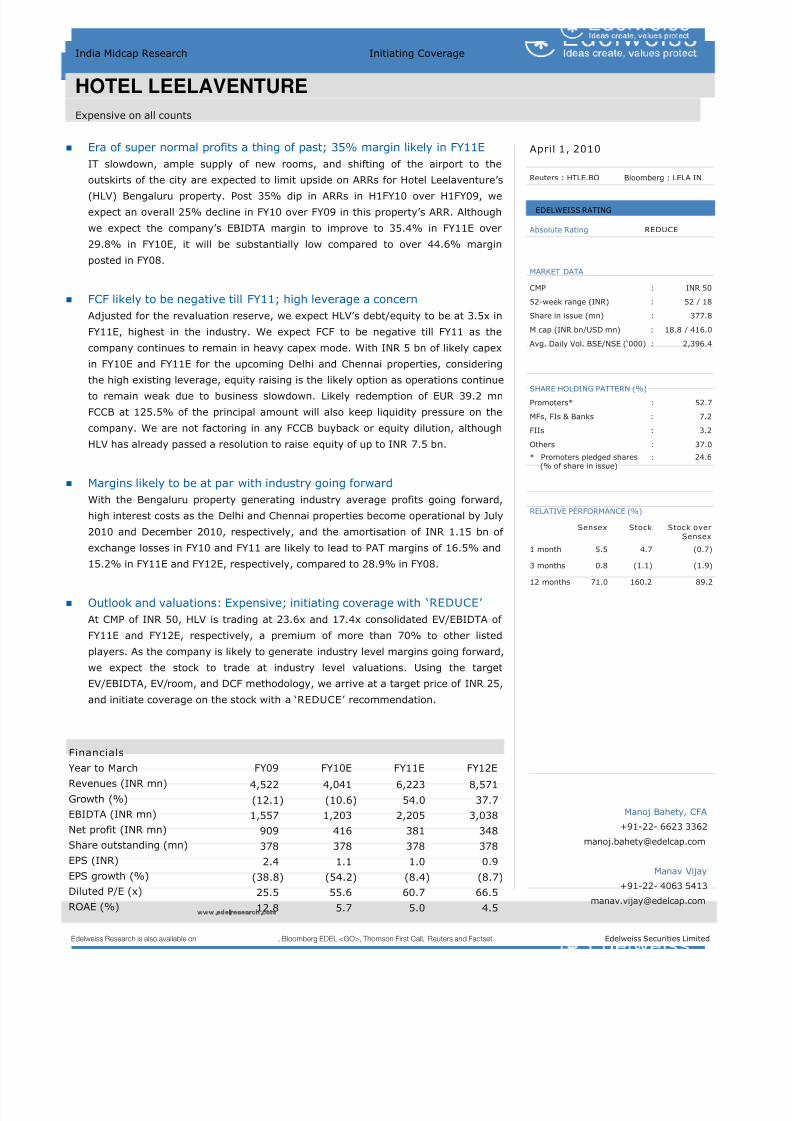
8/8/2019 Hotel and Tourism
http://slidepdf.com/reader/full/hotel-and-tourism 68/106
Edelweiss Securities Limited 67
Hotels & Tourism
Era of super normal profits a thing of past; 35% margin likely in FY11E
IT slowdown, ample supply of new rooms, and shifting of the airport to the
outskirts of the city are expected to limit upside on ARRs for Hotel Leelaventure’s
(HLV) Bengaluru property. Post 35% dip in ARRs in H1FY10 over H1FY09, we
expect an overall 25% decline in FY10 over FY09 in this property’s ARR. Although
we expect the company’s EBIDTA margin to improve to 35.4% in FY11E over
29.8% in FY10E, it will be substantially low compared to over 44.6% margin
posted in FY08.
FCF likely to be negative till FY11; high leverage a concern
Adjusted for the revaluation reserve, we expect HLV’s debt/equity to be at 3.5x in
FY11E, highest in the industry. We expect FCF to be negative till FY11 as the
company continues to remain in heavy capex mode. With INR 5 bn of likely capex
in FY10E and FY11E for the upcoming Delhi and Chennai properties, considering
the high existing leverage, equity raising is the likely option as operations continue
to remain weak due to business slowdown. Likely redemption of EUR 39.2 mn
FCCB at 125.5% of the principal amount will also keep liquidity pressure on the
company. We are not factoring in any FCCB buyback or equity dilution, although
HLV has already passed a resolution to raise equity of up to INR 7.5 bn.
Margins likely to be at par with industry going forward
With the Bengaluru property generating industry average profits going forward,
high interest costs as the Delhi and Chennai properties become operational by July
2010 and December 2010, respectively, and the amortisation of INR 1.15 bn of
exchange losses in FY10 and FY11 are likely to lead to PAT margins of 16.5% and
15.2% in FY11E and FY12E, respectively, compared to 28.9% in FY08.
Outlook and valuations: Expensive; initiating coverage with ‘REDUCE’
At CMP of INR 50, HLV is trading at 23.6x and 17.4x consolidated EV/EBIDTA of
FY11E and FY12E, respectively, a premium of more than 70% to other listed
players. As the company is likely to generate industry level margins going forward,
we expect the stock to trade at industry level valuations. Using the target
EV/EBIDTA, EV/room, and DCF methodology, we arrive at a target price of INR 25,
and initiate coverage on the stock with a ‘REDUCE’ recommendation.
Edelweiss Research is also available on www.edelresearch.com, Bloomberg EDEL <GO>, Thomson First Call, Reuters and Factset. Edelweiss Securities Limited
India Midcap Research Initiating Coverage
HOTEL LEELAVENTURE
Expensive on all counts April 1, 2010
Reuters : HTLE.BO Bloomberg : LELA IN
Absolute Rating REDUCE
MARKET DATA CMP : INR 50
52-week range (INR) : 52 / 18
Share in issue (mn) : 377.8
M cap (INR bn/USD mn) : 18.8 / 416.0
Avg. Daily Vol. BSE/NSE (‘000) : 2,396.4
SHARE HOLDING PATTERN (%)
Promoters* : 52.7
MFs, FIs & Banks : 7.2
FIIs : 3.2
Others : 37.0
* Promoters pledged shares : 24.6(% of share in issue)
RELATIVE PERFORMANCE (%)
Sensex Stock Stock over
Sensex
1 month 5.5 4.7 (0.7)
3 months 0.8 (1.1) (1.9)
12 months 71.0 160.2 89.2
Manoj Bahety, CFA
+91-22- 6623 3362
Manav Vijay
+91-22- 4063 5413
EDELWEISS RATING
FinancialsYear to March FY09 FY10E FY11E FY12E
Revenues (INR mn) 4,522 4,041 6,223 8,571
Growth (%) (12.1) (10.6) 54.0 37.7
EBIDTA (INR mn) 1,557 1,203 2,205 3,038
Net profit (INR mn) 909 416 381 348
Share outstanding (mn) 378 378 378 378
EPS (INR) 2.4 1.1 1.0 0.9
EPS growth (%) (38.8) (54.2) (8.4) (8.7)
Diluted P/E (x) 25.5 55.6 60.7 66.5
ROAE (%) 12.8 5.7 5.0 4.5
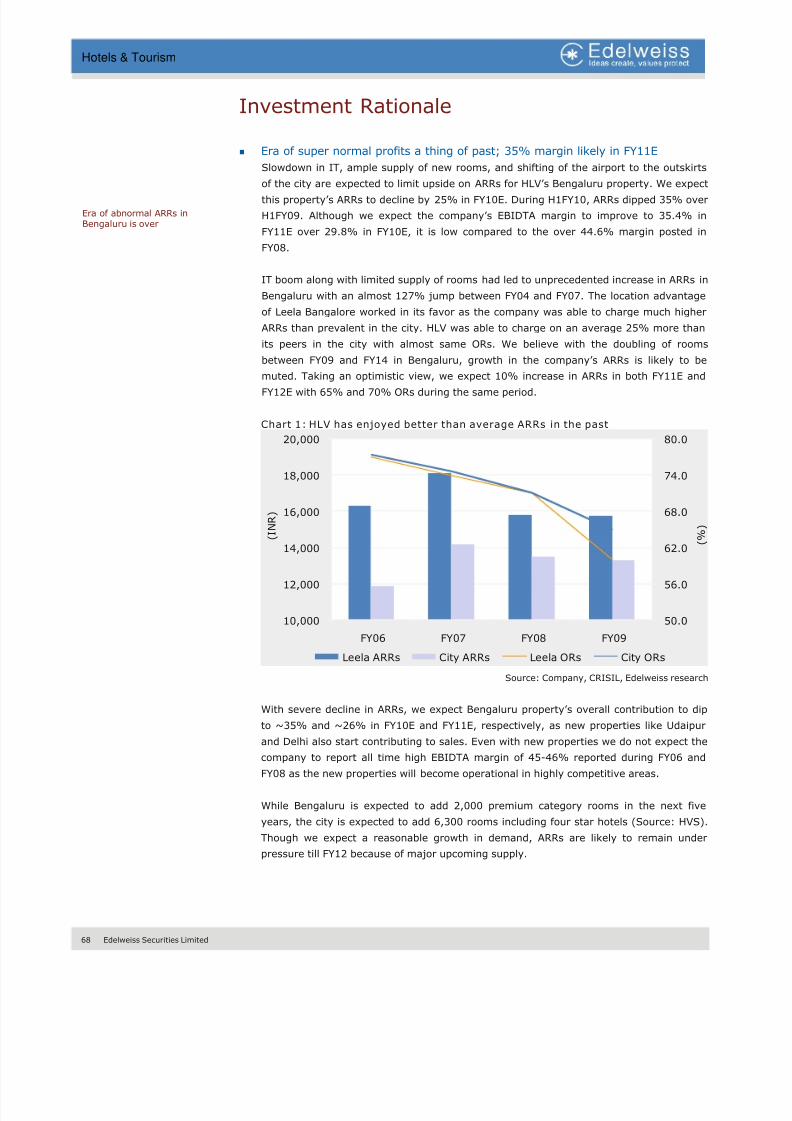
8/8/2019 Hotel and Tourism
http://slidepdf.com/reader/full/hotel-and-tourism 69/106
68 Edelweiss Securities Limited
Hotels & Tourism
Investment Rationale
Era of super normal profits a thing of past; 35% margin likely in FY11E
Slowdown in IT, ample supply of new rooms, and shifting of the airport to the outskirts
of the city are expected to limit upside on ARRs for HLV’s Bengaluru property. We expectthis property’s ARRs to decline by 25% in FY10E. During H1FY10, ARRs dipped 35% over
H1FY09. Although we expect the company’s EBIDTA margin to improve to 35.4% in
FY11E over 29.8% in FY10E, it is low compared to the over 44.6% margin posted in
FY08.
IT boom along with limited supply of rooms had led to unprecedented increase in ARRs in
Bengaluru with an almost 127% jump between FY04 and FY07. The location advantage
of Leela Bangalore worked in its favor as the company was able to charge much higher
ARRs than prevalent in the city. HLV was able to charge on an average 25% more than
its peers in the city with almost same ORs. We believe with the doubling of rooms
between FY09 and FY14 in Bengaluru, growth in the company’s ARRs is likely to be
muted. Taking an optimistic view, we expect 10% increase in ARRs in both FY11E andFY12E with 65% and 70% ORs during the same period.
Chart 1: HLV has enjoyed better than average ARRs in the past
50.0
56.0
62.0
68.0
74.0
80.0
10,000
12,000
14,000
16,000
18,000
20,000
FY06 FY07 FY08 FY09
( % )
( I N R )
Leela ARRs City ARRs Leela ORs City ORs
Source: Company, CRISIL, Edelweiss research
With severe decline in ARRs, we expect Bengaluru property’s overall contribution to dip
to ~35% and ~26% in FY10E and FY11E, respectively, as new properties like Udaipur
and Delhi also start contributing to sales. Even with new properties we do not expect the
company to report all time high EBIDTA margin of 45-46% reported during FY06 and
FY08 as the new properties will become operational in highly competitive areas.
While Bengaluru is expected to add 2,000 premium category rooms in the next five
years, the city is expected to add 6,300 rooms including four star hotels (Source: HVS).
Though we expect a reasonable growth in demand, ARRs are likely to remain under
pressure till FY12 because of major upcoming supply.
Era of abnormal ARRs inBengaluru is over
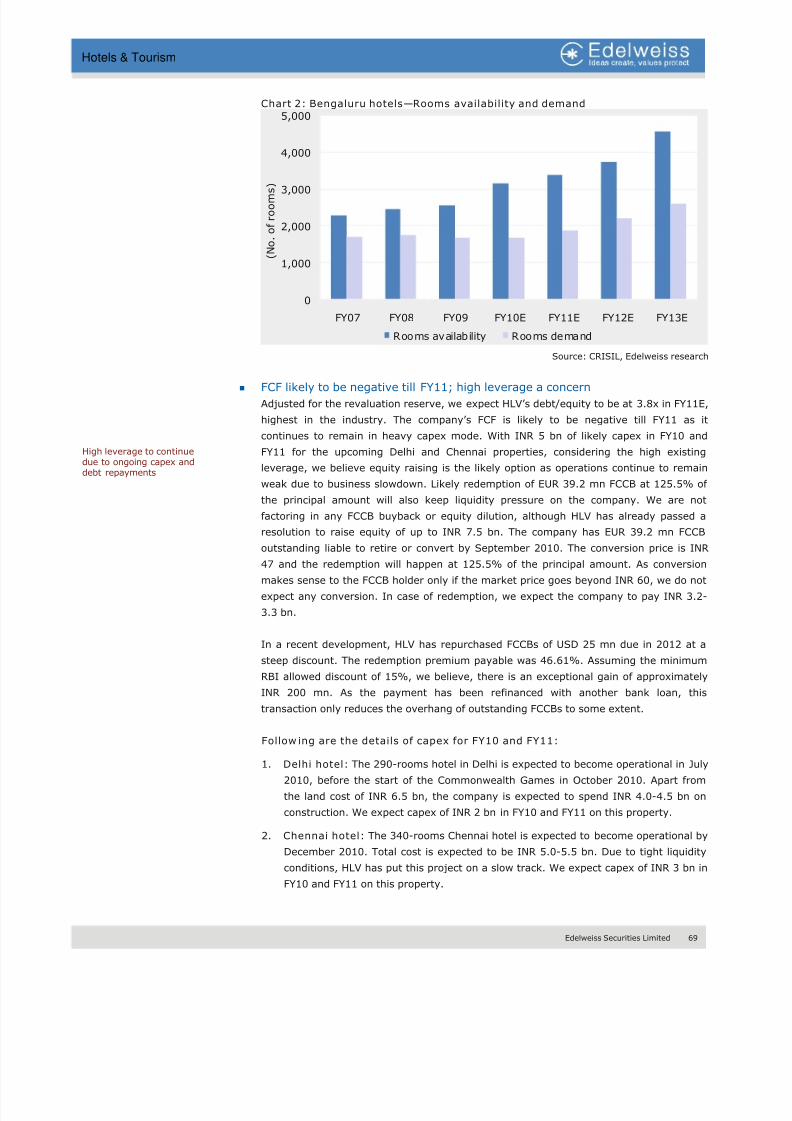
8/8/2019 Hotel and Tourism
http://slidepdf.com/reader/full/hotel-and-tourism 70/106
Edelweiss Securities Limited 69
Hotels & Tourism
Chart 2: Bengaluru hotels—Rooms availability and demand
0
1,000
2,000
3,000
4,000
5,000
FY07 FY08 FY09 FY10E FY11E FY12E FY13E
( N o . o f r o o m s )
Rooms availability Rooms demand
Source: CRISIL, Edelweiss research
FCF likely to be negative till FY11; high leverage a concern
Adjusted for the revaluation reserve, we expect HLV’s debt/equity to be at 3.8x in FY11E,
highest in the industry. The company’s FCF is likely to be negative till FY11 as it
continues to remain in heavy capex mode. With INR 5 bn of likely capex in FY10 and
FY11 for the upcoming Delhi and Chennai properties, considering the high existing
leverage, we believe equity raising is the likely option as operations continue to remain
weak due to business slowdown. Likely redemption of EUR 39.2 mn FCCB at 125.5% of
the principal amount will also keep liquidity pressure on the company. We are not
factoring in any FCCB buyback or equity dilution, although HLV has already passed a
resolution to raise equity of up to INR 7.5 bn. The company has EUR 39.2 mn FCCB
outstanding liable to retire or convert by September 2010. The conversion price is INR
47 and the redemption will happen at 125.5% of the principal amount. As conversionmakes sense to the FCCB holder only if the market price goes beyond INR 60, we do not
expect any conversion. In case of redemption, we expect the company to pay INR 3.2-
3.3 bn.
In a recent development, HLV has repurchased FCCBs of USD 25 mn due in 2012 at a
steep discount. The redemption premium payable was 46.61%. Assuming the minimum
RBI allowed discount of 15%, we believe, there is an exceptional gain of approximately
INR 200 mn. As the payment has been refinanced with another bank loan, this
transaction only reduces the overhang of outstanding FCCBs to some extent.
Follow ing are the details of capex for FY10 and FY11:
1. Delhi hotel: The 290-rooms hotel in Delhi is expected to become operational in July
2010, before the start of the Commonwealth Games in October 2010. Apart from
the land cost of INR 6.5 bn, the company is expected to spend INR 4.0-4.5 bn on
construction. We expect capex of INR 2 bn in FY10 and FY11 on this property.
2. Chennai hotel: The 340-rooms Chennai hotel is expected to become operational by
December 2010. Total cost is expected to be INR 5.0-5.5 bn. Due to tight liquidity
conditions, HLV has put this project on a slow track. We expect capex of INR 3 bn in
FY10 and FY11 on this property.
High leverage to continuedue to ongoing capex anddebt repayments
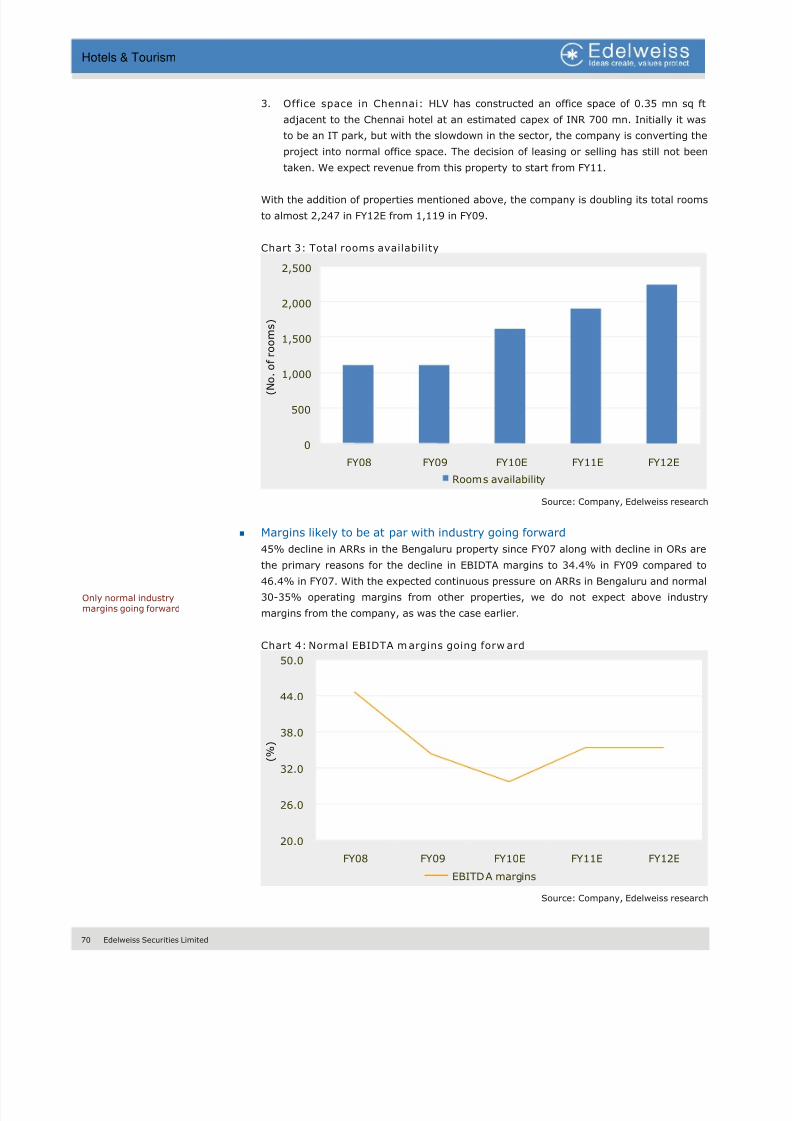
8/8/2019 Hotel and Tourism
http://slidepdf.com/reader/full/hotel-and-tourism 71/106
70 Edelweiss Securities Limited
Hotels & Tourism
3. Office space in Chennai: HLV has constructed an office space of 0.35 mn sq ft
adjacent to the Chennai hotel at an estimated capex of INR 700 mn. Initially it was
to be an IT park, but with the slowdown in the sector, the company is converting the
project into normal office space. The decision of leasing or selling has still not been
taken. We expect revenue from this property to start from FY11.
With the addition of properties mentioned above, the company is doubling its total rooms
to almost 2,247 in FY12E from 1,119 in FY09.
Chart 3: Total rooms availability
0
500
1,000
1,500
2,000
2,500
FY08 FY09 FY10E FY11E FY12E
( N o . o f r o o m s )
Rooms availability
Source: Company, Edelweiss research
Margins likely to be at par with industry going forward
45% decline in ARRs in the Bengaluru property since FY07 along with decline in ORs are
the primary reasons for the decline in EBIDTA margins to 34.4% in FY09 compared to46.4% in FY07. With the expected continuous pressure on ARRs in Bengaluru and normal
30-35% operating margins from other properties, we do not expect above industry
margins from the company, as was the case earlier.
Chart 4: Normal EBIDTA margins going forw ard
20.0
26.0
32.0
38.0
44.0
50.0
FY08 FY09 FY10E FY11E FY12E
( %
)
EBITDA margins
Source: Company, Edelweiss research
Only normal industrymargins going forward
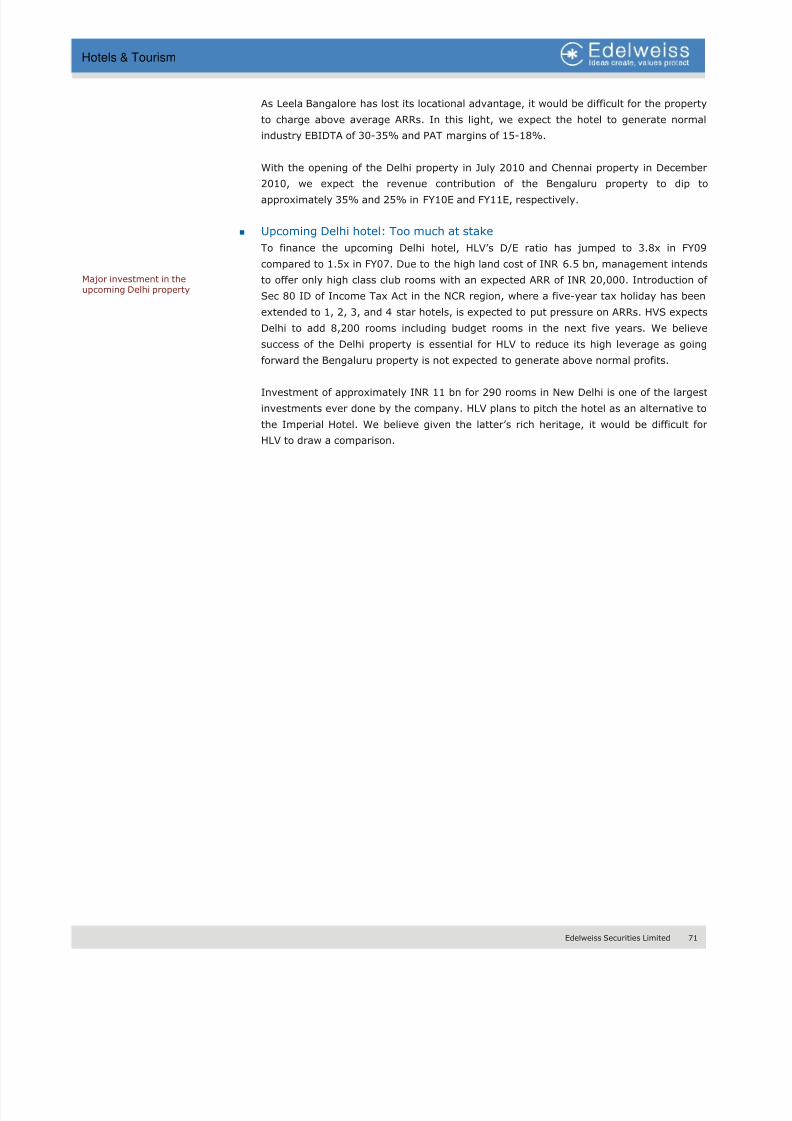
8/8/2019 Hotel and Tourism
http://slidepdf.com/reader/full/hotel-and-tourism 72/106

8/8/2019 Hotel and Tourism
http://slidepdf.com/reader/full/hotel-and-tourism 73/106
72 Edelweiss Securities Limited
Hotels & Tourism
Valuation
We have used valuation parameters like EV/EBIDTA, EV/sales, P/B, and DCF to value HLV.
The stock is currently available at 23.6x and 17.4x consolidated FY11E and FY12E
EV/EBIDTA, respectively, while its global peers are trading at 12.0x and 10.0x their FY11E
and FY12E EV/EBIDTA, respectively. At a target price of INR 25, with the hotel likely to
generate normal profits going ahead, there is no reason for it to trade at substantial premium
to other listed players.
At CMP of INR 50, HLV is currently trading at 3.4x FY11E P/B. Although it is less than its
historical P/B of 4.0x over FY06-09, we believe there is significant downside in the stock
considering the high leverage and absence of above average industry profits going forward.
We initiate coverage on the stock with a ‘REDUCE’ recommendation.
8/8/2019 Hotel and Tourism
http://slidepdf.com/reader/full/hotel-and-tourism 74/106
Edelweiss Securities Limited 73
Hotels & Tourism
Key Risks
Better-than-expected improvement in Bengaluru ARRs
Better-than-expected improvement in Bengaluru ARRs can improve the overall EBIDTA
margins substantially. ARRs similar to FY07 and FY08 can easily push the overall EBIDTAmargin beyond 40% for HLV. Considering the demand-supply economics of the city, we
believe the probability of this event is quite low.
Sale of land bank
HLV has land banks in Agra (7 acres, close to Taj Mahal), Hyderabad (4 acres), and Pune
(6 acres). Though the company plans to develop hotels on all these properties, if the
company decides to sell these land bank(s) to reduce leverage, it could ease some of the
excess leverage concerns on the company.
Sale of Chennai general office space
The company has built a 3.5 lakh sq ft office space in Chennai, adjacent to its upcoming
hotel. As of now HLV plans to lease the space, but an outright sell can fetchapproximately INR 4 bn. A sale is likely to reduce leverage concerns to some extent.
8/8/2019 Hotel and Tourism
http://slidepdf.com/reader/full/hotel-and-tourism 75/106
74 Edelweiss Securities Limited
Hotels & Tourism
Company Description
Hotel Leela Venture (HLV), a chain of luxury resorts and business hotels, operates 1,617
rooms, across six locations in India. Five properties with 1,205 rooms are owned by the
company and 409 rooms are under management contract. Compared to other hotel chains inthe country, HLV is small, but it has prominent presence in cities where it operates.
HLV has a marketing alliance with Kempinski for its properties in India. The company caters
to both business and leisure travelers. With rapid growth in room demand, the company
plans to increase presence, both through ownership and management contract routes. In
2009, HLV added its first property in Delhi through the management contract route. It also
holds land parcels in Agra, Hyderabad, and Pune, where it plans to build hotels in the future.
It is the flagship company of the Leela Group, where promoters’ holding is 55%.
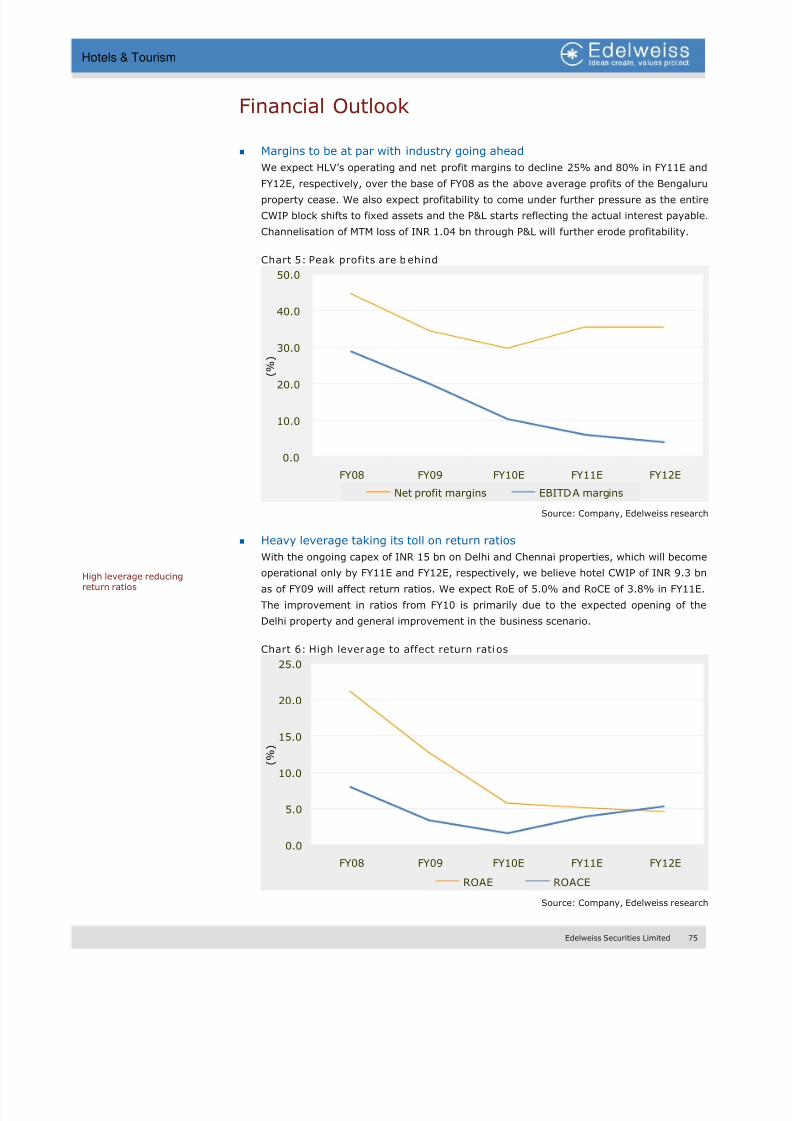
8/8/2019 Hotel and Tourism
http://slidepdf.com/reader/full/hotel-and-tourism 76/106
Edelweiss Securities Limited 75
Hotels & Tourism
Financial Outlook
Margins to be at par with industry going ahead
We expect HLV’s operating and net profit margins to decline 25% and 80% in FY11E and
FY12E, respectively, over the base of FY08 as the above average profits of the Bengaluruproperty cease. We also expect profitability to come under further pressure as the entire
CWIP block shifts to fixed assets and the P&L starts reflecting the actual interest payable.
Channelisation of MTM loss of INR 1.04 bn through P&L will further erode profitability.
Chart 5: Peak profits are behind
0.0
10.0
20.0
30.0
40.0
50.0
FY08 FY09 FY10E FY11E FY12E
( % )
Net profit margins EBITDA margins
Source: Company, Edelweiss research
Heavy leverage taking its toll on return ratios
With the ongoing capex of INR 15 bn on Delhi and Chennai properties, which will become
operational only by FY11E and FY12E, respectively, we believe hotel CWIP of INR 9.3 bn
as of FY09 will affect return ratios. We expect RoE of 5.0% and RoCE of 3.8% in FY11E.
The improvement in ratios from FY10 is primarily due to the expected opening of the
Delhi property and general improvement in the business scenario.
Chart 6: High leverage to affect return ratios
0.0
5.0
10.0
15.0
20.0
25.0
FY08 FY09 FY10E FY11E FY12E
( %
)
ROAE ROACE
Source: Company, Edelweiss research
High leverage reducingreturn ratios
8/8/2019 Hotel and Tourism
http://slidepdf.com/reader/full/hotel-and-tourism 77/106
76 Edelweiss Securities Limited
Hotels & Tourism
Negative FCF to continue till FY11
With an estimated capex of INR 5.5 bn in FY10E and FY11E, we expect FCF to remain
negative till FY11. As the cash generated from operations will not be sufficient for the
ongoing capex, we expect the D/E to remain at 3.5x in FY11E. In FY12E, as the capex
slows down, Delhi and Chennai properties become operational, and general business
environment improves, we expect a positive FCF.
Key highlights from 2009 annual report
• Hotel Leelaventure availed the option of capitalising/deferring foreign exchange
difference on long-term monetary items provided by Accounting Standard 11.
Consequently,
• Exchange loss aggregating INR 1.8 bn are added to fixed assets and would be
depreciated over the life of related assets.
• Exchange losses aggregating INR 1.1 bn are accumulated in “foreign currency
monetary translation difference account” (net of FY09 amortisation aggregating
INR 104.7 mn) and will be amortised over the next two financial years or earlier.
• Exchange gains, recognised in earlier years, aggregating INR 227.4 mn and INR112.0 mn were adjusted in fixed assets and “foreign currency monetary
translation difference account” respectively.
As a result, PAT for the year is higher by INR 2.8 bn, ~ 1.5x of reported PBT.
• Post March 2009, INR appreciated ~ 11.8% vis-à-vis the USD and a substantial
portion of the MTM losses on outstanding derivative positions and the unrealized
exchange loss on foreign currency denominated borrowings could be recouped.
• Losses on derivative positions recognised during the year aggregate INR 29.4 mn.
Provision for losses on derivative positions aggregate INE 81.5 mn (FY08: INR 78.5
mn). Derivative exposure on March 31, 2009 is not disclosed.
• Borrowings increased by INR 4.1 bn (20.0%) to INR 24.5 bn (FY08: INR 20.4 bn).
Fresh borrowings (net) aggregate INR 1.2 bn and restatement of borrowings at
depreciated INR aggregate INR 2.9 bn. ~ 59.0% of total borrowings are
denominated in foreign currency. However, debt equity ratio decreased moderated
by 90bps to 1.3x (FY08: 2.2x) due to higher equity base, courtesy revaluation of
land.
• Premium on redemption of FCCB’s and FCCB issue expenses are charged to
securities premium account. FY08 charge aggregates INR 256.3 mn (net of taxes
and redemption premium on FCCB’s bought back during the year). However, gain
(discount) on buyback of FCCB’s aggregating INR 646.4 mn, ~ 33.4% of PBT, is
recognised in the income statement.
• Freehold and leasehold land rights on properties situated in Mumbai, Bangalore, Goa
and Kovalam were revalued during the year by INR 10.3 bn. Revaluation reservesaggregate INE 12.4 bn, ~ 63.9% of net worth.
• Interest expenditure decreased 29.0% to INR 237.9 mn (FY08: INR 335.0 mn).
Borrowing cost (ex FCCB) decreased 290bps to 1.5% (FY08: 3.5%).
• Exchange gains recognised during the year aggregate INR 87.0 mn, 4.5% of
reported PBT.
• Sundry creditors increased 1.6x to INR 703.7 mn (FY08: INR 275.1 mn) due to 5.9x
increase in project related creditors aggregating INR 427.8 mn (FY08: INR 62.0
mn).
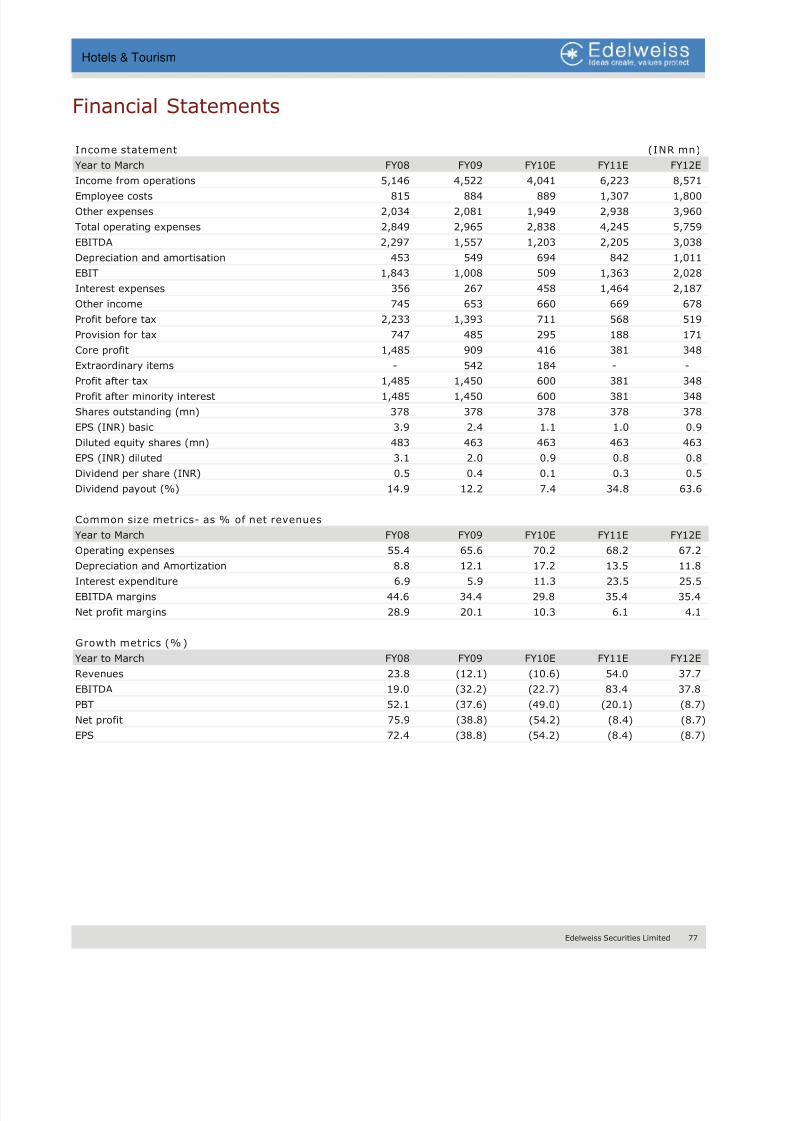
8/8/2019 Hotel and Tourism
http://slidepdf.com/reader/full/hotel-and-tourism 78/106
Edelweiss Securities Limited 77
Hotels & Tourism
Financial Statements
Income statement (INR mn)
Year to March FY08 FY09 FY10E FY11E FY12E
Income from operations 5,146 4,522 4,041 6,223 8,571
Employee costs 815 884 889 1,307 1,800
Other expenses 2,034 2,081 1,949 2,938 3,960
Total operating expenses 2,849 2,965 2,838 4,245 5,759
EBITDA 2,297 1,557 1,203 2,205 3,038
Depreciation and amortisation 453 549 694 842 1,011
EBIT 1,843 1,008 509 1,363 2,028
Interest expenses 356 267 458 1,464 2,187
Other income 745 653 660 669 678
Profit before tax 2,233 1,393 711 568 519
Provision for tax 747 485 295 188 171
Core profit 1,485 909 416 381 348
Extraordinary items - 542 184 - -
Profit after tax 1,485 1,450 600 381 348
Profit after minority interest 1,485 1,450 600 381 348
Shares outstanding (mn) 378 378 378 378 378
EPS (INR) basic 3.9 2.4 1.1 1.0 0.9
Diluted equity shares (mn) 483 463 463 463 463
EPS (INR) diluted 3.1 2.0 0.9 0.8 0.8
Dividend per share (INR) 0.5 0.4 0.1 0.3 0.5
Dividend payout (%) 14.9 12.2 7.4 34.8 63.6
Common size metrics- as % of net revenues
Year to March FY08 FY09 FY10E FY11E FY12E
Operating expenses 55.4 65.6 70.2 68.2 67.2
Depreciation and Amortization 8.8 12.1 17.2 13.5 11.8Interest expenditure 6.9 5.9 11.3 23.5 25.5
EBITDA margins 44.6 34.4 29.8 35.4 35.4
Net profit margins 28.9 20.1 10.3 6.1 4.1
Growth metrics (% )
Year to March FY08 FY09 FY10E FY11E FY12E
Revenues 23.8 (12.1) (10.6) 54.0 37.7
EBITDA 19.0 (32.2) (22.7) 83.4 37.8
PBT 52.1 (37.6) (49.0) (20.1) (8.7)
Net profit 75.9 (38.8) (54.2) (8.4) (8.7)
EPS 72.4 (38.8) (54.2) (8.4) (8.7)
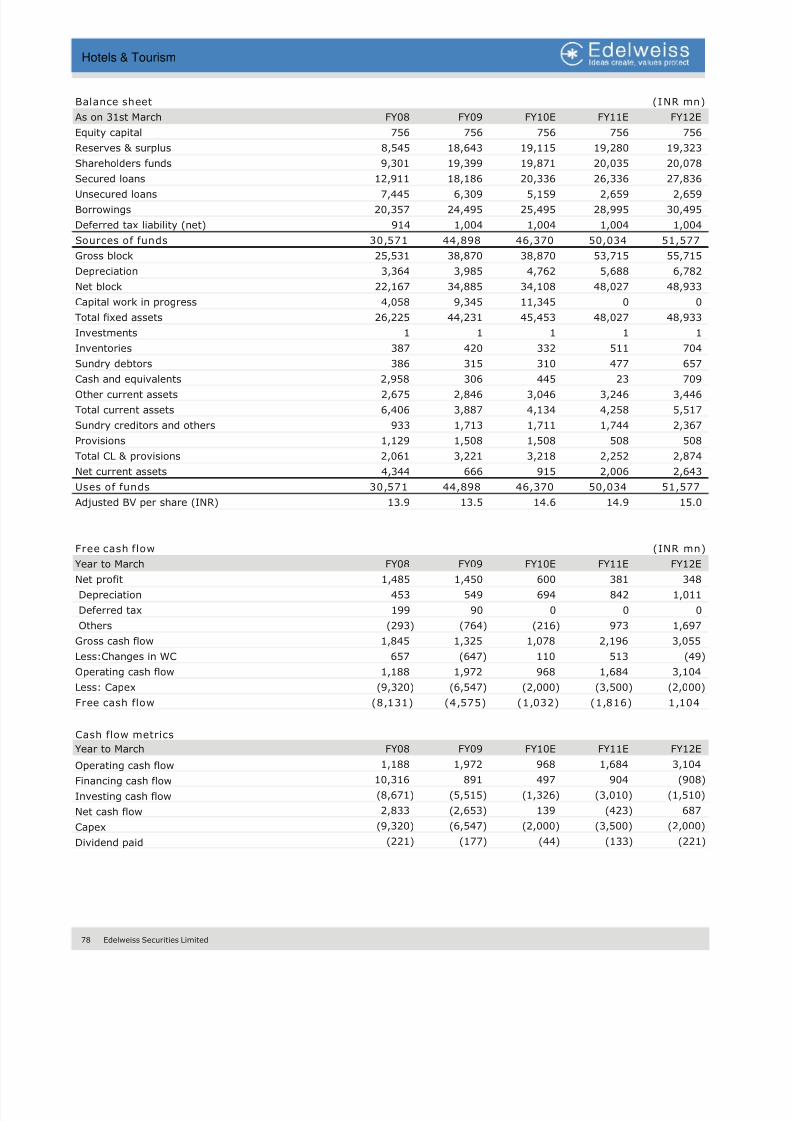
8/8/2019 Hotel and Tourism
http://slidepdf.com/reader/full/hotel-and-tourism 79/106
78 Edelweiss Securities Limited
Hotels & Tourism
Balance sheet (INR mn)
As on 31st March FY08 FY09 FY10E FY11E FY12E
Equity capital 756 756 756 756 756
Reserves & surplus 8,545 18,643 19,115 19,280 19,323
Shareholders funds 9,301 19,399 19,871 20,035 20,078
Secured loans 12,911 18,186 20,336 26,336 27,836
Unsecured loans 7,445 6,309 5,159 2,659 2,659
Borrowings 20,357 24,495 25,495 28,995 30,495
Deferred tax liability (net) 914 1,004 1,004 1,004 1,004
Sources of funds 30,571 44,898 46,370 50,034 51,577
Gross block 25,531 38,870 38,870 53,715 55,715
Depreciation 3,364 3,985 4,762 5,688 6,782
Net block 22,167 34,885 34,108 48,027 48,933
Capital work in progress 4,058 9,345 11,345 0 0
Total fixed assets 26,225 44,231 45,453 48,027 48,933
Investments 1 1 1 1 1
Inventories 387 420 332 511 704
Sundry debtors 386 315 310 477 657
Cash and equivalents 2,958 306 445 23 709
Other current assets 2,675 2,846 3,046 3,246 3,446
Total current assets 6,406 3,887 4,134 4,258 5,517
Sundry creditors and others 933 1,713 1,711 1,744 2,367
Provisions 1,129 1,508 1,508 508 508
Total CL & provisions 2,061 3,221 3,218 2,252 2,874
Net current assets 4,344 666 915 2,006 2,643
Uses of funds 30,571 44,898 46,370 50,034 51,577
Adjusted BV per share (INR) 13.9 13.5 14.6 14.9 15.0
Free cash flow (INR mn)
Year to March FY08 FY09 FY10E FY11E FY12ENet profit 1,485 1,450 600 381 348
Depreciation 453 549 694 842 1,011
Deferred tax 199 90 0 0 0
Others (293) (764) (216) 973 1,697
Gross cash flow 1,845 1,325 1,078 2,196 3,055
Less:Changes in WC 657 (647) 110 513 (49)
Operating cash flow 1,188 1,972 968 1,684 3,104
Less: Capex (9,320) (6,547) (2,000) (3,500) (2,000)
Free cash flow (8,131) (4,575) (1,032) (1,816) 1,104
Cash flow metrics
Year to March FY08 FY09 FY10E FY11E FY12EOperating cash flow 1,188 1,972 968 1,684 3,104
Financing cash flow 10,316 891 497 904 (908)
Investing cash flow (8,671) (5,515) (1,326) (3,010) (1,510)
Net cash flow 2,833 (2,653) 139 (423) 687
Capex (9,320) (6,547) (2,000) (3,500) (2,000)
Dividend paid (221) (177) (44) (133) (221)
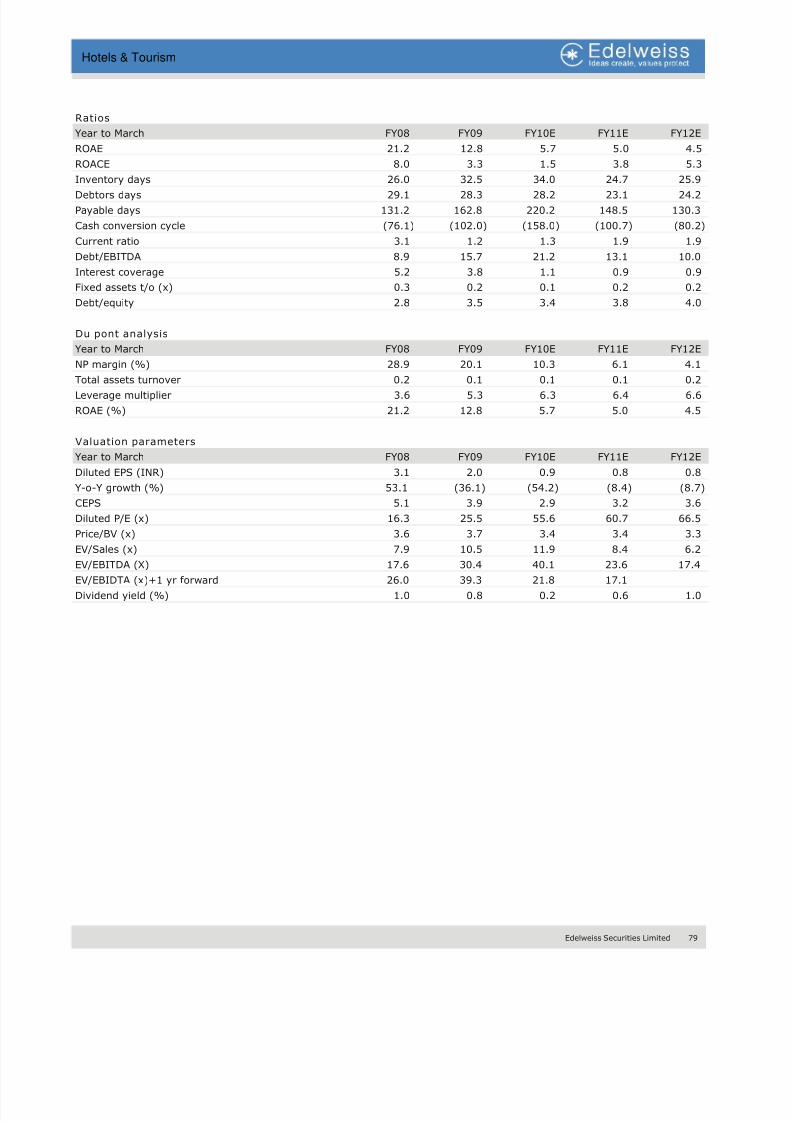
8/8/2019 Hotel and Tourism
http://slidepdf.com/reader/full/hotel-and-tourism 80/106
Edelweiss Securities Limited 79
Hotels & Tourism
Ratios
Year to March FY08 FY09 FY10E FY11E FY12E
ROAE 21.2 12.8 5.7 5.0 4.5
ROACE 8.0 3.3 1.5 3.8 5.3
Inventory days 26.0 32.5 34.0 24.7 25.9
Debtors days 29.1 28.3 28.2 23.1 24.2
Payable days 131.2 162.8 220.2 148.5 130.3
Cash conversion cycle (76.1) (102.0) (158.0) (100.7) (80.2)
Current ratio 3.1 1.2 1.3 1.9 1.9
Debt/EBITDA 8.9 15.7 21.2 13.1 10.0
Interest coverage 5.2 3.8 1.1 0.9 0.9
Fixed assets t/o (x) 0.3 0.2 0.1 0.2 0.2
Debt/equity 2.8 3.5 3.4 3.8 4.0
Du pont analysis
Year to March FY08 FY09 FY10E FY11E FY12E
NP margin (%) 28.9 20.1 10.3 6.1 4.1
Total assets turnover 0.2 0.1 0.1 0.1 0.2
Leverage multiplier 3.6 5.3 6.3 6.4 6.6
ROAE (%) 21.2 12.8 5.7 5.0 4.5
Valuation parameters
Year to March FY08 FY09 FY10E FY11E FY12E
Diluted EPS (INR) 3.1 2.0 0.9 0.8 0.8
Y-o-Y growth (%) 53.1 (36.1) (54.2) (8.4) (8.7)
CEPS 5.1 3.9 2.9 3.2 3.6
Diluted P/E (x) 16.3 25.5 55.6 60.7 66.5
Price/BV (x) 3.6 3.7 3.4 3.4 3.3
EV/Sales (x) 7.9 10.5 11.9 8.4 6.2
EV/EBITDA (X) 17.6 30.4 40.1 23.6 17.4EV/EBIDTA (x)+1 yr forward 26.0 39.3 21.8 17.1
Dividend yield (%) 1.0 0.8 0.2 0.6 1.0

8/8/2019 Hotel and Tourism
http://slidepdf.com/reader/full/hotel-and-tourism 81/106
80 Edelweiss Securities Limited
Hotels & Tourism
THIS PAGE IS INTENTIONALLY LEFT BLANK
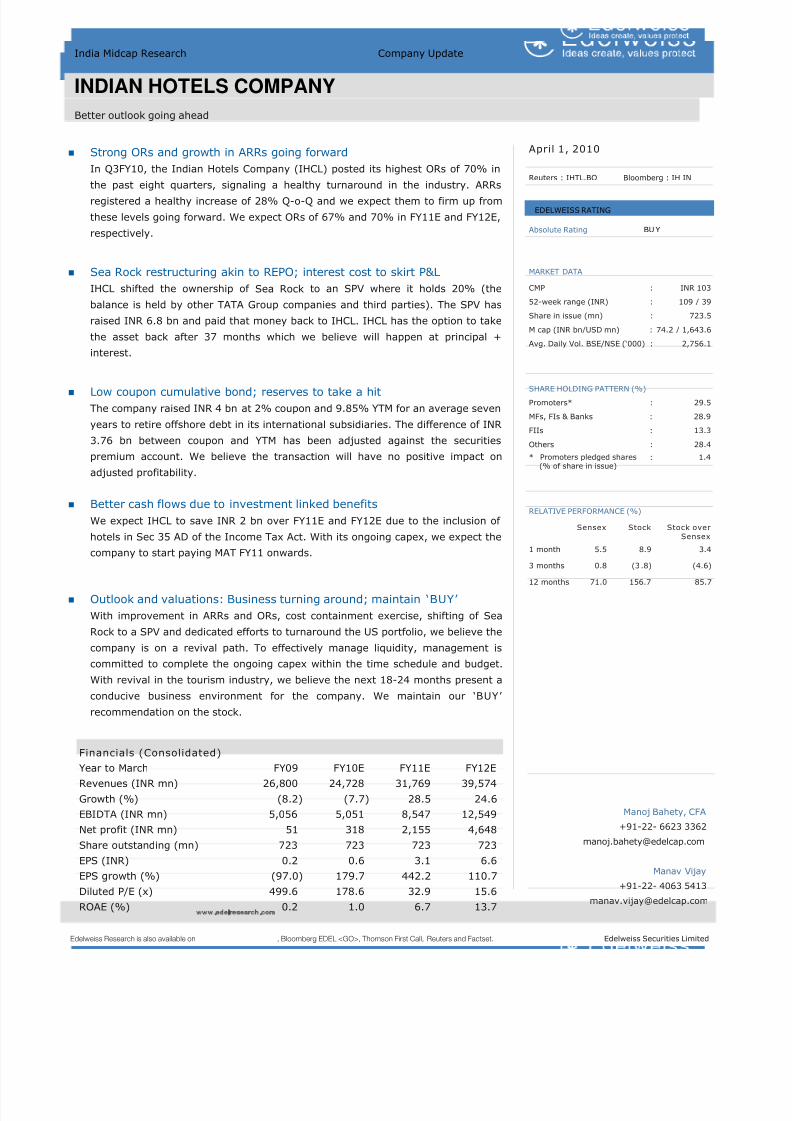
8/8/2019 Hotel and Tourism
http://slidepdf.com/reader/full/hotel-and-tourism 82/106
Edelweiss Securities Limited 81
Hotels & Tourism
Strong ORs and growth in ARRs going forward
In Q3FY10, the Indian Hotels Company (IHCL) posted its highest ORs of 70% in
the past eight quarters, signaling a healthy turnaround in the industry. ARRsregistered a healthy increase of 28% Q-o-Q and we expect them to firm up from
these levels going forward. We expect ORs of 67% and 70% in FY11E and FY12E,
respectively.
Sea Rock restructuring akin to REPO; interest cost to skirt P&L
IHCL shifted the ownership of Sea Rock to an SPV where it holds 20% (the
balance is held by other TATA Group companies and third parties). The SPV has
raised INR 6.8 bn and paid that money back to IHCL. IHCL has the option to take
the asset back after 37 months which we believe will happen at principal +
interest.
Low coupon cumulative bond; reserves to take a hit
The company raised INR 4 bn at 2% coupon and 9.85% YTM for an average seven
years to retire offshore debt in its international subsidiaries. The difference of INR
3.76 bn between coupon and YTM has been adjusted against the securities
premium account. We believe the transaction will have no positive impact on
adjusted profitability.
Better cash flows due to investment linked benefits
We expect IHCL to save INR 2 bn over FY11E and FY12E due to the inclusion of
hotels in Sec 35 AD of the Income Tax Act. With its ongoing capex, we expect the
company to start paying MAT FY11 onwards.
Outlook and valuations: Business turning around; maintain ‘BUY’
With improvement in ARRs and ORs, cost containment exercise, shifting of Sea
Rock to a SPV and dedicated efforts to turnaround the US portfolio, we believe the
company is on a revival path. To effectively manage liquidity, management is
committed to complete the ongoing capex within the time schedule and budget.
With revival in the tourism industry, we believe the next 18-24 months present a
conducive business environment for the company. We maintain our ‘BUY’
recommendation on the stock.
Edelweiss Research is also available on www.edelresearch.com, Bloomberg EDEL <GO>, Thomson First Call, Reuters and Factset. Edelweiss Securities Limited
India Midcap Research Company Update
INDIAN HOTELS COMPANY
Better outlook going ahead
April 1, 2010
Reuters : IHTL.BO Bloomberg : IH IN
Absolute Rating BUY
MARKET DATA CMP : INR 103
52-week range (INR) : 109 / 39
Share in issue (mn) : 723.5
M cap (INR bn/USD mn) : 74.2 / 1,643.6
Avg. Daily Vol. BSE/NSE (‘000) : 2,756.1
SHARE HOLDING PATTERN (%)
Promoters* : 29.5
MFs, FIs & Banks : 28.9
FIIs : 13.3
Others : 28.4
* Promoters pledged shares : 1.4(% of share in issue)
RELATIVE PERFORMANCE (%)
Sensex Stock Stock over
Sensex
1 month 5.5 8.9 3.4
3 months 0.8 (3.8) (4.6)
12 months 71.0 156.7 85.7
Manoj Bahety, CFA
+91-22- 6623 3362
Manav Vijay
+91-22- 4063 5413
EDELWEISS RATING
Financials (Consolidated)Year to March FY09 FY10E FY11E FY12E
Revenues (INR mn) 26,800 24,728 31,769 39,574
Growth (%) (8.2) (7.7) 28.5 24.6
EBIDTA (INR mn) 5,056 5,051 8,547 12,549
Net profit (INR mn) 51 318 2,155 4,648
Share outstanding (mn) 723 723 723 723
EPS (INR) 0.2 0.6 3.1 6.6
EPS growth (%) (97.0) 179.7 442.2 110.7
Diluted P/E (x) 499.6 178.6 32.9 15.6
ROAE (%) 0.2 1.0 6.7 13.7
8/8/2019 Hotel and Tourism
http://slidepdf.com/reader/full/hotel-and-tourism 83/106
82 Edelweiss Securities Limited
Hotels & Tourism
Sea Rock restructuring akin to REPO; interest cost to skirt P&L
To manage the current liquidity crisis in the company, IHCL shifted the Sea Rock
property to an independent SPV where it holds 20%; the balance 80% is held by other
TATA Group companies and third parties. The SPV has raised INR 6.8 bn zero coupon
money on the strength of its assets and paid that money back to IHCL. IHCL has the
option to take the asset back after 37 months. Although, the stated transaction will get
the interest liability down for the next 37 months, it just pushes back the liability without
actually reducing it.
Low coupon cumulative bonds: Reserves to take a hit
IHCL raised INR 4 bn at 2% coupon and 9.5% YTM for an average period of seven years,
to pay off the debt of its international subsidiaries. The company plans to add another
INR 3 bn in March 2010 with similar terms. These funds are being utilised to retire USD
95 mn of Samsara Properties (Orient Express stake) and USD 90 mn of IHMS US (for the
Boston and NYC property). The premium on redemption of INR 4 bn debenture has been
adjusted against the securities premium account. Our analysis suggests that with this
transaction, the debt/equity for FY10E will increase to 1.8x from the current 1.5x. The
aforesaid accounting practice will result in keeping yearly interest cost of ~ INR 500 mn
off P&L and, hence, will result in higher reported profits (no impact on adjusted profits).
Better cash flows due to investment linked benefits
In 2010 budget, hotels have been included in Sec 35 AD of the Income Tax Act where
investment linked benefits have been extended for any new hotel coming up anywhere in
India. We expect IHCL to save approximately INR 2 bn over FY11E and FY12E due to its
ongoing capex. We expect the company to pay MAT due to the heavy ongoing capex.
8/8/2019 Hotel and Tourism
http://slidepdf.com/reader/full/hotel-and-tourism 84/106
Edelweiss Securities Limited 83
Hotels & Tourism
Company Description
IHCL is the largest hotel operator in India with presence in luxury, business and leisure
hotel segments. The company manages 12,243 (103 properties) across India and
international locations. It has also entered into the budget hotel segment with a new
brand, ‘Ginger’ and has also gone into the adventure business with wildlife lodges. IHCL
also runs airline catering business under the brand of Taj SATS, which contributes 6-7%
to total sales. The company has aggressive expansion plans, both in India and abroad by
using ownership and asset light model of management contract.
Investment Theme
With the revival of ARRs and ORs across India, the hotel industry is looking for better
times ahead. With India emerging as one of the fastest growing economy, FTAs of both
business and leisure are expected to pick up. Domestic tourism is also on a great revival
path and with more Indians ready to take holidays, the segment is expected to perform
well in the years to come. We expect IHCL’s Indian portfolio (almost 80% of total sales)
to post healthy growth with the revival of domestic ARRs and ORs. We also expect
international operations to turnaround and start contributing significantly to overall
margins.
Key Risks
Economic slowdown is the biggest risk for the company as travel and tourism takes the
first knock in uncertain times. Unexpected events like terrorist attack or swine flu also
affect the industry badly as many countries advise their citizens against traveling to
affected regions. The company can continue to earn negative returns on its international
investments due to longer-than-expected turnaround of international operations and the
stake of Orient Express.
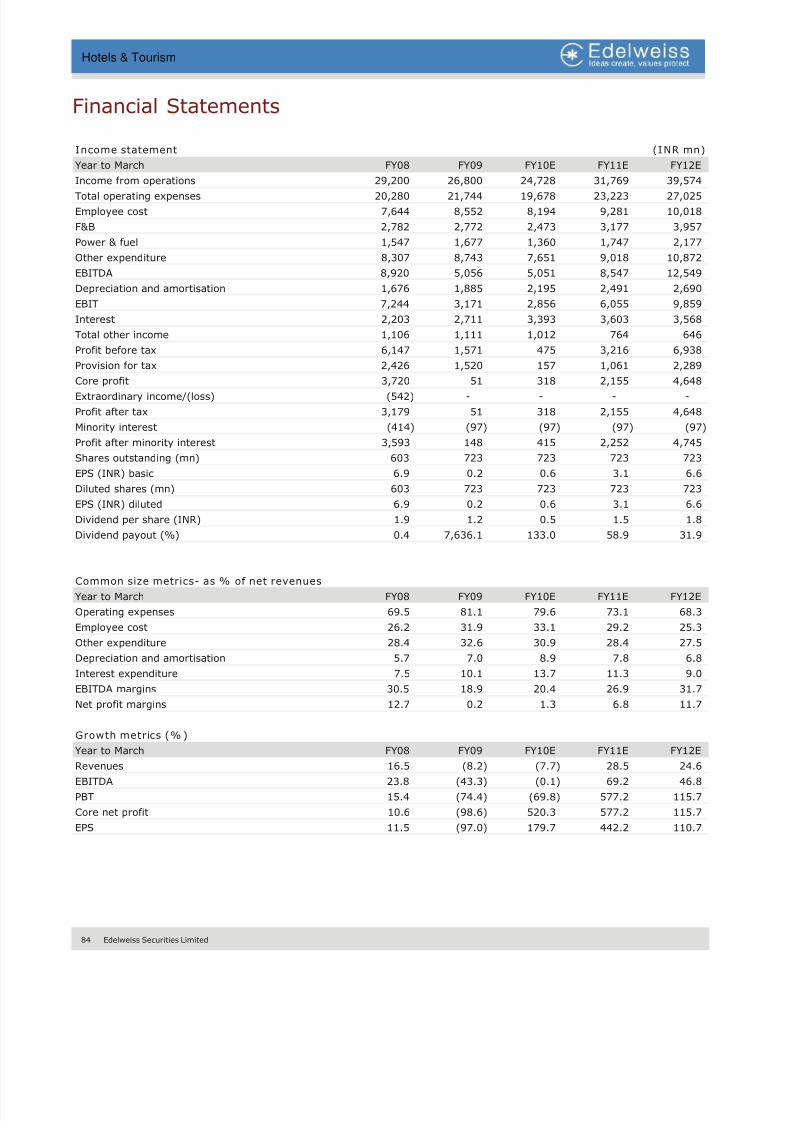
8/8/2019 Hotel and Tourism
http://slidepdf.com/reader/full/hotel-and-tourism 85/106
84 Edelweiss Securities Limited
Hotels & Tourism
Financial Statements
Income statement (INR mn)
Year to March FY08 FY09 FY10E FY11E FY12E
Income from operations 29,200 26,800 24,728 31,769 39,574
Total operating expenses 20,280 21,744 19,678 23,223 27,025
Employee cost 7,644 8,552 8,194 9,281 10,018
F&B 2,782 2,772 2,473 3,177 3,957
Power & fuel 1,547 1,677 1,360 1,747 2,177
Other expenditure 8,307 8,743 7,651 9,018 10,872
EBITDA 8,920 5,056 5,051 8,547 12,549
Depreciation and amortisation 1,676 1,885 2,195 2,491 2,690
EBIT 7,244 3,171 2,856 6,055 9,859
Interest 2,203 2,711 3,393 3,603 3,568
Total other income 1,106 1,111 1,012 764 646
Profit before tax 6,147 1,571 475 3,216 6,938
Provision for tax 2,426 1,520 157 1,061 2,289
Core profit 3,720 51 318 2,155 4,648
Extraordinary income/(loss) (542) - - - -
Profit after tax 3,179 51 318 2,155 4,648
Minority interest (414) (97) (97) (97) (97)
Profit after minority interest 3,593 148 415 2,252 4,745
Shares outstanding (mn) 603 723 723 723 723
EPS (INR) basic 6.9 0.2 0.6 3.1 6.6
Diluted shares (mn) 603 723 723 723 723
EPS (INR) diluted 6.9 0.2 0.6 3.1 6.6
Dividend per share (INR) 1.9 1.2 0.5 1.5 1.8
Dividend payout (%) 0.4 7,636.1 133.0 58.9 31.9
Common size metrics- as % of net revenues
Year to March FY08 FY09 FY10E FY11E FY12E
Operating expenses 69.5 81.1 79.6 73.1 68.3
Employee cost 26.2 31.9 33.1 29.2 25.3
Other expenditure 28.4 32.6 30.9 28.4 27.5
Depreciation and amortisation 5.7 7.0 8.9 7.8 6.8
Interest expenditure 7.5 10.1 13.7 11.3 9.0
EBITDA margins 30.5 18.9 20.4 26.9 31.7
Net profit margins 12.7 0.2 1.3 6.8 11.7
Growth metrics (% )
Year to March FY08 FY09 FY10E FY11E FY12ERevenues 16.5 (8.2) (7.7) 28.5 24.6
EBITDA 23.8 (43.3) (0.1) 69.2 46.8
PBT 15.4 (74.4) (69.8) 577.2 115.7
Core net profit 10.6 (98.6) 520.3 577.2 115.7
EPS 11.5 (97.0) 179.7 442.2 110.7
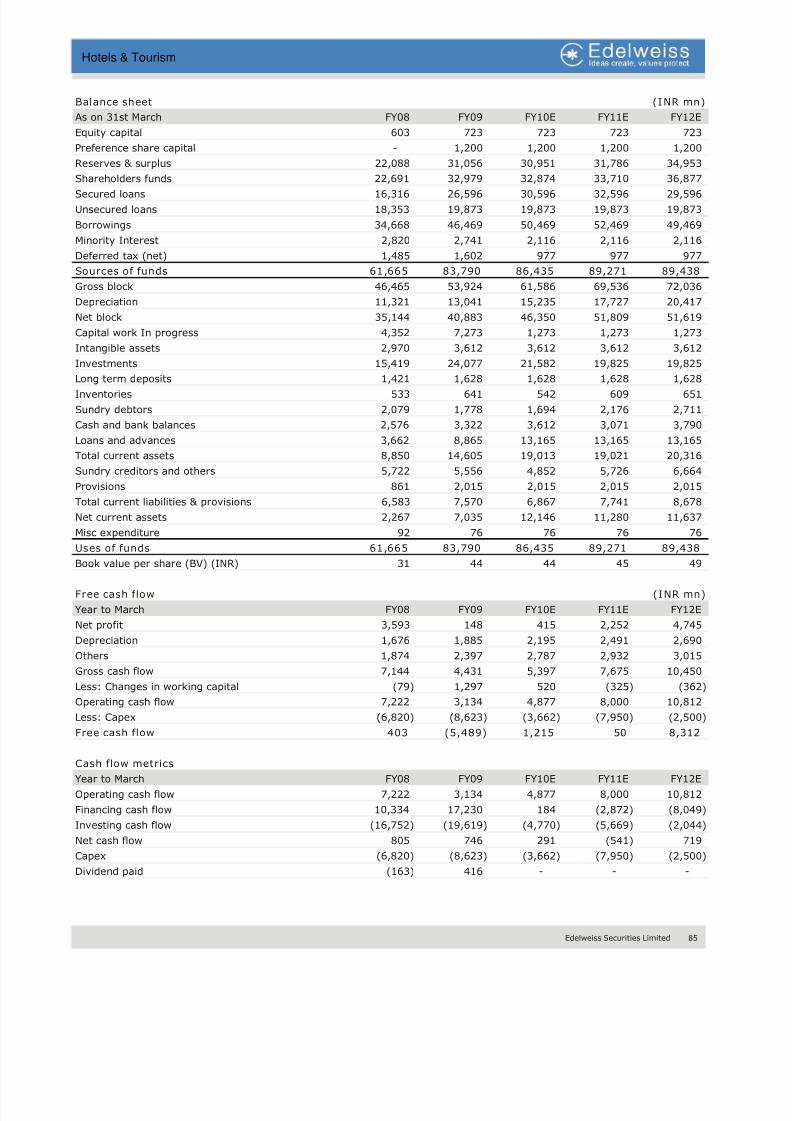
8/8/2019 Hotel and Tourism
http://slidepdf.com/reader/full/hotel-and-tourism 86/106
Edelweiss Securities Limited 85
Hotels & Tourism
Balance sheet (INR mn)
As on 31st March FY08 FY09 FY10E FY11E FY12E
Equity capital 603 723 723 723 723
Preference share capital - 1,200 1,200 1,200 1,200
Reserves & surplus 22,088 31,056 30,951 31,786 34,953
Shareholders funds 22,691 32,979 32,874 33,710 36,877
Secured loans 16,316 26,596 30,596 32,596 29,596
Unsecured loans 18,353 19,873 19,873 19,873 19,873
Borrowings 34,668 46,469 50,469 52,469 49,469
Minority Interest 2,820 2,741 2,116 2,116 2,116
Deferred tax (net) 1,485 1,602 977 977 977
Sources of funds 61,665 83,790 86,435 89,271 89,438
Gross block 46,465 53,924 61,586 69,536 72,036
Depreciation 11,321 13,041 15,235 17,727 20,417
Net block 35,144 40,883 46,350 51,809 51,619
Capital work In progress 4,352 7,273 1,273 1,273 1,273
Intangible assets 2,970 3,612 3,612 3,612 3,612
Investments 15,419 24,077 21,582 19,825 19,825
Long term deposits 1,421 1,628 1,628 1,628 1,628 Inventories 533 641 542 609 651
Sundry debtors 2,079 1,778 1,694 2,176 2,711
Cash and bank balances 2,576 3,322 3,612 3,071 3,790
Loans and advances 3,662 8,865 13,165 13,165 13,165
Total current assets 8,850 14,605 19,013 19,021 20,316
Sundry creditors and others 5,722 5,556 4,852 5,726 6,664
Provisions 861 2,015 2,015 2,015 2,015
Total current liabilities & provisions 6,583 7,570 6,867 7,741 8,678
Net current assets 2,267 7,035 12,146 11,280 11,637
Misc expenditure 92 76 76 76 76
Uses of funds 61,665 83,790 86,435 89,271 89,438
Book value per share (BV) (INR) 31 44 44 45 49
Free cash flow (INR mn)
Year to March FY08 FY09 FY10E FY11E FY12E
Net profit 3,593 148 415 2,252 4,745
Depreciation 1,676 1,885 2,195 2,491 2,690
Others 1,874 2,397 2,787 2,932 3,015
Gross cash flow 7,144 4,431 5,397 7,675 10,450
Less: Changes in working capital (79) 1,297 520 (325) (362)
Operating cash flow 7,222 3,134 4,877 8,000 10,812
Less: Capex (6,820) (8,623) (3,662) (7,950) (2,500)
Free cash flow 403 (5,489) 1,215 50 8,312
Cash flow metrics
Year to March FY08 FY09 FY10E FY11E FY12E
Operating cash flow 7,222 3,134 4,877 8,000 10,812
Financing cash flow 10,334 17,230 184 (2,872) (8,049)
Investing cash flow (16,752) (19,619) (4,770) (5,669) (2,044)
Net cash flow 805 746 291 (541) 719
Capex (6,820) (8,623) (3,662) (7,950) (2,500)
Dividend paid (163) 416 - - -

8/8/2019 Hotel and Tourism
http://slidepdf.com/reader/full/hotel-and-tourism 87/106
86 Edelweiss Securities Limited
Hotels & Tourism
Ratios
Year to March FY08 FY09 FY10E FY11E FY12E
ROAE (%) 17.1 0.2 1.0 6.7 13.7
ROACE (%) 16.7 6.0 4.6 9.0 14.2
Inventory (days) 6 8 9 7 6
Debtors (days) 26 26 26 22 23
Payable (days) 93 95 97 83 84
Cash conversion cycle (61) (60) (62) (54) (55)
Current ratio 1.3 1.9 2.8 2.5 2.3
Debt/EBITDA 3.9 9.2 10.0 6.1 3.9
Interest cover (x) 3.3 1.2 0.8 1.7 2.8
Fixed assets turnover (x) 0.8 0.7 0.5 0.6 0.8
Total asset turnover (x) 0.5 0.4 0.3 0.4 0.4
Equity turnover(x) 1.3 1.0 0.8 1.0 1.2
Debt/Equity (x) 1.5 1.4 1.5 1.6 1.3
Adjusted debt/Equity 1.5 1.4 1.5 1.6 1.3
Du pont analysis
Year to March FY08 FY09 FY10E FY11E FY12E
NP margin (%) 12.7 0.2 1.3 6.8 11.7
Total assets turnover 0.5 0.4 0.3 0.4 0.4
Leverage multiplier 2.5 2.7 2.7 2.7 2.6
ROAE (%) 17.1 0.2 1.0 6.7 13.7
Valuation parameters
Year to March FY08 FY09 FY10E FY11E FY12E
Diluted EPS (INR) 6.9 0.2 0.6 3.1 6.6
Y-o-Y growth (%) 11.5 (97.0) 179.7 442.2 110.7
CEPS (INR) 8.0 2.8 3.6 6.6 10.3
Diluted P/E (x) 15.0 499.6 178.6 32.9 15.6
Price/BV(x) 3.3 2.3 2.3 2.3 2.1 EV/Sales (x) 2.7 3.5 4.0 3.3 2.5
EV/EBITDA (x) 8.8 18.4 19.7 12.1 8.0
EV/EBITDA (x)+1 yr forward 15.5 18.5 11.6 8.3 6.6
Dividend yield (%) 1.9 1.2 0.5 1.5 1.7
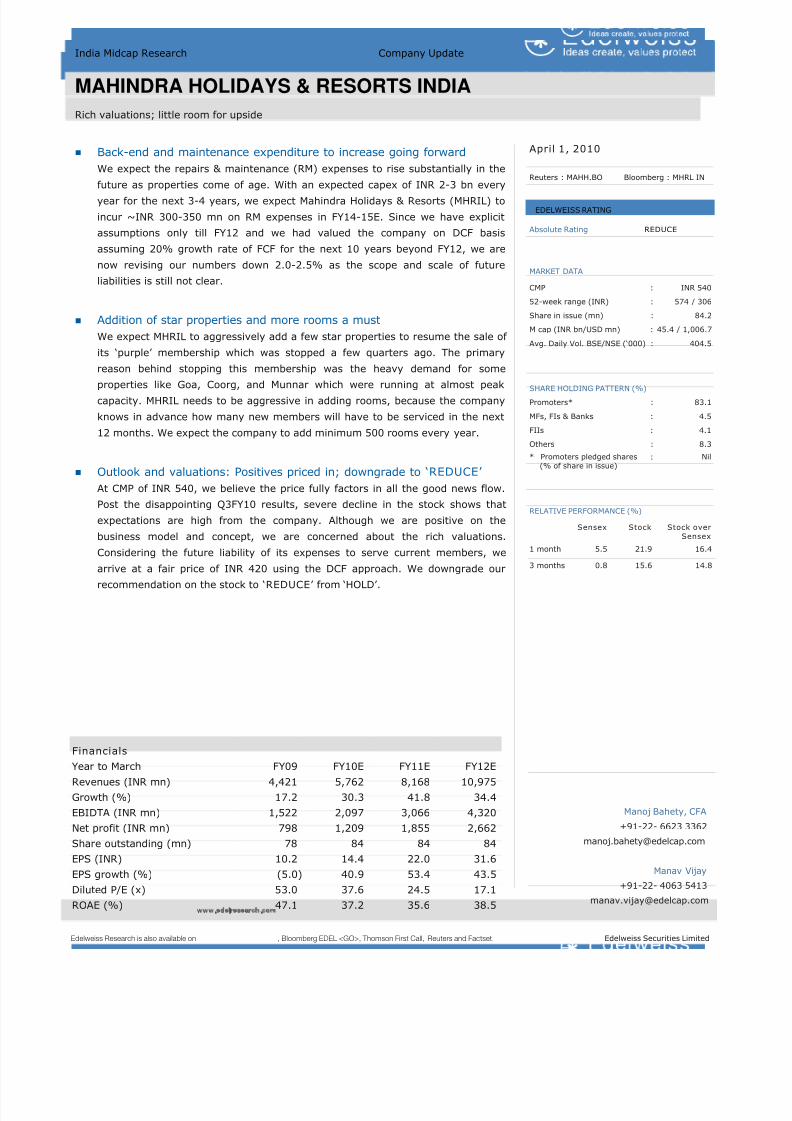
8/8/2019 Hotel and Tourism
http://slidepdf.com/reader/full/hotel-and-tourism 88/106
Edelweiss Securities Limited 87
Hotels & Tourism
Back-end and maintenance expenditure to increase going forward
We expect the repairs & maintenance (RM) expenses to rise substantially in the
future as properties come of age. With an expected capex of INR 2-3 bn everyyear for the next 3-4 years, we expect Mahindra Holidays & Resorts (MHRIL) to
incur ~INR 300-350 mn on RM expenses in FY14-15E. Since we have explicit
assumptions only till FY12 and we had valued the company on DCF basis
assuming 20% growth rate of FCF for the next 10 years beyond FY12, we are
now revising our numbers down 2.0-2.5% as the scope and scale of future
liabilities is still not clear.
Addition of star properties and more rooms a must
We expect MHRIL to aggressively add a few star properties to resume the sale of
its ‘purple’ membership which was stopped a few quarters ago. The primary
reason behind stopping this membership was the heavy demand for some
properties like Goa, Coorg, and Munnar which were running at almost peak
capacity. MHRIL needs to be aggressive in adding rooms, because the company
knows in advance how many new members will have to be serviced in the next
12 months. We expect the company to add minimum 500 rooms every year.
Outlook and valuations: Positives priced in; downgrade to ‘REDUCE’
At CMP of INR 540, we believe the price fully factors in all the good news flow.
Post the disappointing Q3FY10 results, severe decline in the stock shows that
expectations are high from the company. Although we are positive on the
business model and concept, we are concerned about the rich valuations.
Considering the future liability of its expenses to serve current members, we
arrive at a fair price of INR 420 using the DCF approach. We downgrade our
recommendation on the stock to ‘REDUCE’ from ‘HOLD’.
Edelweiss Research is also available on www.edelresearch.com, Bloomberg EDEL <GO>, Thomson First Call, Reuters and Factset. Edelweiss Securities Limited
India Midcap Research Company Update
MAHINDRA HOLIDAYS & RESORTS INDIA
Rich valuations; little room for upside
April 1, 2010
Reuters : MAHH.BO Bloomberg : MHRL IN
Absolute Rating REDUCE
MARKET DATA CMP : INR 540
52-week range (INR) : 574 / 306
Share in issue (mn) : 84.2
M cap (INR bn/USD mn) : 45.4 / 1,006.7
Avg. Daily Vol. BSE/NSE (‘000) : 404.5
SHARE HOLDING PATTERN (%)
Promoters* : 83.1
MFs, FIs & Banks : 4.5
FIIs : 4.1
Others : 8.3
* Promoters pledged shares : Nil
(% of share in issue)
RELATIVE PERFORMANCE (%)
Sensex Stock Stock over
Sensex
1 month 5.5 21.9 16.4
3 months 0.8 15.6 14.8
Manoj Bahety, CFA
+91-22- 6623 3362
Manav Vijay
+91-22- 4063 5413
EDELWEISS RATING
FinancialsYear to March FY09 FY10E FY11E FY12E
Revenues (INR mn) 4,421 5,762 8,168 10,975
Growth (%) 17.2 30.3 41.8 34.4
EBIDTA (INR mn) 1,522 2,097 3,066 4,320
Net profit (INR mn) 798 1,209 1,855 2,662
Share outstanding (mn) 78 84 84 84
EPS (INR) 10.2 14.4 22.0 31.6
EPS growth (%) (5.0) 40.9 53.4 43.5
Diluted P/E (x) 53.0 37.6 24.5 17.1
ROAE (%) 47.1 37.2 35.6 38.5
8/8/2019 Hotel and Tourism
http://slidepdf.com/reader/full/hotel-and-tourism 89/106
88 Edelweiss Securities Limited
Hotels & Tourism
Back-end and maintenance expenditure to increase going forward
We expect the RM expenses to rise substantially in the future as the properties come of
age. With an expected capex of INR 2-3 bn every year for the next 3-4 years, MHRIL is
likely to incur ~INR 300-350 mn RM expenses in FY14-15E, similar to a hotel company.
Since we have explicit assumptions only till FY12 and have valued the company on DCF
basis assuming 20% growth rate of FCF for the next 10 years beyond FY12E, we are now
revising our numbers down 1.0-1.5% as the scope and scale of future liabilities is still
unclear.
In FY09, on total GFA of INR 4.3 bn, the company incurred INR 100 mn on RM, which we
believe is not the correct representation of future as we expect expenses to rise as old
properties start needing more maintenance work. We believe rise in back-end expenses
to serve the existing members, together with higher maintenance expenditure, will
reduce FCFF growth assumption by ~3%.
Based on the reasons mentioned above, we are reducing our FCF growth rate to 17%
from 20% earlier beyond FY12E for 10 years. The current cash flow fully recognizes the
company’s cash collection procedure without putting due emphasis on expenses which
are back ended.
Our revised DCF assumption considers 25% growth in membership and 7% increase in
membership fee for FY11 and FY12, followed by 17% growth in FCFF for the next 10
years beyond FY12E and 5% terminal growth rate. We have considered WACC of 12.7%.
We believe there is little scope for positive surprise to the above assumptions.
Revenue recognition method to lead to income expenditure mismatch
Membership fee comprises non-refundable admission fee (60% of membership fees) and
entitlement fee (40% of membership fees) which is refundable. While MHRIL recognises
the entire admission fees as current year’s revenues, entitlement fee is recognised
linearly over the balance period of membership.
As MHRIL recognises significant portion of membership fee upfront, we believe 40% of membership fees will not be sufficient for servicing existing members for the next 24
years, leading to an income expenditure mismatch. Although the company charges its
members an AMC which is indexed to the Urban Consumer Price Index published by RBI,
we believe this income will be inadequate to meet future expenses of existing members.
As the company is just 12-13 years old and has attained size in the past 4-5 years, as
the number of members grows, the liability of servicing them will also grow manifold.
Addition of star properties and more rooms a must
We expect MHRIL to aggressively add properties along with some star properties, to
resume the sale of its purple membership which had been stopped a few quarters ago.
The primary reason for stopping them was the heavy demand for some of the properties
like Goa, Coorg, and Munnar which were running at almost peak capacity. We believe
with its cash flows, MHRIL needs to be aggressive in adding rooms, more so because it
knows in advance how many new members will have to be serviced in the next 12
months. We expect the company to add minimum 500 rooms every year for 25%
membership growth.
Owing to the heavy rush at the most popular properties, members often complain of
non-availability of rooms during the desired period. We believe the company, in its
attempt to sell memberships, has actually oversold higher class memberships. As almost
33% of its members come from referrals, we believe this number could be at a serious
risk if this problem is not addressed early.
Growth in back endedexpenditure to hit the
profitability in later years

8/8/2019 Hotel and Tourism
http://slidepdf.com/reader/full/hotel-and-tourism 90/106

8/8/2019 Hotel and Tourism
http://slidepdf.com/reader/full/hotel-and-tourism 91/106
90 Edelweiss Securities Limited
Hotels & Tourism
Company Description
MHRIL was started in 1997 and offers a unique vacation ownership model to Indian
consumers with resorts spread across India. The company has different schemes for
families, singles and corporates. With almost 100,000 members spread across different
membership schemes, the company uses the upfront membership fee charged from
members to build resorts. With its resorts located across India, the company plans to
aggressively expand its reach both in terms of members and new resorts.
Investment Theme
With its unique business model, although MHRIL is in a sweet spot to exploit the growth
in the Indian travel & tourism sector, but we are concerned with the accounting
treatment of the income and expenditure done by the company. We believe with its
aggressive income recognition principle, the future expenses to serve the existing
members is not getting properly accounted. Due to the limited history of its operations,
we believe only 5-10 years down the line we will have the visibility of its full scale
expenses.
We are not assigning any value to the change in valuations once the cycle of 25 years of
membership ends as the same resorts can again be re-used for new members
considering the resorts would also be attracting lumpy capex which we have not taken in
our assumptions.
Key Risks
Launching new schemes, restart to sell the Purple membership, increase in overall
average membership fee are some of the factors that could provide risk to our estimates.
Settlement of ongoing Munnar property and IT dispute can also provide upside risk to
our estimates.
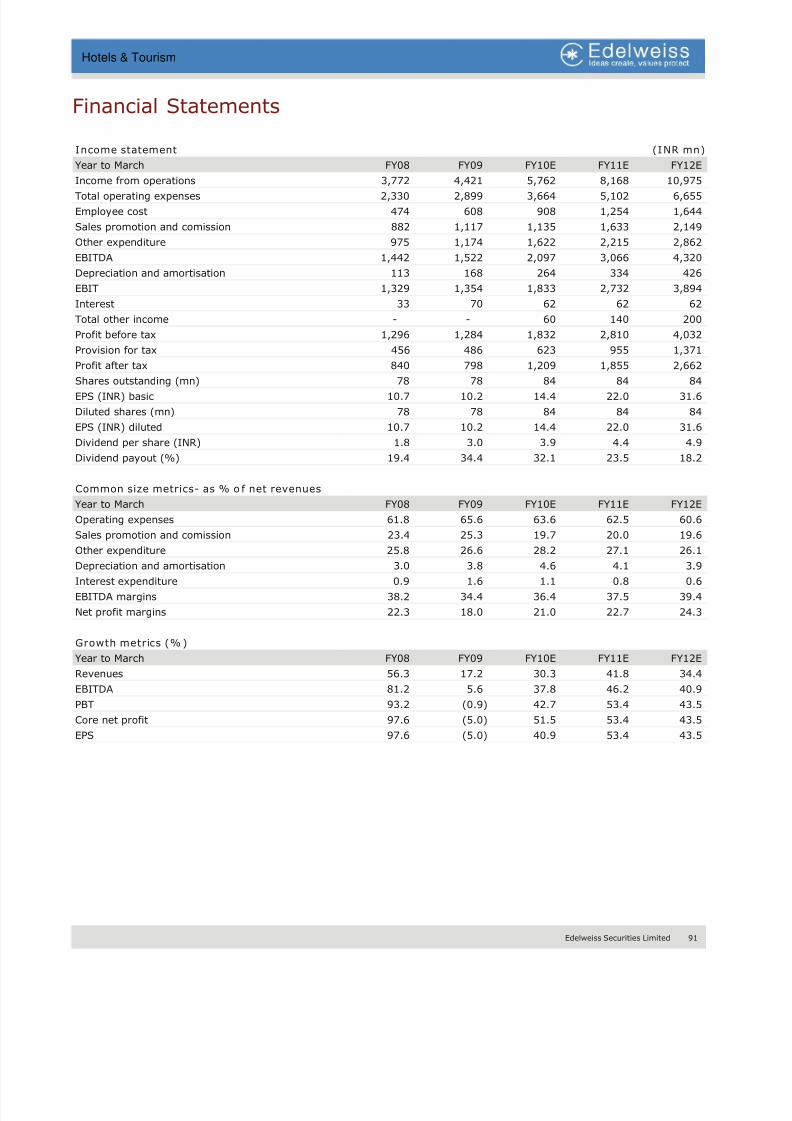
8/8/2019 Hotel and Tourism
http://slidepdf.com/reader/full/hotel-and-tourism 92/106
Edelweiss Securities Limited 91
Hotels & Tourism
Financial Statements
Income statement (INR mn)
Year to March FY08 FY09 FY10E FY11E FY12E
Income from operations 3,772 4,421 5,762 8,168 10,975
Total operating expenses 2,330 2,899 3,664 5,102 6,655
Employee cost 474 608 908 1,254 1,644
Sales promotion and comission 882 1,117 1,135 1,633 2,149
Other expenditure 975 1,174 1,622 2,215 2,862
EBITDA 1,442 1,522 2,097 3,066 4,320
Depreciation and amortisation 113 168 264 334 426
EBIT 1,329 1,354 1,833 2,732 3,894
Interest 33 70 62 62 62
Total other income - - 60 140 200
Profit before tax 1,296 1,284 1,832 2,810 4,032
Provision for tax 456 486 623 955 1,371
Profit after tax 840 798 1,209 1,855 2,662
Shares outstanding (mn) 78 78 84 84 84
EPS (INR) basic 10.7 10.2 14.4 22.0 31.6
Diluted shares (mn) 78 78 84 84 84
EPS (INR) diluted 10.7 10.2 14.4 22.0 31.6
Dividend per share (INR) 1.8 3.0 3.9 4.4 4.9
Dividend payout (%) 19.4 34.4 32.1 23.5 18.2
Common size metrics- as % o f net revenues
Year to March FY08 FY09 FY10E FY11E FY12E
Operating expenses 61.8 65.6 63.6 62.5 60.6
Sales promotion and comission 23.4 25.3 19.7 20.0 19.6
Other expenditure 25.8 26.6 28.2 27.1 26.1
Depreciation and amortisation 3.0 3.8 4.6 4.1 3.9 Interest expenditure 0.9 1.6 1.1 0.8 0.6
EBITDA margins 38.2 34.4 36.4 37.5 39.4
Net profit margins 22.3 18.0 21.0 22.7 24.3
Growth metrics (% )
Year to March FY08 FY09 FY10E FY11E FY12E
Revenues 56.3 17.2 30.3 41.8 34.4
EBITDA 81.2 5.6 37.8 46.2 40.9
PBT 93.2 (0.9) 42.7 53.4 43.5
Core net profit 97.6 (5.0) 51.5 53.4 43.5
EPS 97.6 (5.0) 40.9 53.4 43.5
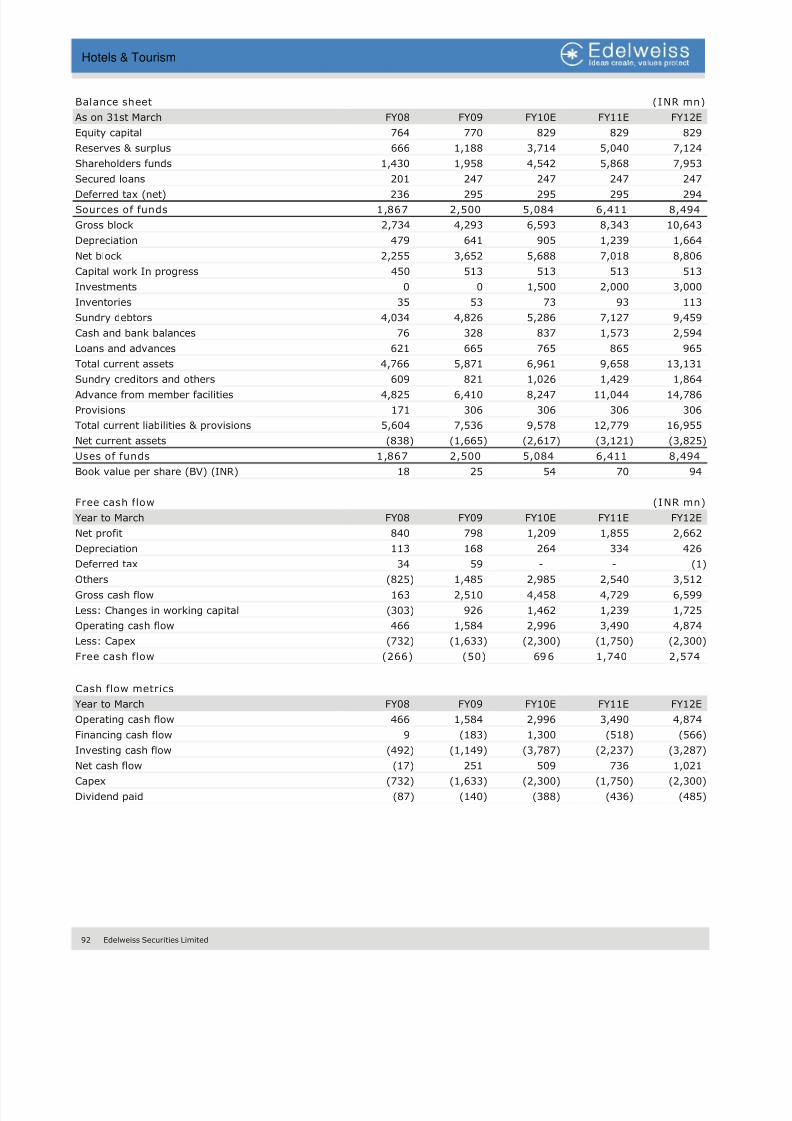
8/8/2019 Hotel and Tourism
http://slidepdf.com/reader/full/hotel-and-tourism 93/106
92 Edelweiss Securities Limited
Hotels & Tourism
Balance sheet (INR mn)
As on 31st March FY08 FY09 FY10E FY11E FY12E
Equity capital 764 770 829 829 829
Reserves & surplus 666 1,188 3,714 5,040 7,124
Shareholders funds 1,430 1,958 4,542 5,868 7,953
Secured loans 201 247 247 247 247
Deferred tax (net) 236 295 295 295 294
Sources of funds 1,867 2,500 5,084 6,411 8,494
Gross block 2,734 4,293 6,593 8,343 10,643
Depreciation 479 641 905 1,239 1,664
Net block 2,255 3,652 5,688 7,018 8,806
Capital work In progress 450 513 513 513 513
Investments 0 0 1,500 2,000 3,000
Inventories 35 53 73 93 113
Sundry debtors 4,034 4,826 5,286 7,127 9,459
Cash and bank balances 76 328 837 1,573 2,594
Loans and advances 621 665 765 865 965
Total current assets 4,766 5,871 6,961 9,658 13,131
Sundry creditors and others 609 821 1,026 1,429 1,864
Advance from member facilities 4,825 6,410 8,247 11,044 14,786
Provisions 171 306 306 306 306
Total current liabilities & provisions 5,604 7,536 9,578 12,779 16,955
Net current assets (838) (1,665) (2,617) (3,121) (3,825)
Uses of funds 1,867 2,500 5,084 6,411 8,494
Book value per share (BV) (INR) 18 25 54 70 94
Free cash flow (INR mn)
Year to March FY08 FY09 FY10E FY11E FY12E
Net profit 840 798 1,209 1,855 2,662
Depreciation 113 168 264 334 426
Deferred tax 34 59 - - (1) Others (825) 1,485 2,985 2,540 3,512
Gross cash flow 163 2,510 4,458 4,729 6,599
Less: Changes in working capital (303) 926 1,462 1,239 1,725
Operating cash flow 466 1,584 2,996 3,490 4,874
Less: Capex (732) (1,633) (2,300) (1,750) (2,300)
Free cash flow (266) (50) 696 1,740 2,574
Cash flow metrics
Year to March FY08 FY09 FY10E FY11E FY12E
Operating cash flow 466 1,584 2,996 3,490 4,874
Financing cash flow 9 (183) 1,300 (518) (566)
Investing cash flow (492) (1,149) (3,787) (2,237) (3,287) Net cash flow (17) 251 509 736 1,021
Capex (732) (1,633) (2,300) (1,750) (2,300)
Dividend paid (87) (140) (388) (436) (485)
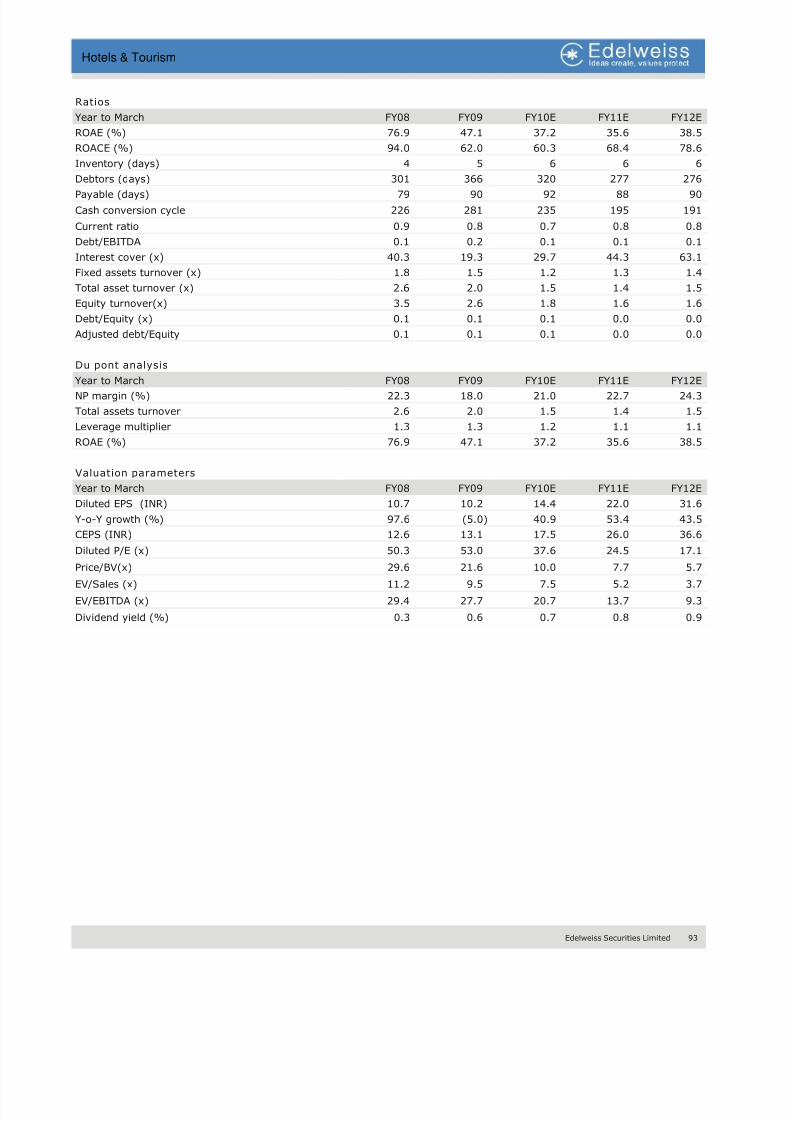
8/8/2019 Hotel and Tourism
http://slidepdf.com/reader/full/hotel-and-tourism 94/106
Edelweiss Securities Limited 93
Hotels & Tourism
Ratios
Year to March FY08 FY09 FY10E FY11E FY12E
ROAE (%) 76.9 47.1 37.2 35.6 38.5
ROACE (%) 94.0 62.0 60.3 68.4 78.6
Inventory (days) 4 5 6 6 6
Debtors (days) 301 366 320 277 276
Payable (days) 79 90 92 88 90
Cash conversion cycle 226 281 235 195 191
Current ratio 0.9 0.8 0.7 0.8 0.8
Debt/EBITDA 0.1 0.2 0.1 0.1 0.1
Interest cover (x) 40.3 19.3 29.7 44.3 63.1
Fixed assets turnover (x) 1.8 1.5 1.2 1.3 1.4
Total asset turnover (x) 2.6 2.0 1.5 1.4 1.5
Equity turnover(x) 3.5 2.6 1.8 1.6 1.6
Debt/Equity (x) 0.1 0.1 0.1 0.0 0.0
Adjusted debt/Equity 0.1 0.1 0.1 0.0 0.0
Du pont analysis
Year to March FY08 FY09 FY10E FY11E FY12E
NP margin (%) 22.3 18.0 21.0 22.7 24.3
Total assets turnover 2.6 2.0 1.5 1.4 1.5
Leverage multiplier 1.3 1.3 1.2 1.1 1.1
ROAE (%) 76.9 47.1 37.2 35.6 38.5
Valuation parameters
Year to March FY08 FY09 FY10E FY11E FY12E
Diluted EPS (INR) 10.7 10.2 14.4 22.0 31.6
Y-o-Y growth (%) 97.6 (5.0) 40.9 53.4 43.5
CEPS (INR) 12.6 13.1 17.5 26.0 36.6
Diluted P/E (x) 50.3 53.0 37.6 24.5 17.1
Price/BV(x) 29.6 21.6 10.0 7.7 5.7
EV/Sales (x) 11.2 9.5 7.5 5.2 3.7
EV/EBITDA (x) 29.4 27.7 20.7 13.7 9.3
Dividend yield (%) 0.3 0.6 0.7 0.8 0.9

8/8/2019 Hotel and Tourism
http://slidepdf.com/reader/full/hotel-and-tourism 95/106
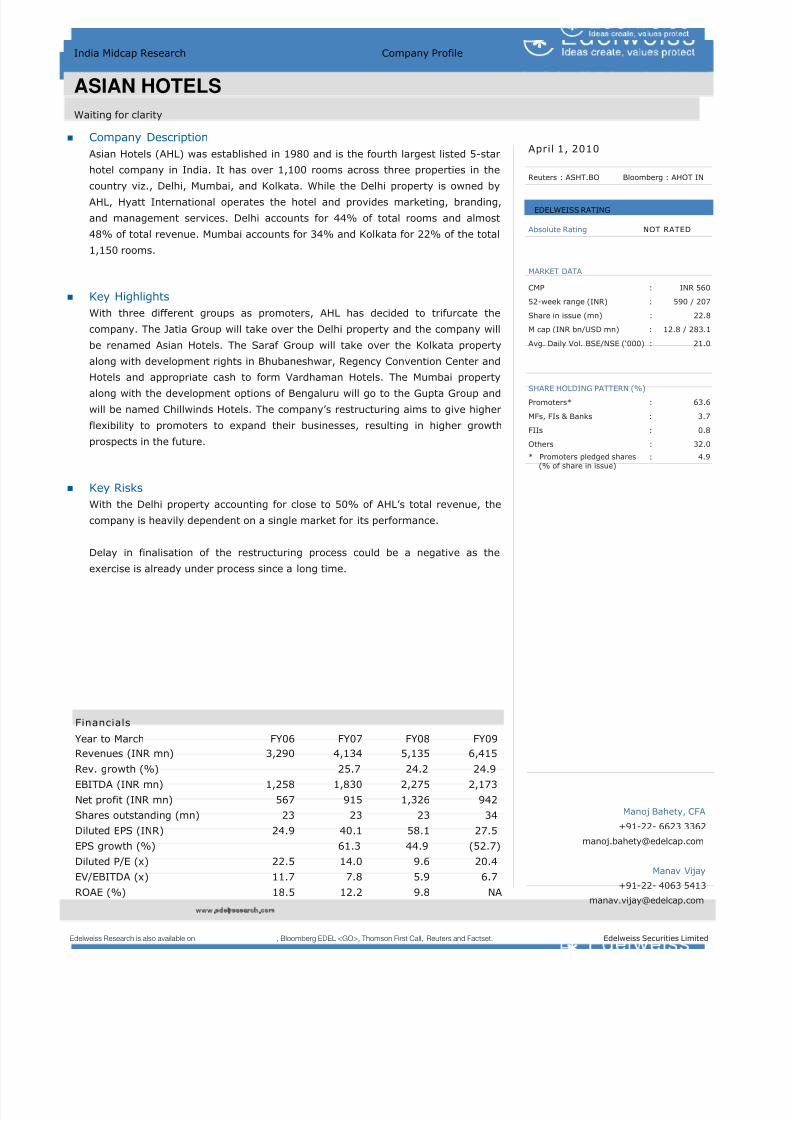
8/8/2019 Hotel and Tourism
http://slidepdf.com/reader/full/hotel-and-tourism 96/106
Edelweiss Securities Limited 95
Hotels & Tourism
Company Description
Asian Hotels (AHL) was established in 1980 and is the fourth largest listed 5-star
hotel company in India. It has over 1,100 rooms across three properties in the
country viz., Delhi, Mumbai, and Kolkata. While the Delhi property is owned byAHL, Hyatt International operates the hotel and provides marketing, branding,
and management services. Delhi accounts for 44% of total rooms and almost
48% of total revenue. Mumbai accounts for 34% and Kolkata for 22% of the total
1,150 rooms.
Key Highlights
With three different groups as promoters, AHL has decided to trifurcate the
company. The Jatia Group will take over the Delhi property and the company will
be renamed Asian Hotels. The Saraf Group will take over the Kolkata property
along with development rights in Bhubaneshwar, Regency Convention Center and
Hotels and appropriate cash to form Vardhaman Hotels. The Mumbai propertyalong with the development options of Bengaluru will go to the Gupta Group and
will be named Chillwinds Hotels. The company’s restructuring aims to give higher
flexibility to promoters to expand their businesses, resulting in higher growth
prospects in the future.
Key Risks
With the Delhi property accounting for close to 50% of AHL’s total revenue, the
company is heavily dependent on a single market for its performance.
Delay in finalisation of the restructuring process could be a negative as the
exercise is already under process since a long time.
Edelweiss Research is also available on www.edelresearch.com, Bloomberg EDEL <GO>, Thomson First Call, Reuters and Factset. Edelweiss Securities Limited
India Midcap Research Company Profile
ASIAN HOTELS
Waiting for clarity
April 1, 2010
Reuters : ASHT.BO Bloomberg : AHOT IN
Absolute Rating NOT RATED
MARKET DATA CMP : INR 560
52-week range (INR) : 590 / 207
Share in issue (mn) : 22.8
M cap (INR bn/USD mn) : 12.8 / 283.1
Avg. Daily Vol. BSE/NSE (‘000) : 21.0
SHARE HOLDING PATTERN (%)
Promoters* : 63.6
MFs, FIs & Banks : 3.7
FIIs : 0.8
Others : 32.0
* Promoters pledged shares : 4.9
(% of share in issue)
Manoj Bahety, CFA
+91-22- 6623 3362
Manav Vijay
+91-22- 4063 5413
EDELWEISS RATING
Financials
Year to March FY06 FY07 FY08 FY09
Revenues (INR mn) 3,290 4,134 5,135 6,415Rev. growth (%) 25.7 24.2 24.9
EBITDA (INR mn) 1,258 1,830 2,275 2,173
Net profit (INR mn) 567 915 1,326 942
Shares outstanding (mn) 23 23 23 34
Diluted EPS (INR) 24.9 40.1 58.1 27.5
EPS growth (%) 61.3 44.9 (52.7)
Diluted P/E (x) 22.5 14.0 9.6 20.4
EV/EBITDA (x) 11.7 7.8 5.9 6.7
ROAE (%) 18.5 12.2 9.8 NA
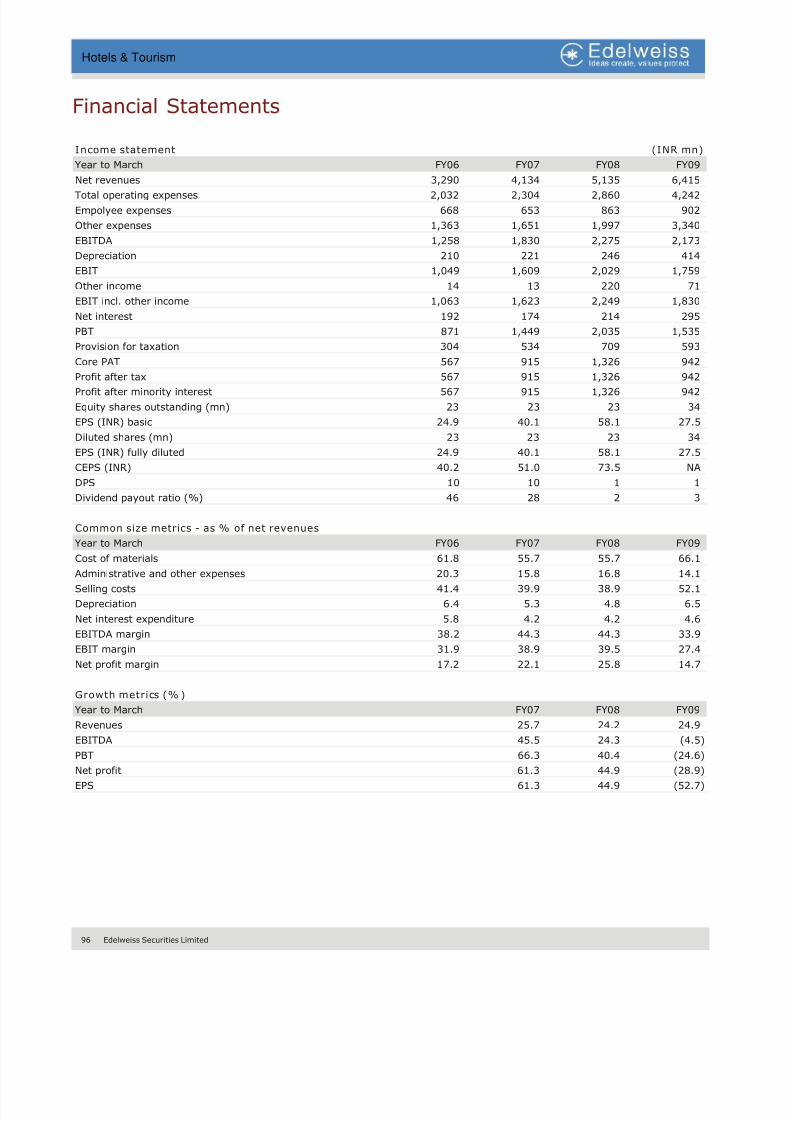
8/8/2019 Hotel and Tourism
http://slidepdf.com/reader/full/hotel-and-tourism 97/106
96 Edelweiss Securities Limited
Hotels & Tourism
Financial Statements
Income statement (INR mn)
Year to March FY06 FY07 FY08 FY09
Net revenues 3,290 4,134 5,135 6,415
Total operating expenses 2,032 2,304 2,860 4,242
Empolyee expenses 668 653 863 902
Other expenses 1,363 1,651 1,997 3,340
EBITDA 1,258 1,830 2,275 2,173
Depreciation 210 221 246 414
EBIT 1,049 1,609 2,029 1,759
Other income 14 13 220 71
EBIT incl. other income 1,063 1,623 2,249 1,830
Net interest 192 174 214 295
PBT 871 1,449 2,035 1,535
Provision for taxation 304 534 709 593
Core PAT 567 915 1,326 942
Profit after tax 567 915 1,326 942 Profit after minority interest 567 915 1,326 942
Equity shares outstanding (mn) 23 23 23 34
EPS (INR) basic 24.9 40.1 58.1 27.5
Diluted shares (mn) 23 23 23 34
EPS (INR) fully diluted 24.9 40.1 58.1 27.5
CEPS (INR) 40.2 51.0 73.5 NA
DPS 10 10 1 1
Dividend payout ratio (%) 46 28 2 3
Common size metrics - as % of net revenues
Year to March FY06 FY07 FY08 FY09
Cost of materials 61.8 55.7 55.7 66.1
Administrative and other expenses 20.3 15.8 16.8 14.1
Selling costs 41.4 39.9 38.9 52.1
Depreciation 6.4 5.3 4.8 6.5
Net interest expenditure 5.8 4.2 4.2 4.6
EBITDA margin 38.2 44.3 44.3 33.9
EBIT margin 31.9 38.9 39.5 27.4
Net profit margin 17.2 22.1 25.8 14.7
Growth metrics (% )
Year to March FY07 FY08 FY09
Revenues 25.7 24.2 24.9
EBITDA 45.5 24.3 (4.5)
PBT 66.3 40.4 (24.6)
Net profit 61.3 44.9 (28.9)
EPS 61.3 44.9 (52.7)
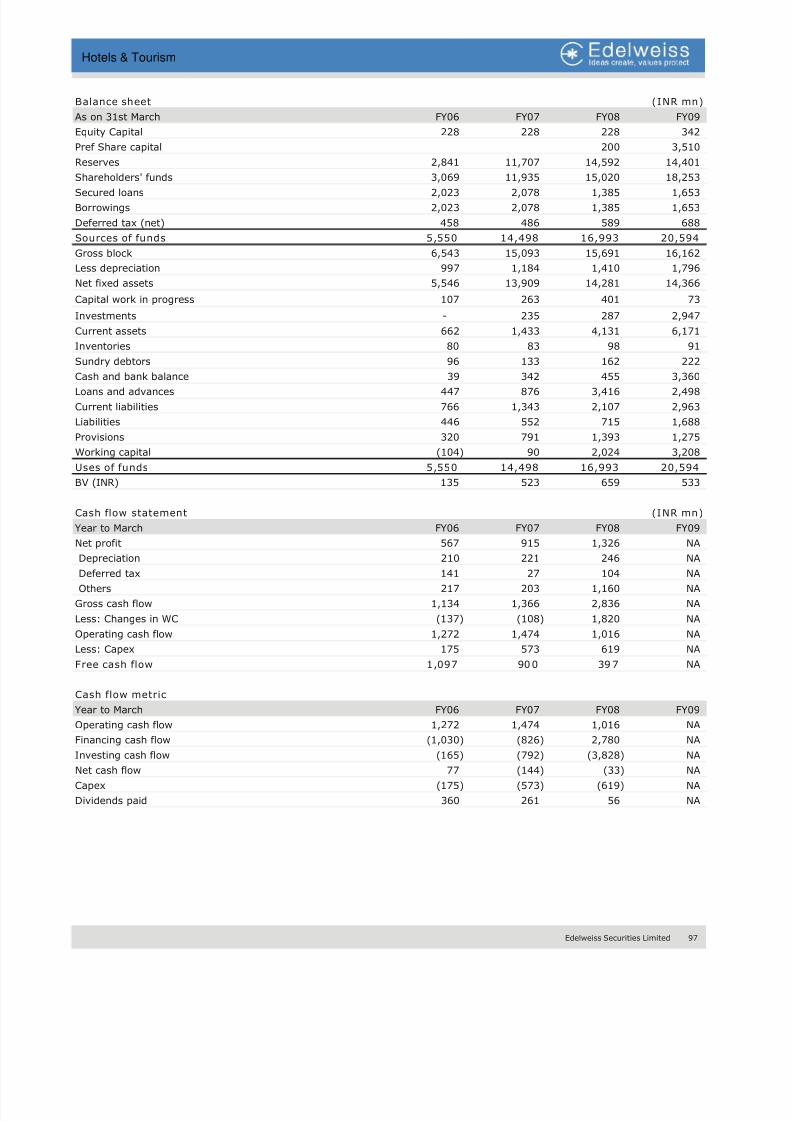
8/8/2019 Hotel and Tourism
http://slidepdf.com/reader/full/hotel-and-tourism 98/106
Edelweiss Securities Limited 97
Hotels & Tourism
Balance sheet (INR mn)
As on 31st March FY06 FY07 FY08 FY09
Equity Capital 228 228 228 342
Pref Share capital 200 3,510
Reserves 2,841 11,707 14,592 14,401
Shareholders' funds 3,069 11,935 15,020 18,253
Secured loans 2,023 2,078 1,385 1,653
Borrowings 2,023 2,078 1,385 1,653
Deferred tax (net) 458 486 589 688
Sources of funds 5,550 14,498 16,993 20,594
Gross block 6,543 15,093 15,691 16,162
Less depreciation 997 1,184 1,410 1,796
Net fixed assets 5,546 13,909 14,281 14,366
Capital work in progress 107 263 401 73
Investments - 235 287 2,947
Current assets 662 1,433 4,131 6,171
Inventories 80 83 98 91
Sundry debtors 96 133 162 222
Cash and bank balance 39 342 455 3,360 Loans and advances 447 876 3,416 2,498
Current liabilities 766 1,343 2,107 2,963
Liabilities 446 552 715 1,688
Provisions 320 791 1,393 1,275
Working capital (104) 90 2,024 3,208
Uses of funds 5,550 14,498 16,993 20,594
BV (INR) 135 523 659 533
Cash flow statement (INR mn)
Year to March FY06 FY07 FY08 FY09
Net profit 567 915 1,326 NA
Depreciation 210 221 246 NA
Deferred tax 141 27 104 NA
Others 217 203 1,160 NA
Gross cash flow 1,134 1,366 2,836 NA
Less: Changes in WC (137) (108) 1,820 NA
Operating cash flow 1,272 1,474 1,016 NA
Less: Capex 175 573 619 NA
Free cash flow 1,097 900 397 NA
Cash flow metric
Year to March FY06 FY07 FY08 FY09
Operating cash flow 1,272 1,474 1,016 NA
Financing cash flow (1,030) (826) 2,780 NA
Investing cash flow (165) (792) (3,828) NANet cash flow 77 (144) (33) NA
Capex (175) (573) (619) NA
Dividends paid 360 261 56 NA
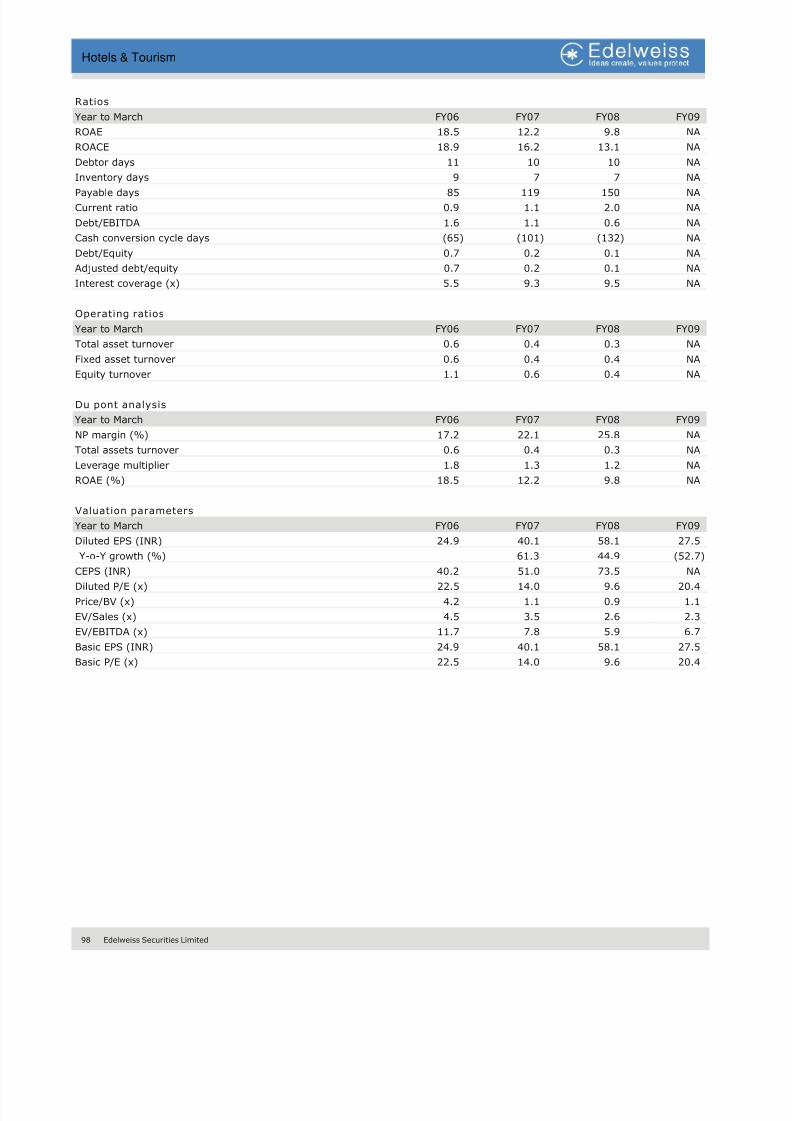
8/8/2019 Hotel and Tourism
http://slidepdf.com/reader/full/hotel-and-tourism 99/106
98 Edelweiss Securities Limited
Hotels & Tourism
Ratios
Year to March FY06 FY07 FY08 FY09
ROAE 18.5 12.2 9.8 NA
ROACE 18.9 16.2 13.1 NA
Debtor days 11 10 10 NA
Inventory days 9 7 7 NA
Payable days 85 119 150 NA
Current ratio 0.9 1.1 2.0 NA
Debt/EBITDA 1.6 1.1 0.6 NA
Cash conversion cycle days (65) (101) (132) NA
Debt/Equity 0.7 0.2 0.1 NA
Adjusted debt/equity 0.7 0.2 0.1 NA
Interest coverage (x) 5.5 9.3 9.5 NA
Operating ratios
Year to March FY06 FY07 FY08 FY09
Total asset turnover 0.6 0.4 0.3 NA
Fixed asset turnover 0.6 0.4 0.4 NA
Equity turnover 1.1 0.6 0.4 NA
Du pont analysis
Year to March FY06 FY07 FY08 FY09
NP margin (%) 17.2 22.1 25.8 NA
Total assets turnover 0.6 0.4 0.3 NA
Leverage multiplier 1.8 1.3 1.2 NA
ROAE (%) 18.5 12.2 9.8 NA
Valuation parameters
Year to March FY06 FY07 FY08 FY09
Diluted EPS (INR) 24.9 40.1 58.1 27.5
Y-o-Y growth (%) 61.3 44.9 (52.7)
CEPS (INR) 40.2 51.0 73.5 NA
Diluted P/E (x) 22.5 14.0 9.6 20.4
Price/BV (x) 4.2 1.1 0.9 1.1
EV/Sales (x) 4.5 3.5 2.6 2.3
EV/EBITDA (x) 11.7 7.8 5.9 6.7
Basic EPS (INR) 24.9 40.1 58.1 27.5
Basic P/E (x) 22.5 14.0 9.6 20.4
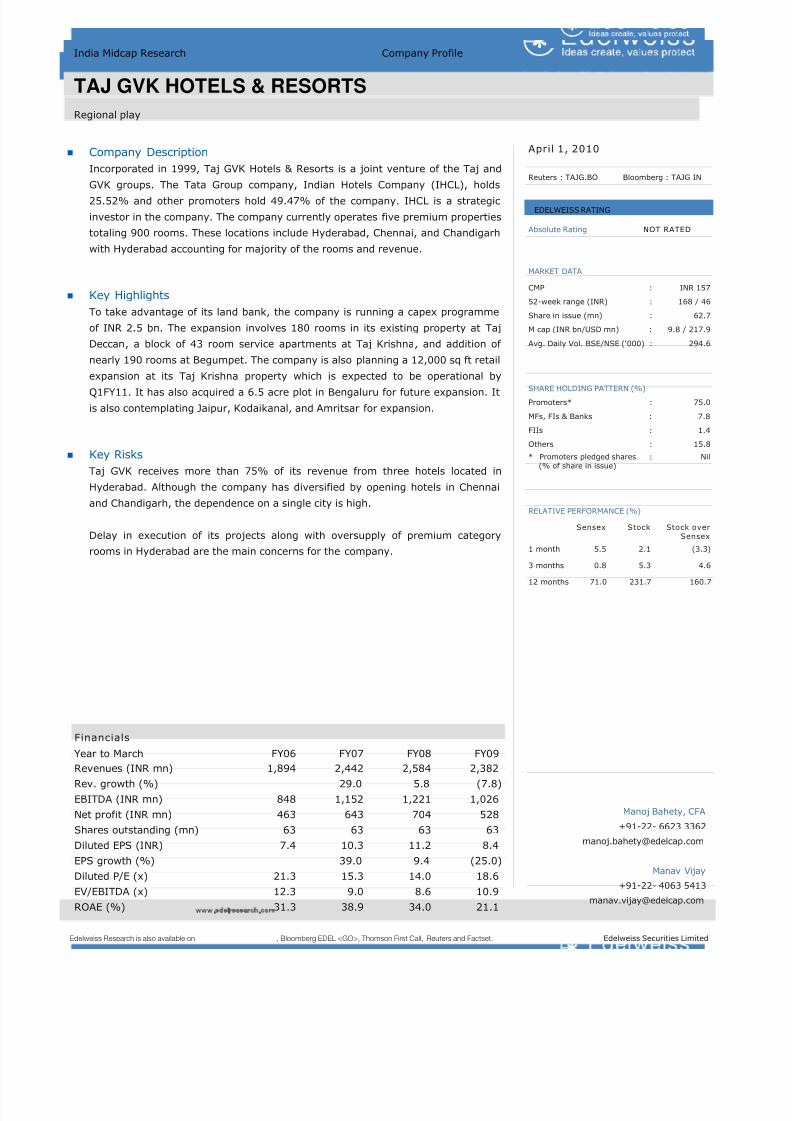
8/8/2019 Hotel and Tourism
http://slidepdf.com/reader/full/hotel-and-tourism 100/106
Edelweiss Securities Limited 99
Hotels & Tourism
Company Description
Incorporated in 1999, Taj GVK Hotels & Resorts is a joint venture of the Taj and
GVK groups. The Tata Group company, Indian Hotels Company (IHCL), holds25.52% and other promoters hold 49.47% of the company. IHCL is a strategic
investor in the company. The company currently operates five premium properties
totaling 900 rooms. These locations include Hyderabad, Chennai, and Chandigarh
with Hyderabad accounting for majority of the rooms and revenue.
Key Highlights
To take advantage of its land bank, the company is running a capex programme
of INR 2.5 bn. The expansion involves 180 rooms in its existing property at Taj
Deccan, a block of 43 room service apartments at Taj Krishna, and addition of
nearly 190 rooms at Begumpet. The company is also planning a 12,000 sq ft retail
expansion at its Taj Krishna property which is expected to be operational byQ1FY11. It has also acquired a 6.5 acre plot in Bengaluru for future expansion. It
is also contemplating Jaipur, Kodaikanal, and Amritsar for expansion.
Key Risks
Taj GVK receives more than 75% of its revenue from three hotels located in
Hyderabad. Although the company has diversified by opening hotels in Chennai
and Chandigarh, the dependence on a single city is high.
Delay in execution of its projects along with oversupply of premium category
rooms in Hyderabad are the main concerns for the company.
Edelweiss Research is also available on www.edelresearch.com, Bloomberg EDEL <GO>, Thomson First Call, Reuters and Factset. Edelweiss Securities Limited
India Midcap Research Company Profile
TAJ GVK HOTELS & RESORTS
Regional play
April 1, 2010
Reuters : TAJG.BO Bloomberg : TAJG IN
Absolute Rating NOT RATED
MARKET DATA CMP : INR 157
52-week range (INR) : 168 / 46
Share in issue (mn) : 62.7
M cap (INR bn/USD mn) : 9.8 / 217.9
Avg. Daily Vol. BSE/NSE (‘000) : 294.6
SHARE HOLDING PATTERN (%)
Promoters* : 75.0
MFs, FIs & Banks : 7.8
FIIs : 1.4
Others : 15.8
* Promoters pledged shares : Nil
(% of share in issue)
RELATIVE PERFORMANCE (%)
Sensex Stock Stock over
Sensex
1 month 5.5 2.1 (3.3)
3 months 0.8 5.3 4.6
12 months 71.0 231.7 160.7
Manoj Bahety, CFA
+91-22- 6623 3362
Manav Vijay
+91-22- 4063 5413
EDELWEISS RATING
Financials
Year to March FY06 FY07 FY08 FY09Revenues (INR mn) 1,894 2,442 2,584 2,382
Rev. growth (%) 29.0 5.8 (7.8)
EBITDA (INR mn) 848 1,152 1,221 1,026
Net profit (INR mn) 463 643 704 528
Shares outstanding (mn) 63 63 63 63
Diluted EPS (INR) 7.4 10.3 11.2 8.4
EPS growth (%) 39.0 9.4 (25.0)
Diluted P/E (x) 21.3 15.3 14.0 18.6
EV/EBITDA (x) 12.3 9.0 8.6 10.9
ROAE (%) 31.3 38.9 34.0 21.1
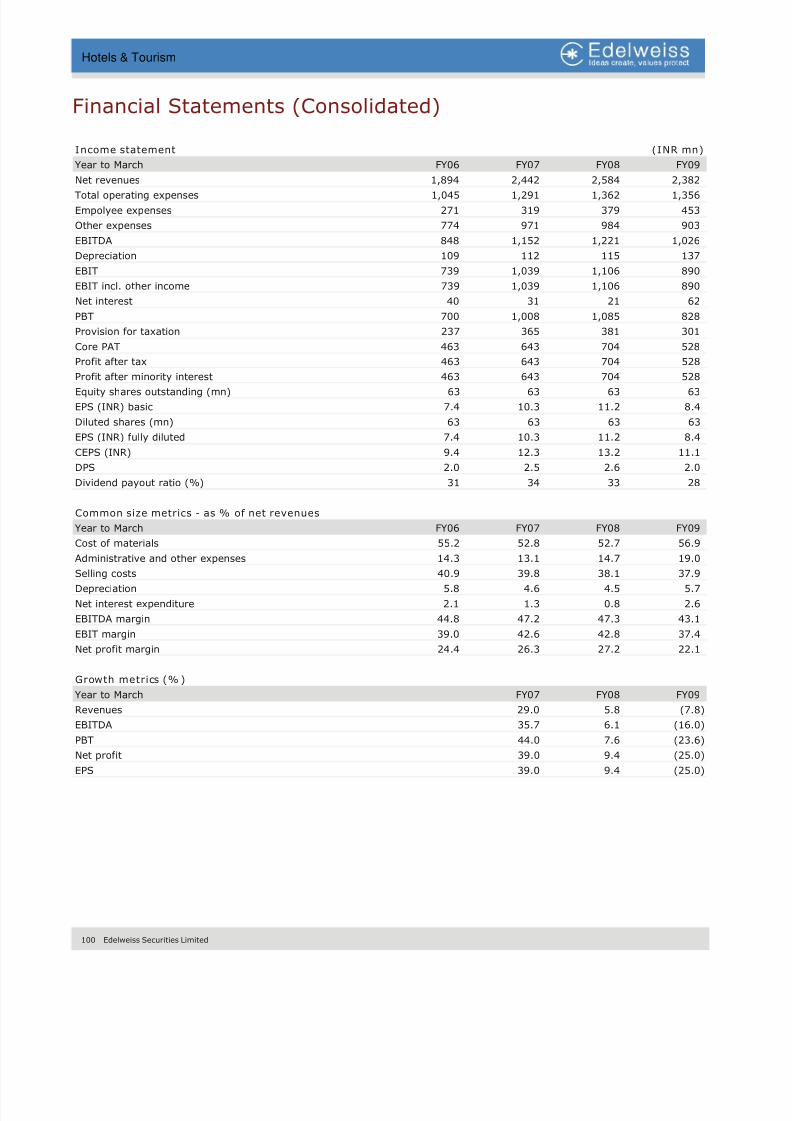
8/8/2019 Hotel and Tourism
http://slidepdf.com/reader/full/hotel-and-tourism 101/106
100 Edelweiss Securities Limited
Hotels & Tourism
Financial Statements (Consolidated)
Income statement (INR mn)
Year to March FY06 FY07 FY08 FY09
Net revenues 1,894 2,442 2,584 2,382
Total operating expenses 1,045 1,291 1,362 1,356
Empolyee expenses 271 319 379 453
Other expenses 774 971 984 903
EBITDA 848 1,152 1,221 1,026
Depreciation 109 112 115 137
EBIT 739 1,039 1,106 890
EBIT incl. other income 739 1,039 1,106 890
Net interest 40 31 21 62
PBT 700 1,008 1,085 828
Provision for taxation 237 365 381 301
Core PAT 463 643 704 528
Profit after tax 463 643 704 528
Profit after minority interest 463 643 704 528 Equity shares outstanding (mn) 63 63 63 63
EPS (INR) basic 7.4 10.3 11.2 8.4
Diluted shares (mn) 63 63 63 63
EPS (INR) fully diluted 7.4 10.3 11.2 8.4
CEPS (INR) 9.4 12.3 13.2 11.1
DPS 2.0 2.5 2.6 2.0
Dividend payout ratio (%) 31 34 33 28
Common size metrics - as % of net revenues
Year to March FY06 FY07 FY08 FY09
Cost of materials 55.2 52.8 52.7 56.9
Administrative and other expenses 14.3 13.1 14.7 19.0
Selling costs 40.9 39.8 38.1 37.9
Depreciation 5.8 4.6 4.5 5.7
Net interest expenditure 2.1 1.3 0.8 2.6
EBITDA margin 44.8 47.2 47.3 43.1
EBIT margin 39.0 42.6 42.8 37.4
Net profit margin 24.4 26.3 27.2 22.1
Growth metrics (% )
Year to March FY07 FY08 FY09
Revenues 29.0 5.8 (7.8)
EBITDA 35.7 6.1 (16.0)
PBT 44.0 7.6 (23.6)
Net profit 39.0 9.4 (25.0)
EPS 39.0 9.4 (25.0)
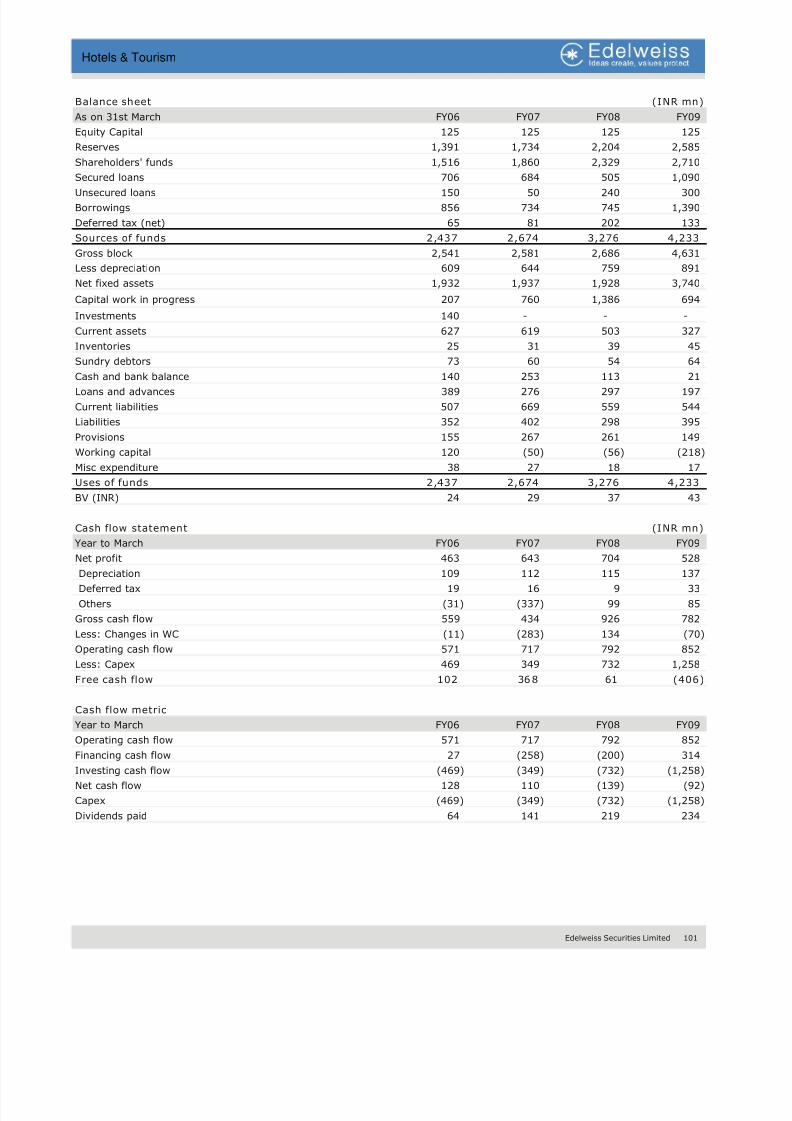
8/8/2019 Hotel and Tourism
http://slidepdf.com/reader/full/hotel-and-tourism 102/106
Edelweiss Securities Limited 101
Hotels & Tourism
Balance sheet (INR mn)
As on 31st March FY06 FY07 FY08 FY09
Equity Capital 125 125 125 125
Reserves 1,391 1,734 2,204 2,585
Shareholders' funds 1,516 1,860 2,329 2,710
Secured loans 706 684 505 1,090
Unsecured loans 150 50 240 300
Borrowings 856 734 745 1,390
Deferred tax (net) 65 81 202 133
Sources of funds 2,437 2,674 3,276 4,233
Gross block 2,541 2,581 2,686 4,631
Less depreciation 609 644 759 891
Net fixed assets 1,932 1,937 1,928 3,740
Capital work in progress 207 760 1,386 694
Investments 140 - - -
Current assets 627 619 503 327
Inventories 25 31 39 45
Sundry debtors 73 60 54 64
Cash and bank balance 140 253 113 21 Loans and advances 389 276 297 197
Current liabilities 507 669 559 544
Liabilities 352 402 298 395
Provisions 155 267 261 149
Working capital 120 (50) (56) (218)
Misc expenditure 38 27 18 17
Uses of funds 2,437 2,674 3,276 4,233
BV (INR) 24 29 37 43
Cash flow statement (INR mn)
Year to March FY06 FY07 FY08 FY09
Net profit 463 643 704 528
Depreciation 109 112 115 137
Deferred tax 19 16 9 33
Others (31) (337) 99 85
Gross cash flow 559 434 926 782
Less: Changes in WC (11) (283) 134 (70)
Operating cash flow 571 717 792 852
Less: Capex 469 349 732 1,258
Free cash flow 102 368 61 (406)
Cash flow metric
Year to March FY06 FY07 FY08 FY09
Operating cash flow 571 717 792 852
Financing cash flow 27 (258) (200) 314
Investing cash flow (469) (349) (732) (1,258)
Net cash flow 128 110 (139) (92)
Capex (469) (349) (732) (1,258)
Dividends paid 64 141 219 234
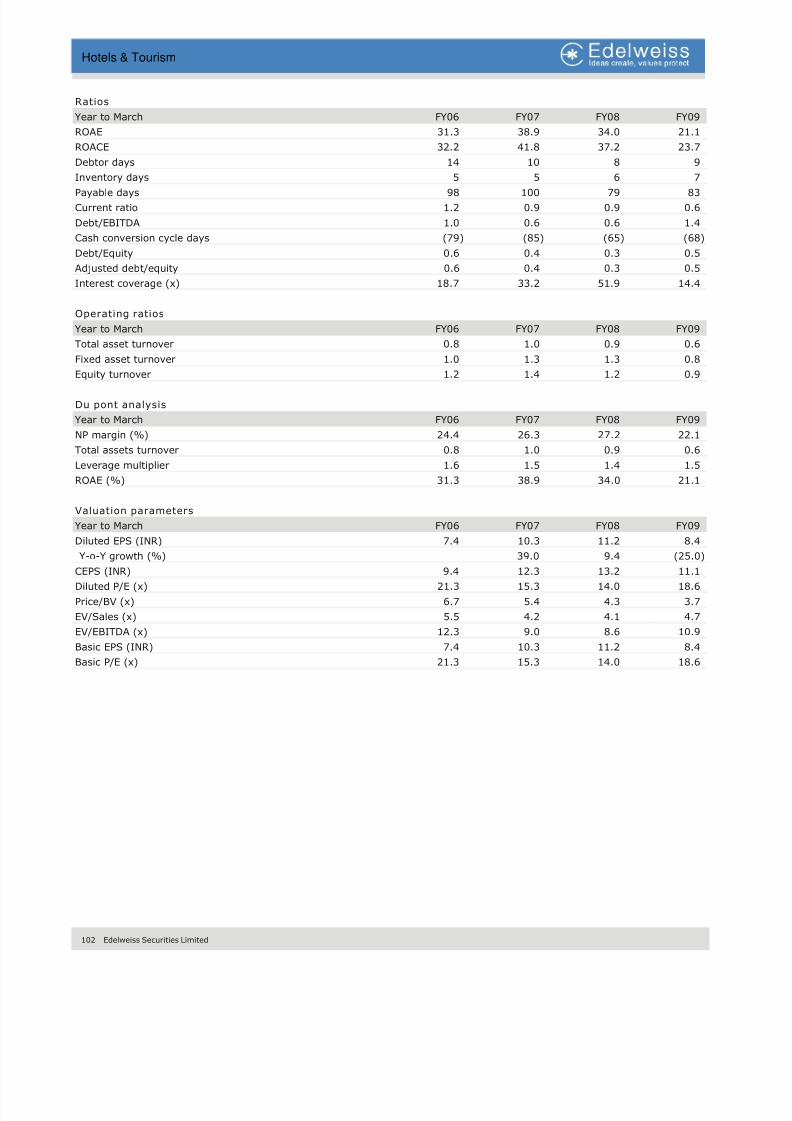
8/8/2019 Hotel and Tourism
http://slidepdf.com/reader/full/hotel-and-tourism 103/106
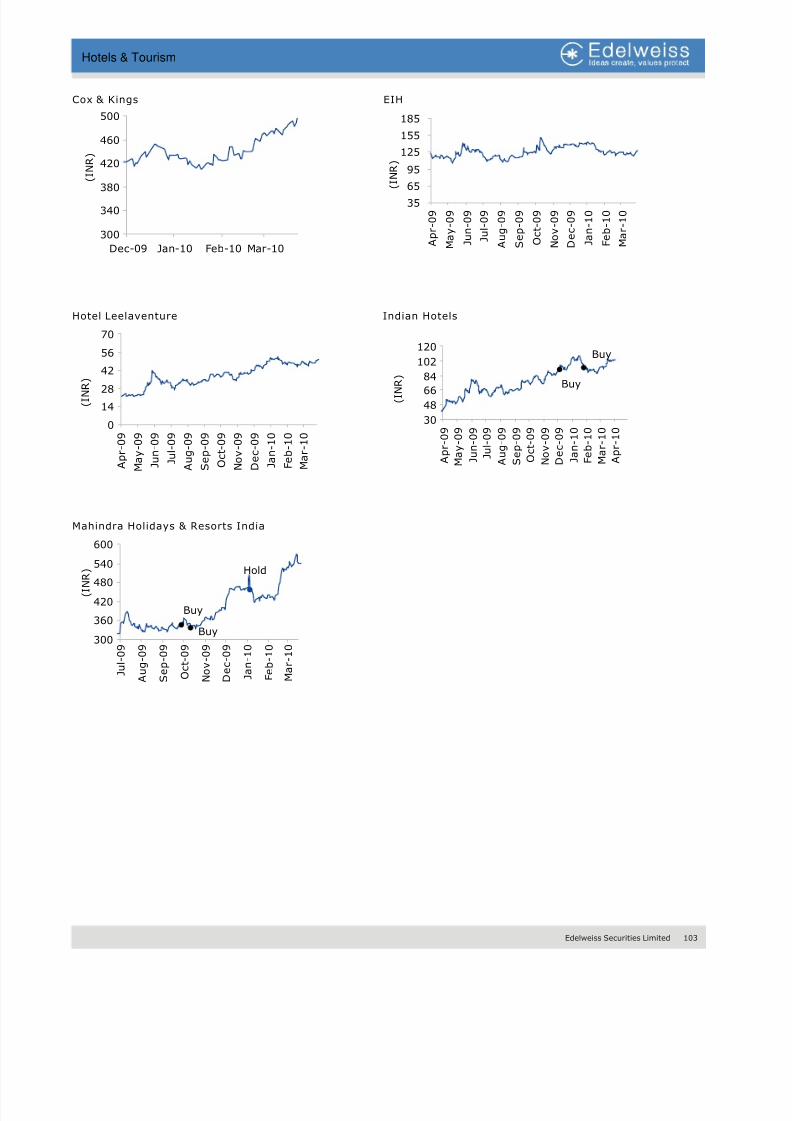
8/8/2019 Hotel and Tourism
http://slidepdf.com/reader/full/hotel-and-tourism 104/106
Edelweiss Securities Limited 103
Hotels & Tourism
Cox & Kings EIH
300
340
380
420
460
500
Dec-09 Jan-10 Feb-10 Mar-10
( I N R )
Hotel Leelaventure Indian Hotels
0
14
28
42
56
70
A p r - 0 9
M a y - 0 9
J u n - 0 9
J u l - 0 9
A u g - 0 9
S e p - 0 9
O c t - 0 9
N o v - 0 9
D e c - 0 9
J a n - 1 0
F e b - 1 0
M a r - 1 0
( I N R )
Mahindra Holidays & Resorts India
Hold
Buy
Buy300
360
420
480
540
600
J u l - 0 9
A u g - 0 9
S e p - 0 9
O c t - 0 9
N o v - 0 9
D e c - 0 9
J a n - 1 0
F e b - 1 0
M a r - 1 0
( I N R )
3565
95
125
155
185
A p r - 0 9
M a y - 0 9
J u n - 0 9
J u l - 0 9
A u g - 0 9
S e p - 0 9
O c t - 0 9
N o v - 0 9
D e c - 0 9
J a n - 1 0
F e b - 1 0
M a r - 1 0
(
I N R )
Buy
Buy
30
48
6684
102
120
A p r - 0 9
M a y - 0 9
J u n - 0 9
J u l - 0 9
A u g - 0 9
S e p - 0 9
O c t - 0 9
N o v - 0 9
D e c - 0 9
J a n - 1 0
F e b - 1 0
M a r - 1 0
A p r - 1 0
( I N R )
8/8/2019 Hotel and Tourism
http://slidepdf.com/reader/full/hotel-and-tourism 105/106
104 Edelweiss Securities Limited
Hotels & Tourism
Buy
Buy
Buy150350
550
750
950
1,150
J u l - 0 8
A u g - 0
8
S e p - 0
8
O c t - 0 8
N o v - 0
8
D e c - 0
8
J a n - 0
9
F e b - 0
9
M a r - 0 9
A p r - 0 9
M a y - 0
9
J u n - 0
9
J u l - 0 9
( I N R )
Edelweiss Research is also available onwww.edelresearch.com
,Bloomberg EDEL <GO>, Thomson First Call, Reuters and Factset. Edelweiss Securities Limited
Edelweiss Securities Limited, 14th Floor, Express Towers, Nariman Point, Mumbai – 400 021,Board: (91-22) 2286 4400, Email: [email protected]
Naresh Kothari Co-Head Institutional Equities [email protected] +91 22 2286 4246
Vikas Khemani Co-Head Institutional Equities [email protected] +91 22 2286 4206
Nischal Maheshwari Head Research [email protected] +91 22 6623 3411
Cove r age g r oup ( s ) o f s t ocks by p r im a r y ana lys t ( s ) : Hote ls
Indian Hotels and Mahindra Holidays & Resorts India
Recent Research
04-Dec-09 Indian Time to check-in; 88 BuyHotels Initiating Coverage
12-Oct-09 Mahindra Membership-led 346 Buy
Resorts & growth;
India Initiating Coverage
Distribution of Ratings / Market Cap
Edelweiss Research Coverage Universe
Rating Distribution* 53 43 29 128
* 3 stocks under review
Market Cap (INR) 72 41 15
> 50bn Between 10bn and 50 bn < 10bn
Date Company Title Price (INR) Recos
Buy Hold Reduce Total
This document has been prepared by Edelweiss Securities Limited (Edelweiss). Edelweiss, its holding company and associate companies are a full service, integratedinvestment banking, portfolio management and brokerage group. Our research analysts and sales persons provide important input into our investment bankingactivities. This document does not constitute an offer or solicitation for the purchase or sale of any financial instrument or as an official confirmation of anytransaction. The information contained herein is from publicly available data or other sources believed to be reliable, but we do not represent that it is accurate orcomplete and it should not be relied on as such. Edelweiss or any of its affiliates/ group companies shall not be in any way responsible for any loss or damage thatmay arise to any person from any inadvertent error in the information contained in this report. This document is provided for assistance only and is not intended tobe and must not alone be taken as the basis for an investment decision. The user assumes the entire risk of any use made of this information. Each recipient of thisdocument should make such investigation as it deems necessary to arrive at an independent evaluation of an investment in the securities of companies referred to inthis document (including the merits and risks involved), and should consult his own advisors to determine the merits and risks of such investment. The investmentdiscussed or views expressed may not be suitable for all investors. We and our affiliates, group companies, officers, directors, and employees may: (a) from time totime, have long or short positions in, and buy or sell the securities thereof, of company (ies) mentioned herein or (b) be engaged in any other transaction involvingsuch securities and earn brokerage or other compensation or act as advisor or lender/borrower to such company (ies) or have other potential conflict of interest withrespect to any recommendation and related information and opinions. This information is strictly confidential and is being furnished to you solely for your
information. This information should not be reproduced or redistributed or passed on directly or indirectly in any form to any other person or published, copied, inwhole or in part, for any purpose. This report is not directed or intended for distribution to, or use by, any person or entity who is a citizen or resident of or located inany locality, state, country or other jurisdiction, where such distribution, publication, availability or use would be contrary to law, regulation or which would subjectEdelweiss and affiliates/ group companies to any registration or licensing requirements within such jurisdiction. The distribution of this document in certain
jurisdictions may be restricted by law, and persons in whose possession this document comes, should inform themselves about and observe, any such restrictions.The information given in this document is as of the date of this report and there can be no assurance that future results or events will be consistent with thisinformation. This information is subject to change without any prior notice. Edelweiss reserves the right to make modifications and alterations to this statement asmay be required from time to time. However, Edelweiss is under no obligation to update or keep the information current. Nevertheless, Edelweiss is committed toproviding independent and transparent recommendation to its client and would be happy to provide any information in response to specific client queries. NeitherEdelweiss nor any of its affiliates, group companies, directors, employees, agents or representatives shall be liable for any damages whether direct, indirect, specialor consequential including lost revenue or lost profits that may arise from or in connection with the use of the information. Past performance is not necessarily aguide to future performance. The disclosures of interest statements incorporated in this document are provided solely to enhance the transparency and should not betreated as endorsement of the views expressed in the report. Edelweiss Securities Limited generally prohibits its analysts, persons reporting to analysts and theirfamily members from maintaining a financial interest in the securities or derivatives of any companies that the analysts cover. The analyst for this report certifiesthat all of the views expressed in this report accurately reflect his or her personal views about the subject company or companies and its or their securities, and nopart of his or her compensation was, is or will be, directly or indirectly related to specific recommendations or views expressed in this report. Analyst holding in thestock: no.
Copyright 2009 Edelweiss Research (Edelweiss Securities Ltd). All rights reserved
Access the entire repository of Edelweiss Research on w ww .edelresearch.com
Rating Interpretation
Buy appreciate more than 15% over a 12-month period
Hold depreciate up to 15% over a 12-month period
Reduce depreciate more than 5% over a 12-month period
Rating Expected to
Distribution of Ratings / Market Cap
Edelweiss Research Coverage Universe
Rating Distribution* 101 56 9 169
* 3 stocks under review
Market Cap (INR) 103 53 13
> 50bn Between 10bn and 50 bn < 10bn
Buy Hold Reduce Total

8/8/2019 Hotel and Tourism
http://slidepdf.com/reader/full/hotel-and-tourism 106/106
Edelweiss Value ScannerEdelweiss Value ScannerEdelweiss Value ScannerEdelweiss Value ScannerEdelweiss Value Scanner