Embed Size (px)
Citation preview

HOTEL REPORTMARCH 2018
PAGE 1
HOTEL GUESTS
OVERALL PERFORMANCE
PAGE 2
PERFORMANCE BY REGION PAGE 3
PERFORMANCE BY STAR RATING PAGE 4
UPCOMING EVENTS PAGE 5
DCT NEWS PAGE 6
GLOSSARY PAGE 7
TABLE OF CONTENTS
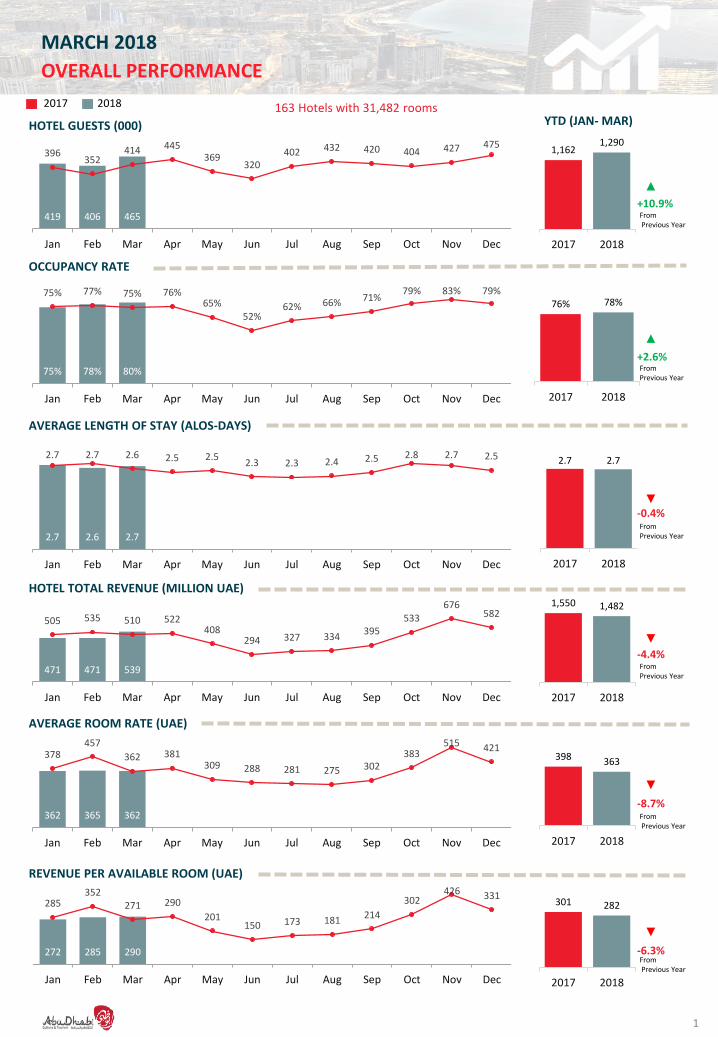
MARCH 2018
2017 2018
OVERALL PERFORMANCE
OCCUPANCY RATE
AVERAGE LENGTH OF STAY (ALOS-DAYS)
HOTEL TOTAL REVENUE (MILLION UAE)
AVERAGE ROOM RATE (UAE)
REVENUE PER AVAILABLE ROOM (UAE)
HOTEL GUESTS (000)
419 406 465 0 0 0 0 0 0 0 0 0
396352
414 445369
320402 432 420 404 427 475
Jan Feb Mar Apr May Jun Jul Aug Sep Oct Nov Dec
75% 78% 80% 0% 0% 0% 0% 0% 0% 0% 0% 0%
75% 77% 75% 76%65%
52%62% 66% 71%
79% 83% 79%
Jan Feb Mar Apr May Jun Jul Aug Sep Oct Nov Dec
2.7 2.6 2.7 0.0 0.0 0.0 0.0 0.0 0.0 0.0 0.0 0.0
2.7 2.7 2.6 2.5 2.52.3 2.3 2.4 2.5 2.8 2.7 2.5
Jan Feb Mar Apr May Jun Jul Aug Sep Oct Nov Dec
471 471 539 0 0 0 0 0 0 0 0 0
505 535 510 522408
294 327 334395
533
676582
Jan Feb Mar Apr May Jun Jul Aug Sep Oct Nov Dec
362 365 362 0 0 0 0 0 0 0 0 0
378457
362 381309 288 281 275 302
383515 421
Jan Feb Mar Apr May Jun Jul Aug Sep Oct Nov Dec
272 285 290 0 0 0 0 0 0 0 0 0
285352
271 290
201150 173 181
214
302426 331
Jan Feb Mar Apr May Jun Jul Aug Sep Oct Nov Dec
2.7 2.7
2017 2018
1,550 1,482
2017 2018
398 363
2017 2018
301 282
2017 2018
1
76% 78%
2017 2018
1,1621,290
2017 2018
163 Hotels with 31,482 rooms
From Previous Year
From Previous Year
From Previous Year
From Previous Year
From Previous Year
From Previous Year
YTD (JAN- MAR)
MARCH 2018
+10.9%
+2.6%
-0.4%
-4.4%
-8.7%
-6.3%
96.7
76.8
59.7
40.4
35.5
36.4
41.4
37.3
127.3
100.4
75.0
50.1
45.0
41.2
38.8
37.6
China
India
UK
United States
Germany
Egypt
Saudi Arabia
Philippines
2.2
1.4
2.8
4.03.7
4.5
2.82.3
2.02.3
1.5
2.6
3.63.1
4.4
2.8
2.2 2.0
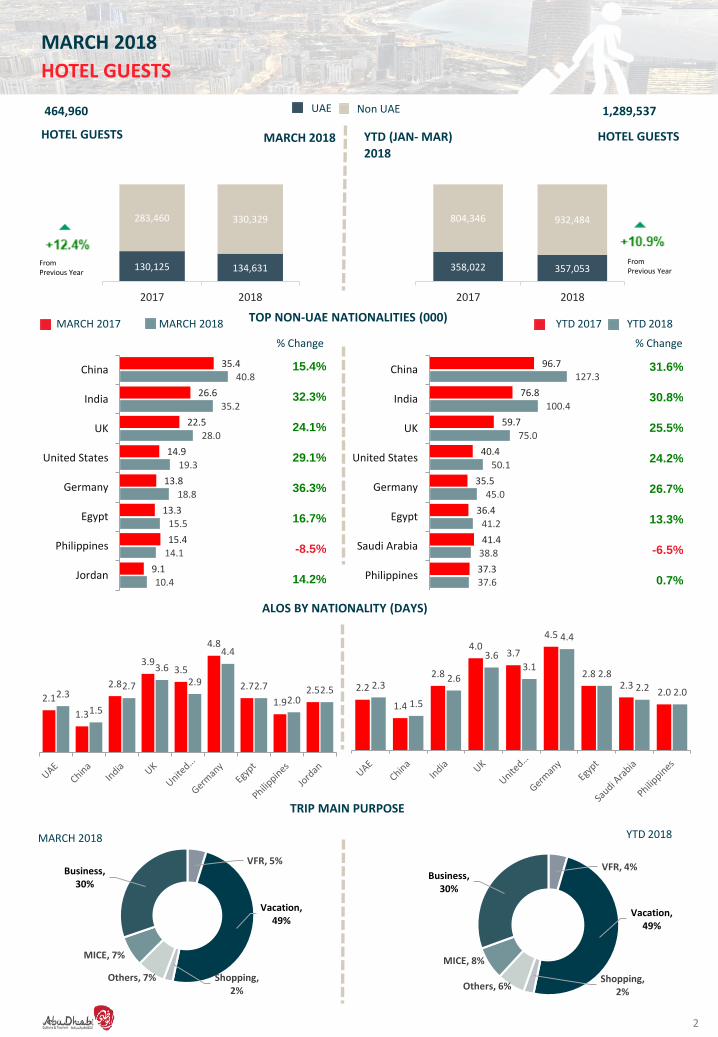
TOP NON-UAE NATIONALITIES (000)
% Change
HOTEL GUESTS
From Previous Year
HOTEL GUESTS HOTEL GUESTS
From Previous Year
130,125 134,631
283,460 330,329
2017 2018
358,022 357,053
804,346 932,484
2017 2018
35.4
26.6
22.5
14.9
13.8
13.3
15.4
9.1
40.8
35.2
28.0
19.3
18.8
15.5
14.1
10.4
China
India
UK
United States
Germany
Egypt
Philippines
Jordan
2
ALOS BY NATIONALITY (DAYS)
TRIP MAIN PURPOSE
% Change
Non UAEUAE
2.1
1.3
2.8
3.93.5
4.8
2.7
1.92.52.3
1.5
2.7
3.6
2.9
4.4
2.7
2.02.5
MARCH 2018
MARCH 2018 YTD (JAN- MAR)
464,960 1,289,537
15.4%
32.3%
24.1%
29.1%
36.3%
16.7%
-8.5%
14.2%
31.6%
30.8%
25.5%
24.2%
26.7%
13.3%
-6.5%
0.7%
2018
MARCH 2017 MARCH 2018 YTD 2017 YTD 2018
MARCH 2018 YTD 2018
VFR, 5%
Vacation, 49%
Shopping, 2%
Others, 7%
MICE, 7%
Business, 30%
VFR, 4%
Vacation, 49%
Shopping, 2%
Others, 6%
MICE, 8%
Business, 30%

GUESTS
OCCUPANCY RATE
ALOS DAYS
REVENUES (M AED)
ARR (AED)
REVPAR (AED)
PERFORMANCE BY REGION
GUESTS
OCCUPANCY RATE
ALOS DAYS
REVENUES (M AED)
ARR (AED)
REVPAR (AED)
25%
15%
7%
6%
6%
6%
UAE
China
Germany
Saudi Arabia
UK
India
26%
11%
8%
6%
4%
4%
UAE
China
India
UK
United States
Germany
ABU DHABI132 Hotels with 27,710 rooms
AL AIN20 Hotels with 2,565 rooms
AL DHAFRA11 Hotels with 1,207 rooms
3
ABU DHABI Al AIN Al DHAFRA
Actual % Change vs Previous Year Actual
% Change vsPrevious Year Actual
% Change vs Previous Year
ABU DHABI Al AIN Al DHAFRA
Actual % Change vsPrevious YTD
Actual % Change vsPrevious YTD
Actual % Change vsPrevious YTD
SUPPLY AND TOP NATIONALITIES - YTD
MARCH 2018
MARCH 2018
YTD (JAN- MAR) 2018
48%
9%
4%
4%
3%
3%
UAE
Oman
India
Egypt
Jordan
UK
409,768
83%
2.7
483.8
356
294
12.8%
8.7%
3.2%
6.3%
0.6%
9.3%
40,126
63%
2.1
29.1
301
188
5.3%
-6.2%
7.7%
-4.1%
-15.0%
-20.2%
15,066
54%
2.2
26.4
729
396
22.7%
-12.9%
-22.1%
7.6%
20.3%
4.8%
1,137,714
80%
2.7
1,333.9
357
288
11.3%
4.7%
0.4%
-4.5%
-9.6%
-5.4%
110,821
61%
2.0
79.4
299
182
4.8%
-9.6%
0.7%
-9.8%
-15.1%
-23.3%
41,002
50%
2.1
68.4
749
371
20.3%
-24.0%
-28.5%
3.8%
38.8%
5.6%
2018
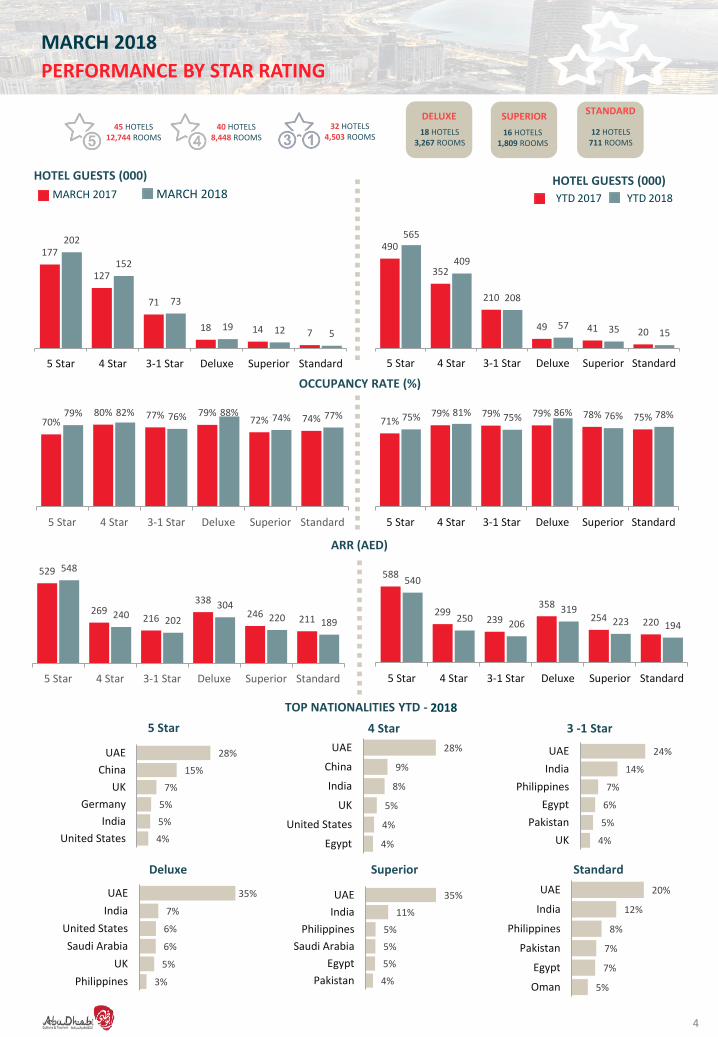
PERFORMANCE BY STAR RATING
HOTEL GUESTS (000)
OCCUPANCY RATE (%)
ARR (AED)
177
127
71
18 14 7
202
152
73
19 12 5
5 Star 4 Star 3-1 Star Deluxe Superior Standard
70%80% 77% 79%
72% 74%79% 82% 76% 88%
74% 77%
5 Star 4 Star 3-1 Star Deluxe Superior Standard
529
269216
338
246 211
548
240202
304220 189
5 Star 4 Star 3-1 Star Deluxe Superior Standard
490
352
210
49 41 20
565
409
208
57 35 15
5 Star 4 Star 3-1 Star Deluxe Superior Standard
71%79% 79% 79% 78% 75%75% 81% 75% 86% 76% 78%
5 Star 4 Star 3-1 Star Deluxe Superior Standard
588
299239
358
254 220
540
250206
319223 194
5 Star 4 Star 3-1 Star Deluxe Superior Standard
5 Star 4 Star 3 -1 Star
Deluxe Superior Standard
28%
15%
7%
5%
5%
4%
UAE
China
UK
Germany
India
United States
35%
7%
6%
6%
5%
3%
UAE
India
United States
Saudi Arabia
UK
Philippines
28%
9%
8%
5%
4%
4%
UAE
China
India
UK
United States
Egypt
24%
14%
7%
6%
5%
4%
UAE
India
Philippines
Egypt
Pakistan
UK
35%
11%
5%
5%
5%
4%
UAE
India
Philippines
Saudi Arabia
Egypt
Pakistan
20%
12%
8%
7%
7%
5%
UAE
India
Philippines
Pakistan
Egypt
Oman
HOTEL GUESTS (000)
4
45 HOTELS12,744 ROOMS
40 HOTELS8,448 ROOMS
32 HOTELS4,503 ROOMS
DELUXE
18 HOTELS3,267 ROOMS
SUPERIORSTANDARD
16 HOTELS1,809 ROOMS
12 HOTELS711 ROOMS
MARCH 2018
TOP NATIONALITIES YTD - 2018
MARCH 2017 MARCH 2018 YTD 2017 YTD 2018
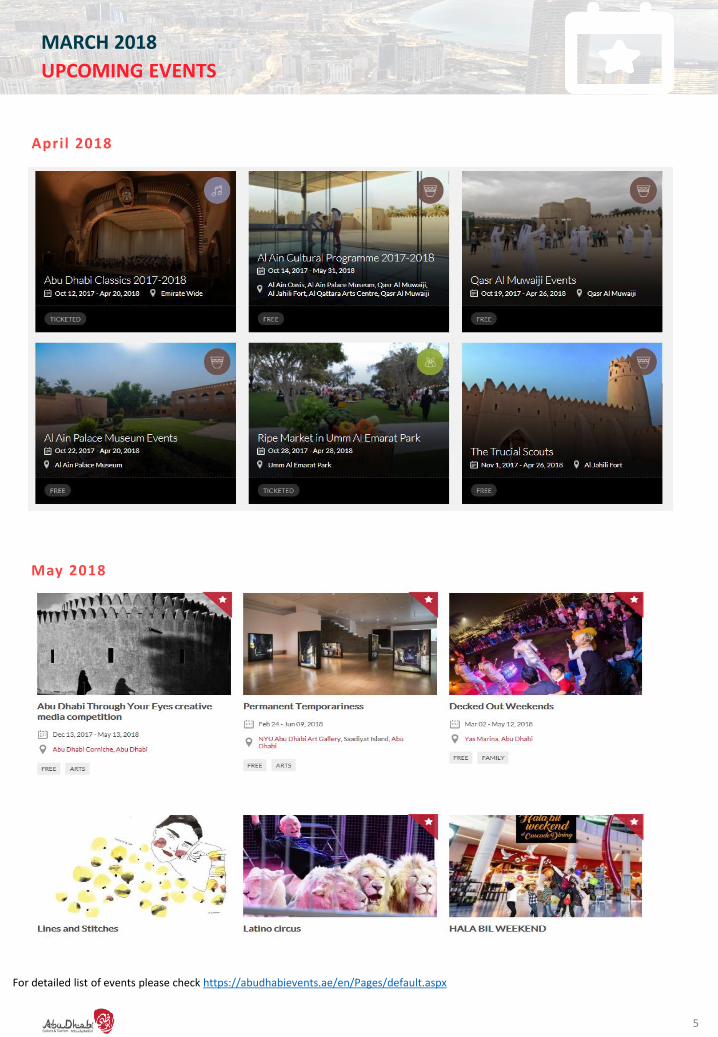
UPCOMING EVENTS
April 2018
31
May 2018
5
For detailed list of events please check https://abudhabievents.ae/en/Pages/default.aspx
MARCH 2018
MARCH 2018
DCT ABU DHABI NEWS
6
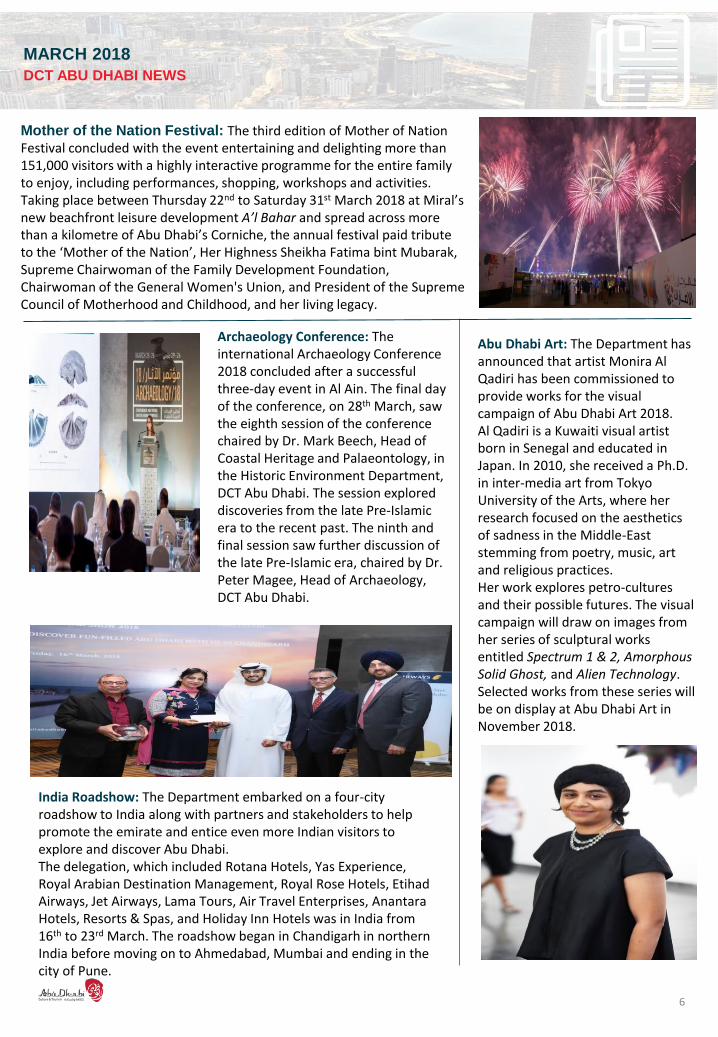
Mother of the Nation Festival: The third edition of Mother of Nation Festival concluded with the event entertaining and delighting more than 151,000 visitors with a highly interactive programme for the entire family to enjoy, including performances, shopping, workshops and activities. Taking place between Thursday 22nd to Saturday 31st March 2018 at Miral’snew beachfront leisure development A’l Bahar and spread across more than a kilometre of Abu Dhabi’s Corniche, the annual festival paid tribute to the ‘Mother of the Nation’, Her Highness Sheikha Fatima bint Mubarak, Supreme Chairwoman of the Family Development Foundation, Chairwoman of the General Women's Union, and President of the Supreme Council of Motherhood and Childhood, and her living legacy.
Abu Dhabi Art: The Department has announced that artist Monira Al Qadiri has been commissioned to provide works for the visual campaign of Abu Dhabi Art 2018. Al Qadiri is a Kuwaiti visual artist born in Senegal and educated in Japan. In 2010, she received a Ph.D. in inter-media art from Tokyo University of the Arts, where her research focused on the aesthetics of sadness in the Middle-East stemming from poetry, music, art and religious practices. Her work explores petro-cultures and their possible futures. The visual campaign will draw on images from her series of sculptural works entitled Spectrum 1 & 2, Amorphous Solid Ghost, and Alien Technology.Selected works from these series will be on display at Abu Dhabi Art in November 2018.
India Roadshow: The Department embarked on a four-city roadshow to India along with partners and stakeholders to help promote the emirate and entice even more Indian visitors to explore and discover Abu Dhabi.The delegation, which included Rotana Hotels, Yas Experience, Royal Arabian Destination Management, Royal Rose Hotels, Etihad Airways, Jet Airways, Lama Tours, Air Travel Enterprises, AnantaraHotels, Resorts & Spas, and Holiday Inn Hotels was in India from 16th to 23rd March. The roadshow began in Chandigarh in northern India before moving on to Ahmedabad, Mumbai and ending in the city of Pune.
Archaeology Conference: The international Archaeology Conference 2018 concluded after a successful three-day event in Al Ain. The final day of the conference, on 28th March, saw the eighth session of the conference chaired by Dr. Mark Beech, Head of Coastal Heritage and Palaeontology, in the Historic Environment Department, DCT Abu Dhabi. The session explored discoveries from the late Pre-Islamic era to the recent past. The ninth and final session saw further discussion of the late Pre-Islamic era, chaired by Dr.Peter Magee, Head of Archaeology, DCT Abu Dhabi.

GLOSSARY
7
Disclaimer:All rights reserved. Report content is based on available information at the time of publishing and is subject to change without notice when more accurate or complete data is available
Guest arrivals
Number of registered guest arrivals (check-ins) including those who occupied complimentary or non-revenue generating rooms either for day-stay or overnight stay
Average Lengthof StayALOS
Average number of nights guests spent in a single stay, calculated by dividing guest nights by guest arrivals
Available rooms
Number of rooms available during the month covered by the report excluding out-of-order (a room status term indicating that a room is scheduled for maintenance, refurbishment, deep cleaning, etc.)
Occupancy is the percentage of available rooms that are occupied, calculated by dividing the number of occupied rooms by the available rooms.
Occupancy Rate, %
Guests Nights
Number of night guests spent in the hotel regardless of the type of rooms they occupy
Total revenues
Revenue generated by hotels from all their operations, including service charge and taxes
Average room(daily) rateARR/ADR
A ratio that indicates average room rate and to what extent rooms are being up-sold or discounted; calculated by dividing room revenue by the number of occupied rooms.(Note: Based on paid rooms only, excluding complimentary and house use but service charge)
Revenue peravailable room
RevPAR
Revenue per Available rooms, calculated by dividing the total revenues by total rooms in hotel minus out-of-service rooms
Occupied rooms
Number of rooms used daily, including complimentary and house use
MARCH 2018