Embed Size (px)
Citation preview
1 © 2008 Studer Groupwww.studergroup.com
Hourly Rounding in the Emergency Department and Inpatient Areas
Becky Montesino, RN, BSN, MSVice President/Chief Nursing Officer
Baptist Hospital, Miami, Florida
What’s Right in Health CareSM | Evidence to Outcomes
Presentation Objectives
• Describe the art and science of “hourly rounding”– Purpose– Process
• List expected outcomes of “hourly rounding”– Inpatient results– Emergency Department results
• Identify the return on investment potential from hourly rounding

2 © 2008 Studer Groupwww.studergroup.com
What’s Right in Health CareSM | Evidence to Outcomes
What’s Right in Health CareSM | Evidence to Outcomes
You are not alone
•WE ARE JUST LIKE YOU.
•WE HAVE THE SAME
CHALLENGES.
3 © 2008 Studer Groupwww.studergroup.com
What’s Right in Health CareSM | Evidence to Outcomes
WELCOME TO BAPTIST
What’s Right in Health CareSM | Evidence to Outcomes
Hourly Rounding
• A REPETITIVE PATIENT CENTERED ACTIVITY FOR SAFETY, COMFORT, PATIENT SATISFACTION AND EVERYONE’S PEACE OF MIND.
• WITH THESE GOALS IN MIND,WHO WOULDN’T WANT TO ROUND?
• WE HAD GREAT OUTCOMES AND A VISIBLE ROI.
4 © 2008 Studer Groupwww.studergroup.com
What’s Right in Health CareSM | Evidence to Outcomes
Introduction to Leadership
• HEY, EVERYONE, OUR RESULTS ARE NOT SO GOOD! (IP=74; ED=4)
• HERE IS WHERE WE NEED TO BE…(IP=90, ED=50)
• HERE IS WHY…(HINT: PATIENT)
• AND…HERE IS HOW WE ARE GOING TO DO IT!
What’s Right in Health CareSM | Evidence to Outcomes
Leadership Development
• ROUNDING IS AN ART
• ROUNDING IS FOR A PURPOSE AND• HAS OUTCOMES ASSOCIATED WITH
IT
• ROUNDING EDUCATION IS A MUST
• SCRIPTING

5 © 2008 Studer Groupwww.studergroup.com
What’s Right in Health CareSM | Evidence to Outcomes
Rounding Tools
• ROUNDING LOGS
• WHITE BOARDS
• ROUNDING ON ROUNDING
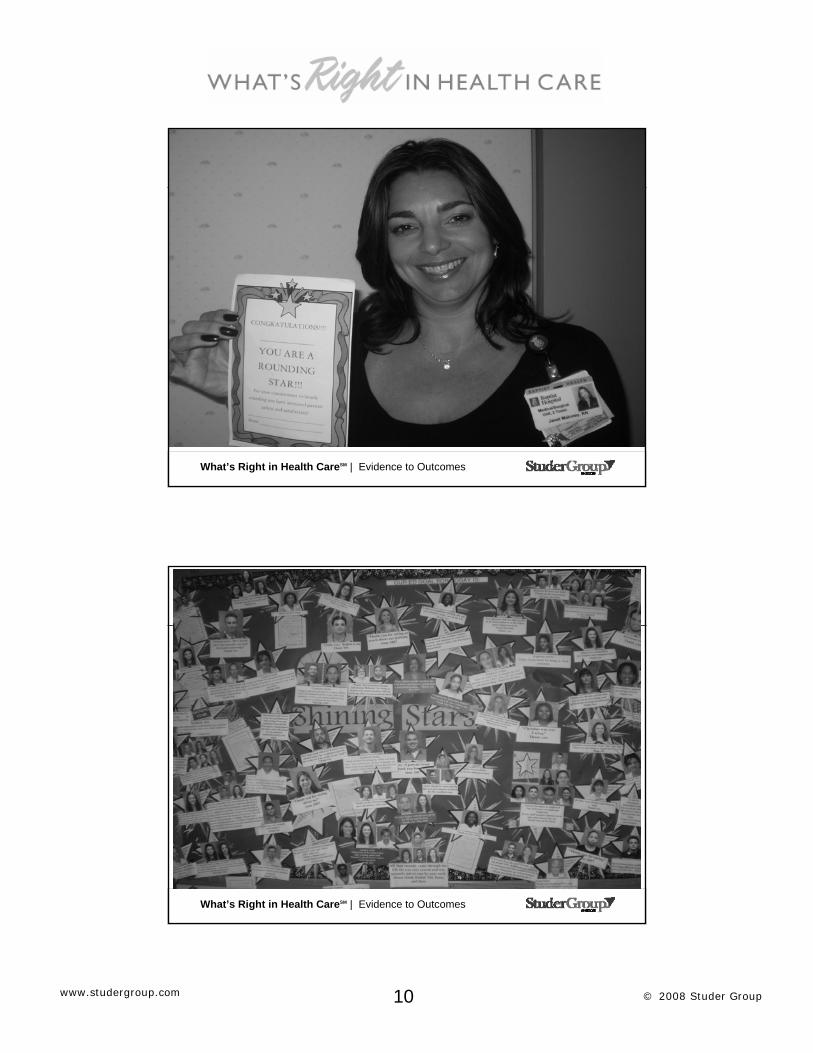
• REWARDS AND RECOGNITION
What’s Right in Health CareSM | Evidence to Outcomes
Accountability
• THIS IS THE HARD PART
• IT STARTS AT THE TOP
• YOU NEED THE RIGHT PEOPLE ON THE BUS
• YOU CAN’T LET UP

6 © 2008 Studer Groupwww.studergroup.com
What’s Right in Health CareSM | Evidence to Outcomes
Service
• Weekly Accountability Tool
• Contains Leader’s Names
BAPTIST HOSPITAL OF MIAMIPatient Satisfaction Report
How to Use this Report Please post these results on the communications board in your unit under the SERVICE pillar by Friday. Carry a copy of this report with you at all times so you can communicate results while rounding with staff and during staff meetings.
Our goal is the 90th percentile for all areas.
Quarter-to-date ending on: Feb. 23 Mar. 1 # of
surveys returned
Inpatient 96 93 789 Emergency (Adult) 30 33 617 Outpatient Surgery 77 76 158 Outpatient Services 94 91 426
1 East Lake - M. Guignard 99 99 25 2 Tower – J. Maloney 90 80 62 3 Tower - M. Suarez-Cantillo 63 59 72 4 Tower - L.Lorenzo 11 19 62 5 Tower - C. Bowling 99 99 38 3 Main - M. Guignard 95 95 68 4 Main - R. Cordo 59 79 32 5 Main - S. Ocon 99 81 26 Rehab - E. Matalon 96 98 13 Women’s Srvc - M. Perez 99 99 59 4 BCVI - D. Thomas 99 99 82 OB - B. Roberts, M. Perez 92 90 124 Peds/PICU - L. McCarthy 99 99 85 NICU - M. Olmeda 37 70 12 Short Stay - R. Maluf-Contreras 99 99 50 ICU - B. Stolzenberg 90 90 132
Admissions 72 67 779 Rooms 97 94 788
Meals 98 97 772 Nurses 93 91 789
Tests and Treatments 93 93 759 Visitors and Family 85 73 768
Physicians 84 82 782 Hospitalists - Dr. Villanueva 96 94 84
Discharge 94 94 774 Personal Issues 96 95 776 Emergency Department
ER Peds - M. Decady-Alexis 89 90 300 Arrival 85 85 299 Nurses 91 92 298
Physicians 83 87 298 Tests 87 89 190
Personal Issues 91 91 295 ER Adult - M. Rafuls and 30 33 617 S. Balbosa-Saunders Arrival 15 14 612
Nurses 28 33 608 Physicians 52 57 607
Tests 35 40 551 Personal Issues 32 36 608
Outpatient Services
Quarter-to-date ending on: Feb. 23 Mar. 1 # of
surveys returned
Urology Lab - S. Callis 99 32 11 Radiation Therapy - G. Weiss 99 99 25 Sleep Center - A. Vinent 91 72 31 Nuclear Medicine - S. Bracci 99 93 46 PET - S. Bracci 93 98 37 Pulmonary - A. Vinent 99 99 24
BCVI - J. Kiah & D. Rodríguez 92 92 340
Endoscopy - D. Phillips 99 99 23 Ultrasound - S. Bracci 99 99 58 CT - S. Callis 4 8 27 Oncology - C. Bowling 99 99 10 Plain films/Flouro - S. Callis 73 89 31 EEG - S. Holan 99 99 7 OP Ortho Rehab - C. Larco 56 46 38 OP Neuro Rehab - R. Mojica 52 48 40
Registration 73 67 413 Facility 89 86 420
Test and Treatments 98 97 423 Personal Issues 89 84 413
Registration Areas
IP/OP Registration - K. Folkman 75 72 1051
OPS/BCVI Registration - M. Sousa 80 84 536
ED Registration - M. Basden 71 69 885
HCAHPS Overall Rating 78 77 100
Would you recommend 86 86 99 HCAHPS Results are % of Top Box Responses
Priority Index Focus
Quarter-to-date:
Inpa
tient
Out
patie
nt
Surg
ery
Out
patie
nt
Serv
ices
Emer
genc
y
Response to concerns and complaints 94 65 74 n/a
What’s Right in Health CareSM | Evidence to Outcomes
Inpatient Rounding
• ROLL-OUT ON PATIENT CARE CENTERS (“You want me to do what???”)
• BUY-IN FROM STAFF (“I won’t do it.”) (“I can’t possibly have time.”)
• CHALLENGES…
• REMEMBER THAT OUR GOAL WAS TO IMPROVE PATIENT SATISFACTION

7 © 2008 Studer Groupwww.studergroup.com
What’s Right in Health CareSM | Evidence to Outcomes
ED Rounding
• “YOU HAVE GOT TO BE KIDDING. OUR NURSES ARE NOT GOING TO DO THAT.”
• SOME OF THEM DIDN’T.• THEY WEREN’T ON THE RIGHT BUS.
• THE NURSE MANAGERS HAD TO LEAD THIS AND ONCE THEY DECIDED TO DRIVE THE BUS, WE WERE ON OUR WAY.
What’s Right in Health CareSM | Evidence to Outcomes
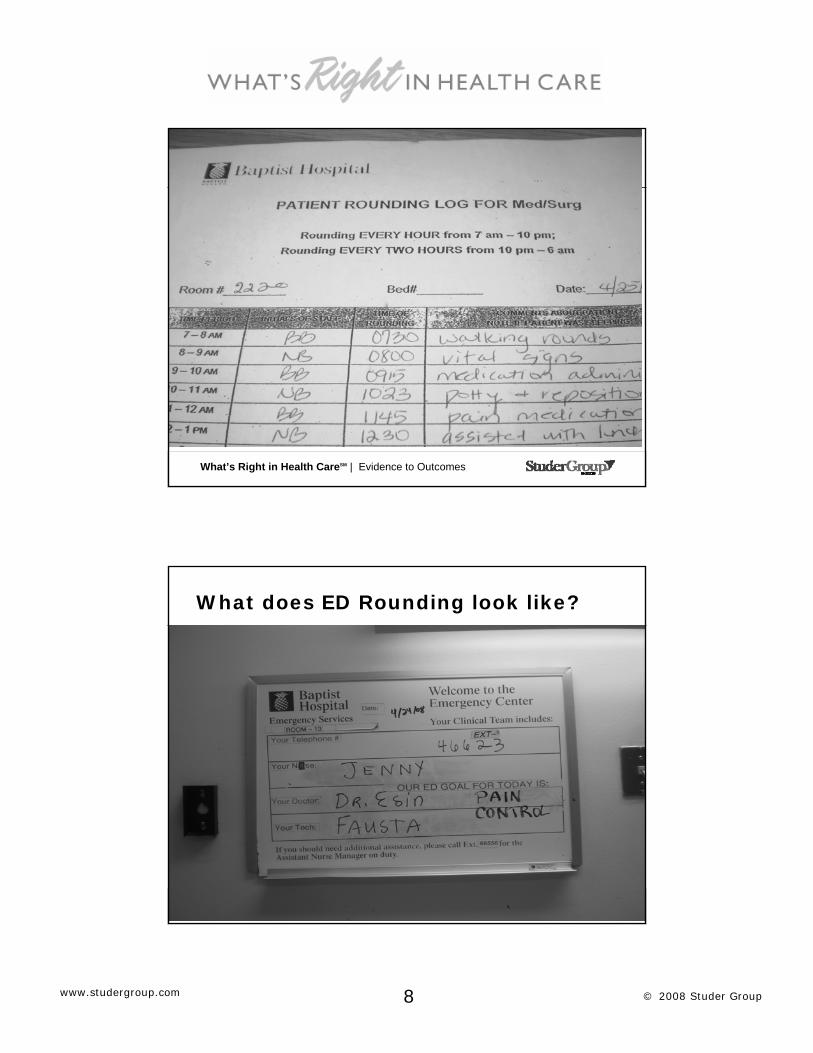
What does rounding look like?
• Insert rounding checklist photo
8 © 2008 Studer Groupwww.studergroup.com
What’s Right in Health CareSM | Evidence to Outcomes
What’s Right in Health CareSM | Evidence to Outcomes
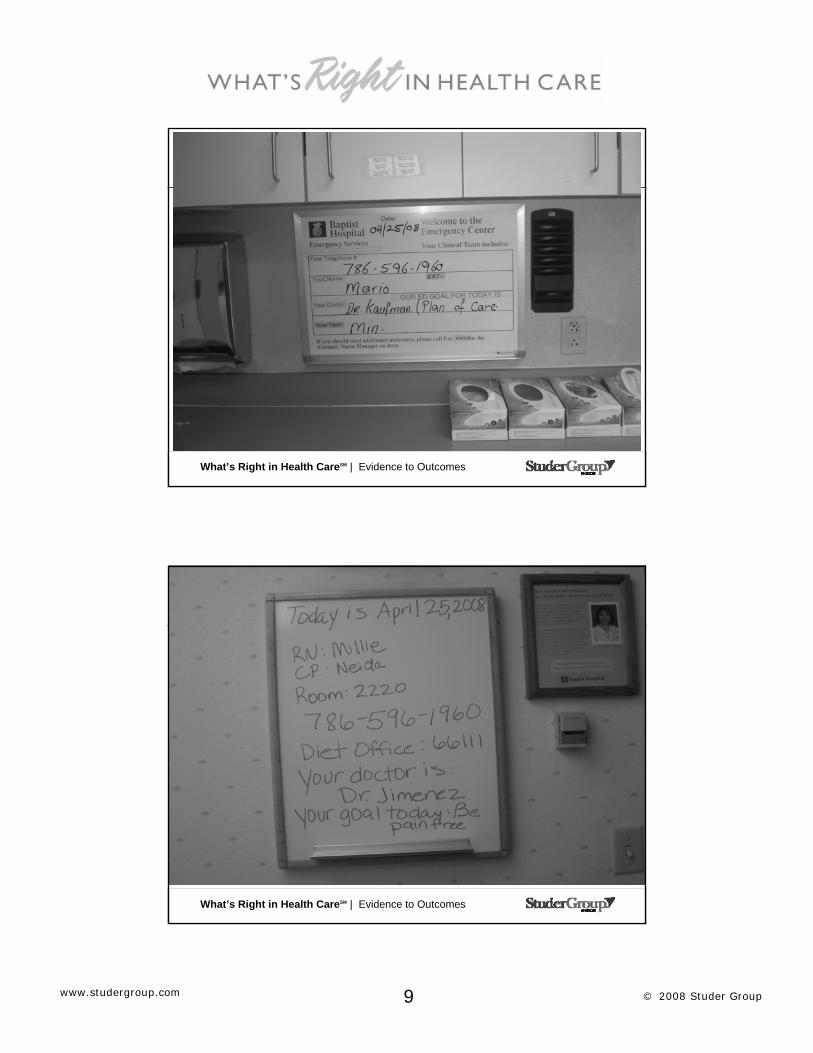
What does ED Rounding look like?
• Insert photo of white board
9 © 2008 Studer Groupwww.studergroup.com
What’s Right in Health CareSM | Evidence to Outcomes
What’s Right in Health CareSM | Evidence to Outcomes
10 © 2008 Studer Groupwww.studergroup.com
What’s Right in Health CareSM | Evidence to Outcomes
What’s Right in Health CareSM | Evidence to Outcomes
11 © 2008 Studer Groupwww.studergroup.com
What’s Right in Health CareSM | Evidence to Outcomes
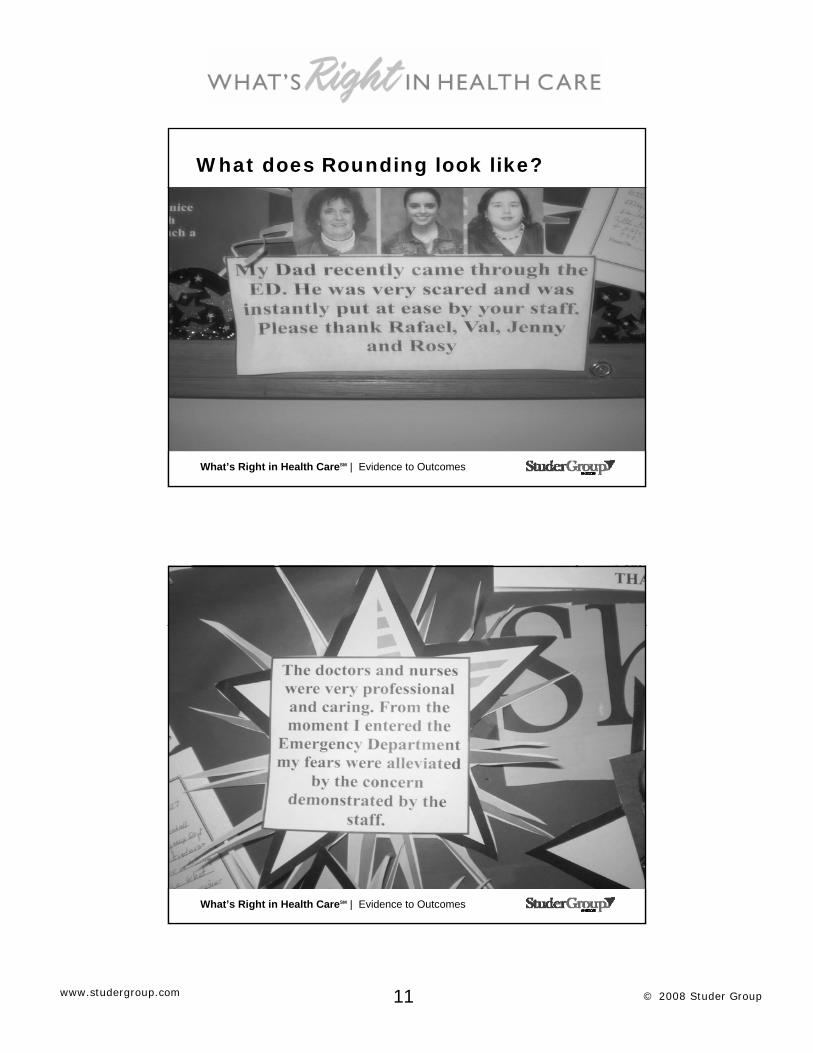
What does Rounding look like?
• Insert white board photo
What’s Right in Health CareSM | Evidence to Outcomes
WHAT DOES ED ROUNDING LOOK LIKE?
• Insert photo of me checking logs
12 © 2008 Studer Groupwww.studergroup.com
What’s Right in Health CareSM | Evidence to Outcomes
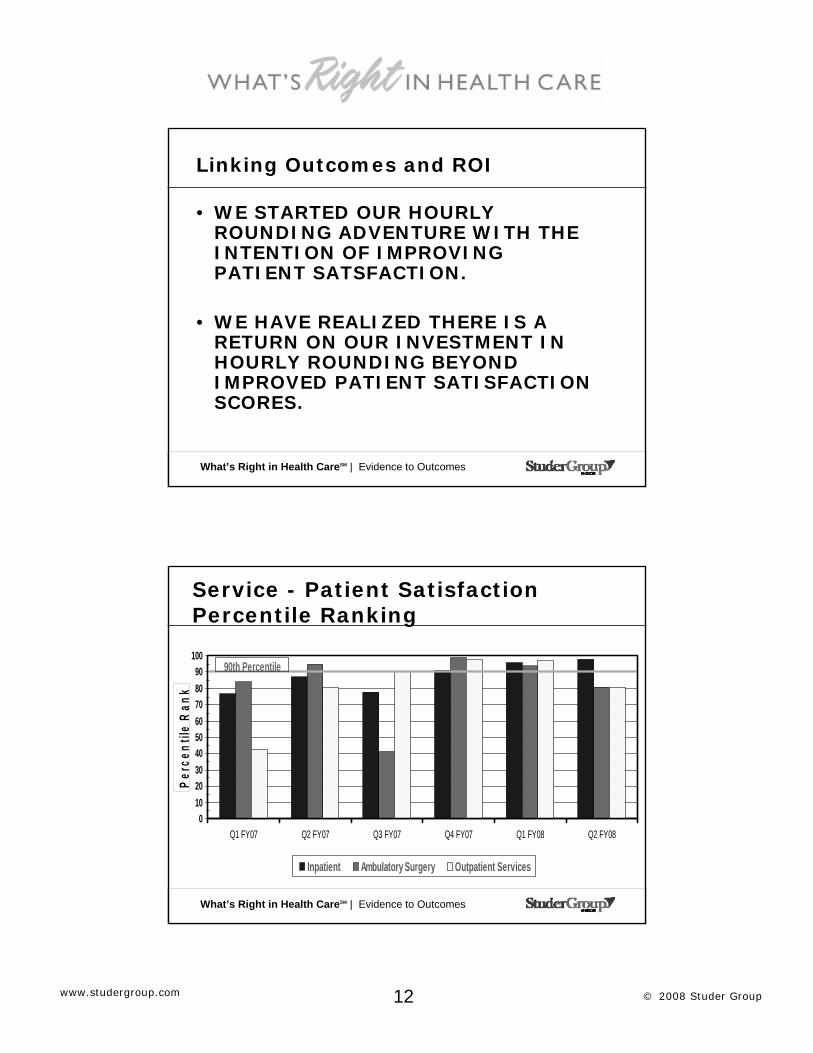
Linking Outcomes and ROI
• WE STARTED OUR HOURLY ROUNDING ADVENTURE WITH THE INTENTION OF IMPROVING PATIENT SATSFACTION.
• WE HAVE REALIZED THERE IS A RETURN ON OUR INVESTMENT IN HOURLY ROUNDING BEYOND IMPROVED PATIENT SATISFACTION SCORES.
What’s Right in Health CareSM | Evidence to Outcomes
Service - Patient Satisfaction Percentile Ranking
0102030405060708090
100
Q1 FY07 Q2 FY07 Q3 FY07 Q4 FY07 Q1 FY08 Q2 FY08
Perc
entil
e R
ank
Inpatient Ambulatory Surgery Outpatient Services
90th Percentile
13 © 2008 Studer Groupwww.studergroup.com
What’s Right in Health CareSM | Evidence to Outcomes
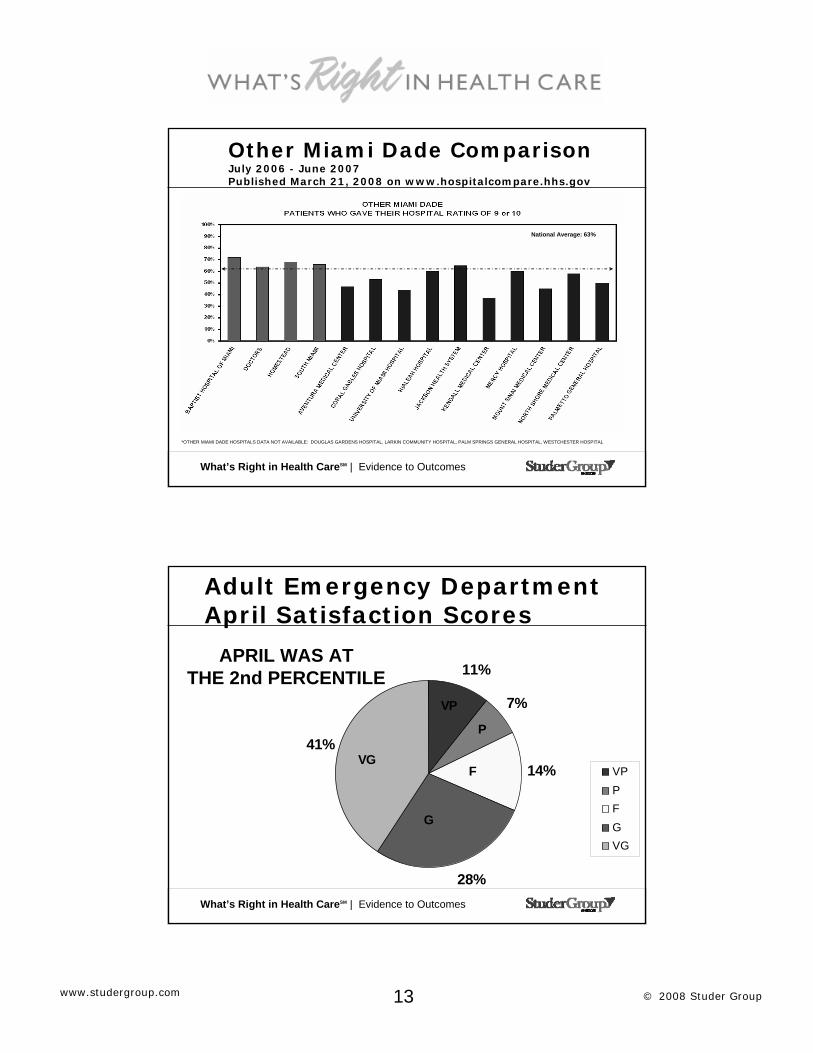
Other Miami Dade ComparisonJuly 2006 - June 2007Published March 21, 2008 on www.hospitalcompare.hhs.gov
National Average: 63%
*OTHER MIAMI DADE HOSPITALS DATA NOT AVAILABLE: DOUGLAS GARDENS HOSPITAL, LARKIN COMMUNITY HOSPITAL, PALM SPRINGS GENERAL HOSPITAL, WESTCHESTER HOSPITAL
What’s Right in Health CareSM | Evidence to Outcomes
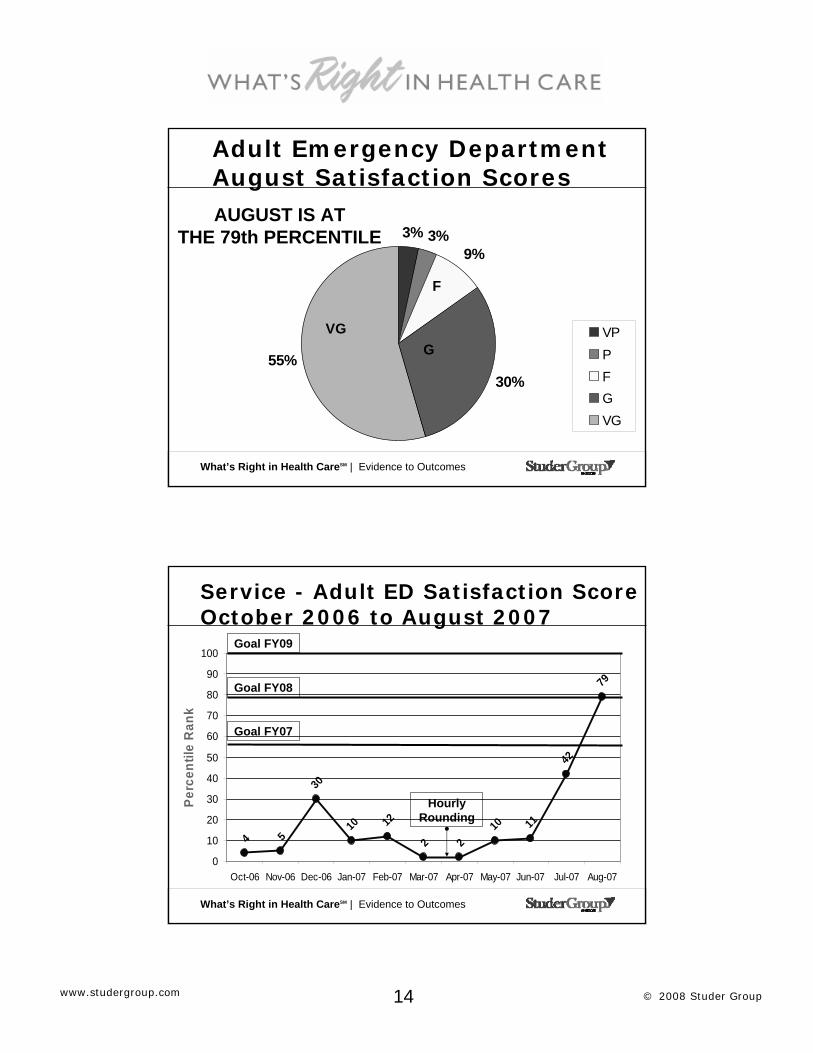
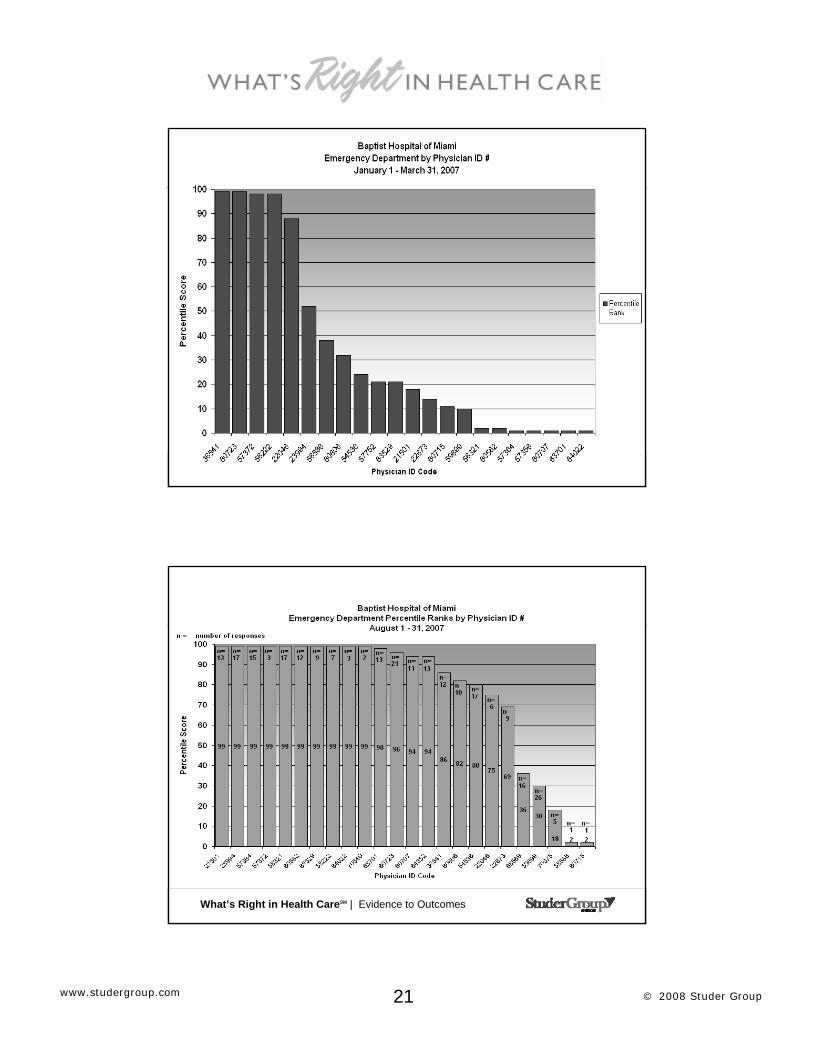
Adult Emergency Department April Satisfaction Scores
11%
7%
14%
28%
41%
VPPFGVG
VG
P
VP
F
G
APRIL WAS ATTHE 2nd PERCENTILE
14 © 2008 Studer Groupwww.studergroup.com
What’s Right in Health CareSM | Evidence to Outcomes
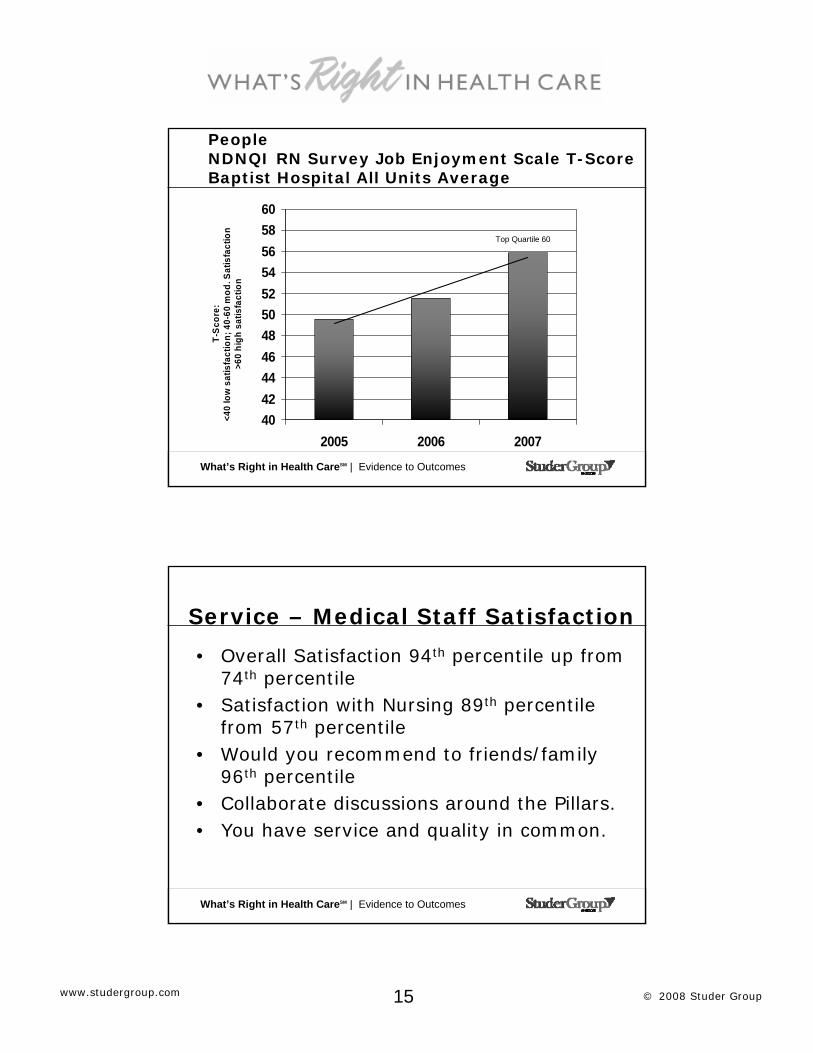
Adult Emergency Department August Satisfaction Scores
3% 3%9%
30%55%
VPPFGVG
VG
F
G
AUGUST IS ATTHE 79th PERCENTILE
What’s Right in Health CareSM | Evidence to Outcomes
4 5
30
10 12
2 210 11
42
79
0
10
20
30
40
50
60
70
80
90
100
Oct-06 Nov-06 Dec-06 Jan-07 Feb-07 Mar-07 Apr-07 May-07 Jun-07 Jul-07 Aug-07
Perc
entil
e R
ank
Hourly Rounding
Goal FY07
Goal FY08
Goal FY09
Service - Adult ED Satisfaction Score October 2006 to August 2007
15 © 2008 Studer Groupwww.studergroup.com
What’s Right in Health CareSM | Evidence to Outcomes
PeopleNDNQI RN Survey Job Enjoyment Scale T-ScoreBaptist Hospital All Units Average
4042444648505254565860
2005 2006 2007
T-Sc
ore:
<4
0 lo
w s
atis
fact
ion;
40-
60 m
od. S
atis
fact
ion
>6
0 hi
gh s
atis
fact
ion
Top Quartile 60
What’s Right in Health CareSM | Evidence to Outcomes
Service – Medical Staff Satisfaction
• Overall Satisfaction 94th percentile up from 74th percentile
• Satisfaction with Nursing 89th percentile from 57th percentile
• Would you recommend to friends/family 96th percentile
• Collaborate discussions around the Pillars.• You have service and quality in common.
16 © 2008 Studer Groupwww.studergroup.com
What’s Right in Health CareSM | Evidence to Outcomes
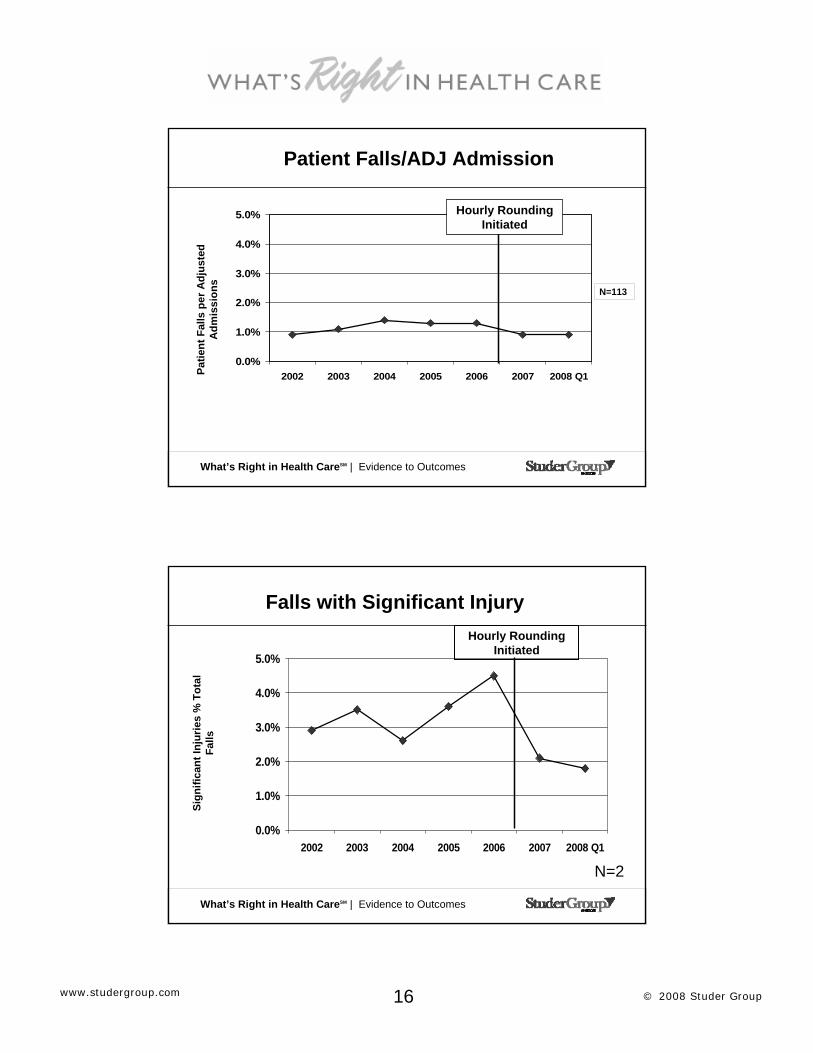
Patient Falls/ADJ Admission
0.0%
1.0%
2.0%
3.0%
4.0%
5.0%
2002 2003 2004 2005 2006 2007 2008 Q1
Hourly Rounding Initiated
Patie
nt F
alls
per
Adj
uste
d A
dmis
sion
s
N=113
What’s Right in Health CareSM | Evidence to Outcomes
Falls with Significant Injury
0.0%
1.0%
2.0%
3.0%
4.0%
5.0%
2002 2003 2004 2005 2006 2007 2008 Q1
Sign
ifica
nt In
jurie
s %
Tot
al
Falls
N=2
Hourly Rounding Initiated
17 © 2008 Studer Groupwww.studergroup.com
What’s Right in Health CareSM | Evidence to Outcomes
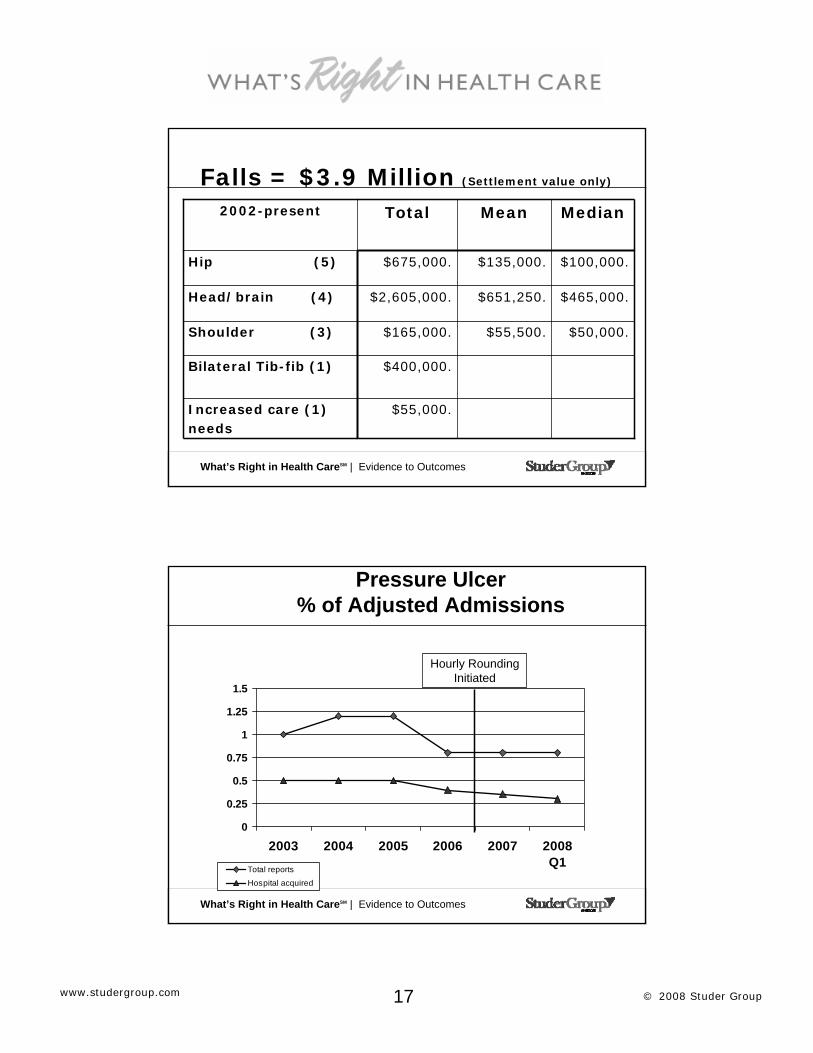
$55,000.Increased care (1)needs
$400,000. Bilateral Tib-fib (1)
$50,000.$55,500.$165,000.Shoulder (3)
$465,000.$651,250.$2,605,000.Head/brain (4)
$100,000.$135,000.$675,000.Hip (5)
MedianMeanTotal2002-present
Falls = $3.9 Million (Settlement value only)
What’s Right in Health CareSM | Evidence to Outcomes
0
0.25
0.5
0.75
1
1.25
1.5
2003 2004 2005 2006 2007 2008Q1
Total reports
Hospital acquired
Pressure Ulcer % of Adjusted Admissions
Hourly Rounding Initiated
18 © 2008 Studer Groupwww.studergroup.com
What’s Right in Health CareSM | Evidence to Outcomes
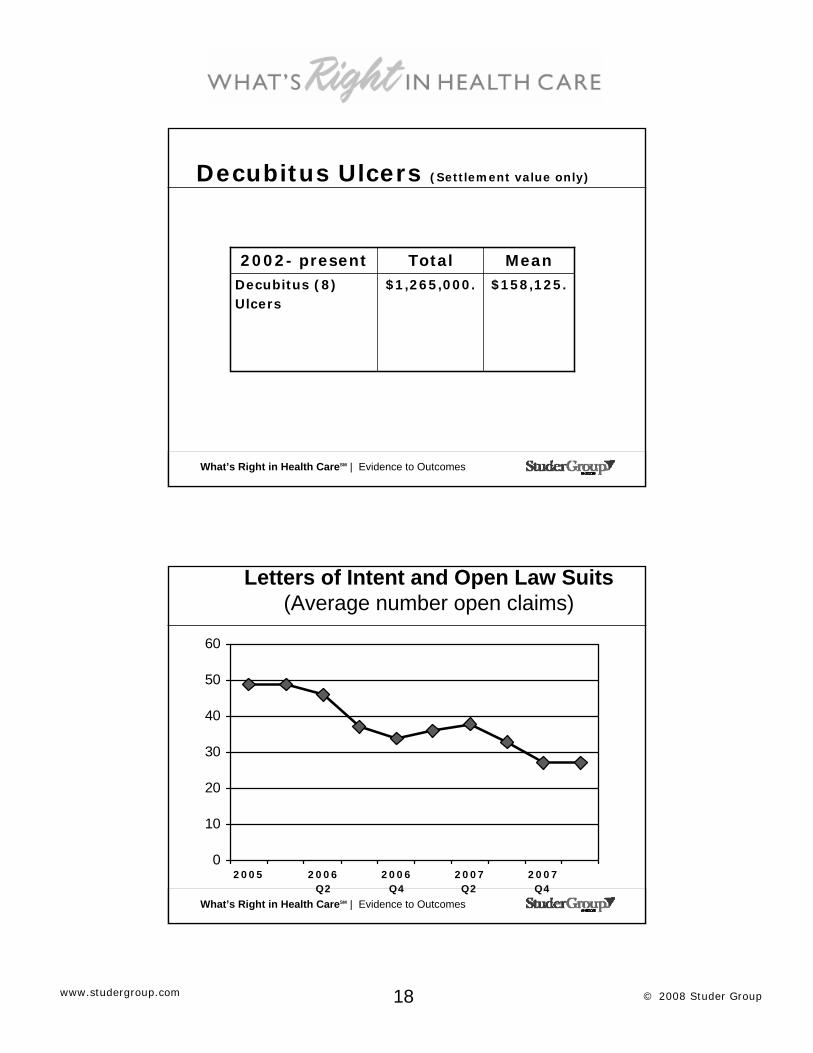
Decubitus Ulcers (Settlement value only)
$158,125.$1,265,000.Decubitus (8)Ulcers
MeanTotal2002- present
What’s Right in Health CareSM | Evidence to Outcomes
0
10
20
30
40
50
60
2 0 0 5 2 0 0 6Q2
2 0 0 6Q4
2 0 0 7Q2
2 0 0 7Q4
Letters of Intent and Open Law Suits(Average number open claims)
19 © 2008 Studer Groupwww.studergroup.com
What’s Right in Health CareSM | Evidence to Outcomes
Good News
• WE HAVE JUST BEEN INFORMED THAT OUR INSURER HAS REDUCED THE AMOUNT OF INSURANCE WE
ARE REQUIRED TO CARRY BY SEVERAL MILLION DOLLARS.
What’s Right in Health CareSM | Evidence to Outcomes
ED Lobby Rounding
• WE WANTED TO REDUCE LWBS.• IT MEANT WE WOULD NEED TO
ROUND IN THE LOBBY.• HOW DO YOU DO THAT?• INTRODUCING HUDDLE ROUNDS.• REQUIRING ROUNDING LOGS.• ASSIGNING HOURLY ROUNDS.
• IT WORKS!!
20 © 2008 Studer Groupwww.studergroup.com
What’s Right in Health CareSM | Evidence to Outcomes
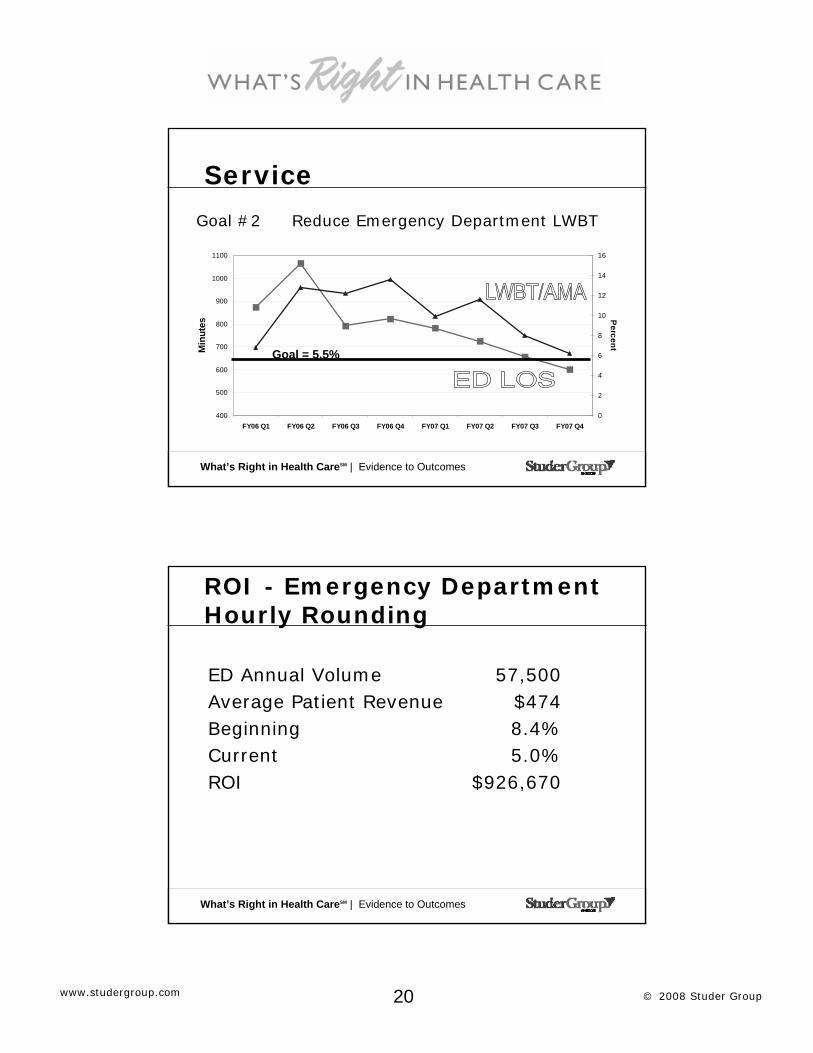
Service
400
500
600
700
800
900
1000
1100
FY06 Q1 FY06 Q2 FY06 Q3 FY06 Q4 FY07 Q1 FY07 Q2 FY07 Q3 FY07 Q4
Min
utes
0
2
4
6
8
10
12
14
16
Percent
Goal #2 Reduce Emergency Department LWBT
Goal = 5.5%
What’s Right in Health CareSM | Evidence to Outcomes
ROI - Emergency DepartmentHourly Rounding
ED Annual VolumeAverage Patient RevenueBeginningCurrentROI
57,500$4748.4%5.0%
$926,670
21 © 2008 Studer Groupwww.studergroup.com
What’s Right in Health CareSM | Evidence to Outcomes
What’s Right in Health CareSM | Evidence to Outcomes

22 © 2008 Studer Groupwww.studergroup.com
What’s Right in Health CareSM | Evidence to Outcomes
Finance – Hospital Margin
7.7%
3.3%2.3%
0.0%
1.0%
2.0%
3.0%
4.0%
5.0%
6.0%
7.0%
8.0%
'07 Actual '07 Budget '06 Actual
What’s Right in Health CareSM | Evidence to Outcomes
23 © 2008 Studer Groupwww.studergroup.com
What’s Right in Health CareSM | Evidence to Outcomes
Growth
Thank You!
Becky Montesino, RN, BSN, MSVP/CNO, Baptist Hospital, Miami, FL