Embed Size (px)
Citation preview

House View
May 03 , 2015

1. UAE Markets –Trending up on higher volumes! 2. Europe – Watch out for Greece…tread cautiously 3. United States (U.S.) – At an all time high….prefer value plays 4. India – Fundamentals Intact despite recent market volatility 5. Oil – Solid Rebound… 6. Gold - Subdued in short term; Long term view remains supportive
2
I- Themes

UAE Markets –Trending up on higher volumes!
Fundamentals of the GCC nations remain strong
• Unique combination of growth and dividend yield. The DFMGI is offering a dividend yield of ~5.2%, and exhibits an average 15% earnings growth in over the next 2 years
• Highest volumes recorded in 2015 in the last few sessions – touched AED 2.5bn – A level not seen since November 2014
• The valuations have approached attractive territories as the market trades at near 12x P/E (~15% discount to its historical average) – Market shifted from Growth to Value play. Index back above the 4100 mark!
• As per our internal equity valuation model, over the next 1.5 year, we can expect a near 18% p.a. total market return from the current levels. Contributors to this return could be the dividend yield, earnings growth and the expansion in valuation multiple themselves
MENA: Earnings season
• UAE :Banks reported good set of numbers – near 21% earnings growth (Y-o-Y), followed by Telecom and Real estate (Emaar Malls reported around 32% growth in earnings)
• SAUDI: Savola – 11%, Saudi Telecom – 4.6%, SABIC – Negative 39%
• QATAR: Industrials and Telecom take the hit: Industries Qatar – Negative 40%, Ooredoo, Negative 43%, Barwa Real Estate – 55%
Risks: Deterioration in sentimental factors could weigh on markets…
• Any weakness in Oil prices
• Softness in real estate markets (Composition of Real Estate in DFMGI is just under 20%) in the UAE
• Rise in geopolitical tension Source: Bloomberg, Mashreq Private Banking
Rationale
1. Funds:
• Makaseb Arab Tigers
• Mashreq Al-Islami Income Fund
2. GCC Trackers:
• MEET (Middle East Equity Tracker)
• GCC High Dividend Yield Tracker
Products
DFM Weekly Chart
Support Levels : 4000 / 3800 Resistance Levels: 4300 / 4700

Mutual Funds:
• Schroder Euro Equity – To play the broad European Market
• Schroder Dividend Maximizer & Schroder Multi Asset Income Fund – To play the High Dividend Yield Strategies
ETFs:
• Wisdom Tree Europe Hedged Equity Fund – To play the export oriented businesses
• SPDR MSCI Europe Consumer Staples, SPDR MSCI Europe Consumer Discretionary – To benefit from the low energy prices
• iShares MSCI Europe Financials – To benefit from the Quantitative Easing (QE)
Structured Products:
• Product linked to EUR/USD – A play on the EURO volatility
• 5 Years Capital Guaranteed product on Indices (Approved by the Central Bank)–
Underlying basket: S&P 500, Eurostoxx 50 & Nikkei 225
Coupon: Guaranteed – 2% p.a ; conditional – 2.5% p.a
Europe – Watch out for Greece…tread cautiously
Quantitative Easing (QE)
• Euro 1.1 trillion ECB Stimulus increases the ‘Cheap Money’ in the system -> aids growth
• QE increases the money supply which promote increased lending and liquidity and hence positively impacting the economic activity
Weak Euro is a boon
• Near 20% fall in the Euro against USD over the last year and is now close to its lowest level in 10 years
• In the short run, the translation benefits of a weak domestic currency adds to the profits of European companies
• Over the longer tenor, weak Euro increases the price competitiveness of the export oriented European businesses and helps them gain market share
Lower Energy prices
• Spending increases as consumers have higher disposable income on the back of lower energy prices
End of deflation?
• Euro Area CPI has been increasing steadily since Jan 2015 – Better numbers
• Recently IMF kept global growth forecast for 2015 unchanged at 3.5%. However, it increased Euro zone's growth outlook and expects it to expand by 1.5%
• Bond yields are low to negative and therefore incentivize investors to move into riskier assets like equities
Risks:
• Greece has to furnish a roadmap for its debt repayment and present it by mid-may. Failing this, it could lead to many uncertainties of which Greek Exit form Euro zone is one
• Increased volatility from any deterioration in economic data
Rationale Products
4

United States (U.S.) – At an all time high….Prefer value plays
Recent weakness in Macro data
• The lower than expected Q1 2015 GDP data. US economy grew by 0.2% - Far lesser than the expected 1%
• Strong dollar has affected the trade balance
• Markit’s final manufacturing PMI fell to 54.1 in Apr from 55.7 in Mar as output growth & new orders fell
• Though the Q1 earnings have been better than expected so far, strong dollar has affected the earnings of some companies
FED’s monetary policy: Rate hike to be pushed out?
• We expect the FED to delay the rate increase cycle as the recent weakness in economic data, strong dollar (which hurts corporate profitability) and as inflation is well below the Fed’s target of 2%
Stretched Valuations…prefer a value strategy
• The quality of the ROE has improved, due to significant deleveraging of the corporate book
• S&P 500 is trading at 17.5x its 1 year forward earnings with around 1.6% dividend yield
• Such stretched valuation makes the market more vulnerable to an increase in rate hikes by the Fed
• However, with FED rate increases pushed out, strong correction in the markets is not expected. At the same time, due to lack of a clear trend in the markets, we prefer value strategies to play the US markets
Rationale – A Neutral Stance
1. Franklin US Opportunities Fund – Mutual fund investing in equity securities of US companies demonstrating accelerating growth & increased profitability across sectors
2. Schroder ISF US Large Cap Fund - Mutual fund investing in the equities of the large blue-chip companies in the US with capital growth as the objective
3. Powershares Buy-back Achievers– This is an ETF which tracks the equities of US companies which reward their shareholders with buy-back programs
4. Vanguard High Dividend Yield ETF – This is an ETF that invests in stocks of US companies that pay high dividends
5. Global Blue-chip dividend yield tracker– 1 Year, USD denominated, linked to dividend yielding bluechip stocks listed worldwide
6. 5 Years Capital Guaranteed product on Indices (Approved by the Central Bank)–
Underlying basket: S&P 500, Eurostoxx 50 & Nikkei 225
Coupon: Guaranteed – 2% p.a ; conditional – 2.5% p.a
Products – ‘Value’ based strategies
15.1% 4.47
4.26 4.6
3.6
2.7 2.6
2.1 1.9 1.7 1.6 1.7 1.5
0.0
1.0
2.0
3.0
4.0
5.0
0%
5%
10%
15%
20%
CY2
00
5
CY2
00
6
CY2
00
7
CY2
00
8
CY2
00
9
CY2
01
0
CY2
01
1
CY2
01
2
CY2
01
3
CY2
01
4
Cu
rren
t
CY2
015
E
ROE(%) Price/Book Value Net Debt to EBITDA
13.6% Average ROE
India – Fundamentals Intact despite recent market volatility
Recent Market Volatility - What led to this?
• Mixed Corporate Earnings thus far. Disappointing numbers from the Sensex leaders like Infosys
• Intermittent confusion over the Taxation on Foreign Portfolio investors (FPI) - FPIs not to be taxed from April 1, 2015
• Weaker Monsoon: The MET/Weather department expects a weaker than average monsoon in 2015
Sensex Performance:
• Flat performance YTD in 2015 – Off c.8% from its recent peak
We had seen a pre-budget rally till February end and a post budget consolidation.
….The bigger picture however remains intact!
• Long term earnings are expected to accelerate (Avg. 15% p.a. over the next 2.5 years)
• Both S&P and Moody’s have increased their growth outlook for India – 7.9% in FY16 and 8.2% in FY17 – Source: S&P
• Market liquidity remains robust: Global investors net inflows stand at USD 6.3bn,
which is still the most in Asia.
Foreigners bought $16bn of stocks in 2014. Overseas investors have pumped in a combined $57bn into Indian stocks and bonds since end of 2013
• Foreign exchange reserves are at an all time high – USD 343bn (as of April 2015)
• Monetary policy remains accommodative on the back of declining inflation (March CPI @ 5.17%). Market is expecting another rate cut in the next central bank meeting on June 02
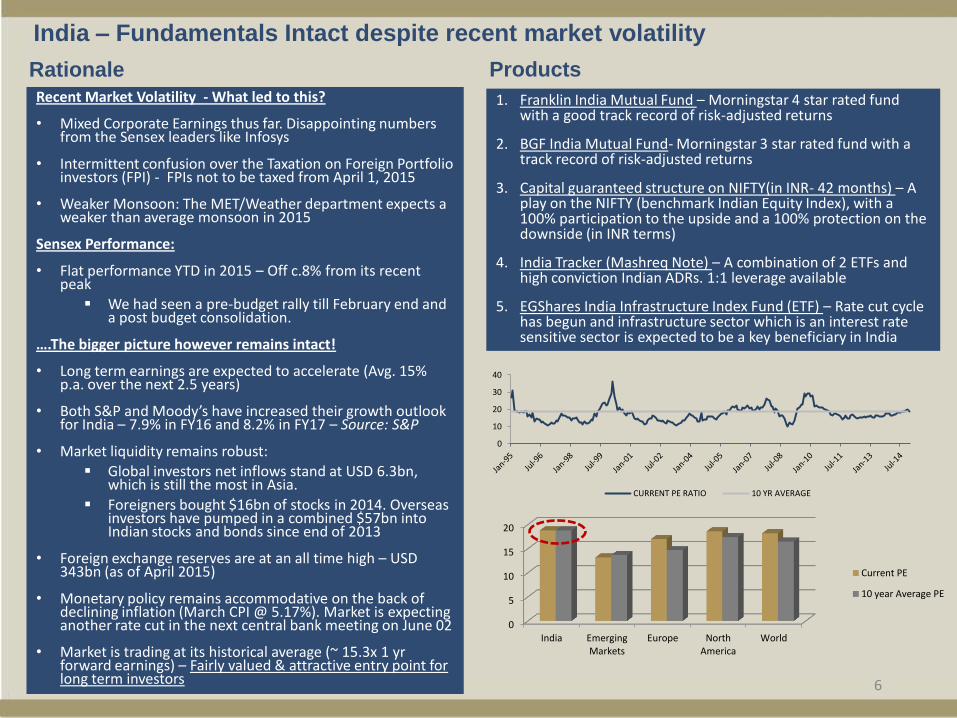
• Market is trading at its historical average (~ 15.3x 1 yr forward earnings) – Fairly valued & attractive entry point for long term investors
Rationale
1. Franklin India Mutual Fund – Morningstar 4 star rated fund with a good track record of risk-adjusted returns
2. BGF India Mutual Fund- Morningstar 3 star rated fund with a track record of risk-adjusted returns
3. Capital guaranteed structure on NIFTY(in INR- 42 months) – A play on the NIFTY (benchmark Indian Equity Index), with a 100% participation to the upside and a 100% protection on the downside (in INR terms)
4. India Tracker (Mashreq Note) – A combination of 2 ETFs and high conviction Indian ADRs. 1:1 leverage available
5. EGShares India Infrastructure Index Fund (ETF) – Rate cut cycle has begun and infrastructure sector which is an interest rate sensitive sector is expected to be a key beneficiary in India
Products
0
10
20
30
40
CURRENT PE RATIO 10 YR AVERAGE
0
5
10
15
20
India Emerging Markets
Europe North America
World
Current PE
10 year Average PE
6
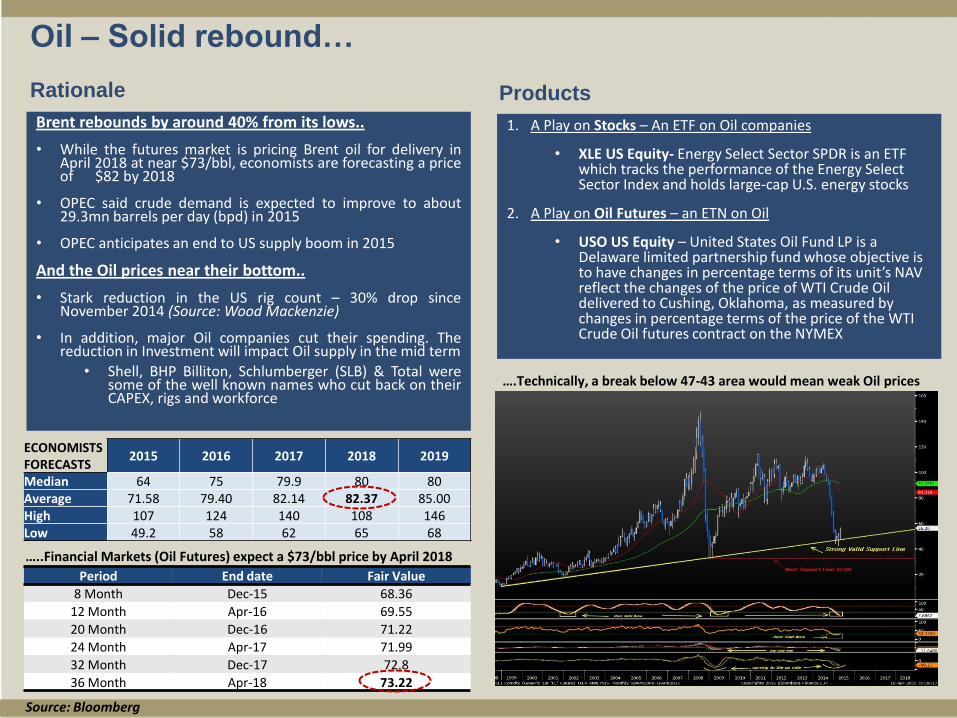
Oil – Solid rebound…
Brent rebounds by around 40% from its lows..
• While the futures market is pricing Brent oil for delivery in April 2018 at near $73/bbl, economists are forecasting a price of $82 by 2018
• OPEC said crude demand is expected to improve to about 29.3mn barrels per day (bpd) in 2015
• OPEC anticipates an end to US supply boom in 2015
And the Oil prices near their bottom..
• Stark reduction in the US rig count – 30% drop since November 2014 (Source: Wood Mackenzie)
• In addition, major Oil companies cut their spending. The reduction in Investment will impact Oil supply in the mid term
• Shell, BHP Billiton, Schlumberger (SLB) & Total were some of the well known names who cut back on their CAPEX, rigs and workforce
Rationale
1. A Play on Stocks – An ETF on Oil companies
• XLE US Equity- Energy Select Sector SPDR is an ETF which tracks the performance of the Energy Select Sector Index and holds large-cap U.S. energy stocks
2. A Play on Oil Futures – an ETN on Oil
• USO US Equity – United States Oil Fund LP is a Delaware limited partnership fund whose objective is to have changes in percentage terms of its unit’s NAV reflect the changes of the price of WTI Crude Oil delivered to Cushing, Oklahoma, as measured by changes in percentage terms of the price of the WTI Crude Oil futures contract on the NYMEX
Products
….Technically, a break below 47-43 area would mean weak Oil prices
ECONOMISTS FORECASTS
2015 2016 2017 2018 2019
Median 64 75 79.9 80 80 Average 71.58 79.40 82.14 82.37 85.00 High 107 124 140 108 146 Low 49.2 58 62 65 68
Source: Bloomberg
…..Financial Markets (Oil Futures) expect a $73/bbl price by April 2018
Period End date Fair Value
8 Month Dec-15 68.36
12 Month Apr-16 69.55
20 Month Dec-16 71.22
24 Month Apr-17 71.99
32 Month Dec-17 72.8
36 Month Apr-18 73.22
Gold – Subdued in short term; Long term view remains supportive
8
Factors against Gold prices:
• The total open interest positions in Gold contracts remain subdued. This indicates lesser interest to own the yellow metal
• Low volatility environment could boost risk appetite – Favour Equities, Gold could be under pressure
• A strong dollar due to tightening by the FED could affect the Gold prices adversely
Factors in favour of the Gold prices:
• Excess monetary supply in the financial system could increase the nominal value of Gold in different currencies
• Low real interest rates remain supportive for Gold prices
1. ETF (Exchange Traded Fund ) on Gold
• GLD US Equity- SPDR Gold Shares is an ETF with an objective to reflect the performance of the price of Gold bullion, less the Trust’s expenses. The trust holds Gold and is expected from time to time to issue Baskets in exchange for deposits of Gold and to distribute gold in connection with redemptions of Baskets
2. 1 month Dual Currency Deposit (DCD) on USD(Base Currency) /XAU (Alternate Currency) – Spot @ 1204 (A/o April 30, 2015)
• At the Money Spot – 15.38%
• 50 pips away from spot – 1.82%
• 75 pips away from spot – 0.39%
Products
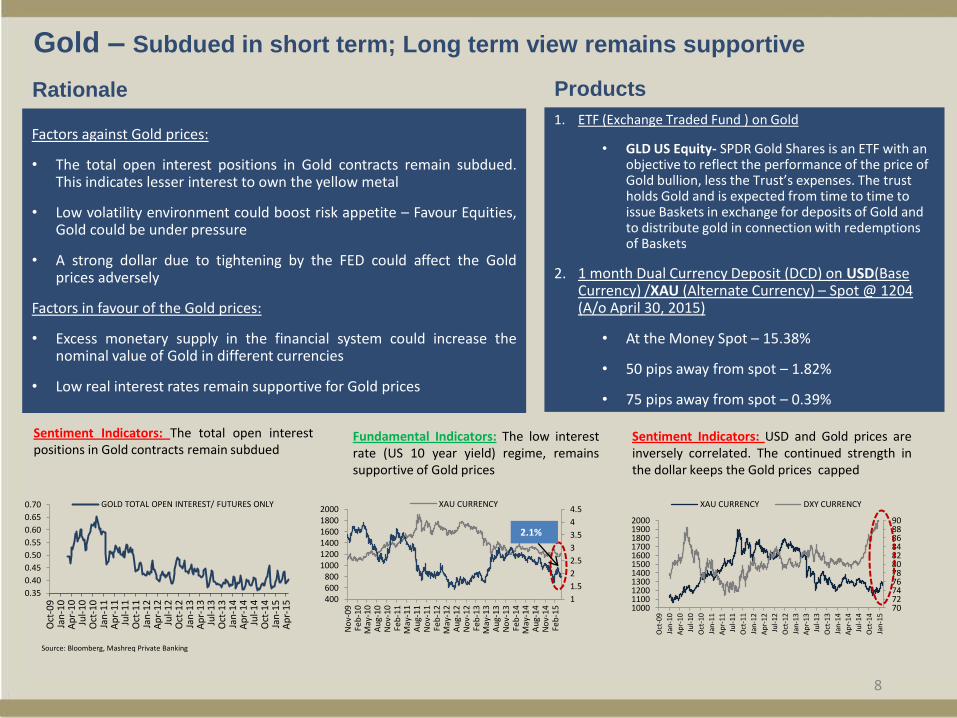
Fundamental Indicators: The low interest rate (US 10 year yield) regime, remains supportive of Gold prices
Sentiment Indicators: USD and Gold prices are inversely correlated. The continued strength in the dollar keeps the Gold prices capped
70 72 74 76 78 80 82 84 86 88 90
1000 1100 1200 1300 1400 1500 1600 1700 1800 1900 2000
Oct
-09
Jan
-10
Ap
r-10
Jul-
10
Oct
-10
Jan
-11
Ap
r-11
Jul-
11
Oct
-11
Jan
-12
Ap
r-12
Jul-
12
Oct
-12
Jan
-13
Ap
r-13
Jul-
13
Oct
-13
Jan
-14
Ap
r-14
Jul-
14
Oct
-14
Jan
-15
XAU CURRENCY DXY CURRENCY
Rationale
Source: Bloomberg, Mashreq Private Banking
1
1.5
2
2.5
3
3.5
4
4.5
400 600 800
1000 1200 1400 1600 1800 2000
No
v-09
Fe
b-1
0 M
ay-1
0 A
ug-
10
No
v-10
Fe
b-1
1 M
ay-1
1 A
ug-
11
No
v-11
Fe
b-1
2 M
ay-1
2 A
ug-
12
No
v-12
Fe
b-1
3 M
ay-1
3 A
ug-
13
No
v-13
Fe
b-1
4 M
ay-1
4 A
ug-
14
No
v-14
Fe
b-1
5
XAU CURRENCY
2.1%
0.35
0.40
0.45
0.50
0.55
0.60
0.65
0.70
Oct
-09
Ja
n-1
0
Ap
r-1
0
Jul-
10
O
ct-1
0
Jan
-11
A
pr-
11
Ju
l-1
1
Oct
-11
Ja
n-1
2
Ap
r-1
2
Jul-
12
O
ct-1
2
Jan
-13
A
pr-
13
Ju
l-1
3
Oct
-13
Ja
n-1
4
Ap
r-1
4
Jul-
14
O
ct-1
4
Jan
-15
A
pr-
15
GOLD TOTAL OPEN INTEREST/ FUTURES ONLY
Sentiment Indicators: The total open interest positions in Gold contracts remain subdued

IMPORTANT NOTICE
This report was prepared by the Private Banking Unit of Mashreqbank psc (“Mashreq”) in the United Arab Emirates (“U.A.E.”). Mashreq is regulated by the Central Bank of the U.A.E. This report is provided for informational purposes and private circulation only and should not be construed as an offer to sell or a solicitation to buy any security or any other financial instrument or adopt any hedging, trading or investment strategy. Prior to investing in any product, we recommend that you consult with a professional financial advisor, taking into consideration investment objectives, financial circumstances and tax implication. While based on information believed to be reliable, we do not guarantee and make no express or implied representation as to the accuracy of this report or complete description of the securities markets or developments referred to in this report. The information, opinions, forecasts (if any), assumptions or estimates contained in this report are as of the date indicated and are subject to change at any time without prior notice. The stated price of any securities mentioned in this report is as of the date indicated and is not a representation that any transaction can be effected at this price. The risks related to investment products described in this report are not all encompassing and investors should refer to the relevant investment offer document for detailed information and applicable terms and conditions. Investment products, including treasury products, are not guaranteed by Mashreq or any of its affiliates or subsidiaries unless stated otherwise and are subject to investment risk, including loss of principal. Investment products are not government insured. Past performance is not an indicator of future performance. US persons (US Citizens; US Green Card Holders; Resident Aliens subject to US income taxes for IRS purposes) are not eligible for any of the investment products introduced by Mashreq unless stated otherwise. This report is for distribution only under such circumstances as may be permitted by applicable law. Neither Mashreq nor its officers, directors or shareholders or other persons shall be liable for any direct, indirect, incidental or other damages including loss of profits arising in any way from the information contained in this report. This report is intended solely for the use by the intended recipients and the contents shall not be reproduced, redistributed or copied in whole or in part for any purpose without Mashreq’s prior express consent.