Embed Size (px)
Citation preview
International Journal of Research in Environmental Science
Volume 3, Issue 3 2017, PP 43-62
ISSN No. (Online) 2454-9444
DOI: http://dx.doi.org/10.20431/2454-9444.0303005
www.arcjournals.org
International Journal of Research in Environmental Science (IJRES) Page | 43
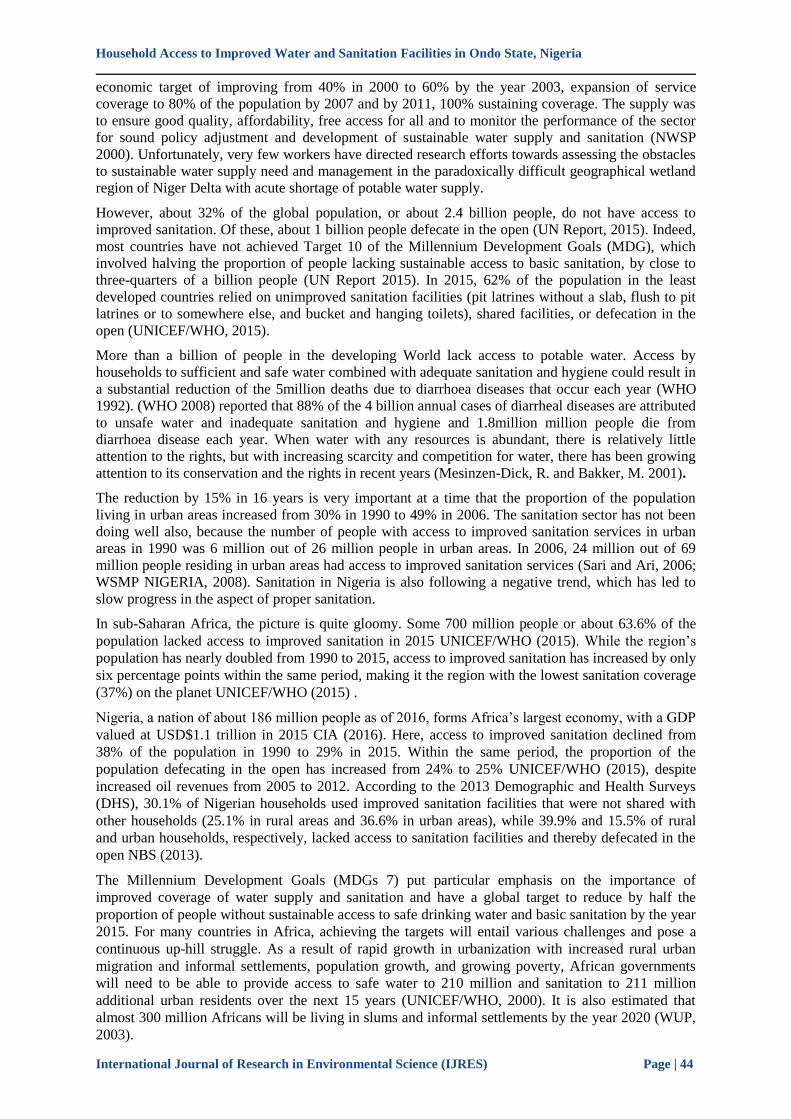
Household Access to Improved Water and Sanitation Facilities in
Ondo State, Nigeria
OWOLABI, Babatunde Oluwaseyi (Ph.D)
Department of Urban and Regional Planning, Federal University of Technology Akure,
Akure, Nigeria
1. INTRODUCTION
1.1 Background to the Study
Water is the essence of life. Safe drinking water and sanitation are indispensable to sustain life and
health and fundamental to the dignity of all. Yet, worldwide 884 million people do not have access to
improved sources of drinking water while 2.5 billion lack access to improved sanitation facilities
(WHO, 2008). While these numbers shed light on a worrying situation, the reality is much worse, as
millions of poor people living in informal settlements are simply missing from national statistics. The
roots of the current water and sanitation crisis can be traced to poverty, inequality and unequal power
relationships, and it is exacerbated by social and environmental challenges accelerating urbanization,
climate change and increasing pollution and depletion of water resources (UNDP, 2006).
Improved sanitation is defined as a system that promotes proper disposal of human and animal waste
for improving and protecting public and environmental health. An improved sanitation facility is that
which hygienically separates excreta from human contact, and is used by only members of one
household: toilets flushing to sewer systems or septic tanks, ventilated improved pit (VIP) latrines, pit
latrines with a slab, and composting toilets (UNICEF/WHO 2015)
Cities exhibit intensive water shortages since the oil boom of the 1970s. The situation in the cities like
Niger Delta wetland is like any other across the country, and sometimes worse because of heavy
pollution of its water sources due to oil exploration. For example Niger Delta Environmental Survey
(NDES, 2000) covering the region found out that most settlements
depend on untreated surface water and wells, which result in health problems. In a related study of the
NDES (2004), it was found that the available quantity of water to residents which was less than 10
litres per person per day in 1994 had reduced to 5.5 litres per person per day in 2000.
This shows that as the population increases there is a dramatic reduction in the quality and quantity of
water available to the residents. To increase safe water supply especially domestic in the country, the
Federal government of Nigeria enacted a water policy in 2000 for the purpose of meeting the national
Abstract: Good water and sanitation promote good health and enhances national development. This study
was conducted in Ese-Odo LGA, Ondo State to investigate the challenges households faced in accessing good
drinking water and sanitation facilities. The study depended on primary data collected from the field through
questionnaire administration and secondary data from the Nigeria Population Commission, Ese-Odo LG
Secretariat, and Ondo State Water Corporation.
The results revealed that only few 29.9% of the households have access to improved water with greater
majority (63%) depending on water from the stream/river for drinking water. The low income earners spend
more of their income on water (30%) than the high income earners (15%). The results also indicated that only
20% of the households have no access to good sanitation in their homes whereas a greater majority of the
household (80%) have no access to improved sanitation, they defecate in nearby bush outside their homes. It
is therefore recommended that the NGO's, CBOs, Ondo state Government and Ese-Odo LGA must focus on
extending pipe-borne water to the communities and also educate households to provide toilets in their homes.
Keywords: Household, Access, Water, Sanitation, Facilities, Ondo State, Nigeria
*Corresponding Author: OWOLABI, Babatunde Oluwaseyi, Department of Urban and Regional
Planning, Federal University of Technology Akure, Akure, Nigeria
Household Access to Improved Water and Sanitation Facilities in Ondo State, Nigeria
International Journal of Research in Environmental Science (IJRES) Page | 44
economic target of improving from 40% in 2000 to 60% by the year 2003, expansion of service
coverage to 80% of the population by 2007 and by 2011, 100% sustaining coverage. The supply was
to ensure good quality, affordability, free access for all and to monitor the performance of the sector
for sound policy adjustment and development of sustainable water supply and sanitation (NWSP
2000). Unfortunately, very few workers have directed research efforts towards assessing the obstacles
to sustainable water supply need and management in the paradoxically difficult geographical wetland
region of Niger Delta with acute shortage of potable water supply.
However, about 32% of the global population, or about 2.4 billion people, do not have access to
improved sanitation. Of these, about 1 billion people defecate in the open (UN Report, 2015). Indeed,
most countries have not achieved Target 10 of the Millennium Development Goals (MDG), which
involved halving the proportion of people lacking sustainable access to basic sanitation, by close to
three-quarters of a billion people (UN Report 2015). In 2015, 62% of the population in the least
developed countries relied on unimproved sanitation facilities (pit latrines without a slab, flush to pit
latrines or to somewhere else, and bucket and hanging toilets), shared facilities, or defecation in the
open (UNICEF/WHO, 2015).
More than a billion of people in the developing World lack access to potable water. Access by
households to sufficient and safe water combined with adequate sanitation and hygiene could result in
a substantial reduction of the 5million deaths due to diarrhoea diseases that occur each year (WHO
1992). (WHO 2008) reported that 88% of the 4 billion annual cases of diarrheal diseases are attributed
to unsafe water and inadequate sanitation and hygiene and 1.8million million people die from
diarrhoea disease each year. When water with any resources is abundant, there is relatively little
attention to the rights, but with increasing scarcity and competition for water, there has been growing
attention to its conservation and the rights in recent years (Mesinzen-Dick, R. and Bakker, M. 2001).
The reduction by 15% in 16 years is very important at a time that the proportion of the population
living in urban areas increased from 30% in 1990 to 49% in 2006. The sanitation sector has not been
doing well also, because the number of people with access to improved sanitation services in urban
areas in 1990 was 6 million out of 26 million people in urban areas. In 2006, 24 million out of 69
million people residing in urban areas had access to improved sanitation services (Sari and Ari, 2006;
WSMP NIGERIA, 2008). Sanitation in Nigeria is also following a negative trend, which has led to
slow progress in the aspect of proper sanitation.
In sub-Saharan Africa, the picture is quite gloomy. Some 700 million people or about 63.6% of the
population lacked access to improved sanitation in 2015 UNICEF/WHO (2015). While the region‟s
population has nearly doubled from 1990 to 2015, access to improved sanitation has increased by only
six percentage points within the same period, making it the region with the lowest sanitation coverage
(37%) on the planet UNICEF/WHO (2015) .
Nigeria, a nation of about 186 million people as of 2016, forms Africa‟s largest economy, with a GDP
valued at USD$1.1 trillion in 2015 CIA (2016). Here, access to improved sanitation declined from
38% of the population in 1990 to 29% in 2015. Within the same period, the proportion of the
population defecating in the open has increased from 24% to 25% UNICEF/WHO (2015), despite
increased oil revenues from 2005 to 2012. According to the 2013 Demographic and Health Surveys
(DHS), 30.1% of Nigerian households used improved sanitation facilities that were not shared with
other households (25.1% in rural areas and 36.6% in urban areas), while 39.9% and 15.5% of rural
and urban households, respectively, lacked access to sanitation facilities and thereby defecated in the
open NBS (2013).
The Millennium Development Goals (MDGs 7) put particular emphasis on the importance of
improved coverage of water supply and sanitation and have a global target to reduce by half the
proportion of people without sustainable access to safe drinking water and basic sanitation by the year
2015. For many countries in Africa, achieving the targets will entail various challenges and pose a
continuous up-hill struggle. As a result of rapid growth in urbanization with increased rural urban
migration and informal settlements, population growth, and growing poverty, African governments
will need to be able to provide access to safe water to 210 million and sanitation to 211 million
additional urban residents over the next 15 years (UNICEF/WHO, 2000). It is also estimated that
almost 300 million Africans will be living in slums and informal settlements by the year 2020 (WUP,
2003).
Household Access to Improved Water and Sanitation Facilities in Ondo State, Nigeria
International Journal of Research in Environmental Science (IJRES) Page | 45
1.2 Statement of Research Problem
Despite the fact that water is an essential for life, and poor sanitation brings about diseases, access to
improved water and sanitation facilities still remains a problem in many developing countries. About
50% of the developing world‟s population –about 2.5 billion people– lack improved sanitation
facilities, and over 884 million people still use unsafe drinking water sources (WHO, 2008).
Olotu Y. et al, (2009) reported that Ese-Odo local government is the most water-stressed region in
Ondo State followed by Ilaje, During the consultation process, it was discovered that the dwellers
derive their drinking water from a variety of sources such as; direct withdrawal from pond, streams
and river, traditional wells of up to 1.5-2.0m diameter with local construction, modern wells that are
usually filled with concrete in order to prevent outside contamination and seepage flow and
reticulated solar-powered boreholes of cleaner and high quality water.
Majority of households in the study area lack access to safe drinking water sources and adequate
sanitation facilities. The sources of drinking water in the District are mainly from, springs, wells and
rivers. There has not been significant effort made by the government to tackle the problem of poor
water and sanitation facilities supply in the area, hence making the indigenes resort to alternative
water sources. Women and children, especially girls, are the ones who suffer the burden of keeping
wake to fetch water from these sources.
The sanitation situation is no different, many of the houses in the communities do not have toilet
facilities, and these putting pressure on the few existing public toilets available. In the mornings, for
example, there are long queues at these public toilets, so people who cannot wait for their turn to use
the facility, defecate indiscriminately In the case of the refuse dumps, there are a few of them but
these are not patronized by those who live far away from it. Refuse is dumped indiscriminately and
this can be seen in the few drains available when it rains, and around the sources of their drinking
water.
1.3 Justification
In both rural and urban areas of low income countries, millions of people lack access to improved
water and sanitation services. The Ese odo community is no exception to this, in that there are few
sanitation facilities and also the majority of the people do not have access to safe drinking water
source. This research is therefore intended to provide baseline information to assess the performance
of the residents study area in the Sustainable Development Goals targets (Goal 6, target.3. Population
and access to safe drinking water and basic sanitation) It is hoped that the findings from the study will
not only benefit the managers of study area but other districts with similar situations
A community given access to proper sanitation and portable water will have improved living
conditions, with increased health and well-being and economic productivity (Elledge 2003). Not only
does proper sanitation reduce the burden of disease, but it provides secondary benefits such as
increasing child school attendance, increasing the economic productivity of communities, as well as
assisting in the empowerment of women (WHO et al. 2004).
The primary preventative method to address these issues is through implementation of appropriate
sanitation facilities and hygiene promotion. Better hygiene through hand washing and food protection
can reduce the impact of diarrhoeal diseases resulting from poor sanitation by 33% (Mooijman 2003).
Implementation of latrines, providing safe excreta disposal options reduces diarrhoeal diseases by up
to 36% (Mooijman 2003; Cairncross & Kolsky 2003). This dissertation aims to highlight the
importance of these issues and examine the viability and details of available sanitation options.
1.4 Scope of Study
The scope of this dissertation encompasses a broad investigation of the issues and processes
associated with access to improved water in Ese odo , as well as a detailed assessment of the health
risk of bad sanitation condition. In achieving this, selecting Ondo State as a case study, some selected
communities in Ese-Odo LGA will be examined to demonstrate the procedures necessary to develop
appropriate, integrated and sustainable solutions for a community with inadequate water and
sanitation facilities.
1.5 Research Question
At the end of this study, the findings will answer the following questions

Household Access to Improved Water and Sanitation Facilities in Ondo State, Nigeria
International Journal of Research in Environmental Science (IJRES) Page | 46
a. What is the trend in access to improved sanitation facilities in the study area;
b. What are the types of water and sanitation facilities available in the area
c. How far the facilities are from the household and how much it costs to access the
facilities.
d. What are the physical quality or state of water and sanitation facilities available to the
communities.
e. Is there any significant difference in household access to sanitation facilities by place
of residence, geopolitical zones, ethnicity, educational level, and wealth;
f. Which socioeconomic factors determine the types of water and sanitation facilities
used by households
1.6 Aim and Objectives
The ultimate aim of this dissertation is to provide an assessment of the options and issues involved
with implementing a holistic environmentally, socially and economically sustainable solution for
water and sanitation problems of the community of Ese-odo LGA. Capacity building and public
participation will be a central component of this project, with the following objectives.
a. To examine the trend in access to improved water and sanitation facilities in study area;
b. To identify the type of water and sanitation facilities available in the study area
c. To determine how far the facilities are from the household and how much it costs to access
the facilities.
d. To determine the physical quality or state of water and sanitation facilities available to the
communities.
e. To assess whether there is any significant difference in household access to sanitation
facilities by place of residence, geopolitical zones, ethnicity, educational level, and wealth;
f. To explore which socioeconomic factors determine the types of water and sanitation facilities
used by households
g. To empower and build the capacity of the local community and stakeholders to improve their
situation.
Fig 1.1 Map of Nigeria Showing Ondo State
Source: Author's Survey, 2017
Household Access to Improved Water and Sanitation Facilities in Ondo State, Nigeria
International Journal of Research in Environmental Science (IJRES) Page | 47
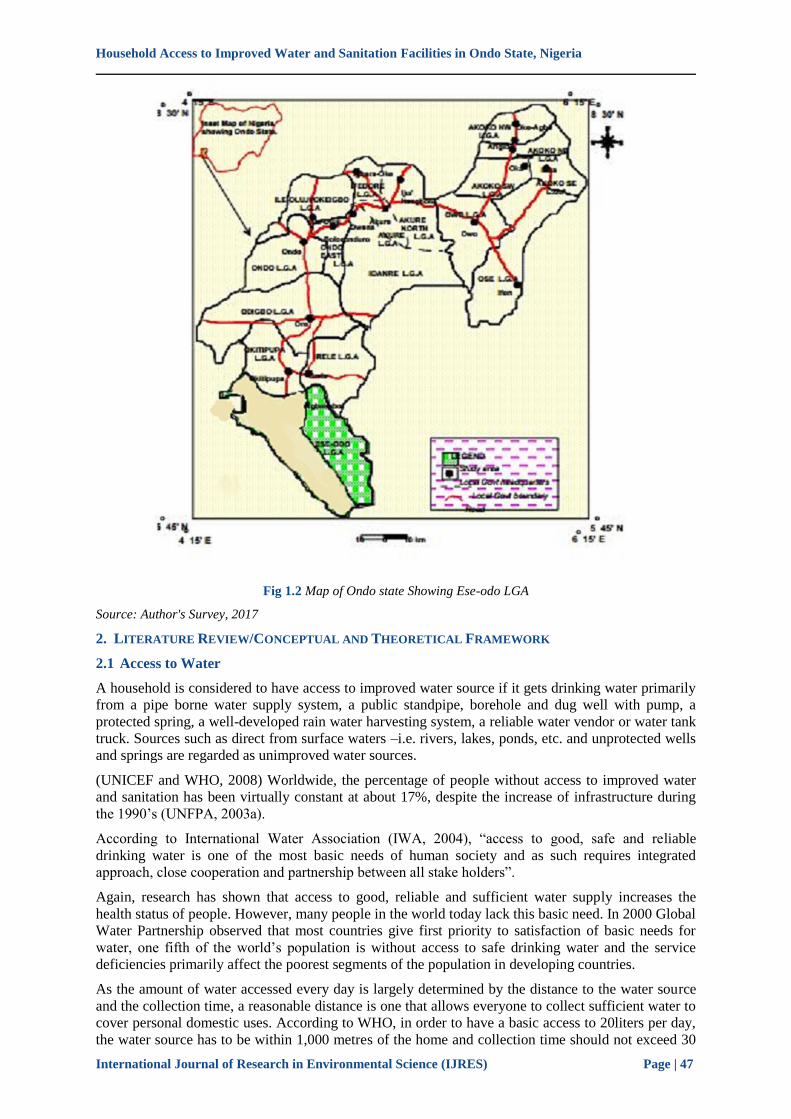
Fig 1.2 Map of Ondo state Showing Ese-odo LGA
Source: Author's Survey, 2017
2. LITERATURE REVIEW/CONCEPTUAL AND THEORETICAL FRAMEWORK
2.1 Access to Water
A household is considered to have access to improved water source if it gets drinking water primarily
from a pipe borne water supply system, a public standpipe, borehole and dug well with pump, a
protected spring, a well-developed rain water harvesting system, a reliable water vendor or water tank
truck. Sources such as direct from surface waters –i.e. rivers, lakes, ponds, etc. and unprotected wells
and springs are regarded as unimproved water sources.
(UNICEF and WHO, 2008) Worldwide, the percentage of people without access to improved water
and sanitation has been virtually constant at about 17%, despite the increase of infrastructure during
the 1990‟s (UNFPA, 2003a).
According to International Water Association (IWA, 2004), “access to good, safe and reliable
drinking water is one of the most basic needs of human society and as such requires integrated
approach, close cooperation and partnership between all stake holders”.
Again, research has shown that access to good, reliable and sufficient water supply increases the
health status of people. However, many people in the world today lack this basic need. In 2000 Global
Water Partnership observed that most countries give first priority to satisfaction of basic needs for
water, one fifth of the world‟s population is without access to safe drinking water and the service
deficiencies primarily affect the poorest segments of the population in developing countries.
As the amount of water accessed every day is largely determined by the distance to the water source
and the collection time, a reasonable distance is one that allows everyone to collect sufficient water to
cover personal domestic uses. According to WHO, in order to have a basic access to 20liters per day,
the water source has to be within 1,000 metres of the home and collection time should not exceed 30
Household Access to Improved Water and Sanitation Facilities in Ondo State, Nigeria
International Journal of Research in Environmental Science (IJRES) Page | 48
minutes. When water is piped into the home, access is optimal and at least 100 litres per person per
day is likely to be ensured.
In this respect, UNDP confirms in its human development report 2006 that having a regular supply of
clean water piped to the household is the optimal type of provision for human development. Access to
a regular supply of water within the home also eliminates the need for women and children to spend
time and physically exert themselves to collect water from distant sources.
2.2 Brief Concept of Improved Water and Sanitation
The concept of improved drinking water and sanitation as essential to health is not a novel idea. The
traditional environmental health already focused on sanitation issues including clean water, sewage
and waste management (Dannenberg, Frumkin & Jackson, 2011).
The JMP has defined “improved water “sources as facilities that are protected from environmental
contamination, especially faecal contamination such as piped water into a dwelling, plot or yard,
protected well or spring and rainwater collection. An “improved sanitation” facility has been defined
by the JMP as a facility that separates and removes human excreta from potential human contact. It
has specifically been defined that sharing facilities of any type are categorized as unimproved
sanitation. The JMP‟s classification for both improved and unimproved source of drinking water and
sanitation facility is presented in Table below.
Table 1. Improved and unimproved drinking water sources and sanitation facility categories as defined by the
JMP
Improved drinking water source Unimproved drinking water source Piped water into dwelling, yard or plot
Public tap or standpipe
Tubewell or borehole
Protected dug well
Protected spring
Rainwater collection
Unprotected dug well
Unprotected spring
Cart with small tank or drum
Tanker truck
Surface water (river, dam, lake, pond,
stream, canal, irrigation channel)
Bottled water
Improved sanitation facility Unimproved sanitation facility
Flush or pour-flush to:
• Piped sewer system
• Septic tank
• Pit latrine
Ventilated improved pit (VIP) latrine
Pit latrine with slab
Composting toilet
Flush or pour-flush to elsewhere (that is,
not to piped sewer system, septic tank or
pit latrine)
Pit latrine without slab/open pit
Bucket
Hanging toilet or hanging latrine
Shared facilities of any type
No facilities, bush or field
Source: WHO/UNICEF, 2014
2.3 Overview of MDGs for WASH Component
Improving global access to clean drinking water and adequate sanitation is one of the least expensive
and most effective means to enhance public health and save lives (International Vaccine Access
Center, 2014). In 2000, 189 world nations came together through the UN Millennium Summit to
develop and adopt a global action plan in order to address the worldwide issues affecting development
such as poverty, disease, food security and human rights (UN, 2000). One of the goals has been to
reduce the number of people without access to improved water and sanitation system.
Accordingly, Clasen (2012) points out that in 2012 the UN made an important announcement that the
goal of reducing half the proportion of people without access to improved drinking water had been
achieved; yet the achievement or progress for improved sanitation system was not indicated.
Building upon the MDGs, a new process has been put in place after the Rio+20 Conference in order
to effectively measure the indicators post 2015 development agenda (UN, 2014). Sustainable
Development Goals (SDGs) are the new development framework that will provide opportunity for
global leaders and populations to work toward an end to poverty and to transform the world to better
meet human needs and the necessities of economic transformation, while protecting our environment,
ensuring peace and realizing human rights (UN, 2014). Under this approach, ensuring availability and
sustainable use of water and sanitation for all has been listed as one of the proposed SDGs to be
Household Access to Improved Water and Sanitation Facilities in Ondo State, Nigeria
International Journal of Research in Environmental Science (IJRES) Page | 49
attained by 2030. With respect to WASH issue, the goals have been set under proposed goal number
6.
2.4 Global trends of access to improved water and sanitation system
Global figures that describe the lack of water and sanitation services are alarming. More than 748
million people, mostly in developing countries, lack access to safe water sources within a reasonable
distance of their home (WHO/UNICEF, 2014). Lack of sanitation is an even larger issue; an estimated
41% of the world‟s population (2.5 billion individuals) is without improved sanitation
(WHO/UNICEF, 2014). According to the most recent progress report by the JMP, global coverage
rate for improved drinking water source has increased from 76% in 1990 to 89% in 2012. This
illustrates that almost 1.6 billion people now get water through a piped connection and 700 million
access water through other improved sources such as public taps, protected wells and boreholes
(WHO/UNICEF, 2014).
Similarly, the global coverage for sanitation has risen from 49% to 64% from 1990 to 2012. However,
there are 2.5 billion people who still do not have access to basic sanitation including flush toilets and
covered latrines (WHO/UNICEF, 2014).
Despite this accomplishment, there are many countries, especially low- and middle income countries
showing little or no improvement in access to safe drinking water and improved sanitation
(WHO/UNICEF, 2014). These current rates of improvement suggest the MDG goal particularly set
for water and sanitation system will not be likely to be achieved by 2015 in some of those developing
countries (Clasen, 2012).
2.5 Theoretical Framework
2.5.1 Resilience Theory
The theoretical framework of this research proposal is based on the ideas of the resilience theory.
According to (Anderies, 2011) the world is undergoing change; global warming, changing macro-
environment and ecological conditions. Like hunger, deprivation in access to improved water and
sanitation is a silent crisis experienced by the poor and tolerated by those endowed with resources,
the technology and the political power to end it.
Lacking water and sanitation is a polite euphemism for a form of deprivation that threatens man's
existence life . It destroys the opportunity and brings down human dignity. Lack of water lead to no
alternative to get water apart from any available water resource regardless of its purity. The water
provision services are affected in one way or another. The water table may go down as well as the
economic activities especially agriculture may take much water during dry seasons. The fixed
functions that human being need to live, or generally want to maintain are basic needs as given by
Maslow hierarchy of needs. In some parts of the world, the needs are taken care of while others not,
but few would deny that providing such needs is a priority especially when it comes to water access.
When water catchment is affected by natural and human factors basic need i.e water for this care it
becomes hard to provide.
The study is grounded on resilience theory by Crawford Stanley Holling. The resilience
thinking focuses on the magnitude of change that the system can cope with while still being able to
function and to the ways in which social systems are capable of adapting to these changes. It
emphasizes the dynamic interconnections between the ecological and social systems, which makes it
useful for assessing environmental impacts on livelihoods. The determinants of the accessibility to
water which this study is focusing on are basically as a result of ecological effects.
2.6 Conceptual Framework
2.6.1 Concept of Sustainable Development
Sustainable development as defined by the World Commission on the Environment and Development
(1987) in its report entitled „Our Common Future‟ is the development that meets the needs of the
present generation without compromising the ability of future generations to meet their needs. This
report has advanced the understanding of global interdependence and the relationship between
economic development and the environment. Therefore, sustainable development dwells on the
capacity to improve the quality of human life while living within the carrying capacity of the
supporting ecosystem. Development is real only if it makes our lives better in all ramifications; and
Household Access to Improved Water and Sanitation Facilities in Ondo State, Nigeria
International Journal of Research in Environmental Science (IJRES) Page | 50
sustainable development becomes a balancing act and sometimes compromise between efficiency
(economic sustainability), equity (social sustainability) and conservation (environmental
sustainability) (Olujimi, 2010).
The concept of development and the quality of the environment postulates that there is a negative
relationship between exploration activities and the environmental quality of man and this becomes
relevant to resource management in Nigeria because it involves reckoning both negative and positive
externalities from the spatial inter-temporal and inter-regional perspectives.
In water, oil film on the water surface could prevent natural aeration and lead to the death of trapped
marine organism. In some cases, fish may ingest the spilled oil or other food materials impregnated
with oil and as such become inedible and unpalatable. Oil spill on the land could lead to retardation of
vegetation growth for a period of time and in extreme cases, to destruction of vegetation. It could also
create potential fire hazard, It was said that some shell-fish population may require 5 to 10 years to
recover from the impact of the spill due to a decrease in the number of reproductive-age shell-fish
stocks and an increase in the mortality of larvae setting on the oiled sediments.
2.6.2 Concept of Environmental Pollution
This paper is based on the concept of Environmental pollution. Enger and Smith (2004) defined the
environment as the sum total of all the conditions that surrounds man. The concept of environmental
pollution has been presented in different way by various authors.
Botkin and Keller (1998) simply defined environmental pollution as involving the discharge of
materials or substances into the environment which renders it useless for specific purposes.
Both air and water are components of the environment which are dynamic entities. They are an
effective means of transport of waste gases and other materials. Soils on the other hand are stationary
entities which are indirectly affected by the pollutions of water and air. Toxic wastes dumped on a soil
may not cause any harm to the plants growing newly if there is no means (such as water or air) of
transfer of toxicant to the plants‟ body or roots (Asthana and Asthana, 2006).
The effects of pollution on soils becomes conspicuous only when the water or the air within the
environments becomes polluted. This article focuses on the social and economic problems of oil
exploration and exploitation in the Niger-Delta Area. Human interference with the environment is
basically through exploration and exploitation of the resources found in it. The effects of oil spills on
the rivers during operations is a major reason for the contamination of water resources in the Niger
Delta region.
2.7 Household Water Use In Sub-Saharan Africa
The right to water covers access to water ,to sustain life and health and to meet basic needs and does
not entitle individuals to an unlimited amount of water. Access to 20-25 liters per person per day
represents a minimum, but this amount raises health concerns because it is insufficient to meet basic
hygiene and consumption requirements (Howard and Bartram, 2003). To WHO (1996) estimates that
20 litres of safe water per person per day is “the amount needed to satisfy metabolic, hygienic and
domestic requirements”. On the average, 20 litres per person per day should be considered the
minimum that is needed. Gleick (1998) estimates that, 25 litres per day is enough for personal
consumption and sanitation. He also revealed that another 25liter per day is required for bathing and
food preparation, producing a total daily requirement of 50 litres per person.
Within villages, household size is one of the most accurate predictors of per capita water use. White et
al (1972), and Lindskog and Lundqvist (1989) found that per capita use consistently decreased as the
number of people in the household increased. In eastern Africa, households with 4-5 members
averaged a little over 10 litres per person per day, while those with more than 12 members averaged
just 7 litres per person per day. In Malawi, two-person households used at least 20 litres per person
per day, while those with members never exceed 10 litres.
2.8 Water Policy Reform in Nigeria
The World Bank has been providing assistance to Nigeria in the water supply sector since 1979. The
first generation of assistance was directed at investments and strengthening institutions at the state
level, especially since urban water supply is constitutionally a responsibility under Nigeria‟s
Household Access to Improved Water and Sanitation Facilities in Ondo State, Nigeria
International Journal of Research in Environmental Science (IJRES) Page | 51
constitution. Amengo-Etego and Grusky (2005) (in Emoabino and Alayande 2007) pointed out that
the States that benefited from the World Bank Water projects are Kaduna (in 1979), Anambra (in
1980), and Bornu (in 1985) and Lagos (in 1989). The second generation of assistance was in the form
of a loan of US$256 million for the National Water Rehabilitation Project (1991-2001), which
targeted the entire country.
3. RESEARCH METHODOLOGY
This chapter details the methodology which the study took to enable achievement of the set
objectives. The first part of this chapter details the research design, the research population, and the
research sample that was used. Part two and three of this chapter describes the population and
sampling frame respectively. The subsequent parts of this chapter cover the explanations of the
proposed instruments of data collection, procedure of data collection, and data analysis. The final part
covered data collection and analysis and finally data validity and reliability formed the conclusion of
the study.
3.1 Research design
According to Cooper and Schindler (2006) they defined research design as the plan and structure
designed to obtain answers to study questions. Normally it is the main plan in framing the research
techniques for the collection and analysis of data, leading to a structural approach for the requirement
of the study.
This study used both qualitative and quantitative research methods. Quantitative research is defined as
a scientific investigation of the relationships of variables based on a collection of numerical and
statistical data and must be organized. Specifically, the survey technique will be used to collect data in
this study.
A survey is described as an in depth study carried out of a particular situation under study rather than
a sweeping statistical survey. The study will involve a large population of Ese odo community data
will be collected on factors influencing water and sanitation access. It is described as a method used to
scale down a very broad field of study into single easily researchable subject. Even though it will not
answer a problem completely, it provides some indications and allows further expounding.
Additionally, it is also useful for testing if scientific models and theory are possible in the real world.
3.2 Nature and Sources of Data
3.2.1 Nature of Data
With a view of achieving the objectives of this study, data from primary and secondary sources were
used. The primary data consisted of opinions of local residents of Ese-odo area, those of opinion
leaders and women. Such data was retrieved from interviews with the individuals and the
administration of questionnaires. Major issues discussed included accessibility, reliability, quality and
quantity and sustainability of the water and sanitation services in Ese-odo community.
Other sources of primary data included too the opinions of the various institutions‟ heads, individuals,
youth groups and women groups involved in water and sanitation services provision in the area. Their
suggestions on how the sector can be improved were quite valuable.
Secondary data used in the study area included published and unpublished information on water and
sanitation services in the various institutions in the water and sanitation sectors. It is from secondary
data that background of the study was developed and the areas that needed improvement identified.
3.2.2 Sources of Data
3.2.2.1 Primary Data
This entailed all the firsthand information gathered from the field through the administration of the
questionnaires, focus group discussions, interview schedules, checklist and photography made during
the study. Such information was collected from opinion leaders, youth and women groups, NGOs and
CBOs, government institutions and private stakeholders in the water and sanitation services in the
area.
Data gathered from residents included socio-demographic data, frequency of water availability in their
respective areas of residence and household‟s water consumption patterns which was crucial for the
Household Access to Improved Water and Sanitation Facilities in Ondo State, Nigeria
International Journal of Research in Environmental Science (IJRES) Page | 52
study. In the institutional interview, the main data that was sought for was in line possible liaison
opportunities between Water corporation and the residents of Ese-odo in dealing with the challenge of
inadequate water supply and sanitation.
The checklist was mainly used in recording various water sources used in the area. This helped in
giving informed recommendations after data analysis.
3.2.2.2 Secondary Data
The data was obtained from both local and international documented sources on water and sanitation
management. These sources included reports, journals, books, internet source and district
development plans in the country. Such information was obtained from government agencies such as
Kenyatta University postmodern library and internet sources. Some preliminary data in line with the
research objectives was acquired and documented in the literature review. It provides general
information on general causes of
3.3 Research population
According to Cox (2010) target population is the entire set of units for which the study data will be
used to make inferences. The target population for the study comprise of the total population of Ese
odo LGA as at the time of this study. Based on the 2006 National population census figure, the
population of Ese odo LGA in 2017 was estimated at 154,978 with a growth rate of 3.05%.
3.4 Sampling frame and Sampling Techniques
3.4.1 Sampling frame
Sample frame can be defined as the set of source materials from which the sample is selected (UNEP,
2008). The definition also encompasses the purpose of sampling frames, which is to provide a means
for choosing the particular members of the target population that are to be interviewed in the survey.
Therefore the sample frame contains the entire population of Ese odo LGA.
3.4.2 Sampling size and procedures
The first stage of selection sample size involve the division of the study area into major districts in the
LGA namely; Kiribo district, Babomi district, Inikorogha district, Ojuala district, Igbekebo district,
Arogbo IV district, Ukparama ward II /arogbo III district, Arogbo II district Ukparama I1/ arogbo 1
district . Therefore, a systematic random sample of communities/streets will be taken from each
district and lastly a systematic random sampling buildings will be made from the selected
communities/streets to ensure a representative coverage of the communities.
3.4.2.1 Sampling procedure
The selection of the sample size of any research is a function of the research population and is also
based on the sampling technique being used in the study. Stratified-random sampling technique would
take into account the proportional area of each stratum and then each could be sampled accordingly.
Considering the value of the sample frame of the study area (69,396 persons)
The first stage of selection sample size involve the division of the study area into different existing 9
district as mentioned above , therefore a random sampling method was used to select four district
from the list and these districts were further divided into streets/roads. At the third and final stage a
systematic random sample of buildings was chosen from several streets/roads to ensure a
representative coverage of the communities. Therefore in other to achieve this sampling technique in
this study area, a list of streets in the selected was made in which a random sample of streets was
made from the list.
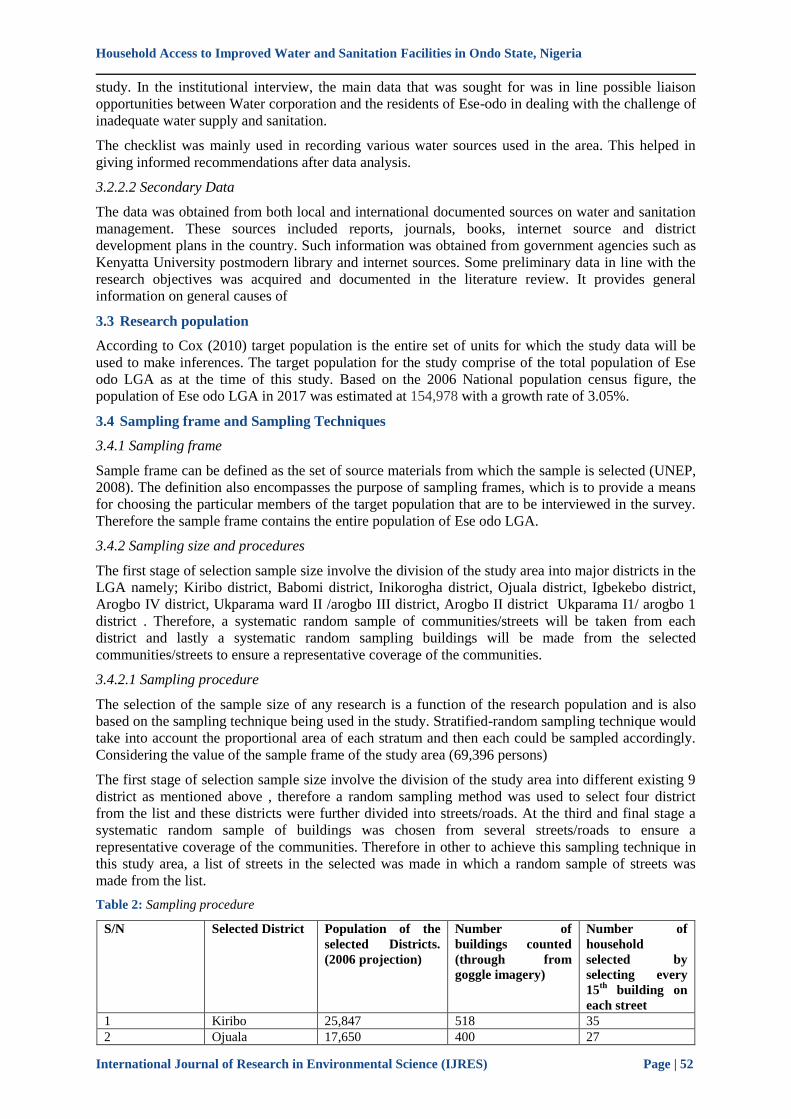
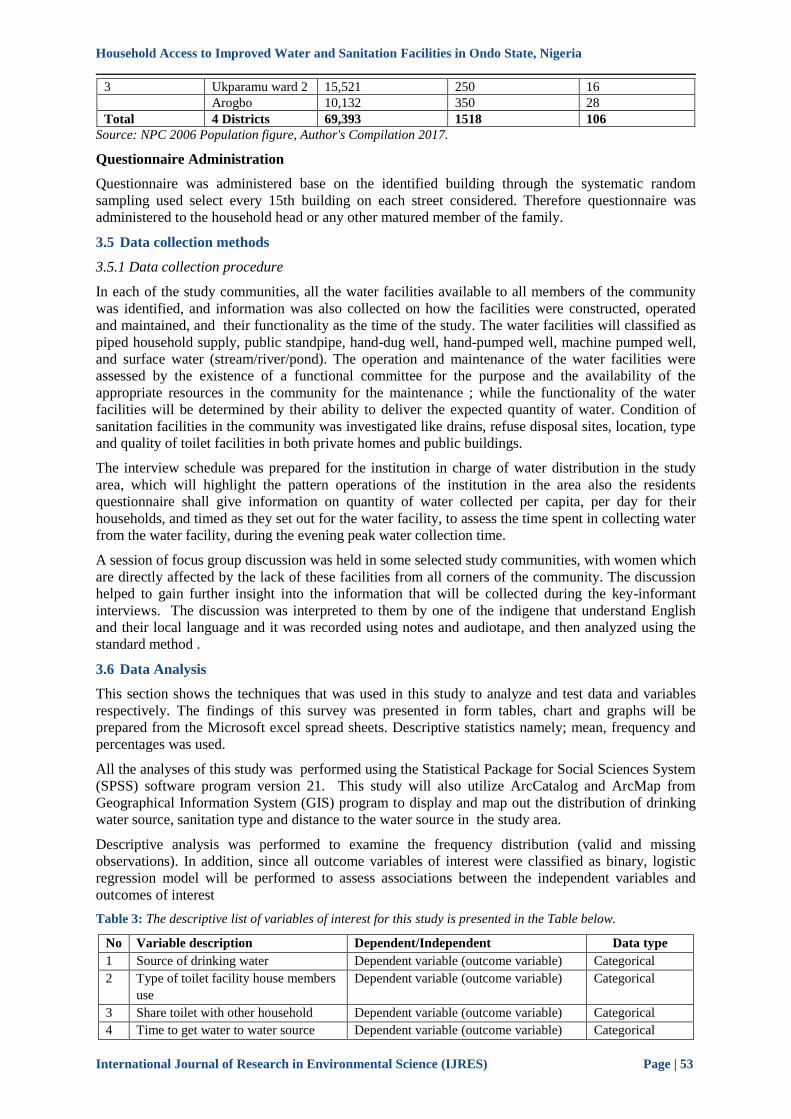
Table 2: Sampling procedure
S/N Selected District Population of the
selected Districts.
(2006 projection)
Number of
buildings counted
(through from
goggle imagery)
Number of
household
selected by
selecting every
15th
building on
each street
1 Kiribo 25,847 518 35
2 Ojuala 17,650 400 27
Household Access to Improved Water and Sanitation Facilities in Ondo State, Nigeria
International Journal of Research in Environmental Science (IJRES) Page | 53
3 Ukparamu ward 2 15,521 250 16
Arogbo 10,132 350 28
Total 4 Districts 69,393 1518 106
Source: NPC 2006 Population figure, Author's Compilation 2017.
Questionnaire Administration
Questionnaire was administered base on the identified building through the systematic random
sampling used select every 15th building on each street considered. Therefore questionnaire was
administered to the household head or any other matured member of the family.
3.5 Data collection methods
3.5.1 Data collection procedure
In each of the study communities, all the water facilities available to all members of the community
was identified, and information was also collected on how the facilities were constructed, operated
and maintained, and their functionality as the time of the study. The water facilities will classified as
piped household supply, public standpipe, hand-dug well, hand-pumped well, machine pumped well,
and surface water (stream/river/pond). The operation and maintenance of the water facilities were
assessed by the existence of a functional committee for the purpose and the availability of the
appropriate resources in the community for the maintenance ; while the functionality of the water
facilities will be determined by their ability to deliver the expected quantity of water. Condition of
sanitation facilities in the community was investigated like drains, refuse disposal sites, location, type
and quality of toilet facilities in both private homes and public buildings.
The interview schedule was prepared for the institution in charge of water distribution in the study
area, which will highlight the pattern operations of the institution in the area also the residents
questionnaire shall give information on quantity of water collected per capita, per day for their
households, and timed as they set out for the water facility, to assess the time spent in collecting water
from the water facility, during the evening peak water collection time.
A session of focus group discussion was held in some selected study communities, with women which
are directly affected by the lack of these facilities from all corners of the community. The discussion
helped to gain further insight into the information that will be collected during the key-informant
interviews. The discussion was interpreted to them by one of the indigene that understand English
and their local language and it was recorded using notes and audiotape, and then analyzed using the
standard method .
3.6 Data Analysis
This section shows the techniques that was used in this study to analyze and test data and variables
respectively. The findings of this survey was presented in form tables, chart and graphs will be
prepared from the Microsoft excel spread sheets. Descriptive statistics namely; mean, frequency and
percentages was used.
All the analyses of this study was performed using the Statistical Package for Social Sciences System
(SPSS) software program version 21. This study will also utilize ArcCatalog and ArcMap from
Geographical Information System (GIS) program to display and map out the distribution of drinking
water source, sanitation type and distance to the water source in the study area.
Descriptive analysis was performed to examine the frequency distribution (valid and missing
observations). In addition, since all outcome variables of interest were classified as binary, logistic
regression model will be performed to assess associations between the independent variables and
outcomes of interest
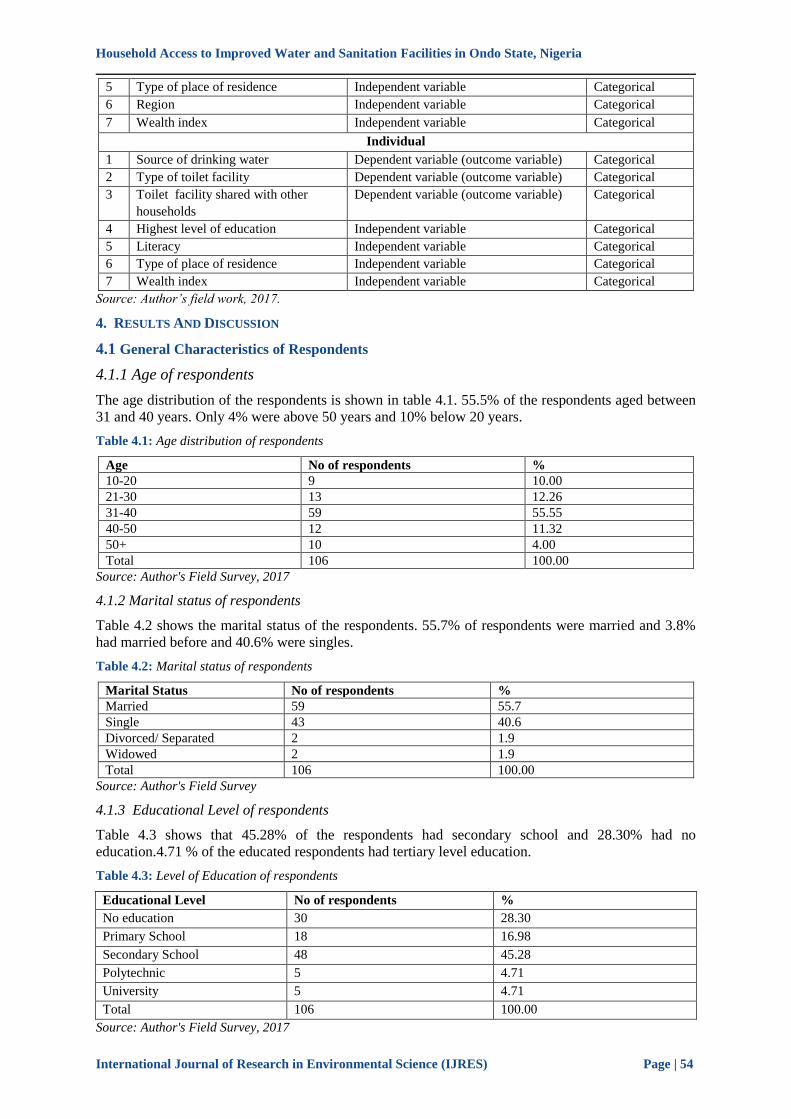
Table 3: The descriptive list of variables of interest for this study is presented in the Table below.
No Variable description Dependent/Independent Data type
1 Source of drinking water Dependent variable (outcome variable) Categorical
2 Type of toilet facility house members
use
Dependent variable (outcome variable) Categorical
3 Share toilet with other household Dependent variable (outcome variable) Categorical
4 Time to get water to water source Dependent variable (outcome variable) Categorical
Household Access to Improved Water and Sanitation Facilities in Ondo State, Nigeria
International Journal of Research in Environmental Science (IJRES) Page | 54
5 Type of place of residence Independent variable Categorical
6 Region Independent variable Categorical
7 Wealth index Independent variable Categorical
Individual
1 Source of drinking water Dependent variable (outcome variable) Categorical
2 Type of toilet facility Dependent variable (outcome variable) Categorical
3 Toilet facility shared with other
households
Dependent variable (outcome variable) Categorical
4 Highest level of education Independent variable Categorical
5 Literacy Independent variable Categorical
6 Type of place of residence Independent variable Categorical
7 Wealth index Independent variable Categorical
Source: Author’s field work, 2017.
4. RESULTS AND DISCUSSION
4.1 General Characteristics of Respondents
4.1.1 Age of respondents
The age distribution of the respondents is shown in table 4.1. 55.5% of the respondents aged between
31 and 40 years. Only 4% were above 50 years and 10% below 20 years.
Table 4.1: Age distribution of respondents
Age No of respondents %
10-20 9 10.00
21-30 13 12.26
31-40 59 55.55
40-50 12 11.32
50+ 10 4.00
Total 106 100.00
Source: Author's Field Survey, 2017
4.1.2 Marital status of respondents
Table 4.2 shows the marital status of the respondents. 55.7% of respondents were married and 3.8%
had married before and 40.6% were singles.
Table 4.2: Marital status of respondents
Marital Status No of respondents %
Married 59 55.7
Single 43 40.6
Divorced/ Separated 2 1.9
Widowed 2 1.9
Total 106 100.00
Source: Author's Field Survey
4.1.3 Educational Level of respondents
Table 4.3 shows that 45.28% of the respondents had secondary school and 28.30% had no
education.4.71 % of the educated respondents had tertiary level education.
Table 4.3: Level of Education of respondents
Educational Level No of respondents %
No education 30 28.30
Primary School 18 16.98
Secondary School 48 45.28
Polytechnic 5 4.71
University 5 4.71
Total 106 100.00
Source: Author's Field Survey, 2017
Household Access to Improved Water and Sanitation Facilities in Ondo State, Nigeria
International Journal of Research in Environmental Science (IJRES) Page | 55
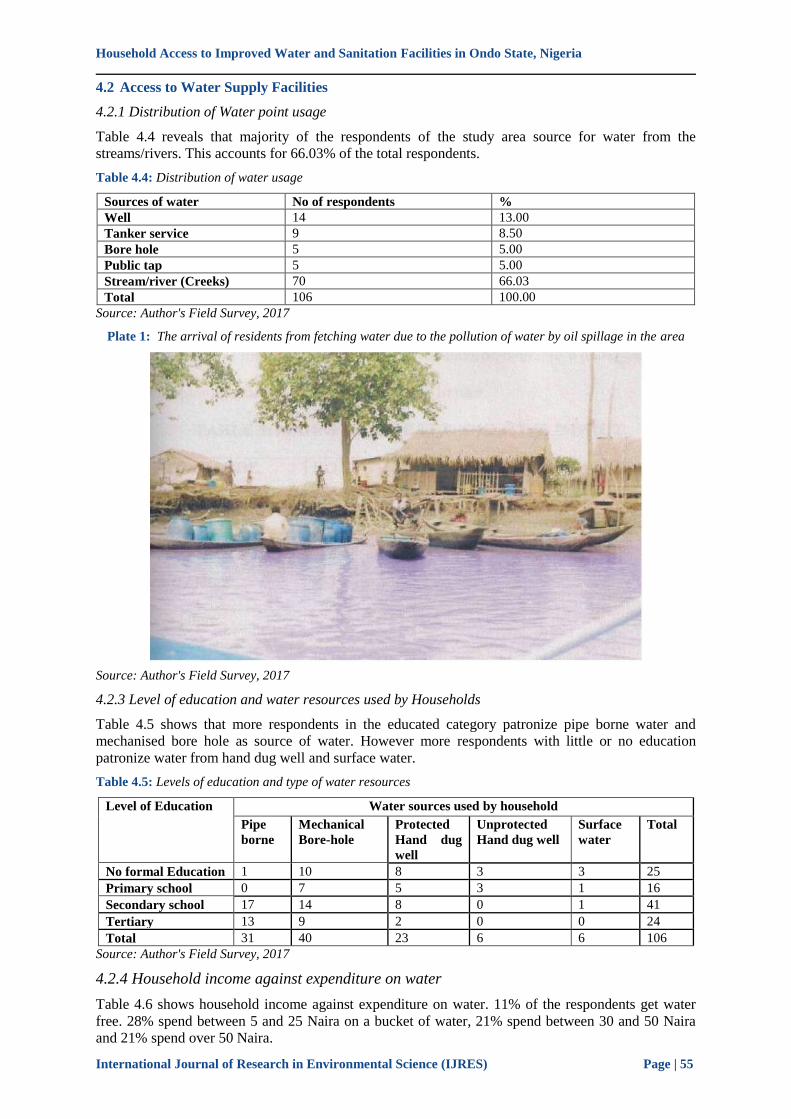
4.2 Access to Water Supply Facilities
4.2.1 Distribution of Water point usage
Table 4.4 reveals that majority of the respondents of the study area source for water from the
streams/rivers. This accounts for 66.03% of the total respondents.
Table 4.4: Distribution of water usage
Sources of water No of respondents %
Well 14 13.00
Tanker service 9 8.50
Bore hole 5 5.00
Public tap 5 5.00
Stream/river (Creeks) 70 66.03
Total 106 100.00
Source: Author's Field Survey, 2017
Plate 1: The arrival of residents from fetching water due to the pollution of water by oil spillage in the area
Source: Author's Field Survey, 2017
4.2.3 Level of education and water resources used by Households
Table 4.5 shows that more respondents in the educated category patronize pipe borne water and
mechanised bore hole as source of water. However more respondents with little or no education
patronize water from hand dug well and surface water.
Table 4.5: Levels of education and type of water resources
Level of Education Water sources used by household
Pipe
borne
Mechanical
Bore-hole
Protected
Hand dug
well
Unprotected
Hand dug well
Surface
water
Total
No formal Education 1 10 8 3 3 25
Primary school 0 7 5 3 1 16
Secondary school 17 14 8 0 1 41
Tertiary 13 9 2 0 0 24
Total 31 40 23 6 6 106
Source: Author's Field Survey, 2017
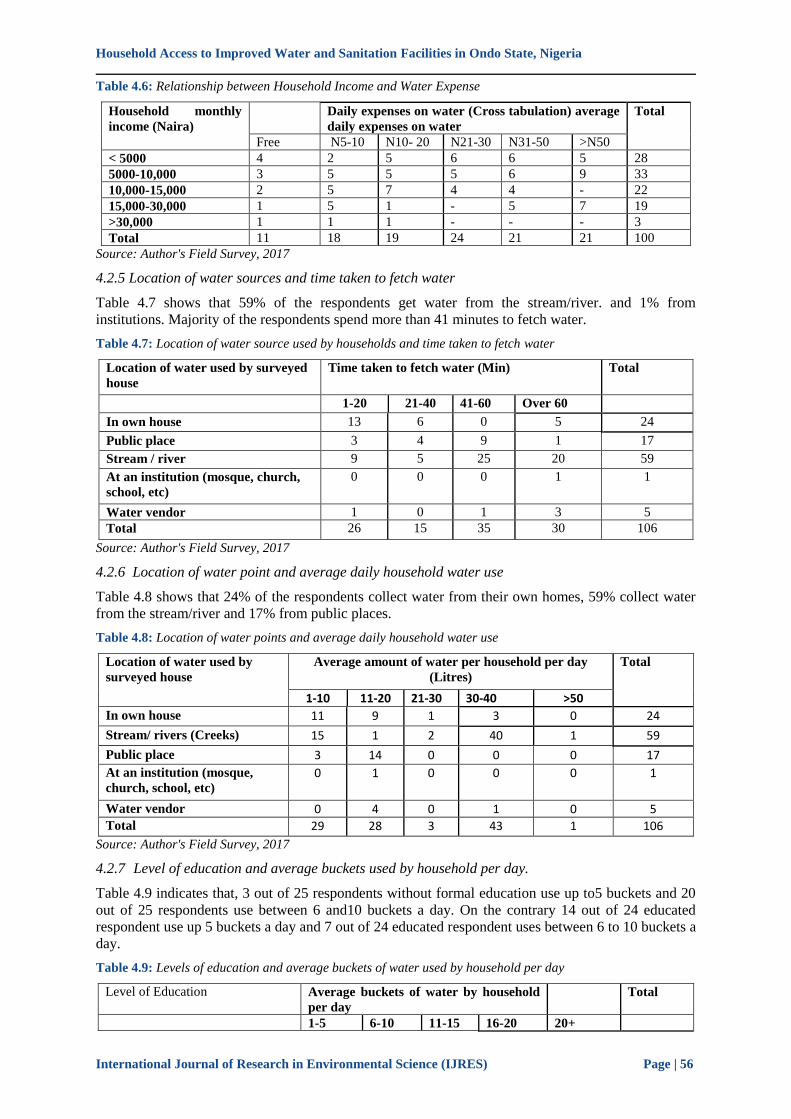
4.2.4 Household income against expenditure on water
Table 4.6 shows household income against expenditure on water. 11% of the respondents get water
free. 28% spend between 5 and 25 Naira on a bucket of water, 21% spend between 30 and 50 Naira
and 21% spend over 50 Naira.
Household Access to Improved Water and Sanitation Facilities in Ondo State, Nigeria
International Journal of Research in Environmental Science (IJRES) Page | 56
Table 4.6: Relationship between Household Income and Water Expense
Household monthly
income (Naira)
Daily expenses on water (Cross tabulation) average
daily expenses on water
Total
Free N5-10 N10- 20 N21-30 N31-50 >N50
< 5000 4 2 5 6 6 5 28
5000-10,000 3 5 5 5 6 9 33
10,000-15,000 2 5 7 4 4 - 22
15,000-30,000 1 5 1 - 5 7 19
>30,000 1 1 1 - - - 3
Total 11 18 19 24 21 21 100
Source: Author's Field Survey, 2017
4.2.5 Location of water sources and time taken to fetch water
Table 4.7 shows that 59% of the respondents get water from the stream/river. and 1% from
institutions. Majority of the respondents spend more than 41 minutes to fetch water.
Table 4.7: Location of water source used by households and time taken to fetch water
Location of water used by surveyed
house
Time taken to fetch water (Min) Total
1-20 21-40 41-60 Over 60
In own house 13 6 0 5 24
Public place 3 4 9 1 17
Stream / river 9 5 25 20 59
At an institution (mosque, church,
school, etc)
0 0 0 1 1
Water vendor 1 0 1 3 5
Total 26 15 35 30 106
Source: Author's Field Survey, 2017
4.2.6 Location of water point and average daily household water use
Table 4.8 shows that 24% of the respondents collect water from their own homes, 59% collect water
from the stream/river and 17% from public places.
Table 4.8: Location of water points and average daily household water use
Location of water used by
surveyed house
Average amount of water per household per day
(Litres)
Total
1-10 11-20 21-30 30-40 >50
In own house 11 9 1 3 0 24
Stream/ rivers (Creeks) 15 1 2 40 1 59
Public place 3 14 0 0 0 17
At an institution (mosque,
church, school, etc)
0 1 0 0 0 1
Water vendor 0 4 0 1 0 5
Total 29 28 3 43 1 106
Source: Author's Field Survey, 2017
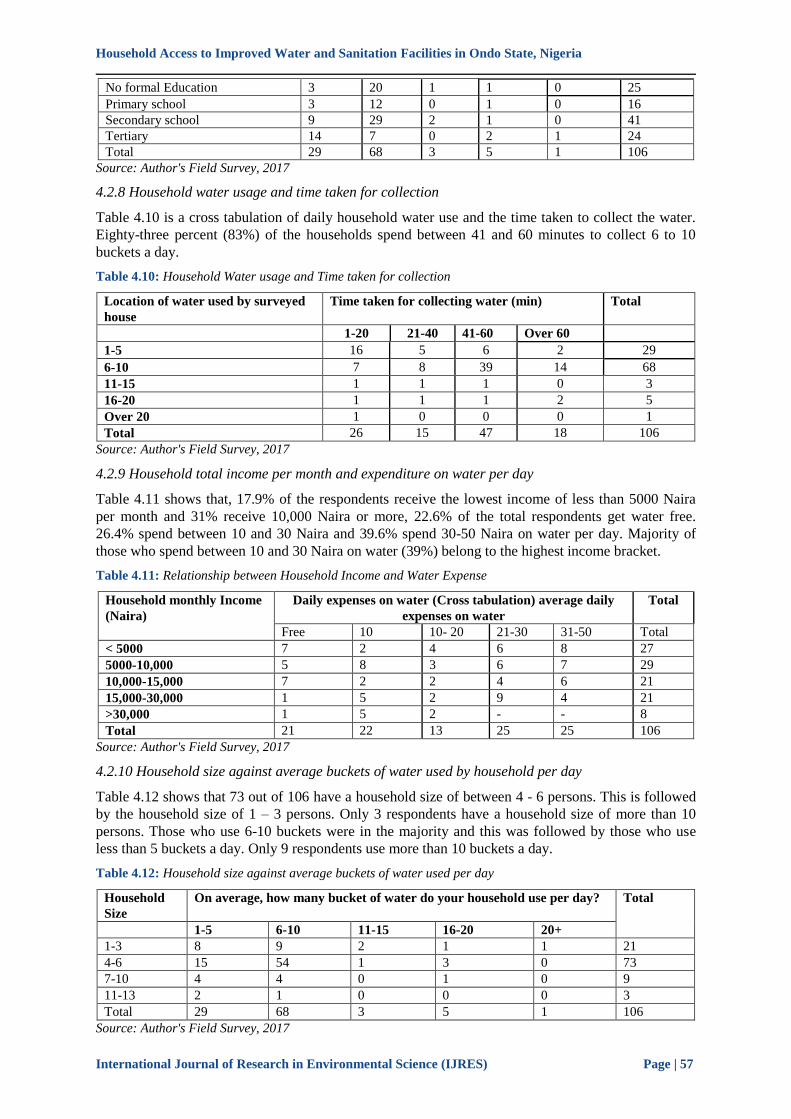
4.2.7 Level of education and average buckets used by household per day.
Table 4.9 indicates that, 3 out of 25 respondents without formal education use up to5 buckets and 20
out of 25 respondents use between 6 and10 buckets a day. On the contrary 14 out of 24 educated
respondent use up 5 buckets a day and 7 out of 24 educated respondent uses between 6 to 10 buckets a
day.
Table 4.9: Levels of education and average buckets of water used by household per day
Level of Education Average buckets of water by household
per day
Total
1-5 6-10 11-15 16-20 20+
Household Access to Improved Water and Sanitation Facilities in Ondo State, Nigeria
International Journal of Research in Environmental Science (IJRES) Page | 57
No formal Education 3 20 1 1 0 25
Primary school 3 12 0 1 0 16
Secondary school 9 29 2 1 0 41
Tertiary 14 7 0 2 1 24
Total 29 68 3 5 1 106
Source: Author's Field Survey, 2017
4.2.8 Household water usage and time taken for collection
Table 4.10 is a cross tabulation of daily household water use and the time taken to collect the water.
Eighty-three percent (83%) of the households spend between 41 and 60 minutes to collect 6 to 10
buckets a day.
Table 4.10: Household Water usage and Time taken for collection
Location of water used by surveyed
house
Time taken for collecting water (min) Total
1-20 21-40 41-60 Over 60
1-5 16 5 6 2 29
6-10 7 8 39 14 68
11-15 1 1 1 0 3
16-20 1 1 1 2 5
Over 20 1 0 0 0 1
Total 26 15 47 18 106
Source: Author's Field Survey, 2017
4.2.9 Household total income per month and expenditure on water per day
Table 4.11 shows that, 17.9% of the respondents receive the lowest income of less than 5000 Naira
per month and 31% receive 10,000 Naira or more, 22.6% of the total respondents get water free.
26.4% spend between 10 and 30 Naira and 39.6% spend 30-50 Naira on water per day. Majority of
those who spend between 10 and 30 Naira on water (39%) belong to the highest income bracket.
Table 4.11: Relationship between Household Income and Water Expense
Household monthly Income
(Naira)
Daily expenses on water (Cross tabulation) average daily
expenses on water
Total
Free 10 10- 20 21-30 31-50 Total
< 5000 7 2 4 6 8 27
5000-10,000 5 8 3 6 7 29
10,000-15,000 7 2 2 4 6 21
15,000-30,000 1 5 2 9 4 21
>30,000 1 5 2 - - 8
Total 21 22 13 25 25 106
Source: Author's Field Survey, 2017
4.2.10 Household size against average buckets of water used by household per day
Table 4.12 shows that 73 out of 106 have a household size of between 4 - 6 persons. This is followed
by the household size of 1 – 3 persons. Only 3 respondents have a household size of more than 10
persons. Those who use 6-10 buckets were in the majority and this was followed by those who use
less than 5 buckets a day. Only 9 respondents use more than 10 buckets a day.
Table 4.12: Household size against average buckets of water used per day
Household
Size
On average, how many bucket of water do your household use per day? Total
1-5 6-10 11-15 16-20 20+
1-3 8 9 2 1 1 21
4-6 15 54 1 3 0 73
7-10 4 4 0 1 0 9
11-13 2 1 0 0 0 3
Total 29 68 3 5 1 106
Source: Author's Field Survey, 2017
Household Access to Improved Water and Sanitation Facilities in Ondo State, Nigeria
International Journal of Research in Environmental Science (IJRES) Page | 58
5. SUMMARY OF FINDINGS, CONCLUSIONS AND RECOMMENDATIONS
5.1 General Characteristics of Respondent
5.1.1 Gender and Age of Respondent
The communities are nearly equally represented with respect to gender i.e. 52% and 48% of the 106
randomly selected were females and males respectively Figure 1 shows that the age distribution of the
respondents is skewed towards the youthful group –i.e. 20 to 40 years- who constitute almost 80%
Less than 4% are above the age of 50. Since the respondents were selected randomly, the Ese-odo
population is generally a youthful community.
The survey also revealed that about 3 in 5 (59.5%) of the respondents are married (55.7%) or were
married before (3.8%). This means that household accessibility to water would be very important to
them. The details of the marital status are shown in Table 4
5.1.2 Educational Level of Respondents
The survey showed that 76.4% of the respondents have had formal education at least up to primary
school and 23.6% have had no education.This shows that the knowledge of the people on potable
water and good sanitation was not in doubt
5.2 Access to Water Supply Facilities
5.2.1 Type of water resource
Stream/river (creeks) is the most readily available point source of water in the area, Even though
respondents would prefer the pipe-borne water from the government, its point sources are far and
limited to a few places. However, what is significant here is that most households (63%) still rely on
untreated surface water for their domestic needs.
5.2.2 Level of Education and Water Sources Used by Household
There appears to be a clear correlation between the level of education and the quality of water that
respondents use. Those with tertiary education will not want anything to do with surface water and
unprotected hand-dug wells. Therefore, because of this, some of this educated residents preferred
using public tap, tanker services and or mechanized public boreholes. education up to primary school
(i.e. including those with no education) were least bordered about their source of water. This could be
a case of affordability, but it does not appear to be fully supported.
5.2.3 Households income against expenditure on water
The study revealed that respondents with high income spend less on water per month as compared to
those with low income. For instance respondents who earn above 30,000naira spend 7.5% of their
total income on water per month whiles those who earn the least (5000 Naira) per month spend about
30% of their total income on water per month. According to UNDP, (2006), water and sanitation
services must be available and affordable for everyone especially the poor. The cost of water and
sanitation service should not exceed 5% of household‟s income.”The revelation above seems to
suggest that the poor in the Municipality do not get access to water as water takes more than 5% of
their income.
5.2.4 Location of water sources and time taken to fetch water
Table 9 shows that those who collect water from the stream spends hours before they can fetch water
from the creek, but only few residents that has access to water in their own homes spend less than 20
minutes to fetch water. This is expected since their most of their water has been polluted by the
operations of the oil exploration and they have to travel distance into the creek before they could get
fresh water, interview revealed that they will need to take canoe filled with kegs and go into the
creeks in mass to search for water and this may take a whole day journey.
5.2.5 Location of Water Point and Water Usage
The study revealed that majority of those who collect water from their own homes do not collect more
than 5 buckets a day but those who collect water from the creeks can collect as much as 100 litres per
household because they uses canoe to transport the water and they don't go every day.
5.2.6 Level of education and average amount of water per household per day
Household Access to Improved Water and Sanitation Facilities in Ondo State, Nigeria
International Journal of Research in Environmental Science (IJRES) Page | 59
The results showed that majority of the educated people use less water than the uneducated or those
with low education. This is expected since the highly educated people are more prudent in their
approach to doing things.
5.2.7 Household Water usage and Time taken for collection
Table 12 showed that, those who collect 5 buckets spend less than 20 minutes and have water in their
homes. Those who use over 50 litres of water spend more than 60 minutes and collect it from a distant
creek where most time they have a long que. Those who have water in their homes will naturally face
less or no competition from other users than those who collect water from the stream/river Therefore
the result is expected.
5.2.8 Household's total income per month and expenditure on water per day
Table 13 revealed that those in low income category spend higher percentage of their income on water
as compared to those higher income brackets. Access to water is a problem for those in low income
brackets according to UNDP standards.
5.2.9 Household size against average buckets of water used by household per day
Table 14 shows that household sizes 4 - 6 and 1- 3 were the two dominant household sizes in the
community. Whereas 43% of household size 1 – 3 used more than 5 buckets a day, 74%of household
size 4-6 used the same quantity. It can therefore be deduced that household size 4-6 use more water
than household size 1-3.
5.3 Access to Sanitation Facilities
The study revealed that majority of the respondents has no access to improved sanitation facilities
only 20% had access to water closet toilet which is regarded as the safest sanitation facility. Majority
of the households in the community uses nearby bush, this can be attributed to te geological
characteristics of Ese-odo being a coastal area, therefore, it is difficult to have soak-away, and
construction of improved toilet is difficult. An interviewee said "It is difficult to dig a soak-away here,
whenever we want to defecate, we usually enter into the nearby bush with our shovel and dig small,
and after defecating, we cover it back with soil and this has been our practice ever since time"
5.4 Conclusions
Poor access to clean water and sanitation becomes a bothering and worrisome issue. Despite the
increased support provided through government and NGO's, there are many people still depending on
unsafe drinking water source and spends the considerable time and stress in getting water.
The study revealed that 29.9% have access to safe drinking water. The major source of water in the
area was the stream/river with about 63% of the population patronizing it. On the average the
households use between hours to collect 50 litres off water a day which costs. The low income earners
spend more than 5% of their income on water which is above the UNDP recommendation. It also
showed that those with high levels of education use water more judiciously.
With regard to sanitation, only 20% have access to good sanitation. Over 63% of the population use
defecate in nearby bush, and about 3% of the population patronize free range or open system. Also,
about 9% have WC at their disposal.
5.5 Recommendations
The following suggestions may be useful in achieving more efficient provision of water and sanitation
supply in Ese-odo Local government Area.
1. The Municipal Assembly must focus on providing pipe-borne water to the people.
2. The Municipal Assembly should educate the landlords on alternative type of toilet facilities which
can adapt to their environment.
3. The Municipal Assembly should intensify education on environmental hygiene to discourage
people from defecating outside.
5. Donor nations and institutions should continue to support the coastal area, with funds, expertise
and other logistics to help meet the water supply and sanitation needs of the populace.
Household Access to Improved Water and Sanitation Facilities in Ondo State, Nigeria
International Journal of Research in Environmental Science (IJRES) Page | 60
6. The nation should work harder towards the achievement of SDGs.
7. Making water and sanitation services accessible in this area should be a core responsibility of both
the Ondo State and Ese-odo local governments but not be considered as one target of MDGs.
8. Government should ensure that tariff levels and structures benefit all consumers including low-
income ones, by selecting appropriate pricing systems such as the increasing block tariff and
uniform volumetric charge
9. Environmental Impact assessment and mitigating ensures should be taken to reduce oil spillage
which contaminates their water bodies even their water animals. purification, which at least
reduced the risk of water-borne disease.
10. Water and sanitation programmes should engage with communities in finding acceptable ways of
subsiding and providing access to water and sanitation.
11. The findings of this research can be pursued further by other research bodies. The water
institutions in Ondo state and water experts can also use the data obtained for further research on
access to improved water.
REFERENCES
Amenga-Etego, R. (2003). Water Privatization in Ghana: Women‟s Rights under Siege-
Accra:Integrated social Development Centre (ISODEC)
Amengo-Etego, R. and S. Grusky (2005). „The New Face of and Associated Factors Environmental
Health at London and Loughborough (WELL), Available: and Planning, vol. 15, no. 3, pp. 332-
337.
Bremner, J. L., and Bilsborrow.R. (2005). Population dynamics and Millennium Goal 7. Discussion
Paper for the Population-Environment Research Network (PERN) Cyber- Seminar, Sept. 5-16:
http://www.populationenvironmentresearch.org/seminars.jsp.
Cooper, D. R. (2011). business Research Methods (11th ed.). McGraw-Hill.
Criteria and Other Supporting Information international programme on chemical safety,
Dannerber J.B, Jack .T and Frumkin S, et.al., (2011) Performance Control for Sensitive Lands: A
Practical Guide for Local
Du Faut. (1988) Access to Water Rights, Obligations and the Bangalore Situation, Linköping
University Electronic Press, Stockholm, 429 pp.
Eager Diken and Smith Coss. (2004) Does Social Capital Matter in Water and Sanitation Delivery?
Social Capital Initiative Working Paper No. (9), 21 pp.
Elledge, M. F. 2003, Sanitation Policies: Thematic Overview Paper, IRC International Water
Emoabino .I.U. & Alayande A. W. (2007). Water Demand Management,
environmental burden of disease. Geneva, WHO. for life: making it happen.
http://www.who.int/water_sanitation_health/
Hutton, G.; Chase, C. The Knowledge Base for Achieving the Sustainable Development Goal Targets
on 10. Pirani, 1989, p.32-33.
Joint Monitoring Programme (JMP) for Water Supply and Sanitation: Improved Sanitation Coverage
Estimates - Kenya, March 2010 48
Kharaka F, and Dorsey T. (2005) Matter that Matters: A Study of Household Routines in a Process of
Changing Water and Sanitation, Unitryck, Linköping, 267 pp.
Koichiro Matsuira (2003),Contribution of Water Pollution from Inadequate Sanitation and Housing
Quality to Diarrheal Disease in Low-Cost Housing Settlements of Cape Town, South Africa‟‟.
American Journal of Public Health, 7 (101) pp. 4-8
Lenton, R. (2003). Background Paper of the Task Force on Water and Sanitation. New York NY, UN
Millennium Project.
Lindskog .A, Lundquist Roaf V., Grimes H., Langford M., Fairstein C., Russell A., Kiefer T. (1989)
Manual on the Right to Water and Sanitation. A Tool to Assist Policy Makers and Practitioners
Develop Strategies for Implementing the Human Right to Water and Sanitation, UN-HABITAT,
Geneva.
Household Access to Improved Water and Sanitation Facilities in Ondo State, Nigeria
International Journal of Research in Environmental Science (IJRES) Page | 61
Lindskog, P., and Lundqvist J. (1989). “Why poor children stay sick: the human ecology of child
health and welfare in rural Malawi.” Scandinavian Institute of African Studies Research Report
No. 85. Uppsala.
Mara, D.; Lane, J.; Scott, B.; Trouba, D. Sanitation and health. PLoS Med. 2010, 7, e1000363.
[CrossRef]
Mehretu, A and Mutambirwa C., 1992. “Time and energy costs of distance in rural life space of
Zimbabwe: case study of the chiduku communal area”. Social science and medicine 34(1): 17-24
mid-term assessment of progress of, 2004 WHO/UNICEF JMP for water supply and
Mooijman, A. M., (December 2003), WELL Factsheet: Evaluation of Hygiene Promotion [Online],
Water
NBS and ICF International. Nigeria Demographic and Health Survey 2013; NBS and ICF
NDDC (2004). Niger Delta Environmental Survey, NDES New Yorke.
Nwakwo W.K and Ifeadi Ada K (1988) Rural Water Supply and the MDGs: A sustainable Approach.
Paper presented at the Conference of the Association of Professional Women Engineers of
Nigeria (APWEN) Owerri Chapter.
Olujimi Julius Ajilowo Bayode, Emmanuel Adebayo Adewunmi and Sogbon Odunwole (2011)
Environmental implications of oil exploration and exploitation in the coastal region of Ondo
State, Nigeria: A regional planning appraisal, International Review of Social Sciences and
Humanities Vol. 3, No. 1 (2012), pp. 51-61 www.irssh.comISSN 2248-9010 (Online), ISSN
2250-0715
Pruss Ustum, Estache, A., Shafik N. (2004) Infrastructure Services in Developing Countries: Access,
Quality, Costs and Policy Reform. World Bank Policy Research Working Paper 3468,
Washington, D.C.
Sari A.R. and Ari ,M.(2006) . Water Rights and Multiple water users. Irrigation and Drainage
system,15.129-143.
Saunder Cate. and Thornhill P. (2010) Peri-Urban Water and Sanitation Services, Springer
Dordrecht Heidelberg, London, 295 pp. University of Ghana http://ugspace.ug.edu.gh 116
Sbrana, G. Technical Note on the Determinants of Water and Sanitation in Yemen; Prepared for the
Project 13, 4. [PubMed]
Skolnik W.H (2012), p.33 33. " The Collection and Management of Household Garbage" , in Poor
Die Young: Housing and Health in Third World Cities, eds.,
Tumwebaze, I.K.; Orach, C.G.; Niwagaba, C.; Luthi, C.; Mosler, H.J. Sanitation facilities in Kampala
slums, UNCHS, Survey of Communities and Squatter Settlements, (Dublin: Tycooly
International Publishing Ltd., 1982), p.33.
Tumwine, J.M., Thompson, J., Katua, M.K., Mujwahuzi, M., Johnstone, N., Porras I. (2003),
Sanitation and Hygiene in Urban and Rural Households in East Africa‟‟. International Journal
of Environmental Health Research, 13(2), pp. 107-115.
UN (United Nations) 2004.World Population Prospect: the 2004 Revision. United Nations,
UN (United Nations) 2010. United Nations Millennium Development Goals. Accessed at
UNDP ( United Nations Development Program) 2006. Human development report 2006. New York:
UNDP
UNFPA. (2003 a). Global population and water: access and sustainability. New York NY,
UNICEF and WHO (2008). Progress on Drinking water sanitation: Special Focus on
UNICEF and WHO (2012). Progress on Drinking Water and Sanitation. Joint Monitoring Programme
for Water Supply and Sanitation. http://data.worldbank.org/topic/agriculture-and-rural-
development ISBN: 978-92-806-4632-0. Visited 15 February 2014.
UNICEF/WHO (2000). Global Water Supply and Sanitation Assessment Report. p.
UN-Water (2009). “Sanitation contributes to dignity and social development”, factsheet No.
3waterforlife.pdf
White, G. F., D. J. Bradley, and A. U. White. (1972). Drawers of Water: Domestic Water Use.
WHO (1987). Drinking Water Quality Guideline for selected herbicides. Volume 27,World
Household Access to Improved Water and Sanitation Facilities in Ondo State, Nigeria
International Journal of Research in Environmental Science (IJRES) Page | 62
WHO (1992). Our Planet, Our Health: Report of the World Health Organisation commission on
Health and Environment (Geneva, Health Organisation).
WHO (1993). Guidelines for Drinking Water Quality, Second Edition. Volume
WHO (1996). Guidelines for Drinking –Water Quality, Second Edition Volume 2, Health
WHO (2003). Emerging issues in water and infectious disease. Geneva: World Health
WHO (2004). Guidelines for Drinking Water Quality. Geneva, WHO. 1
WHO (2008 ). Guidelines for Drinking –Water Quality, Third Edition, Volume 1,2008,
WHO (2008). Guidelines for Drinking-Water Quality. Third Edition incorporating the first and
second Addenda.vol.1(Geneva World Health Organisation.)
WHO / UNICEF (2010) Joint Monitoring Programme (JMP) for Water Supply and Sanitation.
WHO and UNICEF (2004). Meeting the MDG drinking water and sanitation target: A
WHO. (2006). Preventing disease through healthy environments: towards an estimate of the
WHO/UNICEF (2000) Global water supply and sanitation Assessment 2000 report. available
at:http://www.who.int/docstore/water_sanitation_health/Globassessment/GlobalTOC.htm Visited
30th June 2017.
WHO/UNICEF (2005) Joint Monitoring Programme for Water Supply and Sanitation. Water
WHO/UNICEF (2010). Joint monitoring report: Progress on Sanitation and Drinking Water
http://www.who.int/water_sanitation_health/monitoring/fast_facts/en/index.html. Accessed 13th
April, 2017.
World Bank (2004). “The World Bank Group‟s Programme for Water Supply and Sanitation”, Water
Supply and Sanitation Sector Board.
World Health Organization (WHO). Sanitation: Fact Sheet;World Health Organization Media Center,
2016. 816.
WSMP Nigeria, (2008) Water and Sanitation summary sheet. http:// www.unicef .org/nigeria/ng
media water sanitation summary sheet.pdf. Visited 21 May 2017.
Citation: Owolabi. B. O., " Household Access to Improved Water and Sanitation Facilities in Ondo State,
Nigeria ", International Journal of Research in Environmental Science , vol. 3, no. 3, p. 20, 2017.
http://dx.doi.org/10.20431/2454-9444.0303005
Copyright: © 2017 Authors. This is an open-access article distributed under the terms of the Creative
Commons Attribution License, which permits unrestricted use, distribution, and reproduction in any medium,
provided the original author and source are credited.