Embed Size (px)
Citation preview

Household waste prevention in the Helsinki metropolitan area
Sara Agnes Maria Turunen
Faculty of Civil and Environmental Engineering
University of Iceland
2018


Household waste prevention in the Helsinki metropolitan area
Sara Agnes Maria Turunen
30 ECTS thesis submitted in partial fulfillment of a
Magister Scientiarum degree in Environment and Natural Resources
Advisors Jukka Heinonen
Juudit Ottelin
Master’s Examiner Björn H. Halldórsson
Faculty of Civil and Environmental Engineering
School of Engineering and Natural Sciences University of Iceland
Reykjavik, May 2018

Household waste prevention in the Helsinki metropolitan area
Household waste prevention in the Helsinki metropolitan area
30 ECTS thesis submitted in partial fulfillment of a Magister Scientiarum degree in
Environment and Natural Resources
Copyright © 2018 Sara Agnes Maria Turunen
All rights reserved
Faculty of Civil and Environmental Engineering
School of Engineering and Natural Sciences
University of Iceland
Taeknigardur – Dunhagi 5
107, Reykjavik
Iceland
Telephone: 525 4000
Bibliographic information:
Sara Agnes Maria Turunen, 2018, Household waste prevention in the Helsinki
metropolitan area, Master’s thesis, Faculty of Civil and Environmental Engineering,
University of Iceland, pp. 1-98.
Printing: Háskóla Prent
Reykjavik, Iceland, May 2018

Abstract
The purpose of this study is to assess a household’s viewpoint and knowledge regarding
waste prevention and the options a regular household has for waste reduction. This study
compares waste prevention targets set by the EU and the Finnish Government and the
services and opportunities municipalities offer to residents for the actual waste prevention.
In addition, this study tries to reveal and enlighten the field of waste prevention from the
consumer perspective and how consumers understand the concept and find possibilities to
participate in waste prevention.
Waste prevention is a top priority among the five steps on the EU’s waste hierarchy, a
guiding framework of the EU’s waste management legislation and practice. However, the
reduction of municipal solid waste amounts has not been successful in many parts of
Europe. For instance, in all the Nordic countries (except in Sweden) municipal solid waste
amounts have increased between 2005 and 2016. This study focuses on Finland,
particularly on the households in the Helsinki metropolitan area. The main aim, and
research question, of this study is to explore potential reasons for why household waste
amounts have not decreased in the Helsinki metropolitan area. Significant amount of the
Finland’s municipal solid waste is generated in households in the Helsinki metropolitan
area.
To conduct the study, qualitative method has been used. Empirical data has been gathered
through 16 semi-structured interviews with households from the Helsinki metropolitan
area. This data has been supported with the information from the Helsinki metropolitan
area’s waste service provider HSY. Findings show that the concept of waste prevention is
unclear and often confused with waste recycling. It seems that households are insecure
what kind of practical actions they are able to do in terms of waste prevention. The results
of this research seem to indicate that households would need more support regarding
concrete and practical waste prevention actions. Suggestions for future improvements are
presented in this study.
Keywords: waste management, waste prevention, waste minimization, household waste,
municipal solid waste


Útdráttur
Tilgangur þessara rannsóknar er að meta sjónarhorn og þekkingu heimila hvað varðar
úrgangsforvarnir og möguleikann á að draga úr úrgangi hefðbundna heimila. Þessi
rannsókn ber saman úrgangsforvarnir settar af EU og Finnsku ríkisstjórninni ásamt þeirri
þjónustu og tækifærum sem sveitarfélög bjóða uppá fyrir íbúa hvað varðar
úrgangsforvarnir. Að auki reynir þessi rannsókn að sýna og upplýsa svið úrgangsforvarna
frá sjónarmiði neytenda og hvernig neytendur skilja hugtakið og finna möguleika á að taka
þátt í úrgangsforvörnum.
Forvarnir gegn úrgangi eru meðal forgangs verkefna EU. Fimm skrefa úrgangs stig EU,
eru leiðarljós af löggjöfum og starfsháttum úrgangsstjórnunar. Þrátt fyrir þetta hefur ekki
náðst árangur í að minnka úrgang í mörgum Evrópulöndum. Þvert á móti, milli árana 2005-
2016 jókst losun úrgangs frá sveitarfélögum á öllum norðurlöndunum (nema Svíþjóð).
Þessi rannsókn fjallar um Finnland, einkum þó heimili á höfuðborgarsvæðinu. Megin
markmið og rannsóknarspurning þessara rannsóknar er að finna út hugsanlegar ástæður
fyrir því að Finnland hafi ekki tekist að daga úr losun úrgangs.
Rannsóknin var framkvæmd með eigindlegum aðferðum. Gögnum var safnað með 16 hálf-
opnum viðtölum á heimilum á höfuðborgarsvæði Finnlands. Gögnin vöru stutt við
upplýsingar frá úrgangsstöð höfuðborgarsvæðisins HSY. Niðurstöður sýna að skortur er á
skilningi á hugtakinu úrgangsforvörn og ruglingur sé á milli endurvinnslu úrgangs og
úrgangsforvörnum. Það virðist óljóst fyrir heimili hverskonar hagnýtar aðgerðir hægt sé að
gera með tilliti til úrgangsforvarna. Niðurstöður þessara rannsókna virðist benda til þess að
heimili þurfi meiri stuðning hvað varðar heilsteyptar og hagnýtar aðgerðir í
úrgangsforvörnum. Tillögur um endurbætur í framtíðinni eru kynntar í þessari rannsókn.
Leitarorð: Úrgangsstjórnun, úrgangsforvarnir, lágmarks úrgangs losun, heimilissorp,
úrgangslosun sveitarfélaga.


To my family
‘


ix
Table of Contents
List of Figures ............................................................................................................... xi
List of Tables ............................................................................................................... xii
Abbreviations ............................................................................................................. xiii
1 Introduction ........................................................................................................ 15 1.1 Background ........................................................................................................... 15 1.2 Research problem and research questions ............................................................. 17 1.3 Scope and limitations ............................................................................................ 18
2 Research design .................................................................................................. 21 2.1 Method ................................................................................................................. 21
2.1.1 Qualitative method .................................................................................................... 21 2.1.2 Data analysis ............................................................................................................... 22
2.2 Research process ................................................................................................... 22 2.2.1 Sampling ..................................................................................................................... 22 2.2.2 Participants ................................................................................................................. 24 2.2.3 Interview procedure ................................................................................................... 27
2.3 Outline of the thesis .............................................................................................. 28
3 Practical systems and theoretical aspects of waste prevention ............................ 31 3.1 Definition of waste ................................................................................................ 31 3.2 MSW management in EU ....................................................................................... 32
3.2.1 MSW management in the Helsinki metropolitan area ............................................... 34 3.3 Transitioning waste management towards circular economy .................................. 35
3.3.1 Circular economy in Finland ....................................................................................... 38 3.4 Household waste prevention ................................................................................. 38
3.4.1 Practical ways for households .................................................................................... 41 3.5 Waste prevention targets in the EU ........................................................................ 42
3.5.1 Finland’s waste prevention and its targets ................................................................ 44 3.6 Barriers to waste prevention .................................................................................. 47
3.6.1 Conflict of interest ...................................................................................................... 47 3.6.2 Measuring waste prevention...................................................................................... 47 3.6.3 Throwaway society ..................................................................................................... 47 3.6.4 Households’ habits and lack of knowledge ................................................................ 48 3.6.5 Waste recycling .......................................................................................................... 49 3.6.6 Energy recovery .......................................................................................................... 49
3.7 Policy measures for waste prevention .................................................................... 49 3.8 Waste prevention vs. material efficiency ................................................................ 51 3.9 Examples from Europe ........................................................................................... 51
3.9.1 Sweden – weight-based-billing system ...................................................................... 51 3.9.2 UK – awareness and knowledge ................................................................................. 52 3.9.3 Belgium – four main factors influencing waste generation ....................................... 52 3.9.4 Austria – subsidy for reusable good ........................................................................... 53
4 Results and discussion......................................................................................... 55

x
4.1 Theme 1 - Consumption ........................................................................................ 56 4.1.1 Western vs. Finnish consumption .............................................................................. 57 4.1.2 Personal consumption and belongings ...................................................................... 58 4.1.3 Rental, loaning and sharing services .......................................................................... 61 4.1.4 Second-hand shopping ............................................................................................... 62
4.2 Theme 2 - Waste prevention ................................................................................... 64 4.2.1 Concept waste prevention ......................................................................................... 64 4.2.2 Waste prevention actions ........................................................................................... 66 4.2.3 Sustainable consumption ........................................................................................... 67 4.2.4 Maintenance and repair services ............................................................................... 69 4.2.5 Reasons for reducing waste........................................................................................ 71
4.3 Theme 3 - Recycling ................................................................................................ 73 4.3.1 Waste recycling........................................................................................................... 73 4.3.2 Used items recycling ................................................................................................... 76 4.3.3 Pay-as-you-throw ....................................................................................................... 77 4.3.4 General interest .......................................................................................................... 78 4.3.5 Responsible party ....................................................................................................... 79
5 Conclusions ......................................................................................................... 81
References .................................................................................................................. 87
Appendix A ................................................................................................................. 95 Background questionnaire for the interviewees .................................................................. 95 Interview questions for the households .............................................................................. 97

xi
List of Figures
Figure 1. Urban metabolism (Wageningen University & Research, 2015)......................... 16
Figure 2. Finland's population density per km2 and the research area within the blue
circle (Statistics Finland, 2014) ........................................................................ 19
Figure 3. Illustration of the EU’s legal definition of waste (European Commission,
2012) ................................................................................................................. 31
Figure 4. MSW amounts in the EU in years 2005 and 2016 (Eurostat, 2018) .................... 33
Figure 5. MSW amounts in tons in the Helsinki metropolitan area (HSY database,
2018) ................................................................................................................. 34
Figure 6. Household waste in kg per capita (HSY database, 2018) .................................... 34
Figure 7. Linear economy (Ellen MacArthur Foundation, n.d.).......................................... 36
Figure 8. Circular economy (Ellen MacArthur Foundation, 2013a) ................................... 37
Figure 9. The EU's waste hierarchy (EEA Report, 2015) ................................................... 39
Figure 10. Illustration of definition of waste prevention (EEA Report, 2015) ................... 40
Figure 11. Finland's MSW amounts in 1000 t/yr over the period 2008-2015
(Laaksonen et al., 2017).................................................................................... 45

xii
List of Tables
Table 1. Interviewees' demographics .................................................................................. 26
Table 2. Interview details .................................................................................................... 28

xiii
Abbreviations
BAU Business as usual path
CE Circular Economy
EC European Commission
EU European Union
HSY Helsinki Region Environmental Services Authority
MSW Municipal solid waste
NWMP National Waste Management Plan
WFD EU’s Waste Framework Directive


15
1 Introduction
1.1 Background
Unsustainable consumption of natural resources is causing serious problems for the
environment. World’s ecological overshoot already started in the 1970s - meaning that
since then humanity has been using more resources than the Earth can provide in a year
and generatig more waste than the Earth can handle (WWF Report, 2016). Indeed the
change has been so radical that the researchers have started to call the new era
Anthropogenic – human-influenced geologic time (Steffen et al., 2015; Barnosky et al.,
2012). Currently human population needs more than 1.6 Earths to support its consumption
habits (WWF Report, 2016). For instance, one European uses 16 tons of material in a year
and six tons of this becomes waste (European Commission, 2018). The business as usual
(BAU) path would mean that humanity would continue as it has been operating before
(Sachs, 2015) and multiple researchers have stated the current stage of consumption cannot
continue anymore. As a result the natural resources are scarce and waste generation is
greater than can be recycled (WWF Report, 2016). This is threatening not only our health
and well-being, but also our future (WWF Report, 2016). In addition, the world’s
population is constantly growing so the demand and consumption of materials will only
increase in the future (Barnosky et al., 2012; Sachs, 2015), escalating the unsustainable
consumption of global resources.
Today urban metropolitan areas have become the centers of human development and
consumption. In order to understand the environmental impacts of urban development, a
water treatment specialist Wolman defined a concept called urban metabolism in 1965
(Zhang, Yang and Yu, 2015). Urban metabolism refers to cities’ or other human
settlements’ metabolic processes; input and output streams between city and its
environment (Zhang et al., 2015; see Figure 1). Researchers have compared cities to
natural organisms due to the reason that similar to organisms cities use resources from
surrounding environment and create waste as a result (Kennedy et al., 2011; Zhang et al.,
2015; see Figure 1).

16
Figure 1. Urban metabolism (Wageningen University & Research, 2015)
As can be seen from above Figure 1, the outputs of the urban metabolism are resource
losses, wastewater and solid waste. Indeed solid waste management is one important aspect
of the urban metabolism as the waste cities produce is mostly solid waste (Qu, Zhang and
Liang, 2012).
Municipal solid waste (MSW) and its management continue to be a problem around the
world. Landfills release greenhouse gas methane, which increases the climate change
(Botkin and Keller, 2011; European Commission, 2016; McKinsey, 2015). Waste disturbs
the natural circles when it ends up to nature and pollutes waters and soil (Helsingin
kaupunki, 2009). Waste can hurt and kill animals when they mistake it as food or get
tangled to it (Helsingin kaupunki, 2009; Helsingin Uutiset, 2017). For instance, in
Philippines 74% of all plastic leakage to nature comes from collected waste streams
indicating significant issues in the waste management system (McKinsey, 2015). MSW is
mainly generated in households (Barr, 2007; Ferrara and Missios, 2012) and as the world
population is increasing, so are the waste amounts. Many people tend to dispose waste as
quickly as possible. Disposal means wasted resources and with effective waste
management much of the waste could be reused or recycled (Botkin and Keller, 2011).
Thus, advanced waste management plays crucial role in the material efficiency of the
resources. However, preventing the waste generation in the first place would be more
efficient than any waste treatment because the transportation and processing of waste uses
resources and pollutes the environment as well (Zacho and Mosgaard, 2016). In addition to
consumption and waste stages, waste prevention can potentially decrease the
environmental impact from MSW throughout the whole life cycle of a product (EEA,
2016).
In the EU MSW represents only 10% of the total waste but it is a highly visible problem
(EEA, 2016). Each of the EU’s 500 million people generates half a ton household waste
per year (European Commission, 2010). In comparison between the years 2005 and 2016
some of the EU countries, like Bulgaria, Netherlands and Spain, have been able to decrease
their generated MSW. In others, for instance in all of the Nordic countries except in
Sweden, the amounts have been increasing (Eurostat, 2016). Previous research suggests

17
that waste prevention should be done locally and nationally as there is no one fits for all
system (Cox et al., 2010; Zorpas and Lasardini, 2013). While waste prevention research
has received attention globally, not much research has been conducted regarding Finland
recently. Latest research about Finland is mostly related to food waste prevention
(Koivupuro et al., 2012; Katajajuuri et al., 2014; Gjerris and Gaiani, 2013) and industry
related waste minimization (Nurmesniemi, Pöykiö and Keiski, 2007: Lilja and Siukkonen,
2008). Hence, this study will focus on Finland, where the amount of MSW has had an
overall increasing trend during the past decades. More precisely, it is narrowed down to the
Helsinki metropolitan area where more than one fifth of the Finland’s 5.5 million people
live. The main focus is on the household waste prevention.
There have been different attempts to tackle the increasing trend in waste volumes in
Finland. Already in year 1993 the Waste Act of Finland has had the waste reduction as the
center aim of the waste management. In 2008, the Ministry of the Environment of Finland
has published a strategic waste plan “Towards a recycling society – the national waste
management plan until 2016”. Again, the central priority has been given to waste
prevention (Ministry of the Environment, 2008; Laaksonen et al., 2017; EEA Report,
2016). Nevertheless, it has been concluded in Laaksonen et al.’s (2017) background report
that the target to first regularize Finland’s community waste to 2.3-2.5 million tons
(situation before 2000) and then turn it into a decreasing trend before year 2016 has not
been accomplished. Instead, the amount of MSW increased during the plan’s period in
2008-2016 (note. was valid until January 2018 when the next NWM plan was published).
According to Statistics Finland (2016) the amount of community waste in 2016 was 2.8
million tons. In the Helsinki metropolitan area MSW composes 11% of the total waste and
household waste 6% of the total waste (HSY database, 2016). The significance of the
household waste section comes with both the greenhouse gas emissions and financial costs.
Indeed more than half of the greenhouse gas emissions from the Helsinki metropolitan
area’s waste came from household waste – 173 million kg CO2 equivalence (HSY
database, 2016). In addition, according to the Ministry of Environment (2008) 75% of the
MSW costs come from household waste management.
Current Finland’s waste legislation follows principally the EU’s waste legislation. This
means that waste management in Finland is also based on WFD and waste hierarchy.
However, the current waste policies and control systems in Finland are claimed to mostly
support material utilization and health and environmental risks prevention caused by waste,
but not waste prevention (SLL, n.d.; YLE, 2018). One rationalization has been that the
used measures have not been suitable and strong enough to drive changes in the national
economy’s material streams (Laaksonen et al., 2017).
1.2 Research problem and research questions
The aim of this study is to explore potential reasons for why household waste amounts
have not decreased in the Helsinki metropolitan area, despite the stated priority in
Finland’s and the EU’s waste legislation. Significant amount of the Finland’s municipal
solid waste is generated in households in the Helsinki metropolitan area. This study begins
by reviewing previous literature in waste prevention, case studies from Europe and waste
reports from the EU and Finnish Government. The literature review summarizes the best
theoretical practices and most used real-life initiatives and actions in the field of waste

18
prevention. Secondly, based on the acquired theoretical knowledge and understanding,
interviews with group of residents of the Helsinki Metropolitan were conducted. The aim
of the interviews was to reveal the households point of view and knowledge regarding
waste prevention and what kind of services and information regarding waste prevention are
offered for the households by the municipalities and by possible other service providers.
Also local waste provider Helsinki Region Environmental Services Authority (HSY)
provided additional information. By these research steps, this study is able to collect
information on what kind of visible actions and tools are used to reach the waste
prevention targets in the Helsinki metropolitan area.
The research questions the study intends to answer are:
What are potential reasons why the Helsinki metropolitan area has not been
able to decrease the household waste amounts?
This question in mind the study aims to find out, through interviews with households, what
issues potentially hinder the waste prevention development in the Helsinki metropolitan
area. By interviewing households this study can potentially enlighten the problem from a
new perspective, since households are one significant party in waste prevention.
Households provide evidence for practical side of the issue as well: what is missing in
order to incentivize households to more actively prevent waste generation in their everyday
life.
Simultaneously this study has a supporting, follow-up research question:
How could the target be reached in the future?
This follows the main research question naturally, since interviewees are expected to
reveal the problematic factors, while giving their suggestions how these could potentially
be improved. The previously researched ideas and suggested solutions for waste prevention
will be tested in the interviews and see whether these would receive support among the
households.
1.3 Scope and limitations
The context of the research is Finland and more precisely the Helsinki metropolitan area,
which consists of four cities; Helsinki, Espoo, Kauniainen and Vantaa. The significance
comes with the area’s population density (see Figure 2) and the economic status. In total
one fifth of the Finland’s population, 1.2 millions, live within the Helsinki metropolitan
area. The results of this study can indicate reasons that can be found in the entire Helsinki
metropolitan area or even from Finland but are not generalizable due to the sample size.

19
Figure 2. Finland's population density per km2 and the research area within the blue
circle (Statistics Finland, 2014)
Waste prevention can be done in different phases: production, distribution, and
consumption phase and is therefore affected by multiple stakeholders (European
Commission, 2012). In this research the main weight is given to the consumption phase,
where the private consumers are making the decisions, with some aspects of the two other
remaining areas of waste prevention. Hence, the focus is on the MSW through households
and one waste management service provider HSY. Conducted interviews with households
from the Helsinki metropolitan area can give ideas on how to improve the overall waste
prevention situation in the Helsinki metropolitan area.
The empirical research in this study focuses only on Finland’s metropolitan area, but
general descriptive statistics on waste amount and management in the EU are used as
background information. Availability of comparable data from the EU Member States is
limited due to the differences in MSW definitions and how each country processes waste
types and data (EEA, 2016). MSW in some countries includes only household waste while
in others, like Finland, it includes also commercial waste. In addition, the definition of
MSW and calculations has changed over time in some of the EU countries (EEA, 2016).
Thus, the numerical comparison is not the main focus of this study. Nevertheless, it can
give directional hints.

20
The chosen method, qualitative research, has its limitations as well. It is a time-consuming
method because it takes time to conduct and transcribe personal interviews. Time-
consuming aspect gives limitation to the size of the sample data as well, which makes the
results ungeneralizable. Simultaneously, the personal characteristics and previous
knowledge of the researcher shape the study (Creswell, 2007). Based on the same
information different conclusions might be drawn due to personality of the researcher
(Maxwell, 2005). Compared to the quantitative research method, qualitative research is
less structural: when investigating individuals’ knowledge, opinions and viewpoints, it is
impossible to know in advance what kind of responses they are going to give to the open
questions. Lack of objectivity is one counter argument for qualitative research. In addition
since the data cannot be analyzed as numbers, the results are harder to normalize, forcing
the researcher to be extra sensitive when making conclusions. Same words can have
different meaning for different people and people have different sense-making narratives
(Mishler, 1986). This may cause issues when reviewing the interviews, since individuals
can in their narrative use different words and expressions even though they would be
explaining the same object or action.

21
2 Research design
2.1 Method
2.1.1 Qualitative method
The study has a qualitative research approach. Qualitative research aims to describe and
get deeper understanding of the chosen topic (Kvale, 1996). The qualitative research
affiliates with personal understanding and interpretation of the matter and therefore data is
sensitive to the context. Moreover, qualitative research is concerned with the human
behavior. The findings from qualitative study can open up entirely new problems and
perspectives related to the topic but small sample size, due to the method’s time-
consuming feature, is not enough to give any generalization possibility of results. In this
study the purpose is to deepen understanding about the waste prevention awareness of
households living in the Helsinki metropolitan area. Based on the results of the qualitative
analysis, the study formulates research hypotheses for possible quantitative research on the
topic in the future.
Here data collection has been done using in-depth, semi-structure interview approach.
Interview is a useful tool in getting the story behind the personal experiences (McNamara,
1999). It aims to cover both factual and meaning levels, however, capturing the meaning is
often difficult for the interviewer (Kvale, 1996). The main task for the interviewer is to
understand what the interviewee actually means (Kvale, 1996). The interviewer needs to be
a good listener and adaptable throughout the interview because the instrument of the
research is human. “The interviewer needs to learn to listen to what is said and how it is
said.” (Kvale and Brinkmann, 2009, p.138) The qualitative research interview allows
measuring the interviewee’s familiarity on the topic in question. It is also used for
capturing the interviewee’s voices and experiences. An interview is more personal than a
questionnaire, and interviewer is able to pursue in-depth information about the topic
(McNamara, 1999). In order for the questions to have the same meaning to different
interviewees the questions need to be modified to be suitable to, for instance, the
background of the interviewee and his/her understanding of the subject (Kvale and
Brinkmann, 2009). Here semi-structured interview gives interviewer chance to re-arrange
or adjust questions during the interview (Dumay, 2011). In order to investigate diversely,
the knowledge and viewpoints different question types have been used. These have been
for instance, introductory, follow-up, probing, specifying and direct questions (Kvale and
Brinkmann, 2009).
These aforementioned reasons underline why this particular approach has been chosen for
this research. Face-to-face interviews with households have enabled getting detailed
information on the knowledge and viewpoints of these participants and the possible gap
between the institutions and households. Focusing on individuals who represent
households in different categories (age groups, education, housing type etc.) may give
ideas on how the situation is with the rest of the households in the Helsinki metropolitan

22
area. As mentioned before the Helsinki metropolitan area represents one fifth of the
Finland’s population. However, due to the sample size the results of this study are not
generalizable.
2.1.2 Data analysis
Thematic analysis has been used to identify the most important themes and patterns from
the data. Due to the reason that “predefined codes may be used” (Bowen, p.32, 2009), the
original interview outline includes three different themes: consumption, waste prevention
and recycling. Two other themes, consumption and recycling, have been derived from the
previous research being the most important themes influencing waste prevention. The rest
of the thematic analysis has been done using grounded theory procedure, where the data
comes from the combination of the interviews and interviewer’s observations (Bowen,
2009). The purpose of grounded theory is usually to generate theories (Berg, 2009),
however, as the goal of this study is not to create new theories, the grounded theory
process has been only used for the coding of the interview texts. This kind of method has
been successful in a study ‘Identifying motivations and barriers to minimizing household
food waste’ (Graham-Rowe, Jessop and Sparks, 2014) and in other studies as well
(Gardner and Abraham, 2007; Graham-Rowe et al., 2012). The three main themes from the
interview serve as selective coding giving the core categories for the analysis. Then open
coding is used to identify the phenomena in the text or as Berg (2009) puts it “the central
purpose of which is to open inquiry widely” (p.353). After open coding the questions are
grouped with axial coding in order to find out similarities and differences from the data.
Transcribed text that has not be seen contributing anything important for the topic has been
left out. In this way the data reduction has been done.
Direct quotes are used in the result and discussion section as a way to bring in the voice of
participants in the study (Creswell, 2007). According to Creswell (2007) there are three
styles of using quotes; short eye-catching quotations, dialogue (a variation of quotes) and
longer quotations. All of these types of quotes have been used in the results chapter. But as
“Participants do not always state the truth and may say what they think the interviewer
wishes to hear.” (Anderson, 2010, p.5) the interviewees’ nonverbal communication has
also been part of the evaluation in the results chapter.
2.2 Research process
2.2.1 Sampling
The interviewees have been selected using the so-called purposeful selection method based
on the demographics of the studied area. This due to the fact that the background and for
instance geographical location might have a significant impact on the people’s behavior
and available information and services regarding waste prevention. In addition, with
purposeful sampling the aim is to get maximum variation within the sample. Thus,
interviewees are from various age groups, solitaires, with families, living in apartment
buildings and in detached or row houses.
23
Population
As mentioned before, a total of 1.2 million people live in the Helsinki metropolitan area.
The Helsinki metropolitan area’s population is divided as follows; 643 000 people live in
Helsinki, 279 000 in Espoo, 223 000 in Vantaa (Statistics Finland, 2017) and 9 400 in
Kauniainen (Kauniainen, n.d.). Therefore the greatest share, seven (7) interviewees, is
from Helsinki; five (5) from Espoo and four (4) from Vantaa. There are no interviews from
Kauniainen due to its small population size. In the official documents about the Helsinki
metropolitan area Kauniainen is usually united with Espoo due to their similarities, hence
they are united in this study as well.
Gender distribution
The aim was to get approximately same amount of female and male participants as the
gender is quite evenly divided between the cities (W=51%, M=49%). In total there have
been eight (8) females and eight (8) males.
According to previous research (Hirvonen and Vanhatalo, 2018; Barr, 2007) there are
differences in the environmental attitudes and behaviors between women and men. For
instance in a study done in Helsinki and Vantaa about environmental attitudes by Hirvonen
and Vanhatalo (2018), women are using more public transportation and bicycles, are more
often vegetarians, and are more aware of climate change than men.
Age groups
Age groups in this study are divided as follows: 20-29, 30-39, 40-49, 50-59, 60-+. This
distribution was chosen due to the reason that working group forms the majority of people
in the Helsinki metropolitan area. Youngest age group is 20-29 due to the reason that
interviewees should have been living without guardians for some time and take care of the
household alone or together with a partner or a flat mate. In addition, there are two (2) 60-
+ people as the group of 60-74 constitutes 15% in Helsinki and almost as much in other
metropolitan area.
Age can explain preferences and mindsets. For instance, in the study by Hirvonen and
Vanhatalo (2018) older people believed that they lived environmentally friendly as they
can. On the other hand youngest women groups (18-39) felt the most guilty about their
lifestyle being not enough environmentally friendly. Younger generation (18-29) is most
aware of the climate change and has higher interest in for instance shared car use than
older generation (Hirvonen and Vanhatalo, 2018).
Families and singles
On one hand, having children causes changes in necessary consumption as the growing
children need food, new clothes and for instance toys and different equipment for hobbies.
When the children move out from the home the consumption decreases usually radically.
On the other hand, single households tend to generate relatively more waste than greater
households per person (Sokka, Antikainen and Kauppi, 2007). Hence, in this study half (8)
of the interviewees have children. The other half (8) are singles or divorcees, live with a
partner and/or have children who have already reached adulthood.

24
House type
In Helsinki up to 85% of the apartments are in the apartment buildings and rest 15% in the
detached houses or row houses. The main focus has been to interview people from the
apartment houses with some exceptions.
In Espoo and Kauniainen 58% of the apartments are in the apartment buildings and
approximately 28% is detached houses and 14% row houses. Hence, roughly half of the
interviewees are living in apartment houses and half in other two house types.
In Vantaa 62% of the apartments are in the apartment buildings, approximately 25% in
detached houses and 13% in row houses. Same criteria apply with Vantaa than is
mentioned with Espoo.
Housing type gives households different options for recycling due to waste management
regulations, the volume and therefore cost-effectiveness for the municipality. In detached
house only mixed waste and sometimes paper is provided by the municipality.
Nevertheless, detached house can have own compost for bio-waste for instance in the yard
(HSY, 2018). For instance 10 or more apartments, which share waste bins, have a legal
obligation to collect bio-waste and cardboard into separate bins (HSY, 2018). If there are
20 or more apartments sharing same bins, they need additionally separate metal and glass
bins (HSY, 2018). Public recycling points are usually located somewhere near the housing
area or next to a large grocery store. However, the selection at the recycling point and
distance to there varies between the housing areas. In addition, the distance to second hand
stores and recycling centers varies between the housing locations. This can also influence
on the waste prevention behavior.
Education
The interviewees have varying educational level from high school diploma to PhD
candidate. In Finland the educational level is traditionally quite high and this group is not
an exception as 14 out of 16 of the interviewees have or are currently doing a university
degree. According to UNESCO’s Global Education Monitoring Report (2016) “People
with more education are also likely to follow up environmental concern with activism to
promote and support political decisions that protect the environment.” (p.25). The
education level is also easier to be used as comparison than the current work status due to
the large amount of different titles. Furthermore, the current work status does not reveal
anything about the job history, which might as well have an influence on the
environmental awareness.
2.2.2 Participants
In total 16 residents, eight (8) females and eight (8) males, from the Helsinki metropolitan
area have been interviewed for this study. However, notable is that this group cannot be
generalized as representative of the total population. For instance, in this case as
representative of the total population of the Helsinki metropolitan area. One individual
from this group having differing opinion than others can be representative for a large
group, hence the information can be more significant than it looks in this context.

25
Not one of the interviewees is an expert in the environmental or waste sector. Nevertheless,
during the interviews it came out that some have working history (production industry,
packaging industry, etc.), which affected strongly on their answers and viewpoints. All the
interviewees are strangers to each other, except two women. Nevertheless, they have
different backgrounds, age groups and life situations, and at the time were not aware of
each other being both interviewed.

26
Gender Age Highest
education
City Household
size (children)
House type House size
I1 Female 30-39 Master’s
degree
Espoo 4 (2) Row house Bigger than
4-room flat
I2 Female 50-59 Bachelor’s
degree
Espoo 1 (0) Apartment
house
3-room flat
I3 Female 50-59 Bachelor’s
degree
Vantaa 3 (1) Detached
house
4-room flat
I4 Female 40-49 Master’s
degree
Espoo 3 (1) Detached
house
4-room flat
I5 Female 30-39 Master’s
degree
Vantaa 4 (2) Detached
house
Bigger than
4-room flat
I6 Female 20-29 Bachelor’s
degree
Helsinki 1 (0) Apartment
house
Studio
I7 Male 20-29 Bachelor’s
degree
Vantaa 4 (2) Apartment
house
3-room flat
I8 Female 40-49 Bachelor’s
degree
Helsinki 2 (0) Apartment
house
2-room flat
I9 Male 40-49 Master’s
degree
Espoo 5 (3) Detached
house
Bigger than
4-room flat
I1
0
Male 30-39 Master’s
degree
Helsinki 4 (2) Row house 4-room flat
I1
1
Male 40-49 PhD Helsinki 1 (0) Apartment
house
2-room flat
I1
2
Male 20-29 High
school
Espoo 2 (0) Apartment
house
2-room flat
I1
3
Male 60- + Master’s
degree
Vantaa 1 (0) Apartment
house
Studio
I1
4
Female 60- + High
school
Helsinki 2 (0) Detached
house
Bigger than
4-room flat
I1
5
Male 50-59 Master’s
degree
Helsinki 2 (1) Apartment
house
Bigger than
4-room flat
I1
6
Male 30-39 Master’s
degree
Helsinki 2 (0) Apartment
house
2-room flat
Table 1. Interviewees' demographics

27
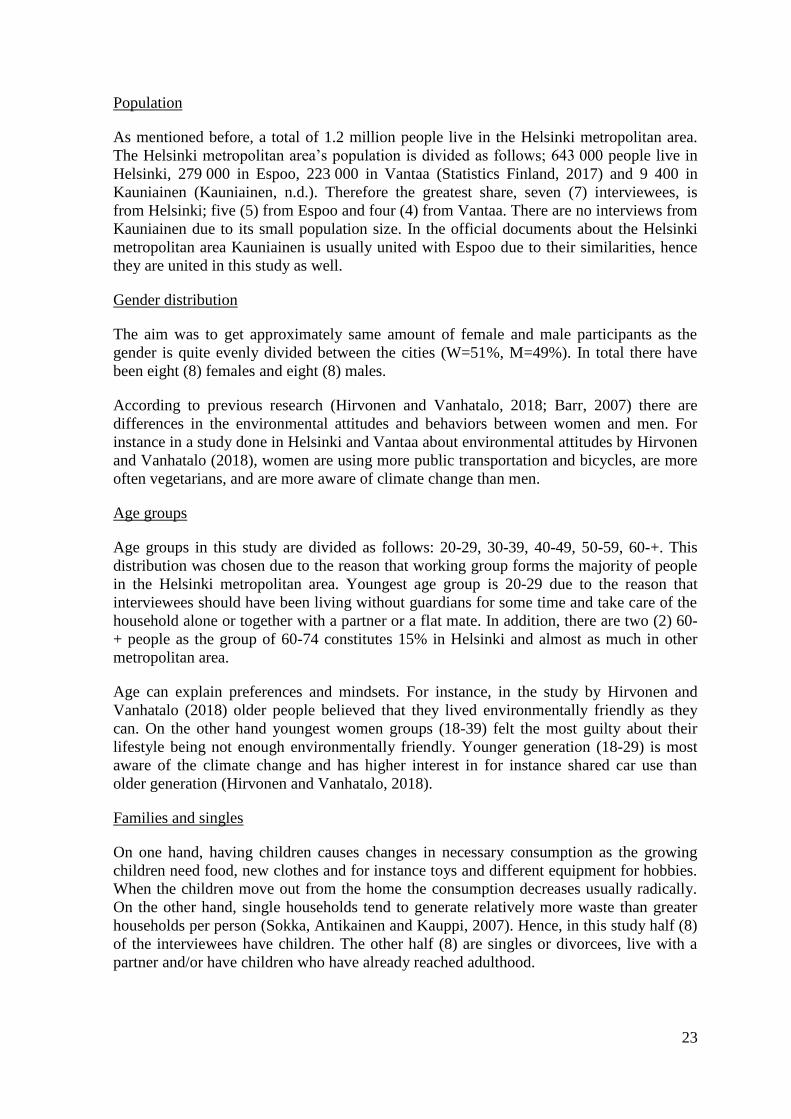
2.2.3 Interview procedure
The interviews were held in 2018 within two months; March and April (see Table 2). All
the interviews were held in Finnish and conducted at desired place either at interviewee’s
home, work place or a café (see Table 2). One was held at interviewer’s home. By giving
interviewees a chance to choose the place possibly made the interview situations more
relaxed because the interviewees were able to choose a place where they felt comfortable.
The interviews were recorded to be able to do later analysis in detail. All the interviewees
gave their permission for the recording. Nevertheless, in some interviews the recording
aspect caused nervousness especially in the beginning of the interview. The duration varied
from half an hour to over an hour (see Table 2). Long thinking pauses did lengthen some of
the interviews. However, more often the reason for a lengthy interview was that the
interviewee knew particularly much or got excited about the topic.
The interviewees did not see the questions prior to the interviews in order to maintain the
situation as unprepared as possible. This due to the reason that in this way answers
hopefully reflected reality the most and were not learned by heart. First, a small briefing
was given to the interviewee about the purpose of the study as well as a moment to ask
questions before the actual interview (Kvale and Brinkmann, 2009). Second, the
interviewee was asked to fill in a questionnaire type background form, including both
personal data and facts about the interviewee (such as age, education, household size) and
opinions to certain environmental issues with limitation to three answers. Third, the
interview was conducted asking 19 open questions partly based on the answers from the
background questionnaire in order to further investigate these answers (McNamara, 1999)
and partly new questions (see Appendix A). The interviewees were given a possibility to
decline to answer any of the interview questions. Most of the questions were formed
according to the barriers, which are detailed later in this study in the section 3.6. The focus
of the questions was to find out the interviewee’s personal experience, opinion, feeling,
input, and knowledge regarding the topic.
The same open questions were presented to each interviewee in order to make later
analysis easier and comparable. It is said that an interviewer, who prepares questions in
advance and relies on them during interviews, can be seen as a good qualitative interviewer
(Eriksson and Kovalainen, 2008). The semi-structure interview gave flexibility to adjust
the situation during interview and gave opportunity to ask further questions based on the
given answers. Thus, different specifying and follow-up questions were used during the
interviews. In the end of the interview a so called debriefing was given to the interviewee
and additionally the interviewee had a chance to add something or give feedback of the
interview if he or she wanted (Kvale and Brinkmann, 2009). Before analyzing the data, all
of the interviews were transcribed word by word from the recordings and notes made
during the interviews by the interviewer.
28
Interviewee Date Duration Place
I1 19.03.2018 49 min Interviewee’s home, Espoo
I2 20.03.2018 50 min Hanko Sushi Sello, Espoo
I3 21.03.2018 47 min Café Rytmi, Helsinki
I4 21.03.2018 44 min Interviewee’s workplace, Helsinki
I5 22.3.2018 49 min Interviewee’s workplace, Helsinki
I6 22.3.2018 44 min Café Rytmi, Helsinki
I7 03.04.2018 40 min Pasila Sokos Hotel, Helsinki
I8 03.04.2018 1 h 17 min Interviewee’s home, Helsinki
I9 04.04.2018 1 h 11 min Picnic Lauttasaari, Helsinki
I10 04.04.2018 1 h 22 min Interviewee’s home, Helsinki
I11 05.04.2018 1 h 4 min Kaisatalo’s café, Helsinki
I12 05.04.2018 54 min Interviewee’s home, Espoo
I13 06.04.2018 51 min Interviewer’s home, Helsinki
I14 06.04.2018 44 min Interviewee’s home, Helsinki
I15 10.04.2018 48 min Interviewee’s workplace, Helsinki
I16 11.04.2018 32 min Picnic Kaisaniemi, Helsinki
Table 2. Interview details
2.3 Outline of the thesis
First, this study reviews earlier academic literature and introduces some case studies and
solution examples from other EU member countries. To add to this, latest waste statistics
from the EU and Finland as well as official waste reports are used to track down the past
development and to further motivate the suggestions. The theory part starts with the
definition of waste and household waste prevention in order to provide a better
understanding of the concept for the reader. Due to its relevance for the topic circular
economy’s role both in the EU and Finland is discussed briefly. Then some barriers related
to waste prevention found from previous literature are introduced. Based on the previous
literature the study presents policy measures and case studies, which may be used to
improve the state of waste prevention in Finland as well. Findings include the information

29
gained from the face-to-face interviews with residents and from personal communication
with HSY.
The results from the interviews are presented in the chapter 4. The interviews with the
households have enabled getting detailed information on the knowledge and viewpoints
regarding waste prevention and the possible gap between the institutions and households.
The results include direct quotes and discussion from the interviews as well as analysis of
the interviews with the information gained from the previous research and reports. The
results seem to indicate that households would need more support regarding concrete and
practical waste prevention actions. Suggestions for future improvements are presented in
the study.


31
3 Practical systems and theoretical aspects of waste prevention
First, this section begins with an official explanation of waste as well as how the practical
systems of MSW management happen in the EU and Finland. Then the relationship with
waste management and circular economy is discussed, and household waste prevention is
introduced both from theoretical and practical perspective. After that, the goals in the EU
and in Finland related to waste prevention are introduced. To continue from goals, some
barriers that hinder waste prevention as well as suggested policy measurements to improve
waste prevention from previous research are listed. It is followed by the proposed concept
of material efficiency to replace waste prevention. Last, case studies from the EU are
presented in order to give real life examples of waste prevention tools and how they have
worked.
3.1 Definition of waste
To clarify what is considered as waste in the context of waste management, further
definition must be presented. Waste is defined in the WDF as follows “’waste’ means any
substance or object which the holder discards or intends or is required to discard” (WDF
article 3, 2008). Moreover, waste is something that has been discarded either voluntarily or
necessarily (European Commission, 2012).
Figure 3 (European Commission, 2012) below illustrates how materials from companies
and consumers turn into waste. As can be seen from below Figure 3, waste is produced in
two ways; from the production process and from the end users.
Figure 3. Illustration of the EU’s legal definition of waste (European Commission, 2012)

32
3.2 MSW management in EU
MSW management consists of different phases. After MSW is generated in households it
needs to be collected, sorted and transported (European Commission, 2010). After
transportation the waste is going to waste treatment centers. All the different parts of the
complete waste process create both financial costs and environmental costs. Recycling, and
the end of lifecycle treatment steps incinerating and landfilling, produce greenhouse gas
emissions and pollutions to air, water and soils (European Commission, 2010). Problematic
is the amount of the waste that is generated yearly and especially its hazardous and toxic
content (European Commission, 2010). Hence, the EU has set directives to guide the waste
management process in its member countries. Every 6th year the waste management plan of
each member state is evaluated and revised (European Commission, 2016).
Landfill directive has been revised in 2014 meaning that within the EU landfilling
recyclable waste is aimed to be fully avoided by 2025 (European Commission, 2016b).
This recyclable waste includes bio-waste, glass, paper, plastic and metal. Nevertheless,
even though some countries are already on positive progress moving away from
landfilling, landfilling remains a widely used MSW treatment method in many of the EU’s
member states. Since member states are not on the same level in the development of the
waste management and existing infrastructure varies significantly, the complete turn is
challenging.
Especially during last decade, the trend has been switching from landfilling to burning
waste. Since 1995 the incinerated MSW has nearly doubled in the EU from 67 kg to 131
kg per capita (Eurostat, 2018). Energy recovery is used for producing energy out of the
waste in a large industrial size burning facilities. The released energy from the waste can
be turned to electricity by moving turbines or to be captured as a transferrable heat for
buildings as a form of heated water. Incineration has its downsides and therefore the
directive on the incineration of waste the EU sets limits to negative environmental effects
such as emissions to air, groundwater, soil, and surface water (European Commission,
2016a). Member states receive also requirements on how the pollutants should be
monitored (European Commission, 2016a).
During the recent decade the EU has aimed to adjust the thinking “waste as an unwanted
burden to seeing it as a valued resource” (European Commission, 2010, p.4). Policies and
strategies for sustainable use of resources, integrated product policy (IPP), policies for
sustainable consumption and production are published with the aim that these support the
waste management within the EU.

33
Figure 4. MSW amounts in the EU in years 2005 and 2016 (Eurostat, 2018)
Figure 4 above illustrates total MSW amounts in kg per capita generated by each of the EU
member state in year 2005 (turquoise pillar) and in 2016 (pink pillar). Interestingly all of
the Nordic countries except Sweden have made an increase between the years (Eurostat,
2018). As can be seen from above Figure 4 in Finland the amount has increased from 478
kg per capita in 2005 to 504 kg per capita in year 2016. Being at the same level (477kg) in
2005 with Finland, Sweden has made progress to better direction and decreased the amount
down to 443 kg per capita in 2016 (Eurostat, 2018).
Regarding the increasing waste amounts, countries have a direct incentive to decrease
generated waste amounts, since waste management is an expense for societies. The cost
occurs from arranging the actual waste management, but simultaneously waste is often a
wasted resource and has an opportunity cost for societies. Even though it is generally
known that waste management is expensive, the data from the cost of waste management is
not well reported (European Parliament, 2015). In 2010 French Ministry of Ecology
reported a cost estimation of 377€ per ton of waste in France and MSW part is 60% of this
amount (European Parliament, 2015).
Development of waste management in the EU is problematic task as well. Due to high
costs and lack of infrastructure that waste management requires, illegal waste shipments,
despite regulations, remain a problem from the EU to outside of the union (European
Commission, 2018c). According to the European Commission (2018c) “… some estimates
suggest that the overall non-compliance rate with the Regulation could be around 25 %.”,
indicating that positive progress in waste management would require significant
investments, supervising and better guidance and co-operation between member states.

34
3.2.1 MSW management in the Helsinki metropolitan area
MSW in the Helsinki metropolitan area consists of private services (grey bar), public
services (orange bar) and households (green bar) (see Figure 5). The private and public
service waste, also known as commercial waste, is included in MSW since it is very
similar waste than what is generated in households. As can be seen from Figure 5 below,
the greatest amount of the MSW comes from the household sector (green bar). The green
bar has also remained quite stable between year 2009 and 2016, unlike the grey bar where
more fluctuations between the years can be seen. At the highest the waste amount has been
673 670 in year 2014 and at the lowest 555 110 in year 2012 and this low amount has been
influenced by the decrease in waste amount in the service sector, especially private service
(see Figure 5).
Figure 5. MSW amounts in tons in the Helsinki metropolitan area (HSY database, 2018)
In below Figure 6 the household fraction has been separated from other MSW origins.
Here the orange bar is the waste in kg per capita and green bar is the waste in tons. From
Figure 6 can be seen that the amount of household waste has been at the highest at 323 kg
per capita in year 2015 and at the lowest 313 kg per capita in 2016 (HSY database, 2018),
hence the difference has not been significant.
Figure 6. Household waste in kg per capita (HSY database, 2018)

35
The main waste provider in the Helsinki metropolitan area for residential properties is a
municipal body HSY. The four cities, Espoo, Helsinki, Kauniainen, and Vantaa, which are
also in the focus of this study, are HSY’s member cities. In terms of waste sorting and
recycling it, HSY arranges the collection and transportation of household’s bio-waste,
cardboard, glass, metal and mixed waste (HSY, n.d.). In year 2017 the transported waste
included largest amount, almost 200 000 tons, of mixed waste (HSY Report, 2018). The
other separated waste has been divided as follows: bio-waste 38 582 tons, cardboard 6 609
tons, glass 3 288 tons, plastic packaging 1 560 tons and metal 1 508 tons (HSY Report,
2018). Indeed, the main challenge in waste management in the future will be how to
increase the recycling rate (Laaksonen et al., 2017).
Furthermore HSY has five Sortti Stations, where households can, for instance, bring
domestic hazardous waste, garden waste, wood, metal and electronic scrap (HSY, n.d.). In
2017, there have been in total 439 260 customer visits at Sortti Stations (HSY Report,
2018). Separate containers for hazardous waste can be found, for instance, at gas stations.
Yearly HSY trucks go around the Helsinki metropolitan area to collect electronics, metal
scrap and hazardous waste from residents. In 2017, these special trucks collected in total of
351 tons of waste (HSY Report, 2018). The amount has decreased from previous years.
HSY works together with RINKI (Finnish Packaging Recycling Ltd.) arranging multiple
recycling points for carton, glass, metal and plastic packaging. These recycling points are
often located near larger grocery stores. On their website HSY provides information about
recycling and has introduced a waste guide (also available as a mobile app) where you can
type the name of the waste you want to recycle.
Energy recovery is the most common way to handle the mixed waste (Laaksonen et al.,
2017). Residential properties’ waste that has been recovered for energy has been 177 802
tons in year 2017 (HSY Report, 2018). Nevertheless, this amount includes only what has
been collected directly from residential properties.
3.3 Transitioning waste management towards
circular economy
“The concept of circular economy promises a way out. Here products do not quickly
become waste, but are reused to extract their maximum value before safely and
productively returning to the biosphere.”
- Ellen MacArthur Foundation, 2013a, p.1

36
Figure 7. Linear economy (Ellen MacArthur Foundation, n.d.)
The current economic activity in the modern society works as illustrated in above Figure 7.
Resources are taken, used and as soon as they are not needed they are disposed. In every
“step” waste is generated and fossil fuels used. This economic and consumption model
relies on large utilization of new, virgin materials and resources that the Earth produces or
those that are not yet utilized. However, as stated in this study as well, the global over
consumption demands more resources than the Earth can sustainably provide. In the linear
model part of the consumed resourced are recovered by recycling and given back for the
manufacturing step, however, large amounts of resources and material are still wasted as a
waste. For example, waste prevention is not actively sponsored in this model.
Thus, the EU drives currently the transition towards circular economy (CE), which is
illustrated in below Figure 8. In CE, resources are not wasted, but actively collected and
recycled after consumption and given back for the production phase. Recycling,
refurbishing, reusing, and maintaining are important parts of the process and every one of
these actions enables to avoid the usage of virgin materials, decreasing global dependency
on fossil resources. Simultaneously CE aims to support waste prevention targets and
principles, and minimize generated waste amounts. For example, in CE different sharing-
model products and services decrease the demand for new products and thus, reduce waste
volumes. Energy recovery and landfill do play part in CE, however, those are marked as
‘leakage – to be minimized’. Thus, these options are only used when everything else is
done to avoid using them.

37
Figure 8. Circular economy (Ellen MacArthur Foundation, 2013a)
Thus, waste prevention and converting waste back to resources are key elements of CE
(European Commission, 2018). As concluded by Cooper (2005), there is a need to decrease
both inputs, the amount of used virgin materials, and outputs, generated waste, and move
the trend from the linear economy to a CE. The concept of CE implies reduced use of raw
materials and maximized recycling in order to lower environmental impact (Tisserant et
al., 2017). In short, CE follows, minimizes, and erases economy’s waste streams (Sitra,
2014).
In 2015, the EU has introduced Circular Economy Package to help its member states in the
transition to CE where the resources are used in a sustainable way (European Commission,
2018b). In the CE package the EU set a target that 65 % of the MSW and 75 % of
packaging waste needs to be recycled by 2030 (European Commission, 2017).
Furthermore, the MSW ending up to landfill can be at the most 10 % (European
Commission, 2017). In 2018 the CE package has been updated. For instance, one set target
is that all plastic packages need to be recyclable by 2030 (European Commission, 2018b).
Private consumers have their own role in CE. The consumer habits and values need a shift
towards different consumption in the form of renting and sharing products, and buying and
reusing used products. A model where consumer is using services that allow access to a
product without an ownership is called collaborative consumerism (Ellen MacArthur
Foundation, 2013a). Some companies are already well supporting the idea of CE in
operating in the sharing-economy, like Airbnb and Uber, and in the second-hand-market,
Amazon and eBay (Sitra, 2014). In addition, CE is creating new work places and
increasing countries self-sufficiency in terms of raw materials (Sitra, 2014).

38
3.3.1 Circular economy in Finland
In the future the linear economy will be replaced by the circular economy in Finland
(Finnish Environment Institute, 2018). The Finland’s prime minister together with the
government is aiming to have Finland a leading country in circular economy by 2025
(Finnish Environment Institute, 2018).
Recently European Commission has granted Finland almost 12 million euros for working
towards CE (Finnish Environment Institute, 2016). This grant enables project called
CIRCWASTE to run between 2016-2023 with a 19 million euro budget (Finnish
Environment Institute, 2016). It is also an important part of reaching the EU’s waste
management targets (Finnish Environment Institute, 2016). The Finnish Innovation Fund
Sitra (2014) estimates that by 2030 Finland could gain with CE value of from 1.5 to 2.5
billion euros. In addition, the Club of Rome (2016) predicts that CE will born 75 000 new
jobs in Finland.
3.4 Household waste prevention
Waste prevention has been given the highest priority on the EU’s waste hierarchy (see
Figure 9, EEA Report, 2015), which is the principle behind the revised Waste Framework
Directive 2008/98/EC (WFD) (EEA Report, 2015). Moving up the waste hierarchy is
crucial in order to get most value out of resources while similarly reducing the impact on
the environment (European Commission, 2016). The original WFD from 1975 has already
included waste prevention goal and its importance has been further highlighted in the
revision of the WDF in 2008. Also OECD has had a waste minimization program since
1994 (OECD, n.d.).
Waste prevention definition according to WFD is following: “‘…”prevention” means
measures taken before a substance, material or product has become waste that reduces:
a. The quantity of waste, including through the re-use of products or the extension of
the life span of products;
b. The adverse impacts of the generated waste on the environment and human health;
or
c. The content of harmful substances in materials and products’.” (p.10, EEA Report,
2015)

39
Figure 9. The EU's waste hierarchy (EEA Report, 2015)
The importance of waste prevention has reached mutual understanding worldwide, but as
stated in the EEA Report 2015 the concrete and effective measures have not been
developed in the EU Member States. The problem arises from the measuring, monitoring
and evaluation - it is challenging to measure something that does not exist (Sharp, Giorgi
and Wilson, 2010; Zorpas and Lasaridi, 2013; Cox et al., 2010).
It is important to point out that waste prevention does not include recycling in any form
European Commission, 2010). Re-use is part of waste prevention in case the product or its
components are being used again for the same purpose possibly with some fixation. This
includes direct re-use, refurbishment, repair, redeployment & cannibalization, and
remanufacturing (European Commission, 2010). With re-use the production of new
products can be delayed, but also by using a certain part of a product again the waste
amount is decreased (European Commission, 2010).
Prevention and recycling indeed have a connection because recycling is affecting to the
quantity of waste that ends up to landfills or incinerations. However, as recycling is
something done to a waste and waste prevention to non-waste, these two needs a different
approach and policy measures (European Commission, 2010). Unlike waste prevention,
recycling does not treat the cause, only the symptoms (Bartl, 2014).
WFD introduces as well a five-step waste hierarchy model (see Figure 9) ranking waste
management options according the environmental impact of each stage (European
Commission, 2012). It starts on top with waste prevention and follows up with preparing
for re-use, recycling, and recovery and ends up with disposal. Difference between re-use
and “preparing for re-use” is that in the latter one the product has already become waste.
Re-use can be, for instance, second hand items from second hand markets.

40
Figure 10. Illustration of definition of waste prevention (EEA Report, 2015)
Figure 10 above illustrates the division between waste prevention and actual waste
management. Waste prevention is affected by multiple stakeholders but one important
aspect for waste prevention is that “… it depends fundamentally on changes in the attitudes
and behavior of households ...” (European Commission, 2012, p.6). Consumers and
individuals can directly influence on waste prevention in the stages ‘purchase & use’ and
‘product re-use’ (see Figure 10). Their purchase decisions can indirectly increase the
demand for products, which are designed and produced by applying waste prevention
principles and targets. Thus, combined influence can be more significant than just the
direct influence. Therefore also sustainable consumption is mentioned in Figure 10.
Consumers can minimize unnecessary consumption and choose products that generate only
small amounts of waste (European Commission, 2012). These actions are called strict
avoidance of waste. Waste prevention can also occur in the end of products life; instead of
discarding the product user re-uses, repairs or refurbishes the product (European
Commission, 2012). If waste prevention would be done completely successfully, waste
streams shown in Figure 3 (p.30) would disappear. Nevertheless, this is unlikely to happen
with current systems and technologies (EU, 2012).
The term waste minimization, however, includes also quality improvements and recycling.
As can be seen from Figure 10, waste minimization arrow crosses the dashed line between
waste prevention and waste management. Good waste management can avoid creation of
landfill waste to very minimum by returning materials back to the production in different
treatment ways such as recycling and recovery.

41
3.4.1 Practical ways for households
Botkin and Keller (2011) name 3R’s as the most effective ways to prevent waste for
households. These 3R’s state for reduce, reuse and recycle. Wilson et al. (2012) continues
by highlighting “as every tonne of waste reduced, reused or recycled (the 3Rs) is a tonne
of waste that the city does not have to pay to collect and dispose safely. There are win–win
solutions, where the city authorities, citizens, businesses and the informal/microenterprise
sectors work together to protect public health and the environment, progress the 3Rs and
contribute to sustainable resource management and sustainable development of the world
community.” Reducing and reusing include buying used, borrowing, renting and sharing
items but also declining and considering carefully what to consume. Recycling can be seen
as recycling waste, but in terms of waste prevention recycling means recycling items and
products through donation, second hand stores and so on. One way to reduce waste is to
buy items made from recycled materials.
EPA (n.d.) lists different practical actions related to reducing and reusing
- “Buy used.
- Look for products that use less packaging.
- Buy reusable over disposable items.
- Maintain and repair products, like clothing, tires and appliances, so that they
won’t have to be thrown out and replaced frequently.
- Borrow, rent or share items that are used infrequently, like party decorations, tools
or furniture.”
In the Helsinki metropolitan area for instance HSY provides information for households
regarding waste prevention. HSY has a Facebook –page called ‘Fiksu vähentää jätettä’
(Eng. Smart reduces waste), which aims in reducing waste. Furthermore, on another
webpage ‘Anna jotain muuta’ (Eng. Give something else) HSY guides households to buy
immaterial gifts like experiences instead of material gifts (personal communication 30-04-
2018). HSY produces different brochures with tips for households in waste prevention. In
these brochures, for instance, HSY highlights the importance of avoiding disposable
products and buy long-lasting items (HSY, n.d.). When you consume moderately you save
not only the environment but also your own money (HSY, n.d.). As can be seen here the
financial aspect is often used as a motivating factor for households. The maintenance and
repairing items is highly recommended in the guidance from HSY. HSY has also included
so called “tip list” for a reasonable consumer. Reducing food waste is important regarding
households and different websites and operators in Finland share “waste food” receipts and
other tips to prevent food going to trash. In addition, groups can book free info session
from HSY about the topic ‘Reduce waste and recycle – also wallet appreciates’ (personal
communication 30-04-2018). Schools can receive environmental education and other
learning material related to waste prevention (personal communication 30-04-2018). HSY
is also one owner of the Recycling Center in the Helsinki metropolitan area and cooperates
with them regularly (personal communication 30-04-2018).

42
3.5 Waste prevention targets in the EU
Within the EU the link between economic growth and waste generation is one of the main
objectives in the revised WFD. Recently the trend has been going to the right direction as
MSW per capita has decreased 4 % since 2000 even though the GDP has increased 33 %
(European Commission, 2012). However, stabilizing waste growth is not anymore
satisfactory; it needs to go downwards (European Commission, 2012).
Waste prevention can contribute to reduced greenhouse gas emissions, especially related to
methane released from landfills, as well as carbon dioxide that is emitted from incineration
(European Commission, 2012). Simultaneously all type of waste collection, transportation
and storing requires energy and tides resources. Waste prevention can and should support
CE principles, decreasing the usage of virgin materials and required energy, leading even
greater avoidance of waste of resources and harmful emissions. Furthermore,
environmental impacts can be reduced with effective resource use throughout the whole
product lifecycle (e.g. lifecycle approach). The EU’s aim eventually is to become zero
waste economy. Avoided waste amounts and greenhouse gases can be used as measures to
quantify actualized waste prevention. In the EU, the Member States have received
guidelines and targets for state level reduction targets in waste generations. The
quantitative targets the EU gives to its Member States are:
- reductions in collected waste
- increase in public awareness
Waste amount reduction can be measured from the collected municipality waste, however
for measuring public awareness the EU has not defined any systematic approach or
measures leaving the impact measurement on a loose ground.
For target setting, the EU has not issued specific waste prevention targets but they are
included in general waste management guidelines and initiatives. The EU’s waste
management targets, which are aimed to be reached by 2030 and partly related to waste
prevention targets, are
- recycling 65% of municipal waste
- recycling 75% of packaging waste
- landfill maximum 10% of municipal waste.
Quantitative waste prevention refers to actions where, for instance, the overall materials
used for product is decreased and efficiency of material and product use is increased (EEA,
2015). This quantitative waste prevention includes also product design, which aims to
generate less waste and support product repair, refurbishment and reuse (EEA, 2015). In
addition, avoiding unnecessary consumption is part of quantitative waste prevention (EEA,
2015). On the other hand, qualitative waste prevention means limiting and decreasing the
hazardous content in waste, hence protecting the human and environmental health. In the
light of this study, the research is not concentrating on this.
The EU’s waste prevention guidelines and strategy are built on three main core areas. The
strategy includes recommendations and enforcements for both consumers and producers;
sponsoring for improving initiatives, and support for research and voluntary activities. The
main three policy options are:

43
- informational – behavior change and decisions
- promotional – behavior change and initiatives
- regulatory – enforcements
Informational strategy
“People, and the need for behavior change, are the key to waste prevention however, and
insight into consumer and business behavior will enhance the efficacy of selected
measures.”
- European Commission, 2012, p.11
Hence, the European Commission (2012) suggests large awareness campaigns to increase
the knowledge and consciousness of the consumers. Indeed, educating and informing are
effective and immediate methods to influence on human behavior, and to enforce the
permanent behavioral change (Shove and Walker, 2010). As well as encouraging changing
behavior, the member countries are hoped to give information on different concrete
techniques for the waste prevention (European Commission, 2012). As the European
Commission (2012) has stated, this will require some training of authorities, since
traditionally waste operators have not actively guided households in the area of waste
prevention.
The European Commission (2012) also recommends concrete measures in promoting re-
use and, for instance, industrial reliance in sense that one industry’s “waste” is useful raw
material for another industry to improve business behavior. Producers could be able to
receive economic incentives for their “greener products” (European Commission, 2012).
These products should also receive eco-labeling to provide consumers direct information
(European Commission, 2012). In addition, improving recovery and recycling for
packaging, vehicles, electronics and batteries is very much advisable for the member
countries (European Commission, 2012).
Promotional strategies
“Promotional strategies stimulate a waste prevention aware community to take specific
actions and provide the financial and logistical support to facilitate this.” (European
Commission, 2012, p.38). Funding, logistical support and promotional activity for the
businesses’ voluntary environmental actions and agreements as well as promoting repair
and reuse centers with their important work for extending products’ life are one of the keys
in waste prevention (European Commission, 2012). In terms of business, construction,
demolition, industrial and packaging waste European Commission (2012) suggests
adopting environmental management system, which can help estimating the environmental
impact from the operations and increasing material efficiency and simultaneously save
money from the organization. Using clean consumption incentives as promotional strategy
is also recommended for the projects that aim in waste prevention (European Commission,
2012). Furthermore, research and development play important role in the promotional
strategies as it can help to identify issues and provide important information regarding the
opportunities (European Commission, 2012).

44
Regulatory strategies
Regulatory strategies by EC (2012) include:
- Planning measures meaning regulations like disposal bans, environmental permits
- Taxes and incentives such as pay-as-you-throw system
- Extended Producer Responsibility (EPR) policies like packaging producer
responsibility system
- Green Public Procurement policies mostly relating government authorities activities
- Eco-design requirements for problematic waste streams
In 2014 the EU reported that out of the legally obliged 31 countries, 24 countries have
been adopting waste prevention programmes. These programmes included in total 27
national and regional waste prevention programmes, whereas 17 solely devoted to waste
prevention and 10 part of the country’s overall waste management plan (EEA, 2014).
3.5.1 Finland’s waste prevention and its targets
“Finland’s waste policy is aimed specifically at waste prevention and decreasing the
negative effects of waste on human health and the environment.”
- Ministry of the Environment, 2008, p. 54
Finland’s National Waste Management Plan (NWMP) until 2016 “Towards a recycling
society” and EEA’s country fact sheet state that Finland’s quantitative target has been to
stabilize the amount of MSW at the level of the early years of this century and ensure that
the trend is downwards by 2016 (EEA Report, 2016). This would have meant first 2.3-2.5
million tons of waste annually and from 2016 going below that. However, this aim failed
as we can see from Figure 11. The set objective regarding private consumption has been to
concentrate on the eco-efficient products and services as well as to decrease the amount of
household waste (EEA Report, 2016). The target groups in Finland in waste prevention
have been consumers, producers, authorities, industry, production, and the construction
sector (EEA Report, 2016).
According to Laaksonen et al. (2017) the waste generation in Finland still strongly follows
the development of GDP. This despite the fact, as mentioned before, that within the EU the
link between economic growth and waste generation is one of the main objectives in the
revised WFD and there has been seen a change to right direction in the EU member states.
In the newest NWMP 2018-2023 the aim is again to separate MSW and GDP from each
other (Ministry of the Environment, 2018).

45
Figure 11. Finland's MSW amounts in 1000 t/yr over the period 2008-2015 (Laaksonen et
al., 2017)
Regarding waste recycling, the aim was that by 2016 50% of the MSW would be recycled
and 30% would be used for energy and for landfilling would go at the most 20% of the
MSW. Targets for energy recovery and landfilling were met, but 30-40% recycling rate
remained the same throughout last decade (Laaksonen et al., 2017). In the newest NWMP
2018-2023 “From recycling to a circular economy” the target is to raise the recycling rate
to 55% (Ministry of the Environment, 2018). However, based on the history it seems that
rise to 55% is unlike to happen.
The waste management means financial expenses to the country, especially the
management of MSW. The NWMP 2008-2016 (note. was valid until January 2018) stated
that households part of the MSW expenses are 75%, whereas commercial is only 25%
(Ministry of the Environment, 2008). This is due to the reason that household waste is
more mixed than commercial waste so that the utilization of household waste requires
often more separation and pretreatment. Furthermore, collection from households is more
expensive as the amount of different waste materials is usually small (Ministry of the
Environment, 2008).
According to the EU one of the crucial parts of the waste prevention is to enhance the
product life (EC, 2012). One idea to support longevity of home appliances, furniture and
other durable goods in Finland was to expand the household tax deduction for repair and
maintenance services purchases (Ministry of the Environment, 2008). However, this policy
has not been in practical use yet as more investigation is needed to recognize the actual
possibilities and benefits of the system and its cost estimate (Ministry of the Environment,
2008). On one hand, this kind of system would mean more expenses to already busy
personal tax deduction service and the technical structure for the law would be complex to
execute. On the other hand, it would positively affect employment and especially bring the
black market’s employment on the legal side (Ministry of the Environment, 2008). In the
newest NWMP 2018-2023 there is no mention about this household tax deduction.
Another crucial part of the waste prevention is the consumption. Households’ income on

46
hand and minimum requirements for products’ material efficiency are indirect
administrative ways to influence on the consumption amount and quality (Ministry of the
Environment, 2008). In order to guide the private consumption, Ministry of the
Environment lists two actions:
- To share practical information about products’ durability and environmental
qualities / environmentally friendliness
- To offer consultation and guidance services to households at the material efficiency
service center
Environmental values are mentioned to be important for Finns and therefore sharing
practical information about the products environmentally friendliness is seen to be a
functional way to have an influence on consumers’ choices. Furthermore, using material
efficient and eco-efficient products is not only society’s benefit but is beneficial also for
the private consumer (Ministry of the Environment, 2008). In the new NWMP 2018-2023
the focus is to replace purchasing products with the use of services (Ministry of the
Environment, 2018). Sharing and reuse are also believed to be successful ways to decrease
the need for new commodities production and usage of raw materials (Ministry of the
Environment, 2018). However, Laaksonen et al. (2017) argue that there is a possibility that
increase in reusing can actually increase the waste generation as it increases the different
consumption channels and in this way tempts residents to consume even more.
Simultaneously changing to consuming services will not automatically decrease generated
waste amounts in total.
Laaksonen et al. (2017) point out multiple problems in the previous NWMP and why the
waste targets have not been met. The measurements have not been strong enough to guide
the waste amounts downwards and many measurements have been developing slowly or
not at all. One important factor is that there have not been suitable indicators for measuring
waste prevention (Laaksonen et al., 2017). However, despite the fact that the overall waste
amounts have not been decreasing there has been development in certain products and
other areas where the success and decreased volume amounts have not been able to be
indicated quantitatively. As an example, the reuse of the beverage bottles, pallets, clothes
and furniture have long history in Finland, but there is not exact information available what
is the impact from these actions to waste prevention (Laaksonen et al., 2017). In addition,
the reuse of electronics and other electric appliances has increased significantly
(Laaksonen et al., 2017). Indeed, the new NWMP focuses on the longevity and recycling
of electric items and electronics (Ministry of the Environment, 2018).
The targets Ministry of the Environment (2018) has stated for the year 2030 are as follows:
1. “High standard waste management is part of the sustainable circular economy
2. Material efficient production and consumption save natural resources and mitigate
climate change
3. Volumes of waste have decreased from the present. Reuse and recycling have risen
to a new level.
4. Recycling market work well. Reuse and recycling create new jobs.
5. Valuable raw materials present at low levels are also recovered from recycled
materials.
6. Material cycles are innocuous and less and hazardous substances are used in the
production.

47
7. In the waste sector there is high-quality research and experiments and competence
in waste issues is at high level.” (p.7)
3.6 Barriers to waste prevention
The possible barriers to waste prevention are important to consider as they can give crucial
information why certain measures work and other measures do not. Paying attention to
barriers can shed light on the possible issues when inventing new measures or improving
old measures to maximize success in the future.
3.6.1 Conflict of interest
In general main barriers to waste prevention seem to be conflict of interest (Bartl, 2012)
and difficulty to measure (Bartl, 2012; Zorpas and Lasardini, 2013). Conflict of interest
arises especially from the waste management business, which has been growing vastly in
industrialized countries like Europe (Bartl, 2012). Successfully done waste prevention
means less work for instance to waste collectors, incinerator, and landfill operators, hence
it means less income for them (Bartl, 2012). According to Bartl (2012) effective drivers to
balance conflicts of interest should be invented in order to overcome this barrier.
3.6.2 Measuring waste prevention
Difficulty to measure the waste prevention is one of the main barriers (Bartl, 2012; Zorpas
and Lasardini, 2013). As Zorpas and Lasardini (2013) explain measuring waste prevention
is complex as there is a need to measure something that does not exist. Regarding waste
measurements, statistics focus on measuring generated waste but not to waste that has been
able to prevent (Bartl, 2012). Some estimates can be calculated from decreased waste
amounts, but waste prevention can be partially successful even though waste volumes
would keep on rising. Basic data to evaluate and identify the waste prevention measures
are missing (Salhofer et al., 2008). Hence, there is a need to make waste prevention
quantifiable. Bartl (2014) points out that current waste legislation sets specific quotas for
recycling and recovery but not for waste prevention. Without the measurability, the
planning of waste prevention actions and investments becomes more difficult to justify in
the public expenditure.
3.6.3 Throwaway society
Consumer society needs a change and consumption decrease to reach waste prevention
targets (Bartl, 2012; Ekvall, 2008). So called throwaway society has become a permanent
part of the consumption culture. Cooper (2005) continues that “Sustainable consumption is
unlikely to be achieved as long as the quantity of household waste generated in industrial
nations continues to rise. One factor underlying this trend is the life span of household
goods.” (p.51). For example, multiple fast-fashion brands rely on frequently occurring
consumers’ needs to replace existing clothes with new ones, and long lasting clothes would
not necessarily support their business strategies (conflict of interest). When the products
and items at households are not lasting long in use, more waste is generated as a result.
Life-cycle thinking is an important aspect to tackle this trend but also consumer attitudes

48
and behavior (Cooper, 2005). Replacing an item, which has not reached its end of life, with
a second item is not in line with waste prevention principles (Zorpa and Lasardini, 2013).
Indeed, sustainable consumption can be seen as a strategy to waste prevention (Lilja,
2009), but the consumers are not the only problem here. Sustainable consumption is often
not in line with the companies and businesses aim to maximize profit (Bartl, 2014),
especially in the mass-production consumer goods industries (conflict of interest). Internet
era can also increase the waste amounts since people order online from all around the
globe, creating need for additional packaging and transportation of the goods.
3.6.4 Households’ habits and lack of knowledge
Barriers for households’ waste prevention defer from the overall waste prevention barriers.
Cox et al. (2010) have identified multiple barriers to waste prevention behavior. These are:
General lack of interest
It’s someone else’s responsibility
Inconvenience
Cost
Weak self-efficacy and a sense of powerlessness
Social norms don’t favor waste prevention
Dominance of the recycling norm (p.201-202)
Hence, problematic for waste prevention are households’ habits and additionally the
dominant consumerism, which makes consumers consume more than they need and buy
new items before old ones have reached end of life (Zorpas and Lasardini, 2013). These
are harder areas for politics to interfere.
Furthermore, Brook Lyndhurst (2009) reports the barriers for household waste prevention
as following:
“The extent to which is has not been possible to identify the reasons behind why
waste is being prevented.
The extent to which the impact of specific (or individual) intervention or campaign
measures remains little understood.
The inability of participants to make a conceptual distinction between waste
prevention and recycling.
A new and different way of intervening, targeting and messaging will be needed in
order to engage new audiences, i.e. those not currently pre-disposed to waste
prevention.” (p.13)
Thus, according to these authors, households’ habits towards waste prevention are
influences by several, independent, but cross-connected factors. Waste prevention appear
to households as an unknown concept, which do not itself encourage actively to take part
in it, nor would it be simple or reasonably effortless to start being more active in waste
prevention. All these issues together are creating a somewhat challenging barrier to
overcome, indicating that increasing pro-active waste prevention in household will require
additional effort from public sector.

49
3.6.5 Waste recycling
Moreover, the difference in terms of recycling and waste prevention is not clear enough to
people (Brook Lyndhurts, 2009; Zorpas and Lasardini, 2013). Many people actually
believe recycling being synonymous to waste prevention (Tucker and Douglas, 2007).
Simultaneously, waste prevention should be promoted more and options should be well
defined – what people actually can do and how they can do it well (Brook Lyndhurts,
2009; Zorpas and Lasardini, 2013). When comparing waste prevention behavior with
recycling behavior the difference is that recycling has only one action, to recycle, but waste
prevention can include many actions (Cox et al., 2010). Moreover, the social norm in
prevention actions is less likely to appear because waste prevention, unlike recycling, is
invisible action (Cox et al., 2010). Tucker and Douglas (2007) also concluded that positive
drivers in recycling behavior can even be absent for waste prevention.
Sometimes recycling and waste prevention even correlate negatively with each other as
people who recycle may keep recycling as a reason not to do anything more to decrease the
amount of waste generated (Zorpas and Lasardini, 2013). Hence, there happens a rebound
effect. Rebound effects are behavioral results that are neither expected nor intended, but
they increase the overall consumption instead of decreasing it (Druckman et al., 2011).
Gentil et al. (2011) mention a rebound effect that can happen when aiming to waste
prevention can generate another type of waste. “For instance, some rebound effects due to
prevention could influence the results, where the prevented fraction is replaced by another
material or service, such as the replacement, or ‘rebound effect’ of unsolicited mail by
internet advertising” (Gentil et al., p.2378).
3.6.6 Energy recovery
Zacho and Mosgaard (2016) point out a “Scandinavian problem”, which refers to the
dominant use of incinerations in the Scandinavian countries. According to Zacho and
Mosgaard (2016) burning waste can eliminate the incentive to reduce waste, hence affect
negatively to the countries overall attempt in waste prevention. Similar issue but related to
the Finland’s recycling rate is also noted in the EEA Country Fact Sheet MSW Finland
(2016) - “Over 1.1 million tons of MSW was incinerated in 2013. It seems that Finland is
at risk to build overcapacities for incineration that might be an obstacle for increasing the
recycling rate” (p.14). However, the same might apply to waste prevention as well.
Often energy recovery is justified with the idea that if there is enough waste to be burned,
it would replace the traditional use of coal and landfills. Hence, it would result in reduced
emissions and be better for environment. Although incineration is better option than
landfill, the problem – waste – still remains (Sitra, 2014). Burning of recyclable and
reusable materials is waste of resources. Ellen MacArthur Foundation (2013b) describes
incineration as a process that utilizes materials at the “lowest nutrient level”.
3.7 Policy measures for waste prevention
Different kind of measures can be used for promoting waste prevention. According to the
review by Cox and colleagues (2010) “…the most effective and most frequently applied
household waste prevention policy measures include prevention targets, producer

50
responsibility, householder charging, public sector funding for pilot projects, and
collaboration between public, private and third sector organizations, supported by long
term and intense public intervention and communications campaigns.”
There is a need for policy measures that would encourage people to change behavior in
order to decrease the waste amounts (Cox et al., 2010). According to Cox et al. (2010)
“..largest voluntary gains could come from home composting and local cross-cutting waste
prevention campaigns. … The other significant options are all top-down policy
measures..” (p.216). Also Hahtala et al. (2007) stand behind awareness raising campaigns
targeting households. Cooper (2005) suggests policies, which improve after-sales services,
such as repair, guarantees, warranties, and spare parts. According to the author, it is
important to create better market incentives for longer-lasting products and promote
increased durability and in general taking good care of the products (Cooper, 2005). Some
suggest long product warranty that would give an incentive to the producers to produce
durable goods (EU, 2017). For instance, in Norway minimum warranty for product is 5
years (EU, 2017). In terms of particular materials refundable deposit system can increase
the use of refillable containers (Ferrara and Missios, 2012). Furthermore, some local
authorities use subsidies to promote waste free alternatives instead of disposable products
(e.g. Austria case by Salhofer et al., 2008). Important is that waste prevention practices are
not only consumers changing into making better choices but the whole structure where
waste prevention practices take place requires change (Zacho and Mosgaard, 2016).
Salhofer et al. (2008) underline the need for targets and measures for specified waste
streams in regards to waste prevention. For instance, with beverage packaging it would
mean increasing the amount of refillable packaging by putting mandatory quotas for each
retail enterprise (Salhofer et al., 2008). One way could be introducing a legal basis to
create a data base for waste prevention (Salhofer et al., 2008). Moreover Sokka et al.
(2007) state that “In order for MSW reduction targets to be cost-efficient and represent
upright environmental policy, they should be based on information of past MSW
production patterns.” Thus, it is important to understand the history of the generated waste
to be able to give any measurements.
Ekvall (2008) argues effective policy instruments in waste prevention being outside of the
waste management area, an exception being introducing a weight-based fee for waste
collection. Multiple studies support weight-based billing having significant impact to
decrease households’ waste (Linderhof et al., 2001; Dahlén et al., 2007; Reichenbach,
2008). Weight-based billing is related to the polluter pays principle. The underlying reason
why weight-based fee would work is that people might start using more home-composting
for heavy components like garden and food waste (Ekvall, 2008; Gellynck, et al. 2011).
Moreover the pay-as-you-throw fee had a positive effect on the individual choice to use
and purchase refillable containers (Ferrara and Missios, 2012). However, some downsides
are found with this solution – more illegal dumping of waste has been recorded as well as
waste moving to neighboring communities (Dahlén and Lagerkvist, 2010).
In the EU’s waste prevention report (2015) different measures are listed that can affect
both the consumption phase and the use phase. The report suggests that, for instance, the
use of economic instruments (e.g. incentives) for clean purchases or payments consumers
would need to pay for instance for packaging which would normally be free. Also different
campaigns and information directly aimed for consumers in order to increase awareness
are desirable. Creditable eco-labels should be promoted and industries and retailers should

51
give information about the waste prevention and products with lower environmental
impact. In addition, the reuse and repair of the intended discarded products and
components should be promoted. This is advised to be done through educational,
economic, logistic, or other measures for instance support the repair and reuse centers.
3.8 Waste prevention vs. material efficiency
Some researchers suggest that instead of the concept of waste prevention the focus should
be in material efficiency (Ekvall, 2008; Lilja, 2009). As Ekvall (2008) puts it “Material
efficiency is a more adequate environmental policy objective than waste prevention, since
most of the environmental benefits from waste prevention stems from the reduced need to
produce materials.“ The goal in these two concepts is similar, however, the approach
differs. Products material efficiency means that the product has been executed by using
natural resources as little as possible and as one result is the amount of waste usually
decreases (Ministry of Environment, 2008).
Lilja (2009) argues “The main weak point in the MEf concept is that it mostly directs
action towards increasing the relative efficiency of materials use, avoiding the issues of
absolute consumption and resource depletion.” (p.135). Hence, there are downsides with
material efficiency, which, unlike waste prevention, does not try to intervene with the
overall consumption. However, waste prevention according to Lilja (2009) is not effective
enough as he states that “On the other hand, based on more than a decade of experience in
Finland, it seems that the avoidance of waste is not a sufficient driving force for a
transition in the consumption and production patterns“. (p.135). The waste prevention
should not be part of waste management but more likely for instance part of resource
policy, sustainable consumption and production and cleaner production policy (Lilja,
2009). Whereas material efficiency could be concluded to be an important part of the
businesses operations, the concept includes also consumers. Consumers and households are
in a key position in creating demand for the material efficient products and services
(Motiva, 2017). Material efficiency is connected to the durable goods and focuses on the
product’s life cycle and therefore it closely relates to waste prevention (Motiva, 2017).
Highlighting the concept of material efficiency over waste prevention is actually where the
focus in both the previous as well as the newest Finland’s NWM plans (2018) has been.
3.9 Examples from Europe
In this section some case studies in four different EU countries are presented.
3.9.1 Sweden – weight-based-billing system
Case study done by Dahlén and Lagerkvist (2010) studied the effect of weight-based-
billing in three municipalities in Sweden. In addition, a questionnaire was done in all 26
municipalities using this particular system in Sweden. Weight-based-billing means that
households are charged according to the kilograms their waste weights. The idea behind

52
this system is related to the ‘polluter pays principle’, where the producer of pollution, in
this case waste, pays the costs of managing it.
Swedish authorities use this system in order to prevent waste generation as well as increase
recycling. The results of the study were inconsistent showing significant reduction in some
municipalities but almost zero in others (Dahlén and Lagerkvist, 2010). Swedish
households in municipalities where pay-by-weight system has been applied generate on
average 20% less waste per capita, than households who do not have the system (Dahlén
and Lagerkvist, 2010). However, surprisingly none of this 20% decrease was explained by
the increased use of recycling centers (Dahlén and Lagerkvist, 2010). According to the
authors it is hard to say if this is due to the fact that the waste was disposed outside
collection system or if the residents adapted less waste producing lifestyle.
Dahlén and Lagerkvist (2010) concluded that factors influencing the most on the outcome
of this kind of monetary incentive were local conditions and attitudes.
3.9.2 UK – awareness and knowledge
Case study from Exeter, UK by Barr (2007) focused on waste reduction, reuse and
recycling from residents’ environmental attitude and behavior point of view. Barr (2007)
found out that when predicting the waste management behavior three factors play
significant role; environmental values, situational characteristics and psychological factors.
In the study, reuse was found out to be also about environmental values and knowledge,
but simplicity and convenience increased the likeliness of reuse (Barr, 2007). Actions
related to reuse needed to be seen as worthwhile and satisfactory (Barr, 2007).
Recycling, on the other hand, was seen as strongly normative action. Barr (2007) explains
that people who accepted the norm to recycle were likely to do so, also people who were
aware of this norm. Crucial seemed to be the knowledge how the local recycling services
function and what type of house people live in (Barr, 2007). This was connected to reality
that an easy access to good facilities made people more likely to recycle (Barr, 2007).
In terms of waste reduction, successful results had a positive correlation with the residents’
awareness of policy knowledge, especially sustainable development, and concern about
waste (Barr, 2007). Older people as well as females were more likely to reduce the waste
than younger age groups and males. To quote Barr (2007) “People with strong
environmental values and citizenship values, along with good awareness of the waste
problem, were more likely to be willing to, and reportedly did, reduce their waste” (p.466).
3.9.3 Belgium – four main factors influencing waste generation
A case study made in Belgium tested how different factors influence on reaching
mandatory goal of 150 kg MSW per capita per year in 308 municipalities (Gellynck,
Jacobsen and Verhelst, 2011). The case is not directly about waste prevention but as it is
about the factors that influence waste generation the link with waste prevention is quite
obvious.

53
The study by Gellynck and colleagues (2011) concluded that higher income of residents
had a negative impact on reaching the goal. This supports the commonly known trend that
when income grows, consumption grows hence waste generation grows.
On the other hand the increased cost of residual waste collection, so called pay-by-the-bag,
had a positive impact on reaching the goal (Gellynck et al., 2011). This way residents got
a concrete incentive to reduce their waste.
In addition, a separate curbside to collect organic waste seemed to have a significant
positive impact on accomplishing the target. This was due to the fact that in this particular
case area organic waste fraction sums up to 40% of the total waste amounts (Gellynck et
al., 2011).
3.9.4 Austria – subsidy for reusable good
In order to decrease the amount of MSW, Austria has used grant subsidies to promote the
use of reusable diapers (Salhofer et al., 2008). Diapers are difficult to recycle and the re-
usage is impossible, and therefore the reduction of usage of diapers could have significant
effect. During infant’s diaper hood one-way diapers create approximately one ton of waste
(Salhofer et al., 2008), making it one of the biggest waste stream small children generates.
In 2004 eventually seven Austrian federal states from nine used this governmental subsidy.
When purchasing reusable diapers equipment for 250 euros, the consumer was entitled to
100 euro subsidy (Salhofer et al., 2008), motivating consumers to switch reusable diapers.
Notable is that reusable diapers even before subsidy, taking into account all costs, is much
cheaper than one-way diaper.
In 2000, Salhofer and colleagues estimated that with a participation rate from 10% to 20%
the amount of municipal waste could be reduced by 2 kilos per capita per year. However,
the participation rates kept staying low. Also in urban areas the system was less successful
than in rural areas. The barriers among parents seemed to be lack of information about the
subsidy and insufficient guidance how to use reusable diapers (Salhofer et al., 2008). In
addition, reusable diapers were not been able to compete with one-way diapers in
advertising.


55
4 Results and discussion
This chapter provides the results of the interviews and discussion. Results will be presented
in the similar structure as they were structured in the interview questions. The results will
show some of the most important and interesting findings from the interviews in the format
of direct quotes.
The main findings of this study seem to indicate that households are not aware of the
concept of waste prevention and it is easily confused with waste recycling as has been
concluded for instance in the study by Tucker and Douglas (2007) and Cox et al. (2010) as
well. This, as discussed before, can be conflicting for instance for the reason that residents
who recycle actively may not give any thought to how the actual amount of waste could be
minimized (Zorpas and Lasardini, 2013). Waste recycling is seen important, as it
undoubtedly is, but it has negative impacts on the environment through the collection and
processing activities (Bartl, 2014). This seems to be forgotten from the households. Hence,
it would be important increase the awareness about waste prevention and lead households
to see beyond the waste recycling.
In addition, the results seem to show that households would need more support for
concrete and practical waste prevention actions. Many of the interviewees were confused
how they could prevent waste. Or in the cases they already had the knowledge, they hoped
for more support to carry out the actions, either by financial incentives or with practical
execution. In some instances waste prevention seems impossible, for example in relation to
packaging waste. On the other hand some of the interviewees mentioned doing actions that
can be seen as a part of waste prevention but are not doing these actions for the sake of
preventing waste but for instance due to financial incentives. Here again the greater
awareness about waste prevention actions could create the moral commitment, thus making
it possibly even more permanent and pro-active habit. If the waste prevention would
become a social norm, similar to recycling, it would further support households for waste
prevention actions. In addition, households could be incentivized to waste prevention with
waste charges, such as pay-as-you-throw payment schemes.
The interviewees who clearly have high environmental values seem to have more
knowledge and are more aware of environmental risks. These interviewees as well practice
waste prevention more often than the ones having less emphasis on the environmental
values. This supports the findings from the previous research (Barr, 2007; Ferrara and
Missions, 2012) that stronger environmental values resulted in more environmentally
friendly behavior and have positive relation with waste prevention.
Based on the interviews, the households seem to be worried about waste worldwide but not
so much in relation to the Helsinki metropolitan area or Finland. Hence, it seems to
indicate that the feeling of being personally responsible of the generated waste is not as
strong as it could be. When the feeling of personal responsibility, ‘responsibility to the self
to act’, is low the waste prevention actions are less likely to be carried out as Barr (2007)
explains in his study.

56
Before going to different themes separately, let’s begin with some introductory words
regarding this particular group of individuals who have been interviewed for this study.
Before the interviews, the interviewees have been asked to fill-in the background
questionnaire. From these questionnaires, following conclusions can be built:
All of the 16 interviewees have either highlighted (10/16) or neutral (6/16)
relationship to nature. Hence, none of these interviewees feel having a distant
relationship to nature.
The women in this research group seem to have stronger relationship with nature
than the men because from ten (10) having highlighted relationship total of seven
(7) are women.
In addition, all of the interviewees feel anxiety about environmental hazards either
a lot (7/16) or a bit (9/16). Thus, none of the interviewees feel zero anxiety
regarding environmental hazards.
In the group feeling a lot of anxiety only two (2) out of seven (7) are men.
When thinking about environmental protection and economic growth none of the
interviewees think economic growth should be put first even if the environmental
situation would get worsen.
Out of 16, five (5) believe that environmental protection should be put first and
four (4) out of these five (5) are women.
The men in this group trust more than the women that environmental protection and
economic growth is possible at the same time.
As these results seem to indicate, the environmental awareness is relatively high at least
according to the interviewees’ own answers. Among these interviewees the women do
show a stronger interest and concern towards environmental issues than the men, but the
men are generally more optimistic.
To highlight these results, some of the amounts are presented in quantitative way and may
give clues how the overall situation in the Helsinki metropolitan area is and for instance
some differences between men and women. Notable is, however, that this study is
qualitative and the results are not generalizable to the total population of the Helsinki
metropolitan area or Finland.
4.1 Theme 1 - Consumption
Second, here the results from the interview’s theme 1, consumption, are reviewed. As
mentioned before current trends in consumption causes problems worldwide. Consumer
society needs a change and consumption decrease to reach waste prevention targets (Bartl,
2012; Ekvall, 2008). The more is consumed the more waste is generated. Thus, the
questions in this consumption theme cover both interviewees’ personal consumption as
well as the idea the interviewees have regarding the general consumption patterns.

57
4.1.1 Western vs. Finnish consumption
Regarding Western and Finnish consumption in the background questions 8 and 9 there is
a consensus among this group that consumption should either decrease slightly or
radically. However, whereas six (6) of them think that Western consumption culture should
radically decrease only three (3) would radically decrease Finnish consumption. Generally
in these interviews Western consumption culture is seen worse than Finnish consumption.
If we think about USA I have visited there multiple times and everything is totally
disposable culture. If we only think about the average people life at home they do not
cook at home instead they buy some plastic cones from which the food is wolfed
down in the street corner. That kind of fast food culture is distasteful and the trash
ends up circulating in the streets. … The society in Finland has not developed so far
to that direction.
- I13, male, 60-+, Vantaa
Finnish consumption is reasonable when comparing to other countries. Well
excluding housing and travelling where Finland’s geographical location and cold
weather are the cause for instance apartments’ heating and long distances in both
domestic and international traveling.
- I15, male, 50-59, Helsinki
However, for instance in one interview knowledge is seen as a barrier when choosing to
answer between slightly and radically regarding both Western and Finnish consumption.
This, that consumption should radically decrease I don’t know enough about. I only
know that it should be decreased but I don’t have enough legit information to say
what the amount is. So the point is that it should be decreased. And maybe it should
be decreased more than slightly but when the options are slightly and radically I
choose slightly because for that I’m sure.
- I12, male, 30-39, Helsinki
As mentioned in the beginning of the study, with current consumption worldwide there is a
need for 1.6 Earth’s resources (WWF, 2016). If everyone would live like Finns, the amount
increases from 1.6 to 3.6 Earths (WWF, 2018). Finns use their own share of resources
approximately four months prior average world (WWF, 2018). Of course the fact that the
world’s average is lower, than for instance Finland’s consumption, is because of the
inequality between rich and poor countries. In relation to other European countries, the
amount of Earths needed is quite similar as in Finland. Hence, it is interesting that from the
interviews it seems that Finland would be better than rest of the Western countries. Maybe
it is related to the patriotism and being proud of your own country but it can be also
distancing.
Distancing is problematic in in terms of environmental problems and human behavior
(Uzzell, 2000). Global problems are usually complex and physically far away, hence
grasping them is seen hard. On the other hand local problems seem less critical when
comparing with the critical global problems. According to Uzzell (2000) “… the mass
media play a critical role in structuring and defining reality and the crucial issues of the
day” (p.307). The global problems are widely exposed in the media and usually receive
more attention. This is also well seen in this qualitative study when the interviewees only

58
mention global problems but not so much domestic, possibly due to what has been on the
headlines in the media. This results in a conflict where residents do not act locally as the
local problems are not seen critical, nor globally as the problems are far both mentally and
physically (Uzzell, 2000). Here Finland’s government and other institutes could be more
informative about the real situation and educate the residents.
When asking about the interviewees’ reasons for why consumption should be decreased
they have answered for instance due to climate change, landfills, environmental reasons,
scarcity of natural resources, pollution and waste. Thus, the consequences seem severe and
quite clear but the cause is seen more strongly coming from other countries than Finland or
from other individuals than the interviewee itself.
Globe can’t handle because we buy all the shitty quality clothes and other
things like that and lot of items we don’t even need. I’m guilty for it myself but
so many others are guilty for it too … Even though it’s pointless to blame
others when I should first make changes myself.
- I16, male, 30-39, Helsinki
4.1.2 Personal consumption and belongings
An environmental management professor Linnanen, who has studied Finnish households’
consumption, states that in Finland the consumption is believed to maintain the economy
and therefore it is a taboo to say ‘do not buy’ (HS, 2018i). The buying continues even
though current consumption phase destroys the natural resources (HS, 2018i) and creates
unnecessary waste.
In the background questionnaire all the interviewees have marked necessity influencing the
most on their purchase decision when buying a product or item. After that the most
influential matters are price (14/16) and durability (14/16). Material (9/16) and
environmentally friendliness (8/16) are relatively important matters among these
interviewees. However, environmental friendliness seems to be a complex matter to define
and, for instance, environmentally friendly labelled product more expensive than other
products. I16 (male, 30-39, Helsinki) thinks that environmentally friendliness is not
promoted and highlighted enough.
When asking about the interviewees’ personal consumption none of the interviewees think
they consume more products and services than others. Perhaps saying consuming more
than others is seen as a negative matter and not everyone is ready to admit it even they
would think so. On the other hand the answer depends greatly whereto the interviewee
chooses to compare herself/himself. Ten (10) relate to consume as much as others and the
remaining six (6) see their consumption being less than others. One interviewee, I6
(female, 20-29, Helsinki), hesitates saying “Because I don’t really pay attention to it I
think its average but it can be the worst as well”. With this I6 refers to the option ‘I
consume more products and services than others’. Also I7 (male, 20-29, Vantaa) ponders
whether he consumes more than others but chooses the answer as much as others.
Reference has varied from an idea of an average Finn to an idea of a coeval Finn with
similar status. In addition, interviewee’s friends and relatives have been setting some
standard for consumption.

59
Probably socioeconomic status among friends and others in the same educational
and job level then the consumption is pretty much of the same type.
- I16, male, 30-39, Helsinki
I’m quite considerate consumer but of course sometimes I buy items that without I
could get along. But even when I buy something that is not so necessary I still go
through same thought process that ‘This is not a necessity but do I still want it?’.
And I hope most of the other people would do the same. Yeah when I answered to
that question I was thinking about the same demography same age and a Finnish yes.
- I9, male, 40-49, Espoo
Some, especially those who see consuming less than others, have been reflecting to their
own youth when they consumed more than currently.
Well I think about this so that as I get older I become more aware of how much
young me consumed unnecessary products. ... When I was young every weekend
when we went to bar with my friend we had to have a new tank top or clutch just
because we could buy and do that.
- I8, female, 40-49, Helsinki
Such unnecessary consumption has been part of my old life. When I was young it was
quite fun but in this age it does not like serve the purpose anymore so in my opinion I
get well along with little and well invest more on quality than in the joy of shopping.
- I2, female, 50-59, Espoo
When asking about how the interviewees feel about the total amount of belongings they
have in their homes and storages, the answers are quite homogenous. Everyone, except the
youngest age group 20-29 and two from the age group 30-39, state without hesitation that
they have too much belongings in their household or they could have less.
I always wish that we would have less and well but then I have to admit when one
looks in my closet I’m very bad at giving up on items and clothes so well well. … For
children for some reason stuff accumulates it just comes and comes and I don’t even
know where it comes from.
- I9, male, 40-49, Espoo
It seems that within one household the attitude concerning belongings can vary greatly
between family members. I7 (male, 20-29, Vantaa) explained he does not have too much
belongings but wife and children have more than he, and during their moving to I7 it felt
that their household has too much.
I’m quite good at getting rid of things my husband always says that everything
disappears. … We have maybe different perception what is useful and what’s not. So
we really have these situations when he asks me where some item is that would now
fit somewhere perfectly. Then I have to admit I have thrown it away. In my opinion
we could have less stuff.
- I3, female, 50-59, Vantaa

60
Most likely I see it in different way than other members of our family. I wish we
would have less stuff than we have. I feel like all the closets and rooms and garage is
full of stuff we don’t use or need.
- I5, female, 30-39, Vantaa
Time seems to be one important influencing factor as items seem to accumulate by years.
Accumulation over time also might also explain why younger people in this study are more
satisfied than older with the amount of belongings at homes.
Way too much stuff and I have to say that same will happen to you (referring to the
interviewer) in very high probability.
- I13, male, 60-+, Vantaa
In addition, the size of household and the size of apartment have an impact on the amount
of belongings at home as well as how many persons live under same roof.
I don’t have too much. I have this compulsory reason for not having too much since
my home is so small.
- I6, female, 20-29, Helsinki
People move first to live alone to a studio or similar and then when they get partner
usually move to bigger apartment. And when they get children even bigger apartment
and stuff accumulates at the same time ... At that point when you are alone and you
have to move from bigger apartment to a smaller one and you realize don’t dare to
give away things.
- I13, male, 60-+, Vantaa
These interview findings show that items bring forth both positive and negative
associations. Many of the items in households are used regularly. Some of the items are
memories, some are burden, and some even both. Most of the items have once been useful,
but getting rid of them takes too much time or is difficult due to the emotional bonds. Also
gifts have been mentioned being difficult issue because getting rid of gift is seen as
disrespectful. According to Cooper (2005) sustainable consumption requires the consumer
to get attached to the belonging and not update the product even when a new updated
product would be available. In this study the problem seems to be more how to get rid of
items, which are not useful anymore. However, in this study it is paradoxical that
interviewees state that they buy almost always items that are necessary, yet they end up
having too much items in their households. Also as will be discussed later, these
interviewees still give away at least some of the unnecessary items.
This should be researched with the quantitative method, hence with greater number of
participants, if this conclusion is valid with the total Helsinki metropolitan area’s
population. If people only buy necessary items but still end up having too much, and often
unnecessary items, there is a problem in regard of waste. The items that are unnecessary
for someone are not always in a good condition for to be donated or to be sold – hence they
end up to be thrown away. Other times even the original owner has an illusion that the item
is useful for someone it may not be true, hence the item ends up to trash. Nowadays the
sustainability problem towards consumption of goods seems to be the combination of the
product quality and consumption habits. The items are rarely bought to last a life time and

61
therefore the excess of products have the possibility to end up as waste, hence increase the
waste amounts.
4.1.3 Rental, loaning and sharing services
One of the EU’s and the circular economy’s main focus is on the different rental, loaning
and sharing services. Currently there is a need for consumer habits and values to shift
towards different consumption in format of for instance renting, loaning and sharing
products instead of owning each product you need. According to Sitra (2014) so called
sharing economy is an important way to reduce the household waste.
In this group of people these kinds of services are used quite rarely. Only three (3) of the
interviewees (I8, I11, I13) marked using often rental, loaning and sharing services.
My spouse and I use often library, art rental shop we have used couple of times,
sport equipment we have rent for instance for snowshoeing and cross-country skiing
because we want to test before buying our own equipment. We have also considered
selling our car and start using car sharing service like Drive Now but then on the
other hand we use car for more than once a week … with all those kilometers it
becomes quite expensive with car sharing or rental car.
- I8, female, 40-49, Helsinki
I love libraries and visit there often I loan not only books or dvds but whatever they
have. … for instance if I need a power drilling machine I loan it from library.
Another service that I use is from internet called “Kuin oma”- service from where I
have loaned things related to filming if necessary mostly cameras and that service is
also very good. From clothes rental I have borrowed tails once a year.
- I11, male, 40-49, Helsinki
I never buy or at least extremely rarely I buy new books. I loan 100 books from
library per year that is why I chose the option “often”.
- I13, male, 60-+, Vantaa
In total five (5) of the interviewees (I1, I2, I7, I10, I12) did not use these services at all.
The underlying reason for not borrowing seems to be the need for owning things one uses.
I consider carefully before buying for instance sports equipment. It’s okay to rent a
tennis racket in tennis field when testing tennis first time but I aim to use my own
belongings until the end therefore I think it’s better to buy my own and use that until
it kind of expires yeah.
- I1, female, 30-39, Espoo
Well I aim to buy things for myself. Also we seem to buy everything for children as
well or then we get those as used from friends.
- I7, male, 20-29, Vantaa
Worth noticing is that many (I3, I4, I5, I6, I9, I14, I16) of the ‘sometimes’ group use these
type of services very rarely and/or they solely use library. In general, a library seems to be
most popular service among different age groups.

62
City bike and then well I’m in that Drive Now system. We have used art rental shop
here at work … I think it’s great that there is a place like art rental shop and library
I’m definitely supporting library but I have never time to read …
- I15, male, 50-59, Helsinki
Yeah well I use library sometimes but only for books. But I have a bad habit to buy
everything to myself even the books for some reason I rather want to own a
commodity than borrow or loan it even it would be wiser to do that way. That’s my
bad habit which I should reflect.
- I16, male, 30-39, Helsinki
Some of the interviewees mention to sometimes rent tools for renovating (I7, I15) or
delivery car (I7) for moving. But these only happen rarely.
A model where consumer is using services that allow access to a product without an
ownership is called collaborative consumerism (Ellen MacArthur Foundation, 2013a). This
kind of consumption has not yet reached enough interest among the Finnish consumers, at
least not according to these interviews. It still seems more likely that the traditional
consumption model, buying new items, is still the most common way of getting yourself
what you need. Based on the results it seems that Finland has not successfully created
demand for this type of services and should be further studied if this is the prevailing
general way of thinking.
Even the use of official rental services is not very high among this particular group it does
not mean that they always buy everything for themselves or for their children. In fact
loaning items and for instance sports equipment is, according to interviewees, more likely
to happen between relatives and friends than through official services. This partly explains
the low utilization rate of loaning, rental and sharing services among the interviewees.
In regards of decreasing the waste amounts in the Helsinki metropolitan area the renting,
loaning and sharing services play important part. Naturally this includes private people
sharing items with each other as well. The waste is prevented in many phases, such as raw
material upstream, manufacturing, storing and transportation, if the same item can be used
by multiple people instead of each buying new, virgin products.
4.1.4 Second-hand shopping
Instead of buying new products one can look for the product or item from second-hand
sector, which are for instance traditional second-hand stores, flea markets and non-profit
organizations selling second-hand clothes (e.g. UFF, Fida). Recently the second-hand
sector has improved with the internet connections (Sitra, 2014) and nowadays you can find
people selling their items in Facebook or through peer-to-peer services like tori.fi.
Perhaps surprisingly only one of the interviewees uses second hand shopping often. But
even I5 (female, 30-39, Vantaa), who buys second hand often does not reflect to her whole
family or the purchases she does for the children.
Well yeah as I mentioned before I don’t buy much to myself, but those things that I
buy are often second hand. For instance I collect certain old Finnish glass items
from 50s-70s. … Together with my family we used to go to flea market quite often

63
,like couple times a month, but nowadays because children are already teenagers I
buy them new from stores.
- I5, female, 30-39, Vantaa
Most popular option among the interviewees has been doing second hand shopping
sometimes (13/16). Primary reason is to purchase items, such as clothes and sport
equipment, for children who are still growing and need new often. Buying anything second
hand for “adult self” seems to be quite rare within this group. If something then the items
have been books, cars, decorations, furniture, and paintings. These interviewees seldom
buy for instance clothes or shoes as used.
Well hmm from ‘Kallio kierrättää’ -group I have bought some clothes … and then to
my last apartment I actually bought a couch and then some small household items
like some bowls and coasters those kind of small items.
- I6, female, 20-29, Helsinki
Yeah when we moved with my flat mate here to the new apartment we went to
Recycling Center to see furniture and we should still go we still need kitchen table
and chairs to it. When I was a kid my parents took me to flea market but nowadays I
tend to buy new. … When I was young and growing fast I needed new often but
nowadays I don’t need to change because of that so that basically doesn’t need to
buy used.
- I12, male, 20-29, Espoo
Yes well children’s’ clothes because it makes no sense to buy them as new but we
also get most of them from relatives and friends… Strollers at least two of them we
have been bought used… And old antique furniture… Maybe my own clothes I feel I
want to buy as new and like clothes and shoes I rarely buy from flea markets but
there also when I buy I use them until they are in poor shape and goes to trash and
rarely nowadays I buy something I would use only two three times and pass on.
- I1, female, 30-39, Espoo
I came to think about antiquarian and even that has been longer time ago maybe it
was a book or recording some rarity but not otherwise.
- I4, female, 40-49, Espoo
From tori.fi I have bought quite many furniture but not much other items. Well car
has usually also bought used. … And then some children’s sport equipment from
tori.fi.
- I7, male, 20-29, Vantaa
Two interviewees (I2, I10) have marked in the background questionnaire that they never
buy second hand.
I have never bought any clothes or something like that as used it just doesn’t feel like
it’s my own or something. Well car I have bought used but everything else I own I
have inherited or once bought for myself.
- I2, female, 50-59, Espoo

64
However, buying second hand rarely or never does not mean that second hand items are
not used at all in the household. I3 and I10 mention their spouses are more interested in
searching second hand especially from internet (tori.fi).
From flea market I have sometimes bought some decoration items and then some
clothes. From tori.fi my husband buys or he is more into that I don’t care to surf
there so that he buys and sells there our mutual belongings like home appliances and
such.
- I3, female, 50-59, Vantaa
My wife is our tori.fi hero and second hand wizard and most of that is for our
children… In our household second hand shopping is used much but never by me.
- I10, male, 30-39, Helsinki
These interview findings supports that the usage of shared and second hand product is still
relatively limited in the Helsinki metropolitan area, at least according to this study. In CE
and waste prevention, one key element is to increase the utilization rate of existing
resources where buying second hand items can be seen as a utilization increase of the
resources and reduction of both resources and waste (Wilson et al., 2012) According to
Sitra (2014) the market has grown in recent years in Finland in general and that there are
some hidden potentials.
Increasing and developing the second hand markets can nudge people to buy used items in
the Helsinki metropolitan area, hence decrease the waste amounts coming from buying
new products and producing them in the first place. The more there are second hand items
on the market, the more convenient it is for residents to consider buying them. As the
market would grow, supply of products and prices would further decrease, attracting more
buyers for the markets. In addition, well-functioning second hand markets could work as
an incentive to keep the belongings in a good shape as the items would have value in
second hand markets when they are not useful for the original owner.
4.2 Theme 2 - Waste prevention
Third, theme 2 from the interview processes waste prevention and the results are presented
here.
4.2.1 Concept waste prevention
One important notion that has come out from the interviews about the waste prevention -
none of the interviewees have heard about the term waste prevention before the interview,
at least not with these words (in Finnish: jätteen synnyn ehkäisy). Despite this, most of the
interviewees have confidence that they know what is meant by the term.
I have no idea have I ever heard about it so I have probably never heard about it.
Well I think it means exactly that we reduce waste so that, if it’s prevention, we with
our own behavior try to reduce it.
- I6, female, 20-29, Helsinki

65
Yes maybe I have heard about it. It means exactly that we don’t buy unnecessary
items and reduce everything such as convenience foods and meat eating and use
public transportation and buy used items not buy everything for own since you can
rent and else then.
- I7, male, 20-29, Vantaa
Hmm yeah maybe not directly heard of that term but yeah in principle yes. It is like
responsible consumption and consumption precisely in a sense that you understand
that particular product’s lifecycle like what producing that product requires and
what its treatment requires and what happens after that and making choices from
that viewpoint.
- I1, female, 30-39, Espoo
No doesn’t ring a bell no. … Common sense answer would be that try to measure
your buying and consuming so that there wouldn’t be any surplus, such kind of
intended scarcity. … Take care of what you own.”
- I11, male, 40-49, Helsinki
No maybe I haven’t but I possibly understand what it means. Maybe I do it when I
look that I don’t buy that kind of product which has multiple plastic wrappings so
that I like boycott or avoid those products and then that the product in itself can
either be compostable used for energy production or not.
- I5, female, 30-39, Vantaa
Well logically thinking waste prevention I have not heard in that form but when I
think about it I understand what you mean with it. It happens when you use products
entirely that it does not produce any waste. Are we able to do it today? Of course
plastic waste is that kind that we cannot really reuse it of course we can recycle it
but already when you take it to trash then the amount of waste should be as little as
possible. Going back to being self-sufficient that is what it was back then.
- I2, female, 50-59, Espoo
Some of the interviewees only had guesses about the meaning of waste prevention.
No. I don’t know. I don’t know exactly but that we would try to generate less waste.
Yeah I thought is that waste type that doesn’t compost or other or does this refer to
every kind of waste? I don’t know this term can you define it?
- I15, male, 50-59, Helsinki
No I haven’t heard. Doesn’t it mean what the words mean that we would prevent
waste?
- I14, female, 60-+, Helsinki
The underlying reason why the interviewees have not heard about the term waste
prevention might be, according to two HSY’s experts, the term is mostly used in the waste
politics and not when communicating with the households (personal communication 30-
04-2018). According to two HSY’s experts more important than knowing the term waste
prevention is that households know concrete examples for waste prevention actions
(personal communication 30-04-2018). However, interestingly on the website HSY still
uses the term ‘waste prevention’, even when the target group is households.

66
As these interview findings indicate, waste prevention as a concept is not familiar for the
regular households. As Shove and Walker (2010) state, the problem relies often on
education and informing of the consumer. All the different actions what for instance HSY
is doing in regards of familiarizing households with waste prevention activities have not
come up in these interviews. Hence, one could conclude that for a reason or another,
messages about waste prevention have not reached the public. Interviewees clearly find
recycling more familiar concept than waste prevention, indicating the dominance of
recycling in a general public discussion. Even though waste prevention would not be the
correct term that is used among public, the underline findings address the lack of proper
communication with the households in relation to waste preventing actions.
4.2.2 Waste prevention actions
The interviewees mentioned many different actions how to prevent waste but are not
necessarily doing these actions themselves. They mentioned buying fewer items,
consuming less in general, fixing items, taking good care of belongings, and other similar
actions that prevent waste but remains unclear how many of the interviewees actively do
these. In addition, many of the interviewees take actions in their everyday life that could be
classified as waste prevention actions, but they are not necessarily doing so in order to
prevent waste. For instance, buying bigger packages of food instead of multiple small ones
or using shoemaker’s services. These actions are done more likely to save money or
because it is a habit or more convenient way. Not buying plastic bags seems to be the most
common practical waste prevention action among these interviewees. Three of the
interviewees (I12, I8, I11) mention they focus on not to generate food waste. Also not
throwing food away has stronger financial incentive than solely food waste and its
consequences on the environment.
Of course to think what to buy. If you buy food you can’t do so much or you can but
not for instance have an influence to food packaging if you want to buy what you
want. You can of course influence on food waste. I never throw food away.
- I12, male, 20-29, Espoo
There are probably multiple areas in life where I and our family could generate less
waste but I can’t really separate them.
- I3, female, 50-59, Vantaa
I could personally eat much less meat and more vegetables and reduce driving car
and use public transportation yeah also to look those packages … almost all the food
is packaged in plastic box or something. Then diapers are used quite much and
generate much waste so that if we would use reusable diapers we could save some.
- I7, male, 20-29, Vantaa
Maybe planning that you buy only what you need… We try to live so that there
wouldn’t be food waste because it’s also money issue.
- I8, female, 40-49, Helsinki
Perhaps first thing is your own reasonable consumption and then small practical
examples using reusable items like canvas bags instead of buying always new plastic
bag, taking reusable plastic plates to picnic instead of disposable ones. At home we
have chargeable batteries so that we don’t always need to buy new batteries.

67
- I9, male, 40-49, Espoo
In this group the packaging of goods is very well noticed especially by women but often
the feeling not having power over the issue has been mentioned. This ‘sense of
powerlessness’ is mentioned as a barrier in the study by Cox et al. (2010) when people feel
that what they do has no impact. Some have strict attitude towards unnecessary packaging
and they simply leave the over-packaged goods in the store. Others say that it is impossible
if you need some particular good and there are no alternatives with less or zero packaging.
Also I8 has mentioned that the amount of packaging comes sometimes as a surprise when
you go home and finally open the package. Especially goods purchased from internet or
ordered from stores to home were said to have too much packaging.
When doing grocery, shopping packaging materials for instance, to those one could
focus even more. As a consumer one could buy budget packages and bigger packs
not like two deciliters but one liter packages which you carry home and not to put
every fruit into different bag.
- I4, female, 40-49, Espoo
Even more and more to think about what kind of packages our food has because most
of our waste comes from the food packaging. And also like how recyclable those
packages are.
- I5, female, 30-39, Vantaa
In principle all the foodstuff how those are packaged. From that waste my trash bin
fills up.
- I6, female, 20-29, Helsinki
Here again more know-how is needed for households about waste prevention – what can
be done, how and why waste prevention is important (Brook Lyndhurst, 2009). In related
to specific actions, not only informing the consumer is enough, but more concrete guidance
and practical demonstration would be required. For instance higher price for generated
waste would shift the focus on the waste prevention. This is not in the main focus of the
study but should be further discussed. In this concrete guidance and motivation a clear gap
is existing in the Helsinki metropolitan area. As the interviews clearly reveal, the
households do not have understanding of the existing waste prevention methods. As
previously has been conducted in this paper waste prevention as a whole is an unknown
phenomenon, however, the practicalities seem to be even more hidden from the
households. In this study, some of the interviewees were not able to define waste
prevention action, even though they would be already executing some of them by
themselves. The households need more support that they believe and understand in their
own actions having influence on the bigger picture.
4.2.3 Sustainable consumption
As mentioned before, consumers can minimize unnecessary consumption and choose
products that generate only small amounts of waste (European Commission, 2012).
According to two HSY’s experts sustainable consumption is used in consumer education
over waste prevention (personal communication 30-04-2018), however, among this
particular group it seems to be difficult concept to define and some interviewees have
struggled with this.

68
Yikes well maybe that what I really need and then again rethink if this really is what
I need. Then think where to buy it or is it really worth to buy or could I maybe rent it
or share it with someone … depends what is utilization rate.
- I1, female, 30-39, Espoo
I guess it should be conscious choice about the material and product’s lifecycle
process so that your own carbon footprint, I’m not sure if it’s carbon footprint, but
footprint in general would be small. … It is perhaps that you have smallest possible
impact on the environment and nature that I would consider sustainable
consumption. .. Funny since I have never been forced to think about this particularly.
… Sustainable is kind of consumption that can be logically maintained.
- I10, male, 30-39, Helsinki
Sustainable consumption hmm do you mean now qualitatively sustainable
consumption? I see quality to go with it because it needs to be durable. Ah well yeah
if you buy large amounts because you get them cheaper then true but mainly that you
invest in quality due to the product’s durability.
- I2, female, 50-59, Espoo
Well basically sustainable consumption is that first of all you would be satisfied with
less that is the key issue here that is the first act. … But these are so complex issues
that nobody cannot really say what sustainable living is.
- I15, male, 50-59, Helsinki
For some of the interviewees the concept of sustainable consumption seems like common
sense and an answer was provided straight without hesitation.
Okay so it would be exactly that you would buy used items and also that you would
recycle what you don’t need yourself so that those wouldn’t end up to trash.
- I12, male, 20-29, Espoo
Sustainable consumption makes me think first not buying too many new commodities
and items preferably loaning or using old or using items until the end and then to
repair what’s broken. That’s approximately what it is.
- I4, female, 40-49, Espoo
Do not buy anything unnecessary and when you buy, buy things that last.
- I7, male, 20-29, Vantaa
Furthermore, sustainable consumption has been related to environmentally friendliness
(I5), not buying unnecessary items and buying less (I2, I5, I15, I16). Many of the
interviewees relate the cost to the durability of the product (I2, I3, I8, I9, I15, I16).
However, I16 (male, 30-39, Helsinki) hesitates with the real connection of the cost and
durability by saying “I have thought in that way that rather to buy less but quality products
so that the life of the product would be long. Also rather pay more for the product than buy
all the time such disposable products. … I don’t know if it’s so rational if we investigate
industries.”

69
One of the targets in the previous NWMP 2008-2016 (note. was valid until January 2018)
has been that private consumption would be directed to eco-efficient products and services
(Ministry of Environment, 2008). Regarding environmental friendliness it seems that again
issue is too complex for a regular consumer. Many state that it is almost impossible to say
whether or not product is environmentally friendly. Some of the interviewees say that they
consider certain materials as environmentally friendly. For instance with clothes natural
fibers have been mentioned to be environmentally friendly. Others say that they look for
certificates and sometimes they do help but problem is that it is unclear what all the
different certificates mean. According to these interviews it takes too much time to search
all the information regarding environmentally friendliness. As mentioned before, Ministry
of Environment has had in the NWMP 2008-2016 (note. was valid until January 2018) the
aim to increase the product information about the durability and environmental qualities.
In addition, the EU talks strongly for eco-labels as has been discussed in the chapters 3.5
and 3.6. However, it seems that the eco-labeling and information in products has not yet
been enough or not in the right place. As I10 (male, 30-39, Helsinki) concludes
“Environmental friendliness needs to be simple and easily achieved. It cannot have too
radical difference what one does environmentally friendly and non-environmentally
friendly way.”
In terms of waste amounts, buying durable products, made preferably with recycled
materials and sold without unnecessary packaging would be a good way to decrease the
generated waste in the Helsinki metropolitan area as well. Sustainable consumption
includes less consumption in general, thus having a positive effect on waste prevention
targets. However, it is explicitly hard to define what is reasonable as the personal needs
and values vary between the households. This applies also for the necessity of consumption
– for different people necessity means different thing and can be greatly influenced by the
background, environment and income of the consumer.
4.2.4 Maintenance and repair services
According to the EU one of the crucial parts of the waste prevention is to enhance the
product life. Waste prevention can also occur in the end of products life; instead of
discarding the product user re-uses, repairs or refurbishes the product (European
Commission, 2012). This is one of the areas the EU wants to enhance with its waste
prevention goals.
In this group the use of maintenance and repair services varies much. Two (2) men (I7,
I12) do not use these kinds of services at all. They either do the repair themselves or ask a
relative or a friend to do it. The most popular is shoemaker’s services, which is used by all
except four (4) interviewees. From these who do not use shoemaker’s services three (3) are
men. Second most popular is the home appliances repair, which is used by nine (9)
interviewees (I2, I3, I4, I5, I8, I9, I10, I14, I15). The reason for using these services seems
to be the price and actual weight of the bigger home appliances like fridge and washing
machine, which makes them harder to be moved. Hence, asking someone to repair the
machine is easier and often less expensive than buying a new one. But in regard to these
appliances also the age of the machine is important when thinking whether to fix it or not.

70
Hmm well like nowadays it is very expensive if fridge breaks down then its repair
costs is as much as buying new. If they say that fridge is for instance 10-15 years old,
then at that point in our household it reaches its end. So that commodity is too old
just maybe due to its energy consumption, but as well with design and that’s very
unfortunate.
- I1, female, 30-39, Espoo
Four (4) interviewees (I6, I11, 13, I15) use dressmaker’s services but none of them do it
very often. Some state that if so called everyday clothes break down it does not make sense
to fix them or it is even impossible to fix. This is also partly due to the bad quality of the
clothes. I7 (male, 20-29, Vantaa) explained that his used clothes go to trash because the
clothes have reached their end life. I16 (male, 30-39, Helsinki) says the same even though
he later in the interview concludes having too much clothes and gives clothes to relatives.
There haven’t been any clothes that could be fixed when often they become worn out.
For instance jeans I have taken them to repair shop but they have said it is
impossible to fix so I had to throw them to trash. In clothes this is often the case that
they don’t last and many of them are made in a way that it’s impossible to fix them
and it is very annoying …
- I11, male, 40-49, Helsinki
Three (3) interviewees (I2, I6, I15) use furniture repair and then the service has usually
been furniture upholstery or polishing of antique furniture. Electronics repair has been used
by five (I3, I4, I6, I14, I15). However, in this part many state that is too expensive and is
only done for relatively new appliance, which might even have guarantee left. According
to EC (2012), ensuring more affordable repairing services would decrease the barrier to
utilize repairing services. Findings from the interviews support this conclusion.
Simultaneously Cooper (2005) suggests policies, which improve after-sales services, such
as repair, guarantees, warranties, and spare parts. Among the interviewees in this study, for
example warranty policies are seen as a positive way to increase the life duration of
products.
Simultaneously for those who have not used electronics repair at all is due to the price or
that the appliance has broken in a way that it is not possible to repair. Especially regarding
phones and laptops it is seen too expensive to repair the product since the cost comes to or
is the same as buying a new device. The same applies to smaller home appliances like
coffee machines and hairdryers. These findings are in line with EEA (2015) report, which
addresses the need for better design of products to ensure the repairability and recyclability
of materials.
According to Cooper (2005) “people appear increasingly unwilling to take long-term care
of possessions through repair and maintenance …” (p.62). These interviewees have not
exactly act as unwilling but they have admitted that it is often too expensive and / or the
new models make it tempting to buy new (especially in terms of technology). I16 (male,
30-39, Helsinki) says it is often not economical to fix belongings or simply that he is too
lazy to do it. On the other hand the attitude towards repair services seems to be positive
and some say that they would use some of the services if they would need them but until
now there has not been a need. Two women (I2, I14) from the older age group say that
they particularly respect craftsman skills and that is one reason they enjoy using those
services.

71
Sweden has introduced tax breaks on repairs so that people would not throw away the old
items (The Guardian, 2016). According to EC (2012) financial incentives would be
prominent option to support repair and maintenance services.
However, when asking how the interviewees would feel about this it causes mixed
opinions. In total of eight interviewees (I1, I2, I3, I4, I5, I6, I7, I8) think this would be a
good idea and give support for the repair services. Seven of them are women. Indeed in
this question it seems that men are more critical for introducing tax system. Four men (I9,
I10, I15, I16) argue that tax break for repairs would not be good because it would
complicate taxation system and would be misused. I11 (male, 40-49, Helsinki) ponders
that it could be tested for some years but if it does not work it should be removed. I13
(male, 60-+, Vantaa) does not believe in this as he thinks the change should be done in
manufacturing especially in Far East. Similarly I14 (female, 60-+, Helsinki) believes that
the guidance should be focused on the production step. Furthermore, I14 (female, 60-+,
Helsinki) argues that people should be ready to pay for the handcraft services.
Some of the interviewees (I4, I7, I12) mention longer guarantee to be a good leverage on
putting the pressure on the producers so that they would focus on producing lasting goods.
This is also what is suggested within the EU and already in use in Norway as they have
minimum 5 year warranty for a product (EU, 2017).
As this study seems to indicate, Finland has not been able to create sufficiently attractive
pricing for repair services. Interviewees find repair services too expensive considering the
purchase price of a new substitute or comparing product. The quality of many products is
relatively poor as well, making their repairing impossible. This occurs especially in
clothing and electronic devices. As Cooper (2005) explains “Measures are needed to
promote the design of product with increased durability to encourage owners to take good
care of their possessions and to provide greater market incentives for longer lasting
products.” Other factor is that the market frequency of new products is intense and
consumers do desire to have the latest products when repairing old ones is not even
interesting option for many of the interviews. It is not reasonable to say that Finland has
failed to promote more sustainable design or production since majority of our consumer
products are imported from other countries. In order to ensure positive change, global rules
and regulations will have to take in place to demand for sustainable and repairable
products.
However, based on the answers about electronics, it seems to be the most problematic
product range for households. Interviewees find repairing and re-using electronics not so
tempting behavior. However, this does not seem to be in-line with the conclusion made by
Laaksonen et al. (2017). According to Laaksonen et al. (2017) the reuse of electronics and
other electric appliances has actually increased significantly. However, the new NWMP
focuses on the longevity and recycling of electric items and electronics (Ministry of the
Environment, 2018). Thus, it seems the progress is positive, but based on the results of this
study there is still room for general improvement.
4.2.5 Reasons for reducing waste
One of the barriers mentioned in the chapter 3 has been “The extent to which is has not
been possible to identify the reasons behind why waste is being prevented.” (Brook

72
Lyndhurst, p.13, 2009). In order to be successful in changing behavior suitable for waste
prevention, there is a need to understand why waste is being prevented.
The interviewees have been asked why the waste amounts should decrease. More than half
of the interviewees are worried where all the trash that is generated finally ends up and that
we cannot expand and build new landfills endlessly (I1, I3, I4, I6, I7, I8, I9, I10, I12, I14).
Also eight (8) interviewees bring up environmentally reasons to underline why it would be
important to reduce waste amounts (I1, I3, I4, I7, I13, I14, I15, I16).
Everywhere is so much waste and landfills and trash bins are full and everything. So
that even the waste is recycled and it is done as much as possible it does not fit here.
… but also that yeah it is not sustainable and it destroys the globe and all those
byproducts what producing goods cause is not good for the environment and for
human either... And if we think about materials and someone invents some smart way
to replace plastic that is going to win Nobel price and else.
- I1, female, 30-39, Espoo
I am not very convinced that it is treated right the waste I mean. Seemingly it is
obviously recycled much in these trash bins and everything but where it ends up? I
have a feeling that everything ends up to same place to be burned it is like sweeping
the trash under the rug.
- I2, female, 50-59, Espoo
In addition, the generation of waste is seen pointless (I15) and waste of money and
resources (I5, I8, I9, I11, I13).
Well first of all it is that all the waste is unnecessary then there must be too much
production if that product has to be thrown away. The less there is waste the smarter
we humans would have been.
- I15, male, 50-59, Helsinki
As interviewees have been explaining their arguments for reducing the waste are mostly
about the landfills. Landfills are considered as ugly and harmful for the environment.
Interviewees also question whether there are enough free places to build up more landfills
in order to manage all the waste that is generated. The worry about environment seems
real. This supports Brook Lyndhurst (2009) argument that ‘care’ is a strong force behind
waste prevention. As has been mentioned before, environmental values are important for
the Finns and therefore sharing practical information about the products environmentally
friendliness is seen to be a functional way to have an influence on consumers’ choices.
Addition to the sustainable consumption Finland should be using this ‘care’ for the
environment as an advantage to improve the tools for transition in the society and to push
Finnish households towards waste prevention actions.
Interestingly the dominant answer is related to the landfills and landfills only. It has been
expected that interviewees would refer more to the global resource shortage since it has
been recently in the discussions of the news and media in general. The need for waste
reduction is clearly justified with visible reasons, however, the natural resource based
issues seem not be as relevant for the interviewees. The finding is interesting since
majority of interviewees are saying they value the nature indicating the importance of the
diverse and pure environment, however, not only the waste but the resource usage makes

73
the environment to suffer as well. Clearly the origin of the waste is not so obvious for the
interviewees. In addition, some of the Finland’s waste is shipped to other countries, like
Estonia and Sweden, to be processed because there is more waste than can be processed
and managed in Finland. Education in this area would again help households in identifying
reasons behind waste prevention actions and therefore highlight the importance of waste
prevention in general. As pointed by Laaksonen et al. (2017) measurements have not been
strong enough to guide the waste amounts downwards and many measurements have been
developing slowly or not at all. One important factor is that there have not been suitable
indicators for measuring waste prevention (Laaksonen et al., 2017).
4.3 Theme 3 - Recycling
Fourth, theme 3 is about recycling including both items recycling as well as waste
recycling.
4.3.1 Waste recycling
As discussed previously in this study, waste recycling is often mistaken to be the synonym
for the waste prevention (Tucker and Douglas, 2007). Sometimes recycling and waste
prevention even correlate negatively with each other as people who recycle may keep
recycling as a reason not to do anything more to decrease the amount of waste generated
(Zorpas and Lasardini, 2013). Thus, it has been important to find out whether the same
misunderstanding can be found from this study as well.
The barrier ‘The inability of participants to make a conceptual distinction between waste
prevention and recycling.’ (Brook Lyndhurst, p.13, 2009) can be seen in this group as well.
Many of the interviewees have talked about these two as a same thing during the interview
until the question ‘What is the difference between waste prevention and waste recycling?’.
Thus, until interviewees had to think about it more carefully it was the same and many
clearly have hesitated at this point. Four (4) interviewees, all women, have similar idea that
waste prevention and recycling differ in process but the goal with both is the same and they
support each other (I1, I2, I3, I5). For four (4) other interviewees, from which three (3) are
male, these two concepts are exactly the same and/or recycling is only part of waste
prevention (I9, I10, I14, I16).
For six (6) interviewees the difference seems to be quite clear.
In recycling stage it is not anymore actual waste prevention but how to get rid of
those in the most effective way to so that those can be utilized in best way for
material recycling.
- I4, female, 40-49, Espoo
Waste prevention is like proactive action and this waste recycling is when the
damage has already happened.
- I8, female, 40-49, Helsinki

74
So waste prevention is like the preventive principle and if still waste is generated
after that it is what is done to waste there should not be any recyclable waste if waste
prevention is successful.
- I11, male, 40-49, Helsinki
Recycling is only a consequence from the waste generation and if we are able to
prevent waste we don’t need to recycle.
- I13, male, 60-+, Vantaa
First we need to prevent the waste … and after we recycle.
- I7, male, 20-29, Vantaa
Preventing is that something doesn’t happen and recycling is that something happens
preventing happens first and recycling only after it.
- I12, male, 20-29, Espoo
Two interviewees (I6, I15) seem to have influence to their answer from the interview itself
as they both refer to how they understand the term regarding the talk before this question.
Thus, the answers probably would have been very different if this question would have
been in the beginning of the interview.
Well if I understood correctly that waste prevention it is like it would happen be
before the recycling but when waste is still generated so then it is recycled but if not
then we don’t need recycling.
- I6, female, 20-29, Helsinki
How I understood it is that it differs and it is precisely that less is less and it is less
whatever waste.
- I15, male, 50-59, Helsinki
Two HSY experts state that due to the reason that energy recovery has been replacing
landfilling it has been important to highlight the importance of waste recycling for the
households (personal communication 30-04-2018). More precisely it has been important to
inform that despite the energy recovery, recycling is still important (personal
communication 30-04-2018).
Recycling waste seems to be regular thing to do for the most of the interviewees. Reasons
for doing it vary because recycling is, for instance, following:
A right thing to do / a norm 6/16 (I2, I4, I6, I9, I10, I14)
Recycling is a civilized deed which needs to be done.
- I9, male, 40-49, Espoo
Because there are specific places for different materials I don’t want to be an
anarchist and fight against that.
- I16, male, 30-39, Helsinki
A habit 6/16 (I2, I5, I6, I7, I10, I12)
Because I got used to recycling in my childhood.

75
- I5, female, 30-39, Espoo
Feels better and is good for the environment 9/16 (I1, I3, I5, I7, I8, I10, I11, I13, I15)
Personally it feels good not to have mixed waste so much. It would feel bad to for
instance throw bio-waste to mixed waste.
- I15, male, 50-59, Helsinki
Reason is simply that is good for commonweal for all of us, for the globe and for the
climate.
- I13, male, 60-+, Vantaa
For some development of recycling really have made a difference
I have been so happy since I heard that one can recycle so that everything doesn’t
end up to one bin because I realize intrinsically that it is not how it should go since
they don’t disappear even if you don’t see them or when you don’t see them they
don’t disappear from the globe. It makes it easier to reuse these (materials) when
they are taken to different recycling points.
- I4, female, 40-49, Espoo
These answers indicate that recycling is taken quite seriously and instead of putting effort
to generate less waste, this group believes that recycling is what needs to be done. This
study also supports the finding of Barr (2007) that recycling might correlate negatively
with waste prevention as the interviewees seem not to think much how to prevent the waste
in the first place but more how to recycle the waste. Hence, it can be concluded that the
barrier ‘Dominance of the recycling norm’ (Cox et al., 2010) has been found from this
study as well. Furthermore, as interviewees have been confused with the difference of
recycling and waste prevention it seems to also be misunderstood among the interviewees,
indicating not only the poor understanding of the concepts but the reality of material and
resource flows in general. As Bartl (2014) points out about recycling is not treatment for
the cause but the symptoms.
Despite all this knowledge and activity in recycling, it is interesting that there is so much
skepticism among the interviewees about how the waste is treated after they have recycled
it to different bins and whether all the recycled waste ends up to same place with mixed
waste. According to two HSY’s experts (personal communication 30-04-2018) it is a myth,
origin of which is hard to trace. It possibly has roots in history when there has been limit in
capacity of treating bio-waste and therefore some of the collected bio-waste has been taken
to landfill (personal communication 30-04-2018). Another possible source to start this
myth is when the recycled waste has been too dirty to be recycled and it has been used for
energy recovery (personal communication 30-04-2018). Another issue regarding recycling
seems to be the profitability and real environmentally friendliness of recycling. Some
interviewees have doubts about how much sense it makes to have all this recycling and
multiple trucks driving the waste back and forth causing more pollution. Two HSY’s
experts assure that they make research and calculations to support the decision making
regarding waste recycling but most of the regulations come from the EU’s waste
management policies (personal communication 30-04-2018).

76
In regards of the research question, waste recycling can be one reason why the waste
amounts are not decreasing. The focus in MSW management in the Helsinki metropolitan
area is currently so much on the recycling that there is no space for waste prevention. In
addition, as mentioned before actively recycling households may not consider how the
waste amounts could be smaller. Thus, waste recycling overrides waste prevention. It
should be highlighted in the Helsinki metropolitan area that first all the waste that can be
prevented should be prevented and only after that becomes waste recycling. Now the
misperception seems to be that best action is done when the generated waste is recycled. If
waste prevention would have same associations as waste recycling, ‘A right thing to do’,
‘A habit’ and ‘Feels better and is good for the environment’, waste prevention would more
easily become part of everyday life.
In addition, even though recycling has long history in the Helsinki metropolitan area and
many have gotten used to it already at young age, it is interesting to see how much trouble
it still causes to residents and how much the interviewees question the recycling system
and the authority and service providers behind it. Thus, based on this could be concluded
that the introducing waste prevention faces similar troubles.
4.3.2 Used items recycling
According to Cox et al. (2010) donating goods is the most popular waste prevention action.
For instance, a recent Finnish study shows that more than 80% of Finns aged 18-65 donate
their clothes (Mikkonen, 2017). Donating and giving away items are done often based on
this study as well. Among these interviewees recycling old items seems to be popular, bit
contradictory, much more than buying used items for themselves. It seems to be considered
as ecological but additionally throwing to trash some item or product, which could be
useful for somebody else, feels wrong (I1, I5, I7, I10, I11, I14). On the other hand donating
or selling away used items makes the interviewees feel good about themselves (I3, I5, I8,
I10).
Environmentally friendliness and from home I have learned not to throw anything
useful to trash. It feels bad to throw to trash something that is not broken.
- I7, male, 20-29, Vantaa
Sometimes I want to cheer up others by donating. Maybe the idea is that for someone
that item is beneficial and he or she finds it useful. Also I don’t want to throw them to
trash.
- I3, female, 50-59, Vantaa
Because throwing away is wasting if it can be valuable for others. It also gives you
good mood.
- I10, male, 30-39, Helsinki
Three (3) of the interviewees have mentioned money as the main motivator for selling
forward their used items (I6, I8, I16).
Only one (1) have been wondering what eventually happens to the useless items the family
donates to UFF or similar organization.

77
On the background is the limited storage space but on the other hand also that
something is useless for us once and for all. It is more difficult to say where those
end up because it seems to be impossible to know after we take them to receiver what
is the final destination.
- I4, female, 40-49, Espoo
One (1) sees being accountable for the purchases he has made and therefore tries to find
second home for the items that are useless for him.
I feel being responsible of the item.
- I13, male, 60-+, Vantaa
Only one (1) of the interviewees has chosen option never.
It is more that when something becomes useless for me it just gets forgotten
somewhere at home. Some of my old items are still at my parents’ house but here (in
the new apartment) I don’t have yet anything useless. Maybe it’s also that I don’t
bother to put them forward but some items are like memories and I don’t want to get
rid of them.
- I12, male, 20-29, Espoo
As a negative side, some of the interviewees say that it takes time and effort to sell and
donate used items and often these “bags” stand in the household waiting to be taken to flea
market by someone who has time. Hence, as Cox et al. (2010) concluded in their study
inconvenience is seen as a barrier in giving the goods new life. Whilst the deed is good the
effort is sometimes too much. Therefore it is not so surprising that money is seen as an
incentive among some of the interviewees. Something needs to get back from the original
purchase of the item and the effort for giving it a new life. By taking useless items to
donation or selling them forward gives possibly items new life and prevents them ending
up to trash. However, getting rid of items has its downsides as well because it might
increase the future purchases and clear the bad consciousness about consumption.
Eventually this would only increase the waste amounts, hence negatively impacting on the
waste prevention.
4.3.3 Pay-as-you-throw
Pay-as-you-throw system and weight-based-billing are tools that have been used for waste
prevention with mostly successful results (discussion in chapter 3.7). To discover how this
group of people would react to it they have been asked how they would feel about paying
for their personally generated waste by amount or weight. Paying for the waste by
household gets positive evaluation from many of the interviewees and is seen like other
household expenses such as water and electricity (I1, I2, I4, I7, I8, I11, I15, I16). Two (2)
interviewees are quite neutral about this system and say that they would not protest about it
because the waste amount they generate is not so much anyway (I6, I12).
Whether or not being charged for the amount of waste, I15 (male, 50-59, Helsinki) thinks
that solely knowing and becoming aware of how much waste you generate would already
help in preventing waste.

78
As a concept it would be great if it would be possible to have some kind of intellect
trash in the apartment that would at least count even if it would not charge for the
waste. Then everyone would see how much waste they create because many might
have a wrong illusion. That is what my children always say to me that I have an
illusion that I don’t consume anything but it would be good to know and then be able
to make comparison that is not possible at the moment.
- I15, male, 50-59, Helsinki
Paying for your own waste is also mostly seen as a fair system.
Good thing. I think all that kind of politics that would individualize the responsibility
of waste generation is good.
- I11, male, 30-39, Helsinki
Money motivates and makes people to consider issues more (I1, I7, I8) and therefore this
kind of system is seen to be motivating and functional in terms of changing human
behavior. However, even the interviewees have been encouraged to answer this question
by excluding possible practicalities of this system; five of the interviewees express their
skepticism regarding the actual functionality and implementation of this kind of system
(I4, I12, I15, I16).
Those who live in detached houses are satisfied with the current system that they pay for
the waste they generate (I3, I4, I5, I9, I14). Notable is that some have never thought about
how the system should be. Also having free recycling points gets positive feedback from
three interviewees, who only have mixed waste in their yard (I5, I9, I10).
I10 (male, 30-39, Helsinki) who lives with his family in a row house apartment is slightly
against this kind of systems and argues that “... it would not be fair since we are a family
with four person and next door lives a couple and the other neighbor is selling his place so
we would probably end up paying relatively more. But there could be a system with a
certain limit to the housing cooperative how much trash can be created at most and if that
limit is exceeded then that amount would cost much more than below the limit.“
However, this kind of system gets positive feedback overall and is predicted to have
awakening impact on the households how much they generate waste. More importantly it
would make households personally responsible for the waste they generate. Linderhof et al.
(2001) find in their study the financial incentive to be potential method to motivate people
to decrease their waste volumes and change the behavior, and it seems to get most of the
interviewees think the same about the system as well. Probably this kind of system could
be suitable for the Helsinki metropolitan area but as most of the residents live in the
apartment houses, the implementation is uncertain.
4.3.4 General interest
The overall interest the interviewees have in these subjects varies greatly. Half of them
(8/16) say that these topics are interesting, they would like to learn more and these issues
should be stressed more (I1, I2, I4, I6, I7, I8, I11, I15). Whereas some (3/16) have honestly
stated that they have not thought much about these issues before and probably will not
change how they personally act in the future (I9, I12, I14). Thus, the barrier ‘General lack
of interest’ (Cox et al., 2008) exists to some extend in this study as well.

79
It seems in fact that personal life, jobs and other interest take up most of the space and only
if there is left some ‘empty space’ then these kind of topics have room.
I think it (interest) changes due to how much other things there are in life.
- I5, female, 30-39, Vantaa
Similarly concludes I16 (male, 30-39, Helsinki) “Yeah those issues have always interested
me and still does but there are many other topics that interest as well.”
At least one says, however, that these kinds of topics have become a permanent part of his
life.
Yeah I feel these issues being part of my everyday life and rest is just rationalization
because yeah these world’s issues are in bad shape.”
- I13, male, 60-+, Vantaa
Interestingly, most of the interviewees think there is enough information available
regarding waste prevention. They mention different media sources (newspapers, bloggers,
TV, radio), schooling, friends and family’s knowledge, to be the source of information for
them. Some even say there is too much information available. However, many still claim
that there are not enough practical examples available and advices how one should do with
waste prevention and sustainable consumption. Contradictory seems to be also the
knowledge and the actual actions interviewees do. During the interview many have
mentioned they know where they could do better but for a reason or another they do not
want to change it.
From these issues can be concluded that changing the behavior and habits are one of the
most important matters in household waste prevention (Cox et al., 2010; Zorpas and
Lasardini, 2013; Brook Lyndhurst, 2009). Permanent change in behavior is happening
when something becomes a habit (Shove and Walker, 2010). In order to make successful
transition into more sustainable living, Finnish households would need not only
information but more support as well as pressure from the society, government and service
providers.
4.3.5 Responsible party
During these interviews there have been many complaints about waste management
systems, society, grocery stores, marketing, authorities, and so on. Therefore it has been bit
surprising when asking interviewees opinion about who is or are responsible for how much
waste is created most of the interviewees (10/16) have answered that everyone (I1, I2, I3,
I4, I6, I9, I11, I12, I13, I16). Barr (2007) found in his study that the waste prevention and
reuse is most likely happening among those, who feel the responsibility to act. Hence, it
seems positive about this group of individuals that they indeed feel being personally
responsible.
Consumers are seen to have much (I2, I12, I14, I15, I16) and to some extent (I1, I5, I6, I7,
I8) influence on the amount of trash. For instance, I1 (female, 30-39, Espoo) believes than
in relation to global waste issues supervising authorities and producers have more
influence than consumers. I11 (male, 40-49, Helsinki) continues that from top-down
control, both short-term such as taxes and regulations and long-term guidance for society

80
transformation, will create change in human behavior. In this direction leans eventually I15
(male, 50-59, Helsinki) as well by concluding “yeah it should happen in individuals but
when they are easily mislead from every direction so in that sense businesses and public
authorities are in charge”. I5 (female, 30-39, Vantaa) adds that government in Finland
should be in charge of the information regarding waste issues. Similarly I9 (male, 40-49,
Espoo), and I13 (male, 60-+, Vantaa) believe more in informing than for instance for laws
and regulations. I16 (male, 30-39, Helsinki) also has his doubts about laws and regulations
and says self-reflecting to be the key in changing behavior. On the other hand, I7 (male,
20-29, Vantaa) says everything comes down to money and therefore the ‘big bosses’ of the
companies are responsible.
Hence, the barrier ‘It’s someone else’s responsibility’ (Cox et al., 2008) both fits and does
not fit in this group of individuals. The interviewees on the one hand seem like they know
much and feel responsible but on the other hand they blame society, service providers and
institutions for lack of advice and services.

81
5 Conclusions
This study tried to answer two research questions. The first one was:
What are potential reasons why Helsinki metropolitan area has not been able to decrease
the household waste amounts?
The study, using qualitative interview method, found several potential reasons, which
should be confirmed or rejected in future quantitative studies. One of the reasons is
possibly the combination of the household’s knowledge and attitude as has been concluded
in the previous research (Cox et al., 2010; Brook Lyndhurst, 2009; Bartl, 2014). The main
finding in this qualitative research in terms of waste prevention has been the lack of
knowledge and information regarding the concept and at the same time the dominance of
waste recycling. According to the interviews of this study, as well as previous research,
waste prevention as a concept is not familiar to households. Some of the interviewees in
this study simply concluded the meaning of the concept from the words itself. Practical
actions and opportunities are hidden for households, and it seems that households do not
have enough motivation to carry out actions. Waste prevention seems to require more
effort than many of these interviewed households are willing to do. The qualitative results
of this study seem to indicate that the Helsinki metropolitan area has not been successful in
communication or building advocate incentives for waste prevention for the households.
The importance of the waste prevention in the Helsinki metropolitan area should be
addressed more as the greatest amount in Finland’s household waste comes from that area.
There are always countries where the situation with waste management is worse than in
Finland but there are also countries where the situation with waste prevention is better, like
in Sweden. Even though Finland has the same opportunities, the development is not going
further at a same rate. In an opinion piece, Finnish Environment Institute’s expert
Salmenperä (who is also one author behind NWMP) compares the difference between
Finns and Swedes in terms of recycling (Salmenperä, 2017). In Sweden, the recycling rate
is around 50% whereas in Finland it has been at its best 40%. Even waste recycling is not
same than waste prevention, these findings can indicate the differences between Finland
and Sweden also in relation to waste prevention.
The major difference between Finland and Sweden is not with the technical side of the
waste management, but in the residents’ attitude (Salmenperä, 2017). As Salmenperä
(2017) summarizes, Swedes consider recycling very important whereas Finns still have
doubts about the necessity and benefits of the recycling. This, regarding Finns, can be
concluded from this study as well. Furthermore, in Sweden the producers and the
municipalities collaborate closely together and inform about the waste management
together, but in Finland this collaboration does not exist partly due to the privatization of
the waste management sector. Municipalities have less responsibility in waste management
in Finland than in Sweden and this responsibility will only get smaller in the future due to
the political changes. These kinds of political issues might be hindering the waste
prevention as well. Finns have so much focus on the recycling, whether to do it or not, so
that there is no space left for the waste prevention. In addition, the mixed information,

82
possibly due to the conflict of interest, confuses the households and results in no action in
relation to waste prevention. Based on the findings of this study, waste prevention actions
for households should be simple, easily executable and supported by municipalities,
companies and institutions together.
Based on the qualitative results of this study, the households seem to be worried about
waste worldwide but not so much in relation to the Helsinki metropolitan area and Finland.
“I don’t really notice that” said one interviewee (I6, female, 20-29, Helsinki) when asking
about the waste in the local environment of Helsinki. During the interviews at least half of
the interviewees mentioned the Great Pacific garbage patches and global plastic problems.
This is due to the recent media attention as can be seen in the articles published by the
Finland’s most read newspaper Helsingin Sanomat (HS) (HS, 2018a; HS, 2018b; HS,
2018c; HS, 2018d). The articles published in HS about Finland and waste are mostly
related to recycling and its troubles (HS, 2018e; HS, 2018f; HS, 2018g; HS, 2018h).
Even though waste has gotten a global problem image, Finland and Finns are not innocent.
When talking about reducing consumption only one interviewee related the conversation to
a domestic problem she saw in the neighborhood “It becomes an environmental burden at
some point when we need to get rid of the stuff. I came to think about an abandoned couch
in the woods nearby” (I14, female, 60-+, Helsinki). Multiple problems arise from waste
ending up to places where it does not belong. Cleaning of the waste from the environment
requires major investments by the cities and multiple hours of human work (ELY-keskus,
2016; Tekniikkatalous, 2012; mtv, 2013), which could be used for other public activities.
For instance, Helsinki is almost surrounded by the sea and the waste is very visible
problem at the coast and beach lines. Interestingly, in a research done about the Baltic Sea
found more plastic waste from Finland than from Sweden, Estonia and Latvia (YLE,
2013). Still littering in the Helsinki metropolitan area has not stopped. In addition, some of
the Finland’s waste is shipped to other countries, like Estonia and Sweden, to be processed
because there is more waste than can be processed and managed in Finland. Despite this,
the interviewees of this study have not mentioned domestic issues during the interviews.
On the other hand, based on the qualitative findings of this research a hypothesis can be
made that global issues are not enough to motivate consumers for waste reduction in the
Helsinki metropolitan area.
Finland is a welfare state and therefore provides many benefits and services for its
residents. These are financed by residents through taxes. This kind of system might cause
careless attitude from the side of residents because they are used to the fact that everything
is taken cared by the government or the city. For instance, the city of Helsinki has been
considering adding an environmental protection tax to packages and this in turn would be
used to cover some of the costs of the environmental cleaning (Helsingin kaupunki, 2009).
However, there is a concern that this kind of tax system would only increase littering
because due to paying more for the cleaning, the residents would feel being justified for
littering (Helsingin kaupunki, 2009). Already with the current system the Helsinki
metropolitan area residents are claimed to be used to the good cleaning service of the cities
and it is taken for granted (Helsingin kaupunki, 2009; mtv, 2013). Residents consider the
Helsinki metropolitan area to be a clean area but actually many hours of work are done
during the early morning to keep for instance the Helsinki city center clean from trash
(mtv, 2013). The same attitude might apply to waste prevention. The households in the
Helsinki metropolitan area perhaps see the importance of waste prevention but expect other
parties to carry it out. As the interviewees of this study have said everybody is responsible,

83
but who eventually is the responsible party pushing and actively promoting the change?
Based on the qualitative results of this study, there should be clear roles to each party on
how they can contribute in waste prevention. For instance, HSY gives practical
information to households, companies give support, and households aim to carry out
actions that are possible in their current situation.
On the other hand, based on the previous research (Cooper, 2005; Cox et al., 2010; Gjerris
and Gaiani, 2013) as well as the qualitative results of this study, households seem to have
reached a certain level of wealth and comfort, which generates unnecessary waste and
environmental burden, but knowing this is not enough to drive the change. For instance,
the interviewees mentioned being aware of the areas in life they could make improvements
in terms of waste prevention but for a reason or another they have not changed their
behavior. This is most likely due to the level of income, but a further study about income
related issues should be conducted in relation to the waste prevention. As Laaksonen et al.
(2017) concluded the waste generation in Finland still strongly follows the GDP
development. The EU stresses that this relationship is very important to decouple. To this
one solution could be developments such as the app ‘Useless’ environmental management
professor Linnanen has been developing for the consumer market which will be released
this year. By using this app, the user will be given different choices how to invest their
money to certain suggested, commercial projects instead of buying material (Useless, n.d.).
These choices are different sustainability projects and by saving the money from
consuming goods, the user is able to gain additional income from the investment (Useless,
n.d.). These kinds of incentives are important in changing the society to work in different
way and produce less waste.
Second hand buying is not seen as an attractive method, not at least based on these
qualitative results. This is also found in the study done by Cooper (2005). The interviewees
explain purchasing second hand items for children but not so often for themselves. Despite
this, the interviewees donate and sell unnecessary items forward. Hence, based on these
qualitative results, there is a bit of paradoxical attitude regarding the second hand markets.
Especially clothes and shoes are not popular to be bought second hand among these
interviewees. On the other hand the interviewees admit still donating and selling these
kinds of items they would not buy used by themselves. Furthermore, another area
improving waste prevention, the usage of repair service, is on low level according to these
qualitative results. This is partly due to the services’ high prices and partly due to the poor
quality of the products, which makes repairing economically a non-attractive investment.
The common attitude among the interviewees towards repair services is positive and in
narratives the tone is promising, however, they rarely use these services. Once again
greater sample size should be taken into research about the use of second hand markets and
repair services in order to find out whether these results can be generalizable in the
Helsinki metropolitan area.
The sharing economy could have influence on the waste prevention but it does not seem
very popular yet. In this study, almost all of the interviewees use libraries but other than
that the use is low. Few interviewees are using sharing services like city bikes and car
sharing. Hence, there is much to expand in this area. The services should be promoted
more and the benefits should be made more attractive. If residents have not tried the
services they do not know what are the benefits in using those. Service providers or city
should actively sponsor and market these services in order to utilize circular economy
models. According to the interviews, it seems that freedom is valued so much that

84
everything should be owned by oneself. This further decreases the motivation to test
sharing based services. Interviewees’ relationship to physical items is complex and
dependency on physical goods seems to remain strong. Interviewees seem to have a strong
need to own items they use and they do not want to use the products as a service. Based on
the results of the study a hypothesis can be made that many consumers are not willing to
shift to a sharing economy due to the reason that they value ownership.
The second research question was:
How could the target be reached in the future?
Again, several potential solutions were detected even though the interviewees found the
concept of waste prevention unfamiliar to them. The priority given to waste prevention in
the EU as well as Finland does not meet the efficiency of the waste prevention activities.
As Laaksonen et al. (2017) concluded, the used measures have not been suitable and strong
enough to drive changes in the national economy’s material streams (Laaksonen et al.,
2017). The measures should be given to each waste stream in order to have a clear target
with the waste reductions. Here, in regards of households, pay-as-you-throw system could
incentivize in waste prevention in the Helsinki metropolitan area. According to this study,
and conducted interviews, it is seen as a fair system from the perspective of the
households. As has been discussed before, the measurement of waste management is
difficult. However, measuring the waste that is generated is not. Instead of being only
encouraged to prevent waste, households should be held accountable for the waste they
generate. This would give households an incentive to decrease the waste amounts. This
system has it downsides as well, hence before implementing it, a thorough research in the
Helsinki metropolitan area should be done.
In terms of waste amounts, encouraging households to buy durable products, preferably
made with recycled materials and sold without unnecessary packaging would be a good
way to decrease the generated waste in the Helsinki metropolitan area as well. Sustainable
consumption simultaneously means less used resources and materials, thus positively
influencing to the waste prevention. Problematic is of course to explicitly say what is
reasonable as the personal needs and values vary between the households. This applies also
for the necessity of the consumption – for different people necessity means different thing
and can be greatly influenced by the background, environment and income of that person.
At least two of the interviewees said in the interviews that there should not be bad
alternatives available in the stores – meaning the ones that are not environmentally friendly
in general or packaged in an unnecessary way. This kind of guidance has of course its
positive side but interferes with the freedom of markets as well as individual freedom to
choose to buy what you want. Thus, it is not very realistic option. One of the interviewees
(I15, male, 50-59, Helsinki) suggests getting tolls back in the EU borders in order to be
able to increase the prices of the cheap products coming from outside the EU and therefore
balancing the market prices and increasing the attractiveness of the production within the
EU. I15 (male, 50-59, Helsinki) argues this would most likely push towards better quality
and durability in products. As in the current EU policies, using tolls is not promoted.
Nevertheless, non-ecofriendly products could be taxed with higher rates to push producers
and brand owners to develop more sustainable products and packaging solutions.
As the EU and other research suggest (Cox et al., 2010; Hahtala, 2007), awareness raising
campaigns related to waste prevention are important and effective. These campaigns could

85
be organized by government and municipalities but also private sector. For instance a
Finnish dark bread label ‘Vaasan’ has launched this year a zero food waste campaign
called Waste Challenge and it promotes the campaign in social media but also at the bus
stops etc. This kind of advertisement is effective because many people in the Helsinki
metropolitan area use public transportation and tram and bus stops are visible in the street
view. As a consumer activating part, Vaasan challenges households to publish receipts in
social media that prevent food waste, creating stronger community engagement (Vaasan,
n.d.). In addition, it is a quite surprising campaign as the conflict of interest could be found
here. The label would probably sell more bread if some of the bread that is bought by
households would be wasted, generating more revenue. On the other hand, the company
can create positive corporate image with this kind of shared-value campaign, and increase
the sales even more. These type of activating, consumer brand leaded campaigns could be
helpful in motivating households to prevent waste in the Helsinki metropolitan area, but
should be further studied in order to get reliable results.
The attractiveness of sharing economy and second hand markets should be promoted much
more for the households and in general. It has been concluded that in Finland there is room
for this type of market development and it would support the overall economy (Sitra,
2014). The usage for households can be motivated with financial incentives as the prices
are usually lower with used items and for instance for one time rent. Simultaneously shared
services increase social interaction between households, which can increase the satisfaction
even more. However, the difficulty arises from households’ tendency of valuing
ownership. The material possession should not be what households pursue. As some of the
interviewees mentioned during the interviews, people should focus on immaterial goods
instead of materialism. To create the change, a complete turn in western consumption
patterns and culture would be required. This phenomenon should be further researched in
the Helsinki metropolitan area.
According to the conducted interviews of the study, prices in the repair services should be
competitive with the prices of new products. This would require relative prices to develop
to favor repairing and then households would perhaps be more willing to maintain and
repair their belongings, reducing generated household waste. As consumer markets are
nowadays global and market prices of products are not easily affected, local government
can support repair and sharing services with for instance financial incentives, active
promoting and affecting on general opinions, thus increase demand for the sector. This in
turn could be able to decrease the waste amounts in the Helsinki metropolitan area.
Overall, this study presents a new perspective to look into the waste prevention in the
Helsinki metropolitan area – from the viewpoint of households. Environmental behavior is
linked with waste prevention and should be encouraged in every aspect of the everyday
life. Waste prevention seems to be a distant concept for households, therefore promoting
and communicating the importance of waste prevention needs to be further addressed,
highlighted, and actively developed.
Nevertheless, among the majority current consumption habits are quite dominant and stiff,
thus the EU targets are not met without significant efforts. As it seems, also according to
this study, promoting waste prevention requires broader, coordinated commitment from all
stakeholders, not only from the public sector. Consumption is closely connected to
households’ identity and residents’ subjective privileges and affecting on these is not
simple. Thus, incentivizing consumption habits to be in-line with waste prevention targets

86
cannot rely only on public sector’s efforts. Private services and new emerging circular
economy businesses will probably bring more opportunities for households in the future
and together with public regulations, guidance and communication, the waste prevention
could, as a phenomena, have a stronger influence in the Helsinki metropolitan area.
Uncertainties and weaknesses of the study
The scope and limitations of this research are explained in the chapter 1.3. The main
limitation of this study comes with the chosen qualitative method. Due to the small sample
size, which is a common feature in the qualitative method, none of the results of this study
are generalizable to the households in the Helsinki metropolitan area or Finland. The
findings, however, indicate some possible issues, which should be further investigated in
future quantitative studies.
Furthermore, the face-to-face interview method has its limitations. As mentioned before
“Participants do not always state the truth and may say what they think the interviewer
wishes to hear.” (Anderson, 2010, p.5). The interviewees may have tried to answer what
they thought they are expected to answer. For instance, the interviewees may have verbally
agreed supporting waste prevention practices, but the actual actions the interviewees do in
the everyday life are not visible in this study. On the other hand, it remains unclear whether
some of the examples about waste prevention practices the interviewees mentioned were
conducted by the interviewees itself and if yes how regularly. For instance, having only
three options, often/sometimes/never, made the results from the questionnaire quite vague.
Even these answers were further discussed in the interview, the precise amounts were not
on the focus, hence leaving uncertainties about how often certain activities are carried out.
There can be multiple reasons why the interviewees’ answers are possibly not reflecting
their real behavior. The reasons can be, for instance, shame or societal pressure. For future
research, in the Helsinki metropolitan area, more behavior observation studies in waste
prevention are required to analyze households’ actual behavior.
One of the main theoretical as well as empirical findings is the complexity of the waste
prevention concept and how to measure it. Households are clearly not familiar with waste
prevention concept itself and find it complex to grasp. In the conducted qualitative
research, this uncertainty affected naturally interviewees’ answers if they were not capable
of sufficiently understand the topic. As a part of this uncertainty and part of narratives, the
interviewees’ actual knowledge and actions towards waste prevention based on these
findings neither can be fully assessed nor confirmed.

87
References
Academic articles Anderson, C. (2010). Presenting and Evaluating Qualitative Research. American Journal of
Pharmaceutical Education, 74(8), article 141, 1-7. Barnosky et al. (2012). Approaching a state shift in Earth’s biosphere. Nature, 486. 52-58. Barr, S. (2007). Factors influencing environmental attitudes and behaviors – A U.K. Case study of
household waste management. Environment and Behavior, 39(4), 435-473. Bartl, A. (2014). Moving from recycling to waste prevention: A review of barriers and enables.
Waste Management & Research, 32(9), 3-18. Berg, B.L. (2009). Qualitative Research Methods for the Social Sciences. Seventh Edition. Boston:
Allyn & Bacon, pp. 339-353. Bowen, G.A., 2006. Document Analysis as a Qualitative Research Method. Qualitative Research
Journal, 9(2), pp.27 – 40. Cooper, T. (2005). Slower consumption – Reflections on product life spans and the “Throwaway
Society”. Journal of Industrial Ecology, 9 (1-2), 51- 67. Cox, J., Giorgi, S., Sharp, V., Strange, K. & Wilson, D.C. (2009). Household waste prevention – a
review of evidence. Waste Management and Research, 28, 193-219. Creswell, J.W. (2007). Qualitative inquiry and research design: Choosing among five approaches.
Second Edition. Sage Publications, Inc. Dahlén, L., Vukicevic, S., Meijer, J-E., &Lagerkvist, A. (2007). Comparison of different collection
systems for sorted household waste in Sweden. Waste Management, 27(10), 1298-1305. Dahlén, L. & Lagerkvist, A. (2010). Pay as you throw – Strengths and weaknesses of weight-based
billing in household waste collection systems in Sweden. Waste Management, 30, 23-31. Druckman, A., Chitnis, M., Sorrell, S. & Jackson, T. (2011). Missing carbon reductions? Exploring
rebounds and backfire effects in UK households. Energy Policy, 39(6), 3572-3581. Ekvall, T. (2008). Waste prevention: Environmental effects and policy instruments. Nordic
workshop – waste resource management and climate actions. Ferrara, I. & Missios, P. (2012). A cross-country study of household waste prevention and
recycling: assessing the effectiveness of policy instruments. Land Economics, 88 (4), 710-744.
Gardner, B. & Abraham, C. (2007). What drives car use? A grounded theory analysis of
commuters’ reasons for driving. Transportation Research Part F, 10, 187-200. Gellynck, X., Jacobsen, R. & Verhelst, P. (2011). Identifying the key factors in increasing recycling
and reducing residual household waste: A case study of the Flemish region of Belgium. Journal of Environmental Management, 92, 2683-2690.

88
Gentil, E.C., Gallo, D. & Christensen, T.H. (2011). Environmental evaluation of municipal waste prevention. Waste Management, 31, 2371-2379.
Gjerris, M. & Gaiani, S. (2013). Household food waste in Nordic countries: Estimations and ethical
implications. Nordic Journal of Applied Ethics, 7(1), 6-23. Graham-Rowe, E., Jessop, D.C. & Sparks, P. (2014). Identifying motivations and barriers to
minimizing household food waste. Resources, Conservation and Recycling, 84, 15-23. Graham-Rowe, E., Gardner, B., Abraham, C., Skippon, S., Dittmar, H., Hutchins, R, et al. (2012).
Mainstream consumers driving plug-in battery-electric and plug-in hybrid electric cars: a qualitative analysis of responses and evaluations. Transportation Research Part A, 46, 140-153.
Hahtala, R.-L.M., Huuhtanen, S.R., Kajaster, S.A., Karhu, A.E., Kemppainen, S.H., Linsiö, O.A. &
Partti, M.-M.A. (2007). The waste prevention kit for enterprises, education, and households (WastePrevKit). WIT Transactions on Ecology and the Environment, 106, 521-529.
Katajajuuri, J-M., Silvennoinen, K., Hartikainen, H., Heikkilä, L. & Reinikainen, A. (2014). Food
waste in the Finnish food chain. Journal of Cleaner Production, 73, 322-329. Koivupuro, H-K., Hartikainen, H., Silvennoinen, K., Katajajuuri, J-M., Heikintalo, N., Reinikainen, A.
& Jalkanen, L. (2012). Influence of socio-demographical, behavioural and attitudinal factors on the amount of avoidable food waste generated in Finnish households. International Journal of Consumer Studies, 36(2), 183-191.
Kvale, S. (1996). Interviews an introduction to qualitative research interviewing. Sage Publications. Kvale, S. & Brinkmann, S. (2009). Interviews – Learning the Craft of Qualitative Research
Interviewing. Second Edition. SAGE Publications, Inc. Lilja, R. (2009). From waste prevention to promotion of material efficiency: change of discourse in
the waste policy of Finland. Journal of Cleaner Production 17, 129-136. Linderhod, V., Kooreman, P., Allers, M. & Wiersma, D. (2001). Weight-based pricing in the
collection of household waste: the Oostzaan case. Resource and Energy Economics, 23, 359-371.
Maxwell, J.A. (2005). Qualitative Research Design: An Interactive Approach. SAGE Publications.
Available at: https://books.google.co.in/books/about/Qualitative_Research_Design.html? Mishler, E.G. (1986). The analysis of interview-narratives. Narrative psychology: The storied nature
of human conduct, 233-255. McNamara, C. (1999). General guidelines for conducting interviews. Minnesota. Nurmesniemi, H., Pöykiö, R. & Keiski, R.L. (2007). A case study of waste management at the
Northern Finnish pulp and paper mill complex of Stora Enso Veitsiluoto Mills. Waste Management, 27(12), 1939-1948.
Reichenbach, J. (2008). Status and prospects of pay-as-you-throw in Europe – A review of pilot
research and implementation studies. Waste Management, 28 (12), 2809-2814. Salhofer, S., Obersteiner, G., Schneider, F. & Lebersorger, S. (2008). Potentials for the prevention
of municipal solid waste. Waste Management, 28, 245-259. Steffen et al. (2015). Planetary boundaries: Guiding human development on a changing planet.
Science, 347.

89
Sharp, V., Giorgi, S. & Wilson, D.C. (2009). Methods to monitor and evaluate household waste. Waste Management and Research, 28, 269-280.
Shove, E. & Walker, G. (2010). Governing transitions in the sustainability of everyday life.
Research Policy, 39, 471-476. Sokka, L., Antikainen, R. & Kauppi, P.E. (2007). Municipal solid waste production and composition
in Finland – Changes in the period 1960-2002 and prospects until 2020. Resources Conservation and Recycling, 50, 475-488.
Uzzell, D.L. (2000). The Psycho-Spatial Dimension of Global Environmental Problems. Journal of
Environmental Psychology, 20(4), 307-318. Wilson, D., Rodic, L., Scheinberg, A., Velis, C.A. & Alabaster, G. (2012). Comparative analysis of
solid waste management in 20 cities. Waste Management & Research, 30(3), 237-254. Zacho, K.O. & Mosgaard, M.A. (2016). Understanding the role of waste prevention in local waste
management: A literature review. Waste Management and Research, 34(10), 980-994. Zorpas, A.A. & Lasaridi, K. (2013). Measuring waste prevention. Waste Management, 33, 1047-
1056. Books Botkin, D.B., & Keller, E.A. (2011). Environmental Science: Earth as a Living Planet. Eight edition.
John Wiley & Sons, Inc. Sachs, J.D. (2015). The Age of Sustainable Development. Columbia University Press. New York. Reports and statistics Brook Lyndhurst (2009). Household Waste Prevention Evidence Review: L3 m3-3 (D) – Impact of
Household Waste Prevention Interventions and Campaigns. A report for Defra’s Waste and Resources Evidence Programme.
EEA Report (2015). Waste prevention in Europe – the status in 2014. European Environmental
Agency Report 6/2015. EU publications. EEA Report (2016). Overview of national waste prevention programmes in Europe. Country fact
sheet – Finland. October 2016. European Environmental Agency. EU (2017). Workshop Report Promoting Remanufacturing, Refurbishment, Repair and Direct
Reuse. European Union. European Commission (2010). Being wise with waste: the EU’s approach to waste management.
European Commission Directorate-General Environment. EU publications. European Commission (2012). Waste Prevention – Handbook: Guidelines on waste prevention
programmes. European Commission Directorate-General Environment. October 2012. European Commission (2017). Waste - Review of Waste Policy and Legislation. Last updated
01/12/2017. http://ec.europa.eu/environment/waste/target_review.htm Ellen MacArthur Foundation (2013a). Towards the Circular Economy – Opportunities for the
consumer goods sector, 1-111. https://www.ellenmacarthurfoundation.org/assets/downloads/publications/TCE_Report-2013.pdf

90
Ellen MacArthur Foundation (2013b). Towards the Circular Economy – Economic and business
rationale for an accelerated transition, 1-96. https://www.ellenmacarthurfoundation.org/assets/downloads/publications/Ellen-MacArthur-Foundation-Towards-the-Circular-Economy-vol.1.pdf
Eurostat (2016). File: Municipal waste generated by country in 2005 and 2016 (kg per capita).
http://ec.europa.eu/eurostat/statistics-explained/index.php/File:Municipal_waste_generated_by_country_in_2005_and_2016,_sorted_by_2016_level_(kg_per_capita).png
Helsingin Kaupunki (2009). Helsingin ulkoilureittien ja puistojen roskaantuminen. Helsingin
kaupungin ympäristökeskuksen julkaisuja 2/2009. https://www.hel.fi/static/ymk/julkaisut/julkaisu-02-09.pdf
HSY Report (2018). HSY:n jätehuollon vuositilasto 2017. Helsingin seudun ympäristöpalvelut -
kuntayhtymä. HSY database (2016). Pääkaupunkiseudun jätevirrat - Jätetilastot 2016. Retrieved April 20th 2018
from https://www.pksjatevirrat.fi/?mo=wastestats McKinsey (2015). Stemming the Tide: Land-based strategies for a plastic-free ocean. McKinsey
Center for Business and Environment. Ocean Conservancy. Published September 2015. https://www.mckinsey.com/~/media/mckinsey/business%20functions/sustainability%20and%20resource%20productivity/our%20insights/saving%20the%20ocean%20from%20plastic%20waste/stemming%20the%20tide%20full%20report.ashx
Ministry of the Environment (2008). Kohti kierrätysyhteiskuntaa - Valtakunnallinen jätesuunnitelma
vuoteen 2016 (Eng. Towards a recycling society: The National Waste Management Plan until 2016). Suomen Ympäristö, 32, 1-54.
Ministry of the Environment (2018). Kierrätyksestä kiertotalouteen – Valtakunnallinen
jätesuunnitelma vuoteen 2023. (Eng. From recycling to a circular economy – The National Waste Plan 2030). Suomen ympäristö 1/2018, 1-62.
Laaksonen, J., Merilehto, K., Pietarinen, A. & Salmenperä, H. (2017). Taustaraportti –
Valtakunnallinen jätesuunnitelma vuoteen 2023 (Eng. Background report – The National Waste Management Plan until 2023). Suomen ympäristö, 3, 1-107.
Sitra (2014). Kiertotalouden mahdollisuudet Suomelle. Sitran selvityksiä, 84, 1-72. Statistics Finland (2014). Väestöntiheys kunnittain 2014. Retrieved February 11th 2018 from
http://tilastokoulu.stat.fi/verkkokoulu_v2.xql?page_type=esim&course_id=tkoulu_teemak&lesson_id=9&subject_id=5&example_id=1
Statistics Finland (2016). Yhdyskuntajätekertymä 2016, tonnia. Statistics Finland’s PX-Web
databases. Retrieved February 11th 2018 from http://tilastokeskus.fi/til/jate/tau.html Statistics Finland (2017). Väestö. Väestörakenne 31.12.2017. Updated 19.04.2018. Retrieved May
16th 2018 from https://www.tilastokeskus.fi/tup/suoluk/suoluk_vaesto.html Kauniainen, (n.d.). Kaupunki ja päätöksenteko - Tietoa kaupungista. Kauniaisten kaupungin
virallinen nettisivu. Retrieved May 16th 2018 from https://www.kauniainen.fi/kaupunki_ja_paatoksenteko/tietoa_kaupungista
Tucker, P. and Douglas, P. (2007). Understanding household waste prevention behaviour – Final Report. University of Paisley Environmental Technology Group. Final Research Report, 1-19.

91
Mikkonen (2017). Tutkimusraportti Vaatelahjoittajatutkimus 2017 UFF, SPR ja Fida. Taloustutkimus. http://www.vala.fi/userData/vala/tiedotteet/KOOSTE_Vaatelahjoittajatutkimus_2017.pdf
UNESCO (2016). Education for people and planet. Creating sustainable futures for all. Global
Education Monitoring Report. UNESCO, 2016, Second edition, 1-620. http://unesdoc.unesco.org/images/0024/002457/245752e.pdf
WFD (2008). Directive 2008/98/EC of the European Parliament and of the council of 19 November
2008 on waste and repealing certain Directives. Official Journal of the European Union. http://eur-lex.europa.eu/LexUriServ/LexUriServ.do?uri=OJ:L:2008:312:0003:0030:en:PDF
WWF Report (2016). Living Planet Report 2016 – Risk and resilience in a new era. WWF
International. https://www.wnf.nl/custom/LPR_2016_fullreport/ Websites Club of Rome (2016). A new Club of Rome study on the circular economy and benefits for society.
Retrieved April 19th 2018 from http://www.clubofrome.org/2016/03/07/a-new-club-of-rome-study-on-the-circular-economy-and-benefits-for-society/
Ellen MacArthur Foundation (n.d.). News - Circular economy. Published 06.06.2012. Retrieved
April 10th 2018 from https://www.ellenmacarthurfoundation.org/news/circular-economy EEA (2017). Municipal waste management across European countries. Published 14/11/2016. Last
modified 23.05.2017. Retrieved March 8th 2018 from https://www.eea.europa.eu/themes/waste/municipal-waste
EPA (n.d.). Reducing and Reusing Basics. Retrieved April 10th 2018 from
https://www.epa.gov/recycle/reducing-and-reusing-basics European Commission (2016a). The Waste Incineration Directive. Last updated 20.04.2016.
Retrieved April 19th 2018 from http://ec.europa.eu/environment/archives/air/stationary/wid/legislation.htm
European Commission (2016b). Landfill of waste. Last updated 09.06.2016. Retrieved April 19th
2018 from http://ec.europa.eu/environment/waste/landfill/useful-information.htm European Commission (2018a). Environment – Waste. European Commission website. Last
updated 19/02/2018. Retrieved March 8th 2018 from http://ec.europa.eu/environment/waste/ European Commission (2018b). Environment – Circular Economy : Implementation of the Circular
Economy Action Plan. Last updated 15/02/2018. Retrieved March 5th 2018 from http://ec.europa.eu/environment/circular-economy/index_en.htm
European Commission (2018c). Framework Legislation - Shipment of waste. Last updated
15.02.2018. Retrieved April 20th 2018 from http://ec.europa.eu/environment/waste/shipments/
ELY-keskus (2016). Tiedotteet 2016. Roskaaminen levähdysalueilla iso ongelma – häviäjänä
tienkäyttäjät. Published 16.06.2016. Retrieved April 20th 2018 from https://www.ely-keskus.fi/web/ely/-/roskaaminen-levahdysalueilla-iso-ongelma-haviajana-tienkayttajat-varsinais-suomi-ja-satakunta-
Finnish Environment Institute (2016). EU:lta merkittävä rahoitus Suomelle kiertotalouden
edistämiseen – lähes 19 miljoonan euron hanke käynnistyy. Published 28.11.2016. Retrieved April 19th 2018 from http://www.syke.fi/fi-

92
FI/Tutkimus__kehittaminen/Kulutus_ja_tuotanto/EUlta_merkittava_rahoitus_Suomelle_kiert(41243)
Helsingin Uutiset (2017). Älä jätä roskia luontoon – Hesy: Maastoon jätetyt roskat tappavat eläimiä.
Published 11.07.2018. Retrieved April 20th 2018 from: https://www.helsinginuutiset.fi/artikkeli/539184-ala-jata-roskia-luontoon-hesy-maastoon-jatetyt-roskat-tappavat-elaimia
HS (2018a). Sukeltajan video paljastaa Balin paratiisi-kohteen karun todellisuuden. Helsingin
Sanomat. Published 06.03.2018. Retrieved April 10th 2018 from https://www.hs.fi/ulkomaat/art-2000005593190.html
HS (2018b). Maailman merissä velloo viisi valtavaa jätepyörrettä – Mitä muovijätteelle voi tehdä?
Helsingin Sanomat. Published 23.03.2018. Retrieved April 10th 2018 from https://www.hs.fi/ulkomaat/art-2000005615512.html
HS (2018c). Tyynenmeren roskapyörre paljastui jopa kuusitoista kertaa suuremmaksi kuin luultiin –
Meressä vellova kaatopaikka on lähes viisinkertainen Suomen pinta-alaan nähden. Helsingin Sanomat. Published 22.03.2018. Retrieved April 10th 2018 from https://www.hs.fi/ulkomaat/art-2000005614516.html
HS (2018d). Muovia on merissä kohta jopa enemmän kuin kalaa, ja osa siitä päätyy ruoka-aineisiin
– HS:n grafiikat kertovat, mitä se tarkoittaa eläimille ja ihmisille. Helsingin Sanomat. Published 14.01.2018 Retrieved April 10th 2018 from https://www.hs.fi/ulkomaat/art-2000005523945.html
HS (2018e). Maatuvatko biojätepussit ja minne laitan sekajätteen, jos siirryn ostoksilla
kangaskasseihin? HS kysyi asiantuntijoilta, kuinka kierrättää oikein. Helsingin Sanomat. Published 07.04.2018. Retrieved April 10th from https://www.hs.fi/kotimaa/art-2000005632472.html
HS (2018f). Pitääkö jogurttipurkki pestä tai hedelmäpussin metalliosa irrottaa? Asiantuntija vastaa
yhdeksään kysymykseen muovin kierrättämisestä. Helsingin Sanomat. Published 05.02.2018. Retrieved April 10th 2018 from https://www.hs.fi/kotimaa/art-2000005553010.html
HS (2018g). Suomalaisten roskapussissa jopa 80 prosenttia on tavaraa, jonka voisi kierrättää –
laiskimpia lajittelijoita ovat alle nelikymppiset. Helsingin Sanomat. Published 16.04.2018. Retrieved April 16th from https://www.hs.fi/kotimaa/art-2000005643170.html
HS (2018h). Törkyiset kierrätysastiat tursuvat kaduille ja pusikoihin Helsingin ympäristössä –
muovin kierrätyksestä tuli sekasotku. Helsingin Sanomat. Published 23.01.2018. Retrieved April 10th from https://www.hs.fi/kaupunki/art-2000005534861.html
HS (2018i). Kulutamme itsemme kuoliaiksi, jyrisee ympäristöprofessori Lassi Linnanen: Suomessa
on vallalla harhainen mantra, joka syöksee koko planeetan perikatoon. Helsingin Sanomat. Published 24.02.2018. Retrieved April 20th 2018 from: https://www.hs.fi/elama/art-2000005579140.html
HSY (2017). Jätehuollon järjestäminen. Last updated 23.10.2017. Retrieved April 18th 2018 from:
https://www.hsy.fi/fi/asiantuntijalle/jatehuolto/Sivut/default.aspx HSY (n.d.). Vähennä jätettä kotona. Retrieved April 19th 2018 from
https://www.hsy.fi/sites/Esitteet/EsitteetKatalogi/vahenna_jatetta_kotona.pdf Motiva (2017). Materiaalitehokkuus. Motiva - Valtion kestävän kehityksen yhtiö. Last updated
14.9.2017. Retrieved April 20th 2018 from https://www.motiva.fi/ratkaisut/materiaalitehokkuus

93
mtv (2013). ”Ihan käsittämätöntä sikailua! Pääkaupunkiseudulla roskataan röyhkeästi. Published 27.09.2013. Retrieved April 10th 2018 from https://www.studio55.fi/tastapuhutaan/article/ihan-kasittamatonta-sikailua-paakaupunkiseudulla-roskataan-royhkeasti/127016
Salmenperä, H. (2017). Kierrätyksen Suomi-Ruotsi maaottelu. Finnish Environment Institute.
Published 18.12.2017. Retrieved April 20th 2018 from http://www.syke.fi/fi-FI/Ajankohtaista/Ratkaisujablogi/Hanna_Salmenpera_Kierratyksen_SuomiRuots(45462)
SLL (n.d.). Jätepolitiikka. Retrieved March 19th 2018 from https://www.sll.fi/mita-me-
teemme/kohtuutalous/jatteet/jatepolitiikka The Guardian (2016). Waste not want not: Sweden to give tax breaks for repairs. Published
19.09.2016. Retrieved 30th May 2018 from https://www.theguardian.com/world/2016/sep/19/waste-not-want-not-sweden-tax-breaks-repairs
Tekniikkatalous (2012). Roskaaminen aiheuttaa Helsingille jättikustannukset. Published
25.03.2018. Retrieved April 10th 2018 from https://www.tekniikkatalous.fi/tekniikka/rakennus/2012-04-25/Roskaaminen-aiheuttaa-Helsingille-j%C3%A4ttikustannukset-3309031.html
Useless (n.d.). Useless website. Retrieved May 16th 2018 from https://useless.fi/en/ Vaasan (n.d.) Hävikkihaaste. Retrieved May 14th 2018 from https://www.vaasan.fi/havikkihaaste/ Wageningen University & Research (2015). AgriSan – Increasing Urban Self-Sufficiency by
Integrating Urban Agriculture and New Sanitation. Retrieved May 11th 2018 from https://www.wur.nl/en/project/AgriSan-Increasing-Urban-Self-Sufficiency-by-Integrating-Urban-Agriculture-and-New-Sanitation.htm
WWF (2018). Suomen ylikulutuspäivä on tänään – jos kaikki eläisivät kuin suomalaiset
tarvitsisimme 3.6 maapalloa. Published 11.04.2018. Retrieved April 20th 2018 from https://wwf.fi/wwf-suomi/viestinta/uutiset-ja-tiedotteet/Suomalaisten-ylikulutuspaiva-on-tanaan---jos-kaikki-elaisivat-kuin-suomalaiset--tarvitsisimme-3-6-maapalloa-3439.a
YLE (2013). Saaristomeren rannat täynnä tupakantumppeja. Published 8.2.2013. Retrieved April
10th 2018 from https://yle.fi/uutiset/3-6486994 YLE (2018). Jätettä kertyy kodeissa huippuvuosien tapaan – Kaatopaikkakasat hävisivät, mutta
jäte palaa usein turhaan. Published 15.01.2018. Retrieved April 19th 2018 from https://yle.fi/uutiset/3-10023644


95
Appendix A
Background questionnaire for the interviewees
Personal data
1. Gender
Female
Male
2. Age
20-29
30-39
40-49
50-59
60- +
3. Highest completed or ongoing
education
Elementary school
High school
Bachelor’s degree
Master’s degree
PhD
4. City
Helsinki
Espoo
Kauniainen
Vantaa
5. Household size, person
1
2
3
4
5 or more
whereas children
0
1
2
3 or more
6. House type
Apartment house
Detached house
Semi-detached house
Row house
7. House size
Studio
Two-room flat
Three-room flat
Four-room flat
Bigger than four-room flat
Theme - Consumption
8. What do you think about Western consumption culture? Choose one option
Good because upholds economy
Consumption should slightly decrease
Consumption should radically decrease
9. What do you think about Finnish consumption? Choose one option
Good because upholds economy
Consumption should slightly decrease

96
Consumption should radically decrease
10. What do you think about your own consumption? Choose one option
I consume services and products more than others
I consume services and products as much as others
I consume services and products less than others
11. Which of the following options mostly influence on your decision to buy a certain
commodity or product?
Price
Material
Environmentally friendliness
Newness / trendiness
Durability
Repairability
The amount or material of possible packaging
Necessity
12. Do you use consumer good’s rental, loaning or sharing services (such as clothes
rental, equipment rental, library, art rental shop, car sharing service)? Choose one
option
Often
Sometimes
Never
13. Which of the following repair and maintenance services do you use?
Shoemaker’s services
Dressmaker’s services
Furniture repair
Electronics repair
Home appliance repair
14. Do you buy used commodities or products from for instance flea markets, Second
hand –shops, antiquarian, Facebook-groups, Reuse-center or tori.fi? Choose one
option
Often
Sometimes
Never
Theme – Recycling
15. Do you take items that are useless to you, to Second hand-stores, antiquarians,
Reuse-center or sell at flea markets, Facebook-groups or tori.fi? Choose one option
Often
Sometimes
Never

97
16. What type of household waste materials can be recycled at your housing
cooperative?
Bio-waste
Paper
Cardboard
Metal
Glass
Plastic
17. What household materials you recycle yourself?
Bio-waste
Paper
Cardboard
Metal
Glass
Plastic
+
18. What is your relationship to nature? Choose one option
Highlighted (I like nature, close to heart)
Neutral
Distant (I don’t like, distant matter)
19. Are you worried about environmental threats? Choose one option
Yes, a lot
Yes, a bit
Not at all
20. Choose one option from following claims
Environmental protection and economic growth are possible at the same time
Economic growth should be put first even if environmental state would worsen
Environmental protection should be put first even if economic situation would
worsen
Interview questions for the households
1. Refer to background question 10. Can you explain your answer related to your own
consumption?
2. Refer to background question 11. Why these things influence most often on your
decision making when buying? (Why not the others?)
3. Refer to background question 12. What kind of commodity rental, loaning or
sharing services do you use? If never: Can you explain why?

98
4. Refer to background question 13. Why do you use these exact repair and
maintenance services? If uses none: Can you explain why?
5. Refer to background question 14. Can you give examples what kind of used items
do you buy and from where? If never: Can you explain why?
6. How would you describe sustainable consumption?
7. How do you relate to the amount of belongings you have in your households
including possible storages?
8. Refer to the background questions 8 and 9. Why do you think decreasing
consumption is important? If not: Can you explain why?
9. Have you heard about term called waste prevention? Can you explain what does it
mean?
10. Why do you think it would be important to decrease waste amounts?
11. How could you personally prevent waste? / What kind of practical ways do you
know? (Do you use refillable packages, durable bags for fruits, canvas bags, some
other things to prevent waste?)
12. Where have you received the knowledge how to prevent waste? If you have not,
where would you like to find this information?
13. Apartment and row houses: What would you think if the waste would be charged
separately from households by weight or amount of waste? / Detached houses:
What do you think about the current system where you pay for the amount you
personally generate?
14. What would you think about different economic incentives such as subsidies for
consumers for using durable goods (or for companies making durable goods) or
introducing tax relief for repair and maintenance services?
15. Who is/are responsible for how much waste is generated?
16. How does waste recycling differ from waste prevention? Why / why not?
17. Refer to background question 15. Why do you sell or give away your items (instead
of throwing them to trash)?
18. Refer to background question 17. Why do you recycle / why not?
+ After this would you like to know more about these topics? Has your interest grown,
lowered or stayed the same regarding these topics?
+ Do you have anything to add? What did you think about the interview?