Embed Size (px)
Citation preview

He Kainga Oranga/Housing and Health Research Programme
Healthy Housing Index Pilot Study
Final Report
March 2007
Michael Keall Michael Baker
Philippa Howden-Chapman Malcolm Cunningham
Chris Cunningham
He Kainga Oranga / Housing and Health Research Programme Department of Public Health, University of Otago, Wellington
© 2006. He Kainga Oranga / Housing and Health Research Programme Article may be quoted freely provided due acknowledgement is given

Healthy Housing Index Pilot Study Final Report 2
Address for Correspondence Dr Michael Keall Housing and Health Research Programme Department of Public Health University of Otago, Wellington Box 7343, Wellington South Phone: 04 385 5999 X 6794 Email: [email protected] The Healthy Housing Index team Housing and Health Research Programme Dr Michael Keall Dr Michael Baker Professor Philippa Howden-Chapman Previous team members: Sarah Bierre, Martin Kennedy, Dr Anna Sansom, Jo-
Anne Robinson, Helen Viggers, Dr Carl Snyman Additional support provided by: Rebecca Osborne, Gina Pene, Vonda Taumata,
Robin Turner, Clare Salmond, Simon Hales, Sarah Nicholls
Building Research Association of New Zealand Dr Malcolm Cunningham Massey University Professor Chris Cunningham Acknowledgements The Healthy Housing Index Team would like to acknowledge the support of Hutt Valley District Health Board, the Accident Compensation Corporation, the Hutt City Council and the Health Research Council of New Zealand for their involvement and support in this study. We would also like to thank all of the participants who consented to the building inspections, and the community groups that assisted us in recruiting them. Thanks also to the Stokes Valley Medical Centre, Naenae Medical Centre, Manuka Health Centre, Johnsonville Medical Centre, Fitzherbert Rd Medical Centre, Bulls Medical Centre, City Medical Centre, Petone Union Health, Petone Medical Centre, Pomare Union Health, Strand Care, Upper Hutt Health Centre, Waterloo Surgery, Whai Oranga o te Iwi, Pretoria St Surgery, Ropata Medical Centre, Kopata Medical Centre, Karori Medical Centre, Epuni Medical Centre, Ferguson Drive Medical Centre, Ngaio Medical Centre, Taita Medical Centre, Wainuiomata Health Centre, Waiwhetu Medical Centre, Thorndon Medical Centre, Epuni Medical Centre, Eastbourne Medical Centre, Avalon Medical Centre for providing patient information for the Pilot. Finally, thanks to Dr Carl Snyman for his work gathering data on GP visits and establishing new effective protocols for gathering such data.
Healthy Housing Index Pilot Study Final Report 3
1 CONTENTS
1 CONTENTS........................................................................................................... 3
2 EXECUTIVE SUMMARY....................................................................................... 5
3 INTRODUCTION................................................................................................... 7
4 BACKGROUND .................................................................................................... 7
4.1 Stakeholder discussions ................................................................................................. 7
4.2 Setting the boundaries of the Index.............................................................................. 9
5 METHODS .......................................................................................................... 12
5.1 The house survey questionnaire.................................................................................. 12
5.2 Sampling........................................................................................................................ 12
5.3 General/HCC sample ................................................................................................... 12
5.4 Recruitment of Māori and Pacific participants......................................................... 15
5.5 Recruitment of Māori participants............................................................................. 15
5.6 Recruitment of Pacific participants............................................................................ 17
5.7 Constitution of sample ................................................................................................. 18
5.8 House surveys ............................................................................................................... 20 5.8.1 House inspectors .................................................................................................... 20 5.8.2 HHI house survey questionnaire ............................................................................ 20 5.8.3 House inspections................................................................................................... 20 5.8.4 Surveying the general population sample .............................................................. 21 5.8.5 Surveying the Māori and Pacific households......................................................... 21 5.8.6 Timing .................................................................................................................... 21 5.8.7 Issues arising regarding recruitment and inspections............................................. 22
5.9 Remedial action ............................................................................................................ 23
5.10 Accessing data on health outcomes............................................................................. 23 5.10.1 Hospitalisations ...................................................................................................... 24 5.10.2 ACC reported injuries ............................................................................................ 24 5.10.3 GP visits ................................................................................................................. 24
5.11 Methods for creating indices ....................................................................................... 24
5.12 Formation of injury hazards index............................................................................. 25
5.13 Measuring associations between reported injury and the injury hazards index ... 26

Healthy Housing Index Pilot Study Final Report 4
6 RESULTS............................................................................................................ 28
6.1 Descriptive results of the houses and occupants included in the sample ................ 28 6.1.1 Ethnicity ................................................................................................................. 28 6.1.2 Smoking ................................................................................................................. 28 6.1.3 Dampness ............................................................................................................... 29 6.1.4 Insulation................................................................................................................ 29 6.1.5 Mould ..................................................................................................................... 30 6.1.6 Heating ................................................................................................................... 30 6.1.7 Lack of insulation and presence of mould ............................................................. 30 6.1.8 Fire safety............................................................................................................... 31 6.1.9 Occupancy, safety and socioeconomic attributes................................................... 31
6.2 Inspectors’ comments .................................................................................................. 32
6.3 The injury hazards index and home injury occurrence ........................................... 33
7 DISCUSSION ...................................................................................................... 36
7.1 Discussion of associations between reported injury and the injury hazards index 36
8 CURRENT AND FUTURE APPLICATIONS ....................................................... 38
8.1 Whanau ora tool ........................................................................................................... 38
8.2 Statistics New Zealand Housing Survey..................................................................... 38
8.3 Other applications ........................................................................................................ 38
8.4 Benefits of this pilot project to other HHRP projects............................................... 38
9 CONCLUSIONS.................................................................................................. 40
9.1 Objectives...................................................................................................................... 40
9.2 The questionnaire......................................................................................................... 40
9.3 Recruitment .................................................................................................................. 41
9.4 Linking to health data.................................................................................................. 41
10 REFERENCES ................................................................................................ 43
11 APPENDIX: QUESTIONNAIRE USED IN THE PILOT ................................... 45

Healthy Housing Index Pilot Study Final Report 5
2 Executive Summary
The Healthy Housing Index Pilot Study was a collaborative study conducted by the He Kainga Oranga/Housing and Health Research Programme (HHRP) and the Building Research Association of New Zealand (BRANZ). Hutt Valley District Health Board, the Accident Compensation Corporation, the Hutt City Council and the Health Research Council of New Zealand provided funding and support for the study. The aim of this pilot study was to investigate the feasibility of creating a Healthy Housing Index (HHI), which is an indicator of housing condition related to the health of the occupants. It provides a measure of the ‘healthiness’ and ‘safety’ of a house or, conversely, provides a measure of how likely it is that occupants will suffer ill health or injuries due to housing factor(s). The most reliable method of surveying and calculating indices was explored in the pilot study, along with the development of an injury hazards sub-index, and the measurement of associations between this injury hazards index and home injury outcomes. The HHI will provide a practical tool for understanding the link between housing and health – with a focus on building condition –, and is intended for use by the Accident Compensation Corporation (ACC), Local and Central Government, Hutt Valley District Health Board (HVDHB), Regional Public Health (RPH), Primary Care Providers, large landlords such as Housing New Zealand and Iwi and other agencies involved in the housing and/or health and safety sector. The HHI has been designed to rate the house (but not the occupants or the way they might live within that house). It is intended that the Index will be used at both the individual house level and at an aggregate level. At the individual level the HHI will allow the identification of high need homes and families. At the aggregate level it will allow a quantitative assessment of the healthiness of the housing stock in a community or a landlord’s portfolio to provide a basis on which to target resources to reduce inequalities in health. The pilot study consists of three main phases. Phase 1 was the conceptual development of the HHI. It involved discussions with various stakeholders and interested parties; reference to housing and health literature and to the British Housing, Health and Safety Rating System (British HHSRS); and drew on the knowledge and expertise of the HHI team. Phase 2 was the collection of house condition data. This involved recruitment and assessment of 102 houses in the Lower Hutt area, with 259 occupants. Houses were recruited using a deliberate sampling method to target houses with Māori occupants, houses with Pacific occupants and a general sample selected to provide a range of housing types and locations. Assessments were completed by building inspectors (97 houses) and/or lay (non-building professional) inspectors (54 houses) using the HHI house survey questionnaire. The house survey questionnaire consisted of questions about the physical condition of the house, namely: (i) structural soundness; (ii) adequacy of services; (iii) warmth and dryness; (iv) safety; and (v) protection from external hazards. Phase 3 of the pilot study was the creation of an injury hazards Index using the house data and the examination of associations between this Index and ACC home injury data. As the pilot data collected were from a purposive sample that sought to include a good representation of the housing of Māori and Pacific residents, the pilot should not be seen as being representative of Hutt Valley housing generally. Nevertheless, the validation of an index such as this requires a sample with a wide range of housing conditions, in which respect this pilot sample is well suited. The HHI project has been reviewed by Professor David Ormandy, the project manager

Healthy Housing Index Pilot Study Final Report 6
and chief architect of the British HHSRS. This consultation has helped guide planning for the development of the index and plan for future development and applications of the HHI. The housing inspections showed that there were likely to be detrimental health effects associated with housing features, particularly those houses with Māori and Pacific occupants. Of the whole sample, over one quarter of the houses were damp. Although the majority of houses (92%) have ceiling insulation, one third (66%) had no wall insulation and over half (53%) had no floor insulation. Over half (54%) of the houses in the sample had evidence of mould. The majority of the houses in the study had some form of heating – only 5% had no heating whatsoever. Most (88%) had fixed heaters in their homes. There was visible mould and a lack of insulation in many of the houses with Māori occupants (62%) and those with Pacific occupants (93%), compared to one in five (21%) of the houses in the general sample. Nearly half (48%) of all the houses in the sample had mould and lacked insulation. Safety issues included: • Houses with pathway problems (e.g. too steep, slippery, overgrown) (34%) • Houses with internal stair hazards (e.g. insecure carpeting, steps between bathroom and
bedroom) (3%) • Houses with structurally unsafe external steps (3%) An injury hazards index was formed from a count of all injury hazards in the house that were considered to be positively associated with reported injury. Linking the hazard index with ACC data on treated home injury events showed that for each additional home injury hazard, there was an estimated increase of 22% in the odds of injury occurrence (with 95% CI: 6% to 41%). This result suggests that addressing injury hazards in the home may be effective in reducing home injury. There are a number of potentially confounding factors that may affect relationships found between the existence of home hazards and injury occurrence. These factors need to be taken into account when future evaluations are planned. Since the last report (December 2005) was produced, the pilot study has been completed by undertaking the following steps: • creation of an injury hazards Index; • the collation of ACC data for the validation phase of the project; • the development of protocols for collecting GP data; • measurement of associations between home injury and the injury hazards index; • writing up and submission of the injury hazards index sub-study to an international peer-
reviewed journal; • community consultations in Taranaki and Christchurch to have the HHI adopted as a
measurement and remediation tool in the Taranaki Healthy Homes Programme and the Christchurch City Council public housing stock;
• consultations with HNZC to access administrative data on housing quality to form indices of housing quality of the HNZC stock for use in the analysis of associations between housing and health of HNZC tenants.
This document reports on Phases of the HHI pilot study and plans for the future applications of the HHI. Results of the Pilot have already been reported at international and national conferences (Bierre et al, 2004; Keall et al, 2006a; Keall et al, 2006b) and submitted to peer-reviewed journals (Bierre et al, submitted; Keall et al, submitted).

Healthy Housing Index Pilot Study Final Report 7
3 Introduction
This is the fourth and final report from The Housing and Health Research Programme on the pilot study for developing the Healthy Housing Index. The rationale for the project, the methods and the main findings, are summarised below. We then discuss progress since the last report, and the prospects for further development. 4 Background
The HHI project began when Dr Malcolm Cunningham of the Building Research Association of New Zealand (BRANZ) approached the Housing and Health Research Programme (HHRP) suggesting the idea of a Healthy Housing Index (HHI). Early collaborative work between BRANZ and the HHRP including meeting with prospective stakeholders identified the lack of a well-defined, quantitative, easy to use, reliable and valid measure of unhealthy or unsafe housing. The aim of this pilot study is to investigate the feasibility of creating a HHI in the Lower Hutt Valley using housing factors that indicate the ‘healthiness’ of a house or, conversely, that provide a measure of how likely it is that occupants will suffer ill health or accidents due to housing factor(s). Discussions with a wide range of stakeholders helped to ensure the project developed in such a way that the Index would be useful for many groups with an interest in housing and health, and could promote change and action in the most suitable way. The Index has been informed by other work in this area, in particular the British HHSRS (Ormandy, 2002; Stewart, 2002) BRANZ’s House Condition Survey, and the New Zealand Standard NZS 4102:1996, “Safer House Design (guidelines to reduce injury at home)” (NZS 4102:1996, 1996). At the individual house level the HHI will allow the identification of high-need homes and families. At the group level it will allow a quantitative assessment of the healthiness of the housing stock in a community or a landlord’s portfolio to provide a basis on which to target resources to reduce inequalities in health. The HHI applies to the house (but not the occupants or the way they might live within that house).
4.1 Stakeholder discussions
An early part of the study consisted of discussions with various interest groups and stakeholders in the housing and health arena. This formed part of a needs-based assessment to ensure the Index will be useful for interest groups and promote change and action in the most suitable way. The stakeholders/interest groups consulted included: • Accident Compensation Corporation (ACC) • Building Industry Authority (BIA) • Building Research Association of New Zealand (BRANZ) • Energy Efficiency and Conservation Authority (EECA) • Hutt Valley District Health Board (HVDHB) • Hutt City Council (HCC) • Housing New Zealand Corporation National Office (HNZC) • Housing New Zealand Corporation Regional Office (HNZC)
Healthy Housing Index Pilot Study Final Report 8
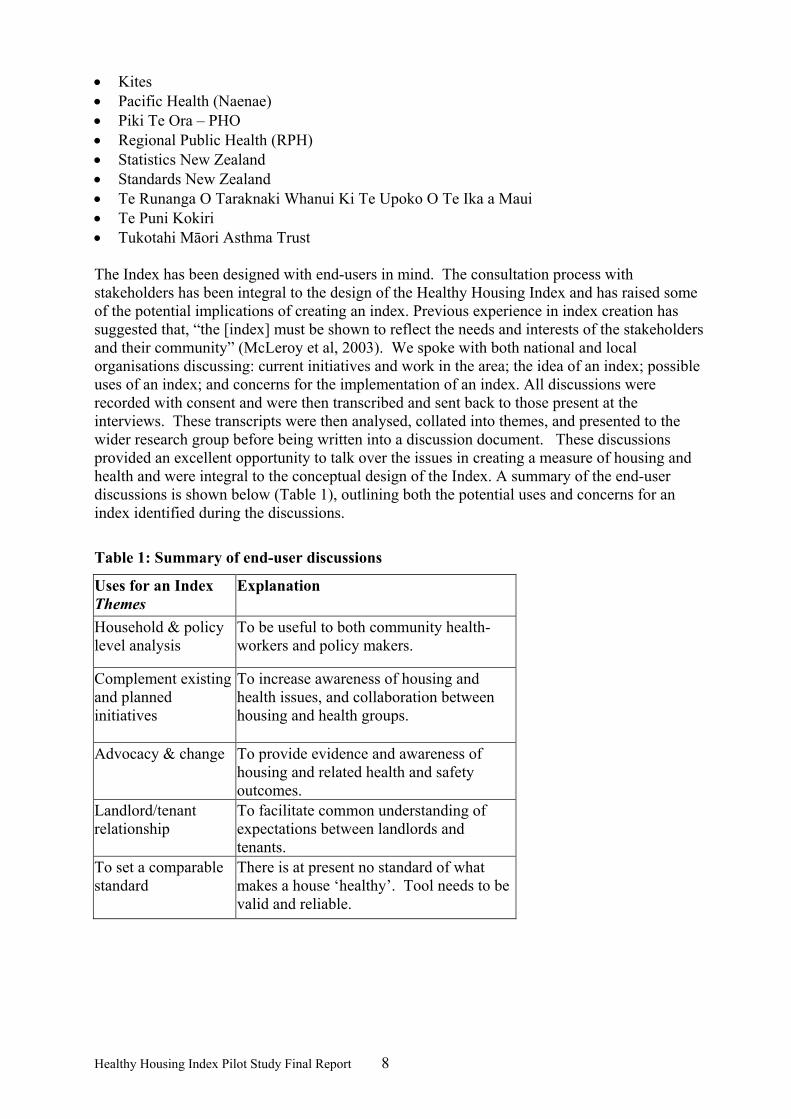
• Kites • Pacific Health (Naenae) • Piki Te Ora – PHO • Regional Public Health (RPH) • Statistics New Zealand • Standards New Zealand • Te Runanga O Taraknaki Whanui Ki Te Upoko O Te Ika a Maui • Te Puni Kokiri • Tukotahi Māori Asthma Trust The Index has been designed with end-users in mind. The consultation process with stakeholders has been integral to the design of the Healthy Housing Index and has raised some of the potential implications of creating an index. Previous experience in index creation has suggested that, “the [index] must be shown to reflect the needs and interests of the stakeholders and their community” (McLeroy et al, 2003). We spoke with both national and local organisations discussing: current initiatives and work in the area; the idea of an index; possible uses of an index; and concerns for the implementation of an index. All discussions were recorded with consent and were then transcribed and sent back to those present at the interviews. These transcripts were then analysed, collated into themes, and presented to the wider research group before being written into a discussion document. These discussions provided an excellent opportunity to talk over the issues in creating a measure of housing and health and were integral to the conceptual design of the Index. A summary of the end-user discussions is shown below (Table 1), outlining both the potential uses and concerns for an index identified during the discussions.
Table 1: Summary of end-user discussions
Uses for an Index Themes
Explanation
Household & policy level analysis
To be useful to both community health-workers and policy makers.
Complement existing and planned initiatives
To increase awareness of housing and health issues, and collaboration between housing and health groups.
Advocacy & change To provide evidence and awareness of housing and related health and safety outcomes.
Landlord/tenant relationship
To facilitate common understanding of expectations between landlords and tenants.
To set a comparable standard
There is at present no standard of what makes a house ‘healthy’. Tool needs to be valid and reliable.

Healthy Housing Index Pilot Study Final Report 9
Concerns for an Index Themes
Explanation
Holistic nature of housing
Housing quality is related to other factors that influence health
The domain of housing
It is difficult to isolate building condition from the occupant of the house and the social, political, economic, and cultural factors in housing.
Enforcement Making the Index voluntary could mean it is a ‘tool with no teeth’
Process of creation The implications of ‘inspecting’ a home for the participants
The implications of the created Index
The relationship between quality and affordability, and the possibility of stigma.
4.2 Setting the boundaries of the Index
Defining the scope of what a healthy house might be was the starting point for the conceptual development and involved: discussions with end-users; reference to the British HHSRS; reference to literature on housing and health; and the multi-disciplinary skills in the research group. The HHI is situated in the arena of Building Quality and Public Health and defines housing quality as an absence of factors that have the potential to negatively affect the health, safety and well-being of the occupant. Using this public health definition of housing quality, we identified the factors that can influence what ‘healthy housing’ might mean to frame the options for the scope of the HHI. These factors were then summarised into five domains, namely: supportive neighbourhood; access to housing; suitability for purpose; health promoting behaviour; and building condition. It was decided that the Index should be based on the building condition domain, that is, the specific physical and measurable components of a house (Figure 1). This decision was based on the need to define clearly what the Index would and would not measure, and was made with an awareness of existing measures (e.g. crowding measures such as the Canadian National Occupancy Standard). This approach excluded factors relating to how the house is used in an attempt to move away from focusing on behaviour and potential victim blaming for the way a house was used. Also technically, as far as possible we want to describe the outcomes of health and safety in the home in terms of the semi-independent factors of house condition on the one hand and behavioural factors on the other. In doing this we acknowledge that physical housing condition is a single but important part of the picture of housing and health, and that the Healthy Housing Index will need to be used within a broader framework of what contributes to both accessing, maintaining, and using a ‘healthy’ home in a ‘healthy’ neighbourhood.

Healthy Housing Index Pilot Study Final Report 10
Figure 1: The five ‘fingers’ or axes of housing condition. A conceptual diagram showing some of the factors which influence healthy housing. The Healthy Housing Index will be framed within the fifth finger of the domains, the domain of building condition.
Having identified the need for the Index, reviewed existing work in the field, and consulted stakeholders, the “boundaries” of the Index were established, a process documented in Bierre et al. (submitted). It was decided that the Index should be based on the building condition domain, that is, the specific physical components of a house which can be measured. This decision was based on the need to define clearly what the Index would and would not measure. Within the domain ‘building condition’, we identified five components for the Index namely: (i) structural soundness, (ii) adequate services, (iii) warmth and dryness, (iv) safety, and (v) protection from external and environmental hazards. Literature reviews (Howden-Chapman, 2004; Osborne et al, 2003), and the health and safety risks identified in the British HHSRS were used to identify the health and safety risks of house conditions as they may occur in New Zealand. Historically, action in the area of health and housing in New Zealand has been limited by a number of political and technical barriers. One of these is the lack of a well-defined, quantitative, easy to use, reliable and valid measure of unhealthy or unsafe housing. The awareness of this need led to interest from the Housing and Health Research Programme (HHRP) and Building Research Association of New Zealand (BRANZ) in developing a HHI. The development of a HHI is a key way in which housing and health knowledge and research can be used to develop an information database to inform housing and health providers. The Building Act (1991) is the most widely applied regulation that ensures a minimum standard of housing condition in New Zealand. Insulation standards were first introduced in 1977 under the Local Government Act. However, because this Act was not applied retrospectively, more than one third of the present housing stock is exempt from these minimum standards, including the requirements for insulation. The Housing Improvement Regulations (1947) and the Health Act (1956) regulate housing to very minimal sanitation and safety levels, and the Tenancy Act (1986) requires landlords to maintain properties to a reasonable standard. There is currently no agreed standard to minimise the effects of a house on the health and safety of the occupants.

Healthy Housing Index Pilot Study Final Report 11
We have minimal levels of housing quality regulation in New Zealand, which is compounded by the little we know about the current condition of houses. The Housing Survey Act 1935 was the last attempt at a national survey of all housing, however it excluded areas with under 1000 people. The results of this survey indicated 17% of houses were unsatisfactory (Statistics New Zealand, 1940) and pre-empted a huge investment in the building of social housing. What we do know about housing today can be gathered from 5-yearly House Condition Surveys conducted by BRANZ on samples of about 500 houses (Page et al, 1995; Clark et al, 2005), and assumptions that houses built before insulation standards were brought in will be un-insulated. There is evidence that our houses are often cold and damp by international standards (Bierre et al, 2004; Isaacs et al, 2004; Isaacs and Donn, 1993). There has recently been international interest in measuring the link between housing and health, including work done by the World Health Organisation (Bonnefoy et al, 2003) and the recent creation of the British HHSRS (Ormandy, 2002; Stewart, 2002). The success of these initiatives to explore housing, health and safety indicators has inspired the piloting of a measurement tool of housing, health and safety in New Zealand, where no similar measure exists. We have drawn from the HHSRS and have embedded aspects of the concept and methods in the unique social, political, and cultural climate of New Zealand. A number of environmental and social indices have been developed in New Zealand including an index of socio-economic deprivation commonly referred to as NZDep (Salmond et al, 1998). NZDep has been widely used by policy makers as part of resource allocation, and by real estate agents, and has attracted some criticism for contributing to stigma for residents and communities in high deprivation areas (Ryks and Kirkpatrick, 2001). We have attempted to avoid this through collaborating with potential end-users and shaping the Index as much as possible to their needs, while clearly defining what the Index does and does not measure.

Healthy Housing Index Pilot Study Final Report 12
5 Methods
5.1 The house survey questionnaire
A house survey (building) questionnaire was developed to quantify the fifth factor, i.e. “Building Condition” in the five-finger framework. It drew upon on the two National House Condition Surveys created by BRANZ (Page et al, 1995), the hazards highlighted in the HHSRS (Court, 2003) and the New Zealand Standard NZS 4102:1996, “Safer House Design (guidelines to reduce injury at home)” (NZS 4102:1996, 1996) . The format of the questionnaire followed the layout of the house, room by room. The questionnaire was developed in consultation with the stakeholders and was reviewed by an independent expert on safety in the home. The final draft was pre-tested by the building inspectors. Following the pre-test, the questionnaire was modified and two versions were produced. One version (the “full” version) was for use by the building inspectors. The second version (shortened version) was for use by the lay inspectors and so excluded those questions in the full version that were felt to be too technical for lay people. This shortened version was administered by the lay inspector and took between 1-2 hours to complete.
5.2 Sampling
A total of 102 houses were included in the pilot study sample. Our sampling methods were opportunistic – not random – and therefore no attempt was made to ensure that the characteristics of each group recruited were representative of housing for that population. Forty three of the houses were from the general sample and these had an over-representation of houses in the less deprived areas (NZDep quintile 1 and 2). A total of 39 households with Māori occupants took part in the study, and the majority of these lived in the more deprived areas (NZDep quintiles 4 and 5). A total of 20 households with Pacific occupants were recruited for the study – these had a heavy bias towards being located in areas of high deprivation (NZDep quintile 5). There was an over-representation among all three ethnic subsamples of households living in houses built before 1977 (when mandatory insulation standards were introduced). Ninety three percent (93%) of the houses in the general sample group were owner-occupiers, compared to half (51%) of the houses in the Māori sample and none of the houses in the Pacific sample. Almost one-quarter (24%) of the houses in this study were owned by Housing New Zealand Corporation (including 15 of the 20 participating households in the Pacific sample). There were very few houses rented from private landlords (8%). Data on tenure status was missing for eight participants.
5.3 General/HCC sample
A deliberate sampling method was used in the pilot study to obtain a range of housing types in the Hutt Valley region. Houses were chosen on the basis of three variables: the age of the house, geographical location, and place on the NZ Deprivation Index. The Geographic Information System (GIS) at Hutt City Council (HCC) was used to identify houses on the basis of environmental location. Houses were then categorised by age and the deprivation rating of

Healthy Housing Index Pilot Study Final Report 13
the mesh block area. A total of 278 houses in the “general sample” were selected using this method. The houses in the general sample over-represented houses in the less deprived areas (NZDep quintile 1 and 2) and those built before 1977 (i.e. prior to the insulation requirements). The following graphs illustrate the distribution of houses in the HCC/general sample (Figures 2 and 3).
Figure 2: Distribution of NZDep quintile of houses in the HCC/general sample
1 2 3 4 5
NZDepquintile
0
20
40
60
80
100
Cou
nt
Figure 3: Distribution of decade of construction of houses in the HCC/general sample
1 8 70 19 0 0 1 9 1 0 1 9 2 0 1 9 30 19 40 1 9 5 0 1 9 6 0 1 9 70 19 8 0 1 9 9 0 2 0 0 0
d ec ad e
0
20
4 0
6 0
8 0
Cou
nt
Having obtained the general population sample using the HCC databases, the following steps were completed:
1. A letter of invitation was posted to each address (addressed to the owner/occupier). This letter provided brief details about the study and said that a member of the HHI team would telephone soon to follow up the invitation. Letters of invitation were sent

Healthy Housing Index Pilot Study Final Report 14
out in four separate batches, based on adjacent suburbs, to try and help with the scheduling and locations of appointments.
2. Where a telephone number was found that matched the name and address provided by HCC, a telephone call was made to the house approximately one week after the letter had been sent. The purpose of this call was to briefly outline the study and invite the householder to make an appointment when one of the HHI team could visit to discuss the study further and obtain consent from those wishing to take part.
3. Up to three telephone calls were attempted for each household if no answer was obtained or if an answerphone was reached.
4. For those houses where no telephone number was found, “door knocking” / “cold calling” was attempted.
5. The community co-ordinator and/or another member of the HHI team visited those who expressed initial interest in taking part in the study. The study was discussed and signed consent gained from those wishing to take part.
6. Where the householder was also a tenant, verbal consent was sought from the owner of the property (e.g. private landlord or Housing New Zealand Corporation).
Results of this process: Of the 278 houses identified in the HCC/general sample, a total of 43 were recruited into the study. This equates to a response rate of 15%. Figures 4 and 5 illustrate the deprivation rating and age groups of those houses where consent to participate was gained.
Figure 4: Distribution of NZDep quintile of participating houses in the general sample
1 2 3 4 5
NZDepquintile
0
2
4
6
8
10
12
14
Cou
nt
It is evident from Figure 4 that those consenting to take part in the general population were mainly living in the less deprived areas (NZDep quintiles 1 and 2).

Healthy Housing Index Pilot Study Final Report 15
Figure 5: Distribution of decade of construction of participating houses in the general sample
1900 1910 1920 1930 1940 1950 1960 1970 1980 1990 2000
decade
0
2
4
6
8
10
12
14
Cou
nt
Figure 5 shows that a large proportion of houses in the general sample were built in the 1950s and most of the houses were built before mandatory insulation standards in 1977.
5.4 Recruitment of Māori and Pacific participants
There was a commitment to recruiting a proportion of households occupied by Māori (40%) and Pacific (20%) people for this study. Households with Māori and Pacific occupants were identified and recruited using community contacts. 5.5 Recruitment of Māori participants
Prior to approaching potential Māori participants, a meeting was held with Te Awakairangi Regional Board. The Regional Board deals with all Māori in the Hutt Valley and has a seat on the Runanga (Te Runanganui o Taranaki Whanui). The proposed study was explained and discussed with the members of the Board and any questions were answered. The Board gave their support to the study and supported our approach to the three local Marae: Kokiri Marae (Seaview), Koraunui Marae (Stokes Valley) and Waiwhetu Marae (Waiwhetu). Presentations were made to each Marae to explain the study and discussions about approaches to recruitment were held. Ongoing meetings with community health workers and Marae personnel were essential to engaging with the local communities and to publicising the study. In addition, a powhiri with Waiwhetu Marae took place with members of the HHRP taking part. This further helped to strengthen the working relationship between the research team and the Marae. Jo-Ani Robinson, the community co-ordinator for the HHRP, is fluent in Te Reo and Tikanga Māori and this was a vital component in the approach to Māori communities. Potential Māori participants were identified by the three Marae in the Lower Hutt Valley and their names and contact details were provided to Jo-Ani Robinson. She used a flexible approach to explain the study to potential participants and to address any questions or concerns they may have about

Healthy Housing Index Pilot Study Final Report 16
taking part. This required a commitment to involving the whole family/whanau and to arranging times and locations for discussions that were convenient for them. Following discussion about the study, signed consent was gained from those who wanted to take part. A total of 39 households with Māori occupants consented to take part in the study. Figures 6 and 7 illustrate the deprivation rating and age groups of those houses with Māori occupants where consent to participate was gained. Figure 6: Distribution of NZDep quintile of participating houses in the Māori sample
1 2 3 4 5
N Z D e p q u in t ile
0
5
1 0
1 5
2 0
Cou
nt
Figure 6 illustrates that the majority of participants in the Māori sample group lived in the more deprived areas (NZDep quintiles 4 and 5).
Figure 7: Distribution of decade of construction of participating houses in the Māori sample
1 9 0 0 1 9 5 0 1 96 0 1 9 7 0 1 9 8 0 1 9 9 0 2 0 0 0
d e c a d e
0
5
1 0
1 5
2 0
Cou
nt
Figure 7 shows that most of the Māori participants lived in houses built in the 1950s/before 1977 (in keeping with those in the general sample).

Healthy Housing Index Pilot Study Final Report 17
5.6 Recruitment of Pacific participants
Discussions were held with Tofa Suafole Gush – the Pacific Advisor to Regional Public Health – to identify the most appropriate route to recruiting Pacific participants. Tofa Suafole recommended that potential participants be identified and approached by a member of the Pacific community. The person she suggested to complete this task was Malama Ropeti Fa’atui, Chair of Pacific Union Health Naenae, an interpretor for the Courts, and an ex-property inspector for HNZC. Malama Fa’atui used a variety of methods to identify and recruit potential participants including: an interview and discussion with Tofa Suafole Gush on Capital Radio – the local radio station for the Pacific community; contacts through the Pacific Health workers in the area; snowballing and word of mouth. Once a potential participant had been identified, Malama Fa’atui visited the household to discuss the study and gain signed consent from those wishing to take part. As with the recruitment of the Māori participants, it was imperative that a flexible approach was used to recruit participants. Recruiting one household often required several visits to the household members: the first visit to explain the study and answer any initial questions; a second visit to discuss further with other family members (often those who lived in other houses but whose opinions were sought from the initial householder); and a further visit to interpret and sign the consent forms. A total of 20 households with Pacific occupants were recruited for the study. Figures 8 and 9 illustrate the deprivation rating and age groups of those houses with Pacific occupants where consent to participate was gained. Figure 8: Distribution of NZDep quintile of participating houses in the Pacific sample
1 2 3 4 5
NZDepquintile
0
3
6
9
12
15
Cou
nt
Figure 8 shows a heavy bias towards the houses of the Pacific participants being located in areas of high deprivation (NZDep quintile 5).
Healthy Housing Index Pilot Study Final Report 18
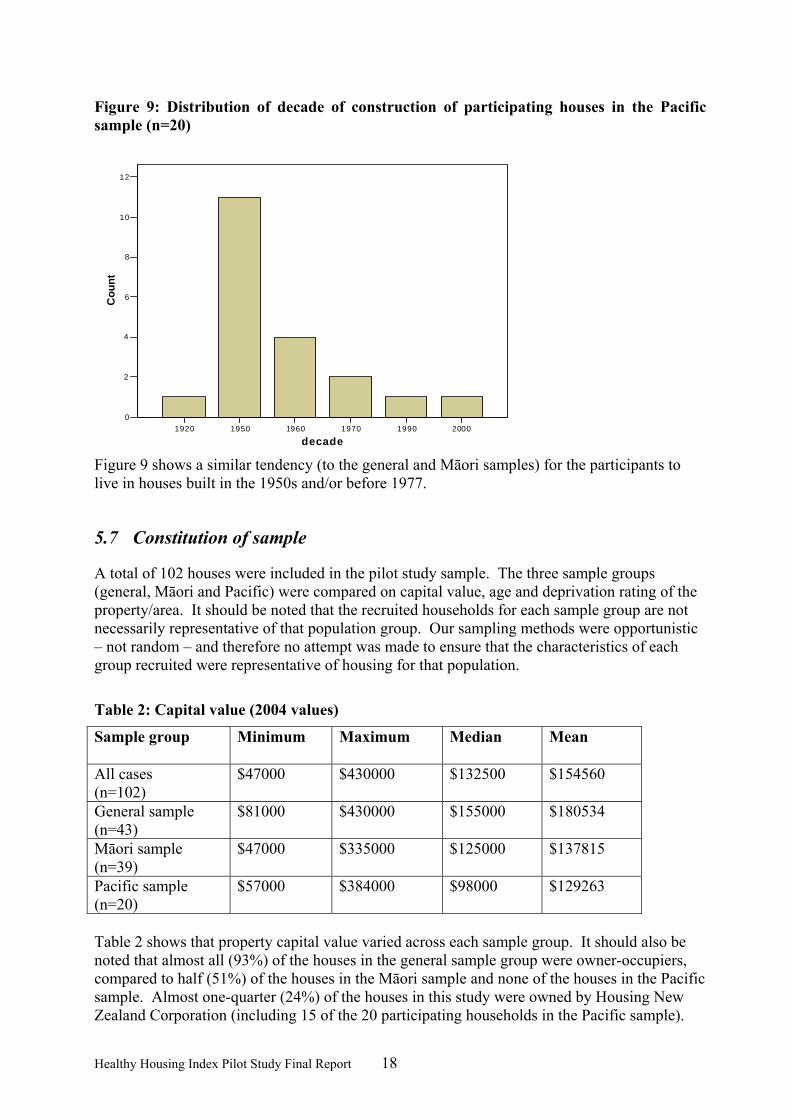
Figure 9: Distribution of decade of construction of participating houses in the Pacific sample (n=20)
1920 1950 1960 1970 1990 2000
decade
0
2
4
6
8
10
12
Cou
nt
Figure 9 shows a similar tendency (to the general and Māori samples) for the participants to live in houses built in the 1950s and/or before 1977.
5.7 Constitution of sample
A total of 102 houses were included in the pilot study sample. The three sample groups (general, Māori and Pacific) were compared on capital value, age and deprivation rating of the property/area. It should be noted that the recruited households for each sample group are not necessarily representative of that population group. Our sampling methods were opportunistic – not random – and therefore no attempt was made to ensure that the characteristics of each group recruited were representative of housing for that population.
Table 2: Capital value (2004 values)
Sample group Minimum Maximum Median
Mean
All cases (n=102)
$47000 $430000 $132500 $154560
General sample (n=43)
$81000 $430000 $155000 $180534
Māori sample (n=39)
$47000 $335000 $125000 $137815
Pacific sample (n=20)
$57000 $384000 $98000 $129263
Table 2 shows that property capital value varied across each sample group. It should also be noted that almost all (93%) of the houses in the general sample group were owner-occupiers, compared to half (51%) of the houses in the Māori sample and none of the houses in the Pacific sample. Almost one-quarter (24%) of the houses in this study were owned by Housing New Zealand Corporation (including 15 of the 20 participating households in the Pacific sample).

Healthy Housing Index Pilot Study Final Report 19
There were very few houses rented from private landlords (8%). (note: data on tenure status is missing for eight participants.)
Figure 10: NZDep quintile of surveyed houses
01020304050607080
1 2 3 4 5
NZDep quintile
perc
enta
ge
AllGeneralMaori Pacific
(Figure 10) As previously highlighted, households with Māori and Pacific occupants tended to be in the more deprived areas (NZDep quintiles 3-5) whereas those in the general sample tended to be in the less deprived areas (NZDep quintiles 1-2).
Figure 11: Decade of construction of surveyed houses
0
10
20
30
40
50
60
1900
1910
1920
1930
1940
1950
1960
1970
1980
1990
2000
Decade
perc
enta
ge AllGeneralMaoriPacific
The majority of houses included in this sample were built in the 1950s and it is of note that most of the houses (for all sample groups) were built before insulation became mandatory in 1977 (Figure 11).

Healthy Housing Index Pilot Study Final Report 20
5.8 House surveys
The following section provides a description of the house surveys that were conducted for the HHI pilot study. 5.8.1 House inspectors
• Briefing and Training A briefing and training session was provided for the house inspectors. Anna Sansom (Project Manager) and Jo-Ani Robinson (Community Co-ordinator) of University of Otago, Wellington conducted the briefing: in person and/or through written notes. This provided the inspectors with an understanding of the background to the study. Mike O’Malley from BRANZ conducted the training sessions. This included a review of the questions on the HHI house survey questionnaire and a practical example where at least one house was assessed.
• Role There were two types of inspector involved in this study. The “building inspector” was a person with experience of building surveys and inspections, and an in-depth knowledge of building issues. The “lay inspector” was a person with some experience of housing and building issues but less expert knowledge of this area than the building inspector.
• Inspectors Four building inspectors and three lay inspectors were involved in the study. The building inspectors were:
Mike O’Malley – BRANZ Brian Fawcett – Hutt City Council Myles Feeney – Compass Panels, independent builder Teri Puketapu – independent master builder
The lay inspectors were:
Bella Tuau – Health Protection Officer, Regional Public Health Malama Fa’atui – ex-property inspector for HNZC, interpreter for the courts, Chair
of Pacific Health (Naenae) Tony Barnett – independent “handyman”
5.8.2 HHI house survey questionnaire
Two versions of the HHI survey questionnaire were developed. The building inspectors completed the full version and a shorter version was completed by the lay inspectors. Both versions used the same template, however, the shorter version omitted some of the more technical or difficult to answer questions. 5.8.3 House inspections
The HHI survey questionnaire had been designed to enable the interior of the house to be assessed separately from the exterior of the house. The sequencing of the questions could be varied if required, for example, depending on weather conditions and available access to the various parts of the house. Where a householder made a specific request that a room (e.g. a bedroom) was not entered this was respected by the inspector. Where it was not possible to

Healthy Housing Index Pilot Study Final Report 21
access specific question areas, for example, roof spaces or underneath houses, these questions were left unanswered. At the end of the house survey, a verbal summary of any pertinent findings was given and a koha of $20 (shopping or petrol voucher) offered to the householder. An information sheet containing details of who to contact if the householder needed assistance with house maintenance or repair was also provided. If the householder requested a written copy of the summary of findings, this was noted on the survey form. Written notes were typed up at the University of Otago, Wellington, and checked by the building inspector before being sent out to the householder. 5.8.4 Surveying the general population sample
These houses were inspected by the building inspector only. Consent to participate was gained and an appointment for the house assessment scheduled by University of Otago, Wellington. The building inspector was provided with a table of addresses with appointment times. The building inspector arrived at the property at the appointed time and conducted the house survey. (If the householder was unable to make the appointment, this was rescheduled by University of Otago, Wellington.) 5.8.5 Surveying the Māori and Pacific households
These houses were inspected by the building inspector and the lay inspector. Different methods were used to recruit and assess the Māori and Pacific houses (see section on recruitment). • Houses in the Māori sample Two pairs of inspectors were contracted to assess houses in the Māori sample. Pair 1 consisted of a building inspector and Māori lay inspector who were provided with a table of scheduled appointments by University of Otago, Wellington. Pair 2 consisted of a Māori building inspector and a lay inspector who were known to the local community and scheduled their own appointments with the households. It was felt to be important and culturally sensitive to ensure that one person in each pair was Māori and acceptable to the community they were visiting. • Houses in the Pacific sample One pair of inspectors was contracted to assess the houses in the Pacific sample. The lay inspector in this pair was also responsible for recruiting Pacific households and scheduling the survey appointments. The lay inspector is a part of, well known and well respected within the Pacific community. As with the Māori component, it was felt to be important and culturally appropriate to ensure that one of the inspectors was of Pacific ethnicity. This helped with language and cultural understanding and the lay inspector was able to access further language/translation support as required. 5.8.6 Timing
The house assessments were completed between November 2004 and January 2005. One hundred and two houses were included in the study. Of these, 97 were surveyed by a building inspector using the full version of the HHI survey questionnaire. This assessment took between 2-4 hours to complete depending on factors such as the size and condition of the house. Fifty-four of the houses in the study were also surveyed using the shortened version of the HHI survey questionnaire. This shortened version was administered by the lay inspector and took between 1-2 hours to complete.

Healthy Housing Index Pilot Study Final Report 22
5.8.7 Issues arising regarding recruitment and inspections
The initial method of recruitment – selecting houses from the Hutt City Council GIS database – yielded a low response rate from the general sample (43/278 = 15% response rate). Of these, the majority were homeowners and there was a concentration of houses in the less deprived areas. Due to the timing of the approach to the different sample groups (general sample followed by Māori and Pacific) the over-representation in the general sample group resulted in a need to access those in the more deprived areas and those who were tenants from the Māori and Pacific sample groups. Thus, the predominance of houses in the more deprived areas in the Māori and Pacific samples, and the higher rate of tenants, was due to a deliberate sampling strategy and should not be taken as being representative or reflective of the populations as a whole. The procedures used to recruit Māori and Pacific participants were more time and resource intensive than that for the general sample but this method had a higher uptake rate than that used for the general sample. Communication and collaboration with the local communities was vital to the success of this approach. It required a flexible approach and cultural sensitivity (e.g. rescheduling visits to the Marae if a tangi was taken place and attending the tangi as appropriate). The commitment to being culturally sensitive and appropriate led to the training of additional inspectors to meet the needs of the Māori and Pacific communities. In doing this, valuable skills in house surveying/inspection were passed onto the communities and we were able to draw on their knowledge and experience of the local housing conditions. The house inspections were originally scheduled to take place during the winter months, however, the questionnaire development and participant recruitment stages took longer than initially anticipated. This resulted in the majority of the house inspections occurring over the summer/festive period. Consequently, the house inspection stage also took longer than anticipated as householders and inspectors were less available at this time. In addition, we had aimed to see houses during the winter in an attempt to see them in their worst possible condition (regarding cold and damp conditions). In some instances the inspectors speculated that a house would experience dampness in the winter even if this was not evident at the time of inspection. This pilot study has been a very valuable experience regarding approaches to communities and the timing of house inspections. To summarise, the main issues identified as important in the recruitment and inspection phase were: • the low response rate from the general sample, • the sample biases which occurred in both the socio-economic deprivation status of
homes, and in home ownership, • the methods to recruit Māori and Pacific homes were highly time and resource intensive,
and • it took much longer than anticipated to recruit participants. This resulted in the majority
of the house inspections occurring over summer, when some problems, such as dampness, would have been less evident than in winter.
Despite these issues, the sample was considered adequate in terms of its coverage of key groups in the population to which the HHI needed to be relevant.
Healthy Housing Index Pilot Study Final Report 23
5.9 Remedial action
After discussion among the team members of the Index project it was felt that the most appropriate body to conduct remedial action on the participating houses was the Hutt Valley District Health Board. Consequently the $50 000 allocated for remedial work was returned to the DHB who subsequently carried out remedial action. The HVDHB decided to retrofit insulation to the houses in the study that were not insulated.
5.10 Accessing data on health outcomes
Part of the pilot involved accessing health and injury data for participants. This process was begun early in 2005 with the collation of data but several unforeseen tasks arose causing a delay of several months. Before the collection of data could begin, we had to obtain an amendment to the ethical approval which would allow us to link participants’ health data with their house condition data. The need for this amendment arose because when the project was initially explained to participants, we did not make it clear that we would be linking health data with house condition data. This ethical approval has been granted. The other unforeseen tasks resulted from us not having: • the name of participants’ GPs and GP’s practices, or • the length of time participants had lived in their houses, or • participants’ NHI numbers. Furthermore, when we approached ACC to collate household injury data ACC were concerned that participants would not interpret the consent form they had signed as giving us permission to collate ACC data. To address these matters we sent a letter to each of the houses, with forms for the participants on which they could: • state the name of their GP and GP’s practice, and • the duration of their occupancy, and could also • provide a new consent (on which it was specified that we wished to collate ACC data).
Additionally, we took the opportunity to explain that the study was going well, and we included some brief findings. Because participants were being asked to sign a consent form that was worded slightly differently to the first consent it was first necessary to obtain ethical approval to ask for this new consent. The amendment to the ethical approval was obtained within three weeks. Those houses which did not return their forms within three weeks of the initial mail out were phoned to ask if they would participate. Often several calls were necessary before contact was made. Even after several calls it was not possible to contact some of the houses, so in these cases follow up letters were sent. Of the 20 Pacific households only 1 returned their forms, even after phone calls. Some of the Pacific households did not have telephones, making contact virtually impossible without a physical visit. We employed Malama Fa’atui to visit the homes and collate the data for us, and doing so greatly increased the response rate. From the time we

Healthy Housing Index Pilot Study Final Report 24
initially asked for the ACC data to the time when we collated the last of the new consent forms was almost 5 months. As a result of this process a response was received from 75% participants and 64% of the original participants consented to us collating ACC data. The number of participants who stated their GPs/GP practice was considerably lower, at 44%. A total of 171 people gave consent to have their health outcomes accessed, including hospitalisations, ACC events and GP visits. 5.10.1 Hospitalisations
The New Zealand Health Information Service (NZHIS) were provided with details of all those participants in the study who agreed to have their health records accessed, together with copies of the consent forms. Data provided included the names, dates of birth, sex and address of the participants. They then extracted hospitalisation data for these people for the period of interest (2001 to 2006). 5.10.2 ACC reported injuries
Participant details were also provided to ACC, who extracted details from their records of all reported injury events during the period January 2002-December 2004. A location field in the data identified the place of occurrence in the data and only home injuries were retained for analysis. Each record relates to a claim made for medical or related services in relation to the injury. Such claims are supported by forms and resultant data files that do not necessarily identify the hazard involved (if in fact a hazard contributed to the injury). 5.10.3 GP visits
There were 145 participants whose GP/practice was not known. For the remaining people, contact was made with most GP practices by Dr Carl Snyman, a GP and an honorary Research Fellow with the HHRP for a few weeks. Practices contacted included: the Stokes Valley Medical Centre, Naenae Medical Centre, Manuka Health Centre, Johnsonville Medical Centre, Fitzherbert Rd Medical Centre, Bulls Medical Centre, City Medical Centre, Petone Union Health, Petone Medical Centre, Pomare Union Health, Strand Care, Upper Hutt Health Centre, Waterloo Surgery, Whai Oranga o te Iwi, Pretoria St Surgery, Ropata Medical Centre, Kopata Medical Centre, Karori Medical Centre, Epuni Medical Centre, Ferguson Drive Medical Centre, Ngaio Medical Centre, Taita Medical Centre, Wainuiomata Health Centre, Waiwhetu Medical Centre, Thorndon Medical Centre, Epuni Medical Centre, Eastbourne Medical Centre, Avalon Medical Centre. All were willing to assist with providing data for the Pilot. Carl ensured that the provision of patient data could be done as efficiently as possible by negotiating with Medtech. Medtech made software available for free, which enabled data to be supplied electronically via Healthlink. Most GP practices (94%) connect to Healthlink, so have the capability of transferring data electronically, according to a recent study in the NZ Medical Journal (Didham et al, 2004).
5.11 Methods for creating indices
Creating the potential indices can involve the use of statistical methods such as factor analysis and principal components analysis. These methods have been applied to the pilot data by Clare Salmond. Several analyses were carried out to examine the relationships between the variables collected by the building inspectors who visited the houses in the pilot sample. Such relationships identify relevant dimensions of desirable indices and any redundant variables, which do not convey useful information beyond that conveyed by other collected data. Her report gave qualified support for developing an overall index as well as indices to measure

Healthy Housing Index Pilot Study Final Report 25
separately the five components of building condition and quality linked to health and safety: structural soundness, adequate services, warmth and dryness, safety, and protection from external hazards. It should also be noted that the sample size is too small for robust factor analysis and principal components analysis and it is quite likely that larger samples would identify different factors as appropriate for an index. A debriefing session with the inspectors involved in the study produced good suggestions regarding which variables should be incorporated into the statistical analysis and/or considered for inclusion in the final model/s. A limitation of factor analysis to form indices is that it relies on internal relationships between variables. This approach assumes that there are certain underlying and unmeasured influences of housing quality that are implied by the measurements made (which are the variables available for forming the Index). A second limitation relates to the validation process. If health data are used to validate or guide the formation of an index, there is a danger that the Index does not measure housing quality but measures some other variable associated with health (for example, socioeconomic status). Given these limitations, it was decided to focus the research on home injury hazards. This aspect of housing quality may have a relatively simple and direct association with health outcomes. As the presence of any hazard will theoretically increase the risk of injury occurrence, it was decided to count key injury hazards within the home.
5.12 Formation of injury hazards index
All injury hazards evaluated by the HHI questionnaire were considered for inclusion in the injury hazards index. As the next step was to consider associations between the index and home injury as reported to ACC, a number of hazards were excluded as they were considered to have little direct relation to the sorts of injuries that would be reported to ACC. Therefore, some of the hazards and safety features discussed above were excluded, including ergonomics of kitchen and bathroom. Injury hazards included in the index were: • Bathroom floor uneven/slippery/sloped • Shower/bath with slippery surface • Inadequate space around bath/shower • In rest of house (apart from bathroom) floor uneven/slippery/sloped • Unsafe electrical wiring • Hot water thermostat temperature set to >60 degrees or measured >55 degrees at tap • Internal stairs present • Stair handrail in disrepair/too high or too low/not continuous • Landing balustrade in disrepair/too low/too wide openings/insufficient strength • Stair risers uneven/too low/too high • Stairs slippery • Stairs not adequately lit • Stairs too steep • Stair treads too wide or narrow or uneven • Steps between bedroom and toilet • Insecure carpet on steps • Steps between kitchen and dining area • Mirrors or glass doors adjacent to stairs • No storage area in each of bathroom/kitchen/laundry available protected from young
children

Healthy Housing Index Pilot Study Final Report 26
• Outdoor pathway poorly lit/slippery/too steep/uneven/window opens onto pathway in hazardous way
• Handrail on external steps in poor condition • Handrail on external steps needed but not provided • External steps structurally unsafe • External steps treads and risers of different heights • External steps flights of less than three steps grouped together • External steps with missing treads • External steps necessary (steep pathway) • External steps slippery • External steps poorly lit/difficult to see
5.13 Measuring associations between reported injury and the injury hazards index
Although most injury prevention experts would encourage the removal or remediation of environmental injury hazards in the home, there is little reliable research to link the existence of hazards in the home with injury occurrence. A recent Cochrane review of studies investigating the effects of home environment modification on injury occurrence identified no studies that found a reduction in injury rates that could be reasonably attributed to the interventions used (Lyons et al, 2003). The authors ascribed this lack of positive evidence to a combination of factors, including problems with study design, poor uptake of interventions by the groups studied and insufficient sample sizes. Nevertheless, there have been studies showing promising results from programmes with interventions that address both extrinsic and intrinsic injury risk factors for particular at-risk groups (e.g., Day et al, 2002). Gill et al. (2000) reported positive, but generally not significant, associations between observed home trip or slip hazards and self-reported falls in a thousand elderly participants. Throw rugs, any mat without a rubber or skid-free backing, carpet folds, cluttered and crowded pathways, including furniture that crowded or narrowed the walking path were identified as particular hazards. With readily modifiable hazards, characteristics of the resident of the house may confound associations between injury and observed hazards. For example, in the study by Gill and colleagues (ibid), an increase in odds of slips/trips was indicated by the presence of grab rails/bars in the bathroom and slips/trips in the bathroom, but this odds ratio was not significantly different from one. If the presence of such a safety feature is a marker of a resident with balance problems, then such confounding could explain this almost-significant finding. Likewise, a more infirm older person may foster uncluttered pathways in their homes because of their need for clear walking areas. This could mean that the presence of clutter in pathways may signal the presence of a healthier resident who is less likely to fall, even in the presence of these hazards. It is always a criticism of observational studies, as opposed to randomised controlled trials, that other factors are liable to confound any associations identified. Given the paucity of robust evidence supporting home hazard reduction, there is a need for studies of the association between home hazards and home injury. The principal research question addressed by the following analysis is whether there is a relationship between the number of injury hazards (or lack of safety features) in the home and the occurrence of injury in the home. Not all injury hazards or safety features identified during

Healthy Housing Index Pilot Study Final Report 27
the house inspection were considered relevant to this research question. For example, as discussed above, the presence of grab rails or grab bars is a safety feature that is likely to have injury preventing characteristics, but may signal that a person with severely impaired balance is resident. Such an association may lead to seemingly increased injury occurrence associated with the presence of this safety feature. We studied injury in the home recorded by ACC via a claim made for medical or related services in relation to the injury. Such claims are supported by forms and resultant data files that do not necessarily identify the hazard involved (if in fact a hazard contributed to the injury). For this reason, the analysis could not estimate risk associated with hazards in the particular area or room of the house where the injury occurred, as was done in the study by Gill et al. (2000). Independent variables analysed included: the number of injury hazards in the house, as described above; age of the subject in three levels, 0-4, 5-59 and 60 plus; sex; deprivation levels of the meshblock of the house measured by NZDep quintiles (Salmond et al, 1998). The quintiles of NZDep classify houses according to Census-collected information on the meshblock (immediate neighbourhood) of the house and indicate deprivation levels from 1 (least deprived) to 5 (most deprived). These deprivation levels are evaluated for the area where the house is located rather than for particular households or individuals and are based on neighbourhood levels of unemployment, household income, home ownership, education levels, levels of crowding and access to communication and transport (ibid). The division of age into the three groups used was based firstly on the limitations of the data, which were too sparse to allow analysis by fine disaggregations of age, and secondly on rates of injury by age group, which show that these three groups have quite different rates of home injury: high for the under-fives and over-60s and relatively low for the ages in between. A contributing factor is likely to be the large amount of time members of these age groups spend in the home according to time use survey data (Bierre et al, submitted). To ensure that the exposure levels were relatively similar for all subjects included in the model, people resident in the inspected house for less than two years were excluded. The hazards identified are listed in the appendix, and include items such as inadequate handrails for stairs, unsafe electrical wiring, steep or slippery outdoor paths, etc. A logistic model was fitted to describe the probability that a person was injured as a function of the explanatory variables. The data (at the person level) were clustered according to the house where they lived. The generalised estimation equation method is an extension of logistic regression that is valid for such clustered data (Zeger and Liang, 1992). We used the SAS procedure GENMOD (SAS Institute, 1998) using the REPEATED statement and an exchangeable correlation structure, which has been used to model injury risk for similarly clustered data (Hutchings et al, 2003). This technique calculates empirical standard errors using a “sandwich” or “robust” variance estimator. The number of explanatory variables able to be included in the model needed to be restricted to ensure that reliable estimates of the parameters could be obtained. Peduzzi et al. (1996) suggested a rule-of-thumb that at least 10 events (here, injured people) should be available for each parameter estimated. As there were only 14 people defined as being injured in the study, clearly only one parameter could be estimated reliably based on this criterion. Nevertheless, as age, gender and deprivation level are all potential confounders of injury risk, a second model was also fitted including these variables along with the number of home injury hazards. This was done in an attempt to identify potential effects of these variables on the association between injury occurrence and exposure to injury hazards. The results of this second model are indicative only and need to be treated with caution.

Healthy Housing Index Pilot Study Final Report 28
6 Results
6.1 Descriptive results of the houses and occupants included in the sample
The following household results are based on the full sample of 102 households. The house condition results (Section 6.1.3 and following) are based on 97 houses that were assessed by the Building Inspectors, excluding five houses that were inspected by lay inspectors. 6.1.1 Ethnicity
Table 3: Self-stated ethnicity of householders* (n=102)
Ethnicity Sample group
NZ European
Māori Samoan Indian Other No response
Total (%)
General 28 3 1 1 6 4 43 (42%)
Māori 0 39 0 0 0 0 39 (38%)
Pacific 0 0 13 0 4 3 20 (20%)
Total (%)
28 (27%)
42 (41%)
14 (14%)
1 (1%)
10 (10%)
7 (7%)
102 (100%)
*The term “householder” is used to describe the adult in the house who gave overall consent for the house to be included in the study. This was based on voluntary nomination i.e. where more than one adult was present in the household, they were asked to nominate one person who would be the named householder. Table 3 shows that Māori participants were the largest ethnic group (41%) included in the study. Those in the “other” category included: Tokelauan, Irish, South African, Chinese and Fijian-Indian. 6.1.2 Smoking
Table 4: Self-reported smoking status of householders (n=102)
Smoke one or more cigarettes per day Sample group Yes No No response
General (n=43) 4 36 3 Māori (n=39) 14 21 4 Pacific (n=20) 5 11 4
Total (%)
17 (17%)
59 (58%)
26 (25%)
Table 4 suggests that over half of the householders in this study do not smoke, however, it unclear whether the figure of only 17% who do smoke is accurate due to the large number who did not respond to this question. The following results (taken from the 97 houses inspected by the building inspectors) are provided to give a general indication of the condition of the houses included in this study. (Note: the building inspectors assessed 15 of the 20 houses with Pacific occupants.) Only a small number of the variables collected by the building inspectors are presented here. Those

Healthy Housing Index Pilot Study Final Report 29
that are presented have been selected to provide a brief description of the conditions of the houses in this study. As previously noted, this study did not use a random sample and, therefore, these results cannot be extrapolated to all houses in the Lower Hutt area or to the housing situations of people in the respective ethnic groups. (Please also refer to Section 6 for details of the NZDep rating of the areas where houses were inspected, the age and the capital value of the houses inspected.) 6.1.3 Dampness
Table 5: Building Inspector’s subjective rating of dampness (n=97)
Subjective dampness Sample group Damp
N % Dry
N % General (n=43)
4 9% 39 91%
Māori (n=39) 13 33% 26 67% Pacific (n=15) 11 73% 4 27% Total 28 29% 69
71%
The highest rates of dampness were found in the houses occupied by Pacific participants (73%) and the lowest rates in the general sample (9%) (Table 5). Of the whole sample, over one quarter of the houses were felt to be damp. 6.1.4 Insulation
Table 6: Presence of insulation in sample (n=97)
No insulation present Sample group Wall insulation
N % Ceiling insulation
N % Floor insulation
N % General (n=43)
18 42% 3 7% 18 42%
Māori (n=39) 31 79% 3 8% 25 64% Pacific (n=15) 15 100% 2 13% 8 53% Total
64 66% 8 8% 51 53%
Table 6 illustrates that, although the majority of houses (92%) have ceiling insulation, one third (66%) had no wall insulation and over half (53%) had no floor insulation. A lack of insulation was most common in the houses with Pacific occupants.

Healthy Housing Index Pilot Study Final Report 30
6.1.5 Mould
Table 7: Presence of mould in any room (n=97)
Sample group Presence of mould in any room
N % General (n=43)
13 30%
Māori (n=39) 25 64% Pacific (n=15) 14 93% Total
52 54%
Table 7 illustrates that over half (54%) of the houses in the sample had evidence of mould. Mould was most common in the houses with Pacific occupants (93%), followed by those with Māori occupants (64%), and least common in the houses of the general sample (30%). 6.1.6 Heating
Table 8: Presence of heater (n=97)
Presence of heater Sample group Fixed heater
N % Portable heater
N % No heater
N % General (n=43)
38 88% 36 84% 1 2%
Māori (n=39) 34 87% 24 71% 3 8% Pacific (n=15) 13 87% 5 33% 1 7% Total
85 88% 65 67% 5 5%
The majority of the houses in the study had some form of heating – only 5% had no heating whatsoever (Table 8). Most (88%) had fixed heaters in their homes. 6.1.7 Lack of insulation and presence of mould
Table 9: Lack of insulation and presence of mould (n=97)
Sample group No insulation AND presence of mould
in any room N %
General (n=43)
9 21%
Māori (n=39) 24 62% Pacific (n=15) 14 93% Total
47 48%
Table 9 shows that there was a presence of mould and a lack of insulation in large proportions of the houses with Māori occupants (62%) and those with Pacific occupants (93%), compared

Healthy Housing Index Pilot Study Final Report 31
to one in five (21%) of the houses in the general sample. Nearly half (48%) of all the houses in the sample experienced presence of mould and a lack of insulation. 6.1.8 Fire safety
Table 10: Lack of smoke alarms
Sample group Lack of smoke alarms
N % General (n=43)
9 21%
Māori (n=39) 19 49% Pacific (n=15) 4 27% Total
32 33%
One third of the houses surveyed had no smoke alarms (Table 10). Nearly half (49%) of the houses with Māori occupants did not have a smoke alarm, compared to around a quarter (27%) of the houses with Pacific occupants and one-fifth (21%) of the general sample. 6.1.9 Occupancy, safety and socioeconomic attributes
Figure 12: Distribution of sample of houses by quintiles of NZDep: all houses in the HHI Pilot study; households with a child aged 4 or less; households with person aged 75 plus.
0%
10%
20%
30%
40%
50%
60%
70%
1 2 3 4 5
quintile of NZDep
toddlerolder personoverall
Figure 12 shows the distribution of three groups of houses from the HHI Pilot study according to their classification by NZDep (Salmond et al, 1998). The quintiles of NZDep classify houses according to Census-collected information on the immediate neighbourhood of the house and indicate deprivation levels from 1 (least deprived) to 5 (most deprived). These deprivation levels are evaluated for the area where the house is located rather than to the individual occupants and are based on levels of unemployment, household income, home ownership, education levels, levels of crowding and access to communication and transport (ibid). The dark solid line of Figure 12 shows that the sample of houses used for the HHI study are generally more deprived than would be expected from a nationally representative sample, in which the sample would be evenly distributed (20% of the sample in each quintile). The most

Healthy Housing Index Pilot Study Final Report 32
deprived quintile (5) is clearly overrepresented. This overrepresentation is even more marked for houses with young children (the dotted line of Figure 12) and appears to be more marked for houses with older people. However, this last group has a relatively small sample size, reflected by zero representation in quintile 4. When the combined sample proportions in the last two quintiles are considered, 59% of the study population overall are in these last two quintiles, equal to the proportion of houses with older people in these quintiles (58%), but markedly lower than the proportion of houses with small children in these last quintiles (75%). The implication of Figure 12 is that houses with small children, in which child injury rates are liable to be high, are also more likely to be economically deprived, with associated implications for scarce financial resources available for environmental hazard reduction. There are also differential levels of home ownership, with owner occupied dwellings constituting a larger proportion of houses with young children and houses with an older person than houses with occupants aged 5-69 (see Table 11). This is another factor that will impact on willingness and ability to address home hazards.
Table 11: Houses in sample: tenure and presence of grabrails and stairs by occupant age attributes
Study group (houses sampled)
Owner occupied Grabrails present
Stairs exist*
Oldest occupant 70 plus 9 out of 12 (75%)
2 out of 12 (17%)
4 out of 12 (33%)
Youngest occupant aged under 5
11 out of 15 (73%)
2 out of 20 (10%)
1 out of 20 (5%)
Occupants aged 5-69 41 out of 71 (58%)
4 out of 64 (6%)
16 out of 64 (25%)
*For the one house with stairs that had a toddler, no stair gates were installed. Other safety issues included: • Houses with pathway problems (e.g. too steep, slippery, overgrown)= 33 (34%) • Houses with internal stair hazards (e.g. insecure carpeting, steps between bathroom and
bedroom) = 3 (3%) • Houses with structurally unsafe external steps = 3 (3%) See section 5.12 for a description of the injury hazards index and the measurement of associations between this index and reported home injury.
6.2 Inspectors’ comments
The inspectors recorded their most pertinent findings for each house in the form of bullet points. The most common comments provided by the building inspectors were to do with:
1. Plumbing: this included issues to do with spouting downpipes, drains that needed attention and the plumbing in bathrooms (27 houses). Often there was more than one plumbing/drainage problem with a house.
2. Ceiling insulation: even though most houses had ceiling insulation, this often had gaps, was unevenly distributed or needed to be replaced (12 houses).
3. Ventilation: this included inadequate ventilation under the floor (e.g. where vents were
blocked) and ventilation inside the house (11 houses).

Healthy Housing Index Pilot Study Final Report 33
4. Storage under the subfloor: a common problem was the storage of material underneath the subfloor (e.g. offcuts of wood) that were damp, sometimes were covered in fungi, and could make the floor damp and/or affected by fungi also (10 houses).
5. Flooding/damp land: this seemed to be a fairly common problem in the area (possibly linked to the reclaimed swamp lands that some of the Hutt Valley has been built upon) (7 houses).
Other issues that the Building Inspectors identified as requiring attention included: inadequate or lack of bathroom extractor fans (4 houses); windows that could not be opened (4 houses); unsafe balustrades (3 houses); and electrical issues – where wiring was old and/or dangerous (3 houses).
6.3 The injury hazards index and home injury occurrence
Table 12 shows some of the characteristics of the study. Note that there was no sample taken of specifically older people’s accommodation or their residents, so the sample of older people may not be typical of older people generally. People living in the community are likely to be healthier than those in institutions or specific older people’s communities.
Table 12: General characteristics of the study
Study period January 2002-December 2004 Number of houses 102 Number of household members 255 Age range of subjects 0-88
Figure 13: Distribution of sampled houses by the number of hazards identified in the house for all houses and for houses in which a reported home injury occurred.
0%10%20%30%40%50%60%70%80%
0-3 4-6 7-9 10 plus
Number of hazards
allaccident
Figure 13 shows that overall, just over 40% of the sampled houses had between seven and nine hazards identified, and 30% had 10 or more hazards. For houses in which there had been a reported injury (i.e., a household member had received medical or associated attention for an injury that occurred in their home, and some funding for that service was provided by ACC), a quarter had between seven and nine hazards, and three-quarters had 10 or more hazards. Clearly, houses in which an accident occurred were more hazardous on average according to the criteria used: the proportion of respondents who were injured increased generally with increasing numbers of identified home hazards. Note that there was only one hospitalisation

Healthy Housing Index Pilot Study Final Report 34
that was coded as being due to a home injury, so such data were not useful for this particular analysis.. Table 13 shows odds of a reported home injury during the two-year period immediately prior to the inspection of the house (which identified injury hazards and other aspects of the house that may affect health). The size of the study is small, which limits the power of the analysis to detect statistically significant odds, despite some quite large apparent effects. For the analysis of the odds of home injury associated with the number of home hazards identified, the number of hazards was classified into tertiles according to the houses in the study sample in Table 13. Fewer categories needed to be used here than in Figure 13 because relative odds could not be defined for quartiles referent to the first quartile that had no reported injuries. For the logistic regression analysis of this association, it made sense to treat the number of home hazards as a continuous variable, meaning that the increase in the odds of reported home injury associated with each additional home hazard identified could be estimated.
Table 13: Study population resident in house for at least two years, with numbers injured in their home and odds of injury by characteristics of subjects and number of identified hazards in their home
Variable name Number injured
Number not injured
% injured
crude odds (relative to first value)
odds adjusted for clustering*
95% CI for odds adjusted for clustering*
Age 0-4 2 22 8.3% 1.0 1.0 5-59 11 186 5.6% 0.7 0.6 (0.1, 2.4) 60 pl 1 32 3.0% 0.3 0.3 (0.0, 3.2) Sex male 5 112 4.3% 1.0 1.0 female 9 121 6.9% 1.7 1.5 (0.4,6.0) NZ Dep quintile+
1 3 27 10.0% 1.0 1.0 2 2 37 5.1% 0.5 0.5 (0.1, 2.8) 3 2 18 10.0% 1.0 0.8 (0.1, 6.9) 4 and 5 6 142 4.1% 0.4 0.3 (0.1, 1.5) Number hazards (tertiles) 0-5 1 81 1.2% 1.0 1.0 6-7 5 73 6.4% 5.5 5.2 (0.6, 47) 8 plus 7 73 8.8% 7.8 7.6 (0.9, 64) TOTAL 13 240 5.1% * adjustment for clustering of subjects was achieved using GEE analysis + NZDep quintile classifies the respondent’s neighbourhood from 1 (least deprived) to 5 (most deprived) Table 13 shows that the relative odds generally follow a pattern expected from the literature, even though these are not statistical significantly different from 1 (the value set for the referent level). The low odds of injury estimated for respondents from the most deprived areas (NZDep

Healthy Housing Index Pilot Study Final Report 35
quintiles 4 and 5) was unexpected, particularly as Figure 14 shows that the number of injury hazards appeared to increase, on average, with increasing levels of deprivation as defined by NZDep. This means that the association between the odds of injury and the number of home hazards will tend to be attenuated unless the confounding effects of deprivation, as measured by NZDep, are accounted for. Table 13 combines NZDep levels 4 and 5 for computational reasons (as adjusted odds could not be computed for NZDep level 4 by itself).
Figure 14: Average number of home hazards identified amongst sampled houses by NZ Dep quintile (1=least deprived; 5=most deprived).
5.906.006.106.206.306.406.506.606.70
1 2 3 4 5
NZ Dep quintile
There was no evidence of problems with the fit of the model: the scaled deviance and scaled Chi-square were both less than one. Using SAS, diagnostic plots of the statistics DFBETA (the standardized differences in the parameter estimates due to deleting an individual observation), DIFDEV (the change in the deviance due to deleting an individual observation) and DIFCHISQ (the change in the Pearson chi-square statistic for the same deletion) identified two unusual observations. However, there was little change in the estimated parameters following the omission of the two observations from the regression, meaning that the estimation was probably quite robust to outlying or unusual data. These two observations did not seem to have errors in the data recorded and they were retained in the final analysis. Table 14 shows the results of the regression, together with empirical standard error estimates and confidence limits. Exponentiating the estimated coefficient for the sum of home hazards shown in Table 14 gives an estimated increase of 22% in the odds of injury associated with each additional hazard in the home (95% CI: 6% to 41%). As a check of potential confounding, a second indicative analysis was done, as described above, which included the independent variables NZDep quintile, respondent age and gender. This resulted in a larger estimated increase in the odds of 26%, also significantly greater than zero.
Table 14: Results of GEE logistic regression modelling the log of the odds of reported injury over three years as a function of the number of home hazards identified in the house inspection, with empirical standard error estimates.
Parameter Estimate Standard Error95% Confidence
Limits Z Pr > |Z| Intercept -4.282 0.646 (-5.547, -3.016) -6.63 <.0001
sumhazards 0.199 0.073 (0.055, 0.342) 2.72 0.007

Healthy Housing Index Pilot Study Final Report 36
7 Discussion
7.1 Discussion of associations between reported injury and the injury hazards index
This study shows that living in a house with more identified hazards is associated with a greater risk of injury requiring medical attention, even after adjusting for confounding factors. Assuming this finding is replicated in larger studies, then it provides good support for using a hazard rating tool to quantify injury risk in houses, guide remediation action to remove the more important hazards, and monitor the effects of interventions to improve the safety of New Zealand’s housing stock. Although it initially appears a simple concept to develop an injury hazards inventory and a resultant index that provides an assessment of the potential for the house to be injurious to its occupants, there are obvious limitations of this approach. One example is that of children’s play areas. From a public health perspective, an area adjacent to the house where children can play is evidently a good thing. The children can obtain enjoyment and exercise, beneficial to their health and development, while being at home. The alternative is that children have to play in a restricted indoor space, or they play on the street or at a nearby park. Paradoxically, because of the way that injury is traditionally coded, a home is likely to appear more hazardous if it has an outside area where children play. This is because children’s play is liable to be the setting of an injury from time to time, which is attributed to the dwelling of that child. Children playing in the street, which is more hazardous because of the presence of motor vehicles, will have any motor vehicle-related injuries coded as occurring on the road, not at the dwelling. Overall, the child with facilities to play outdoors at home will have a lower injury rate than the child compelled to play on the street. But that child’s home will paradoxically appear more hazardous because of the injury events coded as occurring at that location. An example of an injury hazard that may vary according to the characteristics of the occupants is the presence of internal stairs. The pilot study showed that a relatively small proportion of families with small children lived in houses with internal stairs. This has implications both for the evaluation of injury rates associated with hazards within the house, but also for any evaluation of safety features such as stair gates. If a population study were carried out to evaluate the effectiveness of stair gates for the prevention of injuries on stairs for young children, a very large sample would be required to find a reasonable number of families with young children living in houses with internal stairs. Although the current study was small and subject to non-response bias, meaning that the characteristics of this sample do not necessarily reflect the general population, it is probable that New Zealand families with young children are less likely to live in houses with stairs. If this proportion is as low as 5%, as was found in this relatively small sample, then a population study, even one that was able to sample just families with young children, would be a very inefficient study design for the evaluation of stair gate effectiveness as only one in twenty such houses would have the potential to benefit from stair gates. There are several important differences between the current study and that reported by Gill et al. (2000) that may explain the stronger associations obtained in our study than in their larger study. Firstly, there were differences in the analytical approach. Our study related injury occurrence anywhere in the home with hazards anywhere in the home, mainly because of the inability to identify any hazard particularly associated with the injury event from the data available. Gill and colleagues related self-reported falls occurring in a given room with hazards

Healthy Housing Index Pilot Study Final Report 37
identified in that room. As most of the associations they identified were for increased odds of a fall in the presence of fall hazards, it is possible that their analysis would have found a significant association if they had looked for association between falls anywhere in the house with counts of total home hazards, even though their room-by-room associations failed to be statistically significant. Of course, the disadvantage of the HHI approach is that the ability to infer a causal association is weakened by not accounting properly for the aetiological link between the hazard and the injury. A second important difference is with the injury hazards identified. Gill et al. (2000) focused on fall hazards that were generally readily modifiable (such as mats that were trip hazards or clutter that reduced space for walking). Our study focused on more structural features of the house that were less likely to be adapted in response to perceptions of risk (see Appendix, below). It is therefore possible that our study was relatively free from the potential confounding that can arise when people adapt their surroundings to reduce their perceived risk, and adapt the surroundings more when their own liability to fall increases. As discussed above, such a mechanism can lead to a seeming increase in injury (due to problems with balance or frailty) associated with a decrease in injury hazards (removed or modified to reduce perceived risk). Our study has several limitations. Most importantly, the sample size of just 102 households limited possible analyses. The associations observed are subject to various sorts of confounding. Socioeconomic factors are one such confounder, since they appear to attenuate the association between injury hazards and injury occurrence in the data, leading to more conservative estimates. To ensure that the duration of exposure was similar for all subjects included in the model, people resident in the inspected house for less than two years were excluded. This does not necessarily mean that all were exposed to a similar degree to the injury hazards enumerated: some people were resident in the house for between two and four years, but the precise date was often unknown due to the manner of recording duration of residency. Also, no account was taken of the reduced period of exposure to the home environment for children born during the study period. Although the injury hazards were identified at one point in time, at the latter end of the period for which home injuries were monitored, most are not particularly remediable and are therefore less likely to have been modified than the injury hazards identified in the study by Gill et al. (2000). To summarise, this study found an estimated increase of 22% in the odds of injury associated with each additional injury hazard found in the home (with 95% CI: 6% to 41%). This result suggests that addressing injury hazards in the home may be effective in reducing home injury. There are a number of potentially confounding factors that may affect relationships found between the existence of home hazards and injury occurrence. These confounders need to be taken into account when future evaluations are planned.

Healthy Housing Index Pilot Study Final Report 38
8 Current and future applications
Based on the positive findings from this research we plan to repeat this study using a much larger sample size. Assuming these finding are replicated, then that would provide good support for using a hazard rating tool to quantify injury risk in houses more generally. Such information could be used to guide remediation action to remove the more important hazards. Aggregate data from the use of such a rating tool would also provide a useful method for assessing progress towards creating a safer domestic environment at a local and eventually national level.
8.1 Whanau ora tool
If the Healthy Housing Index pilot study results in a useable and reliable tool, there are plans to develop a research agenda to validate it for whanau ora – or the wellbeing of Māori families. Developing a tool that can be used by Māori to enhance whānau or family health recognises the inequalities in health outcomes between Māori and non-Māori, the right to self-determination protected in The Treaty of Waitangi, and the benefits of an approach grounded in a Māori knowledge system. Life expectancy for Māori is currently ten years lower than the rest of the population (Ministry of Health, 2002), and poor housing may be one of the contributing factors. This research will develop a tool for community use, which makes explicit the link between housing quality and health outcomes.
8.2 Statistics New Zealand Housing Survey
Discussions were advanced with Statistics New Zealand to include the Healthy Housing Index in the Statistics New Zealand Housing Survey. Doing so would have helped to test the functionality of the Index, and could have ensured the Statistics NZ housing survey collected useful and important/relevant data. Members of the Index team regularly attend the Statistics New Zealand “Housing Statistics User Group.” Continued discussions with this group will be important to ensuring that any inclusion of the Index questionnaire, or selected questions from it, is managed successfully. Unfortunately, Statistics New Zealand announced that the survey had been cancelled. We will be looking for other opportunities where the HHI can be used.
8.3 Other applications
There are plans to use the approaches developed here for evaluating houses involved in the Taranaki Healthy Homes programme, the Housing NZ Decent Home Programme and public housing owned by the Wellington and Christchurch City Councils.
8.4 Benefits of this pilot project to other HHRP projects
This pilot project to create and validate an Index has also been useful for the “Housing, Heating and Health Study” a project currently being run by the HHRP. It has identified a number of data collation procedures which will be useful to ensure that data collation for the

Healthy Housing Index Pilot Study Final Report 39
participants of the “Housing, Heating and Health Study” runs smoothly. It has also identified important relationships the HHRP needs to establish with agencies such as the PHOs, community contacts, and NZHIS, and how to go about this.
Healthy Housing Index Pilot Study Final Report 40
9 Conclusions
9.1 Objectives
The objectives of the Pilot were to: • Identify applications and potential concerns about a HHI via stakeholder consultations. • Determine the theoretical framework and scope of the HHI. • Develop the instrument (questionnaire) for the pilot version of the HHI study. • Pilot the processes that would be involved in a main study that employed the HHI. These
included: the processes of recruitment of households and household members; house inspections; the collection of health outcomes data (ACC events, hospitalisations and GP visits).
• Examine an association between some of the housing quality variables collected during the house inspections and some health outcomes of the occupants.
• Publish the results in peer-reviewed journals as a way of obtaining independent rigorous review of our approach, methods and analysis. This research area is relatively neglected internationally and this pilot study is therefore an important contribution whose results need to be widely disseminated.
An overarching objective was to reflect on the processes and real or potential problems with the processes, documenting steps taken and problems encountered to inform future studies. This is an important distinction between the approach used in a pilot study and one used in a main study. The pilot deliberately attempts to encounter important issues that may impact on a main study so that the barriers to implementation and analytical barriers can be considered before a main study is embarked upon. This is to avoid wasting time and resources attempting to surmount such difficulties during the main study, when sample sizes are so much larger and mistakes so much more expensive to remedy. The HHI pilot therefore included: • More extensive stakeholder consultations than would be used in such a small-scale study
such as this pilot • A more extensive questionnaire than would be used in a main study • A sample of houses that deliberately included an oversample of Maori and Pacific
dwellings as well as sample from different eras of house construction • Development of processes for collecting data on GP consultations • Extensive debriefing of building inspectors The conclusions from the pilot can be summarised as follows:
9.2 The questionnaire
The HHI questionnaire as used in the pilot collects valid data on housing quality related to health outcomes. There are four issues that need to be addressed for the questionnaire to be used in the main study: • The questionnaire is very long and contains a number of items that provide data on building
condition but have little proven links to the health of the occupants (see questionnaire attached as an appendix). Such items were deliberately included to make sure that a rich data set was available for piloting, but for a main study, the questionnaire needs to be more efficient.
• To make the questionnaire easier to reduce to an index or indices, the questionnaire coding needs to use consistently higher numbers for those aspects likely to be healthier and safer.

Healthy Housing Index Pilot Study Final Report 41
• Given that the questionnaire is likely to be used to guide remediation, it is important that the severity of adverse health outcomes be able to be assessed, such has been developed for the Housing Health and Safety Rating System, used in the UK (Ormandy, 2002). Such an assessment can then be used to allocate resources to address the most severe hazards in terms of both risk of adverse health outcome and on the severity of the health outcome.
• It is important that the questionnaire remains flexible to encompass different perspectives on building quality and hazards. It is also desirable that the HHI is able to make use of reduced data sets such as may be available via administrative records (held by public housing stock administrators, for example).
• The questionnaire was well-suited to the sample of mainly low-density housing encountered in the Pilot. However, it may need to be adapted to suit medium and high density housing that is becoming more common in many cities.
• The lay inspectors were insecure in their competence to carry out the house inspection. That coupled with issues of safety while inspecting suggest that HHI inspectors are best chosen from experienced building professionals.
9.3 Recruitment
There was a very low cooperation rate for this study: less than 20% of households initially approached agreed to participate. A barrier to having the HHI widely used and accepted is the potentially negative reaction of the house occupants to having their house evaluated in this way, resulting in non-cooperation or general opposition to its use. There is a need for a qualitative study of these reactions to inform the approach of researchers and government agencies when attempting to collect these data. Also, the housing inspection itself has the potential to change householders’ behaviours. For example, safety issues may be discussed during the process of identifying home injury hazards, potentially leading to more healthy behaviour by the householders. A qualitative study could potentially identify such sources of bias to which an uninformed evaluation of health effects of housing improvements is liable.
9.4 Linking to health data
The creation of the home injury hazards index and the measurement of associations between this index and ACC-reported injury events provided several insights. First, consideration needs to be taken of the aetiological links between hazards, injury occurrence and injury reporting and recording. As discussed above, there are some health-promoting features of a home, such as the provision of a children’s play area, that can lead to counterintuitive increases in reported injury rates for homes. For this example, the recording of injury events as taking place in the home (in the yard) can increase injury rates relative to recording events occurring on the road outside the home, recorded as taking place on the road rather than at the home. Thus the nature of injury recording needs to be taken into account when creating an index that is designed to be used for research. An index that truly measures health-promoting features of the home would include an area for children to play as a positive indicator, despite the difficulty of establishing its links to improved health via traditional research methods. Second, easily remediable hazards or easily installed safety features can have associations in the opposite direction to those expected. An obvious example is the provision of grab bars in the bathroom. This safety feature is more likely to be present in houses where they are most needed, where the occupant or occupants have problems with mobility. These same people are more likely to fall in their homes, despite the presence of grab bars.

Healthy Housing Index Pilot Study Final Report 42
Third, there are associations between the type of house and the injury propensity of the occupants. In the pilot sample, a much lower proportion of houses with a small child also had stairs. The presence of stairs is clearly an injury hazard. Small children are more liable to suffer home injury than most other age groups. Fourthly, there appear to be associations between socioeconomic status and house type. Tenants or home owners with scarce resources will be less willing to devote funds to remedying hazards in the home or to purchase safety features. All these insights provided by the pilot need to be considered when forming indices of housing quality and imply that an index that is most useful for assessing the healthiness of a house may need to be different from an index used to measure associations with health outcomes. Based on the positive findings from this research we plan to repeat this study using a much larger sample size. Assuming these finding are replicated, then that would provide good support for using a hazard rating tool to quantify injury risk in houses more generally. Such information could be used to guide remediation action to remove the more important hazards. Aggregate data from the use of such a rating tool would also provide a useful method for assessing progress towards creating a safer domestic environment at a local and eventually national level.

Healthy Housing Index Pilot Study Final Report 43
10 References
Bierre S, Cunningham C, Cunningham M, Baker M, Robinson J-A, Kennedy M (2004) A Healthy Housing Index: a collaborative approach to measuring housing condition. In Europe W (ed), The Second WHO International Housing and Health Symposium. WHO Europe, Vilnius, Lithuania pp. 115-122.
Bierre S, Keall MD, Robinson J, Howden-Chapman P, Baker M (submitted) Building a partnership: the development of a healthy housing index, Health Promotion Journal of Australia:pp.
Bonnefoy XR, Braubach M, Moissonnier B, Monolbaev K, Robbel N (2003) Housing and health in Europe: preliminary results of a pan-European study, American Journal of Public Health 93:pp. 1559-1563.
Clark SJ, Jones M, I P (2005) New Zealand 2005 house condition survey, BRANZ study report No. 142. BRANZ, Wellington, New Zealand.
Court R (2003) The UK's Housing Health and Safety Rating System: where are we now, and where are we going, Healthy Housing: promoting good health conference, Warwick.
Day L, Fildes B, Gordon I, Fitzharris M, Flamer H, Lord S (2002) Randomised factorial trial of falls prevention among older people living in their own homes, British Medical Journal (BMJ) 325:pp. 128-131.
Didham R, Martin I, Wood R, Harrison K (2004) Information Technology systems in general practice medicine in New Zealand, NZ Medical Journal 117:pp.
Gill TM, Williams CS, Tinetti ME (2000) Environmental hazards and the risk of nonsyncopal falls in the homes of community-living older persons, Medical Care 38:pp. 1174-1183.
Howden-Chapman P (2004) Housing standards: a glossary of housing and health., Journal of Epidemiology & Community Health 58:pp. 162-169.
Hutchings CB, Knight S, Reading JC (2003) The use of generalized estimating equations in the analysis of motor vehicle crash data, Accident Analysis and Prevention 35:pp. 3-8.
Isaacs N, Camilleri M, Pollard A (2004) Housing, health and energy, In Howden-Chapman P, Carroll P (eds), Housing and Health. Steele Roberts Wellington.
Isaacs N, Donn M (1993) Health and housing--seasonality in New Zealand mortality, Australian Journal of Public Health 17:pp. 68-70.
Keall MD, Baker M, Howden-Chapman P, Cunningham M (submitted) Association between the number of home injury hazards and home injury, Accident Analysis & Prevention:pp.
Keall MD, Howden-Chapman P, Baker M, Cunningham M (2006a) Issues in the formation of a healthy housing index: a research tool to link housing quality to health outcomes Australasian Housing Researchers' Conference, Adelaide.
Keall MD, Howden-Chapman P, Baker M, Cunningham M (2006b) Issues in the formation of a healthy housing index: a research tool to link housing quality to health outcomes Public Health Association of New Zealand Conference, Palmerston North.
Lyons RA, Sander LV, Weightman AL, Patterson J, Jones SA, Lannon S, Rolfe B, Kemp A, Johansen A (2003) Modification of the home environment for the reduction of injuries, Cochran database of systematic reviews 4:pp.
McLeroy K, Norton B, Kegler M, Burdine J, Sumaya C (2003) Community-Based Interventions., American Journal of Public Health 93:pp. 529-533.
Ministry of Health (2002) Reducing Inequalities in Health, Wellington. Ormandy D (2002) A Health Based Approach to the Assessment of Unsatisfactory Housing -
the UK's Housing Health & Safety Rating System, WHO Housing & Health Symposium, Forli, Italy.
Osborne R, Baker M, Howden-Chapman P (2003) Healthy housing: A concise review of the literature. He Kainga Oranga/ Housing and Health Research Programme, Wellington.

Healthy Housing Index Pilot Study Final Report 44
Page IC, Sharman WR, Bennett AF (1995) Study Report-New Zealand House Condition Survey 1994. BRANZ, New Zealand pp. 1-66.
Peduzzi PN, Concato, J., Kemper, E., Holford, T. R., Feinstein, A. (1996) A simulation study of the number of events per variable in logistic regression analysis., Journal of Clinical Epidemiology 99:pp. 1373-1379.
Ryks J, Kirkpatrick R (2001) The Ethics of Mapping the Poor. University of Waikato, New Zealand., pp. 1-5.
Salmond C, Crampton P, Sutton F (1998) NZDep91: A New Zealand index of deprivation. , Aust N Z J Public Health 22:pp. 95–7.
Statistics New Zealand (1940) New Zealand official yearbook, Wellington, New Zealand. Stewart J (2002) The Housing Health and Safety Rating System - a new method of assessing
housing standards reviewed, Journal of Environmental Health Research 1:pp. 35-41. Zeger SL, Liang KY (1992) An overview of methods for the analysis of longitudinal data.,
Statistics in Medicine 11:pp. 1825-1839.

Healthy Housing Index Pilot Study Final Report 45
11 Appendix: questionnaire used in the pilot
(see following pages)

FINAL VERSION FOR PILOT HEALTHY HOUSING INDEX SURVEY QUESTIONNAIRE House ID: Surveyor: Name: Address: Date: Start time: Finish time: Summary bullet points: Any other comments: 1. GENERAL 1.1 House Age Years Year of construction if known 1.2 Number of storeys Storeys 1.3 House layout draw plan of house (exterior walls only) indicate overall dimensions (including height to eave) indicate percentage glazing to each elevation 1.4 No. of rooms (ignore un-lived-in spaces) Bedrooms number Bathrooms number Lounge/Sitting number Separate dining number Rumpus/Games number Study/Sewing, etc. number Total rooms number

Healthy Housing Index Pilot Study Final Report 47
1.5 Generally the building was Well maintained 1 Reasonably maintained 0 Poorly maintained -1 Very poorly maintained -2 Under construction Yes/No 1/0 1.6 Subjective 'dampness' feel 1.6.1 Dampness Feels dry throughout 2 1 Feels damp in places 0 -1 Feels damp throughout -2 1.6.2 Does the house smell musty? Yes 1 No 0 1.7 Ventilation 1.7.1 Air tightness category airtight 0 post 1960, simple design, airtight joinery and windows some airflow 1 average 2 post 1960, larger than 120 m ² leaky 3 draughty 4 1.7.2 Adequacy of ventilation Minimal (too little) ventilation 1/0 Adequate ventilation 1/0 Excessive (too much) ventilation 1/0 1.8 Electrical wiring OK 0 Old, needs rewiring 1

Healthy Housing Index Pilot Study Final Report 48
1.8.1 General purpose electrical sockets are present in bathroom Yes 1 No 0 1.8.2 All electrical fittings and powerpoints connected with wiring hidden Yes 0 No 1 1.9 Very Substandard Does the building have a: Yes No Floor 1/0 Wall linings 1/0 Ceiling linings 1/0 Windows with glass 1/0 Running water 1/0 Electricity 1/0 Sewage 1/0 Toilet 1/0 Bath or shower 1/0 Laundry facilities 1/0 Cooking facilities 1/0 Yes No Very substandard* 1/0 * If "No" to any previous 'very substandard' questions 2. KITCHEN 2.1 Mould No visible mould 0 Specks of mould 1 Moderate mould patches 2 Large mould patches 3 Extensive blackened areas 4

Healthy Housing Index Pilot Study Final Report 49
2.2 Mechanical ventilation to outside 1/0 to roof space 1/0 to another room 1/0 none 1/0 2.3 Kitchen fittings OK 1/0 If "ok" insert tick and go to Q.2.4 Leaking overflows 1/0 Leaking or dripping taps 1/0 Leaking waste pipes 1/0 (prompt for inspectors – look into cupboards) 2.4 Kitchen door? Yes 1 No 0 2.5 Wall and Ceiling Linings 2.5.1 Condition Good 2 1 Fair 0 -1 Poor -2 2.5.2 Rising damp Yes 1 No 0 2.6 Floor linings 2.6.1 Kitchen has floor? Yes 1 No 0 If "no" go to question 2.7 2.6.2 Condition OK 1/0 If "ok" insert tick and go to Q.2.7 Slippery 1/0 Uneven or sloped 1/0 Water or moisture damaged 1/0 rotten 1/0

Healthy Housing Index Pilot Study Final Report 50
2.7 Range 2.7.1 Type No range 1/0 If no range insert tick and go to question 2.8 Electric 1/0 Gas 1/0 Solid fuel 1/0 2.7.2 Condition OK 1/0 If "ok" insert tick and go to Q.2.7.3 damaged elements 1/0 fire risk 1/0 damaged seals 1/0 2.7.3 Location - e.g. not behind door Safe location 1 Unsafe location 0 2.8 Ergonomics 2.8.1 Worktops & sink rims 2.8.1.1 Between 850 and 1050 mm high. Complies 1 Does not comply 0 2.8.1.2 Between 550 and 650 mm deep Complies 1 Does not comply 0 2.8.1.2 Work space above. Minimum 1900 mm in the front, minimum 1580mm at the back. Complies 1 Does not comply 0 2.8.1.3 Work space in front. 550 mm deep. Complies 1 Does not comply 0

Healthy Housing Index Pilot Study Final Report 51
2.8.2 Ovens 2.8.2.1 High level ovens. 2.8.2.1.1 Work space in front. 2000mm high x 800mm wide x 900mm deep. Complies 1 Does not comply 0 2.8.2.1.2 Adjoining setting down space of 300mm width Complies 1 Does not comply 0 2.8.2.2 Low level ovens 2.8.4.1 Work space in front. 1400mm deep x 800mm wide Complies 1 Does not comply 0 2.8.3 Cooking Hobs. 2.8.3.1 Work space in front. 2000mm high x 600mm deep x 800mm wide Complies 1 Does not comply 0 2.8.4 High Level Storage 2.8.4.1 Highest shelf less than 1350 mm from ground? Yes 1 No 0 2.8.4.2 Highest shelf greater than than 1650 mm from ground? Yes 1 No 0 3. HOT WATER CYLINDER 3.1 Thermostat setting greater than 60 oC (140 oF)? Yes 1 No 0 3.2 Water at tap less than 55 oC? Yes 1 No 0

Healthy Housing Index Pilot Study Final Report 52
3.3 Earthquake restraint? Yes 1 No 0 4. BATHROOM 4.1 Bathroom mould No visible mould 0 Specks of mould 1 Moderate mould patches 2 Large mould patches 3 Extensive blackened areas 4 4.2 Mechanical ventilation to outside 1/0 to roof space 1/0 to another room 1/0 none 1/0 4.3 Bathroom fittings no problems 1/0 broken seat or cistern 1/0 rotten shower linings 1/0 leaking outlets 1/0 Inadequate sealing between bath/shower 1/0 and floor/wall linings 4.4 Bathroom door? Yes 1 No 0 4.5 Wall and Ceiling Linings 4.5.1 Condition Good condition 2 1 Fair 0 -1 Poor -2

Healthy Housing Index Pilot Study Final Report 53
4.5.2 Rising damp Yes 1 No 0 4.6 Floor linings 4.6.1 Bathroom has floor? Yes 1 No 0 If "No" go to question 4.7 4.6.2 Condition OK 1/0 If "ok" insert tick and go to Q.4.7. Slippery 1/0 Uneven or sloped 1/0 rotten 1/0 4.7 Bath/shower 4.7.1 Defects No problems 1/0 Slippery surfaces 1/0 and go to Q.4.7.2 Innappropriate siting of openable windows 1/0 Innappropriate siting of taps and/or waste control 1/0 Inadequate functional space immediately adjacent 1/0 to bath/shower 4.7.2 Handles or grabrails 4.7.2.1 Any handles or grabrails? Yes 1 No 0 If "No" go to question 4.8 4.7.2.2 Condition Good 1 Disrepair 0 4.7.2.3 Location Good 1 Poorly located 0

Healthy Housing Index Pilot Study Final Report 54
4.8 Bathroom ergonomics 4.8.1 Wash basin 4.8.1.1 Bathroom has a wash basin? Yes 1 No 0 If "No" go to question 4.8.2 4.8.1.2 Wash basin about 750 mm from floor Complies 1 Does not comply 0 4.8.1.3 Work space 700mm deep x 1100mm wide x 2000mm high Complies 1 Does not comply 0 4.8.2 Bath 4.8.2.1 Bathroom has a bath? Yes 1 No 0 If "No" go to question 4.8.3 4.8.2.2 Work space 700mm deep x 1100mm wide x 2000mm high Complies 1 Does not comply 0 4.8.3 Shower tray 4.8.3.1 Bathroom has a separate shower? Yes 1 Shower over bath No shower 0 If "No shower" tick and go to question 5. 4.8.3.2 Work space 700mm deep x 800mm wide x 2000mm high Complies 1 Does not comply 0 5. SEPARATE TOILET 5.1 Toilet in the bathroom? Yes If "Yes" tick and go to question 5.7 No

Healthy Housing Index Pilot Study Final Report 55
5.2 Mould No visible mould 0 Specks of mould 1 Moderate mould patches 2 Large mould patches 3 Extensive blackened areas 4 5.3 Mechanical ventilation to outside 1/0 to roof space 1/0 to another room 1/0 none 1/0 5.4 Toilet door? Yes 1 No 0 5.5 Wall and Ceiling Linings 5.5.1 Condition Good condition 2 1 Fair 0 -1 Poor -2 5.5.2 Rising damp Yes 1 No 0 5.6 Floor linings 5.6.1 Toilet has floor? Yes 1 No 0 If "No" go to question 5.7 5.6.2 Condition OK 1/0 If "ok" insert tick and go to Q.5.7 Slippery 1/0 Uneven or sloped 1/0 Rotten 1/0

Healthy Housing Index Pilot Study Final Report 56
5.7 Toilet fittings OK 1/0 If "ok" insert tick and go to Q.5.4 broken seat or cistern 1/0 cistern condensation 1/0 cistern leaks 1/0 bowl leaks 1/0 5.8 Toilet seat 5.8.1 400mm above floor Complies 1 Does not comply 0 5.8.2 Activity space around toilet seat is 800mm wide x 600mm in front x 2000mm high Complies 1 Does not comply 0 5.8.3 Grabrails/handrails by toilet? 5.8.3.1 Any handles or grabrails? Yes 1 No 0 If "No" go to question 6 5.8.3.2 Condition Good 1 Disrepair 0 5.8.3.3 Location Good 1 Poorly located 0 6. INTERNAL STAIRS 6.1 None required 1/0 6.2 Required but not provided 1/0 6.3 Staircase structurally sound? Yes 1 No 0

Healthy Housing Index Pilot Study Final Report 57
6.4 Slippery Yes 1 No 0 6.5 Too steep (greater than 42 degrees)? Yes 1 No 0 6.6 Stair gates provided? 6.6.1 At the top of the stairs? Yes 1 No 0 6.6.2 At the bottom of the stairs? Yes 1 No 0 6.6.3 Stair gate is secure/sturdy? Yes 1 No 0 6.7 Risers OK 1/0 If "ok" insert tick and go to Q.6.8 <150mm or > 180 mm 1/0 Uneven risers - variation < 5 mm 1/0 In disrepair 1/0 6.8 Treads OK (between 275mm and 360mm) 1/0 If "ok" insert tick and go to Q.6.9 Not OK - outside above limits 1/0 Nose projecting >16mm beyond any riser 1/0 Width < 1000mm 1/0 Uneven treads 1/0 In disrepair 1/0 6.9 Handrails 6.9.1 Are there any handrails? Yes 1 No 0 If "No" go to question 6.10.

Healthy Housing Index Pilot Study Final Report 58
6.9.2 Condition OK 1/0 If "ok" insert tick and go to Q.6.10 Not continuous 1/0 Not on both sides 1/0 In disrepair 1/0 Openings greater than 100mm 1/0 Height < 900mm or > 1000mm 1/0 6.10 Landings 6.10.1 Are there landings? Yes 1 No 0 If "No" go to question 6.11. 6.10.2 Landing balustrade OK 1/0 Less than 1000mm height 1/0 Openings to guarding greater than 100mm 1/0 Insufficient strength 1/0 Disrepair 1/0 6.11 Stair lighting Ok 1/0 If "ok" insert tick and go to Q.6.12 Inadequately lit (<two lights) 1/0 Glare 1/0 No light switch at top of stairs 1/0 No light switch at bottom of stairs 1/0 6.12 Stair Hazards None 1/0 If "none" insert tick and go to Q.7 Mirrors or glass doors etc. 1/0 Steps between kitchen & dining spaces 1/0 Steps between bedrooms & toilets 1/0 Insecure carpeting 1/0

Healthy Housing Index Pilot Study Final Report 59
7. LAUNDRY 7.1 Laundry Mould No visible mould 0 Specks of mould 1 Moderate mould patches 2 Large mould patches 3 Extensive blackened areas 4 7.2 Mechanical ventilation (room ) to outside 1/0 to another room 1/0 to roof space 1/0 none 1/0 7.3 Dryer ventilation to outside 1/0 to another room 1/0 to roof space 1/0 none 1/0 7.4 Laundry door? Yes 1 No 0 7.5 Wall and Ceiling Linings 7.5.1 Condition Good 2 1 Fair 0 -1 Poor -2 7.5.2 Rising damp Yes 1 No 0

Healthy Housing Index Pilot Study Final Report 60
7.6 Floor linings 7.6.1 Laundry has floor? Yes 1 No 0 If "No" go to question 7.7. 7.6.2 Condition OK 1/0 If "ok" insert tick and go to Q.7. Slippery 1/0 Uneven or sloped 1/0 rotten 1/0 7.7 Laundry fittings 7.7.1 Leaking outlets? Yes 1 No 0 8. FLOOR 8.1 No floor House has a floor 1 House has no floor 0 If "No" go to question 9. 8.2 Multi-levelled Single level floor 1 Multi-level floor 2 8.3 Floor material Concrete 1/0 Timber 1/0 Particle board 1/0 Plywood 1/0 Other 1/0 8.4 Floor condition OK 1/0 If "ok" insert tick and go to Q.9 Slippery 1/0 Uneven or sloped 1/0 Rotten 1/0

Healthy Housing Index Pilot Study Final Report 61
9. INTERIOR LININGS (Excl. kitchen/bathroom /laundry) 9.1 Wall Insulation (inspect by removing switch at one location) No insulation 1/0 If "no" go to Q.9.2 Fibreglass 1/0 Macerated paper 1/0 Rocwool 1/0 Wool 1/0 Foil 1/0 Other 1/0 9.2 Mould No visible mould 0 Specks of mould 1 Moderate mould patches 2 Large mould patches 3 Extensive blackened areas 4 9.3 Lead paint? Yes 1 No 0 10. WINDOWS 10.1 Presence of windows House has windows Yes 1 No 0 If "No" go to question 11. 10.2 Weathertightness of windows? What percentage of windows are not weather tight? <20% 1 20-39% 2 40-59% 3 60-79% 4 80-100% 5

Healthy Housing Index Pilot Study Final Report 62
10.3 Windows with no glass What percentage of windows have no glass? <20% 1 20-39% 2 40-59% 3 60-79% 4 80-100% 5 10.4 Double glazing 10.4.1 Is there double glazing in the house? Yes 1 If "no" go to Q.10.5 No 0 10.4.2 What percentage of windows are double glazed? <20% 1 20-39% 2 40-59% 3 60-79% 4 80-100% 5 10.5 Openable? 80% - 100% of windows openable 5 60% -79% of windows openable 4 40% - 59% of windows openable 3 20% - 39% of windows openable 2 0% - 19% of windows openable 1 10.6 Closable? 80% - 100% of windows closeable 5 60% -79% of windows closeable 4 40% - 59% of windows closeable 3 20% - 39% of windows closeable 2 0% - 19% of windows closeable 1

Healthy Housing Index Pilot Study Final Report 63
10.7 Broken windows What percentage of window panes are broken? <20% 1 20-39% 2 40-59% 3 60-79% 4 80-100% 5 10.8 Number of windows number Good 2 Adequate 1 Several rooms don't have windows 0 Many rooms don't have windows -1 No windows in house -2 10.9 All floor and low level windows are made of safety glass? Yes 1 No 0 Unable to tell 2 10.10 Plain low indoors glass windows or doors have visibility stickers or tape on them? Yes 1 No 0 10.11 Sills of other windows less than 1100mm above floor level? Yes (Less than 1100mm) 1 No (Greater than 1100 mm) 0 10.12 Catches & openers 10.12.1 What percentage of catches are broken? <20% 1 20-39% 2 40-59% 3 60-79% 4 80-100% 5 Yes, badly placed 1 No, placement OK 0

Healthy Housing Index Pilot Study Final Report 64
10.12.3 Upstairs windows able to be unlatched in an emergency? Yes 1 No 0 Not applicable - single storey 2 10.12.4 Security Secure (lockable) catch type 2 1 Ordinary catch type 0 -1 No catches (i.e. no security) -2 10.13 Excessive north facing glazing posing an overheated risk? Yes, overheating risk 1 No overheating risk 0 11. BALCONIES 11.1 Balcony Yes, balcony 1 No balcony 0 If "No" go to question 12. 11.2 Balustrade OK 1/0 Less than 1000mm height 1/0 Climbable by young children 1/0 Openings to guarding greater than 80mm 1/0 Insufficient strength (flexible more than 30 mm) 1/0 Disrepair 1/0 11.3 Floor OK 1/0 If "ok" insert tick and go to Q.12 Slippery 1/0 Uneven 1/0 Disrepair 1/0

Healthy Housing Index Pilot Study Final Report 65
12. ROOF SPACE 12.1 Access to roof space Yes 1 No 0 If "No" go to question 13. 12.2 Ceiling Insulation 12.2.1 Type No ceiling insulation 1/0 If "no" insert tick and go to Q.12.3 Fibreglass 1/0 Macerated paper 1/0 Rocwool 1/0 Wool 1/0 Foil 1/0 Other 1/0 12.2.2 Thickness <50mm 1 50-74 mm 2 75-99 mm 3 100-149 mm 4 150 mm + 5 12.2.3 Percent (%) cover <20% 1 20-39% 2 40-59% 3 60-79% 4 80-100% 5 12.3 Underlay 12.3.1 Any underlay? Yes 1 No 0 If "No" go to question 12.4

Healthy Housing Index Pilot Study Final Report 66
12.3.2 Underlay condition Perfect 2 1 Acceptable 0 -1 Useless -2 12.4 Roof space moisture content 12.4.1 A joist reading number 12.4.2 A rafter reading number 12.5 Internal header Tank No header tank 1/0 If "no" insert tick and go to Q.13 Adequate condition 1/0 unrestrained 1/0 leaking 1/0 no lid 1/0 no tray 1/0 hazards in tank 1/0 13. EXTERIOR DOORS 13.1 No exterior doors House has no exterior doors 1 If no exterior doors go to question 14. House has exterior doors 0 13.2 Weathertight? Yes 1 No 0 13.3 Airtight? Yes 1 No 0 13.4 Excessively strong closers Yes 1 No 0

Healthy Housing Index Pilot Study Final Report 67
14. HEATING (Excl. kitchen/bathroom /laundry) 14.1 Number of fixed heaters no fixed heaters number If "no" insert tick and go to Q.14.2 electric night store number electric panel heaters number electric radiators number electric central heating number electric under-floor heating number electric wall fan number heat pumps number enclosed wood burner/pot belly number open fire (used, not boarded over) number solid or liquid fuel fired central heating number reticulated natural gas (flued), non central number reticulated natural gas (unflued), non central number gas central heating number hot water central heating number gas underfloor heating number hot water underfloor heating number air conditioner number 14.2 Number of portable heaters no portable heaters number If "no" insert tick and go to Q.14.3 electric fan / bar radiator number portable convection heater number portable kerosene number LPG heater number Dehumidifier number 14.3 Total used heating capacity None 0 Less than 1kW 1 Between 1 and 2 kW 2 Greater than 2 kW & less than 5kW 3 More than 5kW 4

Healthy Housing Index Pilot Study Final Report 68
14.4 Condition of heaters OK 0 Unsafe 1 14.5 Fireplace/Chimney OK 1/0 If "ok" insert tick and go to Q.15 chimney touching combustible materials 1/0 poor flue installation 1/0 no fire guard provided 1/0 15. OTHER MECHANICAL SERVICES 15.1 What are the other mechanical services? None 1/0 If "none" insert tick and go to Q.16 DVS system 1/0 Air conditioning 1/0 Heat recovery ventilation 1/0 16. FIRE SAFETY 16.1 Smoke Alarms 16.1.1 Total number of working smoke alarms number 16.1.2 Number of working smoke alarms in these locations: Hallway number Lounge number Bedrooms number Kitchen number Dining number Garage number 16.1.3 How powered? Mains 1 Battery 2 16.1.4 Are the smoke alarms interconnected? Yes 1 No 0

Healthy Housing Index Pilot Study Final Report 69
16.1.5 Are they connected to a 24/7 monitoring system? Yes 1 No 0 16.2 Additional fire protection equipment: No additional fire protection equipment 1/0 If "no" insert tick and go to Q16.3 Fire Extinguisher 1/0 Hose Reel 1/0 Fire Blanket 1/0 Sprinkler system 1/0 Carbon monoxide alarms 1/0 16.3 Sources of ignition No sources of ignition 1/0 If "no" insert tick and go to Q16.4 Dangerously sited heaters 1/0 Dangerously sited cooker 1/0 Dangerously sited fireplaces 1/0 Insufficient or poorly sited electric sockets 1/0 Use of candles or naked flames 1/0 Overloaded electric sockets 1/0 16.4 Chimneys 16.4.1 Brick/masonry chimney cracked? Yes 1 No 0 16.4.2 Is the chimney in close vicinity to combustable materials? Yes 1 No 0 16.5 Flammibilty of dwelling contents 16.5.1 Any wood or other flammable material used for the wall linings? Yes 1 No 0 16.5.2 Any wood or other flammable material used for the ceiling linings? Yes 1 No 0

Healthy Housing Index Pilot Study Final Report 70
16.5.3 Rooms cluttered with combustible materials? Yes 1 No 0 16.5.4 More than the normal amount of upholstered furniture? Yes 1 No 0 16.6 Building factors that will enhance flame spread 16.6.1 Construction of internal doors Solid core 0 Hollow core 1 16.6.2 Are the flooring coverings predominately nylon or other synthetic? Yes 1 No 0 16.7 Inadequate means of egress 16.7.1 Are there at least two doors to the outside on the ground floor? Yes 1 No 0 16.7.2 Escape from upper floors 16.7.2.0 House more than one storey? Yes 1 No 0 16.7.2.1 If more than one storey is there an alternative means of escape? Yes 1 No 0

Healthy Housing Index Pilot Study Final Report 71
17. SECURITY 17.1 Security features No security features 1/0 If "no" insert tick and go to Q.18 Burglar alarm 1/0 Security lights to all entry points 1/0 Security lights to most entry points 1/0 Safety catches on all vulnerable windows 1/0 18. ERGONOMICS 18.1 Highest storage space less than 1650mm from floor (1350 mm for the elderly) Complies 1 Does not comply 0 19. ENTRAPMENT OR COLLISION 19.1 Do any doors open to small circulation areas, corridors, landings or staircases? Yes 1 No 0 19.2 Do any windows open across external pathways? Yes 1 No 0 20. POISONS 20.1 Kitchen: Cupboards available to store cleaning substances out of reach of young children, or with childproof latches Yes 1 No 0 20.2 Bathroom: Cupboards available to store cleaning substances out of reach of young children, or with childproof latches Yes 1 No 0

Healthy Housing Index Pilot Study Final Report 72
20.3 Laundry: Cupboards available to store cleaning substances out of reach of young children, or with childproof latches Yes 1 No 0 20.4 Garage etc.: Storage available to store poisons secure from young children Yes 1 No 0 21. WALL CLADDING 21.1 Type Weatherboards 1/0 Concrete 1/0 Brick 1/0 Concrete block 1/0 Stucco 1/0 Fibre cement sheet 1/0 Fibre cement plank 1/0 EIFS 1/0 Corrugated steel 1/0 Solid timber 1/0 Asbestos 1/0 Plywood 1/0 Other 1/0 21.2 Paint Condition Good 4 Dull 3 Peeling flaking 2 Mainly gone 1 No paint 0 21.3 Lead paint? Yes, lead paint 1 No, not lead paint 0

Healthy Housing Index Pilot Study Final Report 73
21.4 Cladding Condition Good 5 Good/moderate 4 Moderate 3 Moderate/poor 2 Poor 1 21.5 Provision for scaffolding when painting 21.5.1 Parts of house 3 or more storeys high? Yes 1 No 0 21.5.2 If 3 or more storeys high, attachments for erecting scaffolding? Yes 1 No 0 22. ROOF 22.1 Roof structurally sound? Yes 1 No 0 22.2 Construction Material Galvanised Corrugated Steel 1/0 Coil Coated Steel 1/0 Concrete Tile 1/0 Clay Tiles 1/0 Metal Tiles 1/0 Fibre cement tile 1/0 Asbestos 1/0 Rubber over plywood 1/0 Concrete 1/0 22.3 Weathertightness Weathertight 2 1 Moderate leaks 0 -1 Extensive leaks -2

Healthy Housing Index Pilot Study Final Report 74
23. SPOUTING AND DOWN PIPES 23.1 Defects None 1/0 If "none" insert tick and go to Q.24 Missing spouting/downpipes 1/0 Reverse fall 1/0 Holes 1/0 Disharge on ground 1/0 24. BASEMENT/GARAGE (One or more walls below ground) 24.1 Is there a basement/garage? Yes 1 No 0 If no basement/garage go to question 25. 24.2 Use Not used 0 Storage 1 Laundry 2 Rumpus room 3 Living/Bedroom 4 Bathroom/toilet 5 Other 6 Answer questions 24.3 to 24.8 only if basement lived in: 24.3 Odour None 0 1 Earthy 2 3 Musty 4 24.4 Natural Light 2+ walls of basement let in natural light 4 3 One only basement wall lets in natural light 2 1 No natural light into basement 0

Healthy Housing Index Pilot Study Final Report 75
24.5 Basement insulation Yes, well insulated 4 3 Some insulation 2 1 No insulation 0 24.6 Basement ventilation Adequate 1 Inadequate 0 24.7 Water seepage through retaining walls? Yes 1 No 0 24.8 Basement mould No visible mould 0 Specks of mould 1 Moderate mould patches 2 Large mould patches 3 Extensive blackened areas 4 25. SUBFLOOR 25.1 House has subfloor? Yes 1 No 0 If no subfloor go to question 26. 25.2 Access to subfloor possible? Yes 1 No 0 If access to subfloor not possible go to question 26. 25.3 Services discharging under house No discharges 1/0 If "no" insert tick and go to Q.25.4 Water pipes discharging 1/0 Wastes discharging 1/0 Sewer pipes discharging 1/0 Down pipes discharging 1/0

Healthy Housing Index Pilot Study Final Report 76
25.4 Water ponding under house? Yes 1 No 0 25.5 Ground covering Complete & intact 4 3 Incomplete/ partly damaged 2 1 None 0 25.6 Floor insulation None 1/0 If "none" go to Q.25.7 Foil 1/0 Fibreglass 1/0 Polystyrene 1/0 Other 1/0 25.7 Subfloor ventilation 25.7.1 Subfloor ventilation? Yes 1 None 0 25.7.2 Ventilators 25.7.2.1 Ventilators required? No (baseboards, or subfloor open, of concrete floor) 0 Yes 1 25.7.2.2 Adequate number and positioning? (on all sides, less than 1.8m spacing) Yes 1 No 0 25.7.2.3 Ventilators obstructed? No obstructions 0 1% - 25% obstructed 1 26% - 50% obstructed 2 51% - 75% obstructed 3 76% - 100% obstructed 4

Healthy Housing Index Pilot Study Final Report 77
25.8 Fungi and mould on joists and bearers? Yes 1 No 0 25.9 Items stored under house Percent area taken up <20% 1 20-39% 2 40-59% 3 60-79% 4 80-100% 5 25.10 Foundations structurally sound? Yes 1 No 0 25.11 Subfloor moisture (readings on two joists) Reading at joist 1 number Reading at joist 2 number 26. SITE 26.1 Site drainage Very well drained 2 1 Average drainage 0 -1 Very poorly drained -2 26.2 Drains No problems 1/0 If "no" insert tick and go to Q.26.3 Blocked septic tanks 1/0 Blocked sewer drains 1/0 Blocked storm water drains 1/0

Healthy Housing Index Pilot Study Final Report 78
26.3 Slope of site in general Level 0 Gentle slopes 1 Steep 2 Terraced 3 Near vertical 4 26.4 Slope of childrens' play area No play area 1/0 If there is no play area insert tick and go to Q.26.5 Level 0 Gentle slopes 1 Steep 2 Terraced 3 Near vertical 4 26.5 Land stability Stable 2 1 Sign of potential unstability 0 -1 Unstable -2 26.6 Pathways 26.6.1 Any pathways? Yes, pathways 1 No pathways 0 If no pathways go to question 26.7 26.6.2 Pathway problems Yes No No problems 1/0 Too steep (steeper than 1 in 14) 1/0 Slippery (e.g. moss/mould, wet clay) 1/0 Overgrown 1/0 Uneven or broken surface 1/0 Poorly lit (<50 lux) 1/0

Healthy Housing Index Pilot Study Final Report 79
26.6.3 A pathway passes beneath a window/shutter/awning which opens outwards and the distance between a path surface and the bottom of a window/shutter/awning is less than 2.1m Yes 1 No 0 26.7 External steps 26.7.1 Any external steps? Yes 1 No 0 If no external steps insert tick then go to question 26.8 26.7.2 Is there a gap between the steps and the building? Yes 1 No 0 26.7.2.1 Size of gap number of mm 26.7.3 Steps necessary (if slope steeper than 1 in 14) Necessary 0 Unnecessary 1 26.7.4 Flights with less than 3 steps grouped together Yes 1 No 0 26.7.5 Step handrails (needed if slope steeper than 1 in 20) Not needed 1/0 insert tick and go to Q.26.7.6 Needed and not provided 1/0 insert tick and go to Q.26.7.6 Needed and provided 1/0 insert tick and go to Q.26.7.5.1 26.7.5.1 Handrail condition Good 1 Poor 0 26.7.5.2 Handrail position Openings greater than 100mm 1/0 Height less than 900mm or greater than 1000mm 1/0

Healthy Housing Index Pilot Study Final Report 80
26.7.6 Treads & risers Good 1/0 If "good" insert tick and go to Q.26.7.7 missing treads 1/0 risers of different heights 1/0 unsafe surface 1/0 slippery surface 1/0 unpainted edges of steps 1/0 26.7.7 Structure Safe 0 Unsafe 1 26.7.8 Visibility at night Adequate (minimum 50 lux at ground level) 0 Inadequate 1 26.8 Decking 26.7.1 Any decking Yes 1 No 0 If no decking go to question 26.9 26.8.2 Decking handrails: required if decking higher than 1200mm from ground Not needed 1/0 insert tick and go to Q.26.8.3 Needed and not provided 1/0 insert tick and go to Q.26.8.3 Needed and provided 1/0 insert tick and go to Q.26.8.2.1 26.8.2.1 Handrail condition Balustrade at least 1000mm high 1/0 Rails less than 80 mm apart? 1/0 26.8.3 Decking structure Sound condition 0 Unsound condition e.g. decaying or dilapidated 1 26.9 Fences & gates 26.9.1 Any fences or gates? Yes 1 No 0 If "No" go to question 26.10

Healthy Housing Index Pilot Study Final Report 81
26.9.2 Condition OK 0 Not functional 1 26.9.3 Fenced play area for children? Yes 1 No 0 If "No" go to question 26.10 26.9.3.1 Fence condition OK 0 Not functional 1 26.9.3.2 Fence type Mesh 1/0 If mesh insert tick and go to Q.26.9.3.4. Other 1/0 If 'non-mesh' insert tick and go to Q.26.9.3.3 26.9.3.3 'Non-mesh' fence is at least 1200mm above surrounding ground or fixtures Yes 1 No 0 26.9.3.4 Mesh fence is at least 1800mm above surrounding ground or fixtures Yes 1 No 0 Yes, separated from all hazards 1 No, not fenced from all hazards 0 26.9.3.6 Gates self-closing? Yes, all self-closing 1 No, some or none self-closing 0 26.9.3.7 Gates prone to fast or heavy closing (strong closers, windy area)? Yes, a problem 1 No problem 0 26.10 Outdoor Lighting 26.10.1 Is there outdoor lighting? Yes 1 If "no" go to Q.26.11 No 0

Healthy Housing Index Pilot Study Final Report 82
26.10.2 Is the lighting adequate? (50 lux minimum) Yes 1 No 0 26.10.3 Is all of the external lighting appropriately located? Yes 1 No 0 26.11 Pools (including spas) 26.11.1 Any pools or spas? Yes 1 No 0 If "No" go to question 26.12 26.11.2 Pool fence at least 1200 mm high (if pool>400mm depth) Yes 1 No 0 26.12 Driveway fenced? Yes 1 No 0 26.13 Shade (Over year period) House always in shade 4 House has some shade in winter 3 House in shade throughout winter 2 House loses sun in late afternoon or early morning 1 House never shaded 0 26.14 Wind exposure (use diagram below) Sheltered 1 Medium sheltered 2 Little shelter 3 Medium exposed 4 Exposed 5

Healthy Housing Index Pilot Study Final Report 83
26.15 Noise from outdoors Always quiet 0 Mostly quiet 1 Moderate noise 2 Loud noise 3 Constant loud noise 4 26.16 Outdoor air quality OK 1/0 If "ok" insert tick - and finish! Adjacent to busy road 1/0 Adjacent to unsealed road 1/0 Close to petrol station 1/0 Close to air polluting industries 1/0 Close to commercial orchard 1/0 Other factors lessening outdoor air quality 1/0