Embed Size (px)
Citation preview
1
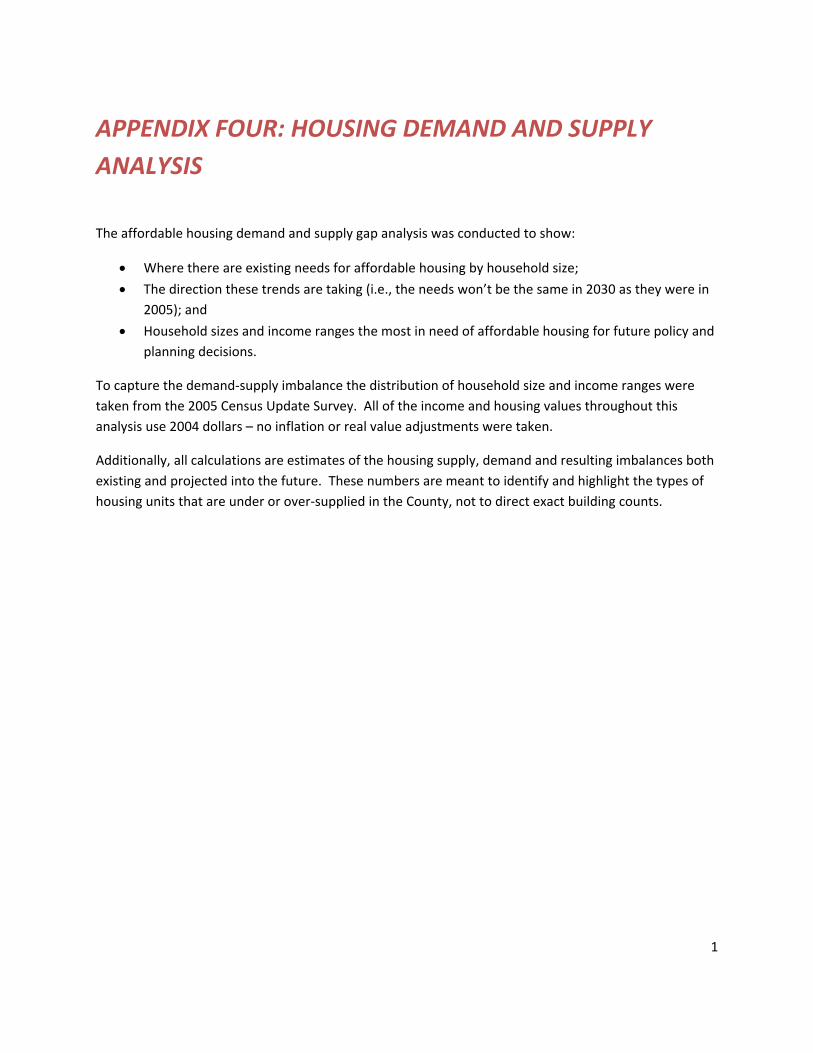
APPENDIX FOUR: HOUSING DEMAND AND SUPPLY ANALYSIS
The affordable housing demand and supply gap analysis was conducted to show:
• Where there are existing needs for affordable housing by household size;
• The direction these trends are taking (i.e., the needs won’t be the same in 2030 as they were in 2005); and
• Household sizes and income ranges the most in need of affordable housing for future policy and planning decisions.
To capture the demand‐supply imbalance the distribution of household size and income ranges were taken from the 2005 Census Update Survey. All of the income and housing values throughout this analysis use 2004 dollars – no inflation or real value adjustments were taken.
Additionally, all calculations are estimates of the housing supply, demand and resulting imbalances both existing and projected into the future. These numbers are meant to identify and highlight the types of housing units that are under or over‐supplied in the County, not to direct exact building counts.
2
SUMMARY OF FINDINGS
FINDING ONE: THERE IS AN EXISTING AND PROJECTED DEFICIENCY IN
AFFORDABLE HOUSING FOR LOW AND MODERATE INCOME HOUSEHOLDS
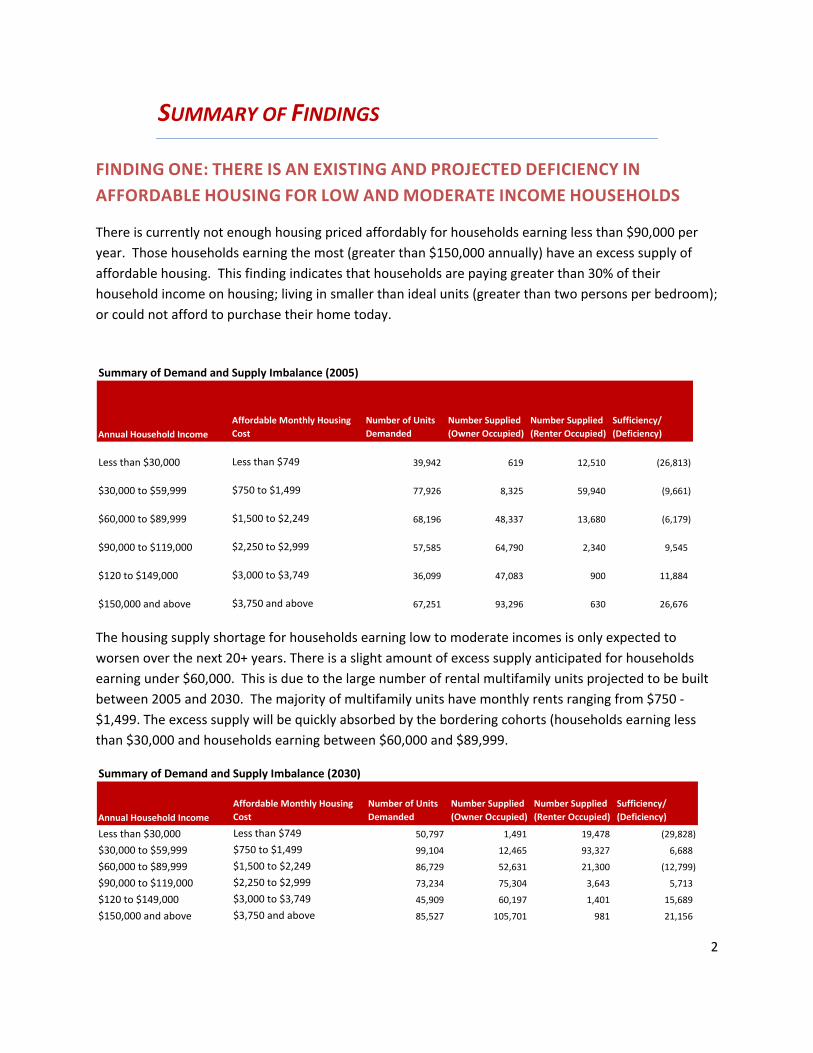
There is currently not enough housing priced affordably for households earning less than $90,000 per year. Those households earning the most (greater than $150,000 annually) have an excess supply of affordable housing. This finding indicates that households are paying greater than 30% of their household income on housing; living in smaller than ideal units (greater than two persons per bedroom); or could not afford to purchase their home today.
Summary of Demand and Supply Imbalance (2005)
Annual Household IncomeAffordable Monthly Housing Cost
Number of Units Demanded
Number Supplied (Owner Occupied)
Number Supplied (Renter Occupied)
Sufficiency/ (Deficiency)
Less than $30,000 Less than $749 39,942 619 12,510 (26,813)
$30,000 to $59,999 $750 to $1,499 77,926 8,325 59,940 (9,661)
$60,000 to $89,999 $1,500 to $2,249 68,196 48,337 13,680 (6,179)
$90,000 to $119,000 $2,250 to $2,999 57,585 64,790 2,340 9,545
$120 to $149,000 $3,000 to $3,749 36,099 47,083 900 11,884
$150,000 and above $3,750 and above 67,251 93,296 630 26,676
The housing supply shortage for households earning low to moderate incomes is only expected to worsen over the next 20+ years. There is a slight amount of excess supply anticipated for households earning under $60,000. This is due to the large number of rental multifamily units projected to be built between 2005 and 2030. The majority of multifamily units have monthly rents ranging from $750 ‐ $1,499. The excess supply will be quickly absorbed by the bordering cohorts (households earning less than $30,000 and households earning between $60,000 and $89,999.
Summary of Demand and Supply Imbalance (2030)
Annual Household IncomeAffordable Monthly Housing Cost
Number of Units Demanded
Number Supplied (Owner Occupied)
Number Supplied (Renter Occupied)
Sufficiency/ (Deficiency)
Less than $30,000 Less than $749 50,797 1,491 19,478 (29,828)
$30,000 to $59,999 $750 to $1,499 99,104 12,465 93,327 6,688
$60,000 to $89,999 $1,500 to $2,249 86,729 52,631 21,300 (12,799)
$90,000 to $119,000 $2,250 to $2,999 73,234 75,304 3,643 5,713
$120 to $149,000 $3,000 to $3,749 45,909 60,197 1,401 15,689
$150,000 and above $3,750 and above 85,527 105,701 981 21,156
3
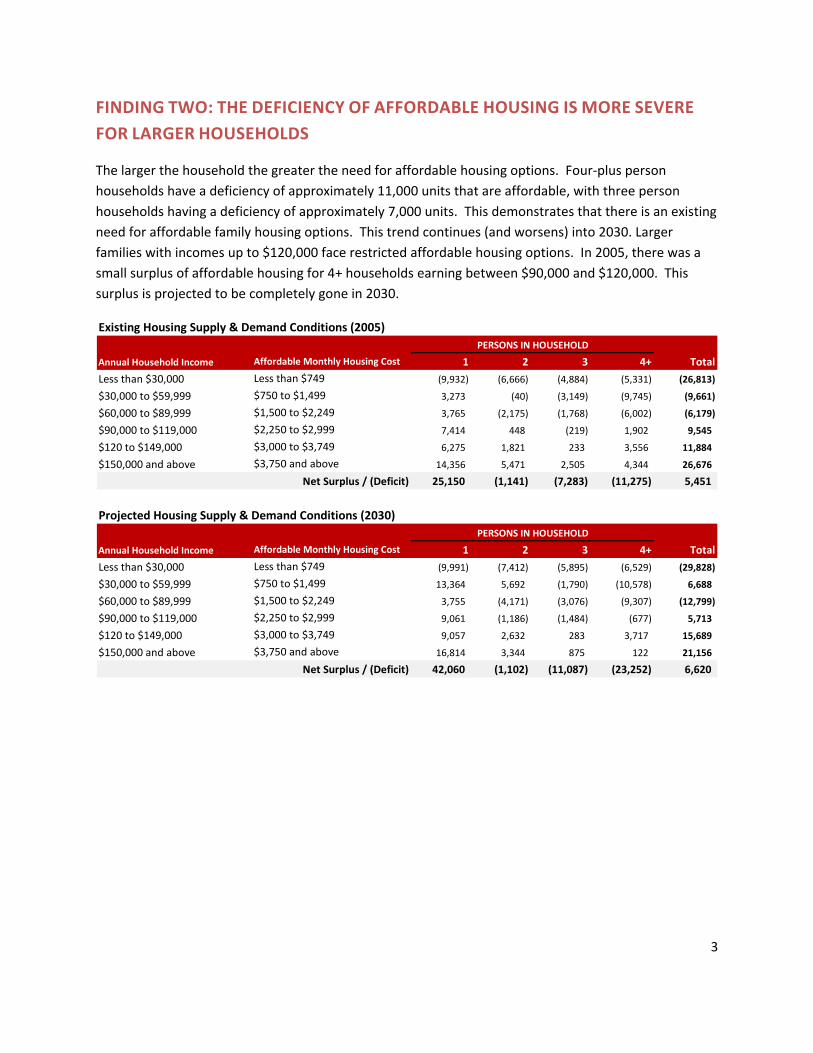
FINDING TWO: THE DEFICIENCY OF AFFORDABLE HOUSING IS MORE SEVERE FOR LARGER HOUSEHOLDS
The larger the household the greater the need for affordable housing options. Four‐plus person households have a deficiency of approximately 11,000 units that are affordable, with three person households having a deficiency of approximately 7,000 units. This demonstrates that there is an existing need for affordable family housing options. This trend continues (and worsens) into 2030. Larger families with incomes up to $120,000 face restricted affordable housing options. In 2005, there was a small surplus of affordable housing for 4+ households earning between $90,000 and $120,000. This surplus is projected to be completely gone in 2030.
Existing Housing Supply & Demand Conditions (2005)
Annual Household Income Affordable Monthly Housing Cost 1 2 3 4+ Total
Less than $30,000 Less than $749 (9,932) (6,666) (4,884) (5,331) (26,813)
$30,000 to $59,999 $750 to $1,499 3,273 (40) (3,149) (9,745) (9,661)
$60,000 to $89,999 $1,500 to $2,249 3,765 (2,175) (1,768) (6,002) (6,179)
$90,000 to $119,000 $2,250 to $2,999 7,414 448 (219) 1,902 9,545
$120 to $149,000 $3,000 to $3,749 6,275 1,821 233 3,556 11,884
$150,000 and above $3,750 and above 14,356 5,471 2,505 4,344 26,676
25,150 (1,141) (7,283) (11,275) 5,451Net Surplus / (Deficit)
PERSONS IN HOUSEHOLD
Projected Housing Supply & Demand Conditions (2030)
Annual Household Income Affordable Monthly Housing Cost 1 2 3 4+ Total
Less than $30,000 Less than $749 (9,991) (7,412) (5,895) (6,529) (29,828)
$30,000 to $59,999 $750 to $1,499 13,364 5,692 (1,790) (10,578) 6,688
$60,000 to $89,999 $1,500 to $2,249 3,755 (4,171) (3,076) (9,307) (12,799)
$90,000 to $119,000 $2,250 to $2,999 9,061 (1,186) (1,484) (677) 5,713
$120 to $149,000 $3,000 to $3,749 9,057 2,632 283 3,717 15,689
$150,000 and above $3,750 and above 16,814 3,344 875 122 21,156
42,060 (1,102) (11,087) (23,252) 6,620
PERSONS IN HOUSEHOLD
Net Surplus / (Deficit)
4
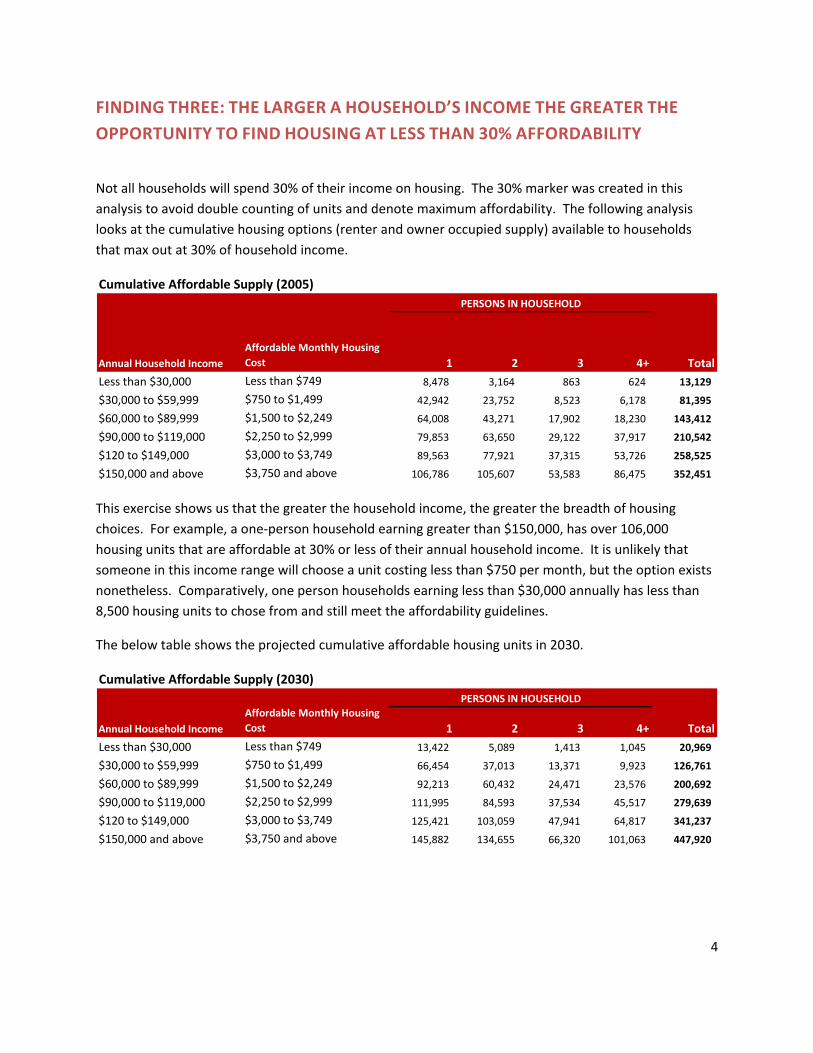
FINDING THREE: THE LARGER A HOUSEHOLD’S INCOME THE GREATER THE OPPORTUNITY TO FIND HOUSING AT LESS THAN 30% AFFORDABILITY
Not all households will spend 30% of their income on housing. The 30% marker was created in this analysis to avoid double counting of units and denote maximum affordability. The following analysis looks at the cumulative housing options (renter and owner occupied supply) available to households that max out at 30% of household income.
Cumulative Affordable Supply (2005)
Annual Household IncomeAffordable Monthly Housing Cost 1 2 3 4+ Total
Less than $30,000 Less than $749 8,478 3,164 863 624 13,129
$30,000 to $59,999 $750 to $1,499 42,942 23,752 8,523 6,178 81,395
$60,000 to $89,999 $1,500 to $2,249 64,008 43,271 17,902 18,230 143,412
$90,000 to $119,000 $2,250 to $2,999 79,853 63,650 29,122 37,917 210,542
$120 to $149,000 $3,000 to $3,749 89,563 77,921 37,315 53,726 258,525
$150,000 and above $3,750 and above 106,786 105,607 53,583 86,475 352,451
PERSONS IN HOUSEHOLD
This exercise shows us that the greater the household income, the greater the breadth of housing choices. For example, a one‐person household earning greater than $150,000, has over 106,000 housing units that are affordable at 30% or less of their annual household income. It is unlikely that someone in this income range will choose a unit costing less than $750 per month, but the option exists nonetheless. Comparatively, one person households earning less than $30,000 annually has less than 8,500 housing units to chose from and still meet the affordability guidelines.
The below table shows the projected cumulative affordable housing units in 2030.
Cumulative Affordable Supply (2030)
Annual Household IncomeAffordable Monthly Housing Cost 1 2 3 4+ Total
Less than $30,000 Less than $749 13,422 5,089 1,413 1,045 20,969
$30,000 to $59,999 $750 to $1,499 66,454 37,013 13,371 9,923 126,761
$60,000 to $89,999 $1,500 to $2,249 92,213 60,432 24,471 23,576 200,692
$90,000 to $119,000 $2,250 to $2,999 111,995 84,593 37,534 45,517 279,639
$120 to $149,000 $3,000 to $3,749 125,421 103,059 47,941 64,817 341,237
$150,000 and above $3,750 and above 145,882 134,655 66,320 101,063 447,920
PERSONS IN HOUSEHOLD

5
FINDING FOUR: THERE IS AN OPPORTUNITY TO RETHINK HOUSING
PREFERENCES
Housing preference can be thought of as fluid. The notion of attached (townhouse) housing units in the suburbs did not become mainstream until the 1970s. Prior to the 1970s, attached housing was seen as only occurring in cities, with little chance of market acceptability in the suburbs. Once attached housing was built in the suburbs, it became obvious that families would accept denser housing and even seek it out in some cases. Since the 1970s, single family attached housing has been the most prevalent form of new housing stock built in the County.
The current debate is over market acceptability of suburban condos aimed at families. The current mantra is that families (outside of those living in large urban areas, such as New York City, for example) are averse to living in dense condos. As land availability dwindles, and single‐family housing prices soar beyond the means of the majority of households, families should begin to accept and choose high‐density living if the correct amenities are in place. These amenities include: open, green space, proximity to good schools and County services, proximity to family‐friendly entertainment and activities, and a sense of community.
Affordability in a good community drives purchasers at all life stages. The predominance of attached housing in the suburbs began not because families and young professionals all of a sudden decided that they wanted attached product, but rather because they could afford these housing products in their neighborhood of choice. The key to encouraging families to live in high density, condos and apartments is to provide affordable options. Therefore, the focus on only building small, luxury condominiums and apartments must be switched to a focus on providing quality, affordable, dense condominiums and apartments in a variety of sizes.
Matrix of Housing Options by Household Size
Housing Options 1 2 3 4+
Efficiency Condo/Apt. X
One Bedroom Condo/Apt. X X
Two Bedroom Condo/Apt X X X
Three‐plus Bedroom Condo/Apt. X X X
Townhouse/Duplex X X X X
Single Family Detached X X X X
PERSONS IN HOUSEHOLD
6
METHODOLOGY
HOUSING DEMAND – 2005 AND 2030
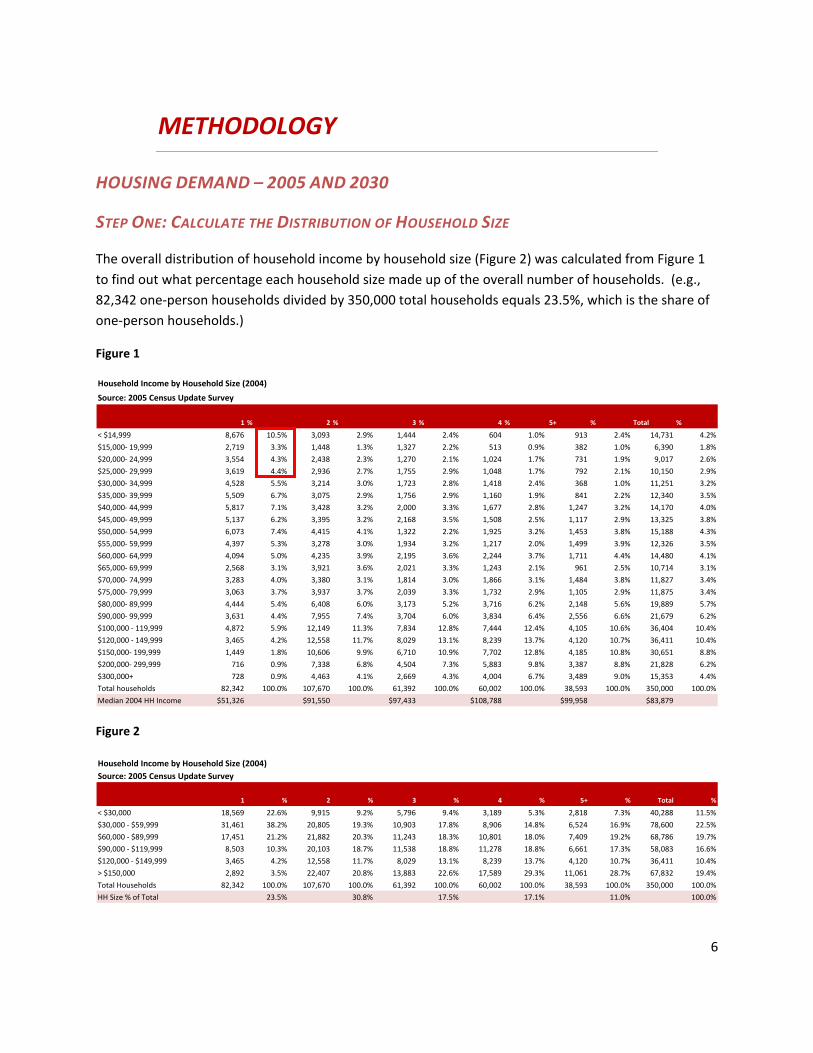
STEP ONE: CALCULATE THE DISTRIBUTION OF HOUSEHOLD SIZE
The overall distribution of household income by household size (Figure 2) was calculated from Figure 1 to find out what percentage each household size made up of the overall number of households. (e.g., 82,342 one‐person households divided by 350,000 total households equals 23.5%, which is the share of one‐person households.)
Figure 1
Household Income by Household Size (2004)
Source: 2005 Census Update Survey
1 % 2 % 3 % 4 % 5+ % Total %
< $14,999 8,676 10.5% 3,093 2.9% 1,444 2.4% 604 1.0% 913 2.4% 14,731 4.2%
$15,000‐ 19,999 2,719 3.3% 1,448 1.3% 1,327 2.2% 513 0.9% 382 1.0% 6,390 1.8%
$20,000‐ 24,999 3,554 4.3% 2,438 2.3% 1,270 2.1% 1,024 1.7% 731 1.9% 9,017 2.6%
$25,000‐ 29,999 3,619 4.4% 2,936 2.7% 1,755 2.9% 1,048 1.7% 792 2.1% 10,150 2.9%
$30,000‐ 34,999 4,528 5.5% 3,214 3.0% 1,723 2.8% 1,418 2.4% 368 1.0% 11,251 3.2%
$35,000‐ 39,999 5,509 6.7% 3,075 2.9% 1,756 2.9% 1,160 1.9% 841 2.2% 12,340 3.5%
$40,000‐ 44,999 5,817 7.1% 3,428 3.2% 2,000 3.3% 1,677 2.8% 1,247 3.2% 14,170 4.0%
$45,000‐ 49,999 5,137 6.2% 3,395 3.2% 2,168 3.5% 1,508 2.5% 1,117 2.9% 13,325 3.8%
$50,000‐ 54,999 6,073 7.4% 4,415 4.1% 1,322 2.2% 1,925 3.2% 1,453 3.8% 15,188 4.3%
$55,000‐ 59,999 4,397 5.3% 3,278 3.0% 1,934 3.2% 1,217 2.0% 1,499 3.9% 12,326 3.5%
$60,000‐ 64,999 4,094 5.0% 4,235 3.9% 2,195 3.6% 2,244 3.7% 1,711 4.4% 14,480 4.1%
$65,000‐ 69,999 2,568 3.1% 3,921 3.6% 2,021 3.3% 1,243 2.1% 961 2.5% 10,714 3.1%
$70,000‐ 74,999 3,283 4.0% 3,380 3.1% 1,814 3.0% 1,866 3.1% 1,484 3.8% 11,827 3.4%
$75,000‐ 79,999 3,063 3.7% 3,937 3.7% 2,039 3.3% 1,732 2.9% 1,105 2.9% 11,875 3.4%
$80,000‐ 89,999 4,444 5.4% 6,408 6.0% 3,173 5.2% 3,716 6.2% 2,148 5.6% 19,889 5.7%
$90,000‐ 99,999 3,631 4.4% 7,955 7.4% 3,704 6.0% 3,834 6.4% 2,556 6.6% 21,679 6.2%
$100,000 ‐ 119,999 4,872 5.9% 12,149 11.3% 7,834 12.8% 7,444 12.4% 4,105 10.6% 36,404 10.4%
$120,000 ‐ 149,999 3,465 4.2% 12,558 11.7% 8,029 13.1% 8,239 13.7% 4,120 10.7% 36,411 10.4%
$150,000‐ 199,999 1,449 1.8% 10,606 9.9% 6,710 10.9% 7,702 12.8% 4,185 10.8% 30,651 8.8%
$200,000‐ 299,999 716 0.9% 7,338 6.8% 4,504 7.3% 5,883 9.8% 3,387 8.8% 21,828 6.2%
$300,000+ 728 0.9% 4,463 4.1% 2,669 4.3% 4,004 6.7% 3,489 9.0% 15,353 4.4%
Total households 82,342 100.0% 107,670 100.0% 61,392 100.0% 60,002 100.0% 38,593 100.0% 350,000 100.0%
Median 2004 HH Income $51,326 $91,550 $97,433 $108,788 $99,958 $83,879
Figure 2
Household Income by Household Size (2004)Source: 2005 Census Update Survey
1 % 2 % 3 % 4 % 5+ % Total %
< $30,000 18,569 22.6% 9,915 9.2% 5,796 9.4% 3,189 5.3% 2,818 7.3% 40,288 11.5%
$30,000 ‐ $59,999 31,461 38.2% 20,805 19.3% 10,903 17.8% 8,906 14.8% 6,524 16.9% 78,600 22.5%
$60,000 ‐ $89,999 17,451 21.2% 21,882 20.3% 11,243 18.3% 10,801 18.0% 7,409 19.2% 68,786 19.7%
$90,000 ‐ $119,999 8,503 10.3% 20,103 18.7% 11,538 18.8% 11,278 18.8% 6,661 17.3% 58,083 16.6%
$120,000 ‐ $149,999 3,465 4.2% 12,558 11.7% 8,029 13.1% 8,239 13.7% 4,120 10.7% 36,411 10.4%
> $150,000 2,892 3.5% 22,407 20.8% 13,883 22.6% 17,589 29.3% 11,061 28.7% 67,832 19.4%
Total Households 82,342 100.0% 107,670 100.0% 61,392 100.0% 60,002 100.0% 38,593 100.0% 350,000 100.0%
HH Size % of Total 23.5% 30.8% 17.5% 17.1% 11.0% 100.0%
7
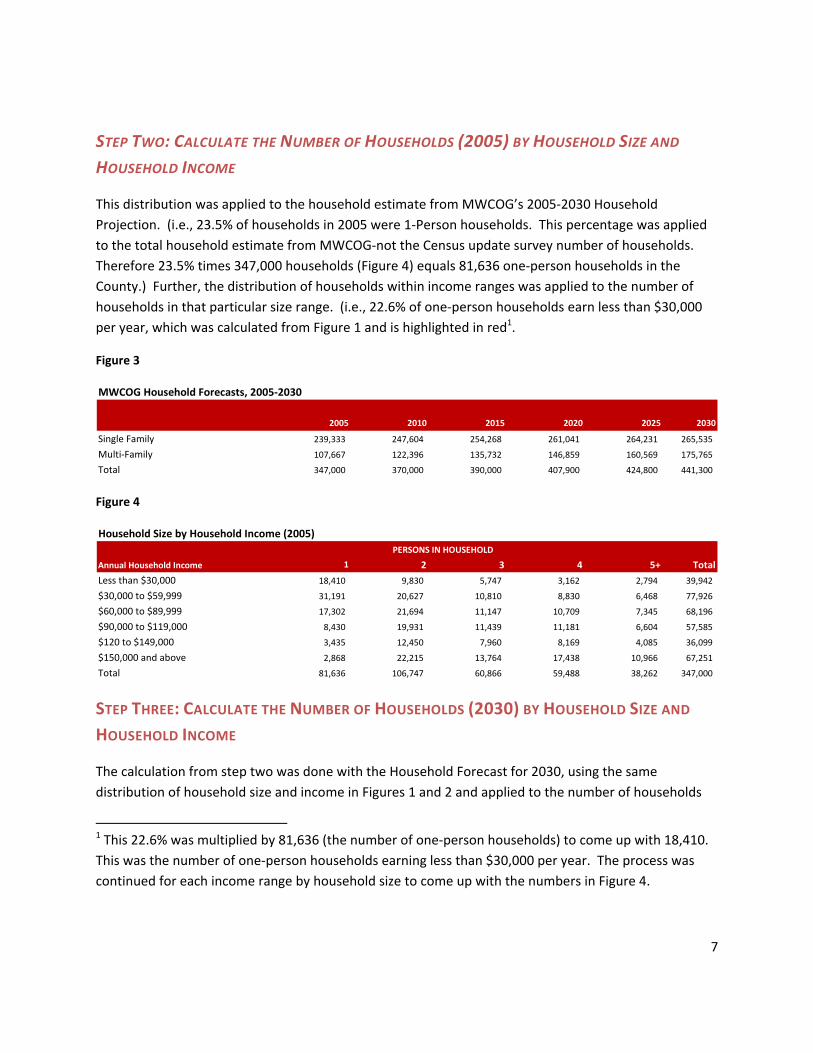
STEP TWO: CALCULATE THE NUMBER OF HOUSEHOLDS (2005) BY HOUSEHOLD SIZE AND HOUSEHOLD INCOME
This distribution was applied to the household estimate from MWCOG’s 2005‐2030 Household Projection. (i.e., 23.5% of households in 2005 were 1‐Person households. This percentage was applied to the total household estimate from MWCOG‐not the Census update survey number of households. Therefore 23.5% times 347,000 households (Figure 4) equals 81,636 one‐person households in the County.) Further, the distribution of households within income ranges was applied to the number of households in that particular size range. (i.e., 22.6% of one‐person households earn less than $30,000 per year, which was calculated from Figure 1 and is highlighted in red1.
Figure 3
MWCOG Household Forecasts, 2005‐2030
2005 2010 2015 2020 2025 2030
Single Family 239,333 247,604 254,268 261,041 264,231 265,535
Multi‐Family 107,667 122,396 135,732 146,859 160,569 175,765
Total 347,000 370,000 390,000 407,900 424,800 441,300
Figure 4
Household Size by Household Income (2005)
Annual Household Income 1 2 3 4 5+ Total
Less than $30,000 18,410 9,830 5,747 3,162 2,794 39,942
$30,000 to $59,999 31,191 20,627 10,810 8,830 6,468 77,926
$60,000 to $89,999 17,302 21,694 11,147 10,709 7,345 68,196
$90,000 to $119,000 8,430 19,931 11,439 11,181 6,604 57,585
$120 to $149,000 3,435 12,450 7,960 8,169 4,085 36,099
$150,000 and above 2,868 22,215 13,764 17,438 10,966 67,251
Total 81,636 106,747 60,866 59,488 38,262 347,000
PERSONS IN HOUSEHOLD
STEP THREE: CALCULATE THE NUMBER OF HOUSEHOLDS (2030) BY HOUSEHOLD SIZE AND HOUSEHOLD INCOME
The calculation from step two was done with the Household Forecast for 2030, using the same distribution of household size and income in Figures 1 and 2 and applied to the number of households
1 This 22.6% was multiplied by 81,636 (the number of one‐person households) to come up with 18,410. This was the number of one‐person households earning less than $30,000 per year. The process was continued for each income range by household size to come up with the numbers in Figure 4.
8
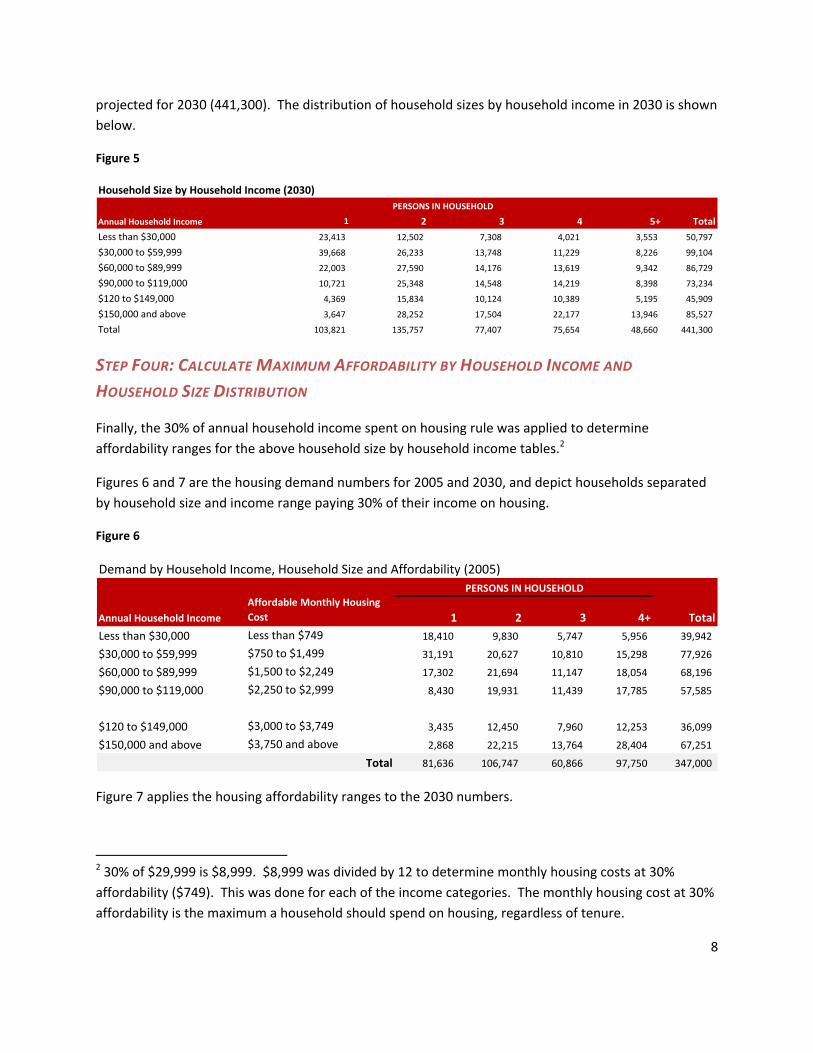
projected for 2030 (441,300). The distribution of household sizes by household income in 2030 is shown below.
Figure 5
Household Size by Household Income (2030)
Annual Household Income 1 2 3 4 5+ Total
Less than $30,000 23,413 12,502 7,308 4,021 3,553 50,797
$30,000 to $59,999 39,668 26,233 13,748 11,229 8,226 99,104
$60,000 to $89,999 22,003 27,590 14,176 13,619 9,342 86,729
$90,000 to $119,000 10,721 25,348 14,548 14,219 8,398 73,234
$120 to $149,000 4,369 15,834 10,124 10,389 5,195 45,909
$150,000 and above 3,647 28,252 17,504 22,177 13,946 85,527
Total 103,821 135,757 77,407 75,654 48,660 441,300
PERSONS IN HOUSEHOLD
STEP FOUR: CALCULATE MAXIMUM AFFORDABILITY BY HOUSEHOLD INCOME AND
HOUSEHOLD SIZE DISTRIBUTION
Finally, the 30% of annual household income spent on housing rule was applied to determine affordability ranges for the above household size by household income tables.2
Figures 6 and 7 are the housing demand numbers for 2005 and 2030, and depict households separated by household size and income range paying 30% of their income on housing.
Figure 6
Demand by Household Income, Household Size and Affordability (2005)
Annual Household IncomeAffordable Monthly Housing Cost 1 2 3 4+ Total
Less than $30,000 Less than $749 18,410 9,830 5,747 5,956 39,942
$30,000 to $59,999 $750 to $1,499 31,191 20,627 10,810 15,298 77,926
$60,000 to $89,999 $1,500 to $2,249 17,302 21,694 11,147 18,054 68,196
$90,000 to $119,000 $2,250 to $2,999 8,430 19,931 11,439 17,785 57,585
$120 to $149,000 $3,000 to $3,749 3,435 12,450 7,960 12,253 36,099
$150,000 and above $3,750 and above 2,868 22,215 13,764 28,404 67,251
81,636 106,747 60,866 97,750 347,000
PERSONS IN HOUSEHOLD
Total
Figure 7 applies the housing affordability ranges to the 2030 numbers.
2 30% of $29,999 is $8,999. $8,999 was divided by 12 to determine monthly housing costs at 30% affordability ($749). This was done for each of the income categories. The monthly housing cost at 30% affordability is the maximum a household should spend on housing, regardless of tenure.

9
Figure 7
Demand by Household Income, Household Size and Affordability (2030)
Annual Household IncomeAffordable Monthly Housing Cost 1 2 3 4+ Total
Less than $30,000 Less than $749 23,413 12,502 7,308 7,574 50,797
$30,000 to $59,999 $750 to $1,499 39,668 26,233 13,748 19,455 99,104
$60,000 to $89,999 $1,500 to $2,249 22,003 27,590 14,176 22,960 86,729
$90,000 to $119,000 $2,250 to $2,999 10,721 25,348 14,548 22,618 73,234
$120 to $149,000 $3,000 to $3,749 4,369 15,834 10,124 15,583 45,909
$150,000 and above $3,750 and above 3,647 28,252 17,504 36,123 85,527
103,821 135,757 77,407 124,315 441,300
PERSONS IN HOUSEHOLD
Total
10
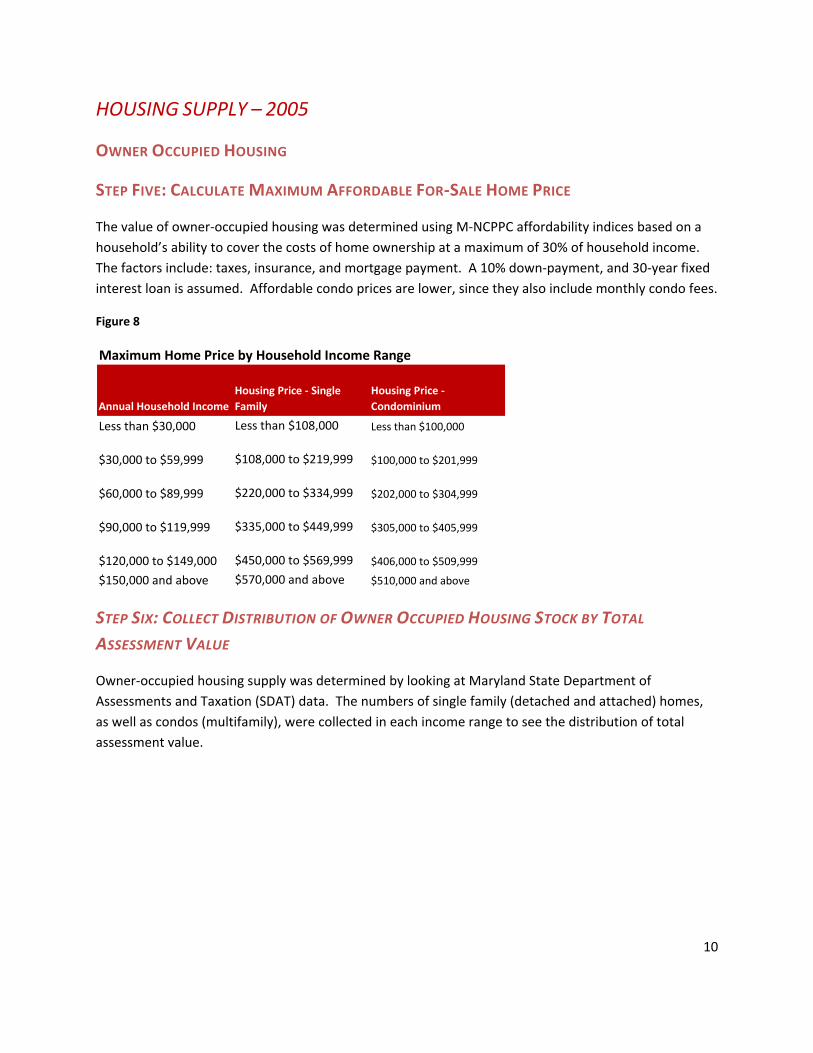
HOUSING SUPPLY – 2005
OWNER OCCUPIED HOUSING
STEP FIVE: CALCULATE MAXIMUM AFFORDABLE FOR‐SALE HOME PRICE
The value of owner‐occupied housing was determined using M‐NCPPC affordability indices based on a household’s ability to cover the costs of home ownership at a maximum of 30% of household income. The factors include: taxes, insurance, and mortgage payment. A 10% down‐payment, and 30‐year fixed interest loan is assumed. Affordable condo prices are lower, since they also include monthly condo fees.
Figure 8
Maximum Home Price by Household Income Range
Annual Household IncomeHousing Price ‐ Single Family
Housing Price ‐ Condominium
Less than $30,000 Less than $108,000 Less than $100,000
$30,000 to $59,999 $108,000 to $219,999 $100,000 to $201,999
$60,000 to $89,999 $220,000 to $334,999 $202,000 to $304,999
$90,000 to $119,999 $335,000 to $449,999 $305,000 to $405,999
$120,000 to $149,000 $450,000 to $569,999 $406,000 to $509,999
$150,000 and above $570,000 and above $510,000 and above
STEP SIX: COLLECT DISTRIBUTION OF OWNER OCCUPIED HOUSING STOCK BY TOTAL ASSESSMENT VALUE
Owner‐occupied housing supply was determined by looking at Maryland State Department of Assessments and Taxation (SDAT) data. The numbers of single family (detached and attached) homes, as well as condos (multifamily), were collected in each income range to see the distribution of total assessment value.
11
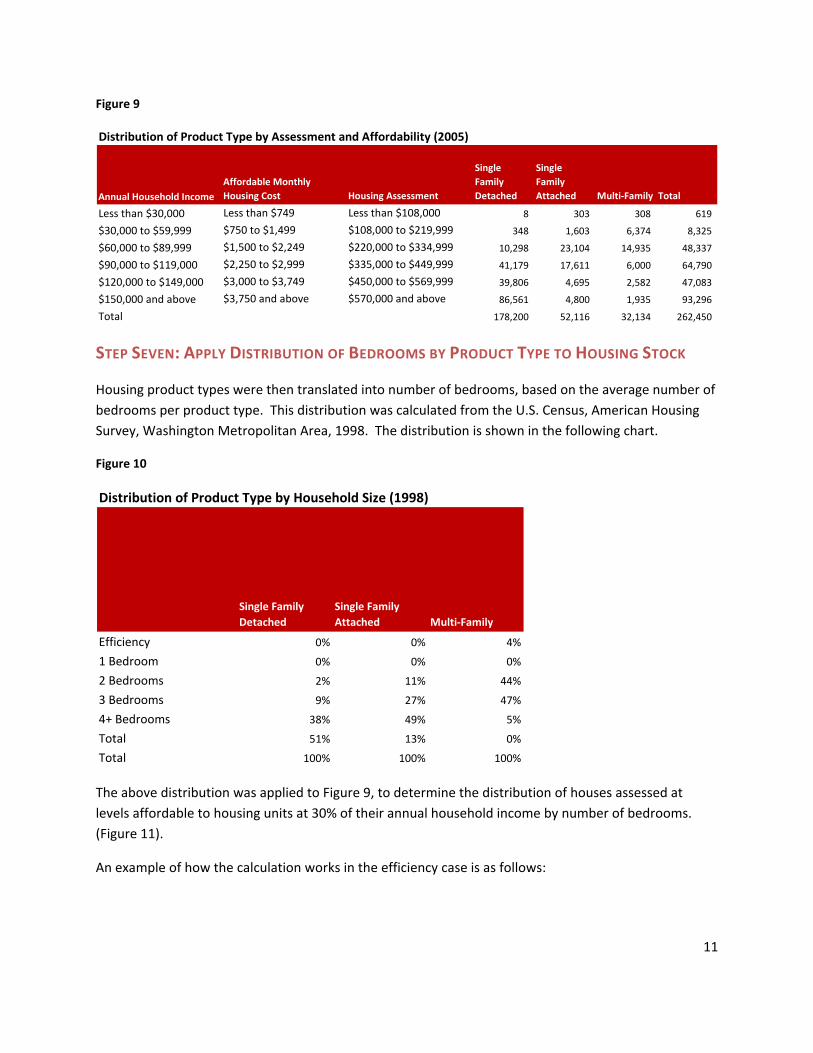
Figure 9
Distribution of Product Type by Assessment and Affordability (2005)
Annual Household IncomeAffordable Monthly Housing Cost Housing Assessment
Single Family Detached
Single Family Attached Multi‐Family Total
Less than $30,000 Less than $749 Less than $108,000 8 303 308 619
$30,000 to $59,999 $750 to $1,499 $108,000 to $219,999 348 1,603 6,374 8,325
$60,000 to $89,999 $1,500 to $2,249 $220,000 to $334,999 10,298 23,104 14,935 48,337
$90,000 to $119,000 $2,250 to $2,999 $335,000 to $449,999 41,179 17,611 6,000 64,790
$120,000 to $149,000 $3,000 to $3,749 $450,000 to $569,999 39,806 4,695 2,582 47,083
$150,000 and above $3,750 and above $570,000 and above 86,561 4,800 1,935 93,296
Total 178,200 52,116 32,134 262,450
STEP SEVEN: APPLY DISTRIBUTION OF BEDROOMS BY PRODUCT TYPE TO HOUSING STOCK
Housing product types were then translated into number of bedrooms, based on the average number of bedrooms per product type. This distribution was calculated from the U.S. Census, American Housing Survey, Washington Metropolitan Area, 1998. The distribution is shown in the following chart.
Figure 10
Distribution of Product Type by Household Size (1998)
Single Family Detached
Single Family Attached Multi‐Family
Efficiency 0% 0% 4%
1 Bedroom 0% 0% 0%
2 Bedrooms 2% 11% 44%
3 Bedrooms 9% 27% 47%
4+ Bedrooms 38% 49% 5%
Total 51% 13% 0%
Total 100% 100% 100%
The above distribution was applied to Figure 9, to determine the distribution of houses assessed at levels affordable to housing units at 30% of their annual household income by number of bedrooms. (Figure 11).
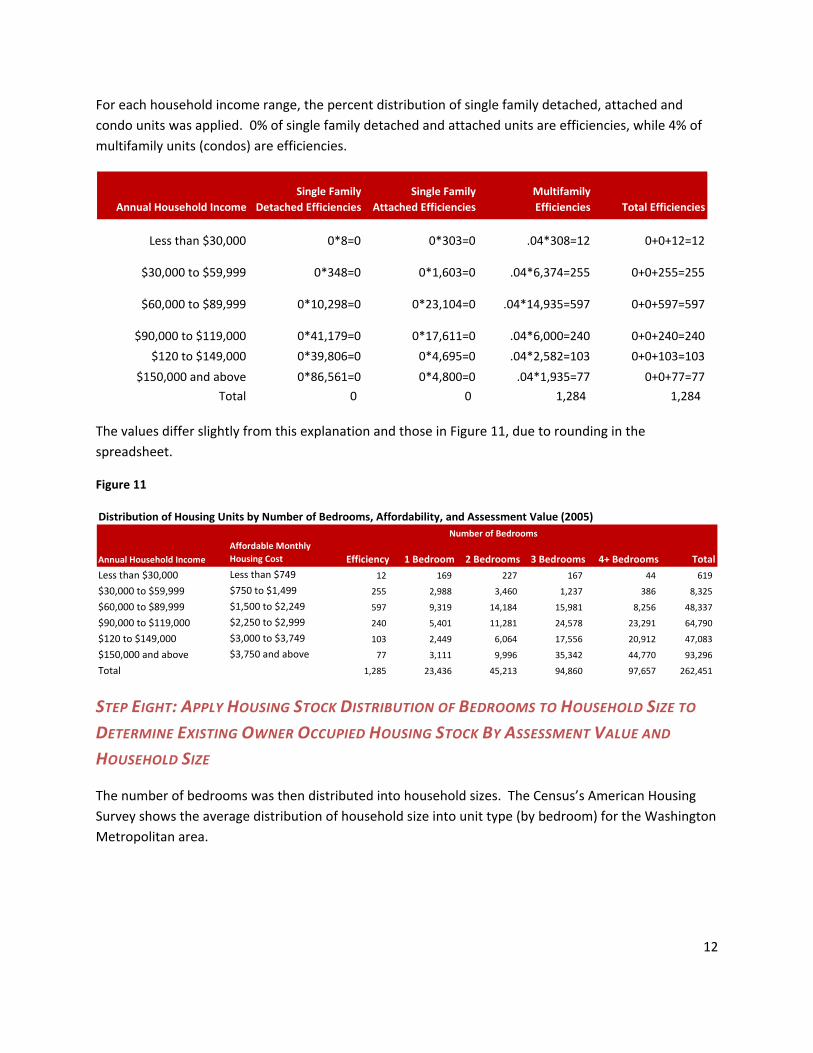
An example of how the calculation works in the efficiency case is as follows:
12
For each household income range, the percent distribution of single family detached, attached and condo units was applied. 0% of single family detached and attached units are efficiencies, while 4% of multifamily units (condos) are efficiencies.
Annual Household IncomeSingle Family
Detached EfficienciesSingle Family
Attached EfficienciesMultifamily Efficiencies Total Efficiencies
Less than $30,000 0*8=0 0*303=0 .04*308=12 0+0+12=12
$30,000 to $59,999 0*348=0 0*1,603=0 .04*6,374=255 0+0+255=255
$60,000 to $89,999 0*10,298=0 0*23,104=0 .04*14,935=597 0+0+597=597
$90,000 to $119,000 0*41,179=0 0*17,611=0 .04*6,000=240 0+0+240=240
$120 to $149,000 0*39,806=0 0*4,695=0 .04*2,582=103 0+0+103=103
$150,000 and above 0*86,561=0 0*4,800=0 .04*1,935=77 0+0+77=77
Total 0 0 1,284 1,284
The values differ slightly from this explanation and those in Figure 11, due to rounding in the spreadsheet.
Figure 11
Distribution of Housing Units by Number of Bedrooms, Affordability, and Assessment Value (2005)
Annual Household IncomeAffordable Monthly Housing Cost Efficiency 1 Bedroom 2 Bedrooms 3 Bedrooms 4+ Bedrooms Total
Less than $30,000 Less than $749 12 169 227 167 44 619
$30,000 to $59,999 $750 to $1,499 255 2,988 3,460 1,237 386 8,325
$60,000 to $89,999 $1,500 to $2,249 597 9,319 14,184 15,981 8,256 48,337
$90,000 to $119,000 $2,250 to $2,999 240 5,401 11,281 24,578 23,291 64,790
$120 to $149,000 $3,000 to $3,749 103 2,449 6,064 17,556 20,912 47,083
$150,000 and above $3,750 and above 77 3,111 9,996 35,342 44,770 93,296
Total 1,285 23,436 45,213 94,860 97,657 262,451
Number of Bedrooms
STEP EIGHT: APPLY HOUSING STOCK DISTRIBUTION OF BEDROOMS TO HOUSEHOLD SIZE TO DETERMINE EXISTING OWNER OCCUPIED HOUSING STOCK BY ASSESSMENT VALUE AND HOUSEHOLD SIZE
The number of bedrooms was then distributed into household sizes. The Census’s American Housing Survey shows the average distribution of household size into unit type (by bedroom) for the Washington Metropolitan area.
13
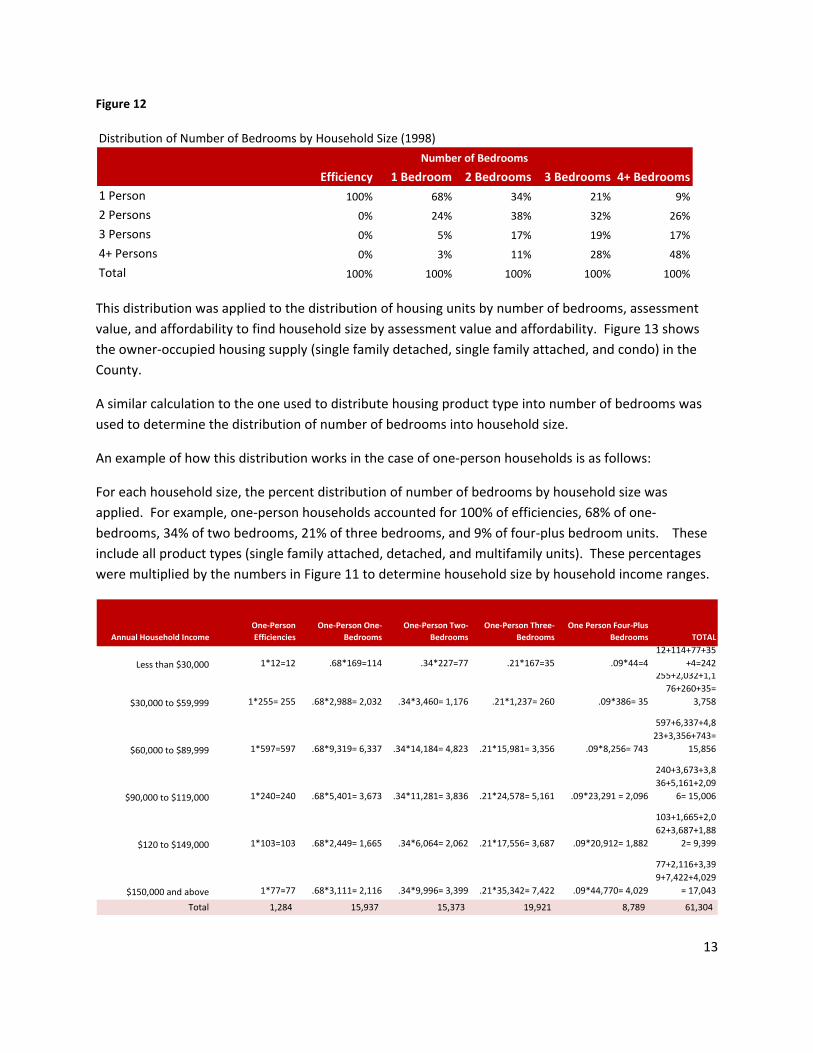
Figure 12
Distribution of Number of Bedrooms by Household Size (1998)
Efficiency 1 Bedroom 2 Bedrooms 3 Bedrooms 4+ Bedrooms1 Person 100% 68% 34% 21% 9%
2 Persons 0% 24% 38% 32% 26%
3 Persons 0% 5% 17% 19% 17%
4+ Persons 0% 3% 11% 28% 48%
Total 100% 100% 100% 100% 100%
Number of Bedrooms
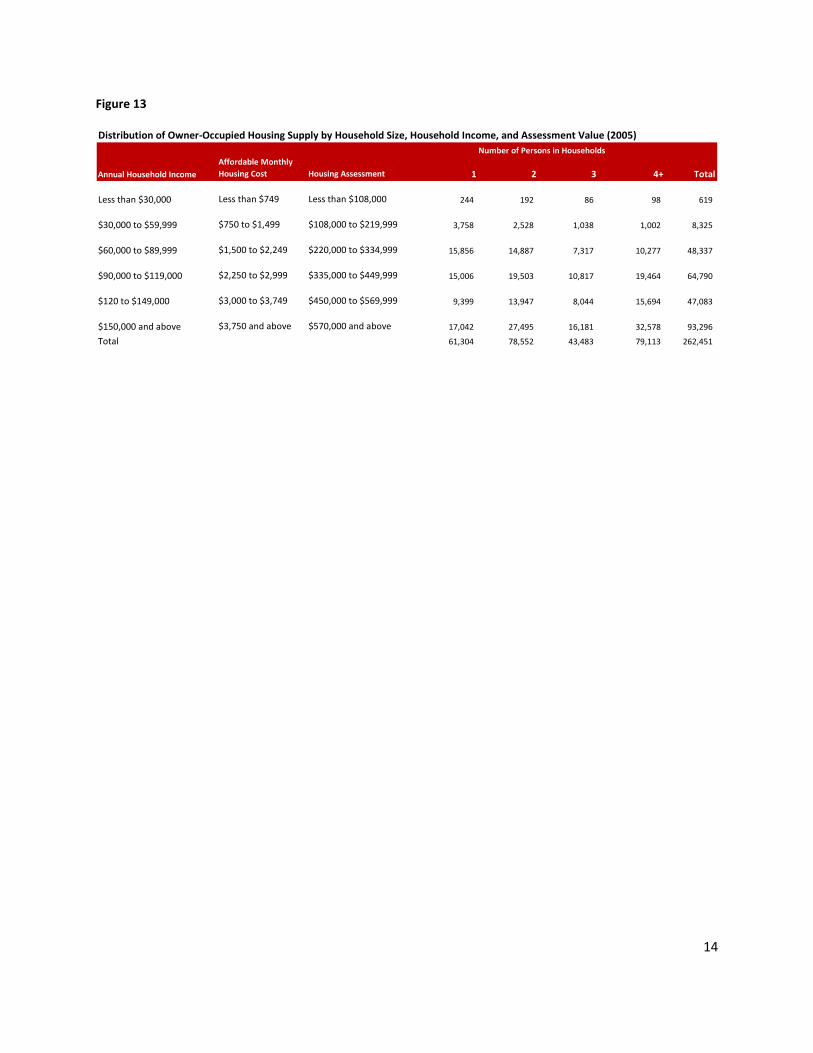
This distribution was applied to the distribution of housing units by number of bedrooms, assessment value, and affordability to find household size by assessment value and affordability. Figure 13 shows the owner‐occupied housing supply (single family detached, single family attached, and condo) in the County.
A similar calculation to the one used to distribute housing product type into number of bedrooms was used to determine the distribution of number of bedrooms into household size.
An example of how this distribution works in the case of one‐person households is as follows:
For each household size, the percent distribution of number of bedrooms by household size was applied. For example, one‐person households accounted for 100% of efficiencies, 68% of one‐bedrooms, 34% of two bedrooms, 21% of three bedrooms, and 9% of four‐plus bedroom units. These include all product types (single family attached, detached, and multifamily units). These percentages were multiplied by the numbers in Figure 11 to determine household size by household income ranges.
Annual Household IncomeOne‐Person Efficiencies
One‐Person One‐Bedrooms
One‐Person Two‐Bedrooms
One‐Person Three‐Bedrooms
One Person Four‐Plus Bedrooms TOTAL
Less than $30,000 1*12=12 .68*169=114 .34*227=77 .21*167=35 .09*44=412+114+77+35
+4=242
$30,000 to $59,999 1*255= 255 .68*2,988= 2,032 .34*3,460= 1,176 .21*1,237= 260 .09*386= 35
255+2,032+1,176+260+35=
3,758
$60,000 to $89,999 1*597=597 .68*9,319= 6,337 .34*14,184= 4,823 .21*15,981= 3,356 .09*8,256= 743
597+6,337+4,823+3,356+743=
15,856
$90,000 to $119,000 1*240=240 .68*5,401= 3,673 .34*11,281= 3,836 .21*24,578= 5,161 .09*23,291 = 2,096
240+3,673+3,836+5,161+2,09
6= 15,006
$120 to $149,000 1*103=103 .68*2,449= 1,665 .34*6,064= 2,062 .21*17,556= 3,687 .09*20,912= 1,882
103+1,665+2,062+3,687+1,88
2= 9,399
$150,000 and above 1*77=77 .68*3,111= 2,116 .34*9,996= 3,399 .21*35,342= 7,422 .09*44,770= 4,029
77+2,116+3,399+7,422+4,029
= 17,043
Total 1,284 15,937 15,373 19,921 8,789 61,304
14
Figure 13
Distribution of Owner‐Occupied Housing Supply by Household Size, Household Income, and Assessment Value (2005)
Annual Household IncomeAffordable Monthly Housing Cost Housing Assessment 1 2 3 4+ Total
Less than $30,000 Less than $749 Less than $108,000 244 192 86 98 619
$30,000 to $59,999 $750 to $1,499 $108,000 to $219,999 3,758 2,528 1,038 1,002 8,325
$60,000 to $89,999 $1,500 to $2,249 $220,000 to $334,999 15,856 14,887 7,317 10,277 48,337
$90,000 to $119,000 $2,250 to $2,999 $335,000 to $449,999 15,006 19,503 10,817 19,464 64,790
$120 to $149,000 $3,000 to $3,749 $450,000 to $569,999 9,399 13,947 8,044 15,694 47,083
$150,000 and above $3,750 and above $570,000 and above 17,042 27,495 16,181 32,578 93,296
Total 61,304 78,552 43,483 79,113 262,451
Number of Persons in Households
15
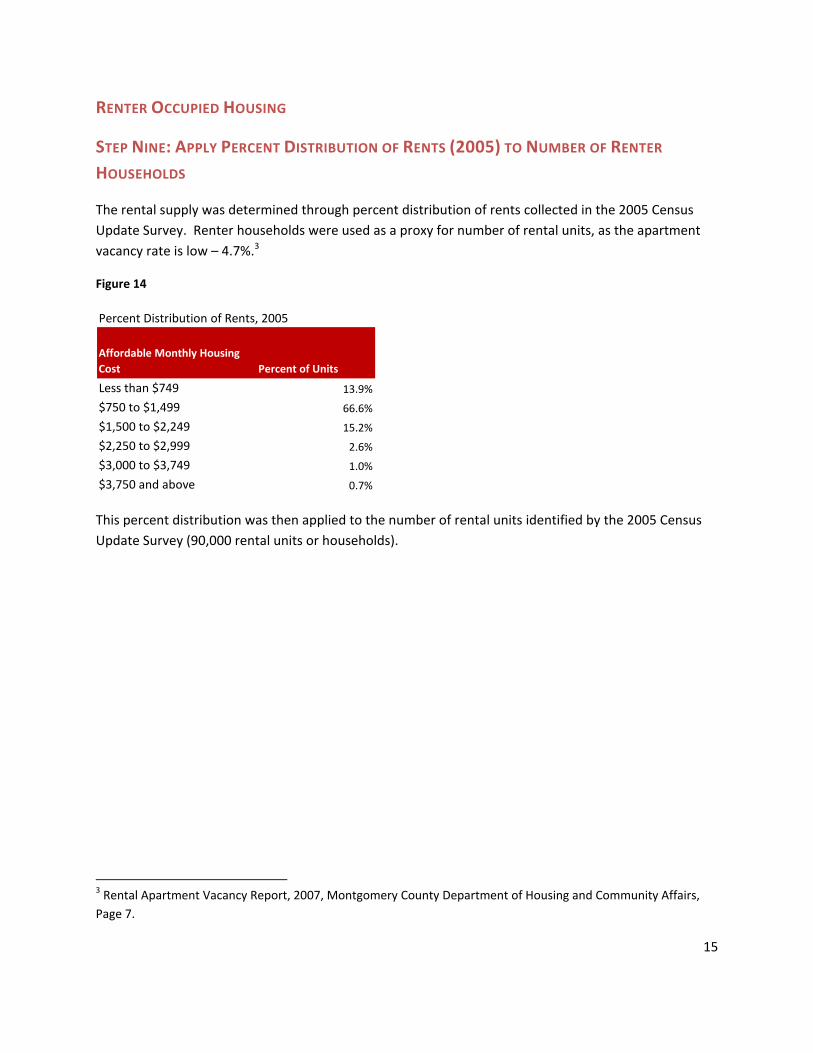
RENTER OCCUPIED HOUSING
STEP NINE: APPLY PERCENT DISTRIBUTION OF RENTS (2005) TO NUMBER OF RENTER HOUSEHOLDS
The rental supply was determined through percent distribution of rents collected in the 2005 Census Update Survey. Renter households were used as a proxy for number of rental units, as the apartment vacancy rate is low – 4.7%.3
Figure 14
Percent Distribution of Rents, 2005
Affordable Monthly Housing Cost Percent of Units
Less than $749 13.9%
$750 to $1,499 66.6%
$1,500 to $2,249 15.2%
$2,250 to $2,999 2.6%
$3,000 to $3,749 1.0%
$3,750 and above 0.7%
This percent distribution was then applied to the number of rental units identified by the 2005 Census Update Survey (90,000 rental units or households).
3 Rental Apartment Vacancy Report, 2007, Montgomery County Department of Housing and Community Affairs, Page 7.

16
Figure 15
Renter Household Income by Household Size (2005)
Source: 2005 Census Update Survey
1 % 2 % 3+ % Total %
< $14,999 5,939 18.3% 2,228 8.5% 2,255 7.2% 10,422 11.6%
$15,000‐ 24,999 2,726 8.4% 1,970 7.5% 3,928 12.5% 8,624 9.6%
$25,000‐ 29,999 1,485 4.6% 1,475 5.6% 2,532 8.1% 5,492 6.1%
$30,000‐ 34,999 2,376 7.3% 1,677 6.4% 2,117 6.8% 6,171 6.9%
$35,000‐ 39,999 3,077 9.5% 1,192 4.5% 2,109 6.7% 6,378 7.1%
$40,000‐ 44,999 2,685 8.3% 1,332 5.1% 2,244 7.2% 6,260 7.0%
$45,000‐ 49,999 2,280 7.0% 1,350 5.1% 2,012 6.4% 5,642 6.3%
$50,000‐ 54,999 2,322 7.2% 1,512 5.8% 1,761 5.6% 5,595 6.2%
$55,000‐ 59,999 1,612 5.0% 983 3.7% 1,149 3.7% 3,744 4.2%
$60,000‐ 64,999 1,137 3.5% 1,229 4.7% 1,633 5.2% 3,999 4.4%
$65,000‐ 69,999 774 2.4% 1,410 5.4% 812 2.6% 2,996 3.3%
$70,000‐ 74,999 1,050 3.2% 912 3.5% 909 2.9% 2,871 3.2%
$75,000‐ 79,999 740 2.3% 1,238 4.7% 702 2.2% 2,680 3.0%
$80,000‐ 89,999 989 3.1% 1,409 5.4% 1,393 4.4% 3,792 4.2%
$90,000‐ 99,999 842 2.6% 1,737 6.6% 1,285 4.1% 3,863 4.3%
$100,000‐ 124,999 1,715 5.3% 2,558 9.8% 2,473 7.9% 6,747 7.5%
$125,000+ 651 2.0% 2,019 7.7% 2,053 6.5% 4,723 5.2%
Total households 32,400 100.0% 26,232 100.0% 31,368 100.0% 90,000 100.0%
Staff calculated the number of units in each rent range using the data in Figure 14.4 The number of units in each rent range is shown in Figure 16 below.
Figure 16
Number of Rental Units by Rent Range, 2005
Affordable Monthly Housing Cost Number of Units
Less than $749 12,510
$750 to $1,499 59,940
$1,500 to $2,249 13,680
$2,250 to $2,999 2,340
$3,000 to $3,749 900
$3,750 and above 630
Total 90,000
4 For example: 90,000*13.9% = 12,510. There are 12,510 rental units under $750.
17
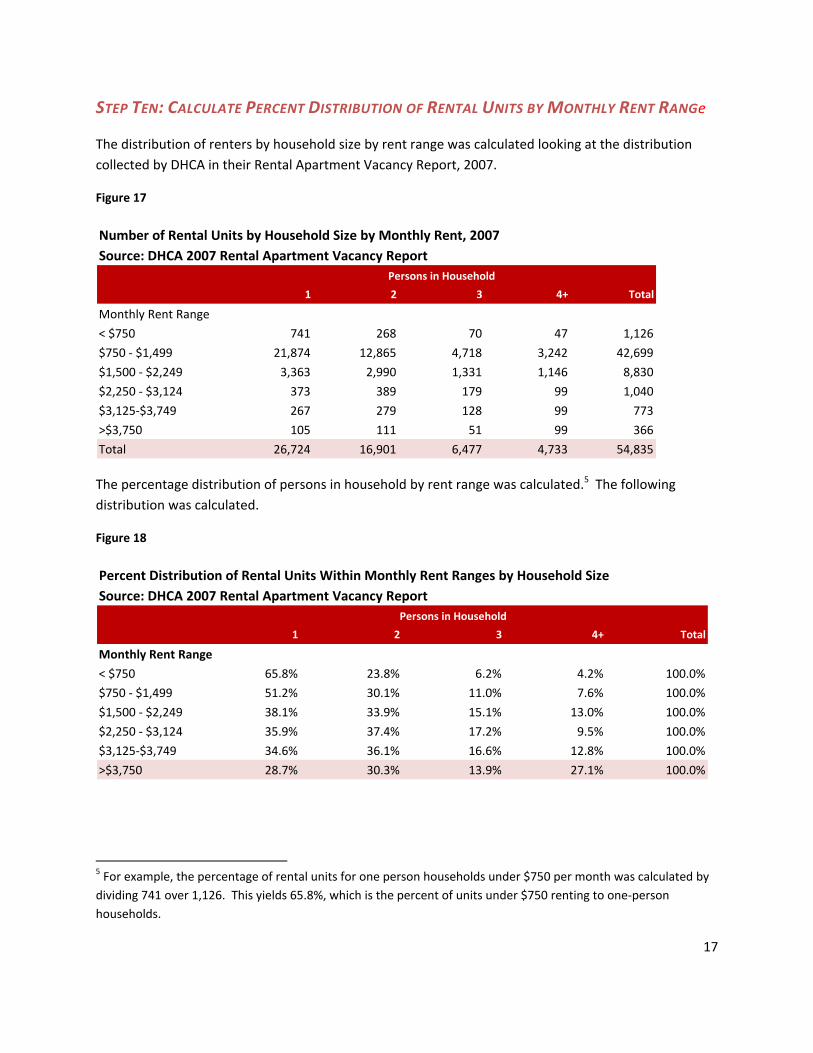
STEP TEN: CALCULATE PERCENT DISTRIBUTION OF RENTAL UNITS BY MONTHLY RENT RANGe
The distribution of renters by household size by rent range was calculated looking at the distribution collected by DHCA in their Rental Apartment Vacancy Report, 2007.
Figure 17
Number of Rental Units by Household Size by Monthly Rent, 2007Source: DHCA 2007 Rental Apartment Vacancy Report
1 2 3 4+ Total
Monthly Rent Range
< $750 741 268 70 47 1,126
$750 ‐ $1,499 21,874 12,865 4,718 3,242 42,699
$1,500 ‐ $2,249 3,363 2,990 1,331 1,146 8,830
$2,250 ‐ $3,124 373 389 179 99 1,040
$3,125‐$3,749 267 279 128 99 773
>$3,750 105 111 51 99 366
Total 26,724 16,901 6,477 4,733 54,835
Persons in Household
The percentage distribution of persons in household by rent range was calculated.5 The following distribution was calculated.
Figure 18
Percent Distribution of Rental Units Within Monthly Rent Ranges by Household SizeSource: DHCA 2007 Rental Apartment Vacancy Report
1 2 3 4+ Total
Monthly Rent Range
< $750 65.8% 23.8% 6.2% 4.2% 100.0%
$750 ‐ $1,499 51.2% 30.1% 11.0% 7.6% 100.0%
$1,500 ‐ $2,249 38.1% 33.9% 15.1% 13.0% 100.0%
$2,250 ‐ $3,124 35.9% 37.4% 17.2% 9.5% 100.0%
$3,125‐$3,749 34.6% 36.1% 16.6% 12.8% 100.0%
>$3,750 28.7% 30.3% 13.9% 27.1% 100.0%
Persons in Household
5 For example, the percentage of rental units for one person households under $750 per month was calculated by dividing 741 over 1,126. This yields 65.8%, which is the percent of units under $750 renting to one‐person households.
18
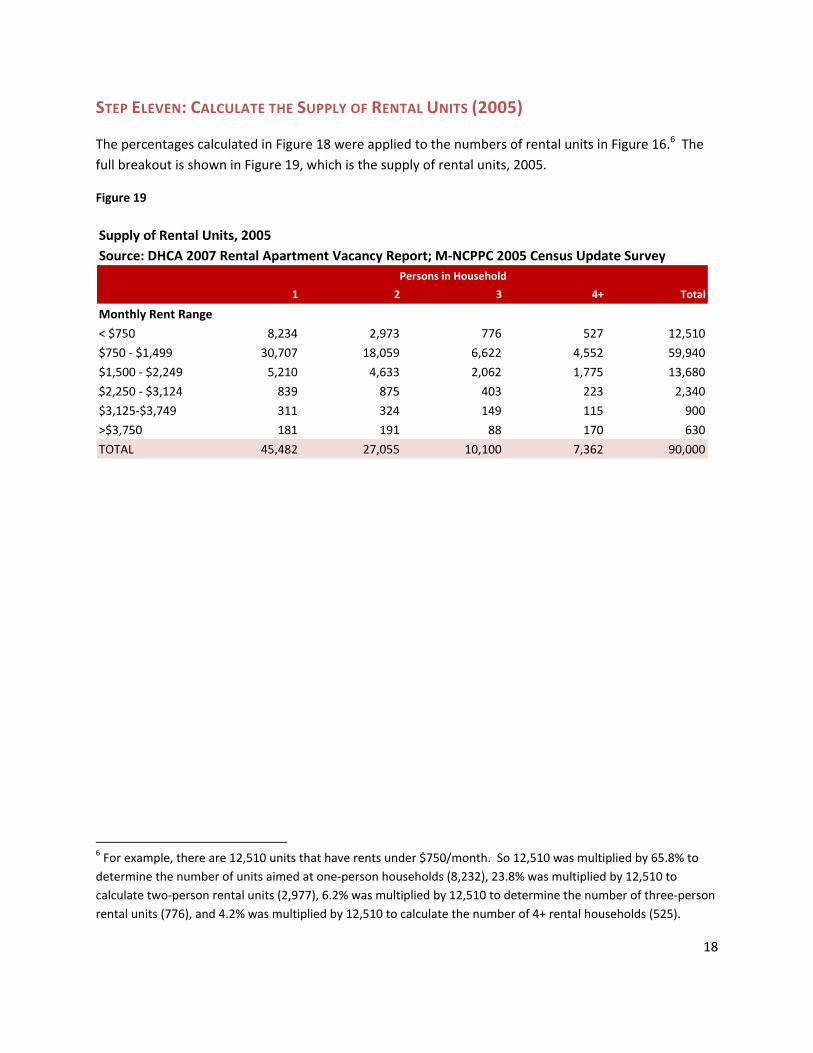
STEP ELEVEN: CALCULATE THE SUPPLY OF RENTAL UNITS (2005)
The percentages calculated in Figure 18 were applied to the numbers of rental units in Figure 16.6 The full breakout is shown in Figure 19, which is the supply of rental units, 2005.
Figure 19
Supply of Rental Units, 2005Source: DHCA 2007 Rental Apartment Vacancy Report; M‐NCPPC 2005 Census Update Survey
1 2 3 4+ Total
Monthly Rent Range
< $750 8,234 2,973 776 527 12,510
$750 ‐ $1,499 30,707 18,059 6,622 4,552 59,940
$1,500 ‐ $2,249 5,210 4,633 2,062 1,775 13,680
$2,250 ‐ $3,124 839 875 403 223 2,340
$3,125‐$3,749 311 324 149 115 900
>$3,750 181 191 88 170 630
TOTAL 45,482 27,055 10,100 7,362 90,000
Persons in Household
6 For example, there are 12,510 units that have rents under $750/month. So 12,510 was multiplied by 65.8% to determine the number of units aimed at one‐person households (8,232), 23.8% was multiplied by 12,510 to calculate two‐person rental units (2,977), 6.2% was multiplied by 12,510 to determine the number of three‐person rental units (776), and 4.2% was multiplied by 12,510 to calculate the number of 4+ rental households (525).
19
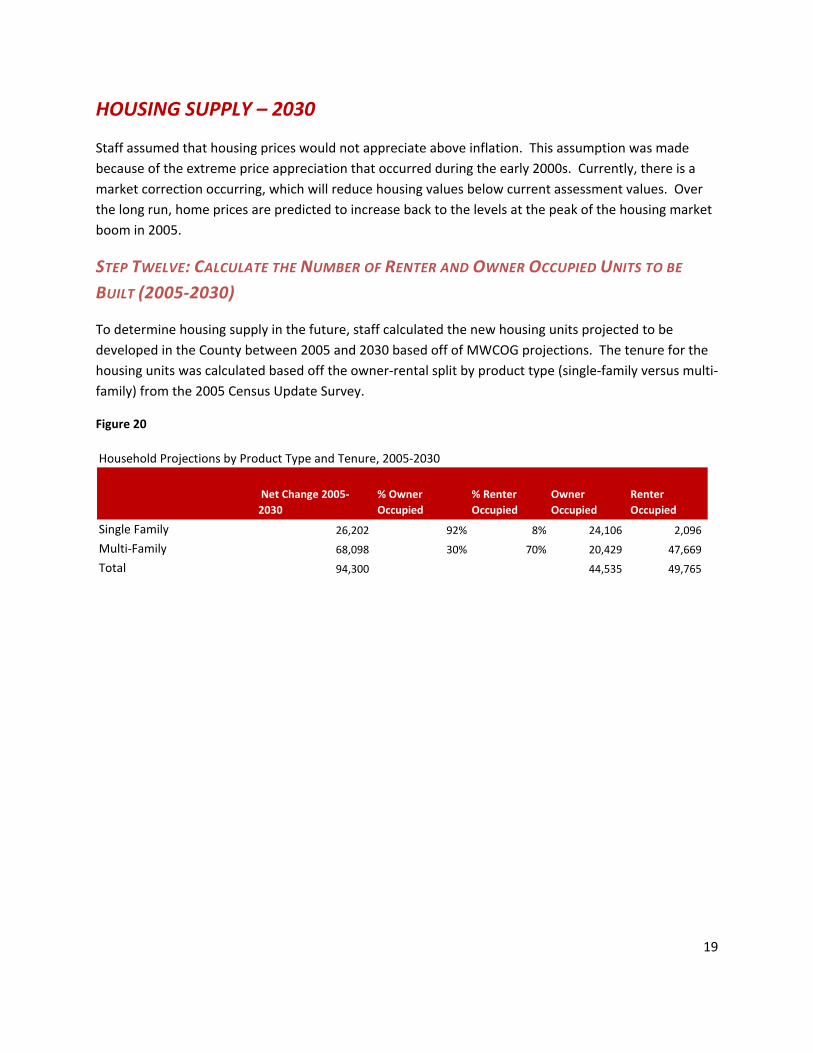
HOUSING SUPPLY – 2030
Staff assumed that housing prices would not appreciate above inflation. This assumption was made because of the extreme price appreciation that occurred during the early 2000s. Currently, there is a market correction occurring, which will reduce housing values below current assessment values. Over the long run, home prices are predicted to increase back to the levels at the peak of the housing market boom in 2005.
STEP TWELVE: CALCULATE THE NUMBER OF RENTER AND OWNER OCCUPIED UNITS TO BE
BUILT (2005‐2030)
To determine housing supply in the future, staff calculated the new housing units projected to be developed in the County between 2005 and 2030 based off of MWCOG projections. The tenure for the housing units was calculated based off the owner‐rental split by product type (single‐family versus multi‐family) from the 2005 Census Update Survey.
Figure 20
Household Projections by Product Type and Tenure, 2005‐2030
Net Change 2005‐2030
% Owner Occupied
% Renter Occupied
Owner Occupied
Renter Occupied
Single Family 26,202 92% 8% 24,106 2,096
Multi‐Family 68,098 30% 70% 20,429 47,669
Total 94,300 44,535 49,765
20
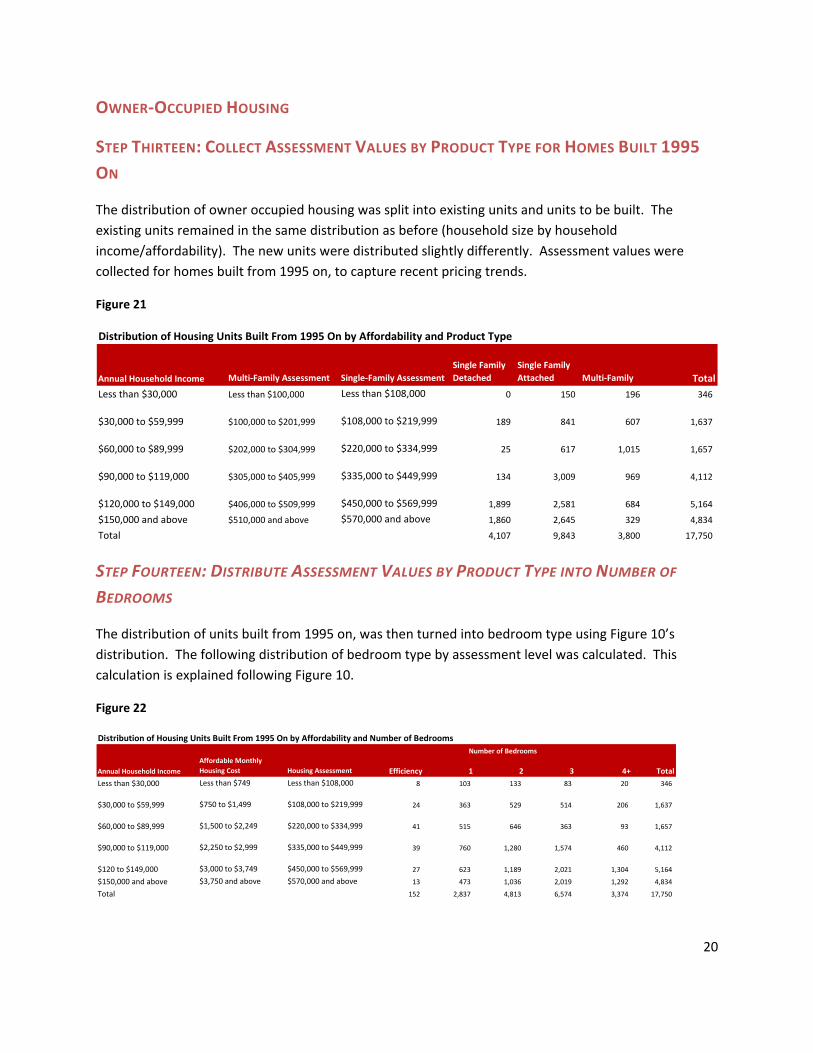
OWNER‐OCCUPIED HOUSING
STEP THIRTEEN: COLLECT ASSESSMENT VALUES BY PRODUCT TYPE FOR HOMES BUILT 1995 ON
The distribution of owner occupied housing was split into existing units and units to be built. The existing units remained in the same distribution as before (household size by household income/affordability). The new units were distributed slightly differently. Assessment values were collected for homes built from 1995 on, to capture recent pricing trends.
Figure 21
Distribution of Housing Units Built From 1995 On by Affordability and Product Type
Annual Household Income Multi‐Family Assessment Single‐Family AssessmentSingle Family Detached
Single Family Attached Multi‐Family Total
Less than $30,000 Less than $100,000 Less than $108,000 0 150 196 346
$30,000 to $59,999 $100,000 to $201,999 $108,000 to $219,999 189 841 607 1,637
$60,000 to $89,999 $202,000 to $304,999 $220,000 to $334,999 25 617 1,015 1,657
$90,000 to $119,000 $305,000 to $405,999 $335,000 to $449,999 134 3,009 969 4,112
$120,000 to $149,000 $406,000 to $509,999 $450,000 to $569,999 1,899 2,581 684 5,164
$150,000 and above $510,000 and above $570,000 and above 1,860 2,645 329 4,834
Total 4,107 9,843 3,800 17,750
STEP FOURTEEN: DISTRIBUTE ASSESSMENT VALUES BY PRODUCT TYPE INTO NUMBER OF
BEDROOMS
The distribution of units built from 1995 on, was then turned into bedroom type using Figure 10’s distribution. The following distribution of bedroom type by assessment level was calculated. This calculation is explained following Figure 10.
Figure 22
Distribution of Housing Units Built From 1995 On by Affordability and Number of Bedrooms
Annual Household IncomeAffordable Monthly Housing Cost Housing Assessment Efficiency 1 2 3 4+ Total
Less than $30,000 Less than $749 Less than $108,000 8 103 133 83 20 346
$30,000 to $59,999 $750 to $1,499 $108,000 to $219,999 24 363 529 514 206 1,637
$60,000 to $89,999 $1,500 to $2,249 $220,000 to $334,999 41 515 646 363 93 1,657
$90,000 to $119,000 $2,250 to $2,999 $335,000 to $449,999 39 760 1,280 1,574 460 4,112
$120 to $149,000 $3,000 to $3,749 $450,000 to $569,999 27 623 1,189 2,021 1,304 5,164
$150,000 and above $3,750 and above $570,000 and above 13 473 1,036 2,019 1,292 4,834
Total 152 2,837 4,813 6,574 3,374 17,750
Number of Bedrooms

21
STEP FIFTEEN: DISTRIBUTE BEDROOM TYPE INTO HOUSEHOLD SIZE
The bedroom distribution was calculated into household size using Figure 12’s distribution of number of bedrooms by household size (also explained in detail following Figure 12).
Figure 23
Distribution of Housing Units Built From 1995 On by Affordability and Household Size
Annual Household IncomeAffordable Monthly Housing Cost Housing Assessment 1 2 3 4+ Total
Less than $30,000 Less than $749 Less than $108,000 142 107 47 50 346
$30,000 to $59,999 $750 to $1,499 $108,000 to $219,999 578 506 241 313 1,638
$60,000 to $89,999 $1,500 to $2,249 $220,000 to $334,999 695 509 220 233 1,657
$90,000 to $119,000 $2,250 to $2,999 $335,000 to $449,999 1,364 1,290 633 827 4,114
$120 to $149,000 $3,000 to $3,749 $450,000 to $569,999 1,399 1,582 839 1,346 5,166
$150,000 and above $3,750 and above $570,000 and above 1,230 1,484 803 1,319 4,836
Total 5,409 5,477 2,783 4,088 17,757
Number of Persons in Household
Figure 24 Distribution of Housing Units Built from 1995 On by Affordability and Household Size
STEP SIXTEEN: CALCULATE THE PERCENT DISTRIBUTION OF FOR SALE HOUSING BUILT FROM
1995 ON BY AFFORDABILITY
A percent distribution of housing units by affordability and household size was calculated. This shows the percent of housing units if 30% of household income was spent on housing.7
7 To get the percent distribution, we multiplied the number of units in an income range and specific household size by the total number of units. For example, the 142 units assessed at less than $108,000 and occupied by a 1‐person household were divided by the total number of units 17,757. The end result was 0.8% of total units were single‐family households and assessed at less than $108,000 for a single family home ($100,000 for a condo). This process was applied to all of the household size by income range categories.
22
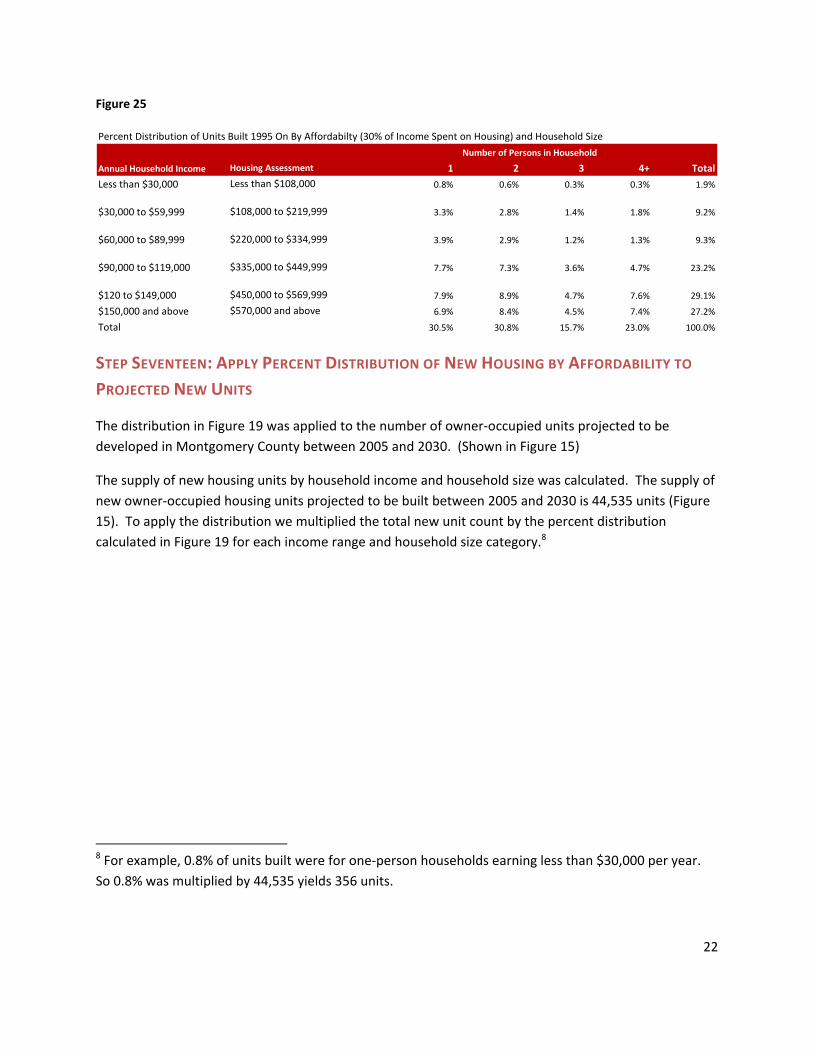
Figure 25
Percent Distribution of Units Built 1995 On By Affordabilty (30% of Income Spent on Housing) and Household Size
Annual Household Income Housing Assessment 1 2 3 4+ Total
Less than $30,000 Less than $108,000 0.8% 0.6% 0.3% 0.3% 1.9%
$30,000 to $59,999 $108,000 to $219,999 3.3% 2.8% 1.4% 1.8% 9.2%
$60,000 to $89,999 $220,000 to $334,999 3.9% 2.9% 1.2% 1.3% 9.3%
$90,000 to $119,000 $335,000 to $449,999 7.7% 7.3% 3.6% 4.7% 23.2%
$120 to $149,000 $450,000 to $569,999 7.9% 8.9% 4.7% 7.6% 29.1%
$150,000 and above $570,000 and above 6.9% 8.4% 4.5% 7.4% 27.2%
Total 30.5% 30.8% 15.7% 23.0% 100.0%
Number of Persons in Household
STEP SEVENTEEN: APPLY PERCENT DISTRIBUTION OF NEW HOUSING BY AFFORDABILITY TO PROJECTED NEW UNITS
The distribution in Figure 19 was applied to the number of owner‐occupied units projected to be developed in Montgomery County between 2005 and 2030. (Shown in Figure 15)
The supply of new housing units by household income and household size was calculated. The supply of new owner‐occupied housing units projected to be built between 2005 and 2030 is 44,535 units (Figure 15). To apply the distribution we multiplied the total new unit count by the percent distribution calculated in Figure 19 for each income range and household size category.8
8 For example, 0.8% of units built were for one‐person households earning less than $30,000 per year. So 0.8% was multiplied by 44,535 yields 356 units.
23
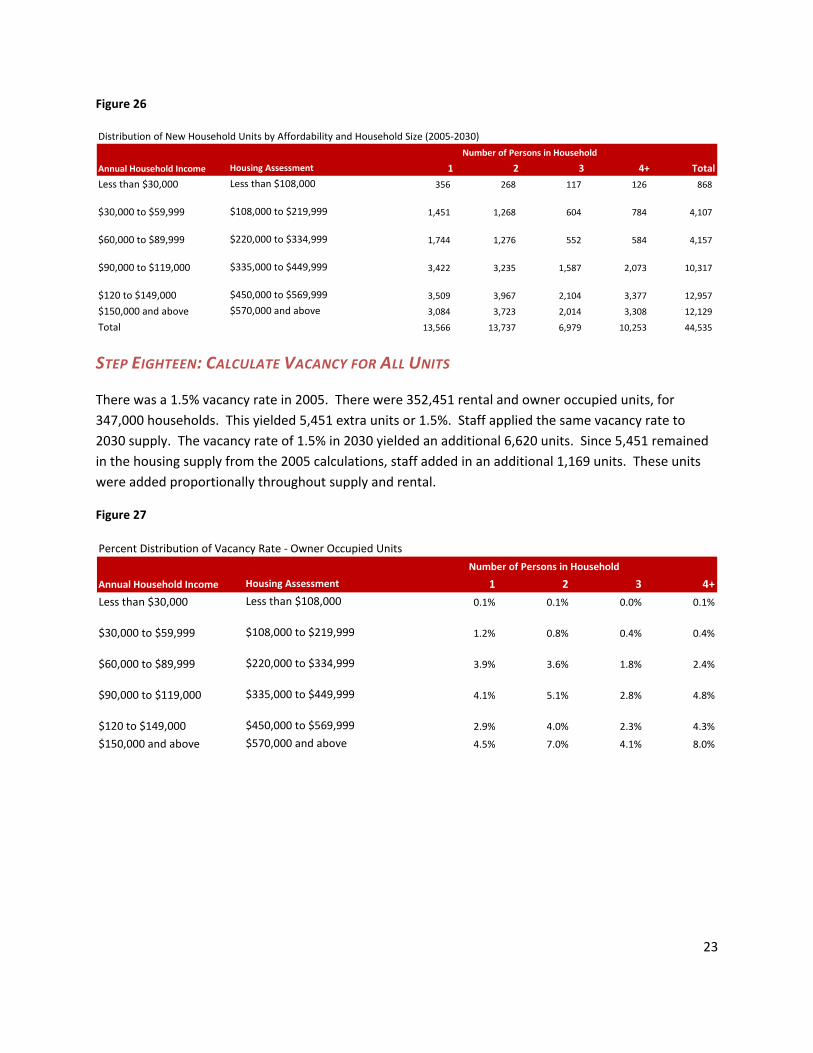
Figure 26
Distribution of New Household Units by Affordability and Household Size (2005‐2030)
Annual Household Income Housing Assessment 1 2 3 4+ Total
Less than $30,000 Less than $108,000 356 268 117 126 868
$30,000 to $59,999 $108,000 to $219,999 1,451 1,268 604 784 4,107
$60,000 to $89,999 $220,000 to $334,999 1,744 1,276 552 584 4,157
$90,000 to $119,000 $335,000 to $449,999 3,422 3,235 1,587 2,073 10,317
$120 to $149,000 $450,000 to $569,999 3,509 3,967 2,104 3,377 12,957
$150,000 and above $570,000 and above 3,084 3,723 2,014 3,308 12,129
Total 13,566 13,737 6,979 10,253 44,535
Number of Persons in Household
STEP EIGHTEEN: CALCULATE VACANCY FOR ALL UNITS
There was a 1.5% vacancy rate in 2005. There were 352,451 rental and owner occupied units, for 347,000 households. This yielded 5,451 extra units or 1.5%. Staff applied the same vacancy rate to 2030 supply. The vacancy rate of 1.5% in 2030 yielded an additional 6,620 units. Since 5,451 remained in the housing supply from the 2005 calculations, staff added in an additional 1,169 units. These units were added proportionally throughout supply and rental.
Figure 27
Percent Distribution of Vacancy Rate ‐ Owner Occupied Units
Annual Household Income Housing Assessment 1 2 3 4+
Less than $30,000 Less than $108,000 0.1% 0.1% 0.0% 0.1%
$30,000 to $59,999 $108,000 to $219,999 1.2% 0.8% 0.4% 0.4%
$60,000 to $89,999 $220,000 to $334,999 3.9% 3.6% 1.8% 2.4%
$90,000 to $119,000 $335,000 to $449,999 4.1% 5.1% 2.8% 4.8%
$120 to $149,000 $450,000 to $569,999 2.9% 4.0% 2.3% 4.3%
$150,000 and above $570,000 and above 4.5% 7.0% 4.1% 8.0%
Number of Persons in Household

24
Figure 28
Percent Distribution of Vacancy Rate ‐ Renter Occupied Units
Annual Household Income Housing Assessment 1 2 3 4+
Less than $30,000 Less than $108,000 2.9% 1.0% 0.3% 0.2%
$30,000 to $59,999 $108,000 to $219,999 10.7% 6.3% 2.3% 1.6%
$60,000 to $89,999 $220,000 to $334,999 1.8% 1.6% 0.7% 0.6%
$90,000 to $119,000 $335,000 to $449,999 0.3% 0.3% 0.1% 0.1%
$120 to $149,000 $450,000 to $569,999 0.1% 0.1% 0.1% 0.0%
$150,000 and above $570,000 and above 0.1% 0.1% 0.0% 0.1%
Number of Persons in Household
These percent distributions were applied to the outstanding 1,169 units to get the following distributions.
Figure 29
Distribution of Vacancy Rate ‐ Owner Occupied Units
Annual Household Income Housing Assessment 1 2 3 4+
Less than $30,000 Less than $108,000 2 1 1 1
$30,000 to $59,999 $108,000 to $219,999 14 10 4 5
$60,000 to $89,999 $220,000 to $334,999 46 42 21 28
$90,000 to $119,000 $335,000 to $449,999 48 59 32 56
$120 to $149,000 $450,000 to $569,999 34 47 27 50
$150,000 and above $570,000 and above 53 82 48 94
Number of Persons in Household
Figure 30
Distribution of Vacancy Rate ‐ Renter Occupied Units
Annual Household Income Housing Assessment 1 2 3 4+
Less than $30,000 Less than $108,000 33 12 3 2
$30,000 to $59,999 $108,000 to $219,999 125 73 27 18
$60,000 to $89,999 $220,000 to $334,999 21 19 8 7
$90,000 to $119,000 $335,000 to $449,999 3 4 2 1
$120 to $149,000 $450,000 to $569,999 1 1 1 0
$150,000 and above $570,000 and above 1 1 0 1
Number of Persons in Household
25
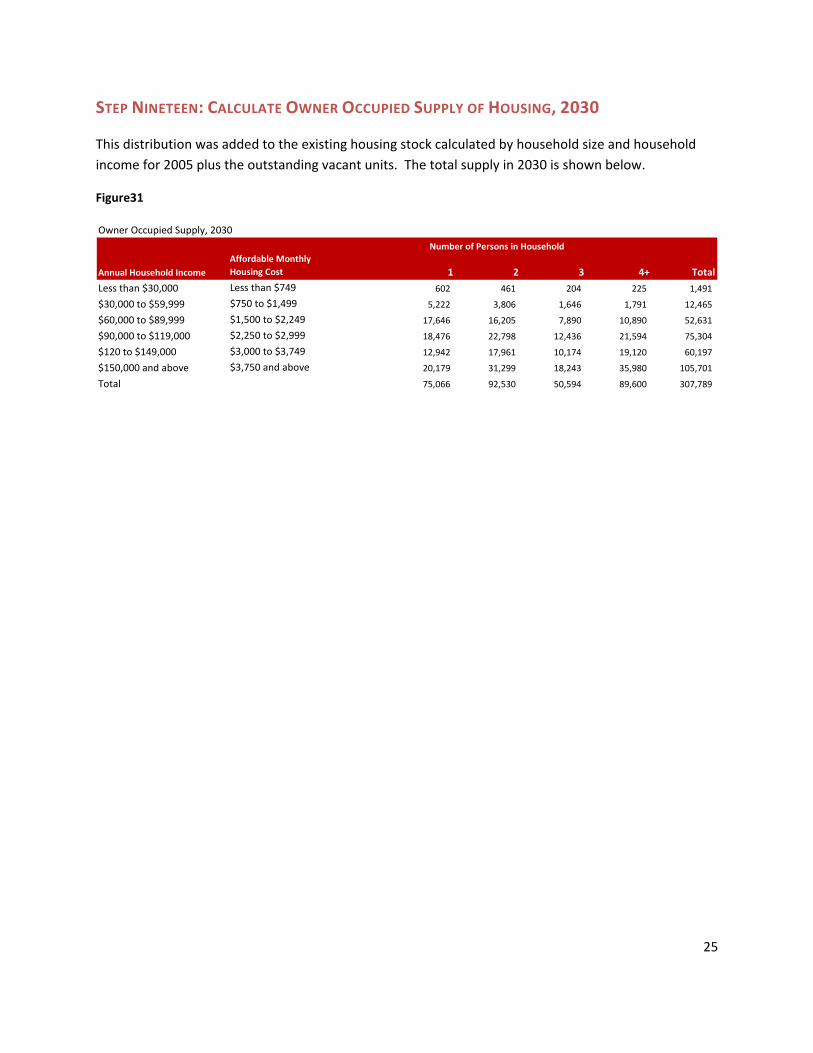
STEP NINETEEN: CALCULATE OWNER OCCUPIED SUPPLY OF HOUSING, 2030
This distribution was added to the existing housing stock calculated by household size and household income for 2005 plus the outstanding vacant units. The total supply in 2030 is shown below.
Figure31
Owner Occupied Supply, 2030
Annual Household IncomeAffordable Monthly Housing Cost 1 2 3 4+ Total
Less than $30,000 Less than $749 602 461 204 225 1,491
$30,000 to $59,999 $750 to $1,499 5,222 3,806 1,646 1,791 12,465
$60,000 to $89,999 $1,500 to $2,249 17,646 16,205 7,890 10,890 52,631
$90,000 to $119,000 $2,250 to $2,999 18,476 22,798 12,436 21,594 75,304
$120 to $149,000 $3,000 to $3,749 12,942 17,961 10,174 19,120 60,197
$150,000 and above $3,750 and above 20,179 31,299 18,243 35,980 105,701
Total 75,066 92,530 50,594 89,600 307,789
Number of Persons in Household
26
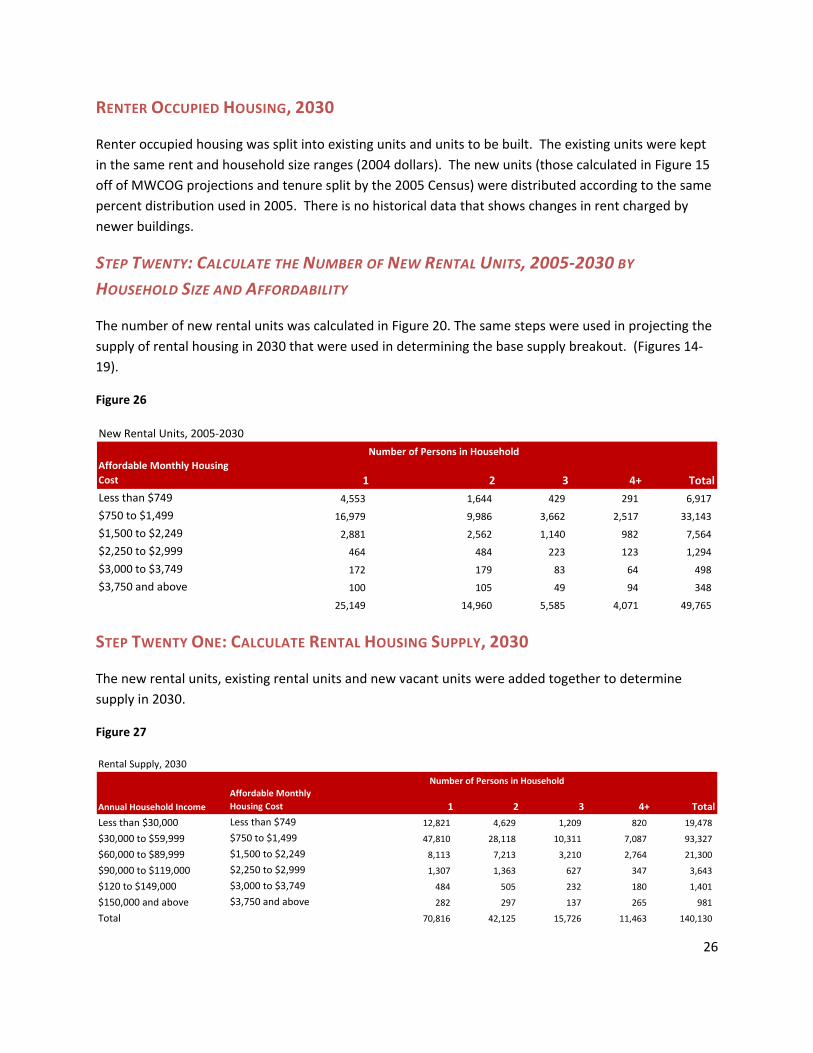
RENTER OCCUPIED HOUSING, 2030
Renter occupied housing was split into existing units and units to be built. The existing units were kept in the same rent and household size ranges (2004 dollars). The new units (those calculated in Figure 15 off of MWCOG projections and tenure split by the 2005 Census) were distributed according to the same percent distribution used in 2005. There is no historical data that shows changes in rent charged by newer buildings.
STEP TWENTY: CALCULATE THE NUMBER OF NEW RENTAL UNITS, 2005‐2030 BY HOUSEHOLD SIZE AND AFFORDABILITY
The number of new rental units was calculated in Figure 20. The same steps were used in projecting the supply of rental housing in 2030 that were used in determining the base supply breakout. (Figures 14‐19).
Figure 26
New Rental Units, 2005‐2030
Affordable Monthly Housing Cost 1 2 3 4+ TotalLess than $749 4,553 1,644 429 291 6,917
$750 to $1,499 16,979 9,986 3,662 2,517 33,143
$1,500 to $2,249 2,881 2,562 1,140 982 7,564
$2,250 to $2,999 464 484 223 123 1,294
$3,000 to $3,749 172 179 83 64 498
$3,750 and above 100 105 49 94 348
25,149 14,960 5,585 4,071 49,765
Number of Persons in Household
STEP TWENTY ONE: CALCULATE RENTAL HOUSING SUPPLY, 2030
The new rental units, existing rental units and new vacant units were added together to determine supply in 2030.
Figure 27
Rental Supply, 2030
Annual Household IncomeAffordable Monthly Housing Cost 1 2 3 4+ Total
Less than $30,000 Less than $749 12,821 4,629 1,209 820 19,478
$30,000 to $59,999 $750 to $1,499 47,810 28,118 10,311 7,087 93,327
$60,000 to $89,999 $1,500 to $2,249 8,113 7,213 3,210 2,764 21,300
$90,000 to $119,000 $2,250 to $2,999 1,307 1,363 627 347 3,643
$120 to $149,000 $3,000 to $3,749 484 505 232 180 1,401
$150,000 and above $3,750 and above 282 297 137 265 981
Total 70,816 42,125 15,726 11,463 140,130
Number of Persons in Household

27
GAP ANALYSIS
STEP TWENTY TWO: CALCULATE GAP ANALYSIS, 2005 AND 2030
A gap analysis was conducted to determine at which household size and household income ranges there is an imbalance in housing supply and demand. The housing supply in 2005 (owner occupied and renter occupied) was subtracted from demand to find the imbalances or gaps. These tables were calculated earlier in the analysis (Figures 6, 13, and 19). The gap analysis is subtracting the total supply (owner and renter occupied) from the demand.
2005 ANALYSIS
The highlighted categories are those with excess demand (under supplied). The analysis shows that:
• There is an across the board need for additional housing for those households earning the least.
• One‐person households have the least burden. This is due to the fact that they have smaller, more affordable options available to them than larger households do. These options include efficiencies, and the majority of one‐bedroom units.
• Households earning less than $90,000 face a severe shortage of housing.
• There is a need for affordable, family housing regardless of product type. (For example, four bedroom apartments/condos could fit the needs of a family as well as single family detached or attached housing.)
• If this housing shortage continues, Montgomery County may see a decrease in the number of households earning under $90,000 per year, as those households migrate to areas (within and outside of the region) with more affordable housing options.
• There is an excess supply of large, expensive homes in the County.
• The shortage of housing in 2005 indicates that some households are:
• Paying greater than 30% of their household income on housing;
• Living in smaller than ‘optimal’ units, i.e., four persons in a one bedroom unit; or
• Could not afford to purchase their home today (the assessed value is far greater than their mortgages.
28
2030 ANALYSIS
• Similar patterns were observed in 2030.
• In real terms, housing is projected to become even more unaffordable in the future.
• The housing shortage for households earning under $30,000 is expected to worsen.
• The large share of rental apartments projected, is helping to provide housing opportunities for smaller households earning under $60,000 per year.
• The housing shortage is projected to affect households of persons 3+ earning less than $125,000 per year (2005 dollars). This is an increase, as the housing shortage in 2005 affected households earning less than $90,000.
• The excess supply of large, expensive homes is not anticipated to increase.
• There is expected to be a surge in expensive, smaller housing due to the large number of luxury condos planned. (one and two person households.)
29
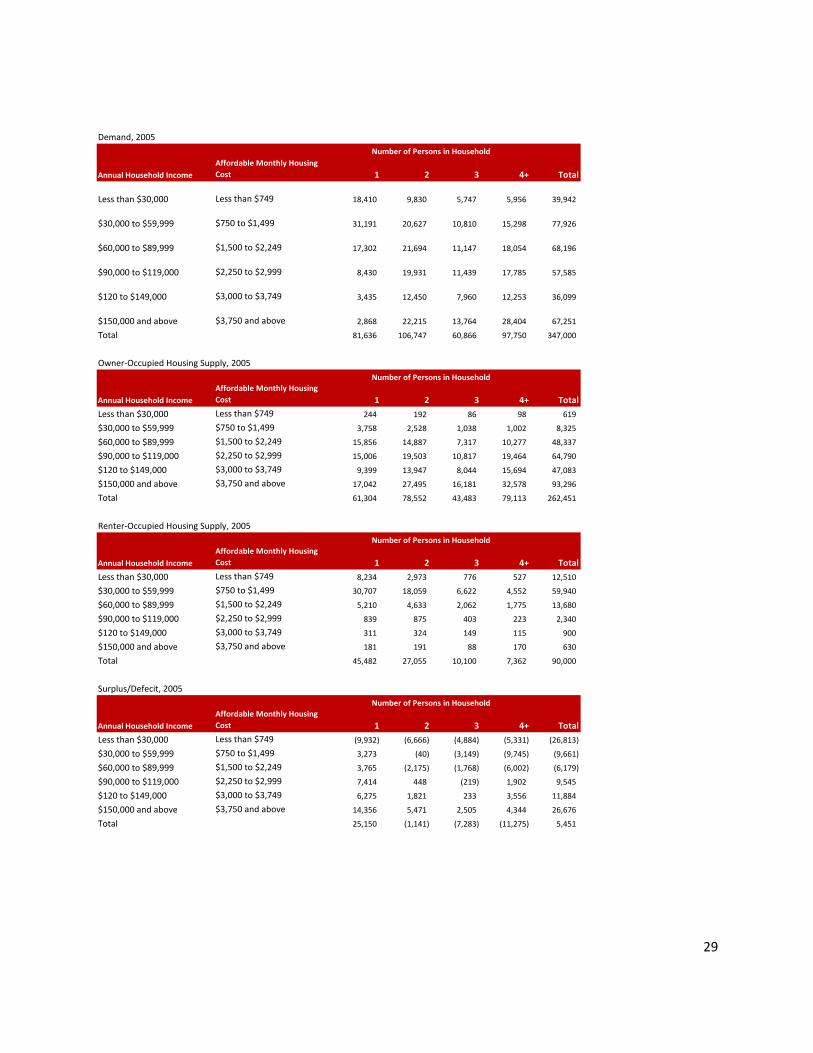
Demand, 2005
Annual Household IncomeAffordable Monthly Housing Cost 1 2 3 4+ Total
Less than $30,000 Less than $749 18,410 9,830 5,747 5,956 39,942
$30,000 to $59,999 $750 to $1,499 31,191 20,627 10,810 15,298 77,926
$60,000 to $89,999 $1,500 to $2,249 17,302 21,694 11,147 18,054 68,196
$90,000 to $119,000 $2,250 to $2,999 8,430 19,931 11,439 17,785 57,585
$120 to $149,000 $3,000 to $3,749 3,435 12,450 7,960 12,253 36,099
$150,000 and above $3,750 and above 2,868 22,215 13,764 28,404 67,251
Total 81,636 106,747 60,866 97,750 347,000
Owner‐Occupied Housing Supply, 2005
Annual Household IncomeAffordable Monthly Housing Cost 1 2 3 4+ Total
Less than $30,000 Less than $749 244 192 86 98 619
$30,000 to $59,999 $750 to $1,499 3,758 2,528 1,038 1,002 8,325
$60,000 to $89,999 $1,500 to $2,249 15,856 14,887 7,317 10,277 48,337
$90,000 to $119,000 $2,250 to $2,999 15,006 19,503 10,817 19,464 64,790
$120 to $149,000 $3,000 to $3,749 9,399 13,947 8,044 15,694 47,083
$150,000 and above $3,750 and above 17,042 27,495 16,181 32,578 93,296
Total 61,304 78,552 43,483 79,113 262,451
Renter‐Occupied Housing Supply, 2005
Annual Household IncomeAffordable Monthly Housing Cost 1 2 3 4+ Total
Less than $30,000 Less than $749 8,234 2,973 776 527 12,510
$30,000 to $59,999 $750 to $1,499 30,707 18,059 6,622 4,552 59,940
$60,000 to $89,999 $1,500 to $2,249 5,210 4,633 2,062 1,775 13,680
$90,000 to $119,000 $2,250 to $2,999 839 875 403 223 2,340
$120 to $149,000 $3,000 to $3,749 311 324 149 115 900
$150,000 and above $3,750 and above 181 191 88 170 630
Total 45,482 27,055 10,100 7,362 90,000
Surplus/Defecit, 2005
Annual Household IncomeAffordable Monthly Housing Cost 1 2 3 4+ Total
Less than $30,000 Less than $749 (9,932) (6,666) (4,884) (5,331) (26,813)
$30,000 to $59,999 $750 to $1,499 3,273 (40) (3,149) (9,745) (9,661)
$60,000 to $89,999 $1,500 to $2,249 3,765 (2,175) (1,768) (6,002) (6,179)
$90,000 to $119,000 $2,250 to $2,999 7,414 448 (219) 1,902 9,545
$120 to $149,000 $3,000 to $3,749 6,275 1,821 233 3,556 11,884
$150,000 and above $3,750 and above 14,356 5,471 2,505 4,344 26,676
Total 25,150 (1,141) (7,283) (11,275) 5,451
Number of Persons in Household
Number of Persons in Household
Number of Persons in Household
Number of Persons in Household
30
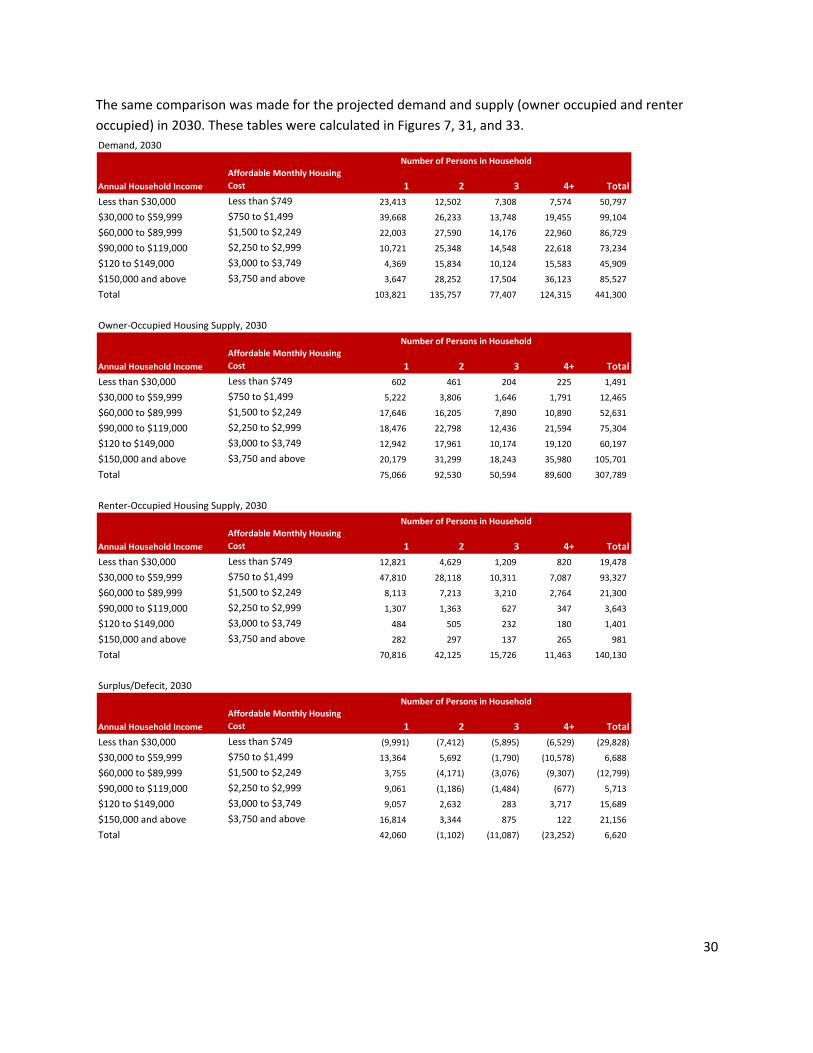
The same comparison was made for the projected demand and supply (owner occupied and renter occupied) in 2030. These tables were calculated in Figures 7, 31, and 33. Demand, 2030
Annual Household IncomeAffordable Monthly Housing Cost 1 2 3 4+ Total
Less than $30,000 Less than $749 23,413 12,502 7,308 7,574 50,797
$30,000 to $59,999 $750 to $1,499 39,668 26,233 13,748 19,455 99,104
$60,000 to $89,999 $1,500 to $2,249 22,003 27,590 14,176 22,960 86,729
$90,000 to $119,000 $2,250 to $2,999 10,721 25,348 14,548 22,618 73,234
$120 to $149,000 $3,000 to $3,749 4,369 15,834 10,124 15,583 45,909
$150,000 and above $3,750 and above 3,647 28,252 17,504 36,123 85,527
Total 103,821 135,757 77,407 124,315 441,300
Owner‐Occupied Housing Supply, 2030
Annual Household IncomeAffordable Monthly Housing Cost 1 2 3 4+ Total
Less than $30,000 Less than $749 602 461 204 225 1,491
$30,000 to $59,999 $750 to $1,499 5,222 3,806 1,646 1,791 12,465
$60,000 to $89,999 $1,500 to $2,249 17,646 16,205 7,890 10,890 52,631
$90,000 to $119,000 $2,250 to $2,999 18,476 22,798 12,436 21,594 75,304
$120 to $149,000 $3,000 to $3,749 12,942 17,961 10,174 19,120 60,197
$150,000 and above $3,750 and above 20,179 31,299 18,243 35,980 105,701
Total 75,066 92,530 50,594 89,600 307,789
Renter‐Occupied Housing Supply, 2030
Annual Household IncomeAffordable Monthly Housing Cost 1 2 3 4+ Total
Less than $30,000 Less than $749 12,821 4,629 1,209 820 19,478
$30,000 to $59,999 $750 to $1,499 47,810 28,118 10,311 7,087 93,327
$60,000 to $89,999 $1,500 to $2,249 8,113 7,213 3,210 2,764 21,300
$90,000 to $119,000 $2,250 to $2,999 1,307 1,363 627 347 3,643
$120 to $149,000 $3,000 to $3,749 484 505 232 180 1,401
$150,000 and above $3,750 and above 282 297 137 265 981
Total 70,816 42,125 15,726 11,463 140,130
Surplus/Defecit, 2030
Annual Household IncomeAffordable Monthly Housing Cost 1 2 3 4+ Total
Less than $30,000 Less than $749 (9,991) (7,412) (5,895) (6,529) (29,828)
$30,000 to $59,999 $750 to $1,499 13,364 5,692 (1,790) (10,578) 6,688
$60,000 to $89,999 $1,500 to $2,249 3,755 (4,171) (3,076) (9,307) (12,799)
$90,000 to $119,000 $2,250 to $2,999 9,061 (1,186) (1,484) (677) 5,713
$120 to $149,000 $3,000 to $3,749 9,057 2,632 283 3,717 15,689
$150,000 and above $3,750 and above 16,814 3,344 875 122 21,156
Total 42,060 (1,102) (11,087) (23,252) 6,620
Number of Persons in Household
Number of Persons in Household
Number of Persons in Household
Number of Persons in Household
31
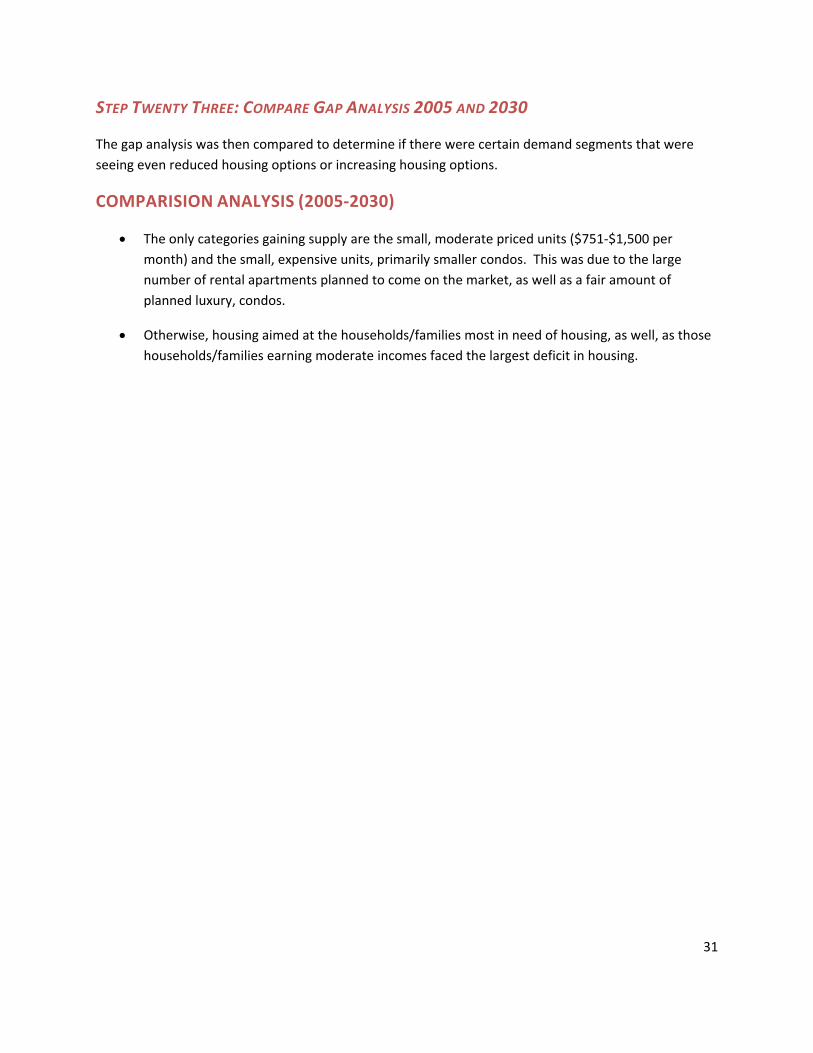
STEP TWENTY THREE: COMPARE GAP ANALYSIS 2005 AND 2030
The gap analysis was then compared to determine if there were certain demand segments that were seeing even reduced housing options or increasing housing options.
COMPARISION ANALYSIS (2005‐2030)
• The only categories gaining supply are the small, moderate priced units ($751‐$1,500 per month) and the small, expensive units, primarily smaller condos. This was due to the large number of rental apartments planned to come on the market, as well as a fair amount of planned luxury, condos.
• Otherwise, housing aimed at the households/families most in need of housing, as well, as those households/families earning moderate incomes faced the largest deficit in housing.
32
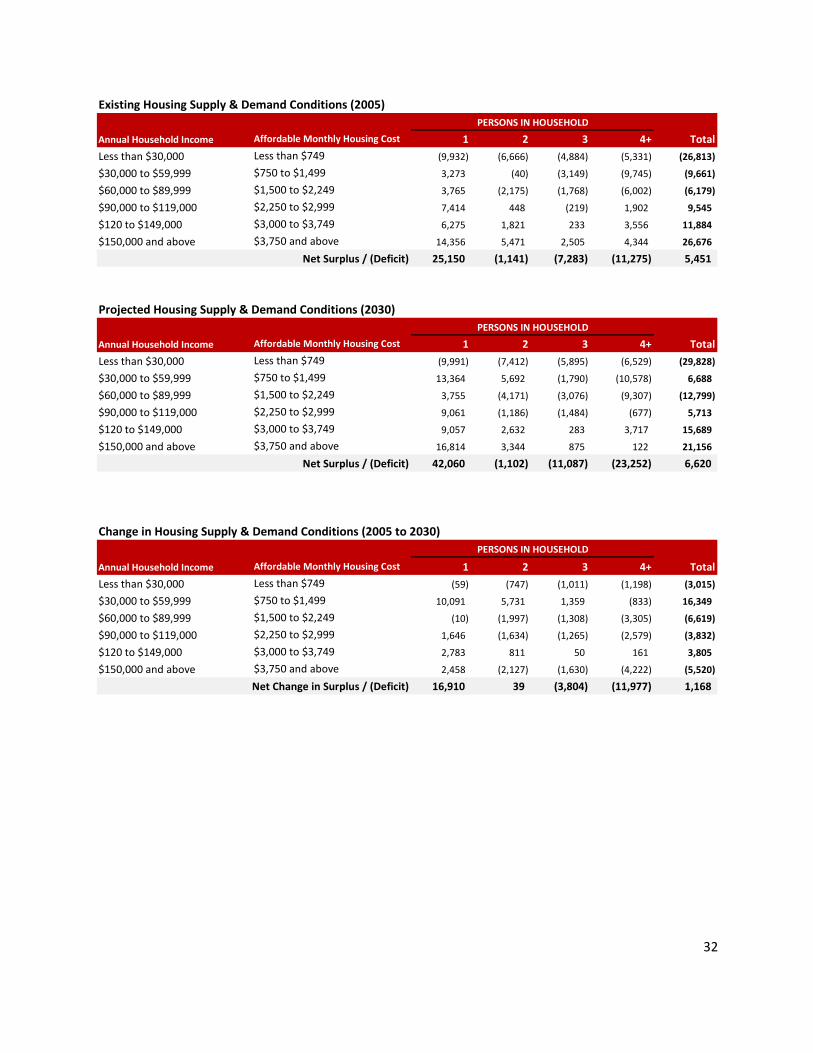
Existing Housing Supply & Demand Conditions (2005)
Annual Household Income Affordable Monthly Housing Cost 1 2 3 4+ Total
Less than $30,000 Less than $749 (9,932) (6,666) (4,884) (5,331) (26,813)
$30,000 to $59,999 $750 to $1,499 3,273 (40) (3,149) (9,745) (9,661)
$60,000 to $89,999 $1,500 to $2,249 3,765 (2,175) (1,768) (6,002) (6,179)
$90,000 to $119,000 $2,250 to $2,999 7,414 448 (219) 1,902 9,545
$120 to $149,000 $3,000 to $3,749 6,275 1,821 233 3,556 11,884
$150,000 and above $3,750 and above 14,356 5,471 2,505 4,344 26,676
25,150 (1,141) (7,283) (11,275) 5,451
Projected Housing Supply & Demand Conditions (2030)
Annual Household Income Affordable Monthly Housing Cost 1 2 3 4+ Total
Less than $30,000 Less than $749 (9,991) (7,412) (5,895) (6,529) (29,828)
$30,000 to $59,999 $750 to $1,499 13,364 5,692 (1,790) (10,578) 6,688
$60,000 to $89,999 $1,500 to $2,249 3,755 (4,171) (3,076) (9,307) (12,799)
$90,000 to $119,000 $2,250 to $2,999 9,061 (1,186) (1,484) (677) 5,713
$120 to $149,000 $3,000 to $3,749 9,057 2,632 283 3,717 15,689
$150,000 and above $3,750 and above 16,814 3,344 875 122 21,156
42,060 (1,102) (11,087) (23,252) 6,620
Change in Housing Supply & Demand Conditions (2005 to 2030)
Annual Household Income Affordable Monthly Housing Cost 1 2 3 4+ Total
Less than $30,000 Less than $749 (59) (747) (1,011) (1,198) (3,015)
$30,000 to $59,999 $750 to $1,499 10,091 5,731 1,359 (833) 16,349
$60,000 to $89,999 $1,500 to $2,249 (10) (1,997) (1,308) (3,305) (6,619)
$90,000 to $119,000 $2,250 to $2,999 1,646 (1,634) (1,265) (2,579) (3,832)
$120 to $149,000 $3,000 to $3,749 2,783 811 50 161 3,805
$150,000 and above $3,750 and above 2,458 (2,127) (1,630) (4,222) (5,520)
16,910 39 (3,804) (11,977) 1,168
Net Surplus / (Deficit)
Net Change in Surplus / (Deficit)
PERSONS IN HOUSEHOLD
PERSONS IN HOUSEHOLD
PERSONS IN HOUSEHOLD
Net Surplus / (Deficit)