Embed Size (px)
Citation preview
Housing Finance Policy Center Lunchtime Data Talk Credit Scoring: Going Beyond the Usual Sarah Davies, VantageScore Solutions Michael Turner, PERC Kenneth Brevoort, Consumer Financial Protection Bureau Laurie Goodman, Urban Institute
March 12, 2015
Alternative Data & Credit Scoring Sarah F. Davies
Senior Vice President, Analytics & Product Management
203-363-2162 VantageScore Solutions, LLC
VantageScore Solutions, LLC © 2014 2
Topics….
• Who can be scored using traditional credit file
data? • The scoreable universe • Criteria for scoring – three gating factors • How good is the score?
• Leveraging alternative data • Rent and utility data • Full-file or positive-only data
VantageScore Solutions, LLC © 2014 3
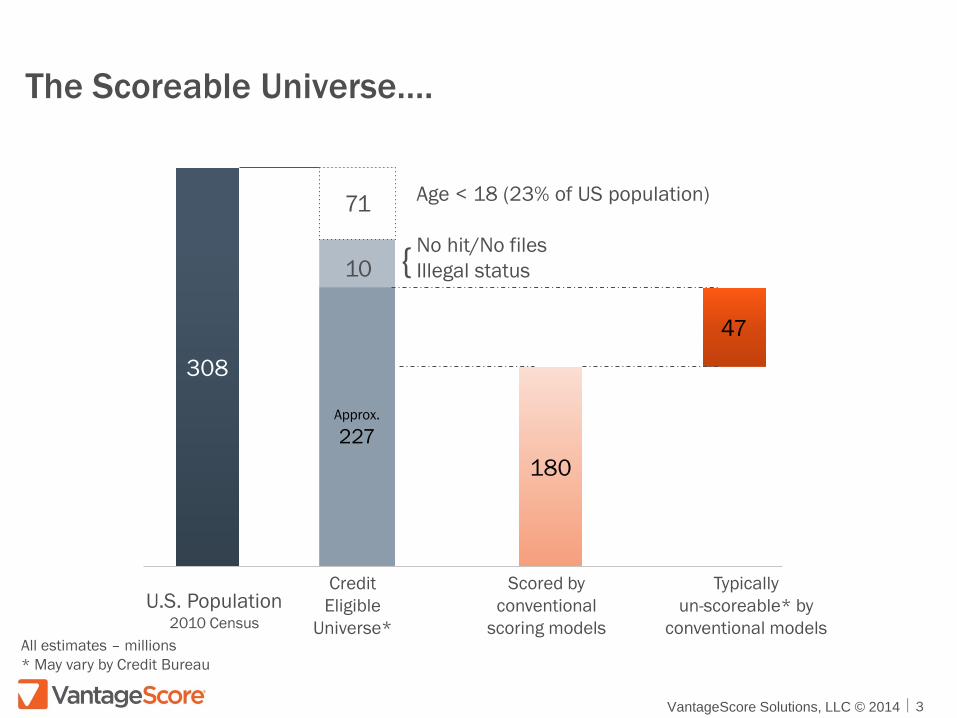
The Scoreable Universe….
308
Approx.
227 180
47
Scored by conventional
scoring models
Typically un-scoreable* by
conventional models U.S. Population
2010 Census
Credit Eligible
Universe*
Age < 18 (23% of US population)
No hit/No files Illegal status
All estimates – millions * May vary by Credit Bureau
{ 10
71
VantageScore Solutions, LLC © 2014 4
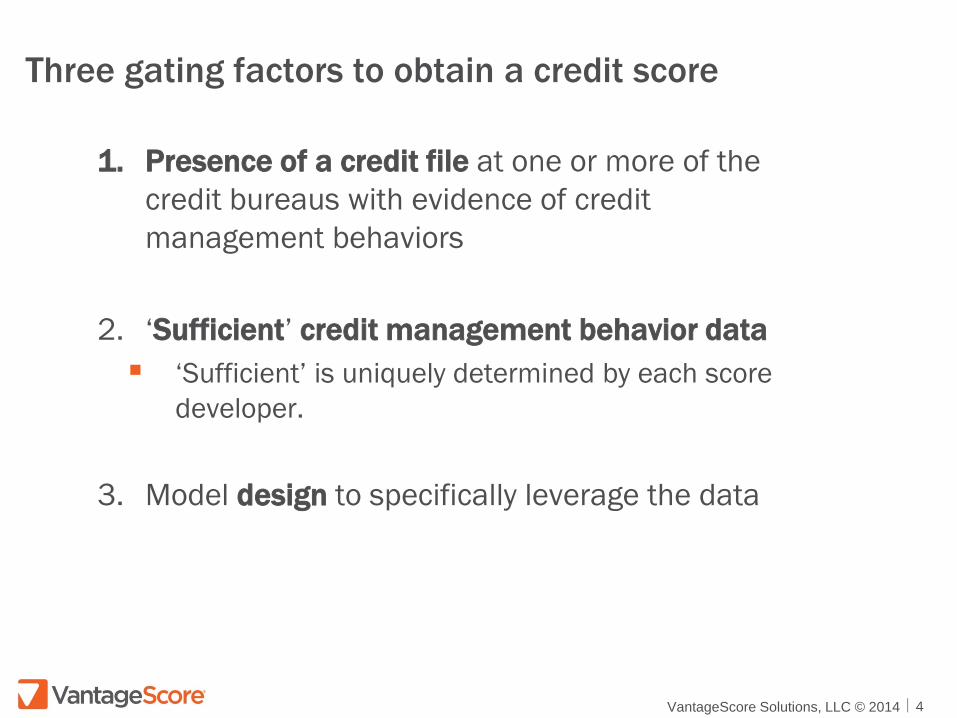
Three gating factors to obtain a credit score
1. Presence of a credit file at one or more of the credit bureaus with evidence of credit management behaviors
2. ‘Sufficient’ credit management behavior data ‘Sufficient’ is uniquely determined by each score
developer.
3. Model design to specifically leverage the data
VantageScore Solutions, LLC © 2014 5
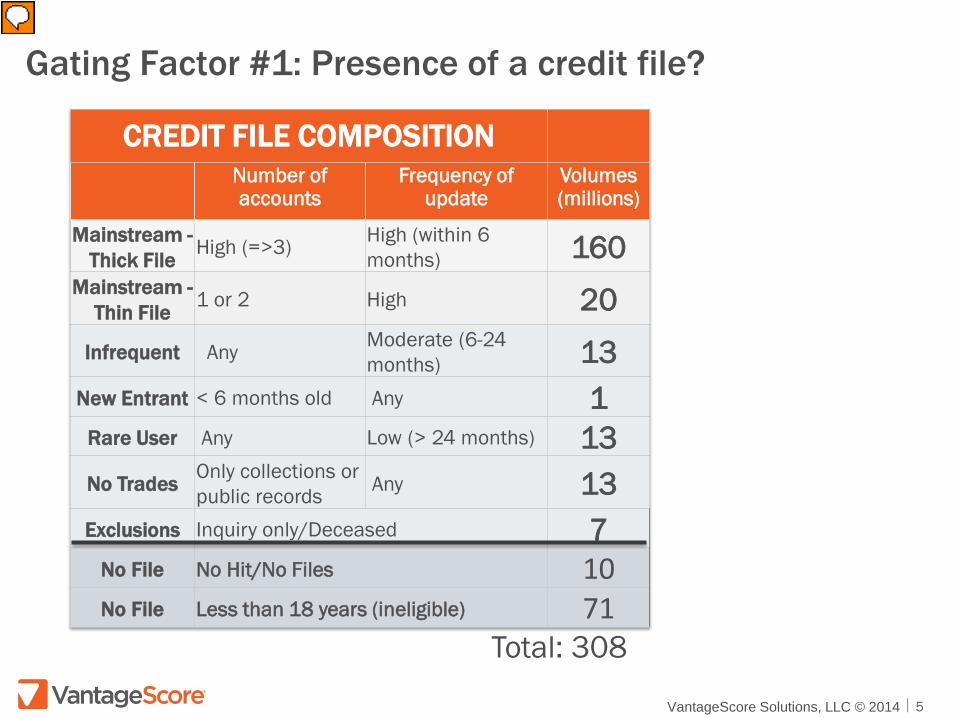
Gating Factor #1: Presence of a credit file?
CREDIT FILE COMPOSITION Number of accounts
Frequency of update
Volumes (millions)
Mainstream - Thick File High (=>3) High (within 6
months) 160 Mainstream -
Thin File 1 or 2 High 20 Infrequent Any Moderate (6-24
months) 13 New Entrant < 6 months old Any 1
Rare User Any Low (> 24 months) 13 No Trades Only collections or
public records Any 13 Exclusions Inquiry only/Deceased 7
No File No Hit/No Files 10 No File Less than 18 years (ineligible) 71
Total: 308
VantageScore Solutions, LLC © 2014 6
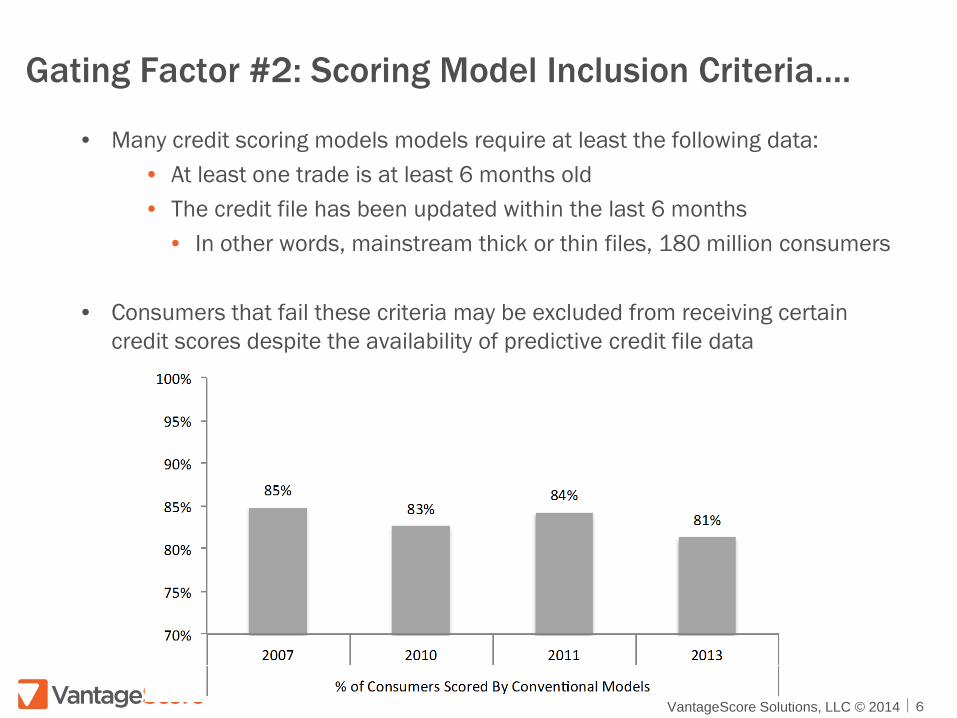
Gating Factor #2: Scoring Model Inclusion Criteria….
• Many credit scoring models models require at least the following data: • At least one trade is at least 6 months old • The credit file has been updated within the last 6 months
• In other words, mainstream thick or thin files, 180 million consumers
• Consumers that fail these criteria may be excluded from receiving certain credit scores despite the availability of predictive credit file data
VantageScore Solutions, LLC © 2014 7
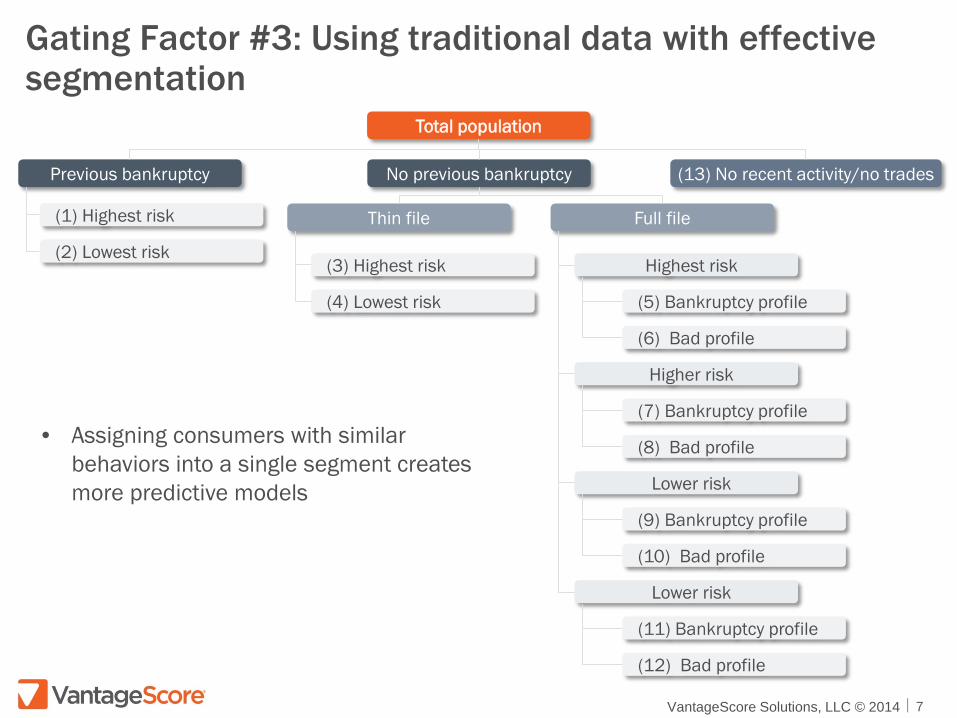
Gating Factor #3: Using traditional data with effective segmentation
Previous bankruptcy No previous bankruptcy
Thin file
Total population
(13) No recent activity/no trades
Full file (1) Highest risk
(2) Lowest risk (3) Highest risk
(4) Lowest risk
Highest risk
Higher risk
(5) Bankruptcy profile
(6) Bad profile
(7) Bankruptcy profile
(8) Bad profile
Lower risk
(9) Bankruptcy profile
(10) Bad profile
Lower risk
(11) Bankruptcy profile
(12) Bad profile
• Assigning consumers with similar behaviors into a single segment creates more predictive models
VantageScore Solutions, LLC © 2014 8
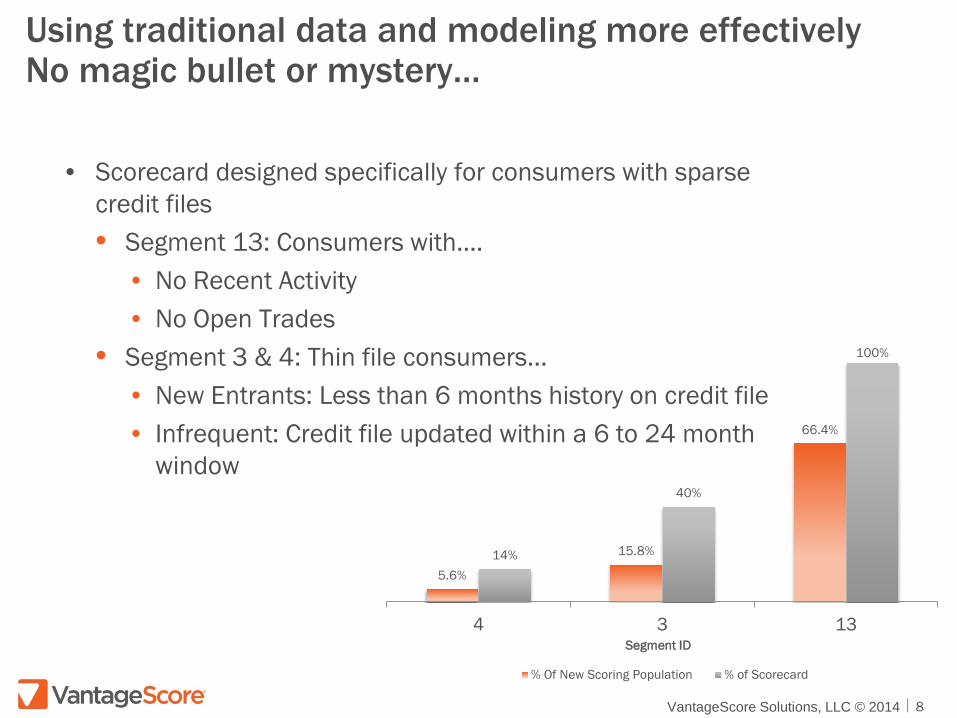
Using traditional data and modeling more effectively No magic bullet or mystery…
• Scorecard designed specifically for consumers with sparse
credit files • Segment 13: Consumers with….
• No Recent Activity • No Open Trades
• Segment 3 & 4: Thin file consumers... • New Entrants: Less than 6 months history on credit file • Infrequent: Credit file updated within a 6 to 24 month
window
5.6%
15.8%
66.4%
14%
40%
100%
4 3 13Segment ID
% Of New Scoring Population % of Scorecard

VantageScore Solutions, LLC © 2014 9
Segment 13 – Strongest predictive variable
• Number of unpaid external collections with balances greater than $250 • Provides meaningful predictive insight when included in
the appropriate segments
0.0%
10.0%
20.0%
30.0%
40.0%
50.0%
60.0%
70.0%
1 2 3 4 5 6 7 8 9 10 11 12 13 14 15 16 17 18
Def
ault
Rate
VantageScore Solutions, LLC © 2014 10
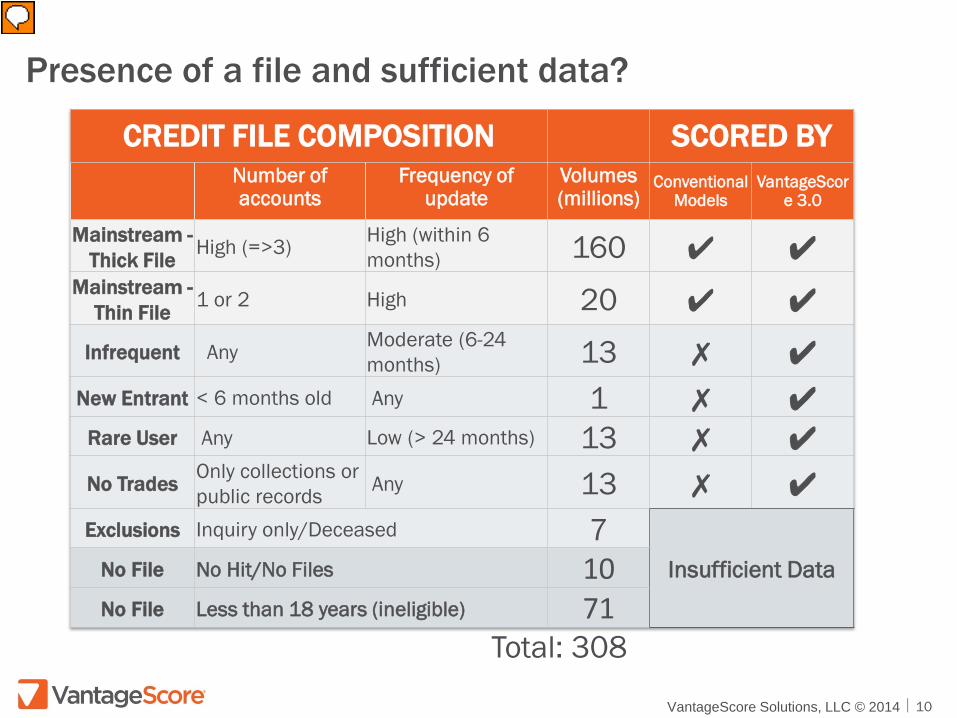
Presence of a file and sufficient data?
CREDIT FILE COMPOSITION SCORED BY Number of accounts
Frequency of update
Volumes (millions)
Conventional Models
VantageScore 3.0
Mainstream - Thick File High (=>3) High (within 6
months) 160 ✔ ✔ Mainstream -
Thin File 1 or 2 High 20 ✔ ✔ Infrequent Any Moderate (6-24
months) 13 ✗ ✔ New Entrant < 6 months old Any 1 ✗ ✔
Rare User Any Low (> 24 months) 13 ✗ ✔ No Trades Only collections or
public records Any 13 ✗ ✔ Exclusions Inquiry only/Deceased 7
Insufficient Data No File No Hit/No Files 10 No File Less than 18 years (ineligible) 71
Total: 308
VantageScore Solutions, LLC © 2014 11
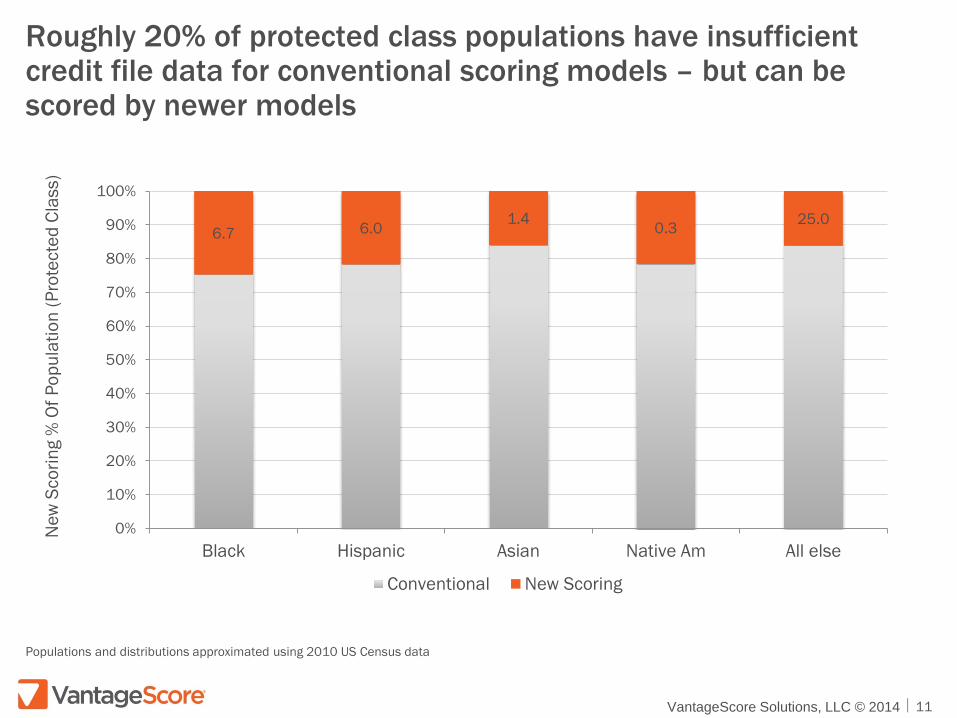
Roughly 20% of protected class populations have insufficient credit file data for conventional scoring models – but can be scored by newer models
6.7 6.0 1.4 0.3 25.0
0%
10%
20%
30%
40%
50%
60%
70%
80%
90%
100%
Black Hispanic Asian Native Am All else
Conventional New Scoring
New
Sco
ring
% O
f Pop
ulat
ion
(Pro
tect
ed C
lass
)
Populations and distributions approximated using 2010 US Census data
VantageScore Solutions, LLC © 2014 12
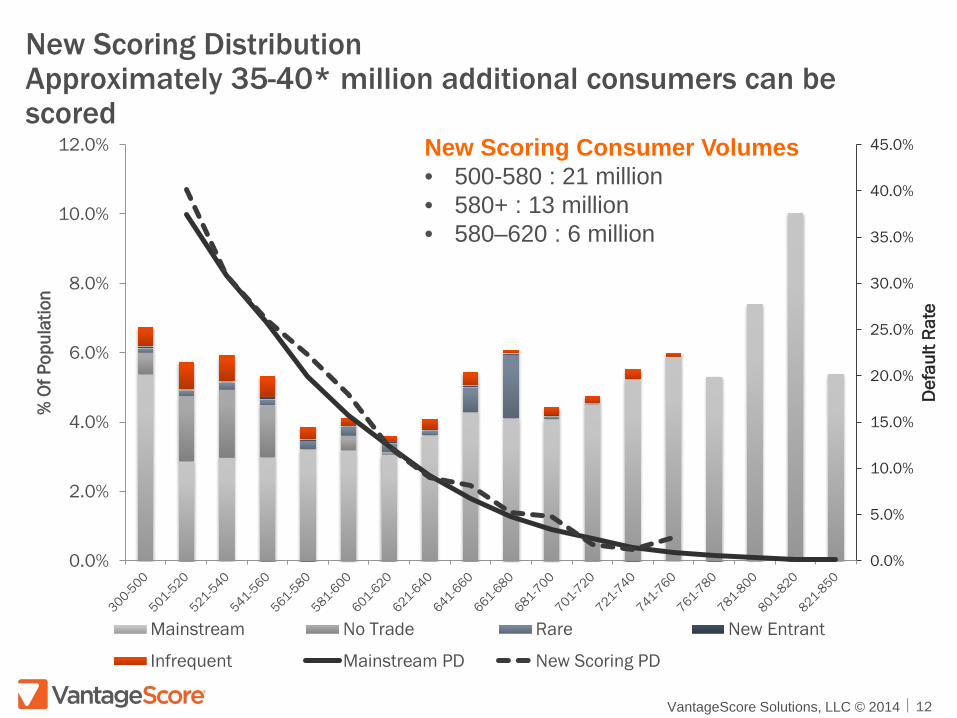
New Scoring Distribution Approximately 35-40* million additional consumers can be scored
New Scoring Consumer Volumes • 500-580 : 21 million • 580+ : 13 million • 580–620 : 6 million
0.0%
5.0%
10.0%
15.0%
20.0%
25.0%
30.0%
35.0%
40.0%
45.0%
0.0%
2.0%
4.0%
6.0%
8.0%
10.0%
12.0%
Def
ault
Rate
% O
f Pop
ulat
ion
Mainstream No Trade Rare New Entrant
Infrequent Mainstream PD New Scoring PD
VantageScore Solutions, LLC © 2014 13
• Up to 93% (~220 million consumers) of the credit eligible population can be scored using traditional credit data
• Leveraging alternative data to score the remainder
VantageScore Solutions, LLC © 2014 14
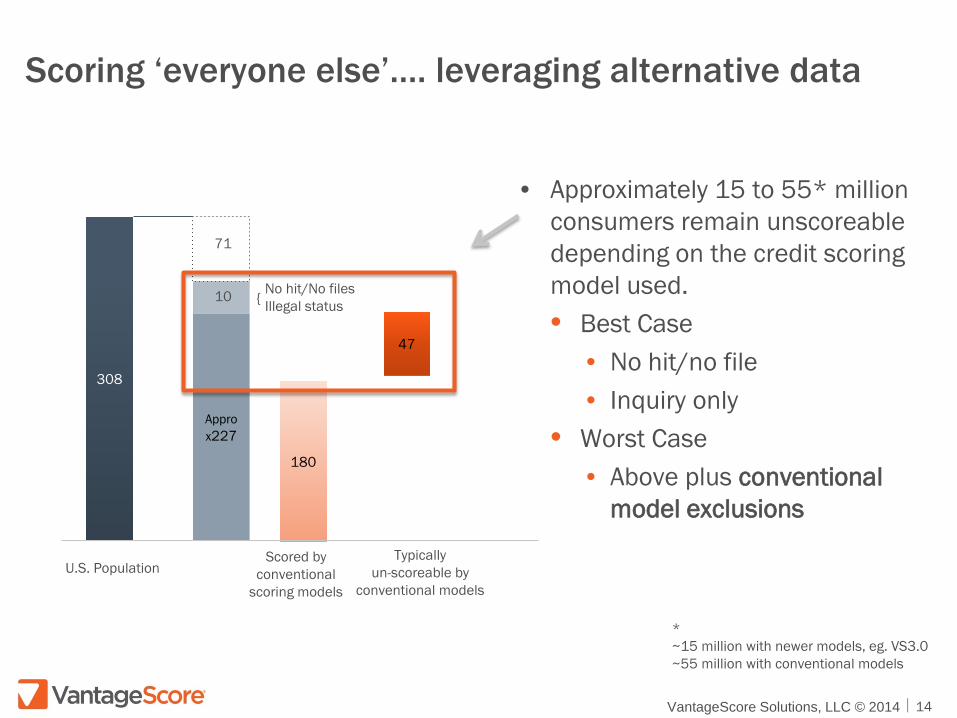
Scoring ‘everyone else’…. leveraging alternative data
• Approximately 15 to 55* million consumers remain unscoreable depending on the credit scoring model used. • Best Case
• No hit/no file • Inquiry only
• Worst Case • Above plus conventional
model exclusions
308
Approx227
180
47
Scored by conventional
scoring models
Typically un-scoreable by
conventional models U.S. Population
No hit/No files Illegal status { 10
71
* ~15 million with newer models, eg. VS3.0 ~55 million with conventional models
VantageScore Solutions, LLC © 2014 15
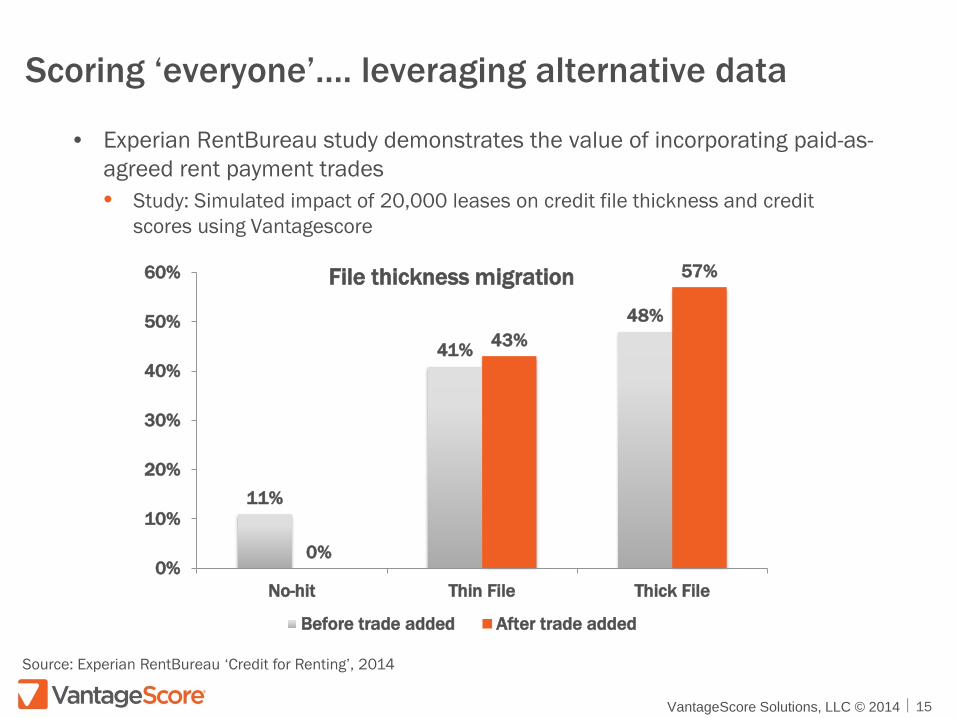
Scoring ‘everyone’…. leveraging alternative data
• Experian RentBureau study demonstrates the value of incorporating paid-as-agreed rent payment trades • Study: Simulated impact of 20,000 leases on credit file thickness and credit
scores using Vantagescore
11%
41%
48%
0%
43%
57%
0%
10%
20%
30%
40%
50%
60%
No-hit Thin File Thick File
Before trade added After trade added
Source: Experian RentBureau ‘Credit for Renting’, 2014
File thickness migration
VantageScore Solutions, LLC © 2014 16
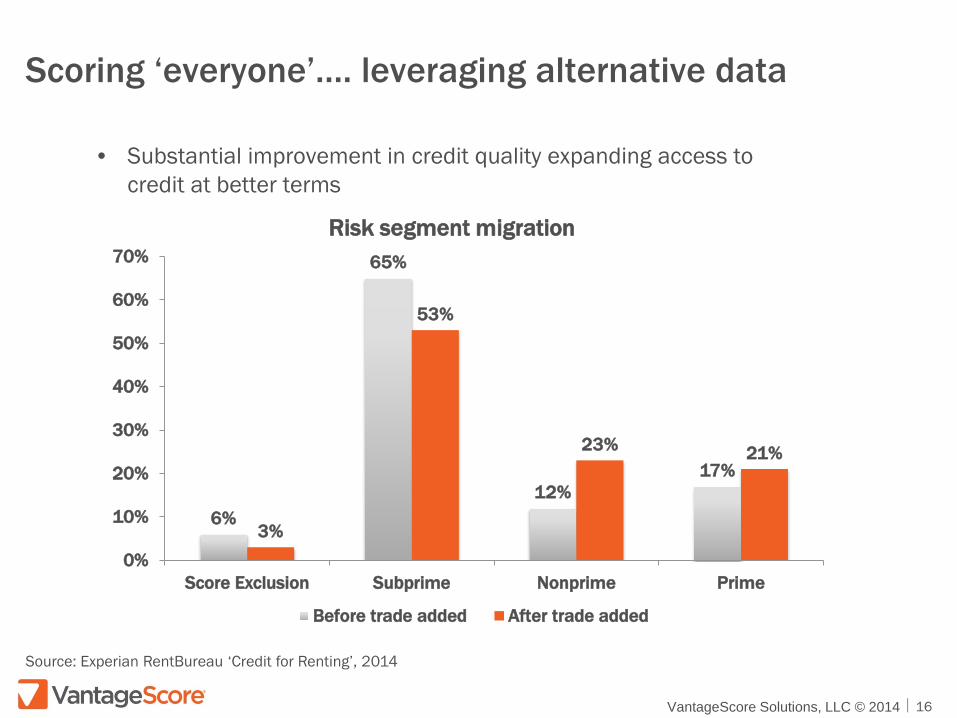
Scoring ‘everyone’…. leveraging alternative data
• Substantial improvement in credit quality expanding access to credit at better terms
6%
65%
12% 17%
3%
53%
23% 21%
0%
10%
20%
30%
40%
50%
60%
70%
Score Exclusion Subprime Nonprime Prime
Before trade added After trade added
Source: Experian RentBureau ‘Credit for Renting’, 2014
Risk segment migration
VantageScore Solutions, LLC © 2014 17
Scoring ‘everyone’…. leveraging alternative data
• Similar results are observed when incorporating positive energy-utility data (Experian ‘Let There Be Light’, 2015) • 20% of thin file consumers migrated to thick file • Subprime population reduced by 47%
• Several challenges remain with these data
• Data quality and accuracy • Universal reporting • Impact of consumer utility laws
• However, it’s a positive sign that major credit scores now
incorporate rental payments when available on the consumer’s primary credit file
VantageScore Solutions, LLC © 2014 18
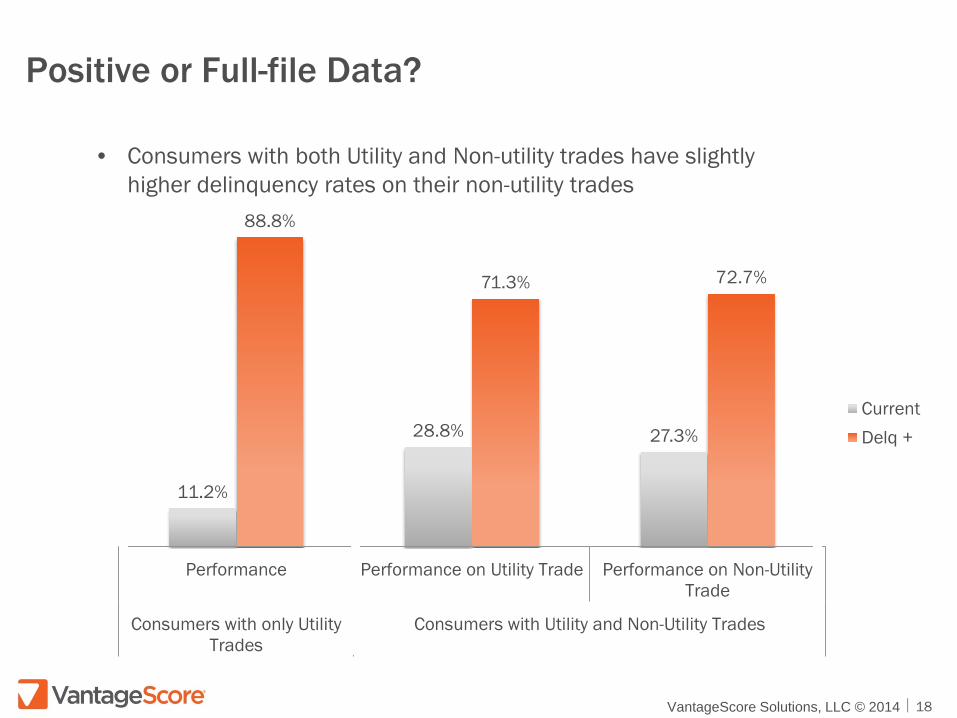
Positive or Full-file Data?
• Consumers with both Utility and Non-utility trades have slightly higher delinquency rates on their non-utility trades
11.2%
28.8% 27.3%
88.8%
71.3% 72.7%
Performance Performance on Utility Trade Performance on Non-UtilityTrade
Consumers with only UtilityTrades
Consumers with Utility and Non-Utility Trades
CurrentDelq +

Credit Scoring:
19
Going Beyond the
Usual
PERC Presentation: March 12th, 2015 Urban Institute—Washington, DC
Select PERC Supporters Include…
Foundations & Nonprofits
Government & Multilaterals
Trade Associations
Private Organizations
20
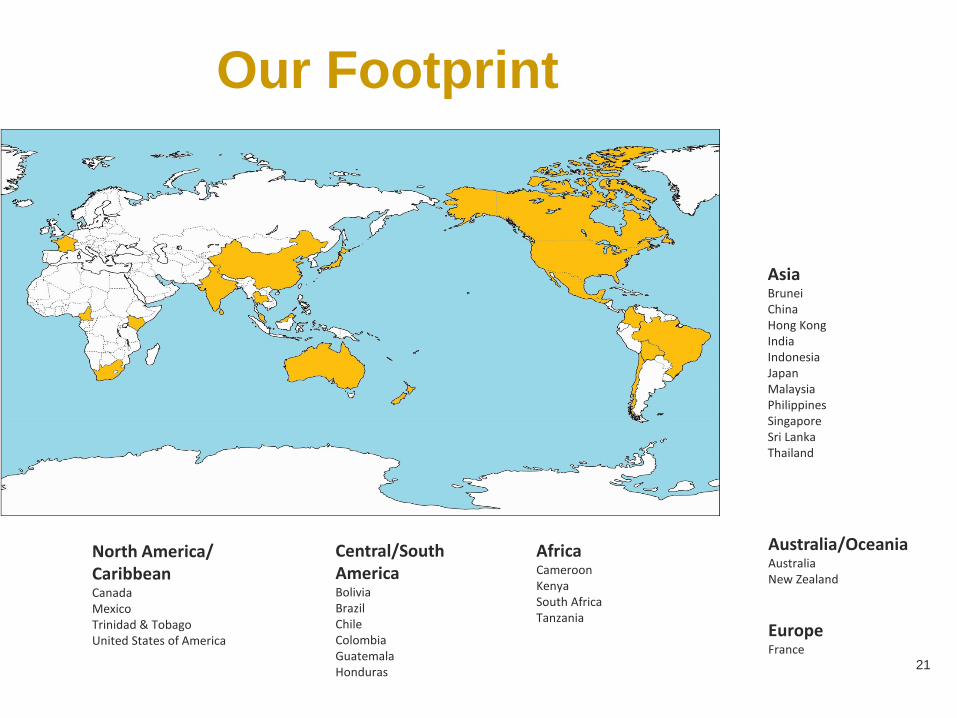
Our Footprint
Africa Cameroon Kenya South Africa Tanzania
North America/ Caribbean Canada Mexico Trinidad & Tobago United States of America
Asia Brunei China Hong Kong India Indonesia Japan Malaysia Philippines Singapore Sri Lanka Thailand
Australia/Oceania Australia New Zealand Europe France
Central/South America Bolivia Brazil Chile Colombia Guatemala Honduras 21
PERC’s Alternative
Data Initiative
(ADI) PERC advocates the inclusion of alternative data for use in credit granting
alternative = regular bill payment data from telecoms, energy utilities, rental payments and other such non-financial services that are valuable inputs for credit decisions
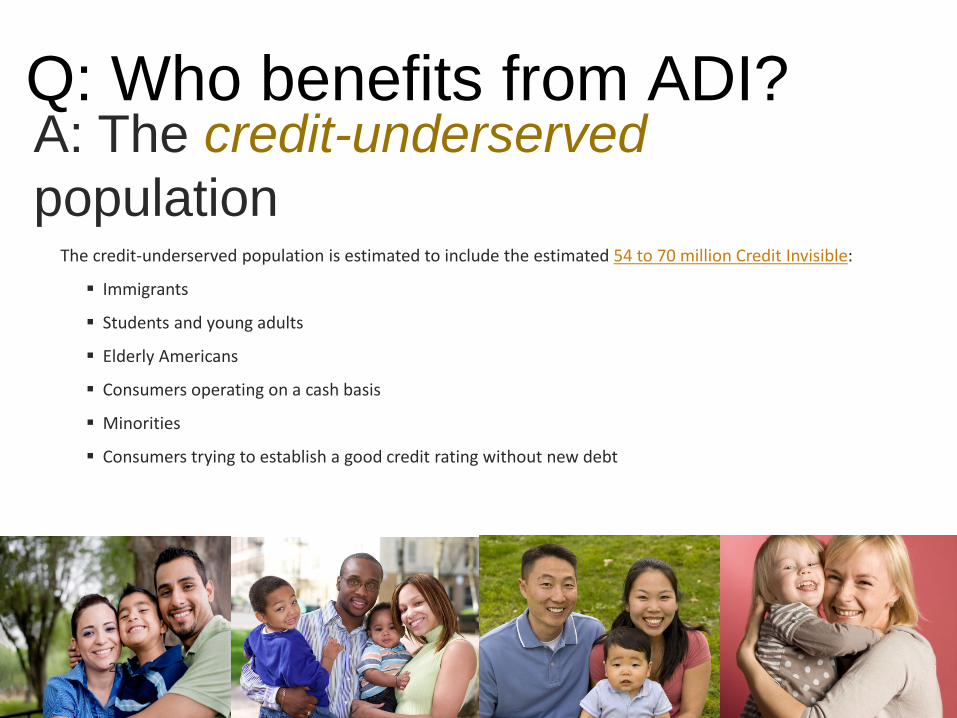
Q: Who benefits from ADI? A: The credit-underserved population The credit-underserved population is estimated to include the estimated 54 to 70 million Credit Invisible:
Immigrants
Students and young adults
Elderly Americans
Consumers operating on a cash basis
Minorities
Consumers trying to establish a good credit rating without new debt
23
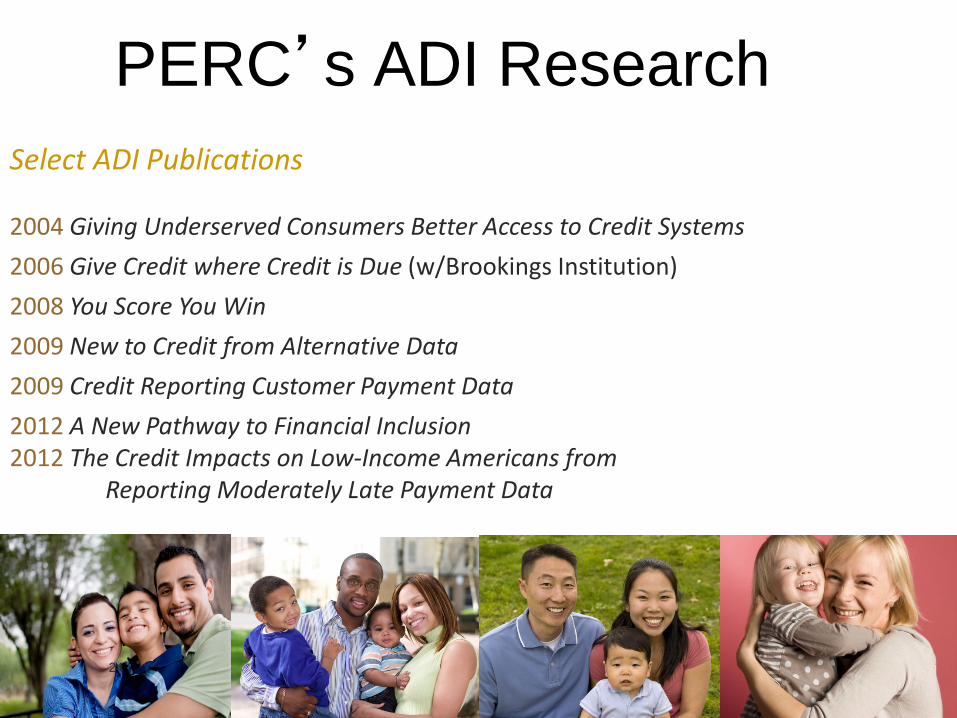
PERC’s ADI Research
Select ADI Publications 2004 Giving Underserved Consumers Better Access to Credit Systems 2006 Give Credit where Credit is Due (w/Brookings Institution) 2008 You Score You Win 2009 New to Credit from Alternative Data 2009 Credit Reporting Customer Payment Data 2012 A New Pathway to Financial Inclusion 2012 The Credit Impacts on Low-Income Americans from Reporting Moderately Late Payment Data
24
25
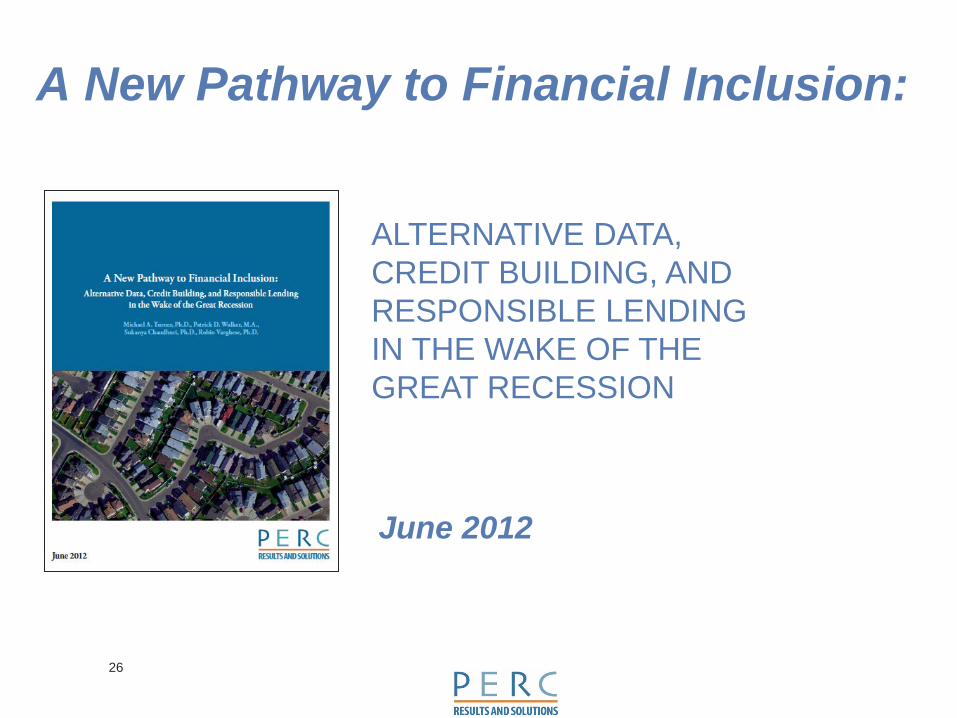
A New Pathway to Financial Inclusion:
26
ALTERNATIVE DATA, CREDIT BUILDING, AND RESPONSIBLE LENDING IN THE WAKE OF THE GREAT RECESSION
June 2012
27
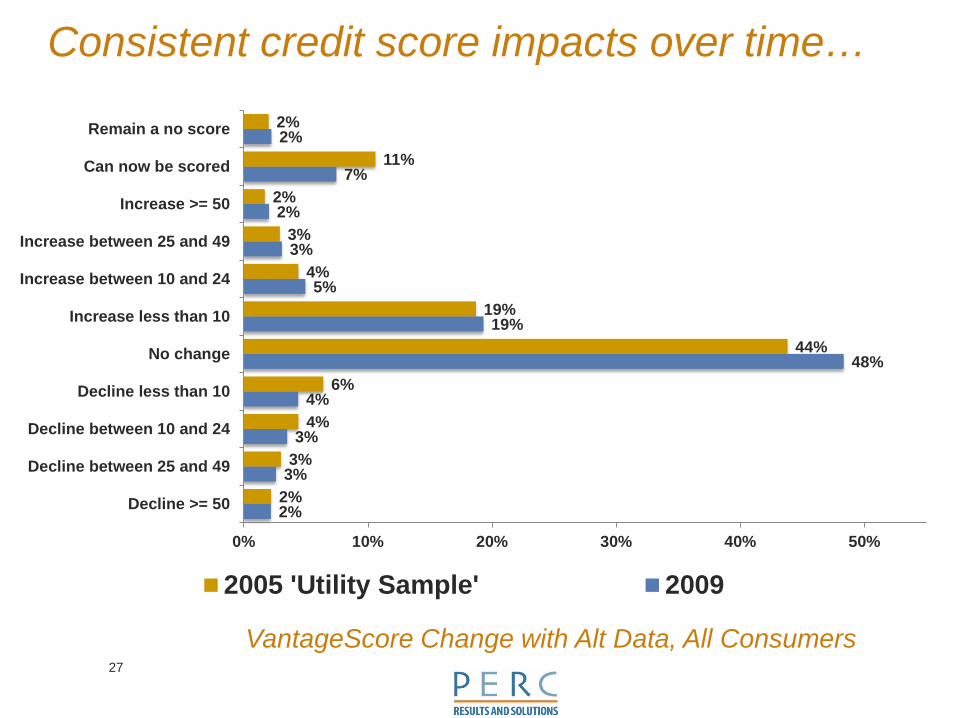
2%
3%
3%
4%
48%
19%
5%
3%
2%
7%
2%
2%
3%
4%
6%
44%
19%
4%
3%
2%
11%
2%
0% 10% 20% 30% 40% 50%
Decline >= 50
Decline between 25 and 49
Decline between 10 and 24
Decline less than 10
No change
Increase less than 10
Increase between 10 and 24
Increase between 25 and 49
Increase >= 50
Can now be scored
Remain a no score
2005 'Utility Sample' 2009
Consistent credit score impacts over time…
VantageScore Change with Alt Data, All Consumers
28
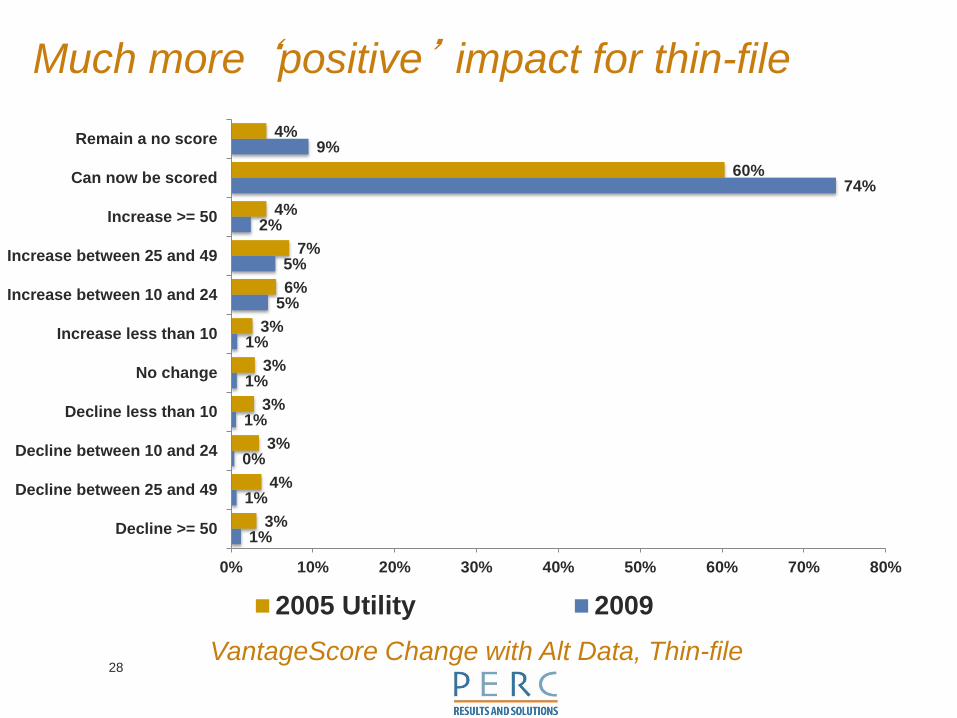
Much more ‘positive’ impact for thin-file
1%
1%
0%
1%
1%
1%
5%
5%
2%
74%
9%
3%
4%
3%
3%
3%
3%
6%
7%
4%
60%
4%
0% 10% 20% 30% 40% 50% 60% 70% 80%
Decline >= 50
Decline between 25 and 49
Decline between 10 and 24
Decline less than 10
No change
Increase less than 10
Increase between 10 and 24
Increase between 25 and 49
Increase >= 50
Can now be scored
Remain a no score
2005 Utility 2009VantageScore Change with Alt Data, Thin-file
29
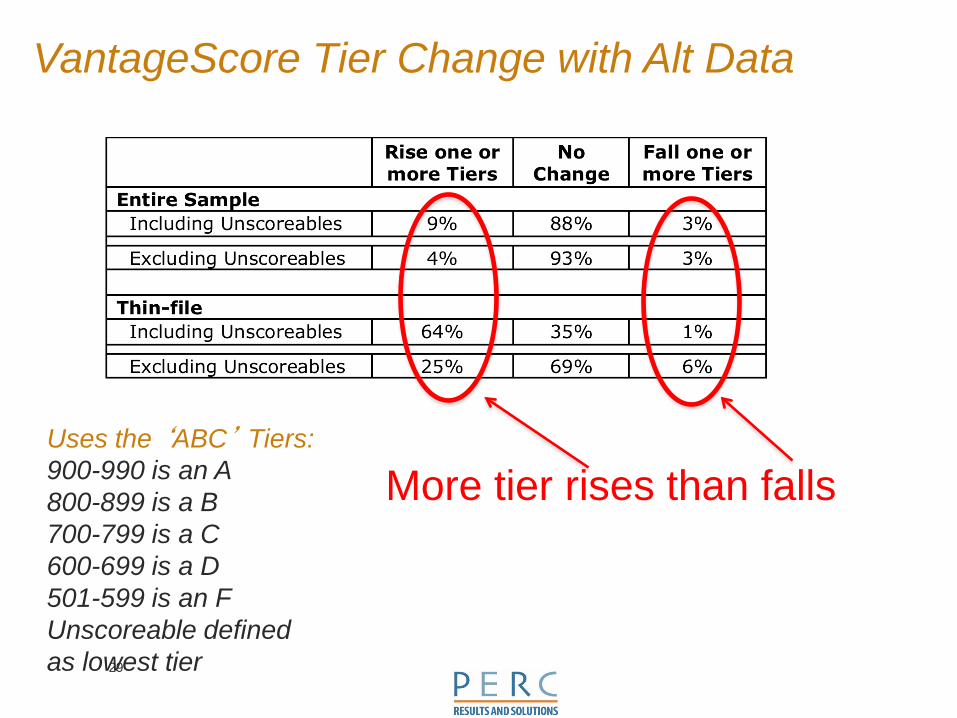
VantageScore Tier Change with Alt Data
Uses the ‘ABC’ Tiers: 900-990 is an A 800-899 is a B 700-799 is a C 600-699 is a D 501-599 is an F Unscoreable defined as lowest tier
More tier rises than falls
30
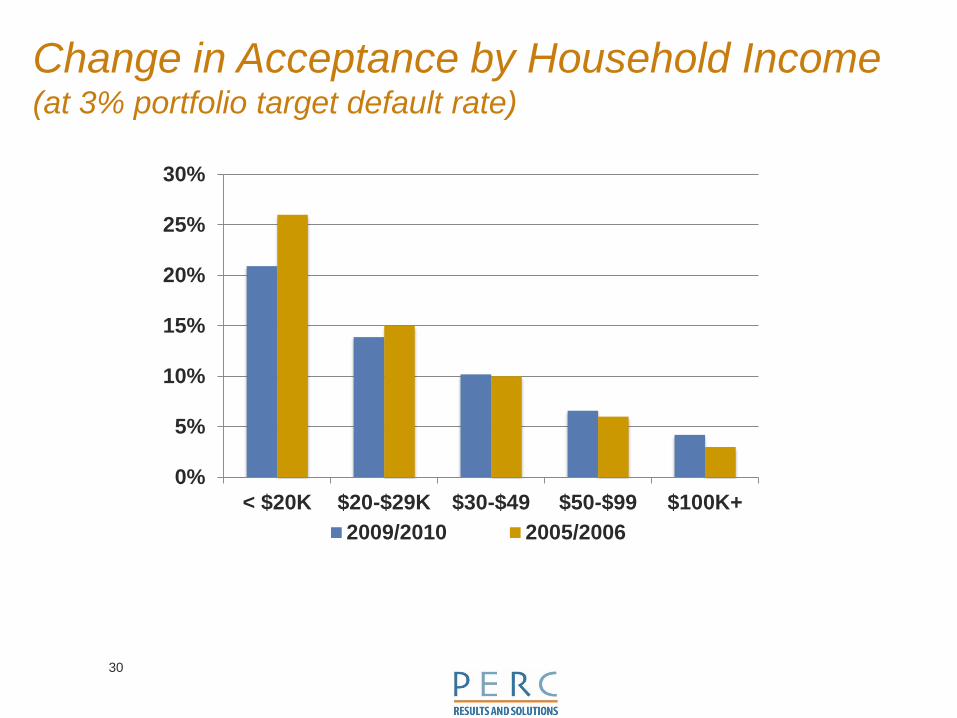
0%
5%
10%
15%
20%
25%
30%
< $20K $20-$29K $30-$49 $50-$99 $100K+2009/2010 2005/2006
Change in Acceptance by Household Income (at 3% portfolio target default rate)
31
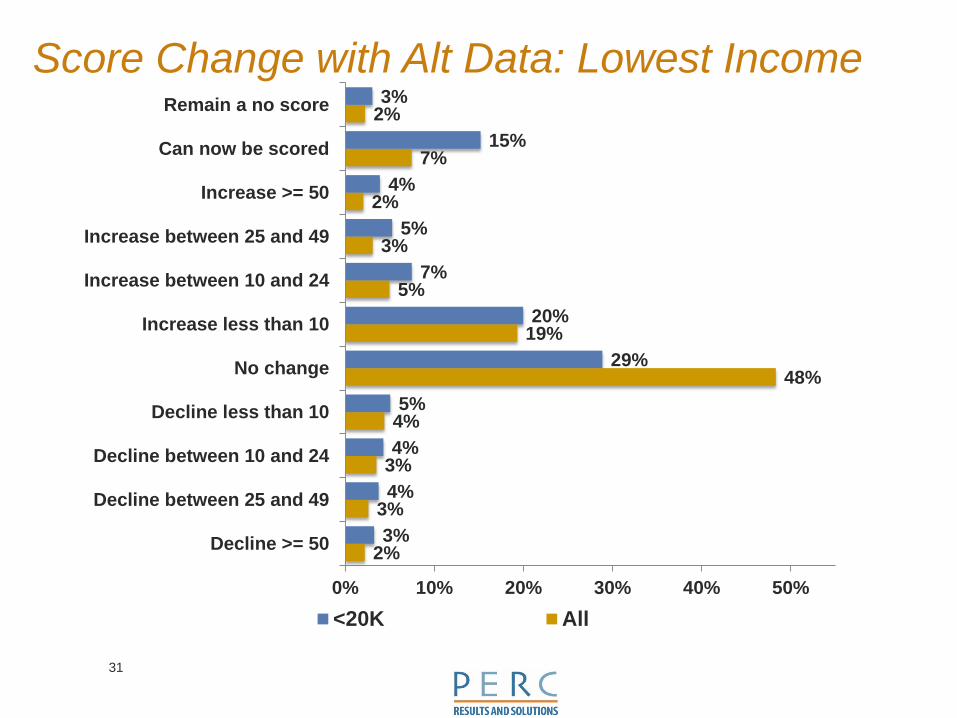
Score Change with Alt Data: Lowest Income
2%
3%
3%
4%
48%
19%
5%
3%
2%
7%
2%
3%
4%
4%
5%
29%
20%
7%
5%
4%
15%
3%
0% 10% 20% 30% 40% 50%
Decline >= 50
Decline between 25 and 49
Decline between 10 and 24
Decline less than 10
No change
Increase less than 10
Increase between 10 and 24
Increase between 25 and 49
Increase >= 50
Can now be scored
Remain a no score
<20K All
32
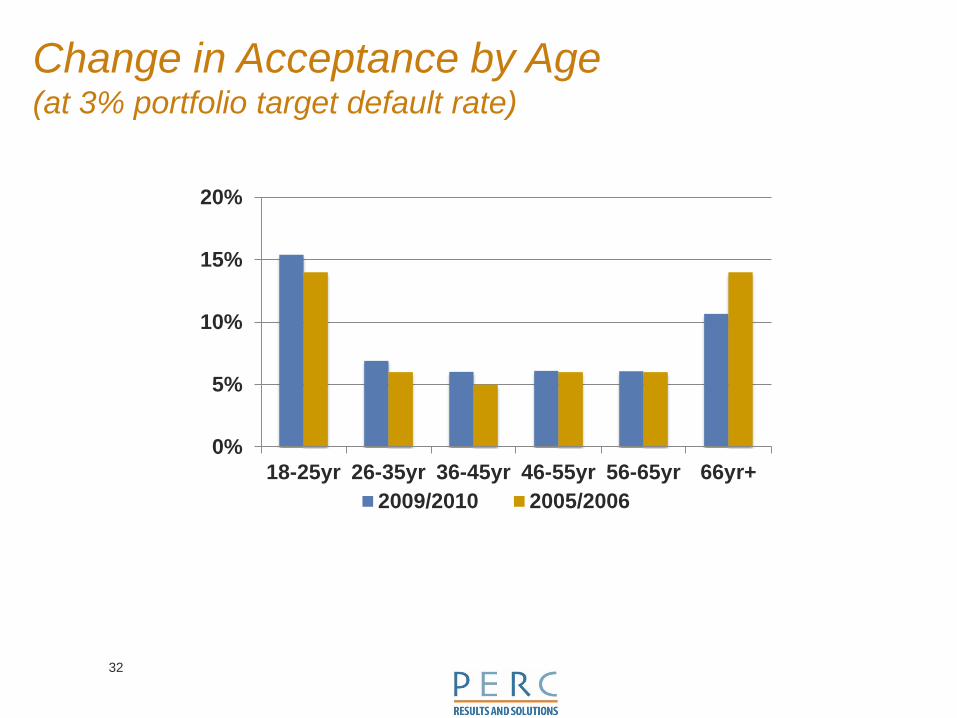
0%
5%
10%
15%
20%
18-25yr 26-35yr 36-45yr 46-55yr 56-65yr 66yr+2009/2010 2005/2006
Change in Acceptance by Age (at 3% portfolio target default rate)

33
VantageScore Score Change with Alt Data, Helps those with damaged credit (PR & 90+ dpd)
0%
5%
10%
15%
20%
25%
30%
35%
40%
≥ 50 pt 25-49 pt 10-24 pt < 10 pt No Change Can Now beScored
Remain a"No Score"
Decrease Increase
55.8% see score increases, 30.2% see decreases
Research Consensus Confirms Benefits of Alternative Data
34
March 2015
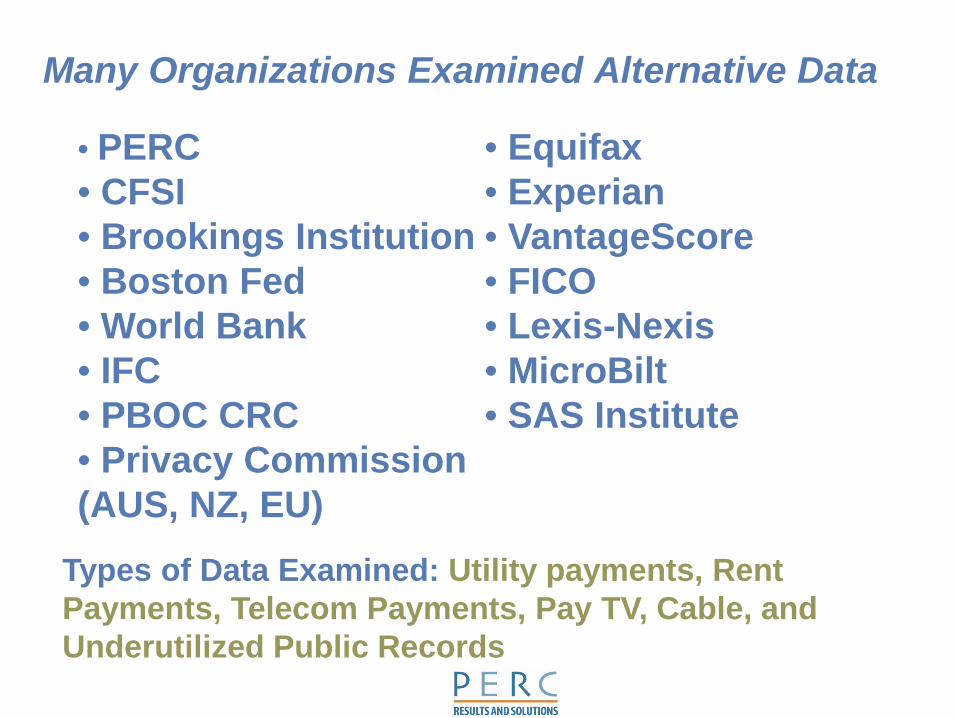
Many Organizations Examined Alternative Data
• PERC • CFSI • Brookings Institution • Boston Fed • World Bank • IFC • PBOC CRC • Privacy Commission (AUS, NZ, EU)
• Equifax • Experian • VantageScore • FICO • Lexis-Nexis • MicroBilt • SAS Institute
Types of Data Examined: Utility payments, Rent Payments, Telecom Payments, Pay TV, Cable, and Underutilized Public Records
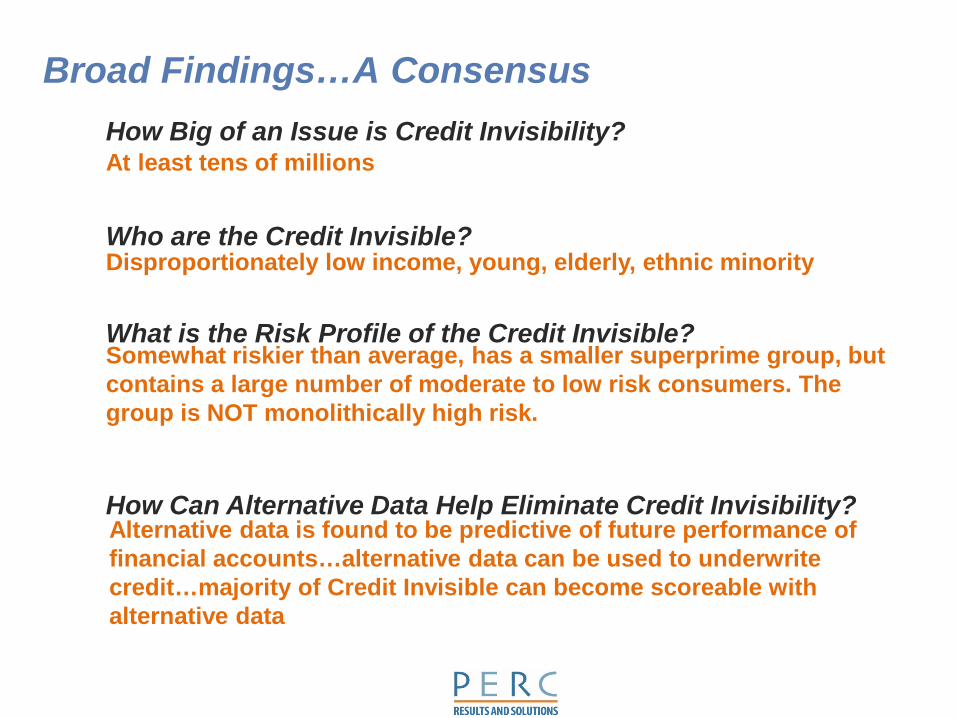
Broad Findings…A Consensus How Big of an Issue is Credit Invisibility?
Who are the Credit Invisible?
At least tens of millions
Disproportionately low income, young, elderly, ethnic minority
What is the Risk Profile of the Credit Invisible? Somewhat riskier than average, has a smaller superprime group, but contains a large number of moderate to low risk consumers. The group is NOT monolithically high risk.
How Can Alternative Data Help Eliminate Credit Invisibility? Alternative data is found to be predictive of future performance of financial accounts…alternative data can be used to underwrite credit…majority of Credit Invisible can become scoreable with alternative data
Predicting Financial Account Delinquencies with Utility and Telecom Payment Data
37
March / April 2015
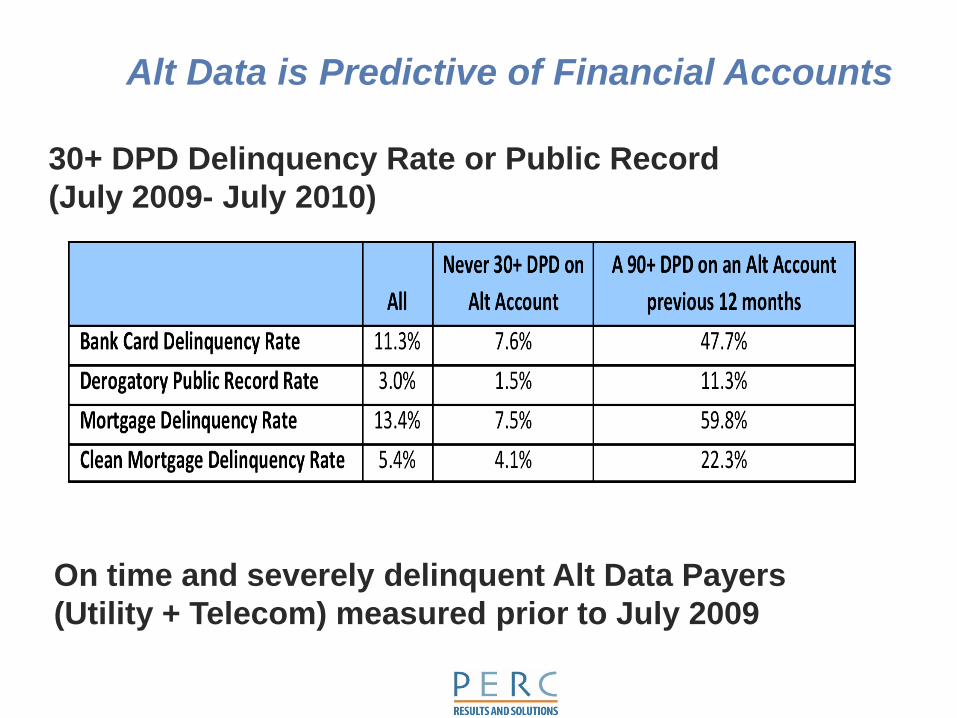
Alt Data is Predictive of Financial Accounts
30+ DPD Delinquency Rate or Public Record (July 2009- July 2010)
On time and severely delinquent Alt Data Payers (Utility + Telecom) measured prior to July 2009
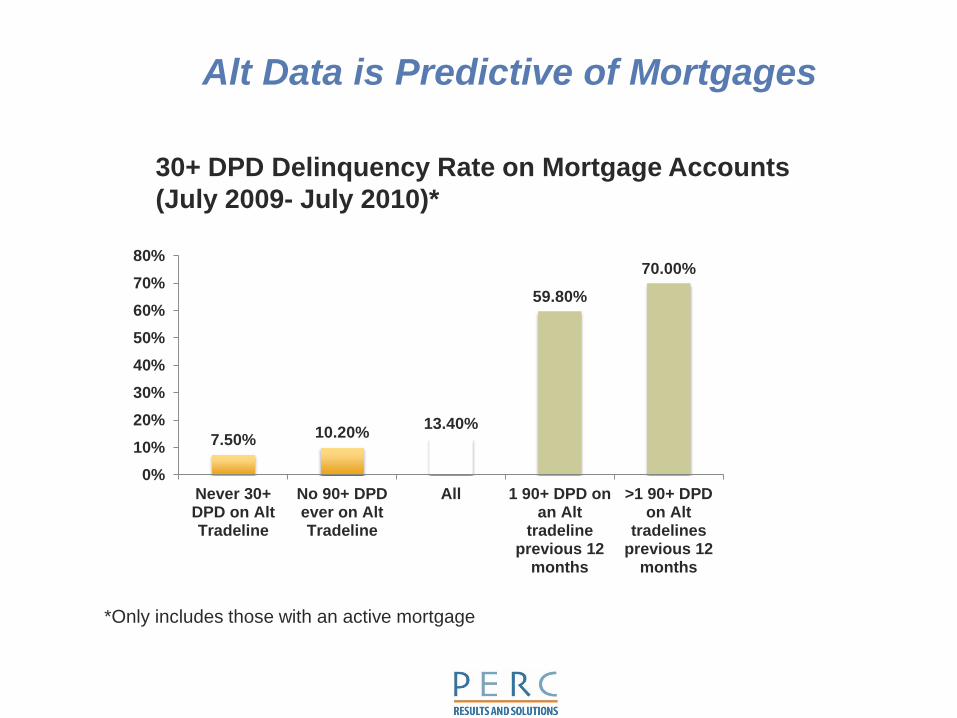
7.50% 10.20% 13.40%
59.80%
70.00%
0%10%20%30%40%50%60%70%80%
Never 30+DPD on AltTradeline
No 90+ DPDever on AltTradeline
All 1 90+ DPD onan Alt
tradelineprevious 12
months
>1 90+ DPDon Alt
tradelinesprevious 12
months
30+ DPD Delinquency Rate on Mortgage Accounts (July 2009- July 2010)*
Alt Data is Predictive of Mortgages
*Only includes those with an active mortgage
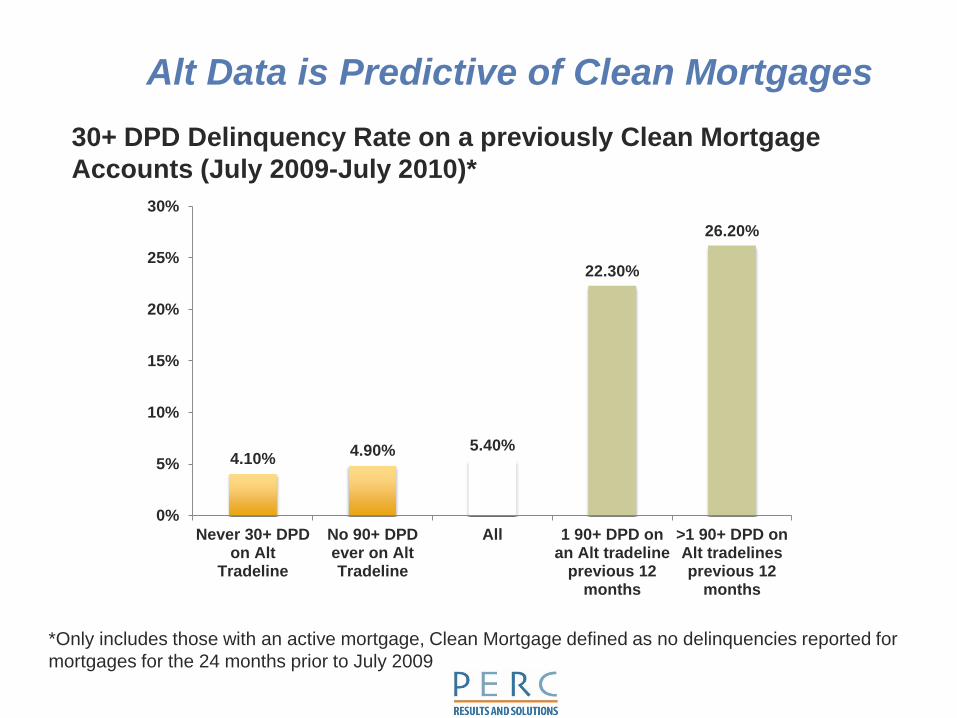
4.10% 4.90% 5.40%
22.30%
26.20%
0%
5%
10%
15%
20%
25%
30%
Never 30+ DPDon Alt
Tradeline
No 90+ DPDever on AltTradeline
All 1 90+ DPD onan Alt tradeline
previous 12months
>1 90+ DPD onAlt tradelinesprevious 12
months
30+ DPD Delinquency Rate on a previously Clean Mortgage Accounts (July 2009-July 2010)*
Alt Data is Predictive of Clean Mortgages
*Only includes those with an active mortgage, Clean Mortgage defined as no delinquencies reported for mortgages for the 24 months prior to July 2009
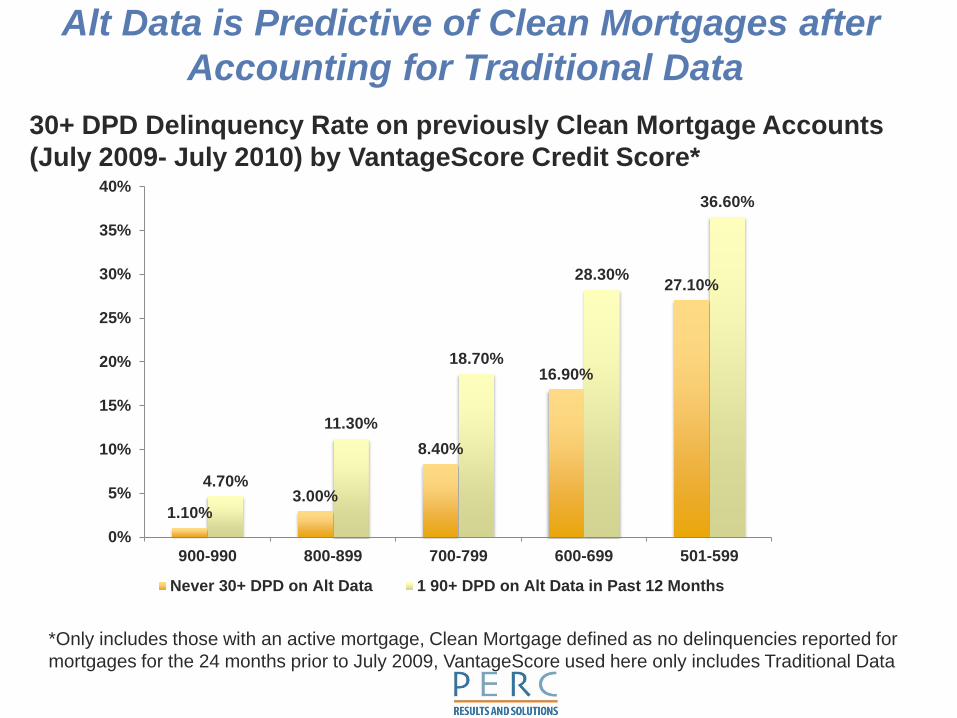
1.10% 3.00%
8.40%
16.90%
27.10%
4.70%
11.30%
18.70%
28.30%
36.60%
0%
5%
10%
15%
20%
25%
30%
35%
40%
900-990 800-899 700-799 600-699 501-599
Never 30+ DPD on Alt Data 1 90+ DPD on Alt Data in Past 12 Months
30+ DPD Delinquency Rate on previously Clean Mortgage Accounts (July 2009- July 2010) by VantageScore Credit Score*
*Only includes those with an active mortgage, Clean Mortgage defined as no delinquencies reported for mortgages for the 24 months prior to July 2009, VantageScore used here only includes Traditional Data
Alt Data is Predictive of Clean Mortgages after Accounting for Traditional Data
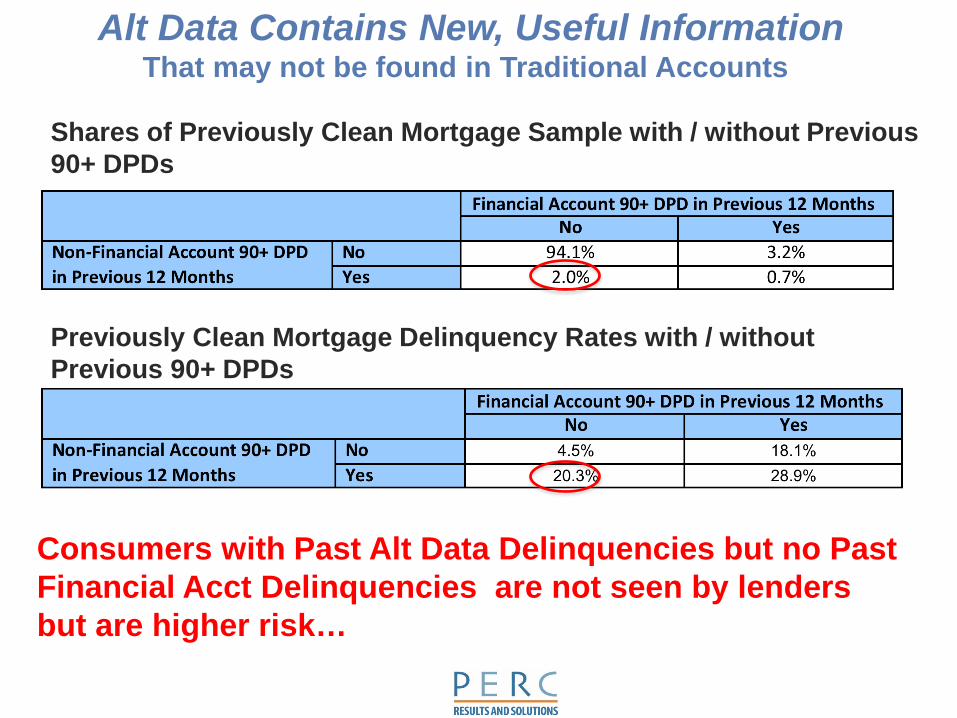
Shares of Previously Clean Mortgage Sample with / without Previous 90+ DPDs
Previously Clean Mortgage Delinquency Rates with / without Previous 90+ DPDs
Alt Data Contains New, Useful Information That may not be found in Traditional Accounts
Consumers with Past Alt Data Delinquencies but no Past Financial Acct Delinquencies are not seen by lenders but are higher risk…

43
‘Consumer Friendly’ Reporting For instance: • Use restriction (not for employment screening or insurance underwriting) • Exclude all negatives less than 90 days • Report assistance as “paid as agreed” or exclude (e.g. LIHEAP) • Exclude unpaid balances on closed accounts (e.g. <$100)
44
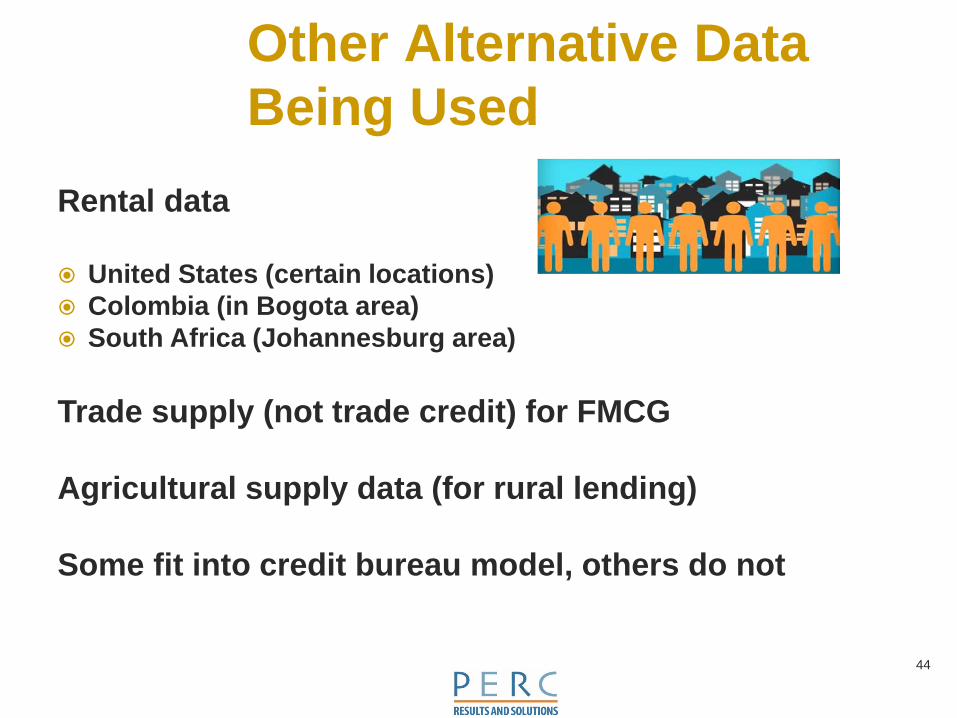
Other Alternative Data Being Used
Rental data United States (certain locations) Colombia (in Bogota area) South Africa (Johannesburg area) Trade supply (not trade credit) for FMCG Agricultural supply data (for rural lending) Some fit into credit bureau model, others do not
45
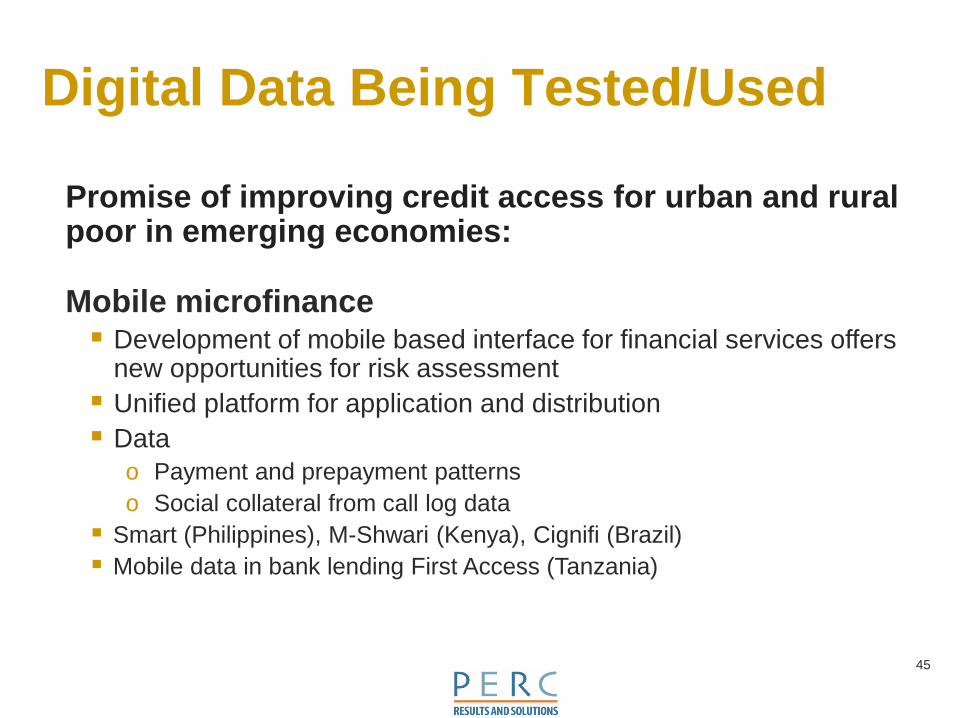
Digital Data Being Tested/Used
Promise of improving credit access for urban and rural poor in emerging economies:
Mobile microfinance Development of mobile based interface for financial services offers
new opportunities for risk assessment Unified platform for application and distribution Data
o Payment and prepayment patterns o Social collateral from call log data
Smart (Philippines), M-Shwari (Kenya), Cignifi (Brazil) Mobile data in bank lending First Access (Tanzania)

Hurdles to Reporting (US)
46
Technological barriers to reporting: Complex billing cycles (footprint dependent) Legacy IT systems
Regulatory barriers: Some states have statutory prohibitions Regulatory uncertainty Jurisdictional issues—FCC, state PUCs/PSCs, CFPB
Economic barriers: Compliance costs—FCRA data furnisher obligations Customer service costs from lenders scaring
customers substantial Incentives, what do you get for sharing data?
47
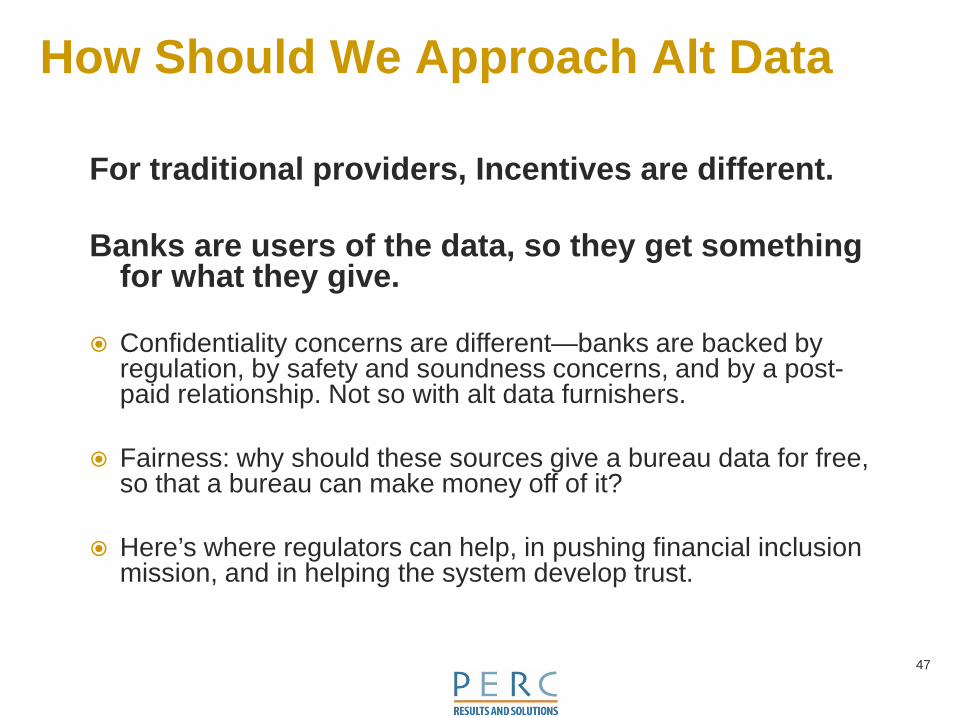
How Should We Approach Alt Data
For traditional providers, Incentives are different. Banks are users of the data, so they get something
for what they give.
Confidentiality concerns are different—banks are backed by regulation, by safety and soundness concerns, and by a post-paid relationship. Not so with alt data furnishers.
Fairness: why should these sources give a bureau data for free, so that a bureau can make money off of it?
Here’s where regulators can help, in pushing financial inclusion mission, and in helping the system develop trust.
48
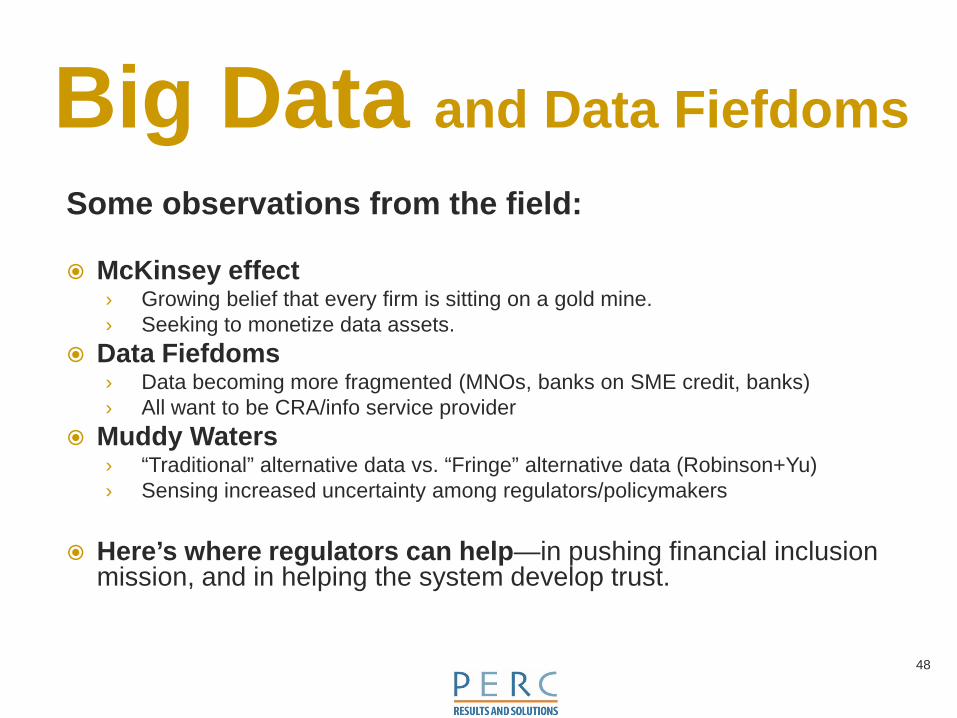
Big Data and Data Fiefdoms Some observations from the field:
McKinsey effect
› Growing belief that every firm is sitting on a gold mine. › Seeking to monetize data assets.
Data Fiefdoms › Data becoming more fragmented (MNOs, banks on SME credit, banks) › All want to be CRA/info service provider
Muddy Waters › “Traditional” alternative data vs. “Fringe” alternative data (Robinson+Yu) › Sensing increased uncertainty among regulators/policymakers
Here’s where regulators can help—in pushing financial inclusion
mission, and in helping the system develop trust.

302 East Pettigrew Street Suite 130 Durham, NC 27701 www.perc.net (919) 338-2798 x803
Credit Scoring: Going Beyond the Usual Housing Finance Policy Center Lunchtime Data Talk
Ken Brevoort Section Chief, Credit Information & Policy Office of Research Consumer Financial Protection Bureau March 12, 2015
The opinions in this presentation are those of the author and do not necessarily reflect the views of the Consumer Financial Protection Bureau or the United States.
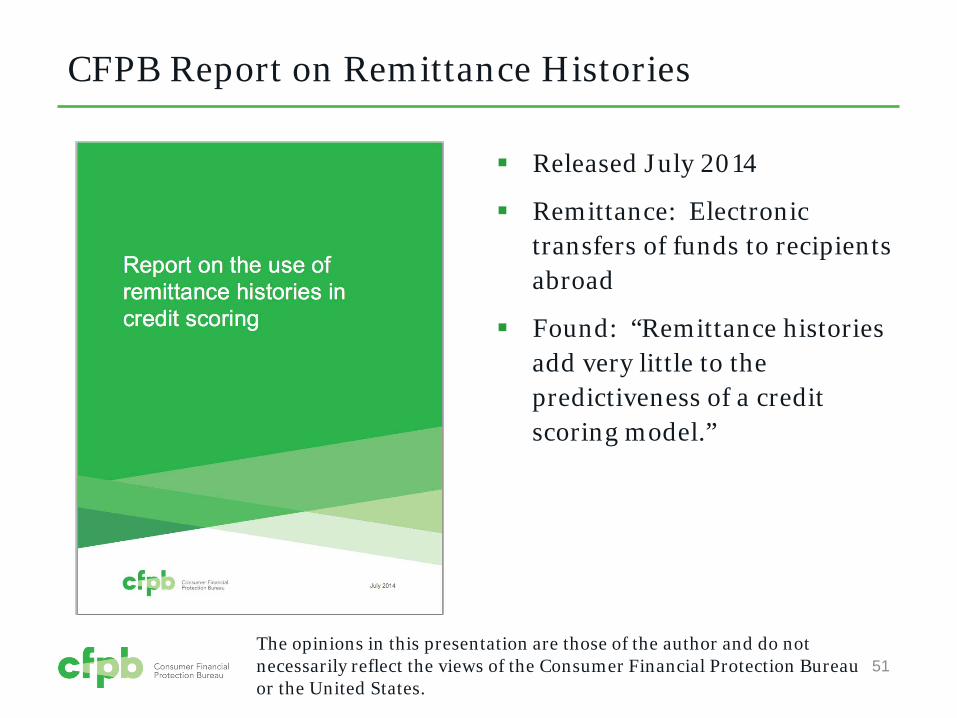
Released July 2014
Remittance: Electronic transfers of funds to recipients abroad
Found: “Remittance histories add very little to the predictiveness of a credit scoring model.”
CFPB Report on Remittance Histories
51 The opinions in this presentation are those of the author and do not necessarily reflect the views of the Consumer Financial Protection Bureau or the United States.
My Office
52 The opinions in this presentation are those of the author and do not necessarily reflect the views of the Consumer Financial Protection Bureau or the United States.
Why Are Some Records Unscorable?
Model builders are unable to predict which consumers will repay their loans
Reasons why:
A lack of information about the consumer
• Alternative data can help here, but
– How many thin files have this information? – Is alternative data really predictive?
Building a model requires both left- and right-hand-side variables, so we need observable performance
• Alternative data unlikely to help here
53 The opinions in this presentation are those of the author and do not necessarily reflect the views of the Consumer Financial Protection Bureau or the United States.
Why is this Important? An Example
Utility payment information for random sample of 1 million consumers with unscorable records
Credit Record data from end of 2012 and end of 2014
Credit Characteristics from 2012
Credit Performance in 2013 and 2014 from 2014 data
Thin files are less likely to have performance that is observable in the data
If only 10 percent have observable performance, the model
• Will be estimated using only 100,000 observations
• May prove unreliable when extrapolated to the other 90 percent of consumers with unscorable records
54 The opinions in this presentation are those of the author and do not necessarily reflect the views of the Consumer Financial Protection Bureau or the United States.
Conclusions
Sarah Davies and Michael Turner are doing important and interesting work!
There are a lot of reasons to be enthusiastic about alternative data’s potential
But until the predictive power of these data are reliably demonstrated, we should be cautious in advocating the use of such data
55 The opinions in this presentation are those of the author and do not necessarily reflect the views of the Consumer Financial Protection Bureau or the United States.