Embed Size (px)
Citation preview
Housing Foreclosures: Theory Works, so Does Policy
Allen C. Goodman
Brent C Smith
October 2009
The opinions presented in this research are those of the authors and do not represent those of the Federal Reserve Bank or any of its representatives / employees
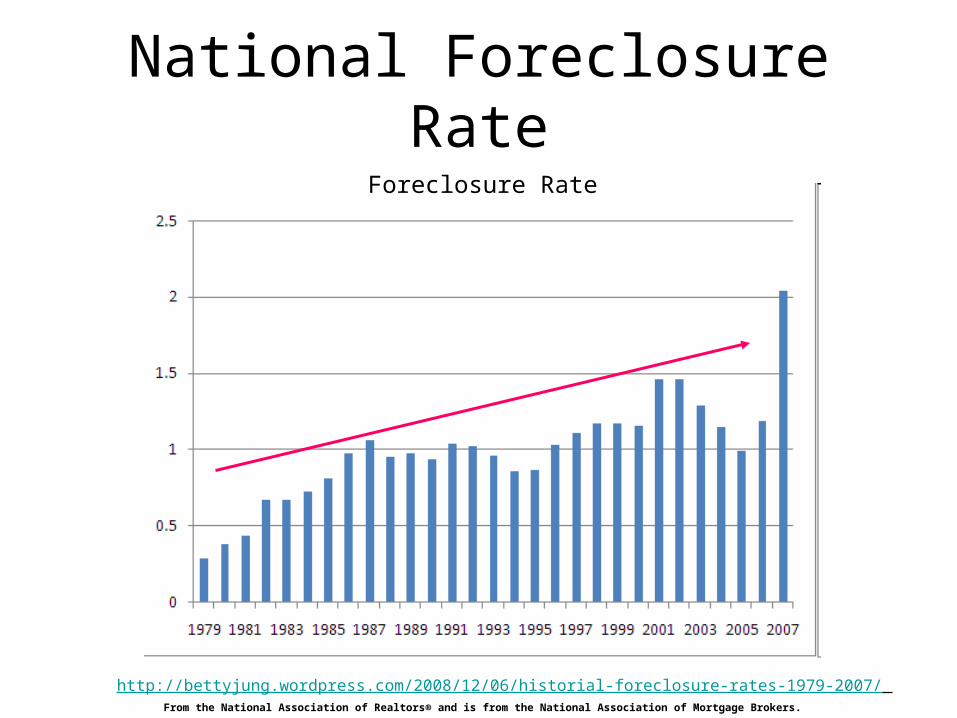
National Foreclosure Rate
http://bettyjung.wordpress.com/2008/12/06/historial-foreclosure-rates-1979-2007/
Foreclosure Rate
From the National Association of Realtors® and is from the National Association of Mortgage Brokers.
Explore 2 policy directives
Time & cost of exercising foreclosure process
Product restrictions e.g. predatory lending
Inform policy
Timely given the current state of the United States residential real estate market
Enhances the debate on the merits and demerits of credit rationing
Provide a new approach to modeling the mortgage performance
Potentially useful to policy makers concerned with the near term prospects for additional foreclosures
Contributes to a well developed literature on mortgage default and the subprime market
Objectives

3
Public policy that imposes costs on financial institutions
in the process of exercising the default through to sale or
REO may influence the rate at which mortgage loans
default
There is inconsistent evidence that this same policy has
similar influences on the rate at which a defaulted
property ends in REO
Predatory lending policies also appear to encourage
underwriting restraint which is expressed in lower default
rates with somewhat more consistency
State Level Foreclosure and Predatory Lending Legislation
State level foreclosure laws impose varying constraints and costs on both borrowers and lenders and the view of Crews-Cutts and Merrill (2008) is that the probability of successful reinstatement of defaulted loans can be altered through state statutory timelines
Deficiency judgments The lender receives house plus any deficiency judgment collections, and in exchange the borrower receives the benefit of eliminating negative equity less any deficiency judgment (Ambrose and Buttimer, 2000)
Judicial foreclosure proceedings Restrict the rights of lenders or trustees in their disposition of the property resulting in a foreclosure process that takes, on average, five months longer than the nonjudicial alternative and imposes more transaction costs (Edminston and Zalneraitis, 2007; Pence, 2006; Wood, 1997; Kahn & Yavas, 1994)
Statutory redemption Refers to the period of time after a foreclosure sale during which the borrower has the right to redeem the property by paying the principal balance, accrued interest, any penalties or fees, and court costs (Clauretie and Herzog, 1990)
Varying Foreclosure Costs
Federal Home Ownership and Equal Protection Act of 1994 (HOEPA)
Loans which the APR exceeds the yield on a Treasury Security,
having a comparable maturity, by 8 percentage points.
State laws vary with North Carolina adopting the first mini-HOEPA in 1999 (An and Bostic, 2008)
North Carolina served as a laboratory and treatment case for numerous studies with the vast majority testing the merits and demerits
Supporters argue in favor of exposing lenders for consumer security and forcing financial institutions to absorb the externalities created from predatory lending (Renuart, 2004; Bostic, et al, 2007; Elliehausen & Staten,
2004; Lee & Ernst, 2006)
Critics charge that predatory statutes reduce the availability of credit through credit rationing and increased borrower costs (Ho & Pennington-
Cross, 2006; Ernst, Farris, Stein, 2002; Harvey & Nigro, 2004)
Predatory Lending
Decision to Foreclose• The ultimate decision to foreclose rests with the borrower. • We posit that legislative costs imposed on financial institutions
create an incentive for credit rationing by lenders. Underwriting is the lender’s instrument in risk reduction. State policies that impose costs to financial institutions for high cost lending and foreclosure processing are designed to motivate restraint on lenders.
• By instituting higher underwriting standards, financial institutions reduce potential costs to the overall loan portfolio. This would suggest that restrictive lending policies simply result in lenders imposing greater restraint in granting loans via the underwriting mechanism – a form of credit rationing.
• Lenders will attempt to mitigate the higher cost of default in states that impose foreclosure by, – 1) increasing borrowing costs and – 2) instituting differential underwriting standards with more rigid
benchmarks applied to borrowers in high cost states. • We expect to observe this in a lower rate of default for those
high cost states.
Consider two states
• State A – Low lender cost for default• State B – High lender cost for default• Borrowers apply for loans with a single financial
institution that services both states. The states with lower cost of default motivate the lender to institute more liberal underwriting practices than for loans in the high cost state. Given the borrower’s inability to self-select, borrowers from the two states will face different requirements.
Hypotheses
• The legal prescript regulating the time before lenders can execute foreclosures influences the rate of foreclosures across the market.
• The more options and lower costs for borrowers to default, the greater the cost to lenders, and the increased incentive on lenders to tighten underwriting standards influence the rate of foreclosures across the market.

Determinants of Foreclosures
• Borrower characteristics– High FICO– Lower Income
• Loan characteristics– High Interest– ARM or Interest-Only Mortgages– Loan-Value Ratio
• Contextual variables– Housing market characteristics– State laws
Loan performance data
• The database is comprised of individual loan performance data aggregated up to the zip code.
• We assume that each observation has a set of unknown factors that contribute to an individual’s mortgage selection and includes characteristics of the mortgages that make up the subsamples for each zip code.

Hierarchically arranged
• For example, New York City and Buffalo are subject to the same state regulations, but that are almost 400 miles apart, and they are subject to different MSA-level housing market conditions.
• Similarly, Kansas City, Missouri and Kansas City, Kansas share a common border, but lie in different states. Both MSA and state level variables matter.

Hierarchical Linear Modeling
• While metropolitan or state level indicators can be included in an ad hoc manner, depending on the problem, we borrow an analytical framework from the education, evaluation, and health care literatures.
• School researchers have long recognized that students learn within groups, within classrooms, within grades, within schools, and within school districts.
• The achievement of students within a particular classroom may be related to the specific teacher, which may be related to attitudes or supervision at the particular school.
• Bryk and Raudenbush (1992) provide detailed explanation of the method, and Goodman and Thibodeau (1998) apply it to housing markets and submarkets.
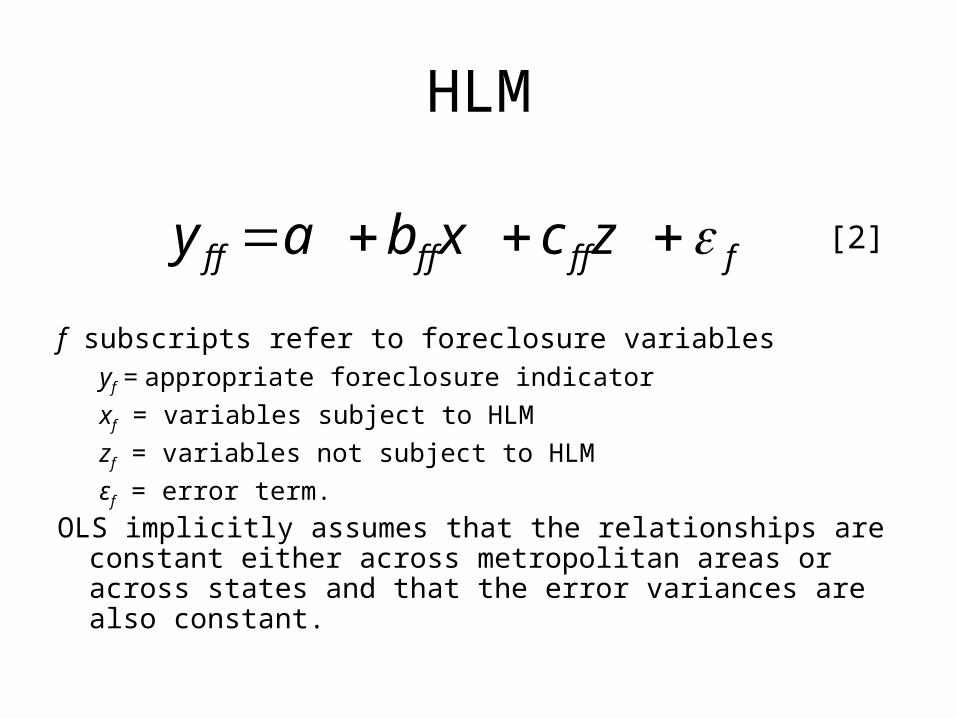
HLM
f subscripts refer to foreclosure variablesyf = appropriate foreclosure indicator
xf = variables subject to HLM
zf = variables not subject to HLM
εf = error term.
OLS implicitly assumes that the relationships are constant either across metropolitan areas or across states and that the error variances are also constant.
f f f f f f fy a b x c z [2]
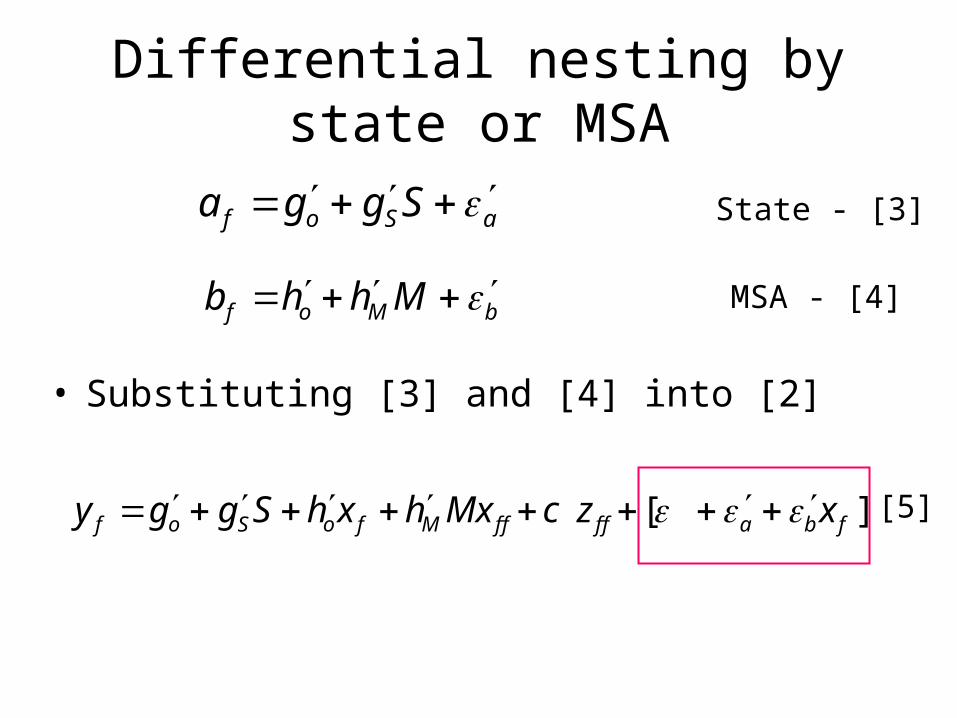
Differential nesting by state or MSA
• Substituting [3] and [4] into [2]
f o S aa g g S
f o M bb h h M MSA - [4]
State - [3]
[ ]f o S o f M f f f f a b fy g g S h x h Mx c z x [5]
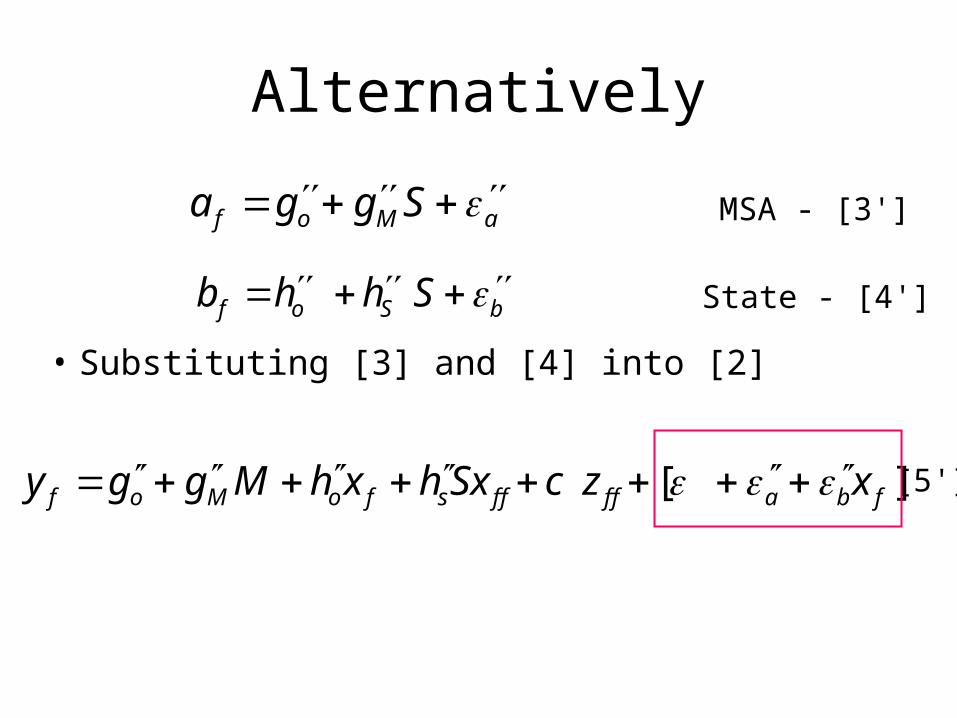
Alternatively
• Substituting [3] and [4] into [2]
f o M aa g g S
State - [4']
MSA - [3']
f o S bb h h S
[ ]f o M o f s f f f f a b fy g g M h x h Sx c z x [5']
10
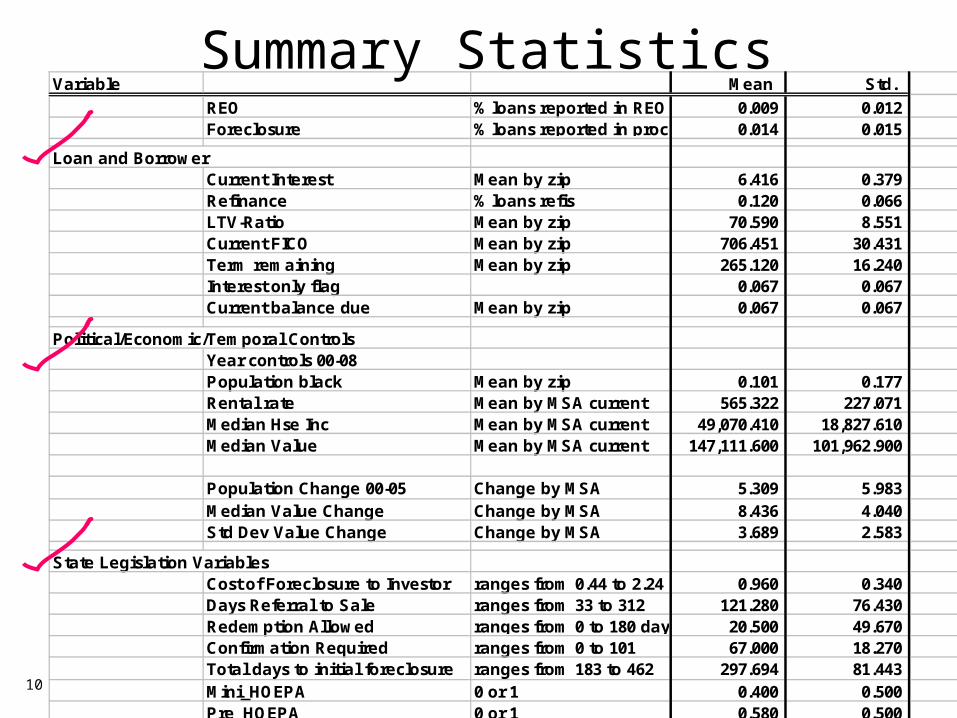
Variable Mean Std.
REO % loans reported in REO 0.009 0.012 Foreclosure % loans reported in process 0.014 0.015
Loan and BorrowerCurrent Interest Mean by zip 6.416 0.379 Refinance % loans refis 0.120 0.066 LTV-Ratio Mean by zip 70.590 8.551 Current FICO Mean by zip 706.451 30.431 Term remaining Mean by zip 265.120 16.240 Interest only flag 0.067 0.067 Current balance due Mean by zip 0.067 0.067
Political/Economic/Temporal ControlsYear controls 00-08Population black Mean by zip 0.101 0.177 Rental rate Mean by MSA current 565.322 227.071 Median Hse Inc Mean by MSA current 49,070.410 18,827.610 Median Value Mean by MSA current 147,111.600 101,962.900 GDP test Change by statePopulation Change 00-05 Change by MSA 5.309 5.983 Median Value Change Change by MSA 8.436 4.040 Std Dev Value Change Change by MSA 3.689 2.583
State Legislation VariablesCost of Foreclosure to Investor ranges from 0.44 to 2.24 0.960 0.340 Days Referral to Sale ranges from 33 to 312 121.280 76.430 Redemption Allowed ranges from 0 to 180 days 20.500 49.670 Confirmation Required ranges from 0 to 101 67.000 18.270 Total days to initial foreclosure ranges from 183 to 462 297.694 81.443 Mini_HOEPA 0 or 1 0.400 0.500 Pre_HOEPA 0 or 1 0.580 0.500
Summary Statistics

Data (Table 1)• At the time the data were gathered, mean interest rate
charged by zip code ranged from 5.45% to 8.73% with a median of 6.42% (only moderately above national average for conventional loans)
• The average of borrowers’ FICO scores, aggregated by zip code, ranged from 565 to 783. Mean was 706.
• The average loan-to-value ratio by zip code ranged from 37 to 184 as a percent of the value. Mean was 70.6. Additionally, there are zip codes in the sample where the pct of loans classified as interest-only approaches 50%.
• Average rate of foreclosures by zip code is 1.4% although some zip codes have as much as 24% of the loans classified as in foreclosure.
• Average age of loans in this sample is short, just over two years, suggesting little seasoning in the data and thus a reasonably homogeneous dataset. Over 83% of the loans in this dataset were originated in 2003 or later.

Key Outcomes OLSOLS
Dependent Variables % foreclose % REO Both % foreclose % REO Both
Intercept -0.1213 * -0.1869 * -0.3082 * 0.0081 -0.2085 * -0.2004 *
Loan Characteristicszcur_int 0.0166 * 0.0212 * 0.0378 * 0.0009 0.0208 * 0.0218 *zprepay_penalty 0.0631 * 0.0472 * 0.1103 * 0.0922 * 0.0549 * 0.1471 *zltv_rati 0.0003 * 0.0002 * 0.0004 * 0.0001 * 0.0003 * 0.0004 *
Borrowerszfico_cur -0.00008112 * -0.00001481 -9.59E-05 * -9.074E-05 * -0.00002163 * -1.12E-04 *zip_black_pop 0.0021 * 0.0070 0.0090 * 0.0049 * 0.0071 * 0.0121 *
Economic Controlsvalrent -0.00000284 0.00000406 * 1.21E-06 4.574E-07 0.00000457 5.03E-06med_value 0.00000302 -0.00001064 * -7.62E-06 -1.21E-06 * -0.00000995 * -1.12E-05 *stdvalch -1.33E-03 * 1.61E-04 * -1.17E-03 * -4.18E-04 * -1.31E-04 * -5.50E-04 *
State Legislationcost to investor -0.00043 0.00381 * 0.00339 *days_ref_sale -0.00053 * 0.00007 * -0.00046 *redemption 0.00007 * -0.00002 * 0.00004 *confirmation 0.00019 * -0.00009 * 0.00009 *total_days -0.00008 * 0.00008 * 0.00000mini_HOEPA 0.00149 * 0.00126 * 0.00274 *pred_pre_HOEPA -0.00182 * -0.00011 -0.00193 *
R2 0.5701 0.6297 0.7296 0.7229 0.7081 0.7679
State & MSA Effects MSA Effects Only
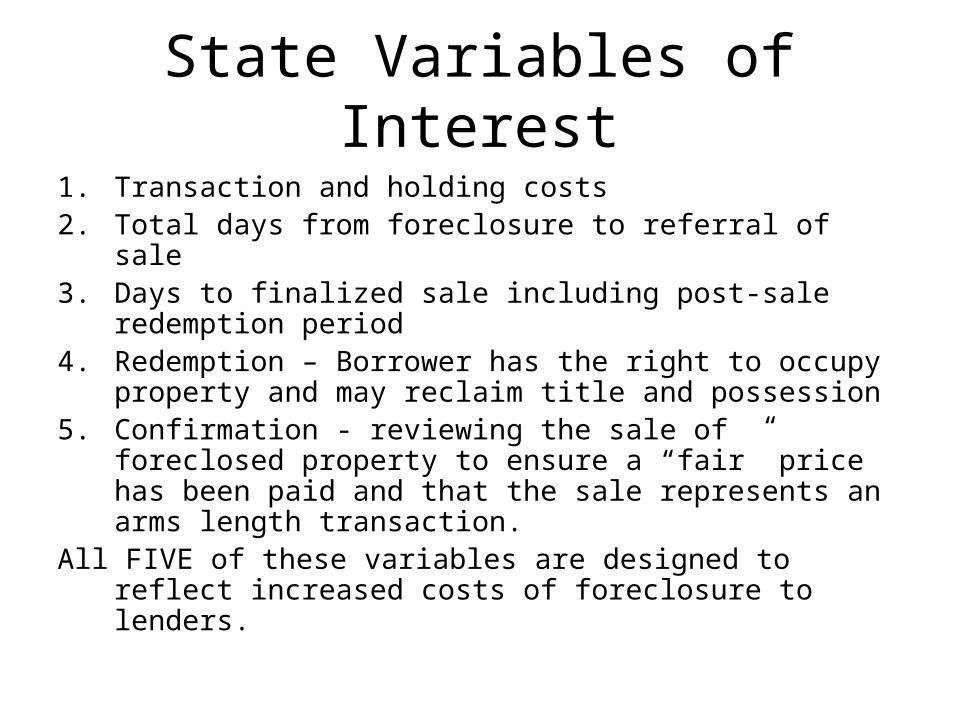
State Variables of Interest
1. Transaction and holding costs2. Total days from foreclosure to referral of sale3. Days to finalized sale including post-sale redemption
period4. Redemption – Borrower has the right to occupy
property and may reclaim title and possession5. Confirmation - reviewing the sale of foreclosed
property to ensure a “fair” price has been paid and that the sale represents an arms length transaction.
All FIVE of these variables are designed to reflect increased costs of foreclosure to lenders.
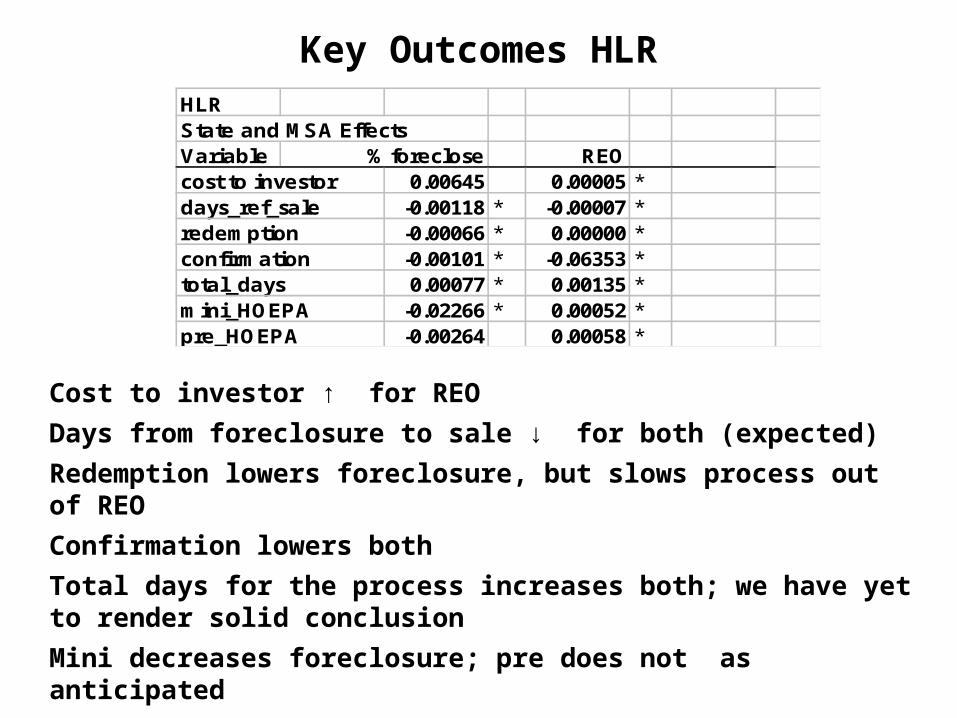
Key Outcomes HLRHLRState and MSA Effects Variable % foreclose REO Bothcost to investor 0.00645 0.00005 * -0.09110 *days_ref_sale -0.00118 * -0.00007 * 0.00003redemption -0.00066 * 0.00000 * -0.00004confirmation -0.00101 * -0.06353 * -0.00114 *total_days 0.00077 * 0.00135 * -0.00044 *mini_HOEPA -0.02266 * 0.00052 * -0.03139 *pre_HOEPA -0.00264 0.00058 * -0.03571 *
Cost to investor ↑ for REO
Days from foreclosure to sale ↓ for both (expected)
Redemption lowers foreclosure, but slows process out of REO
Confirmation lowers both
Total days for the process increases both; we have yet to render solid conclusion
Mini decreases foreclosure; pre does not as anticipated
Both increase REO, suggesting fewer restrictions once foreclosure begins

Elasticities – OLS, HLM
Elasticities Foreclose REO BOTH
OLS
Current rate 7.3545 14.9706 10.2816
FICO -4.1189 -1.2037 -2.9980
HLM
Current rate 9.1030 12.1317 10.2888
FICO -3.0466 -0.7095 -2.1876
BIG! … by most standards
BIG! … by most standards
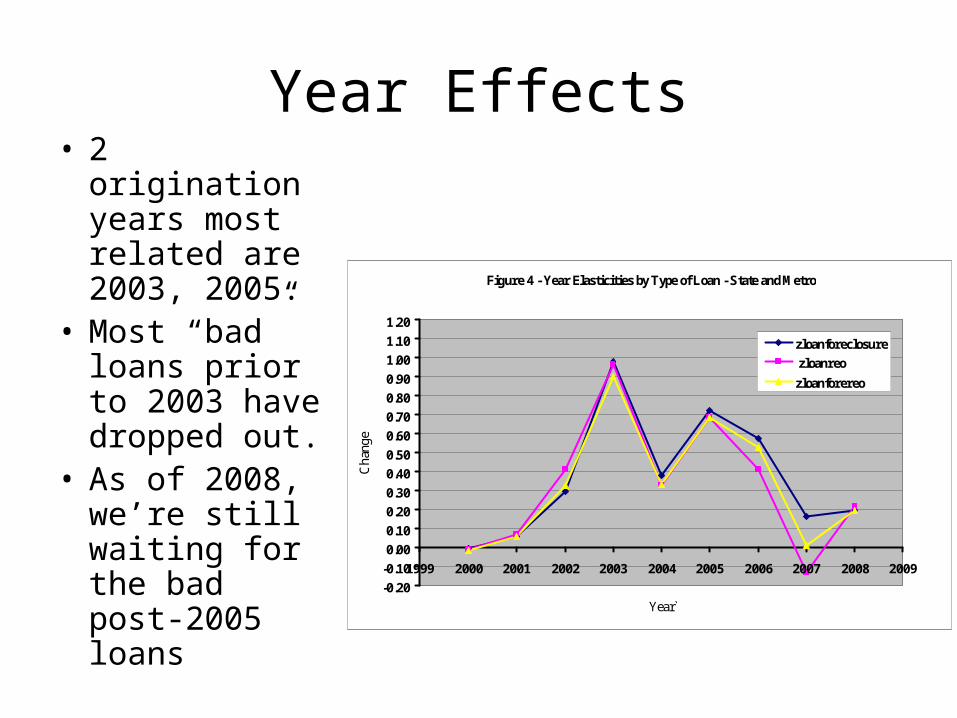
Year Effects• 2 origination
years most related are 2003, 2005.
• Most “bad” loans prior to 2003 have dropped out.
• As of 2008, we’re still waiting for the bad post-2005 loans
Figure 4 - Year Elasticities by Type of Loan - State and Metro
-0.20
-0.10
0.00
0.10
0.20
0.30
0.40
0.50
0.60
0.70
0.80
0.90
1.00
1.10
1.20
1999 2000 2001 2002 2003 2004 2005 2006 2007 2008 2009
Year`
Cha
nge
zloanforeclosure
zloanreo
zloanforereo
Conclusions – 1
• Local factors matter
• Higher interest rates more foreclosures
• Higher FICO fewer foreclosures
Conclusions
Those states imposing higher temporal and financial costs on lenders exhibit lower default levels when controlling for loan and local conditions.
State level legislative influences provide a foundation for discussion of national level policy that further regulates predatory lending and financial institution foreclosure activities.