Embed Size (px)
Citation preview
STATE OFHOUSING IN INDIA
A STATISTICAL COMPENDIUM
2013
STATE OFHOUSING IN INDIA
A STATISTICAL COMPENDIUM
2013
STATE OFHOUSING IN INDIA
A STATISTICAL COMPENDIUM
2013
Government of IndiaMinistry of Housing and Urban Poverty Alleviation
National Buildings Organisation
lR;eso t;rslR;eso t;rs
STAT
E O
F HO
USIN
G IN
IND
IA A
STAT
ISTIC
AL
CO
MPE
ND
IUM
2013
lR;eso t;rslR;eso t;rs
Director (NBO) & OSD (JNNURM & RAY)Ministry of Housing & Urban Poverty Alleviation
Room No. – 210, G-Wing, NBO Building,Nirman Bhawan, New Delhi – 110108
Tel:- +91-11-23061692, Fax : +-91-11-23061542E-mail:- [email protected]
lR;eso t;rs

Hkkjr esa vkoklksa dh fLFkfr
1
STATE OF HOUSING IN INDIAA STATISTICAL COMPENDIUM
2013
Government of IndiaMinistry of Housing and Urban Poverty Alleviation
National Buildings Organisation


i
LIST OF TABLES
1 Total Number of Census Houses: Rural & Urban-2011.
2 Total Number of Households: Rural & Urban -2011.
3 Distribution of Occupied Census Houses -2011.
4 Distribution of Census Houses by Predominant Material of Roof -2011.
5 Distribution of Census Houses by Predominant Material of Wall -2011.
6 Distribution of Census Houses by Predominant Material of Floor-2011.
7Distribution of Occupied Houses used as Residence and Residence- cum -Other Uses by their Habitable Condition -2011.
8 Distribution of Households Living in Census Houses by Predominant Material of Roof -2011.
9 Distribution of Households Living in Census Houses by Predominant Material of Wall -2011.
10 Distribution of Households Living in Census Houses by Predominant Material of Floor -2011.
11 Distribution of Households by Their Habitable Condition of Census Houses Occupied -2011.
12 Distribution of Households Having Number of Dwelling Rooms -2011.
13 Distribution of Households by Ownership Status of the Census Houses Occupied by them -2011.
14 Distribution of Households by Number of Married Couples in a Household- 2011.
15 Distribution of Households by Source of Drinking Water -2011.
16 Distribution of Households by Location of Drinking Water Source -2011.
17 Distribution of Households by Availability of Kitchen Facility -2011.
18 Distribution of Households by Type of Bathing Facility Within the House -2011.
19Distribution of Households by Type of Drainage connectivity for Waste Water Outlet Facility Within the House -2011.
20 Distribution of Households by Type of Latrine Facility Within the House -2011.
21 Distribution of Households by Source of Lighting Facility-2011.
22 Distribution of Households by Availability of Type of Fuel Used for Cooking- 2011.
23 Distribution of Households by Availing of Banking Services Facility- 2011.
ii
24
25 Distribution of Houseless Population in India – 2001.
26 Distribution of Estimated Urban Housing Shortage in India – 2012-17.
27 Distribution of State-wise Urban Housing Shortage (2012-17)
28 Distribution of Urban Housing Shortage among different Socio-Economic Groups (2012-17)
29Distribution (in Percentage) of Households by Major Source (Most Used) of Drinking Water during Last 365 Days as per 49th, 58th and 65th NSSO Rounds.
30Distribution (in Percentage) of Households by Distance from Source of Drinking Water as per 49th
, 58th and 65th NSSO Rounds.
31Distribution (in Percentage) of Households by Type of Bathroom Facility in 49th, 58th and 65th
NSSO Rounds.
32Distribution (in Percentage) of Households by Type of Latrine Used as per 49th, 58th, and 65th
NSSO Rounds.
33Distribution (in Percentage) of Households by Type of Use of Latrine Facility as per 49th, 58th, and 65th NSSO Rounds.
34Proportion (in Percentage) of Households with Electricity for Domestic Use as per 49th, 58th, and 65th NSSO Rounds.
35Proportion (in Percentage) of Households with Drinking Water Within Premises, Electricity for Domestic Use and Latrine During 49th, 58th and 65th NSSO Rounds.
36Distribution (in Percentage) of Households with Different Types of Tenurial Status of the Dwelling Unit During 49th, 58th and 65th NSSO Rounds.
37Distribution (in percentage) of Households by Type of Structure of House as per 49th, 58th, and 65th
NSSO Rounds.
38Distribution (in Percentage) of Households Living in Houses by Type of Use of House: as per 49th,58th, and 65th NSSO Rounds.
39Distribution (in Percentage) of Households Living in Houses by Condition of Structure: NSSO 65th
Round.
40Proportion of Households (in Percentage) who undertook Construction during Last 365 Days, Average Number of Constructions undertaken Per Reporting Households during Last 365 Days and Average Cost Per Construction in NSS 65th Round.
41Distribution (in Percentage) of Average Cost of Construction during the Last 365 Days for Different Items in 65th Round.
42 Distribution (Per 1000) of Households across Social Groups during 2008-09: NSSO 65th Round.
43Distribution (in Percentage) of Households by Major Source (Most Used) of Drinking Water During Last 365 Days in 65th Round.
iii
44Distribution (in Percentage) of Households by Availability of Types of Bathroom for Each Social Group: NSSO 65th Round.
45Distribution (in Percentage) of Households by Availability of Latrine Facility for Different Social Groups: NSSO 65th Round.
46Proportion (in Percentage) of Households by Social Groups Who had Electricity for Domestic Use: NSSO 65th Round.
47
48 Slum Population in Million Plus Cities in India-2001
49 India’s Estimated Slum Population for all 5161 towns in 2001.
50 State wise estimated slum population for all 5161 towns 2001
51 India’s projected slum population during Year 2011-2017.
52 Statewise projected slum population during 2011-2017
53 Urban Sector: Major Thrust Areas and Programmes in Five Year Plans.
54 Cumulative Physical and Financial Progress under JNNURM (BSUP & IHSDP) (Rs in Crores)
55 Swarna Jayanti Shahari Rozgar Yojana: Physical and Financial Progress (Rs in Crores)
iv
LIST OF FIGURES
1 Total Number of Census House - Census-2011.
2 Total Number of Households: Rural & Urban -2011.
3 Total Number of Occupied Census Houses -2011.
4 Census Houses by Predominant Material of Roof -2011.
5 Census Houses by Predominant Material of Wall-2011.
6 Census Houses by Predominant Material of Floor-2011.
7 Occupied Census Houses by Their habitable Condition-2011.
8 Households Living in Census Houses by Predominant Material of Roof -2011.
9 Households Living in Census Houses by Predominant Material of Wall -2011.
10 Households Living in Census Houses by Predominant Material of Floor -2011.
11 Households by Their Habitable Condition of Census Houses Occupied -2011.
12 Households Having Number of Dwelling Rooms -2011.
13 Households by Ownership Status of the Census Houses Occupied by Them -2011.
14 Households by Number of Married Couples in Households -2011.
15 Households by Source of Drinking Water -2011.
16 Households by Location of Drinking Water Source -2011.
17 Households by Availability of Kitchen Facility-2011.
18 Households by Type of Bathing Facility Within the House -2011.
19 Households by Type of Drainage connectivity for Waste Water Outlet Facility Within the House -2011.
20 Households by Type of Latrine Facility Within the House -2011.
21 Households by Source of Lighting Facility -2011.
22 Households by Availability of Type of Fuel Used for Cooking - 2011
23 Distribution of Households by Availing of Banking Services Facility- 2011.
24
25 Houseless Population in India – 2001.
26 Estimated Urban Housing Shortage in India – 2012-17.
27 State-wise Urban Housing Shortage (2012-17)
28 Urban Housing Shortage among different Socio- Economic Groups in India- 2012-17.
v
29 Percentage Distribution of Households by Different Sources of Drinking Water in NSSO 65th
Round for Rural +Urban.
30 Percentage Distribution of Households by Distance From Source of Drinking Water as per 49th,58th and 65th NSSO Rounds.
31 Distribution (in percentage) of Households by Type of Bathroom Facility in 49th, 58th and 65th
NSSO Rounds.
32 Distribution (in Percentage) of Households by Type of Latrine for Rural + Urban during 49th, 58th
and 65th NSSO Rounds.
33 Distribution (in Percentage) of Households by Type of Use of Latrine Facility in 49th, 58th and 65th NSSO Rounds.
34 Proportion (in Percentage) of Households with Electricity for Domestic Use during 49th, 58th and 65th Rounds.
35 Proportion (in Percentage) of Households with Drinking Water Within Premises, Electricity for Domestic Use and Latrine (All- India Level) during 49th, 58th and 65th Rounds.
36 Distribution (in Percentage) of Households by Type of Structure of House in NSSO 65th Round.
37 Distribution (in Percentage) of Households Living in Houses by Type of Use of House in NSSO 65th Round.
38 Distribution (in Percentage) of Households Living in Houses by Condition of Structure: NSSO 65th Round.
39 Proportion of Households (in Percentage) in Rural, Urban and Rural +Urban Areas Who had undertaken Construction during Last 365 Days by Status of Construction in NSSO 65th Round.
40 Average Cost (Rs. 000) per Construction: NSSO 65th Round.
41 Distribution (in Percentage) of Average Cost of Construction During the Last 365 Days in Different Items in NSSO 65th Round.
42 Distribution (Per 1000) of Households and Percentage Across Social Groups During 2008-09: NSSO 65th Round.
43 Distribution (in Percentage) of Households by Availability of Types of Bathroom for Each Social Group: NSSO 65th Round.
44 Proportion (in Percentage) of Households by Social Groups Who had Electricity for Domestic Use: NSSO 65th Round.
45 Slum and Non Slum Population in India-2001.
46 Percentage of Slum and Non Slum Population in India-2001.
47 State wise Number of Slum Reporting Towns/Cities in India-2001.
48 State/UT wise Slum Population as per Census 2001.
49 Percentage Distribution of Slum Population in States/UT’s as per Census 2001.
50 Slum Population in Major Million Plus Cities per Census 2001.
51 India’s estimated slum population for all 5161 towns in 2001
52 India’s projected slum population during 2011-2017
53 State wise Projected slum population by 2017
vi
LIST OF BOXES
1 12th Plan: Objective for Urban Poverty Alleviation.
2 12th Plan: Objective for Slum Development.
vii
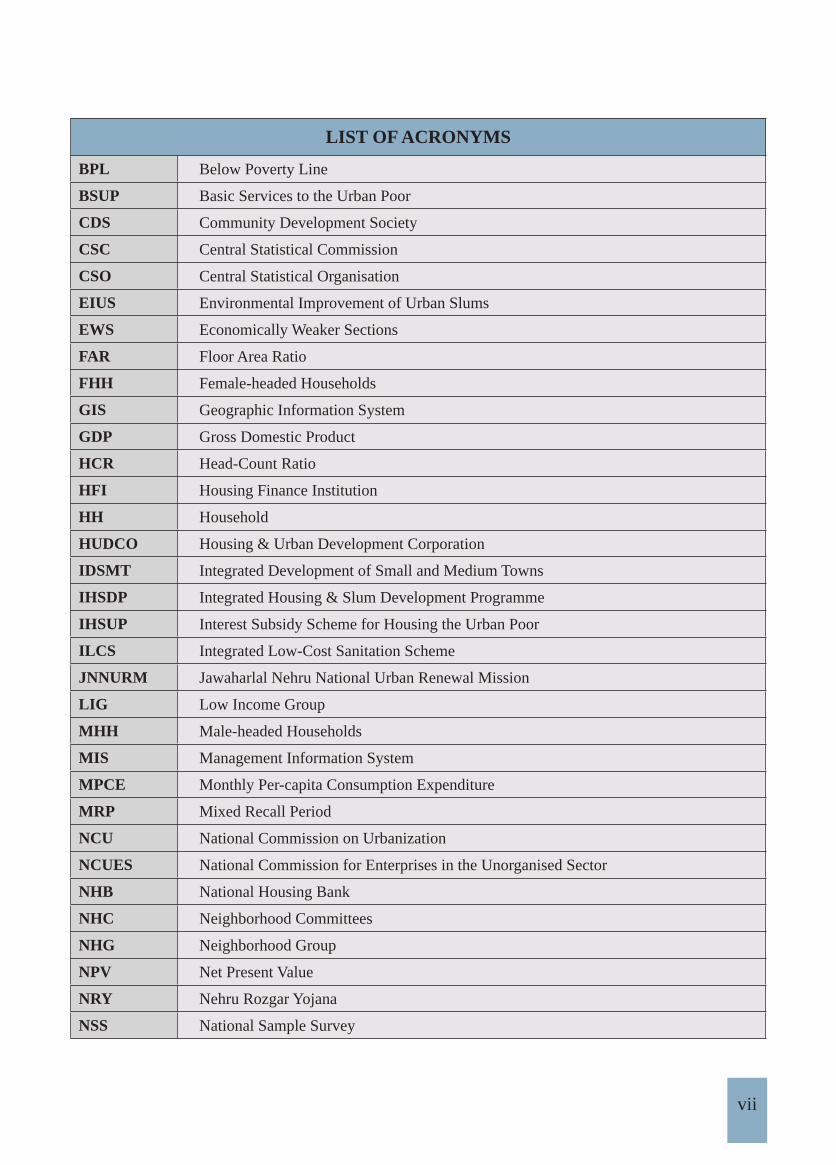
LIST OF ACRONYMS
BPL Below Poverty Line
BSUP Basic Services to the Urban Poor
CDS Community Development Society
CSC Central Statistical Commission
CSO Central Statistical Organisation
EIUS Environmental Improvement of Urban Slums
EWS Economically Weaker Sections
FAR Floor Area Ratio
FHH Female-headed Households
GIS Geographic Information System
GDP Gross Domestic Product
HCR Head-Count Ratio
HFI Housing Finance Institution
HH Household
HUDCO Housing & Urban Development Corporation
IDSMT Integrated Development of Small and Medium Towns
IHSDP Integrated Housing & Slum Development Programme
IHSUP Interest Subsidy Scheme for Housing the Urban Poor
ILCS Integrated Low-Cost Sanitation Scheme
JNNURM Jawaharlal Nehru National Urban Renewal Mission
LIG Low Income Group
MHH Male-headed Households
MIS Management Information System
MPCE Monthly Per-capita Consumption Expenditure
MRP Mixed Recall Period
NCU National Commission on Urbanization
NCUES National Commission for Enterprises in the Unorganised Sector
NHB National Housing Bank
NHC Neighborhood Committees
NHG Neighborhood Group
NPV Net Present Value
NRY Nehru Rozgar Yojana
NSS National Sample Survey
viii
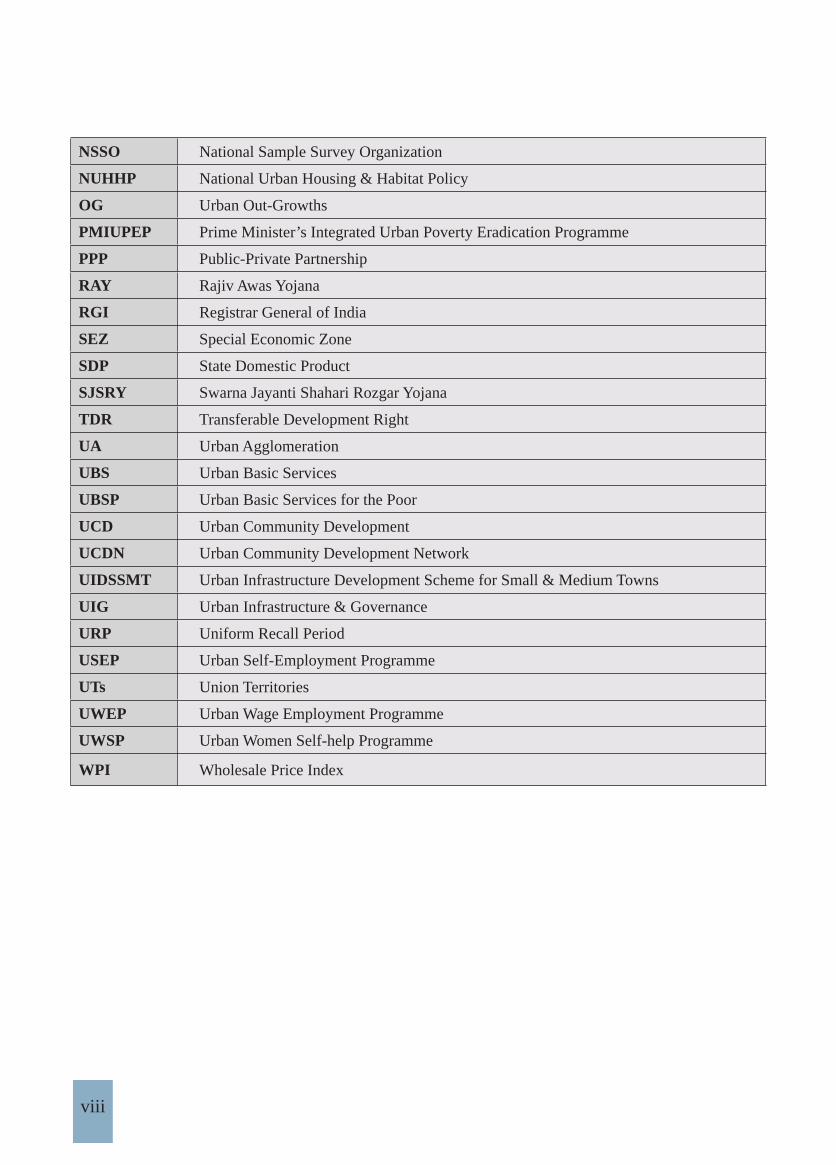
NSSO National Sample Survey Organization
NUHHP National Urban Housing & Habitat Policy
OG Urban Out-Growths
PMIUPEP Prime Minister’s Integrated Urban Poverty Eradication Programme
PPP Public-Private Partnership
RAY Rajiv Awas Yojana
RGI Registrar General of India
SEZ Special Economic Zone
SDP State Domestic Product
SJSRY Swarna Jayanti Shahari Rozgar Yojana
TDR Transferable Development Right
UA Urban Agglomeration
UBS Urban Basic Services
UBSP Urban Basic Services for the Poor
UCD Urban Community Development
UCDN Urban Community Development Network
UIDSSMT Urban Infrastructure Development Scheme for Small & Medium Towns
UIG Urban Infrastructure & Governance
URP Uniform Recall Period
USEP Urban Self-Employment Programme
UTs Union Territories
UWEP Urban Wage Employment Programme
UWSP Urban Women Self-help Programme
WPI Wholesale Price Index
State of Housing in India
1
1 Housing in India: Introduction and Approach
1. Introduction
1.1 The 2011 Census of India reveals that the urban population of the country stood at 377 million or 31.16 percent
of the total population. This is estimated to have increased to 437 million by 2021, which is about 36 percent of the total
population. It is projected that the urban population would grow to about 553 million in 2026. The level of urbanization
is expected to reach 50 percent mark in the next 3-4 decades. Urbanisation and economic growth are closely interlinked,
as more than 60 percent of Gross Domestic Product of the country is contributed by Urban India. As India moves ahead
to a double-digit growth, obviously a key policy issue has emerged as to how to rejuvenate and strengthen the Urban
1.2 Housing is regarded as an ‘engine of economic growth’ and can give a big push to the economy through
its strong ‘backward’ and ‘forward’ linkages with about 250 ancillary industries. As per an IIM Ahmedabad Study
(July 2000), housing investment has inter-industry linkages and investment in housing/construction sector has strong
on the construction sector would generate additional income in the economy as a whole, which would be almost 5
times as high as the direct income generated within the construction sector itself. Further, investment in housing has an
sector induces an overall employment generation in the economy by an extent that is eight times the direct employment
generated in the construction sector itself.
2. Approach to Housing & Initiatives
2.1 Recognising the importance of housing in the country as a basic human need, it has been one of the
incentives to promote housing on both, the demand and supply sides. Since independence, a large number of schemes
have been launched under different names, but the focus continues to be on housing for the poor. The core of all
the housing initiatives is to concentrate efforts on improvement of the housing conditions of industrial workers/
economically weaker sections and of low-income groups, through housing schemes, involving an element of subsidy
ranging between 20 percent to 50 percent. All the housing programmes have resulted in the positive growth in the total
housing stock, which has increased from 13.30 million units in 1961 to 78.48 million units in 2011.
2.2 According to the Report of the Technical Group (TG-12) on Estimation of Urban Housing Shortage, the total
urban housing shortage in the country in 2012 recorded a decline from (24.71) Million at the beginning of 11th
Plan as estimated by 11th Plan Technical Group to 18.78 million in the beginning of the 12th Plan as estimated by TG-12.
National Buildings Organisation
2
It is worth noting that 96 per cent of this shortage pertains to the economically weaker sections and the lower income
groups of the society. The urban housing shortage during the 12th Five Plan period (2012-2017) may even come lower
if the rate of growth in housing stock continues to be higher than the growth in number of Households in the 12th Five
Year Plan, as observed in the last decade. Assuming the business as usual scenario and also continuation of the strategic
intervention both at State & Central level, housing shortage may actually go down.
2.3 Government has always been sensitive to the needs of the urban poor and it has addressed the magnitude of
housing shortages by launching several programmes, mainly aimed at catering to the needs of poorer segments of
the society. Some of the recent programmes for housing the poor include: Two Million Housing Programme, Valmiki
Amedkar Awas Yojana (VAMBAY), Jawaharlal Nehru National Urban Renewal Mission (JNNURM), Interest Subsidy
for Housing the Urban Poor (ISHUP), Affordable Housing in Partnership (AHIP) Scheme, and interest subvention
and Habitat Policy (NUHHP)’ in 2007 with the challenging goal of ‘Affordable Housing for All’ and to advocate the
aims and areas of action with which to progress towards it. Innovative approaches advocated by the NUHHP-2007
include the reservation of 10-15 percent of land or 20-25 percent Floor Space Index (FSI)/Floor Area Ratio (FAR) under
private sector development for EWS and LIG housing, either by regulation in new developments in expansion areas of
Development Rights (TDRs) to accelerate private investment in the provision of houses for the poor. The initiatives
under active consideration of the Ministry of Housing & Urban Poverty Alleviation (M/o HUPA) in Government of
India include Review of National Urban Land Policy, Model Real Estate Regulation Act, Model Legal Framework for
assigning Property Rights to Slum Dwellers, and Housing Start-Up Index (HSUI).
2.4 The other efforts taken by the Govt. of India towards affordable housing include setting up a Committee to
establish Housing Micro-Finance Institution for the housing needs of poor in the informal sector, the report of which
has already been received by the MoHUPA. Some states like Punjab, Maharashtra, Rajasthan, Karnataka and Madhya
Pradesh have already developed State Housing and Habitat Policy, while many other states/UTs are in the process of
developing it. Moreover, several states have started programmes within the state sector for social housing, some of
which are as ambitious as the JNNURM. Andhra Pradesh, for example, has adopted a policy of meeting housing needs
of the poor by a saturation approach; Uttar Pradesh has a large programme for urban housing; and Maharashtra has set
itself a target of 20 lakh houses within this plan period 2012-17.
2.5 One of the important developments in the urban housing sector is the launching of the Jawaharlal Nehru
National Urban Renewal Mission (JNNURM) – with components of Basic Services to the Urban Poor (BSUP) and
Integrated Housing & Slum Development Programme (IHSDP) - in 2005. Besides JNNURM, two other housing programmes
that have been launched by the Government of India are Interest Subsidy Scheme for Housing the Urban Poor (ISHUP)
and Affordable Housing in Partnership - launched in February 2009. Together, they address the “supply side” issues of
affordable housing and aim to enable the construction of about 25 lakh houses with basic amenities for the Economically
Weaker Sections (EWS) and Low Income Groups (LIG) by the end of 12th Five Year Plan. About 15.7 lakh houses have
State of Housing in India
3
2.6 As components of JNNURM, the BSUP and IHSDP have achieved a fair amount of success with the
overarching aims of focusing State attention on the problems of inequity in urban areas, and drawing budgetary
resources to the welfare of the urban poor. Cities have begun earmarking funds within their budgets for the urban poor
housing in all new developments. About 2/3rd of the JNNURM housing is being provided by conferring entitlements
in-situ including provision for upgradation of infrastructure of existing slums. Simultaneously, there is an acceptance at
policy level, both in the State and Municipality, that the emergence of new slums can be prevented only by increasing the
availability of land and affordable housing for the urban poor, which in turn requires that the market-distorting shortages
of land and housing be corrected.
2.7 Considering the need to intensify efforts and accord a new deal to slum-dwellers, the President of India, in her
address to both the Houses of Parliament on 4th June 2009 declared the resolve of the Government to usher in a Slum-free
Urban India through the launching of Rajiv Awas Yojana (RAY). In pursuance of the Government’s vision of creating a
Slum-free India, RAY has been launched on 02.06.2011. The Phase I of Rajiv Awas Yojana which is for a period of two
years from the date of approval of the scheme is the preparatory phase and is currently under implementation. The Phase
II of RAY shall be there for the remaining period of the 12th Five Year Plan. Under the Scheme, Central Assistance
will be extended to States that are willing to assign property rights to slum dwellers and undertake reservation of land/
Floor Area Ratio (FAR)/dwelling units for Economically Weaker Sections (EWS)/Low Income Groups (LIG), earmark
25 per cent of municipal budget for basic services to the urban poor/slum-dwellers and bring in legislative amendments
and policy changes to redress land and affordable housing shortages for the urban poor.
in cities is the lack of availability of land at affordable prices. This is explained in terms of lack of ‘legal’ space or tenure
security in the existing slums; absence of implementation of reservation of land for EWS/LIG housing and informal
sector activities in Master Plans for cities, spiraling urban land prices that have soared on the adoption of land as a
resource raising policy by states and municipalities. Another key constraint to affordable housing to the urban poor is the
is critically important for the poor if they are not to be squeezed out of the formal housing market. Another constraint is
the availability of rental housing for new migrants from rural areas and small towns seeking jobs in cities. Rajiv Awas
Yojana is expected to adopt a holistic approach with a package of measures to address the issues of land for housing
and facilitate the construction of affordable houses for the urban poor. This scheme proposes to guarantee the lending
agencies for loans given to EWS/LIG persons upto Rs. 5 Lakh without any third party guarantee or collateral security.
31st October, 2012.
2.8 Housing and housing amenities are major indicators to gauge human well-being of a country. Any
person in the house, the basic civic amenities available to the household etc. will depict the overall socio-economic
progress of the society. Statistical information relating to housing condition in quantitative terms is essential for an
National Buildings Organisation
4
assessment of the overall housing needs and also for the formulation of housing policies and programmes. Thus, a
bodies to enable them to give proper attention to the formulation, execution and evaluation of housing policies and
programmes which constitute an integral part of the overall social and economic plans of the country. Adequate database on
`Housing’ and `Housing Amenities’ is a mainstay for methodical planning and judicious use of plan resources
equitably reaching the needy across the States/Union Territories (UTs). To have a good understanding of housing and
housing amenities and to be able to understand the housing problem in its entirety and launch appropriate, timely and
corrective steps to mitigate hardships of the houseless and poor, it is imperative to build up comprehensive database on
various aspects of housing in the country which is essential for the formulation of an effective and coordinated policy.
Alleviation, is the nodal agency for collecting, maintaining and disseminating authentic information on buildings statistics and
housing in India. As part of its activities, NBO is bringing out the `Housing in India – A Statistical Compendium’. This
compendium contains state-wise rural-urban disaggregated data on housing, households and household amenities.
2.9 The statistical inputs have been taken from the Census of India-2011 and the following reports of the National
Sample Survey Organization (NSSO):
Housing Condition in India 49th Round (Jan.1993-June.1993)
Housing Condition in India 58th Round (July to December 2002)
Housing Condition and Amenities in India, 2008-09 65th Round (July 2008-June 2009)
State of Housing in India
5
2 Houses & Housing Condition in India-Census 2011
Number of Houses and Households1.
1.1 Census of India in its decadal Census operation collects valuable information on number of houses and
households, quality of houses in terms of good, livable and dilapidated in the country along with some of the important
information on availability of basic amenities like safe drinking water, electricity and toilet facilities etc.
Total Houses (Table-1, Figure-1)
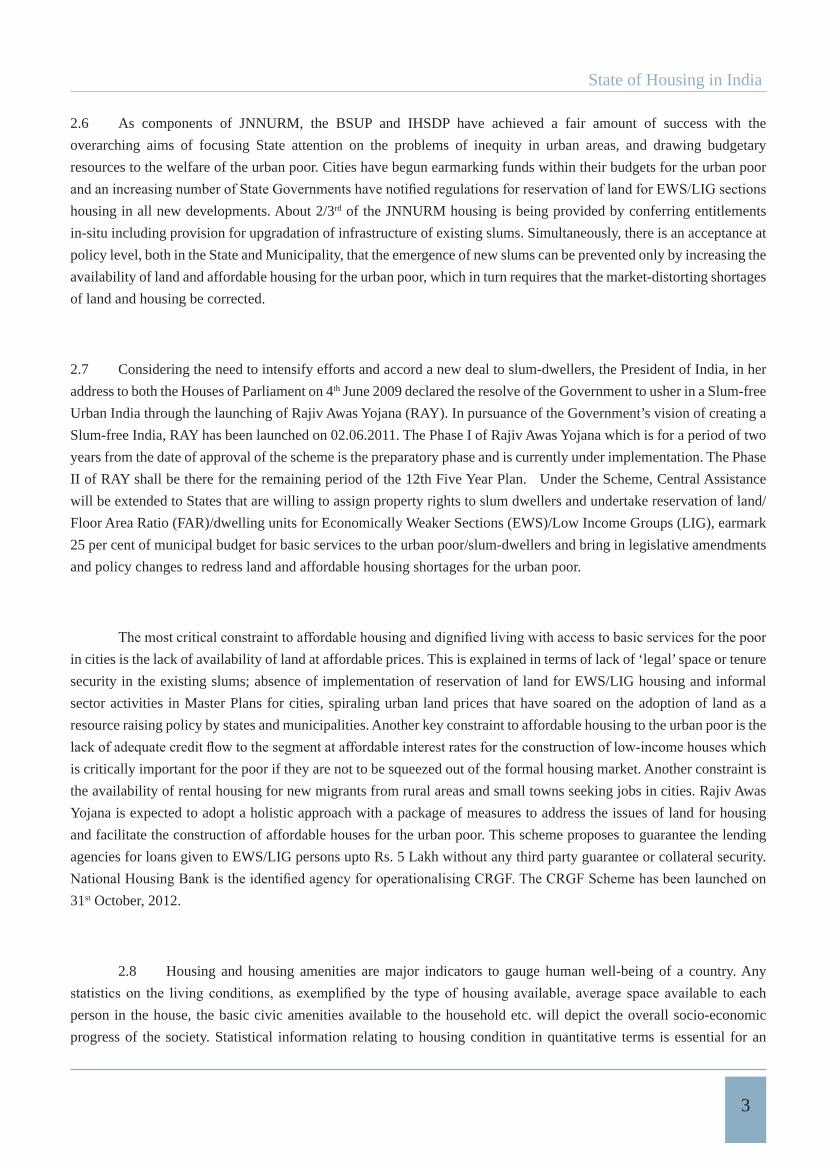
1.2 As per the 2011 Census, the total number of houses in India was 330.84 million. This includes 306.16 million
occupied and 24.67 million vacant houses. The number of houses in rural area was 220.70 million with 207.12 million
occupied houses and 13.58 million vacant houses; in urban areas the number was 110.14 million total houses, which
includes 99.05 million occupied and 11.09 million vacant houses.
Table- 1 Total Number of Census Houses: Rural & Urban-2011
(In million)
Area Total Number of Census Houses
Distribution of Census HousesOccupied Census Houses Vacant Census Houses
(1) (2) (3) (4)
Rural 220.70 207.12 13.58
Urban 110.14 99.04 11.09
India 330.84 306.16 24.67
Figure- 1 Total Number of Census House - Census-2011
Source: Census of India 2011: Series-H: Tables on Houses, Household Amenities and Assets
National Buildings Organisation
6
Total Households (Table-2, Figure-2):
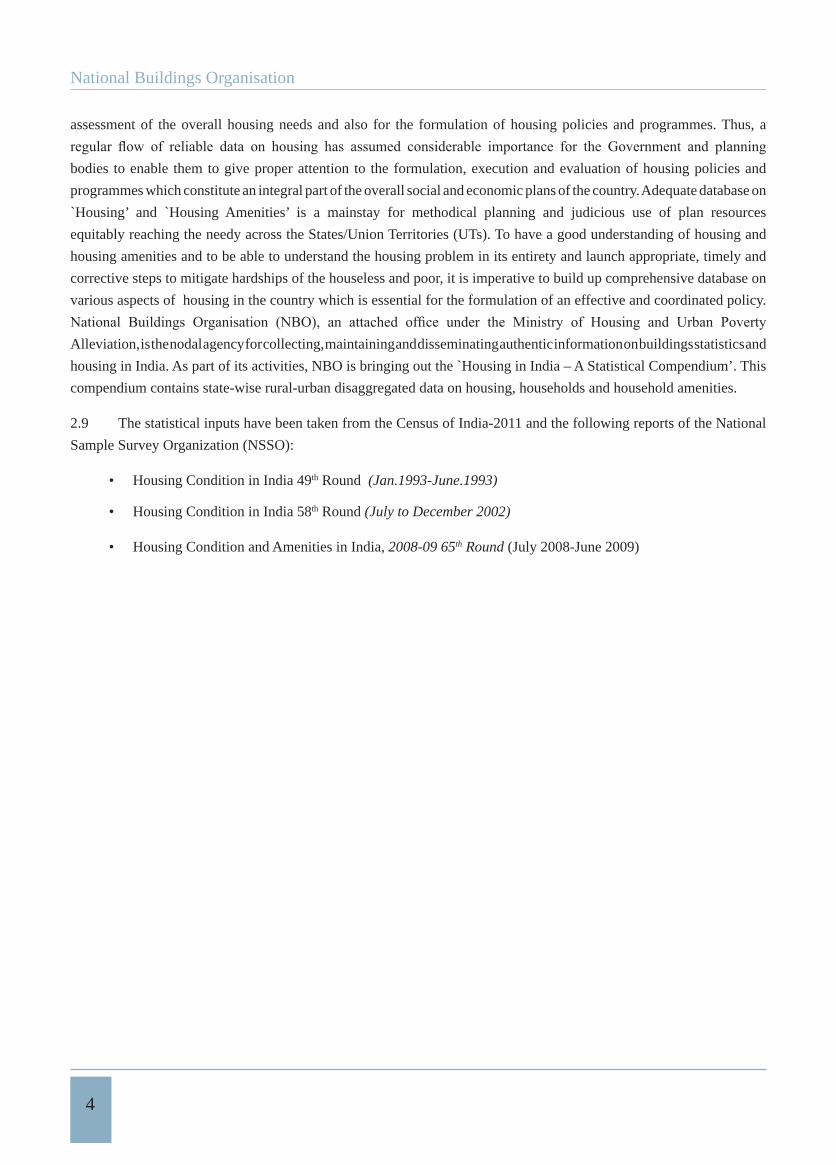
1.3 The total number of households was 246.69 million in India as per 2011 Census and the All-India average
household size was 4.9 persons. The number of rural households was 167.83 million (68 per cent), while the urban
households were 78.86 million (32 per cent). The average household size was 4.9 and 4.8 persons respectively for rural
and urban areas. Figure-2 shows the number of households in rural and urban areas in 2011.
Table -2 Total Number of Households: Rural & Urban -2011
(In million)
Characteristics Total Rural Urban
Total Population 1210.19 833.09 (69%) 377.10 (31%)
Total Households 246.69 167.83 (68%) 78.86 (32%)
Average Household Size 4.9 4.9 4.8
Figure- 2 Total Number of Households: Rural & Urban -2011
Source: Census of India 2011: Series-H: Tables on Houses, Household Amenities and Assets
Total Occupied Houses by Type of Use (Table-3, Figure-3):
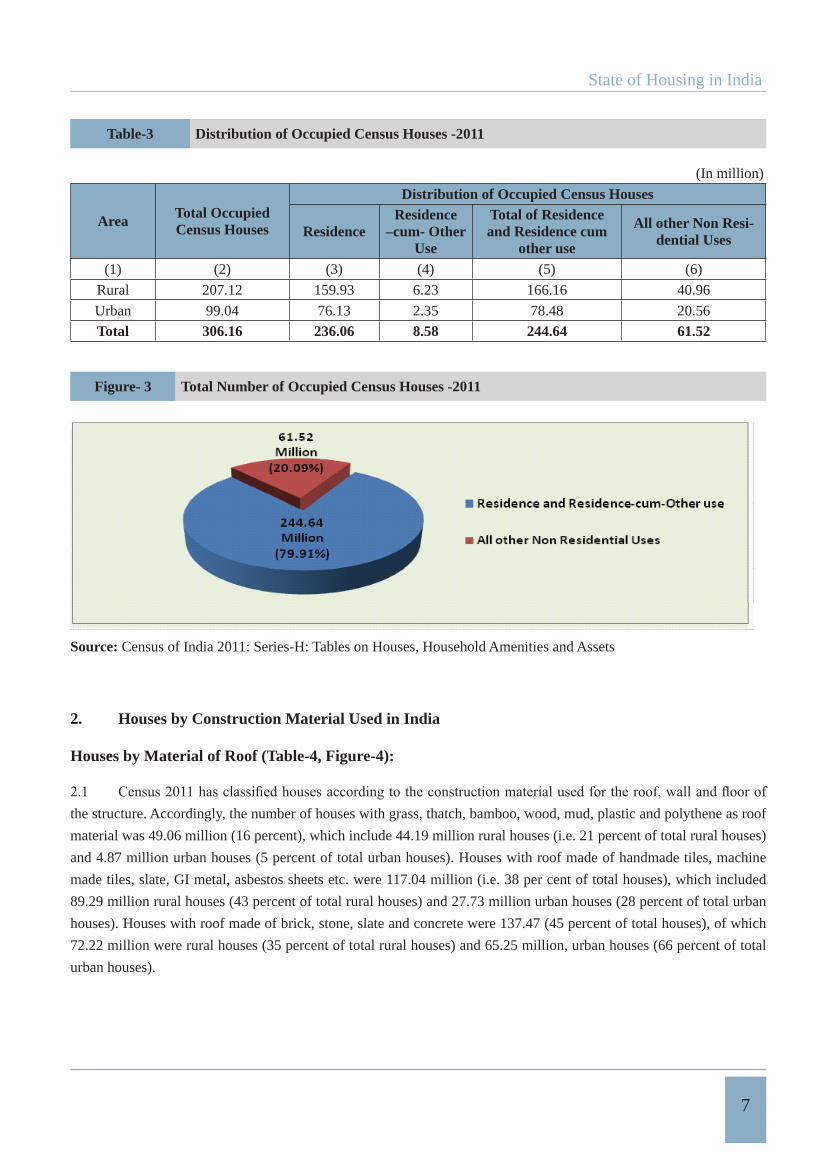
1.4 There were 306.16 million occupied census houses in India as per 2011 Census. Of the occupied houses, houses
used for both residential and residence-cum-other purposes were 244.64 million. Houses used for non-residential uses
were numbered at 61.52 million. Among the 207.12 million total occupied houses in rural areas, those used for both
residential and residence-cum-other purposes were 166.16 million and houses used for all other non-residential uses
were 40.96 million. Out of the 99.05 million occupied houses in urban areas, the number of houses used for both
residential and residence-cum-other purposes was 78.48 million while those used for all other
non- residential uses were 20.56 million.
State of Housing in India
7
Table-3 Distribution of Occupied Census Houses -2011
(In million)
Area Total Occupied Census Houses
Distribution of Occupied Census Houses
ResidenceResidence
–cum- Other Use
Total of Residence and Residence cum
other use
All other Non Resi-dential Uses
(1) (2) (3) (4) (5) (6)
Rural 207.12 159.93 6.23 166.16 40.96
Urban 99.04 76.13 2.35 78.48 20.56
Total 306.16 236.06 8.58 244.64 61.52
Figure- 3 Total Number of Occupied Census Houses -2011
Source: Census of India 2011: Series-H: Tables on Houses, Household Amenities and Assets
2. Houses by Construction Material Used in India
Houses by Material of Roof (Table-4, Figure-4):
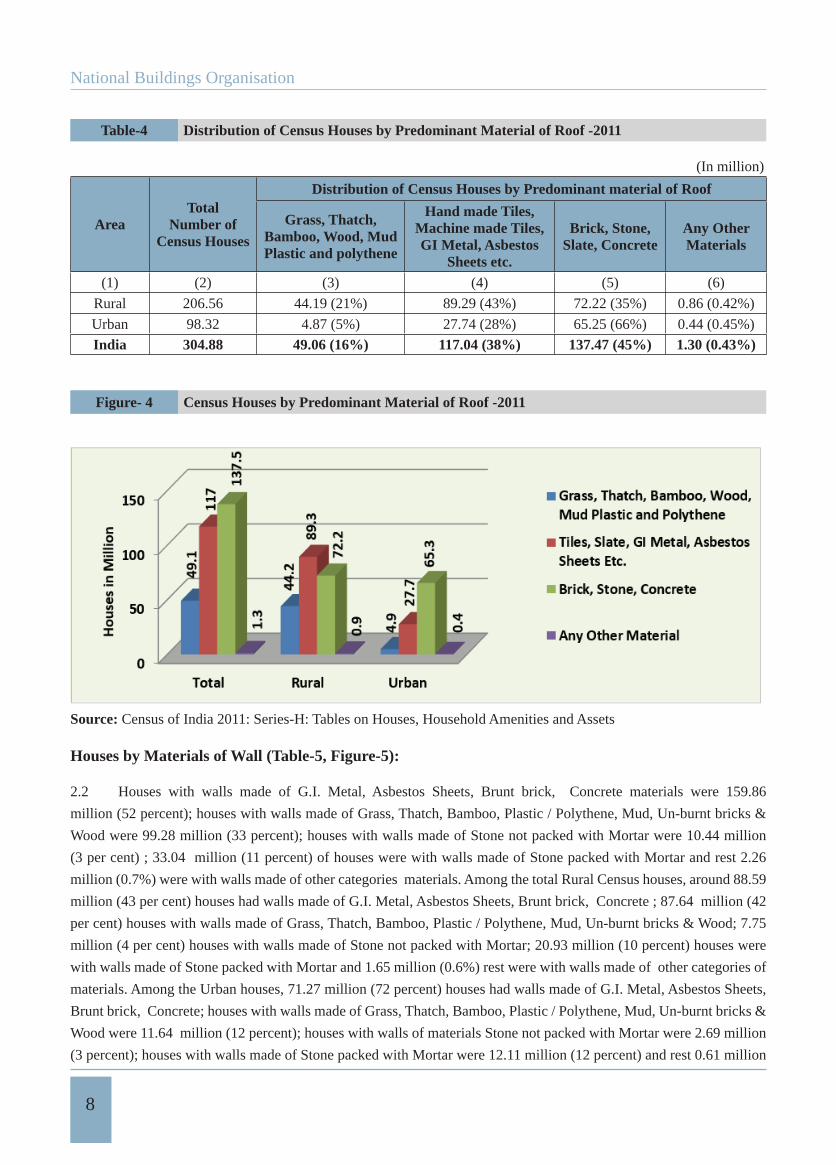
the structure. Accordingly, the number of houses with grass, thatch, bamboo, wood, mud, plastic and polythene as roof
material was 49.06 million (16 percent), which include 44.19 million rural houses (i.e. 21 percent of total rural houses)
and 4.87 million urban houses (5 percent of total urban houses). Houses with roof made of handmade tiles, machine
made tiles, slate, GI metal, asbestos sheets etc. were 117.04 million (i.e. 38 per cent of total houses), which included
89.29 million rural houses (43 percent of total rural houses) and 27.73 million urban houses (28 percent of total urban
houses). Houses with roof made of brick, stone, slate and concrete were 137.47 (45 percent of total houses), of which
72.22 million were rural houses (35 percent of total rural houses) and 65.25 million, urban houses (66 percent of total
urban houses).
National Buildings Organisation
8
Table-4 Distribution of Census Houses by Predominant Material of Roof -2011
(In million)
AreaTotal
Number of Census Houses
Distribution of Census Houses by Predominant material of Roof
Grass, Thatch, Bamboo, Wood, Mud Plastic and polythene
Hand made Tiles, Machine made Tiles, GI Metal, Asbestos
Sheets etc.
Brick, Stone, Slate, Concrete
Any Other Materials
(1) (2) (3) (4) (5) (6)
Rural 206.56 44.19 (21%) 89.29 (43%) 72.22 (35%) 0.86 (0.42%)
Urban 98.32 4.87 (5%) 27.74 (28%) 65.25 (66%) 0.44 (0.45%)
India 304.88 49.06 (16%) 117.04 (38%) 137.47 (45%) 1.30 (0.43%)
Figure- 4 Census Houses by Predominant Material of Roof -2011
Source: Census of India 2011: Series-H: Tables on Houses, Household Amenities and Assets
Houses by Materials of Wall (Table-5, Figure-5):
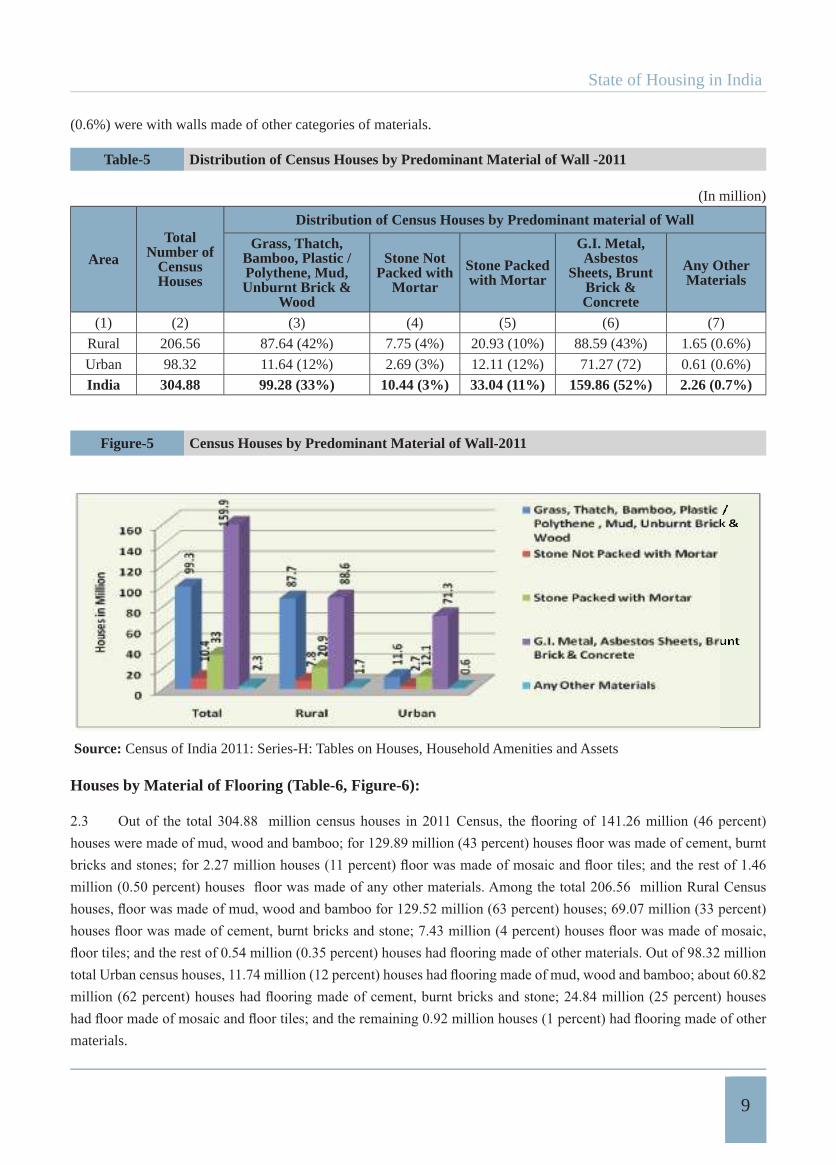
2.2 Houses with walls made of G.I. Metal, Asbestos Sheets, Brunt brick, Concrete materials were 159.86
million (52 percent); houses with walls made of Grass, Thatch, Bamboo, Plastic / Polythene, Mud, Un-burnt bricks &
Wood were 99.28 million (33 percent); houses with walls made of Stone not packed with Mortar were 10.44 million
(3 per cent) ; 33.04 million (11 percent) of houses were with walls made of Stone packed with Mortar and rest 2.26
million (0.7%) were with walls made of other categories materials. Among the total Rural Census houses, around 88.59
million (43 per cent) houses had walls made of G.I. Metal, Asbestos Sheets, Brunt brick, Concrete ; 87.64 million (42
per cent) houses with walls made of Grass, Thatch, Bamboo, Plastic / Polythene, Mud, Un-burnt bricks & Wood; 7.75
million (4 per cent) houses with walls made of Stone not packed with Mortar; 20.93 million (10 percent) houses were
with walls made of Stone packed with Mortar and 1.65 million (0.6%) rest were with walls made of other categories of
materials. Among the Urban houses, 71.27 million (72 percent) houses had walls made of G.I. Metal, Asbestos Sheets,
Brunt brick, Concrete; houses with walls made of Grass, Thatch, Bamboo, Plastic / Polythene, Mud, Un-burnt bricks &
Wood were 11.64 million (12 percent); houses with walls of materials Stone not packed with Mortar were 2.69 million
(3 percent); houses with walls made of Stone packed with Mortar were 12.11 million (12 percent) and rest 0.61 million
State of Housing in India
9
(0.6%) were with walls made of other categories of materials.
Table-5 Distribution of Census Houses by Predominant Material of Wall -2011
(In million)
Area
Total Number of
CensusHouses
Distribution of Census Houses by Predominant material of Wall
Grass, Thatch, Bamboo, Plastic / Polythene, Mud, Unburnt Brick &
Wood
Stone Not Packed with
Mortar
Stone Packed with Mortar
G.I. Metal, Asbestos
Sheets, Brunt Brick &Concrete
Any Other Materials
(1) (2) (3) (4) (5) (6) (7)
Rural 206.56 87.64 (42%) 7.75 (4%) 20.93 (10%) 88.59 (43%) 1.65 (0.6%)
Urban 98.32 11.64 (12%) 2.69 (3%) 12.11 (12%) 71.27 (72) 0.61 (0.6%)
India 304.88 99.28 (33%) 10.44 (3%) 33.04 (11%) 159.86 (52%) 2.26 (0.7%)
Figure-5 Census Houses by Predominant Material of Wall-2011
Source: Census of India 2011: Series-H: Tables on Houses, Household Amenities and Assets
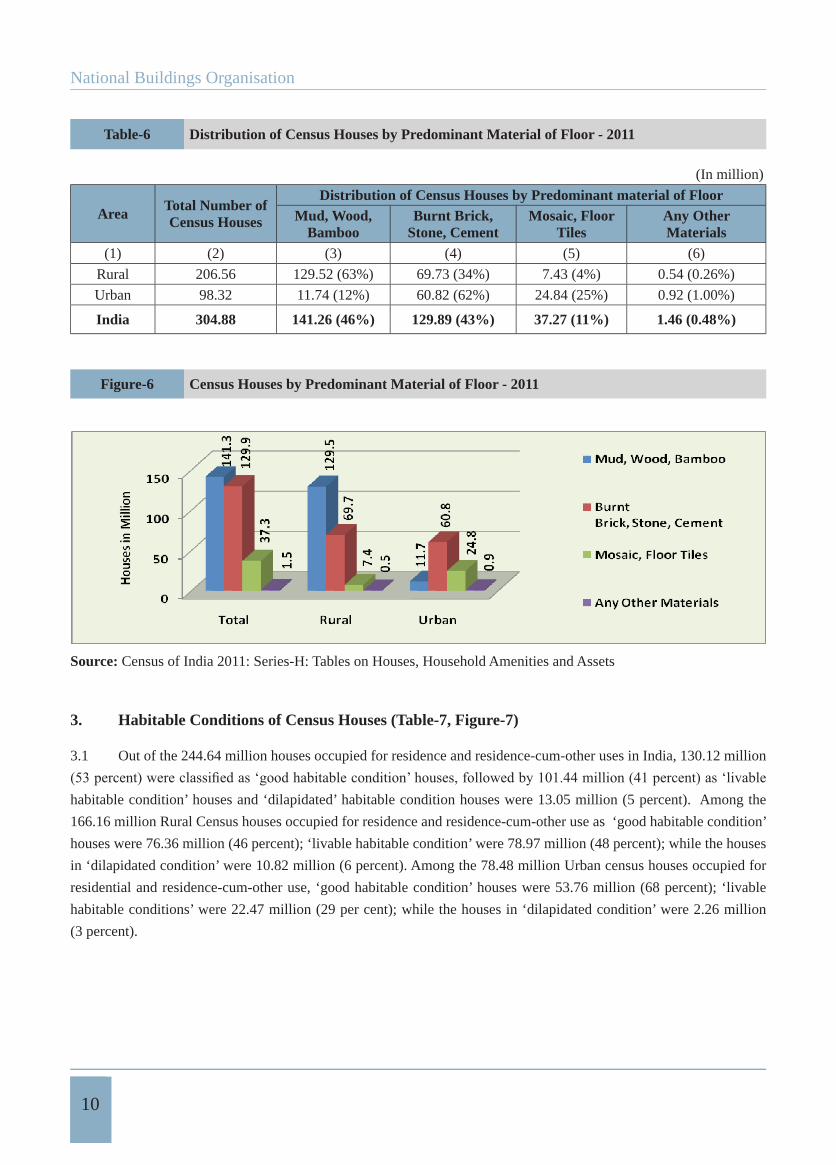
Houses by Material of Flooring (Table-6, Figure-6):
materials.
National Buildings Organisation
10
Table-6 Distribution of Census Houses by Predominant Material of Floor - 2011
(In million)
Area Total Number of Census Houses
Distribution of Census Houses by Predominant material of FloorMud, Wood,
BambooBurnt Brick,
Stone, CementMosaic, Floor
TilesAny Other Materials
(1) (2) (3) (4) (5) (6)
Rural 206.56 129.52 (63%) 69.73 (34%) 7.43 (4%) 0.54 (0.26%)
Urban 98.32 11.74 (12%) 60.82 (62%) 24.84 (25%) 0.92 (1.00%)
India 304.88 141.26 (46%) 129.89 (43%) 37.27 (11%) 1.46 (0.48%)
Figure-6 Census Houses by Predominant Material of Floor - 2011
Source: Census of India 2011: Series-H: Tables on Houses, Household Amenities and Assets
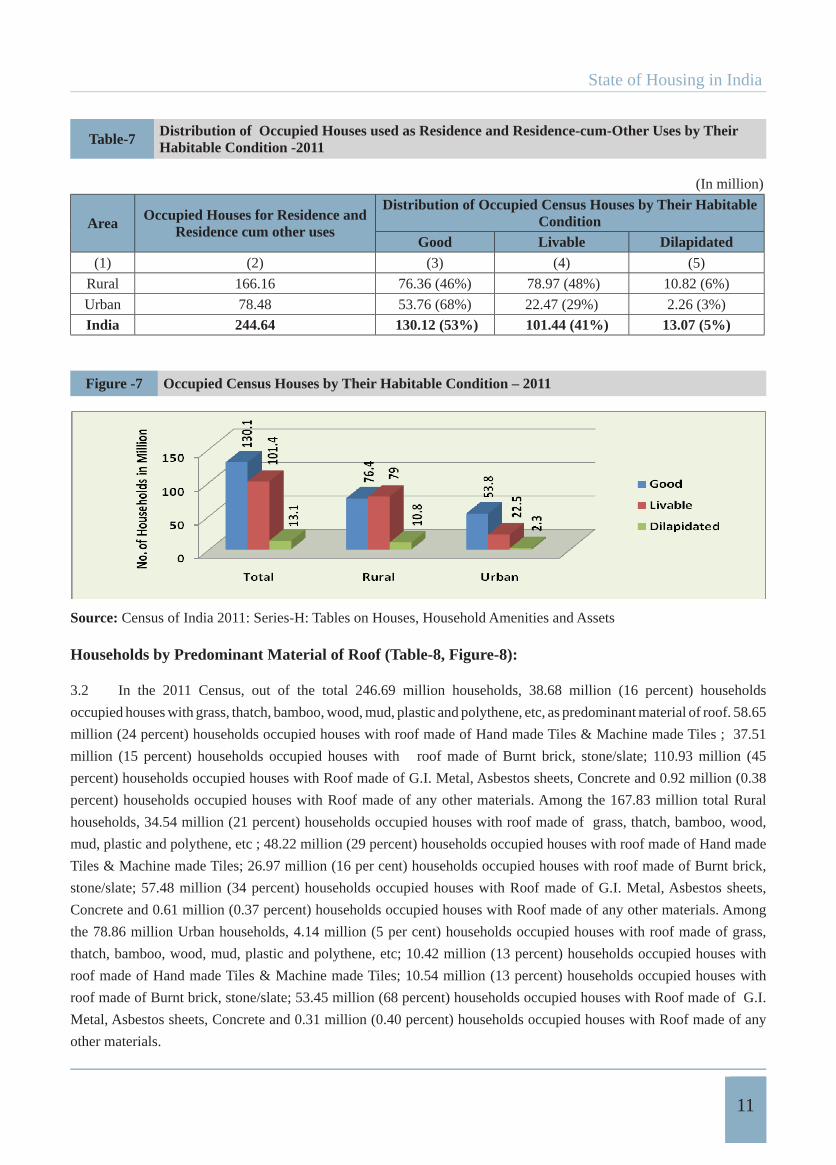
3. Habitable Conditions of Census Houses (Table-7, Figure-7)
3.1 Out of the 244.64 million houses occupied for residence and residence-cum-other uses in India, 130.12 million
habitable condition’ houses and ‘dilapidated’ habitable condition houses were 13.05 million (5 percent). Among the
166.16 million Rural Census houses occupied for residence and residence-cum-other use as ‘good habitable condition’
houses were 76.36 million (46 percent); ‘livable habitable condition’ were 78.97 million (48 percent); while the houses
in ‘dilapidated condition’ were 10.82 million (6 percent). Among the 78.48 million Urban census houses occupied for
residential and residence-cum-other use, ‘good habitable condition’ houses were 53.76 million (68 percent); ‘livable
habitable conditions’ were 22.47 million (29 per cent); while the houses in ‘dilapidated condition’ were 2.26 million
(3 percent).
State of Housing in India
11
Table-7 Distribution of Occupied Houses used as Residence and Residence-cum-Other Uses by Their Habitable Condition -2011
(In million)
Area Occupied Houses for Residence and Residence cum other uses
Distribution of Occupied Census Houses by Their Habitable Condition
Good Livable Dilapidated(1) (2) (3) (4) (5)
Rural 166.16 76.36 (46%) 78.97 (48%) 10.82 (6%)
Urban 78.48 53.76 (68%) 22.47 (29%) 2.26 (3%)
India 244.64 130.12 (53%) 101.44 (41%) 13.07 (5%)
Figure -7 Occupied Census Houses by Their Habitable Condition – 2011
Source: Census of India 2011: Series-H: Tables on Houses, Household Amenities and Assets
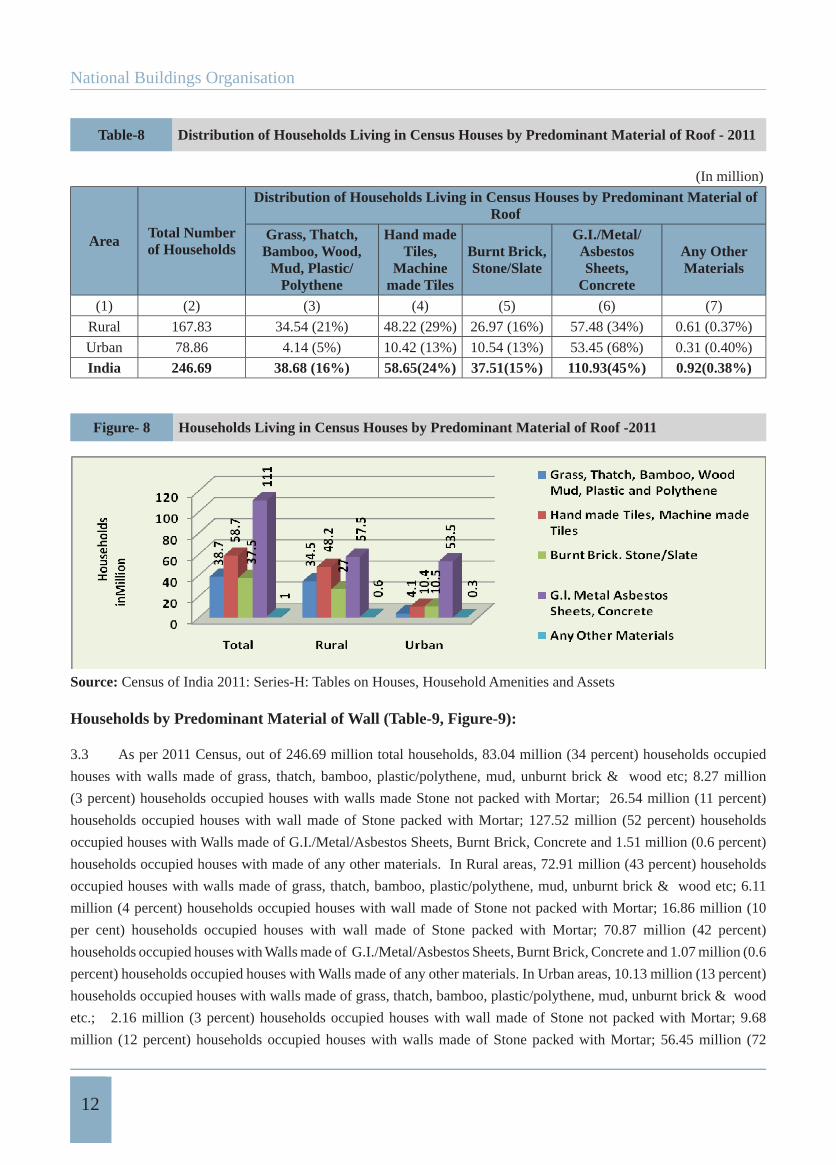
Households by Predominant Material of Roof (Table-8, Figure-8):
3.2 In the 2011 Census, out of the total 246.69 million households, 38.68 million (16 percent) households
occupied houses with grass, thatch, bamboo, wood, mud, plastic and polythene, etc, as predominant material of roof. 58.65
million (24 percent) households occupied houses with roof made of Hand made Tiles & Machine made Tiles ; 37.51
million (15 percent) households occupied houses with roof made of Burnt brick, stone/slate; 110.93 million (45
percent) households occupied houses with Roof made of G.I. Metal, Asbestos sheets, Concrete and 0.92 million (0.38
percent) households occupied houses with Roof made of any other materials. Among the 167.83 million total Rural
households, 34.54 million (21 percent) households occupied houses with roof made of grass, thatch, bamboo, wood,
mud, plastic and polythene, etc ; 48.22 million (29 percent) households occupied houses with roof made of Hand made
Tiles & Machine made Tiles; 26.97 million (16 per cent) households occupied houses with roof made of Burnt brick,
stone/slate; 57.48 million (34 percent) households occupied houses with Roof made of G.I. Metal, Asbestos sheets,
Concrete and 0.61 million (0.37 percent) households occupied houses with Roof made of any other materials. Among
the 78.86 million Urban households, 4.14 million (5 per cent) households occupied houses with roof made of grass,
thatch, bamboo, wood, mud, plastic and polythene, etc; 10.42 million (13 percent) households occupied houses with
roof made of Hand made Tiles & Machine made Tiles; 10.54 million (13 percent) households occupied houses with
roof made of Burnt brick, stone/slate; 53.45 million (68 percent) households occupied houses with Roof made of G.I.
Metal, Asbestos sheets, Concrete and 0.31 million (0.40 percent) households occupied houses with Roof made of any
other materials.
National Buildings Organisation
12
Table-8 Distribution of Households Living in Census Houses by Predominant Material of Roof - 2011
(In million)
Area Total Number of Households
Distribution of Households Living in Census Houses by Predominant Material of Roof
Grass, Thatch, Bamboo, Wood,
Mud, Plastic/ Polythene
Hand made Tiles,
Machinemade Tiles
Burnt Brick, Stone/Slate
G.I./Metal/AsbestosSheets,
Concrete
Any Other Materials
(1) (2) (3) (4) (5) (6) (7)
Rural 167.83 34.54 (21%) 48.22 (29%) 26.97 (16%) 57.48 (34%) 0.61 (0.37%)
Urban 78.86 4.14 (5%) 10.42 (13%) 10.54 (13%) 53.45 (68%) 0.31 (0.40%)
India 246.69 38.68 (16%) 58.65(24%) 37.51(15%) 110.93(45%) 0.92(0.38%)
Figure- 8 Households Living in Census Houses by Predominant Material of Roof -2011
Source: Census of India 2011: Series-H: Tables on Houses, Household Amenities and Assets
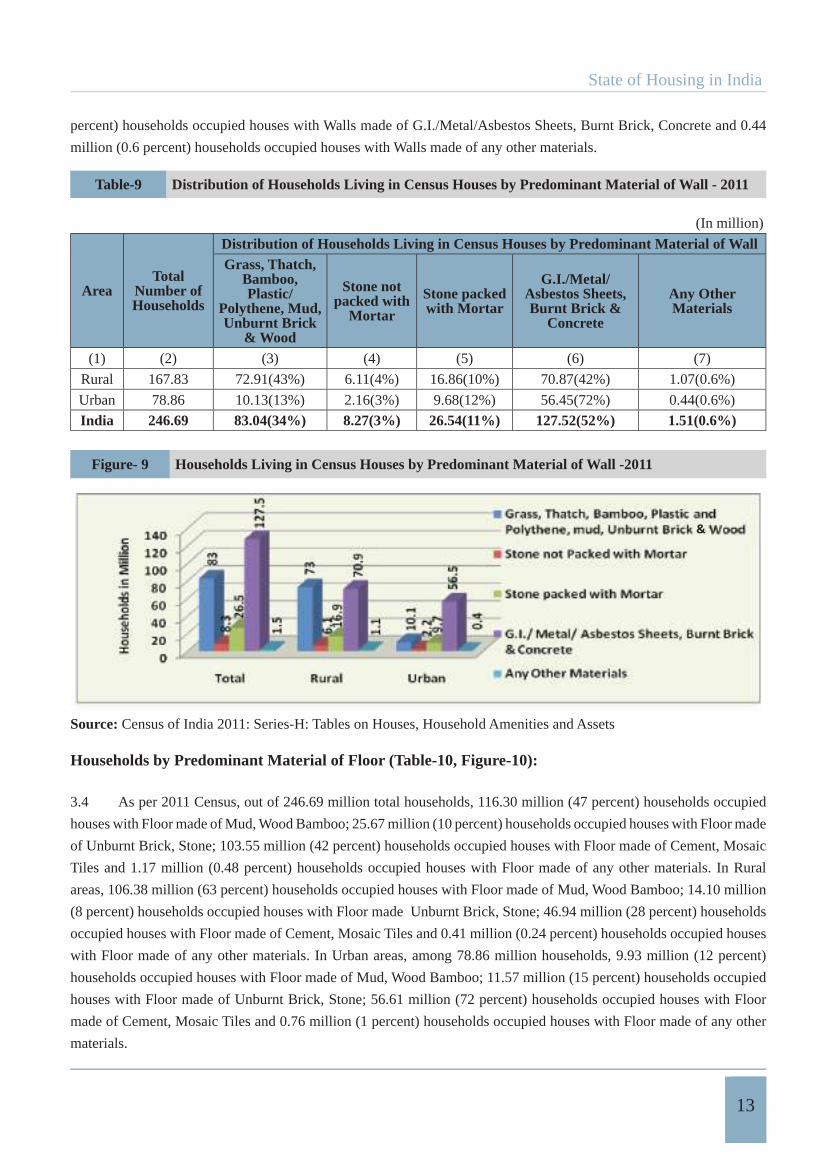
Households by Predominant Material of Wall (Table-9, Figure-9):
3.3 As per 2011 Census, out of 246.69 million total households, 83.04 million (34 percent) households occupied
houses with walls made of grass, thatch, bamboo, plastic/polythene, mud, unburnt brick & wood etc; 8.27 million
(3 percent) households occupied houses with walls made Stone not packed with Mortar; 26.54 million (11 percent)
households occupied houses with wall made of Stone packed with Mortar; 127.52 million (52 percent) households
occupied houses with Walls made of G.I./Metal/Asbestos Sheets, Burnt Brick, Concrete and 1.51 million (0.6 percent)
households occupied houses with made of any other materials. In Rural areas, 72.91 million (43 percent) households
occupied houses with walls made of grass, thatch, bamboo, plastic/polythene, mud, unburnt brick & wood etc; 6.11
million (4 percent) households occupied houses with wall made of Stone not packed with Mortar; 16.86 million (10
per cent) households occupied houses with wall made of Stone packed with Mortar; 70.87 million (42 percent)
households occupied houses with Walls made of G.I./Metal/Asbestos Sheets, Burnt Brick, Concrete and 1.07 million (0.6
percent) households occupied houses with Walls made of any other materials. In Urban areas, 10.13 million (13 percent)
households occupied houses with walls made of grass, thatch, bamboo, plastic/polythene, mud, unburnt brick & wood
etc.; 2.16 million (3 percent) households occupied houses with wall made of Stone not packed with Mortar; 9.68
million (12 percent) households occupied houses with walls made of Stone packed with Mortar; 56.45 million (72
State of Housing in India
13
percent) households occupied houses with Walls made of G.I./Metal/Asbestos Sheets, Burnt Brick, Concrete and 0.44
million (0.6 percent) households occupied houses with Walls made of any other materials.
Table-9 Distribution of Households Living in Census Houses by Predominant Material of Wall - 2011
(In million)
AreaTotal
Number of Households
Distribution of Households Living in Census Houses by Predominant Material of WallGrass, Thatch,
Bamboo,Plastic/
Polythene, Mud, Unburnt Brick
& Wood
Stone not packed with
Mortar
Stone packed with Mortar
G.I./Metal/Asbestos Sheets, Burnt Brick &
Concrete
Any Other Materials
(1) (2) (3) (4) (5) (6) (7)
Rural 167.83 72.91(43%) 6.11(4%) 16.86(10%) 70.87(42%) 1.07(0.6%)
Urban 78.86 10.13(13%) 2.16(3%) 9.68(12%) 56.45(72%) 0.44(0.6%)
India 246.69 83.04(34%) 8.27(3%) 26.54(11%) 127.52(52%) 1.51(0.6%)
Figure- 9 Households Living in Census Houses by Predominant Material of Wall -2011
Source: Census of India 2011: Series-H: Tables on Houses, Household Amenities and Assets
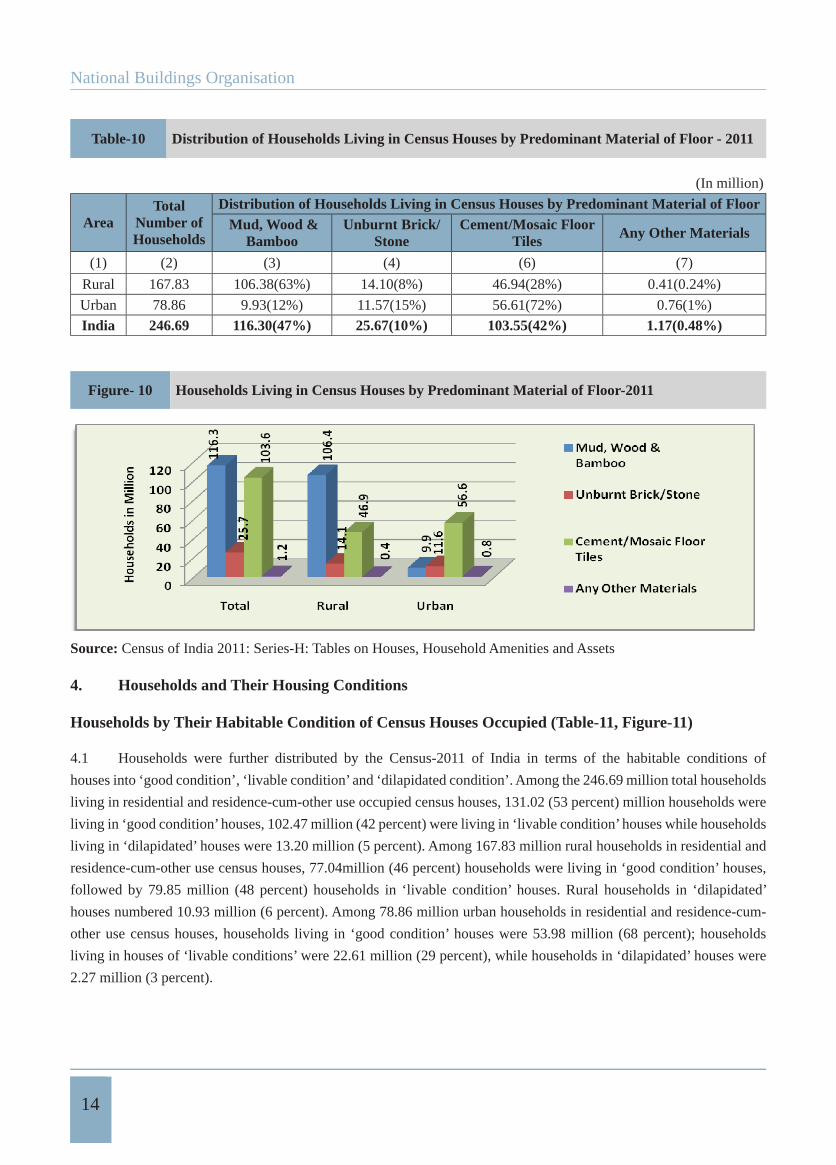
Households by Predominant Material of Floor (Table-10, Figure-10):
3.4 As per 2011 Census, out of 246.69 million total households, 116.30 million (47 percent) households occupied
houses with Floor made of Mud, Wood Bamboo; 25.67 million (10 percent) households occupied houses with Floor made
of Unburnt Brick, Stone; 103.55 million (42 percent) households occupied houses with Floor made of Cement, Mosaic
Tiles and 1.17 million (0.48 percent) households occupied houses with Floor made of any other materials. In Rural
areas, 106.38 million (63 percent) households occupied houses with Floor made of Mud, Wood Bamboo; 14.10 million
(8 percent) households occupied houses with Floor made Unburnt Brick, Stone; 46.94 million (28 percent) households
occupied houses with Floor made of Cement, Mosaic Tiles and 0.41 million (0.24 percent) households occupied houses
with Floor made of any other materials. In Urban areas, among 78.86 million households, 9.93 million (12 percent)
households occupied houses with Floor made of Mud, Wood Bamboo; 11.57 million (15 percent) households occupied
houses with Floor made of Unburnt Brick, Stone; 56.61 million (72 percent) households occupied houses with Floor
made of Cement, Mosaic Tiles and 0.76 million (1 percent) households occupied houses with Floor made of any other
materials.
&
National Buildings Organisation
14
Table-10 Distribution of Households Living in Census Houses by Predominant Material of Floor - 2011
(In million)
AreaTotal
Number of Households
Distribution of Households Living in Census Houses by Predominant Material of Floor Mud, Wood &
BambooUnburnt Brick/
StoneCement/Mosaic Floor
Tiles Any Other Materials
(1) (2) (3) (4) (6) (7)
Rural 167.83 106.38(63%) 14.10(8%) 46.94(28%) 0.41(0.24%)
Urban 78.86 9.93(12%) 11.57(15%) 56.61(72%) 0.76(1%)
India 246.69 116.30(47%) 25.67(10%) 103.55(42%) 1.17(0.48%)
Figure- 10 Households Living in Census Houses by Predominant Material of Floor-2011
Source: Census of India 2011: Series-H: Tables on Houses, Household Amenities and Assets
4. Households and Their Housing Conditions
Households by Their Habitable Condition of Census Houses Occupied (Table-11, Figure-11)
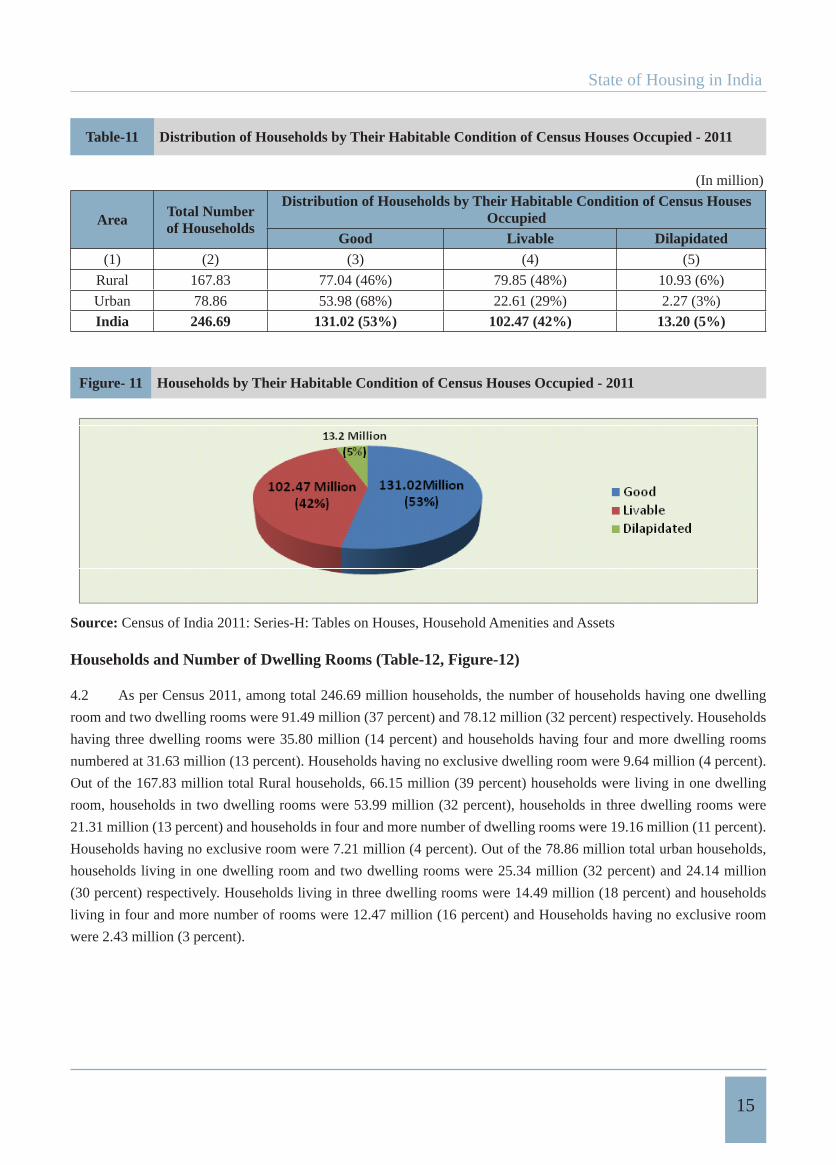
4.1 Households were further distributed by the Census-2011 of India in terms of the habitable conditions of
houses into ‘good condition’, ‘livable condition’ and ‘dilapidated condition’. Among the 246.69 million total households
living in residential and residence-cum-other use occupied census houses, 131.02 (53 percent) million households were
living in ‘good condition’ houses, 102.47 million (42 percent) were living in ‘livable condition’ houses while households
living in ‘dilapidated’ houses were 13.20 million (5 percent). Among 167.83 million rural households in residential and
residence-cum-other use census houses, 77.04million (46 percent) households were living in ‘good condition’ houses,
followed by 79.85 million (48 percent) households in ‘livable condition’ houses. Rural households in ‘dilapidated’
houses numbered 10.93 million (6 percent). Among 78.86 million urban households in residential and residence-cum-
other use census houses, households living in ‘good condition’ houses were 53.98 million (68 percent); households
living in houses of ‘livable conditions’ were 22.61 million (29 percent), while households in ‘dilapidated’ houses were
2.27 million (3 percent).
State of Housing in India
15
Table-11 Distribution of Households by Their Habitable Condition of Census Houses Occupied - 2011
(In million)
Area Total Number of Households
Distribution of Households by Their Habitable Condition of Census Houses Occupied
Good Livable Dilapidated(1) (2) (3) (4) (5)
Rural 167.83 77.04 (46%) 79.85 (48%) 10.93 (6%)
Urban 78.86 53.98 (68%) 22.61 (29%) 2.27 (3%)
India 246.69 131.02 (53%) 102.47 (42%) 13.20 (5%)
Figure- 11 Households by Their Habitable Condition of Census Houses Occupied - 2011
Source: Census of India 2011: Series-H: Tables on Houses, Household Amenities and Assets
Households and Number of Dwelling Rooms (Table-12, Figure-12)
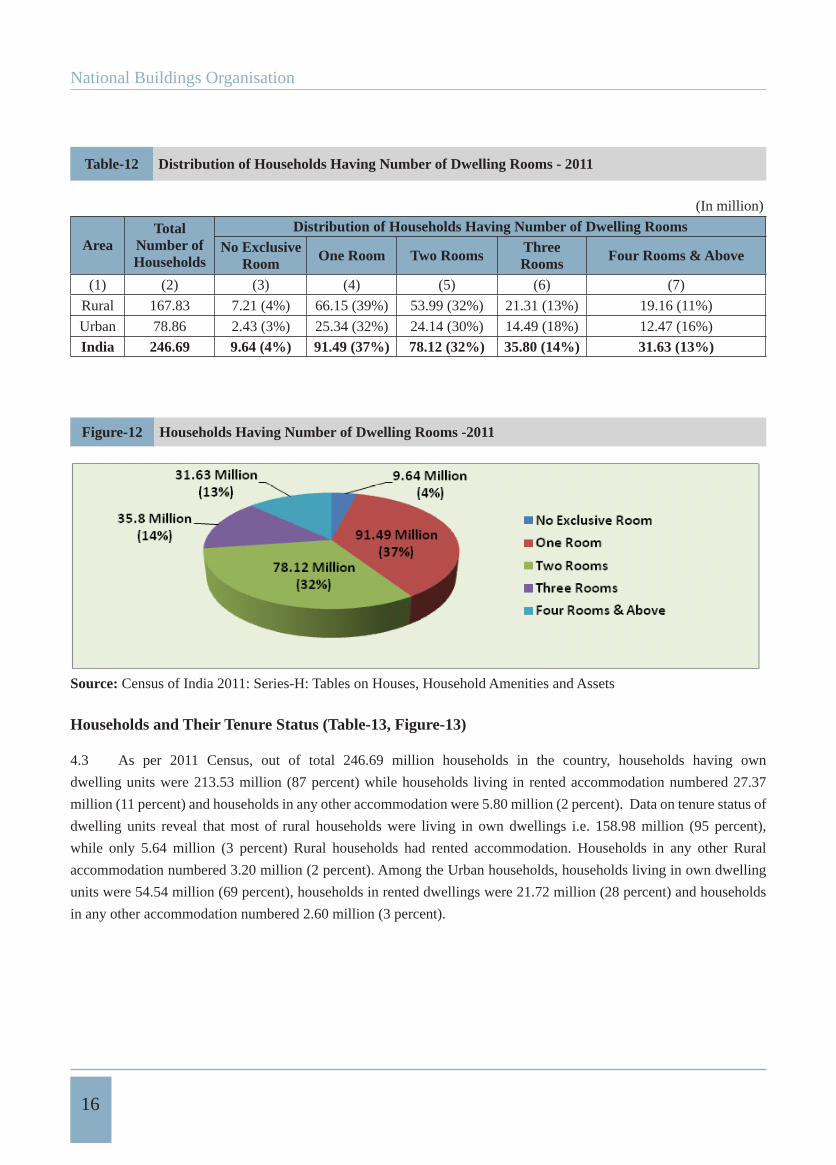
4.2 As per Census 2011, among total 246.69 million households, the number of households having one dwelling
room and two dwelling rooms were 91.49 million (37 percent) and 78.12 million (32 percent) respectively. Households
having three dwelling rooms were 35.80 million (14 percent) and households having four and more dwelling rooms
numbered at 31.63 million (13 percent). Households having no exclusive dwelling room were 9.64 million (4 percent).
Out of the 167.83 million total Rural households, 66.15 million (39 percent) households were living in one dwelling
room, households in two dwelling rooms were 53.99 million (32 percent), households in three dwelling rooms were
21.31 million (13 percent) and households in four and more number of dwelling rooms were 19.16 million (11 percent).
Households having no exclusive room were 7.21 million (4 percent). Out of the 78.86 million total urban households,
households living in one dwelling room and two dwelling rooms were 25.34 million (32 percent) and 24.14 million
(30 percent) respectively. Households living in three dwelling rooms were 14.49 million (18 percent) and households
living in four and more number of rooms were 12.47 million (16 percent) and Households having no exclusive room
were 2.43 million (3 percent).
National Buildings Organisation
16
Table-12 Distribution of Households Having Number of Dwelling Rooms - 2011
(In million)
AreaTotal
Number of Households
Distribution of Households Having Number of Dwelling RoomsNo Exclusive
Room One Room Two Rooms Three Rooms Four Rooms & Above
(1) (2) (3) (4) (5) (6) (7)
Rural 167.83 7.21 (4%) 66.15 (39%) 53.99 (32%) 21.31 (13%) 19.16 (11%)
Urban 78.86 2.43 (3%) 25.34 (32%) 24.14 (30%) 14.49 (18%) 12.47 (16%)
India 246.69 9.64 (4%) 91.49 (37%) 78.12 (32%) 35.80 (14%) 31.63 (13%)
Figure-12 Households Having Number of Dwelling Rooms -2011
Source: Census of India 2011: Series-H: Tables on Houses, Household Amenities and Assets
Households and Their Tenure Status (Table-13, Figure-13)
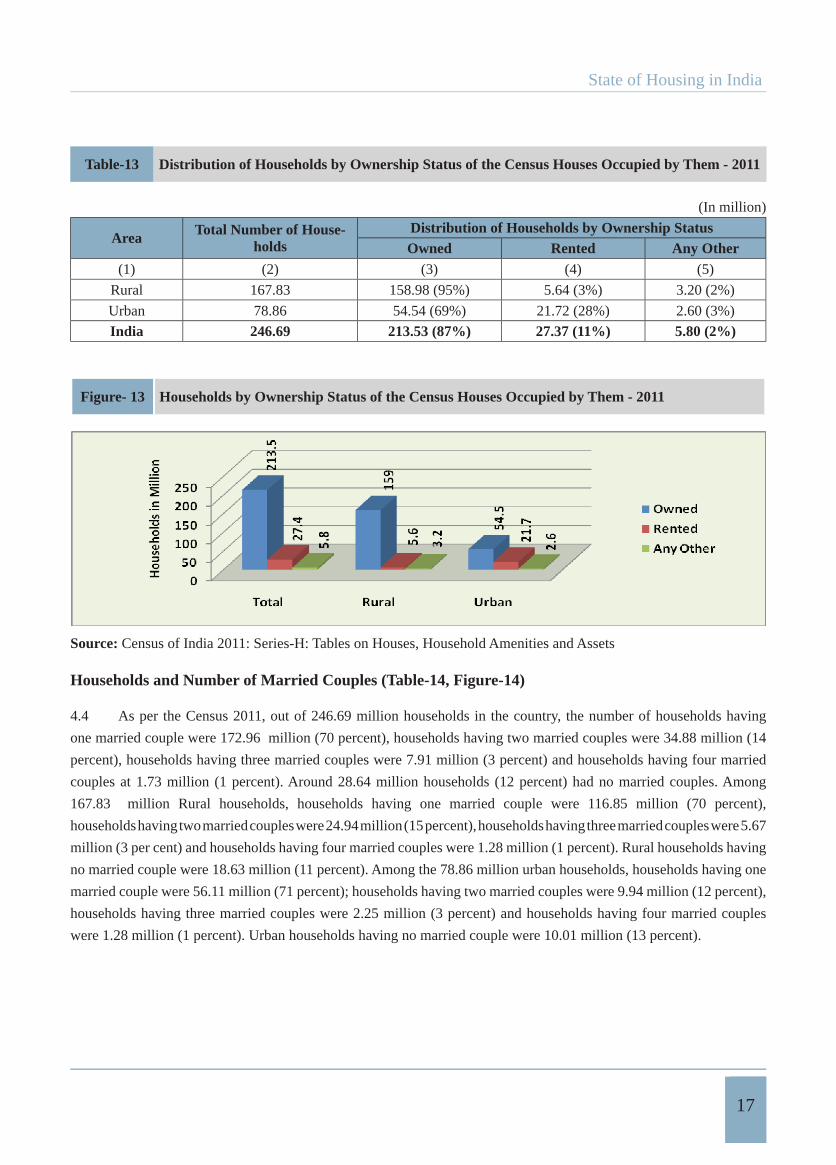
4.3 As per 2011 Census, out of total 246.69 million households in the country, households having own
dwelling units were 213.53 million (87 percent) while households living in rented accommodation numbered 27.37
million (11 percent) and households in any other accommodation were 5.80 million (2 percent). Data on tenure status of
dwelling units reveal that most of rural households were living in own dwellings i.e. 158.98 million (95 percent),
while only 5.64 million (3 percent) Rural households had rented accommodation. Households in any other Rural
accommodation numbered 3.20 million (2 percent). Among the Urban households, households living in own dwelling
units were 54.54 million (69 percent), households in rented dwellings were 21.72 million (28 percent) and households
in any other accommodation numbered 2.60 million (3 percent).
State of Housing in India
17
Table-13 Distribution of Households by Ownership Status of the Census Houses Occupied by Them - 2011
(In million)
Area Total Number of House-holds
Distribution of Households by Ownership StatusOwned Rented Any Other
(1) (2) (3) (4) (5)
Rural 167.83 158.98 (95%) 5.64 (3%) 3.20 (2%)
Urban 78.86 54.54 (69%) 21.72 (28%) 2.60 (3%)
India 246.69 213.53 (87%) 27.37 (11%) 5.80 (2%)
Figure- 13 Households by Ownership Status of the Census Houses Occupied by Them - 2011
Source: Census of India 2011: Series-H: Tables on Houses, Household Amenities and Assets
Households and Number of Married Couples (Table-14, Figure-14)
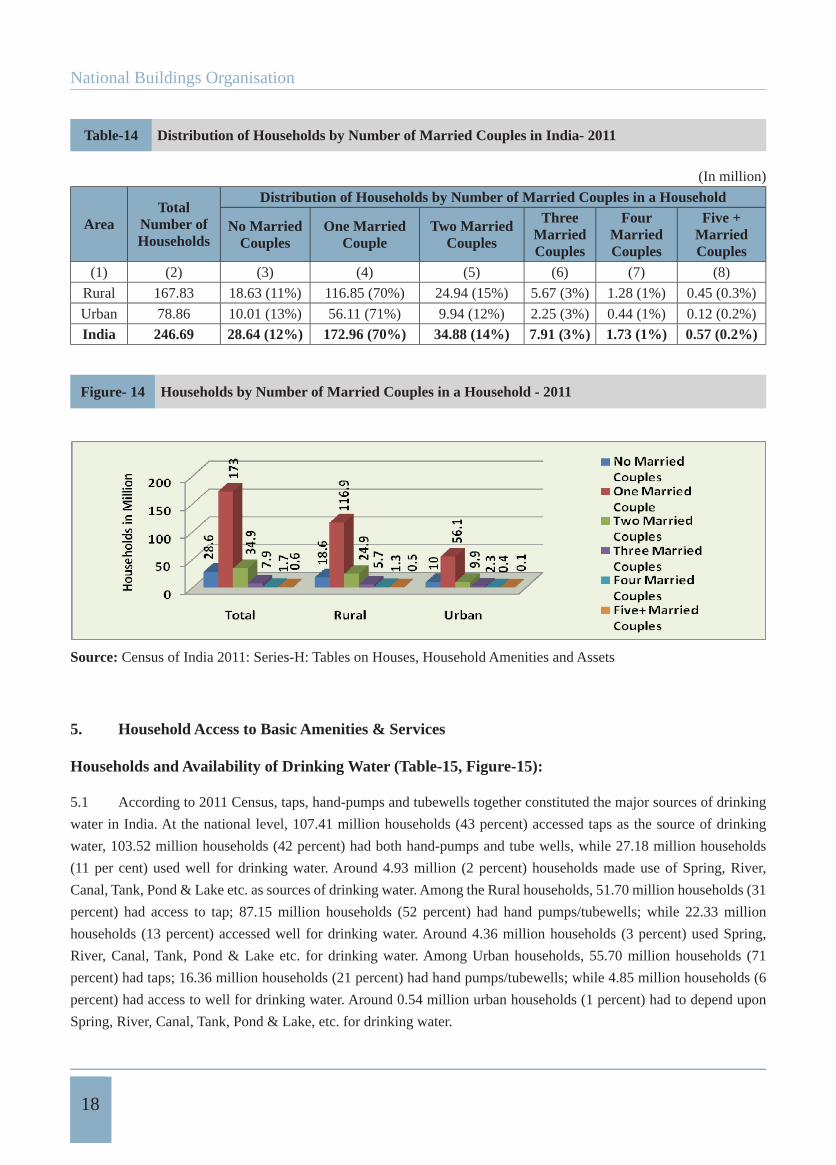
4.4 As per the Census 2011, out of 246.69 million households in the country, the number of households having
one married couple were 172.96 million (70 percent), households having two married couples were 34.88 million (14
percent), households having three married couples were 7.91 million (3 percent) and households having four married
couples at 1.73 million (1 percent). Around 28.64 million households (12 percent) had no married couples. Among
167.83 million Rural households, households having one married couple were 116.85 million (70 percent),
households having two married couples were 24.94 million (15 percent), households having three married couples were 5.67
million (3 per cent) and households having four married couples were 1.28 million (1 percent). Rural households having
no married couple were 18.63 million (11 percent). Among the 78.86 million urban households, households having one
married couple were 56.11 million (71 percent); households having two married couples were 9.94 million (12 percent),
households having three married couples were 2.25 million (3 percent) and households having four married couples
were 1.28 million (1 percent). Urban households having no married couple were 10.01 million (13 percent).
National Buildings Organisation
18
Table-14 Distribution of Households by Number of Married Couples in India- 2011
(In million)
AreaTotal
Number of Households
Distribution of Households by Number of Married Couples in a Household
No Married Couples
One Married Couple
Two Married Couples
Three MarriedCouples
Four MarriedCouples
Five + MarriedCouples
(1) (2) (3) (4) (5) (6) (7) (8)
Rural 167.83 18.63 (11%) 116.85 (70%) 24.94 (15%) 5.67 (3%) 1.28 (1%) 0.45 (0.3%)
Urban 78.86 10.01 (13%) 56.11 (71%) 9.94 (12%) 2.25 (3%) 0.44 (1%) 0.12 (0.2%)
India 246.69 28.64 (12%) 172.96 (70%) 34.88 (14%) 7.91 (3%) 1.73 (1%) 0.57 (0.2%)
Figure- 14 Households by Number of Married Couples in a Household - 2011
Source: Census of India 2011: Series-H: Tables on Houses, Household Amenities and Assets
5. Household Access to Basic Amenities & Services
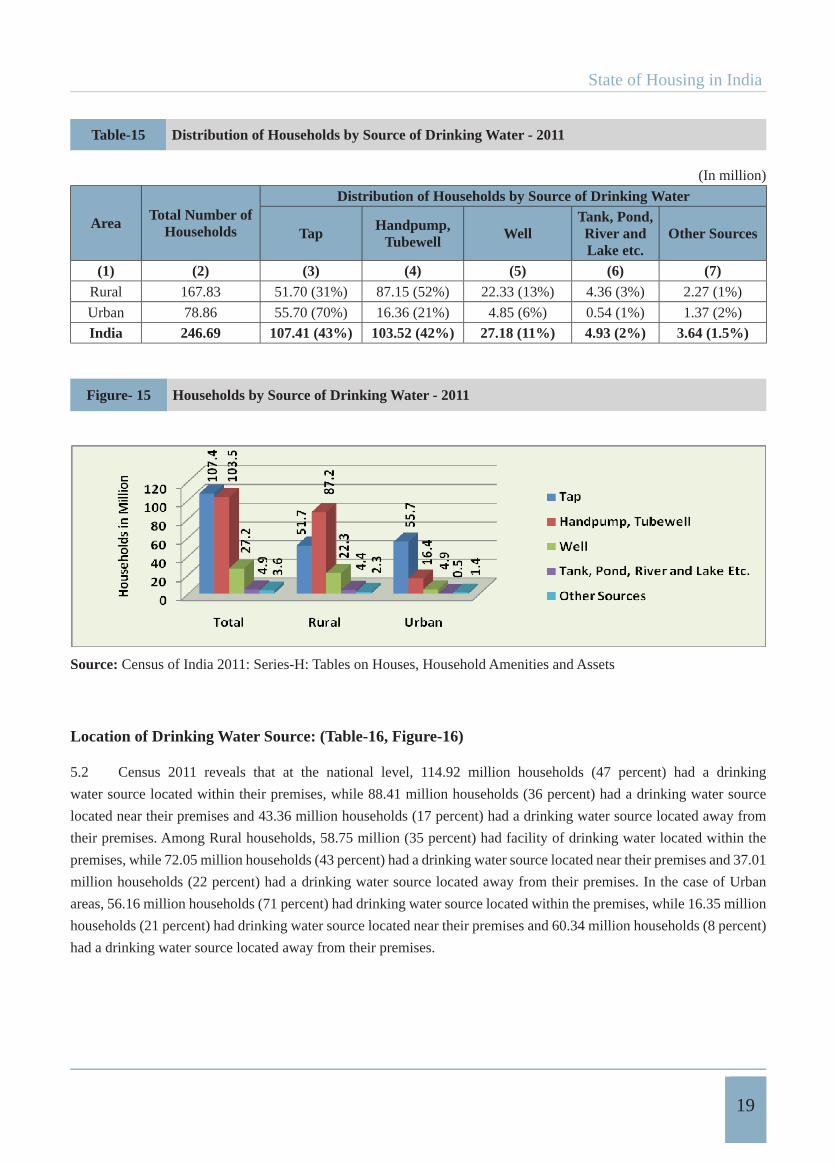
Households and Availability of Drinking Water (Table-15, Figure-15):
5.1 According to 2011 Census, taps, hand-pumps and tubewells together constituted the major sources of drinking
water in India. At the national level, 107.41 million households (43 percent) accessed taps as the source of drinking
water, 103.52 million households (42 percent) had both hand-pumps and tube wells, while 27.18 million households
(11 per cent) used well for drinking water. Around 4.93 million (2 percent) households made use of Spring, River,
Canal, Tank, Pond & Lake etc. as sources of drinking water. Among the Rural households, 51.70 million households (31
percent) had access to tap; 87.15 million households (52 percent) had hand pumps/tubewells; while 22.33 million
households (13 percent) accessed well for drinking water. Around 4.36 million households (3 percent) used Spring,
River, Canal, Tank, Pond & Lake etc. for drinking water. Among Urban households, 55.70 million households (71
percent) had taps; 16.36 million households (21 percent) had hand pumps/tubewells; while 4.85 million households (6
percent) had access to well for drinking water. Around 0.54 million urban households (1 percent) had to depend upon
Spring, River, Canal, Tank, Pond & Lake, etc. for drinking water.
State of Housing in India
19
Table-15 Distribution of Households by Source of Drinking Water - 2011
(In million)
Area Total Number of Households
Distribution of Households by Source of Drinking Water
Tap Handpump,Tubewell Well
Tank, Pond, River and Lake etc.
Other Sources
(1) (2) (3) (4) (5) (6) (7)Rural 167.83 51.70 (31%) 87.15 (52%) 22.33 (13%) 4.36 (3%) 2.27 (1%)
Urban 78.86 55.70 (70%) 16.36 (21%) 4.85 (6%) 0.54 (1%) 1.37 (2%)
India 246.69 107.41 (43%) 103.52 (42%) 27.18 (11%) 4.93 (2%) 3.64 (1.5%)
Figure- 15 Households by Source of Drinking Water - 2011
Source: Census of India 2011: Series-H: Tables on Houses, Household Amenities and Assets
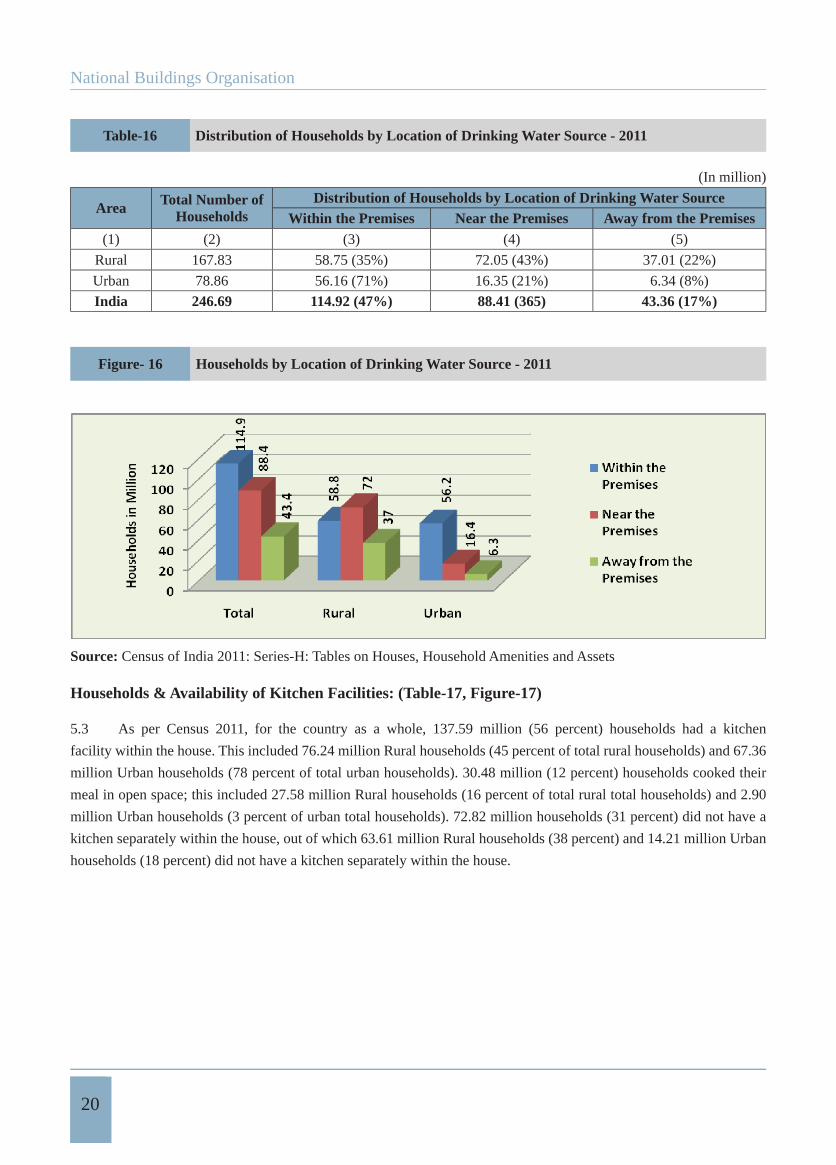
Location of Drinking Water Source: (Table-16, Figure-16)
5.2 Census 2011 reveals that at the national level, 114.92 million households (47 percent) had a drinking
water source located within their premises, while 88.41 million households (36 percent) had a drinking water source
located near their premises and 43.36 million households (17 percent) had a drinking water source located away from
their premises. Among Rural households, 58.75 million (35 percent) had facility of drinking water located within the
premises, while 72.05 million households (43 percent) had a drinking water source located near their premises and 37.01
million households (22 percent) had a drinking water source located away from their premises. In the case of Urban
areas, 56.16 million households (71 percent) had drinking water source located within the premises, while 16.35 million
households (21 percent) had drinking water source located near their premises and 60.34 million households (8 percent)
had a drinking water source located away from their premises.
National Buildings Organisation
20
Table-16 Distribution of Households by Location of Drinking Water Source - 2011
(In million)
Area Total Number of Households
Distribution of Households by Location of Drinking Water SourceWithin the Premises Near the Premises Away from the Premises
(1) (2) (3) (4) (5)
Rural 167.83 58.75 (35%) 72.05 (43%) 37.01 (22%)
Urban 78.86 56.16 (71%) 16.35 (21%) 6.34 (8%)
India 246.69 114.92 (47%) 88.41 (365) 43.36 (17%)
Figure- 16 Households by Location of Drinking Water Source - 2011
Source: Census of India 2011: Series-H: Tables on Houses, Household Amenities and Assets
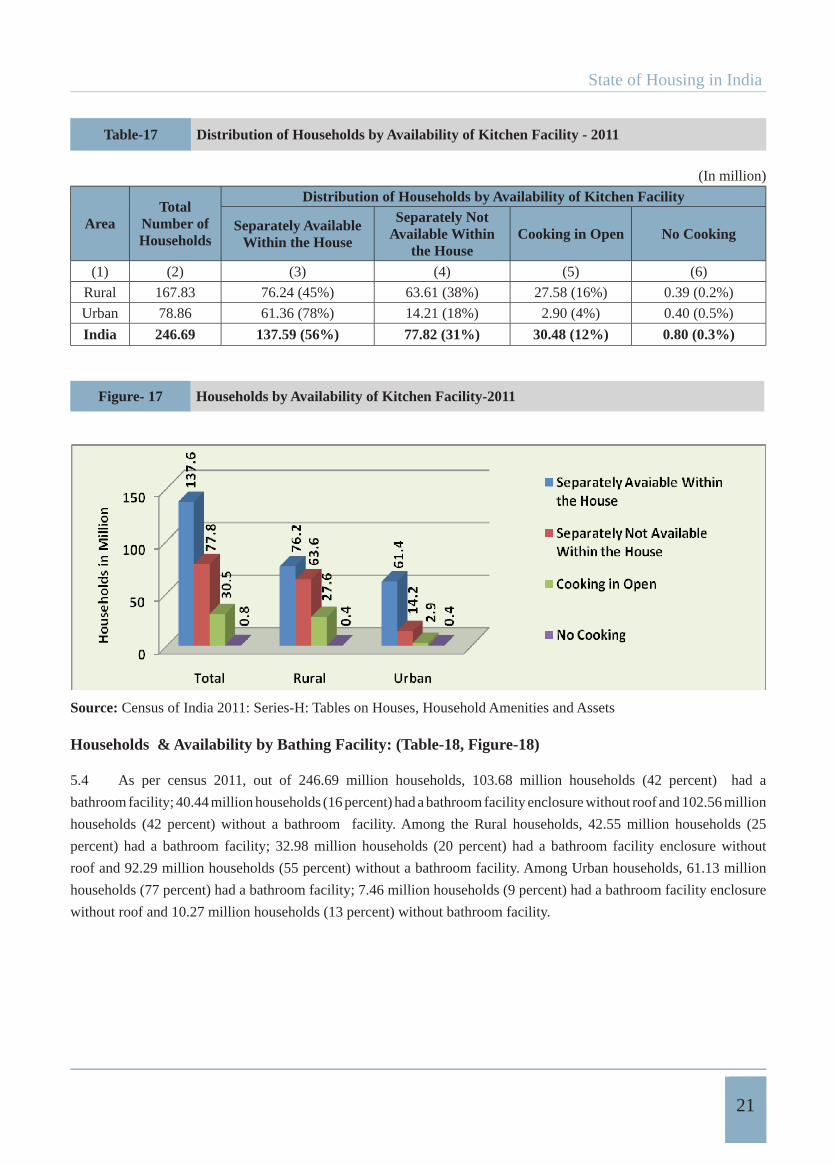
Households & Availability of Kitchen Facilities: (Table-17, Figure-17)
5.3 As per Census 2011, for the country as a whole, 137.59 million (56 percent) households had a kitchen
facility within the house. This included 76.24 million Rural households (45 percent of total rural households) and 67.36
million Urban households (78 percent of total urban households). 30.48 million (12 percent) households cooked their
meal in open space; this included 27.58 million Rural households (16 percent of total rural total households) and 2.90
million Urban households (3 percent of urban total households). 72.82 million households (31 percent) did not have a
kitchen separately within the house, out of which 63.61 million Rural households (38 percent) and 14.21 million Urban
households (18 percent) did not have a kitchen separately within the house.
State of Housing in India
21
Table-17 Distribution of Households by Availability of Kitchen Facility - 2011
(In million)
AreaTotal
Number of Households
Distribution of Households by Availability of Kitchen Facility
Separately Available Within the House
Separately Not Available Within
the HouseCooking in Open No Cooking
(1) (2) (3) (4) (5) (6)
Rural 167.83 76.24 (45%) 63.61 (38%) 27.58 (16%) 0.39 (0.2%)
Urban 78.86 61.36 (78%) 14.21 (18%) 2.90 (4%) 0.40 (0.5%)
India 246.69 137.59 (56%) 77.82 (31%) 30.48 (12%) 0.80 (0.3%)
Figure- 17 Households by Availability of Kitchen Facility-2011
Source: Census of India 2011: Series-H: Tables on Houses, Household Amenities and Assets
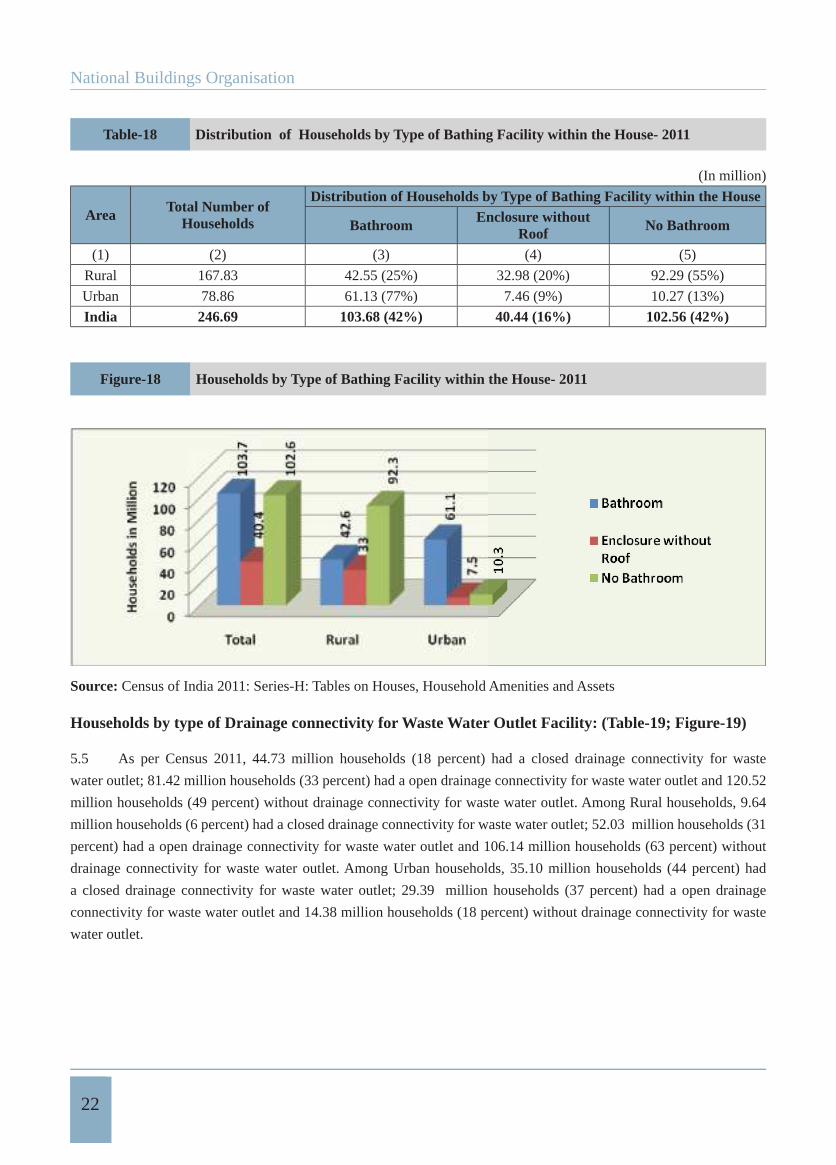
Households & Availability by Bathing Facility: (Table-18, Figure-18)
5.4 As per census 2011, out of 246.69 million households, 103.68 million households (42 percent) had a
bathroom facility; 40.44 million households (16 percent) had a bathroom facility enclosure without roof and 102.56 million
households (42 percent) without a bathroom facility. Among the Rural households, 42.55 million households (25
percent) had a bathroom facility; 32.98 million households (20 percent) had a bathroom facility enclosure without
roof and 92.29 million households (55 percent) without a bathroom facility. Among Urban households, 61.13 million
households (77 percent) had a bathroom facility; 7.46 million households (9 percent) had a bathroom facility enclosure
without roof and 10.27 million households (13 percent) without bathroom facility.
National Buildings Organisation
22
Table-18 Distribution of Households by Type of Bathing Facility within the House- 2011
(In million)
Area Total Number of Households
Distribution of Households by Type of Bathing Facility within the House
Bathroom Enclosure without Roof No Bathroom
(1) (2) (3) (4) (5)
Rural 167.83 42.55 (25%) 32.98 (20%) 92.29 (55%)
Urban 78.86 61.13 (77%) 7.46 (9%) 10.27 (13%)
India 246.69 103.68 (42%) 40.44 (16%) 102.56 (42%)
Figure-18 Households by Type of Bathing Facility within the House- 2011
Source: Census of India 2011: Series-H: Tables on Houses, Household Amenities and Assets
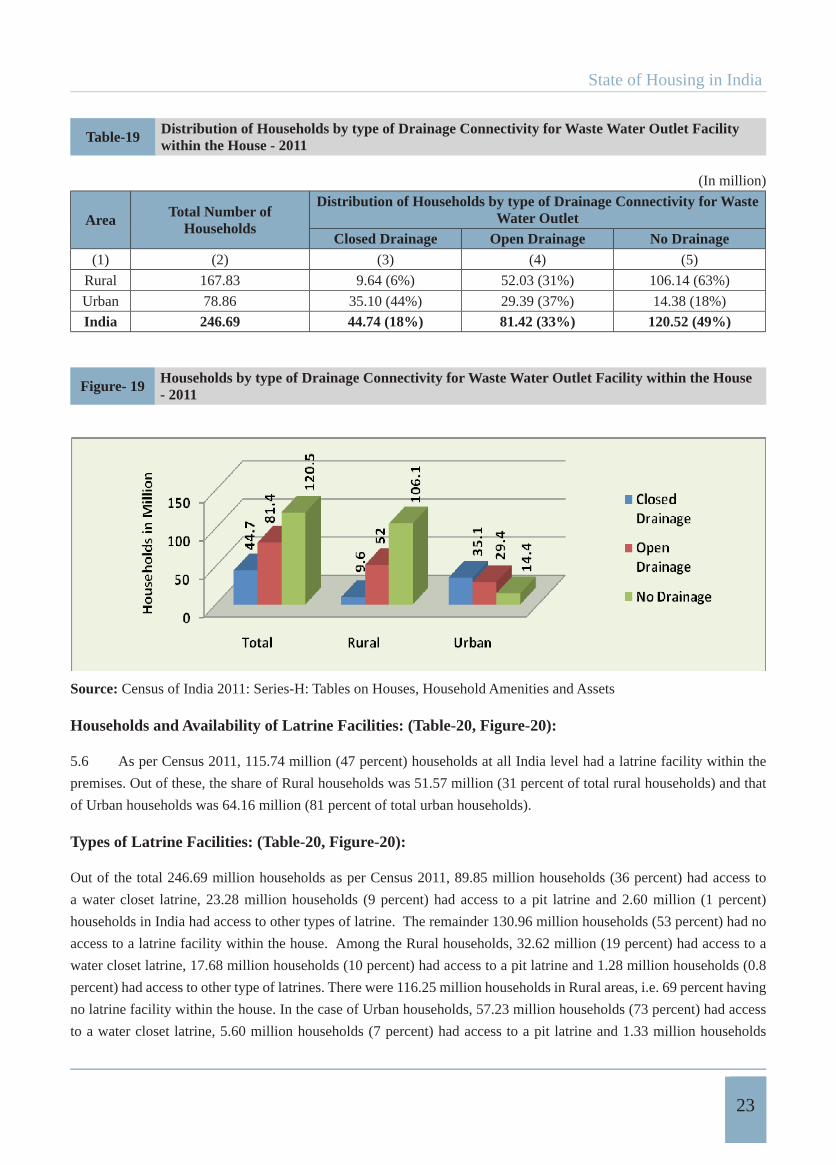
Households by type of Drainage connectivity for Waste Water Outlet Facility: (Table-19; Figure-19)
5.5 As per Census 2011, 44.73 million households (18 percent) had a closed drainage connectivity for waste
water outlet; 81.42 million households (33 percent) had a open drainage connectivity for waste water outlet and 120.52
million households (49 percent) without drainage connectivity for waste water outlet. Among Rural households, 9.64
million households (6 percent) had a closed drainage connectivity for waste water outlet; 52.03 million households (31
percent) had a open drainage connectivity for waste water outlet and 106.14 million households (63 percent) without
drainage connectivity for waste water outlet. Among Urban households, 35.10 million households (44 percent) had
a closed drainage connectivity for waste water outlet; 29.39 million households (37 percent) had a open drainage
connectivity for waste water outlet and 14.38 million households (18 percent) without drainage connectivity for waste
water outlet.
State of Housing in India
23
Table-19 Distribution of Households by type of Drainage Connectivity for Waste Water Outlet Facility within the House - 2011
(In million)
Area Total Number of Households
Distribution of Households by type of Drainage Connectivity for Waste Water Outlet
Closed Drainage Open Drainage No Drainage(1) (2) (3) (4) (5)
Rural 167.83 9.64 (6%) 52.03 (31%) 106.14 (63%)
Urban 78.86 35.10 (44%) 29.39 (37%) 14.38 (18%)
India 246.69 44.74 (18%) 81.42 (33%) 120.52 (49%)
Figure- 19 Households by type of Drainage Connectivity for Waste Water Outlet Facility within the House - 2011
Source: Census of India 2011: Series-H: Tables on Houses, Household Amenities and Assets
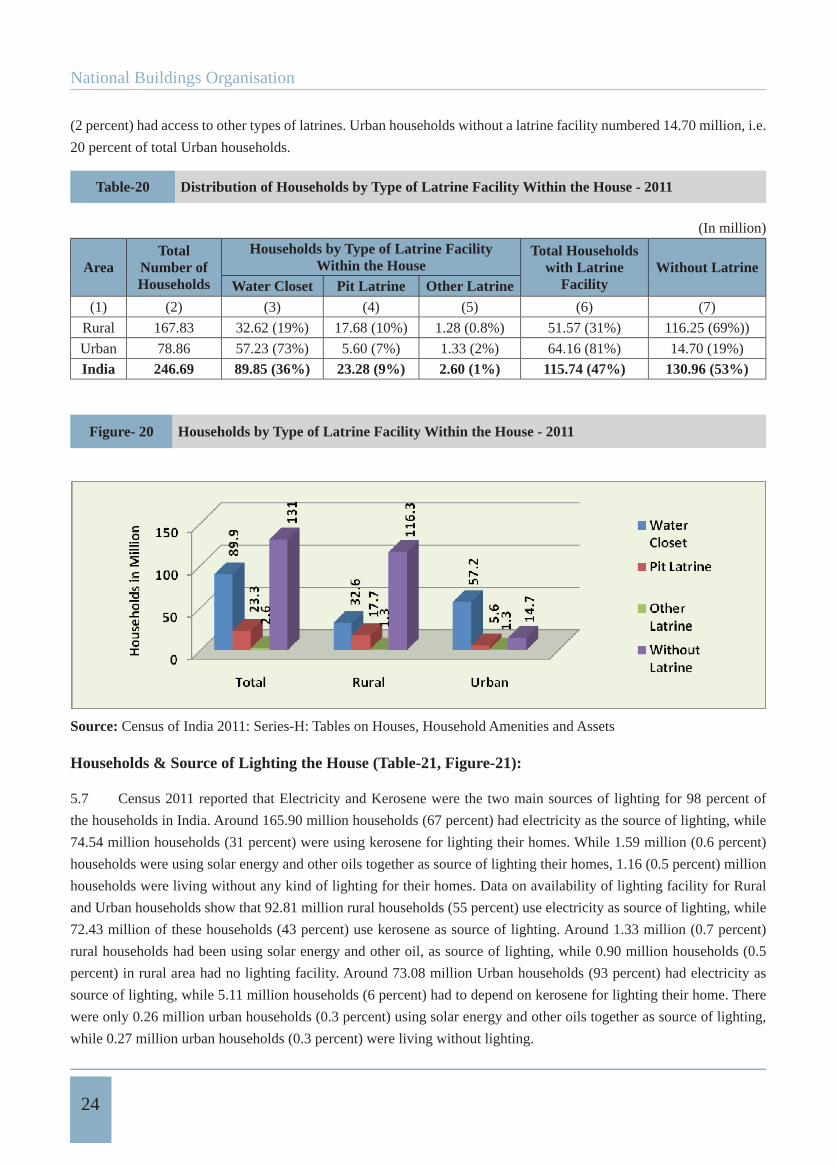
Households and Availability of Latrine Facilities: (Table-20, Figure-20):
5.6 As per Census 2011, 115.74 million (47 percent) households at all India level had a latrine facility within the
premises. Out of these, the share of Rural households was 51.57 million (31 percent of total rural households) and that
of Urban households was 64.16 million (81 percent of total urban households).
Types of Latrine Facilities: (Table-20, Figure-20):
Out of the total 246.69 million households as per Census 2011, 89.85 million households (36 percent) had access to
a water closet latrine, 23.28 million households (9 percent) had access to a pit latrine and 2.60 million (1 percent)
households in India had access to other types of latrine. The remainder 130.96 million households (53 percent) had no
access to a latrine facility within the house. Among the Rural households, 32.62 million (19 percent) had access to a
water closet latrine, 17.68 million households (10 percent) had access to a pit latrine and 1.28 million households (0.8
percent) had access to other type of latrines. There were 116.25 million households in Rural areas, i.e. 69 percent having
no latrine facility within the house. In the case of Urban households, 57.23 million households (73 percent) had access
to a water closet latrine, 5.60 million households (7 percent) had access to a pit latrine and 1.33 million households
National Buildings Organisation
24
(2 percent) had access to other types of latrines. Urban households without a latrine facility numbered 14.70 million, i.e.
20 percent of total Urban households.
Table-20 Distribution of Households by Type of Latrine Facility Within the House - 2011
(In million)
AreaTotal
Number of Households
Households by Type of Latrine Facility Within the House
Total Households with Latrine
FacilityWithout Latrine
Water Closet Pit Latrine Other Latrine(1) (2) (3) (4) (5) (6) (7)
Rural 167.83 32.62 (19%) 17.68 (10%) 1.28 (0.8%) 51.57 (31%) 116.25 (69%))
Urban 78.86 57.23 (73%) 5.60 (7%) 1.33 (2%) 64.16 (81%) 14.70 (19%)
India 246.69 89.85 (36%) 23.28 (9%) 2.60 (1%) 115.74 (47%) 130.96 (53%)
Figure- 20 Households by Type of Latrine Facility Within the House - 2011
Source: Census of India 2011: Series-H: Tables on Houses, Household Amenities and Assets
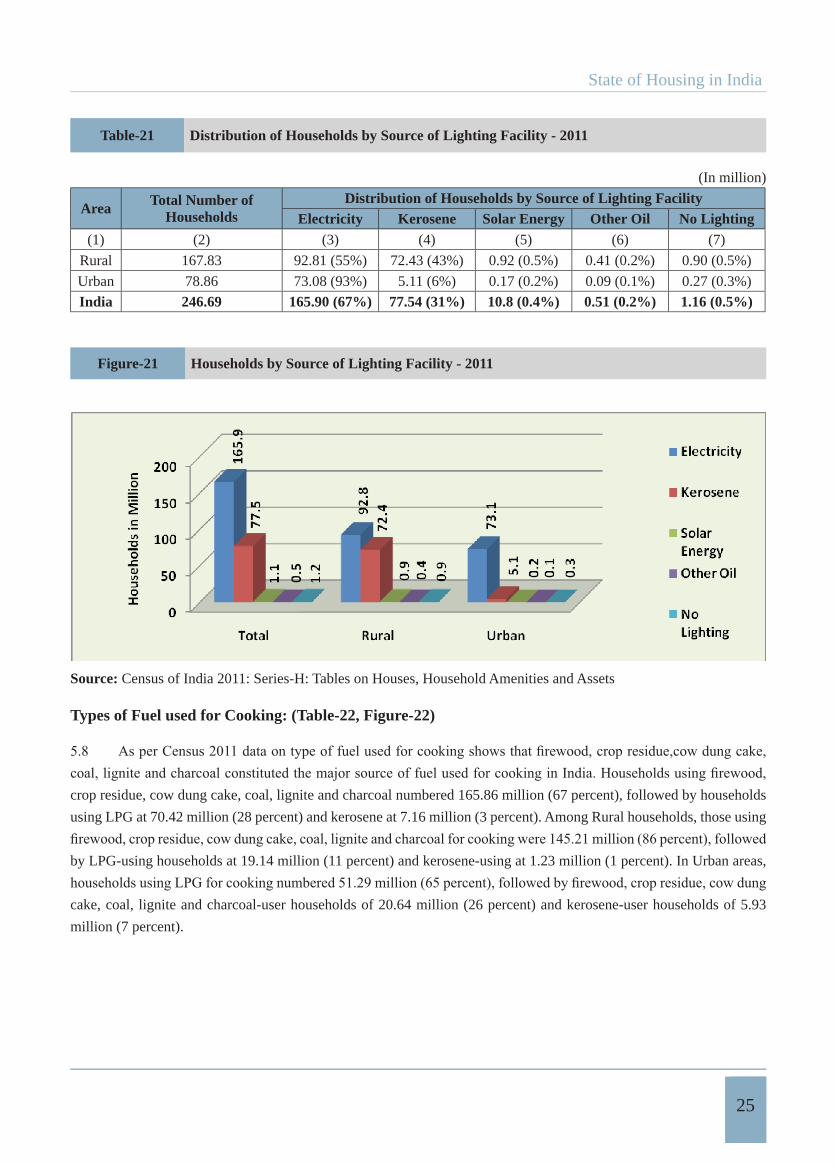
Households & Source of Lighting the House (Table-21, Figure-21):
5.7 Census 2011 reported that Electricity and Kerosene were the two main sources of lighting for 98 percent of
the households in India. Around 165.90 million households (67 percent) had electricity as the source of lighting, while
74.54 million households (31 percent) were using kerosene for lighting their homes. While 1.59 million (0.6 percent)
households were using solar energy and other oils together as source of lighting their homes, 1.16 (0.5 percent) million
households were living without any kind of lighting for their homes. Data on availability of lighting facility for Rural
and Urban households show that 92.81 million rural households (55 percent) use electricity as source of lighting, while
72.43 million of these households (43 percent) use kerosene as source of lighting. Around 1.33 million (0.7 percent)
rural households had been using solar energy and other oil, as source of lighting, while 0.90 million households (0.5
percent) in rural area had no lighting facility. Around 73.08 million Urban households (93 percent) had electricity as
source of lighting, while 5.11 million households (6 percent) had to depend on kerosene for lighting their home. There
were only 0.26 million urban households (0.3 percent) using solar energy and other oils together as source of lighting,
while 0.27 million urban households (0.3 percent) were living without lighting.
State of Housing in India
25
Table-21 Distribution of Households by Source of Lighting Facility - 2011
(In million)
Area Total Number of Households
Distribution of Households by Source of Lighting FacilityElectricity Kerosene Solar Energy Other Oil No Lighting
(1) (2) (3) (4) (5) (6) (7)
Rural 167.83 92.81 (55%) 72.43 (43%) 0.92 (0.5%) 0.41 (0.2%) 0.90 (0.5%)
Urban 78.86 73.08 (93%) 5.11 (6%) 0.17 (0.2%) 0.09 (0.1%) 0.27 (0.3%)
India 246.69 165.90 (67%) 77.54 (31%) 10.8 (0.4%) 0.51 (0.2%) 1.16 (0.5%)
Figure-21 Households by Source of Lighting Facility - 2011
Source: Census of India 2011: Series-H: Tables on Houses, Household Amenities and Assets
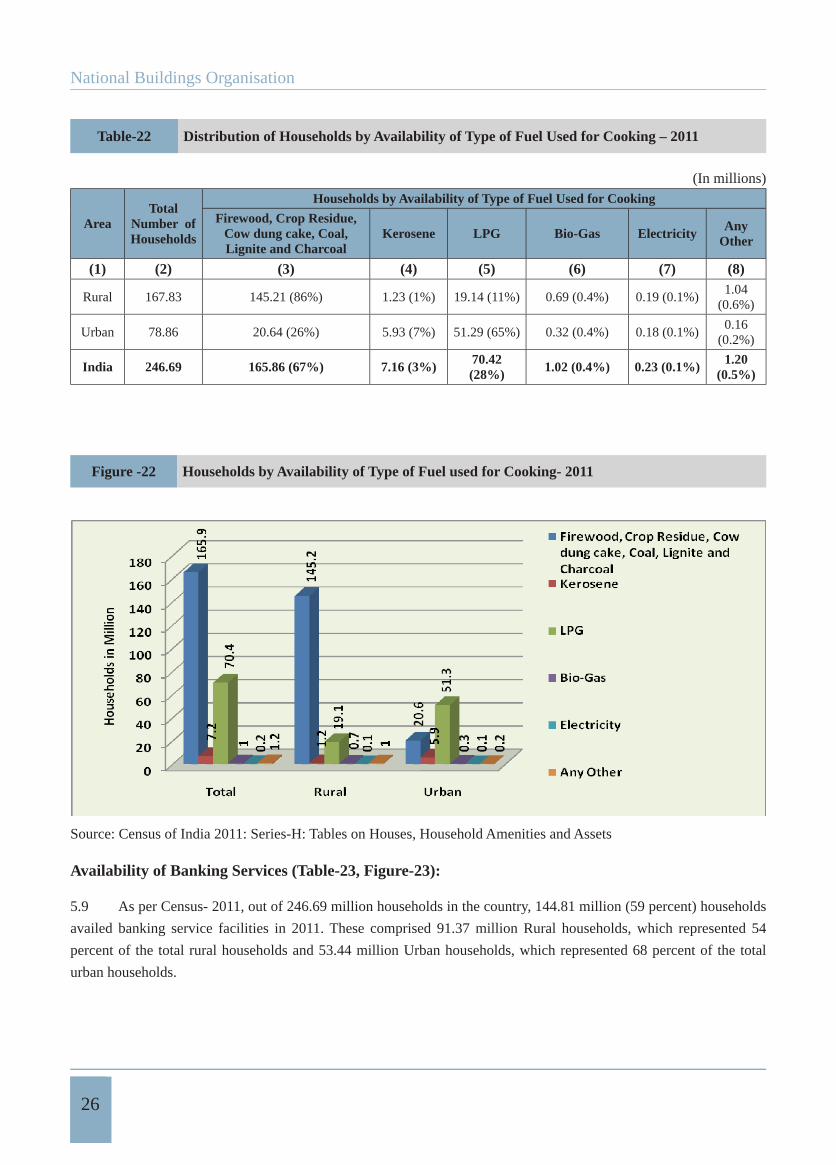
Types of Fuel used for Cooking: (Table-22, Figure-22)
crop residue, cow dung cake, coal, lignite and charcoal numbered 165.86 million (67 percent), followed by households
using LPG at 70.42 million (28 percent) and kerosene at 7.16 million (3 percent). Among Rural households, those using
by LPG-using households at 19.14 million (11 percent) and kerosene-using at 1.23 million (1 percent). In Urban areas,
cake, coal, lignite and charcoal-user households of 20.64 million (26 percent) and kerosene-user households of 5.93
million (7 percent).
National Buildings Organisation
26
Table-22 Distribution of Households by Availability of Type of Fuel Used for Cooking – 2011
(In millions)
AreaTotal
Number of Households
Households by Availability of Type of Fuel Used for Cooking
Firewood, Crop Residue, Cow dung cake, Coal, Lignite and Charcoal
Kerosene LPG Bio-Gas Electricity AnyOther
(1) (2) (3) (4) (5) (6) (7) (8)
Rural 167.83 145.21 (86%) 1.23 (1%) 19.14 (11%) 0.69 (0.4%) 0.19 (0.1%)1.04
(0.6%)
Urban 78.86 20.64 (26%) 5.93 (7%) 51.29 (65%) 0.32 (0.4%) 0.18 (0.1%)0.16
(0.2%)
India 246.69 165.86 (67%) 7.16 (3%) 70.42(28%) 1.02 (0.4%) 0.23 (0.1%) 1.20
(0.5%)
Figure -22 Households by Availability of Type of Fuel used for Cooking- 2011
Source: Census of India 2011: Series-H: Tables on Houses, Household Amenities and Assets
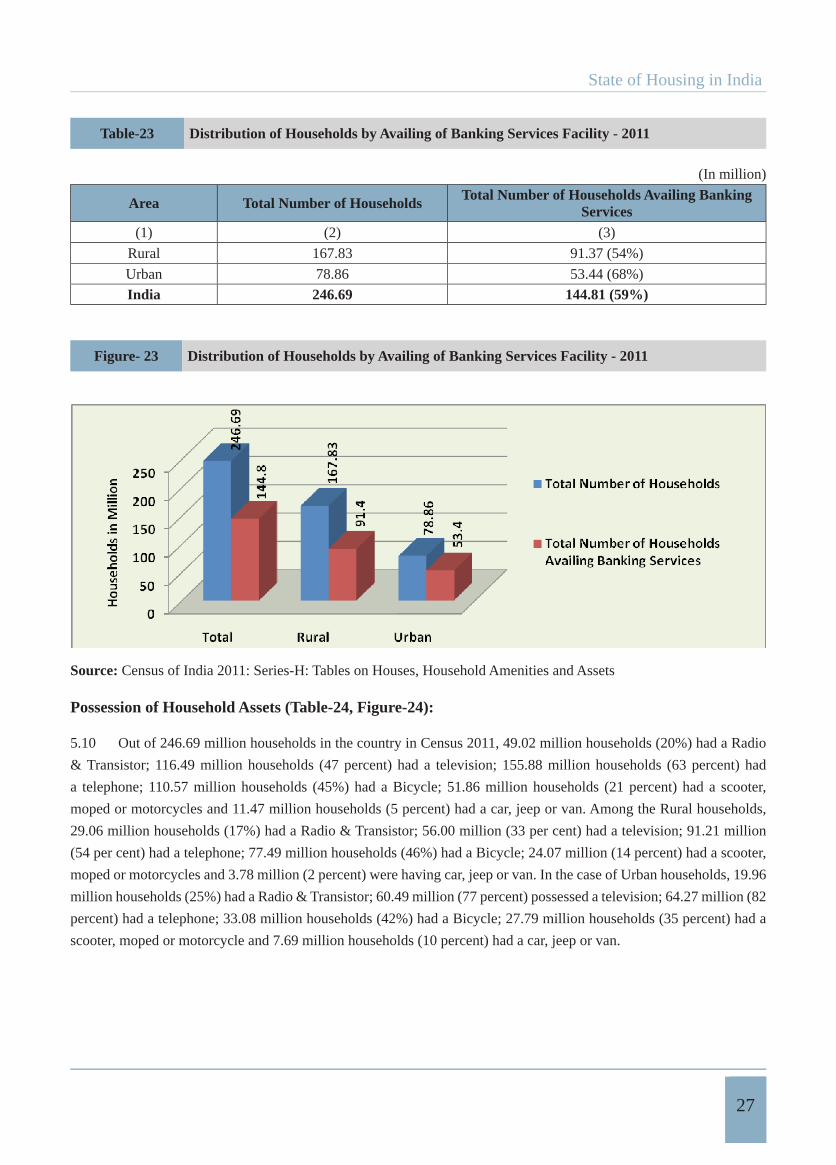
Availability of Banking Services (Table-23, Figure-23):
5.9 As per Census- 2011, out of 246.69 million households in the country, 144.81 million (59 percent) households
availed banking service facilities in 2011. These comprised 91.37 million Rural households, which represented 54
percent of the total rural households and 53.44 million Urban households, which represented 68 percent of the total
urban households.
State of Housing in India
27
Table-23 Distribution of Households by Availing of Banking Services Facility - 2011
(In million)
Area Total Number of Households Total Number of Households Availing Banking Services
(1) (2) (3)
Rural 167.83 91.37 (54%)
Urban 78.86 53.44 (68%)
India 246.69 144.81 (59%)
Figure- 23 Distribution of Households by Availing of Banking Services Facility - 2011
Source: Census of India 2011: Series-H: Tables on Houses, Household Amenities and Assets
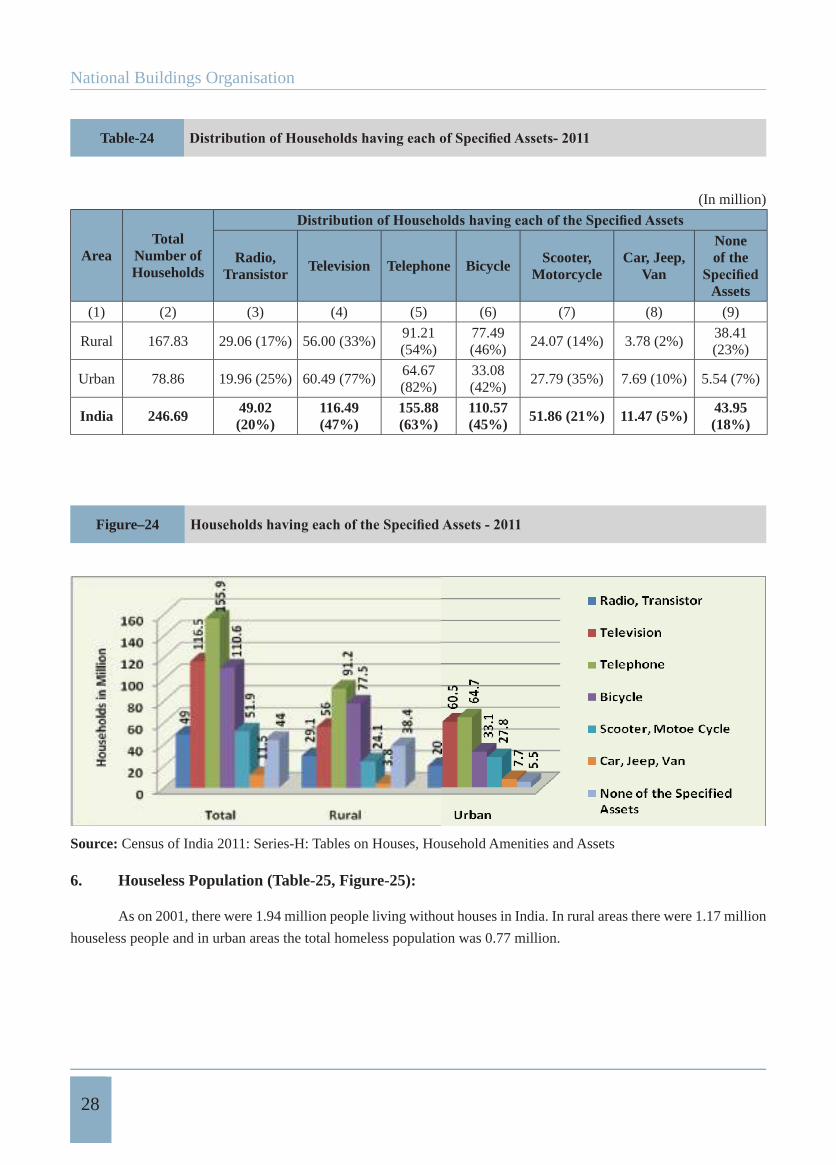
Possession of Household Assets (Table-24, Figure-24):
5.10 Out of 246.69 million households in the country in Census 2011, 49.02 million households (20%) had a Radio
& Transistor; 116.49 million households (47 percent) had a television; 155.88 million households (63 percent) had
a telephone; 110.57 million households (45%) had a Bicycle; 51.86 million households (21 percent) had a scooter,
moped or motorcycles and 11.47 million households (5 percent) had a car, jeep or van. Among the Rural households,
29.06 million households (17%) had a Radio & Transistor; 56.00 million (33 per cent) had a television; 91.21 million
(54 per cent) had a telephone; 77.49 million households (46%) had a Bicycle; 24.07 million (14 percent) had a scooter,
moped or motorcycles and 3.78 million (2 percent) were having car, jeep or van. In the case of Urban households, 19.96
million households (25%) had a Radio & Transistor; 60.49 million (77 percent) possessed a television; 64.27 million (82
percent) had a telephone; 33.08 million households (42%) had a Bicycle; 27.79 million households (35 percent) had a
scooter, moped or motorcycle and 7.69 million households (10 percent) had a car, jeep or van.
National Buildings Organisation
28
Table-24
(In million)
AreaTotal
Number of Households
Radio,Transistor Television Telephone Bicycle Scooter,
MotorcycleCar, Jeep,
Van
Noneof the
Assets(1) (2) (3) (4) (5) (6) (7) (8) (9)
Rural 167.83 29.06 (17%) 56.00 (33%)91.21(54%)
77.49(46%)
24.07 (14%) 3.78 (2%)38.41(23%)
Urban 78.86 19.96 (25%) 60.49 (77%)64.67(82%)
33.08(42%)
27.79 (35%) 7.69 (10%) 5.54 (7%)
India 246.69 49.02(20%)
116.49 (47%)
155.88(63%)
110.57 (45%) 51.86 (21%) 11.47 (5%) 43.95
(18%)
Figure–24
Source: Census of India 2011: Series-H: Tables on Houses, Household Amenities and Assets
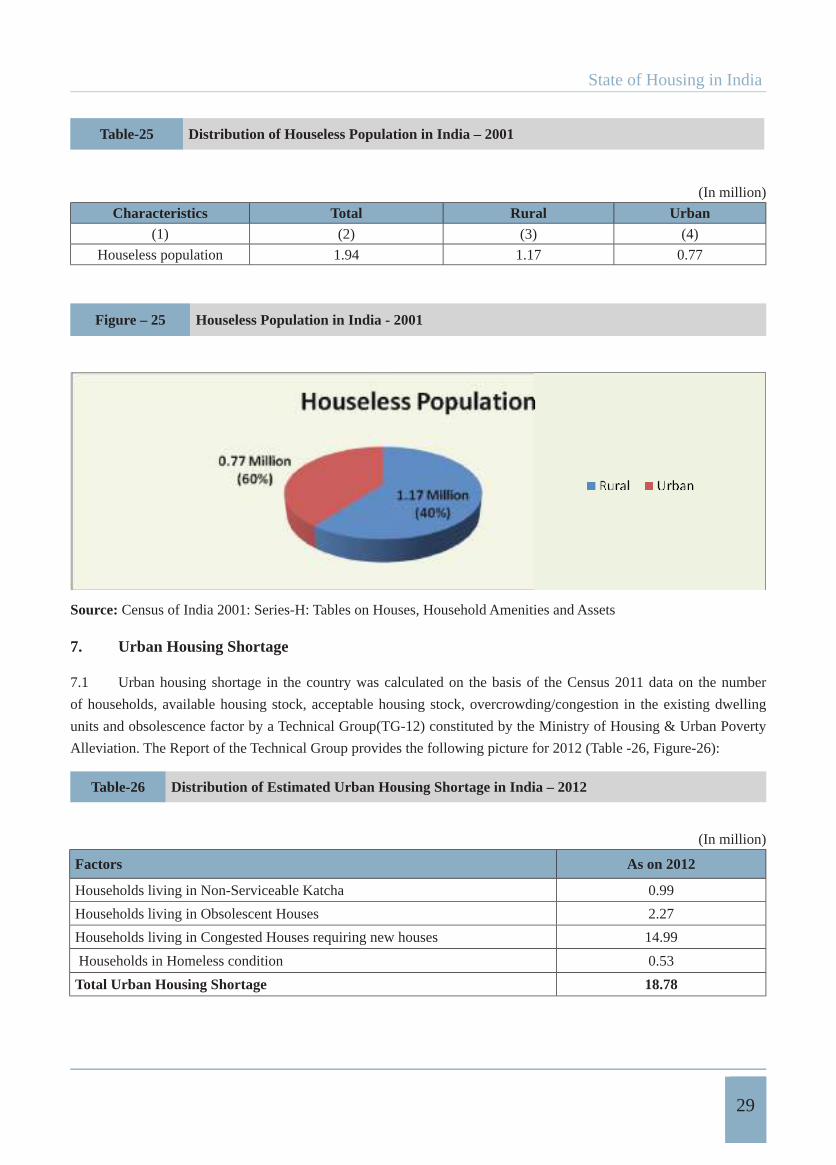
6. Houseless Population (Table-25, Figure-25):
As on 2001, there were 1.94 million people living without houses in India. In rural areas there were 1.17 million
houseless people and in urban areas the total homeless population was 0.77 million.
State of Housing in India
29
Table-25 Distribution of Houseless Population in India – 2001
(In million)
Characteristics Total Rural Urban(1) (2) (3) (4)
Houseless population 1.94 1.17 0.77
Figure – 25 Houseless Population in India - 2001
Source: Census of India 2001: Series-H: Tables on Houses, Household Amenities and Assets
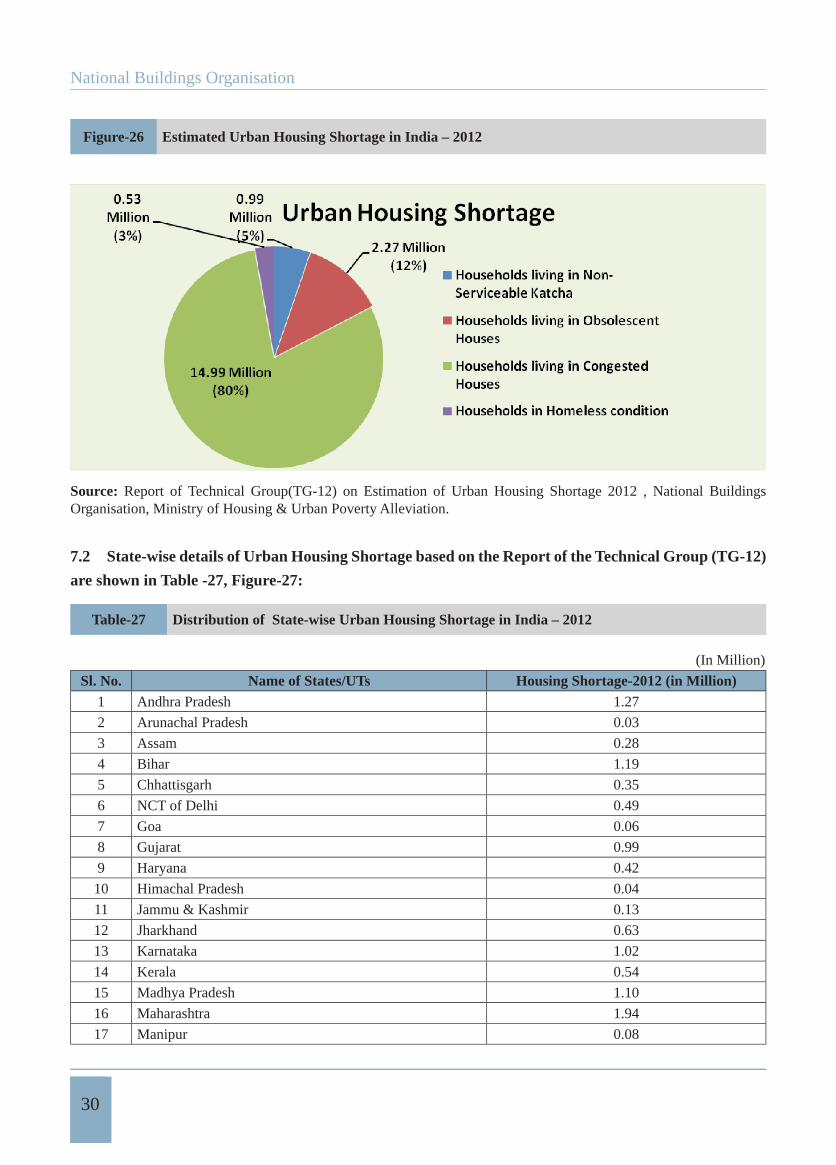
7. Urban Housing Shortage
7.1 Urban housing shortage in the country was calculated on the basis of the Census 2011 data on the number
of households, available housing stock, acceptable housing stock, overcrowding/congestion in the existing dwelling
units and obsolescence factor by a Technical Group(TG-12) constituted by the Ministry of Housing & Urban Poverty
Alleviation. The Report of the Technical Group provides the following picture for 2012 (Table -26, Figure-26):
Table-26 Distribution of Estimated Urban Housing Shortage in India – 2012
(In million)
Factors As on 2012
Households living in Non-Serviceable Katcha 0.99
Households living in Obsolescent Houses 2.27
Households living in Congested Houses requiring new houses 14.99
Households in Homeless condition 0.53
Total Urban Housing Shortage 18.78
National Buildings Organisation
30
Figure-26 Estimated Urban Housing Shortage in India – 2012
Source: Report of Technical Group(TG-12) on Estimation of Urban Housing Shortage 2012 , National Buildings Organisation, Ministry of Housing & Urban Poverty Alleviation.
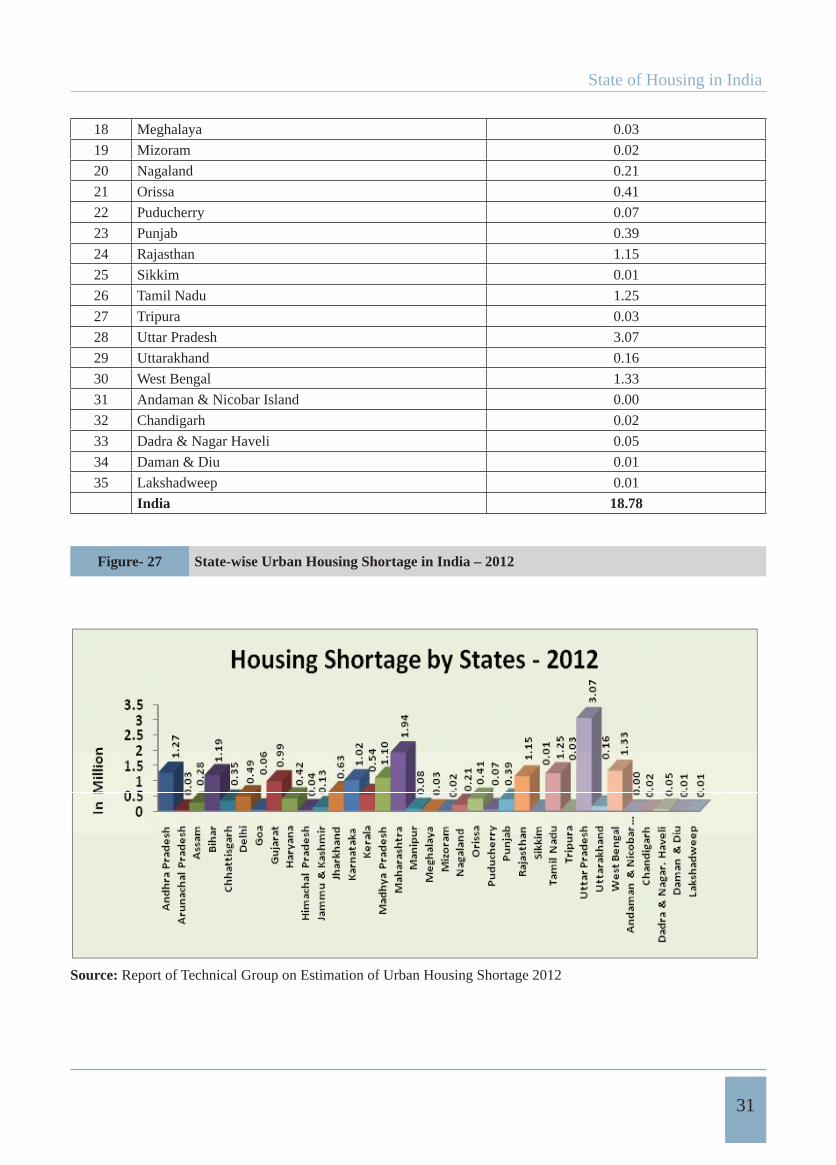
7.2 State-wise details of Urban Housing Shortage based on the Report of the Technical Group (TG-12)
are shown in Table -27, Figure-27:
Table-27 Distribution of State-wise Urban Housing Shortage in India – 2012
(In Million)
Sl. No. Name of States/UTs Housing Shortage-2012 (in Million)1 Andhra Pradesh 1.27
2 Arunachal Pradesh 0.03
3 Assam 0.28
4 Bihar 1.19
5 Chhattisgarh 0.35
6 NCT of Delhi 0.49
7 Goa 0.06
8 Gujarat 0.99
9 Haryana 0.42
10 Himachal Pradesh 0.04
11 Jammu & Kashmir 0.13
12 Jharkhand 0.63
13 Karnataka 1.02
14 Kerala 0.54
15 Madhya Pradesh 1.10
16 Maharashtra 1.94
17 Manipur 0.08
State of Housing in India
31
18 Meghalaya 0.03
19 Mizoram 0.02
20 Nagaland 0.21
21 Orissa 0.41
22 Puducherry 0.07
23 Punjab 0.39
24 Rajasthan 1.15
25 Sikkim 0.01
26 Tamil Nadu 1.25
27 Tripura 0.03
28 Uttar Pradesh 3.07
29 Uttarakhand 0.16
30 West Bengal 1.33
31 Andaman & Nicobar Island 0.00
32 Chandigarh 0.02
33 Dadra & Nagar Haveli 0.05
34 Daman & Diu 0.01
35 Lakshadweep 0.01
India 18.78
Figure- 27 State-wise Urban Housing Shortage in India – 2012
Source: Report of Technical Group on Estimation of Urban Housing Shortage 2012
National Buildings Organisation
32
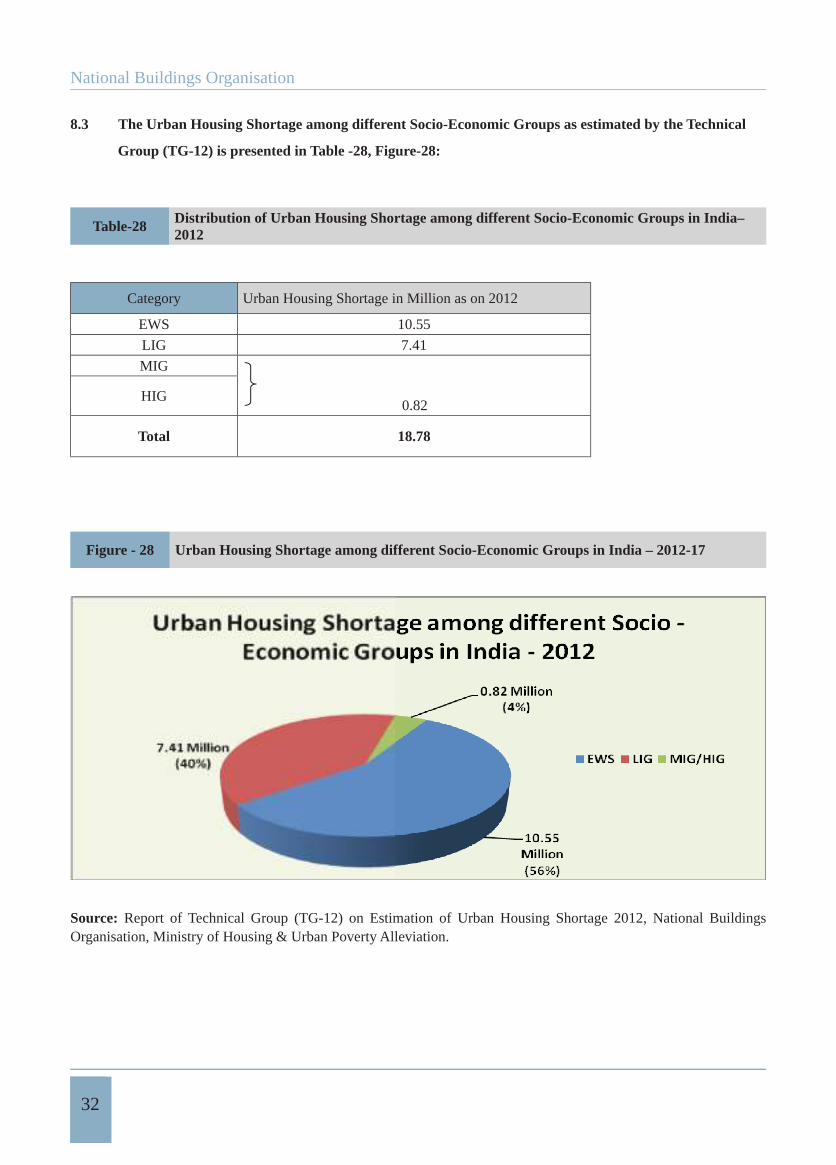
8.3 The Urban Housing Shortage among different Socio-Economic Groups as estimated by the Technical
Group (TG-12) is presented in Table -28, Figure-28:
Table-28 Distribution of Urban Housing Shortage among different Socio-Economic Groups in India– 2012
Category Urban Housing Shortage in Million as on 2012
EWS 10.55
LIG 7.41
MIG
0.82HIG
Total 18.78
Figure - 28 Urban Housing Shortage among different Socio-Economic Groups in India – 2012-17
Source: Report of Technical Group (TG-12) on Estimation of Urban Housing Shortage 2012, National Buildings Organisation, Ministry of Housing & Urban Poverty Alleviation.
State of Housing in India
33
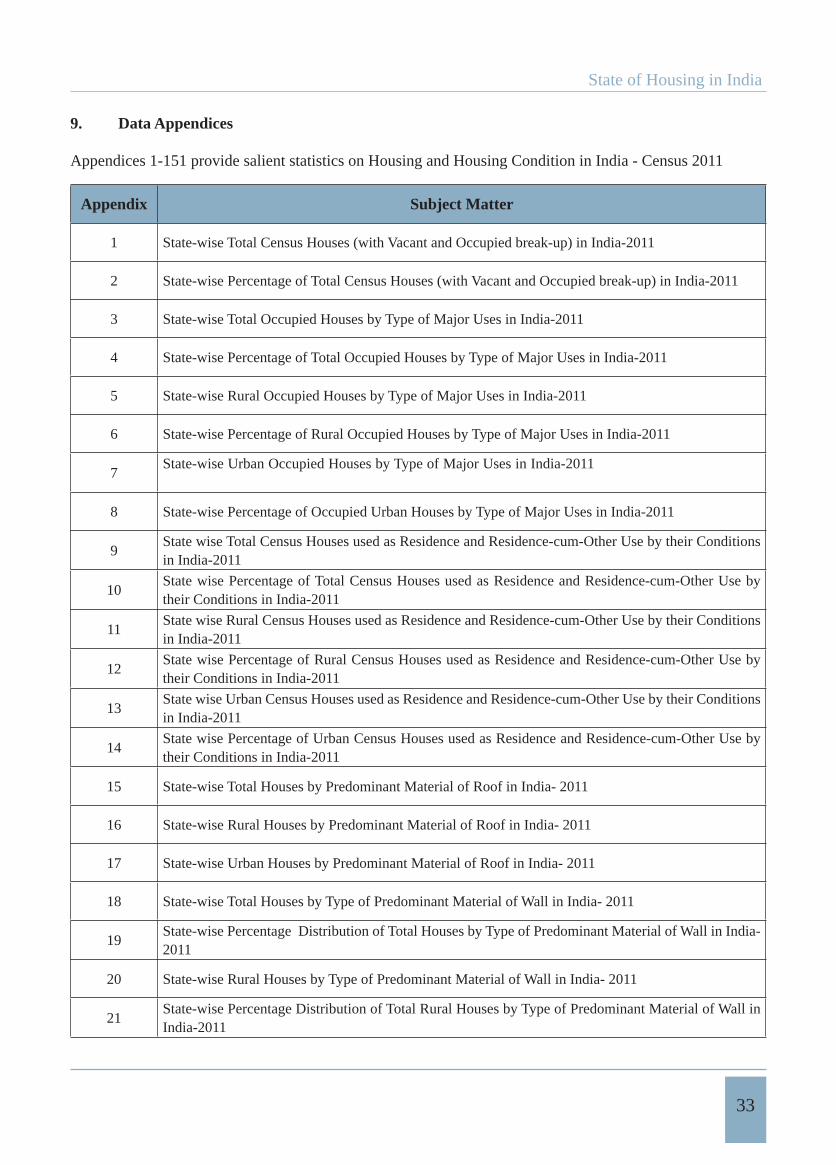
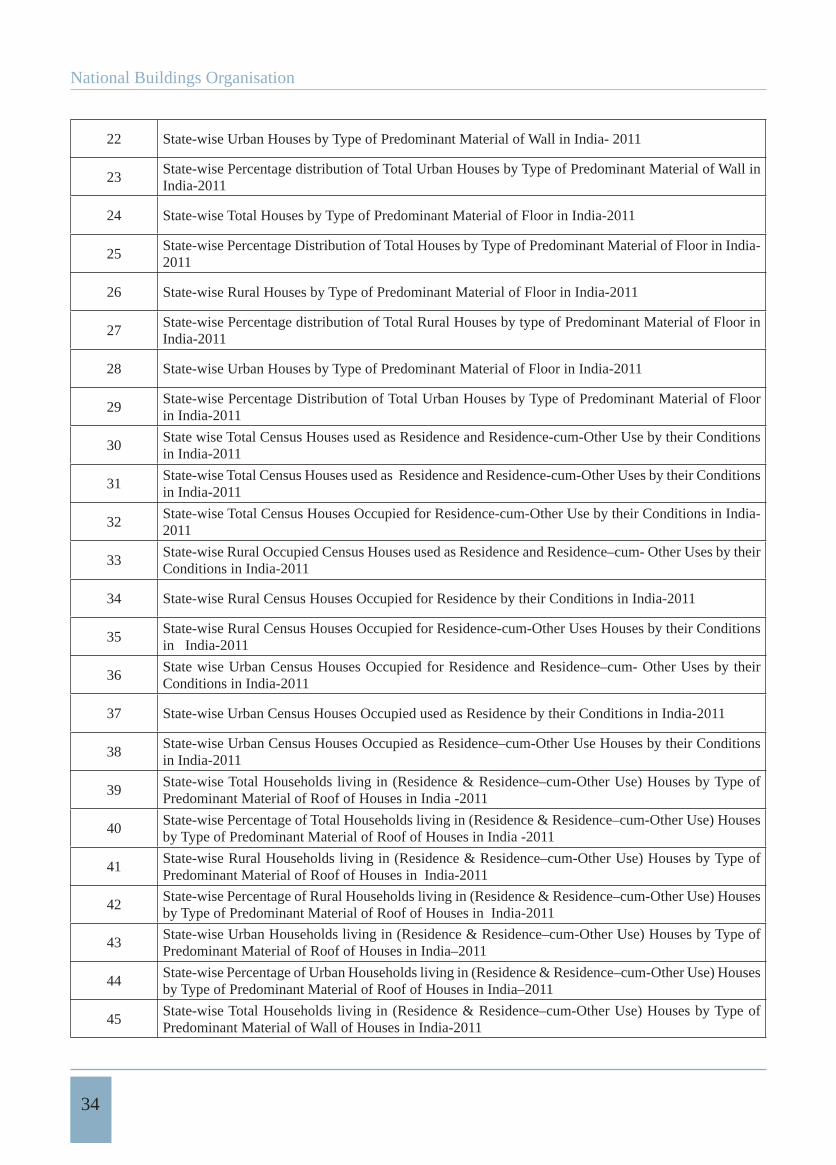
9. Data Appendices
Appendices 1-151 provide salient statistics on Housing and Housing Condition in India - Census 2011
Appendix Subject Matter
1 State-wise Total Census Houses (with Vacant and Occupied break-up) in India-2011
2 State-wise Percentage of Total Census Houses (with Vacant and Occupied break-up) in India-2011
3 State-wise Total Occupied Houses by Type of Major Uses in India-2011
4 State-wise Percentage of Total Occupied Houses by Type of Major Uses in India-2011
5 State-wise Rural Occupied Houses by Type of Major Uses in India-2011
6 State-wise Percentage of Rural Occupied Houses by Type of Major Uses in India-2011
7State-wise Urban Occupied Houses by Type of Major Uses in India-2011tec Houses by type of major Uses in India-2001
8 State-wise Percentage of Occupied Urban Houses by Type of Major Uses in India-2011
9State wise Total Census Houses used as Residence and Residence-cum-Other Use by their Conditions in India-2011
10State wise Percentage of Total Census Houses used as Residence and Residence-cum-Other Use by their Conditions in India-2011
11State wise Rural Census Houses used as Residence and Residence-cum-Other Use by their Conditions in India-2011
12State wise Percentage of Rural Census Houses used as Residence and Residence-cum-Other Use by their Conditions in India-2011
13State wise Urban Census Houses used as Residence and Residence-cum-Other Use by their Conditions in India-2011
14State wise Percentage of Urban Census Houses used as Residence and Residence-cum-Other Use by their Conditions in India-2011
15 State-wise Total Houses by Predominant Material of Roof in India- 2011
16 State-wise Rural Houses by Predominant Material of Roof in India- 2011
17 State-wise Urban Houses by Predominant Material of Roof in India- 2011
18 State-wise Total Houses by Type of Predominant Material of Wall in India- 2011
19State-wise Percentage Distribution of Total Houses by Type of Predominant Material of Wall in India-2011
20 State-wise Rural Houses by Type of Predominant Material of Wall in India- 2011
21State-wise Percentage Distribution of Total Rural Houses by Type of Predominant Material of Wall in India-2011
National Buildings Organisation
34
22 State-wise Urban Houses by Type of Predominant Material of Wall in India- 2011
23State-wise Percentage distribution of Total Urban Houses by Type of Predominant Material of Wall in India-2011
24 State-wise Total Houses by Type of Predominant Material of Floor in India-2011
25State-wise Percentage Distribution of Total Houses by Type of Predominant Material of Floor in India-2011
26 State-wise Rural Houses by Type of Predominant Material of Floor in India-2011
27State-wise Percentage distribution of Total Rural Houses by type of Predominant Material of Floor in India-2011
28 State-wise Urban Houses by Type of Predominant Material of Floor in India-2011
29State-wise Percentage Distribution of Total Urban Houses by Type of Predominant Material of Floor in India-2011
30State wise Total Census Houses used as Residence and Residence-cum-Other Use by their Conditions in India-2011
31State-wise Total Census Houses used as Residence and Residence-cum-Other Uses by their Conditions in India-2011
32State-wise Total Census Houses Occupied for Residence-cum-Other Use by their Conditions in India-2011
33State-wise Rural Occupied Census Houses used as Residence and Residence–cum- Other Uses by their Conditions in India-2011
34 State-wise Rural Census Houses Occupied for Residence by their Conditions in India-2011
35State-wise Rural Census Houses Occupied for Residence-cum-Other Uses Houses by their Conditions in India-2011
36State wise Urban Census Houses Occupied for Residence and Residence–cum- Other Uses by their Conditions in India-2011
37 State-wise Urban Census Houses Occupied used as Residence by their Conditions in India-2011
38State-wise Urban Census Houses Occupied as Residence–cum-Other Use Houses by their Conditions in India-2011
39State-wise Total Households living in (Residence & Residence–cum-Other Use) Houses by Type of Predominant Material of Roof of Houses in India -2011
40State-wise Percentage of Total Households living in (Residence & Residence–cum-Other Use) Houses by Type of Predominant Material of Roof of Houses in India -2011
41State-wise Rural Households living in (Residence & Residence–cum-Other Use) Houses by Type of Predominant Material of Roof of Houses in India-2011
42State-wise Percentage of Rural Households living in (Residence & Residence–cum-Other Use) Houses by Type of Predominant Material of Roof of Houses in India-2011
43State-wise Urban Households living in (Residence & Residence–cum-Other Use) Houses by Type of Predominant Material of Roof of Houses in India–2011
44State-wise Percentage of Urban Households living in (Residence & Residence–cum-Other Use) Houses by Type of Predominant Material of Roof of Houses in India–2011
45State-wise Total Households living in (Residence & Residence–cum-Other Use) Houses by Type of Predominant Material of Wall of Houses in India-2011
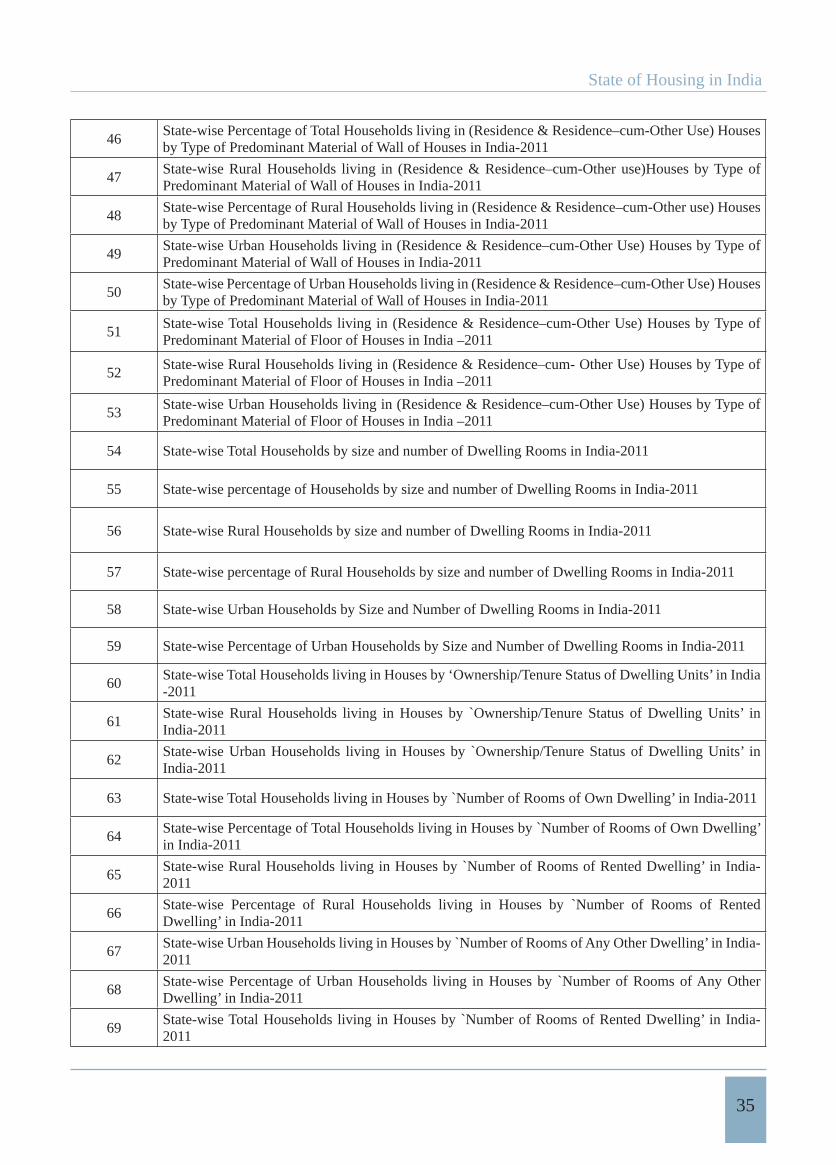
State of Housing in India
35
46State-wise Percentage of Total Households living in (Residence & Residence–cum-Other Use) Houses by Type of Predominant Material of Wall of Houses in India-2011R
47State-wise Rural Households living in (Residence & Residence–cum-Other use)Houses by Type of Predominant Material of Wall of Houses in India-2011
48State-wise Percentage of Rural Households living in (Residence & Residence–cum-Other use) Houses by Type of Predominant Material of Wall of Houses in India-2011
49State-wise Urban Households living in (Residence & Residence–cum-Other Use) Houses by Type of Predominant Material of Wall of Houses in India-2011
50State-wise Percentage of Urban Households living in (Residence & Residence–cum-Other Use) Houses by Type of Predominant Material of Wall of Houses in India-2011
51State-wise Total Households living in (Residence & Residence–cum-Other Use) Houses by Type of Predominant Material of Floor of Houses in India –2011
52State-wise Rural Households living in (Residence & Residence–cum- Other Use) Houses by Type of Predominant Material of Floor of Houses in India –2011
53State-wise Urban Households living in (Residence & Residence–cum-Other Use) Houses by Type of Predominant Material of Floor of Houses in India –2011
54 State-wise Total Households by size and number of Dwelling Rooms in India-2011
55 State-wise percentage of Households by size and number of Dwelling Rooms in India-2011
56 State-wise Rural Households by size and number of Dwelling Rooms in India-2011
57 State-wise percentage of Rural Households by size and number of Dwelling Rooms in India-2011
58 State-wise Urban Households by Size and Number of Dwelling Rooms in India-2011
59 State-wise Percentage of Urban Households by Size and Number of Dwelling Rooms in India-2011
60State-wise Total Households living in Houses by ‘Ownership/Tenure Status of Dwelling Units’ in India -2011
61State-wise Rural Households living in Houses by `Ownership/Tenure Status of Dwelling Units’ in India-2011
62State-wise Urban Households living in Houses by `Ownership/Tenure Status of Dwelling Units’ in India-2011
63 State-wise Total Households living in Houses by `Number of Rooms of Own Dwelling’ in India-2011
64State-wise Percentage of Total Households living in Houses by `Number of Rooms of Own Dwelling’ in India-2011
65State-wise Rural Households living in Houses by `Number of Rooms of Rented Dwelling’ in India-2011
66State-wise Percentage of Rural Households living in Houses by `Number of Rooms of Rented Dwelling’ in India-2011
67State-wise Urban Households living in Houses by `Number of Rooms of Any Other Dwelling’ in India-2011
68State-wise Percentage of Urban Households living in Houses by `Number of Rooms of Any Other Dwelling’ in India-2011
69State-wise Total Households living in Houses by `Number of Rooms of Rented Dwelling’ in India-2011
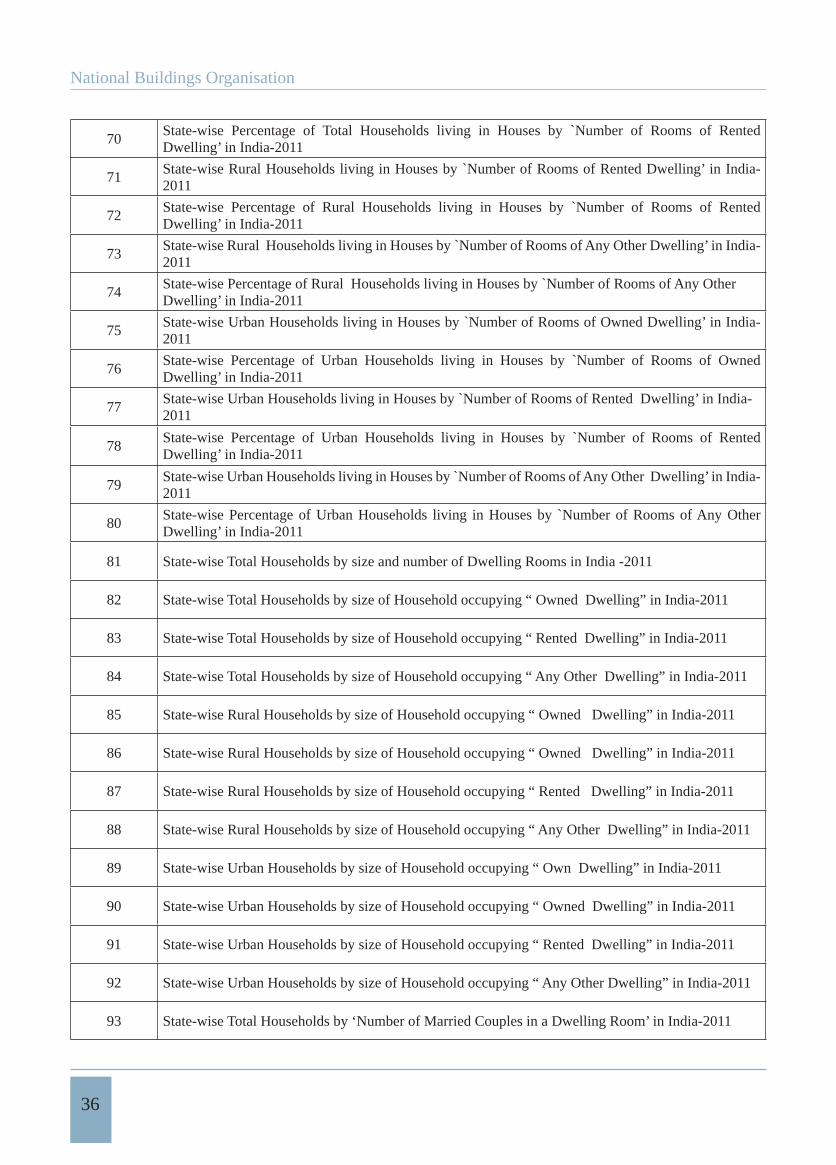
National Buildings Organisation
36
70State-wise Percentage of Total Households living in Houses by `Number of Rooms of Rented Dwelling’ in India-2011
71State-wise Rural Households living in Houses by `Number of Rooms of Rented Dwelling’ in India-2011
72State-wise Percentage of Rural Households living in Houses by `Number of Rooms of Rented Dwelling’ in India-2011
73State-wise Rural Households living in Houses by `Number of Rooms of Any Other Dwelling’ in India-2011
74State-wise Percentage of Rural Households living in Houses by `Number of Rooms of Any Other Dwelling’ in India-2011
75State-wise Urban Households living in Houses by `Number of Rooms of Owned Dwelling’ in India-2011
76State-wise Percentage of Urban Households living in Houses by `Number of Rooms of Owned Dwelling’ in India-2011
77State-wise Urban Households living in Houses by `Number of Rooms of Rented Dwelling’ in India-2011
78State-wise Percentage of Urban Households living in Houses by `Number of Rooms of Rented Dwelling’ in India-2011
79State-wise Urban Households living in Houses by ̀ Number of Rooms of Any Other Dwelling’ in India-2011
80State-wise Percentage of Urban Households living in Houses by `Number of Rooms of Any Other Dwelling’ in India-2011
81 State-wise Total Households by size and number of Dwelling Rooms in India -2011
82 State-wise Total Households by size of Household occupying “ Owned Dwelling” in India-2011
83 State-wise Total Households by size of Household occupying “ Rented Dwelling” in India-2011
84 State-wise Total Households by size of Household occupying “ Any Other Dwelling” in India-2011
85 State-wise Rural Households by size of Household occupying “ Owned Dwelling” in India-2011
86 State-wise Rural Households by size of Household occupying “ Owned Dwelling” in India-2011
87 State-wise Rural Households by size of Household occupying “ Rented Dwelling” in India-2011
88 State-wise Rural Households by size of Household occupying “ Any Other Dwelling” in India-2011
89 State-wise Urban Households by size of Household occupying “ Own Dwelling” in India-2011
90 State-wise Urban Households by size of Household occupying “ Owned Dwelling” in India-2011
91 State-wise Urban Households by size of Household occupying “ Rented Dwelling” in India-2011
92 State-wise Urban Households by size of Household occupying “ Any Other Dwelling” in India-2011
93 State-wise Total Households by ‘Number of Married Couples in a Dwelling Room’ in India-2011
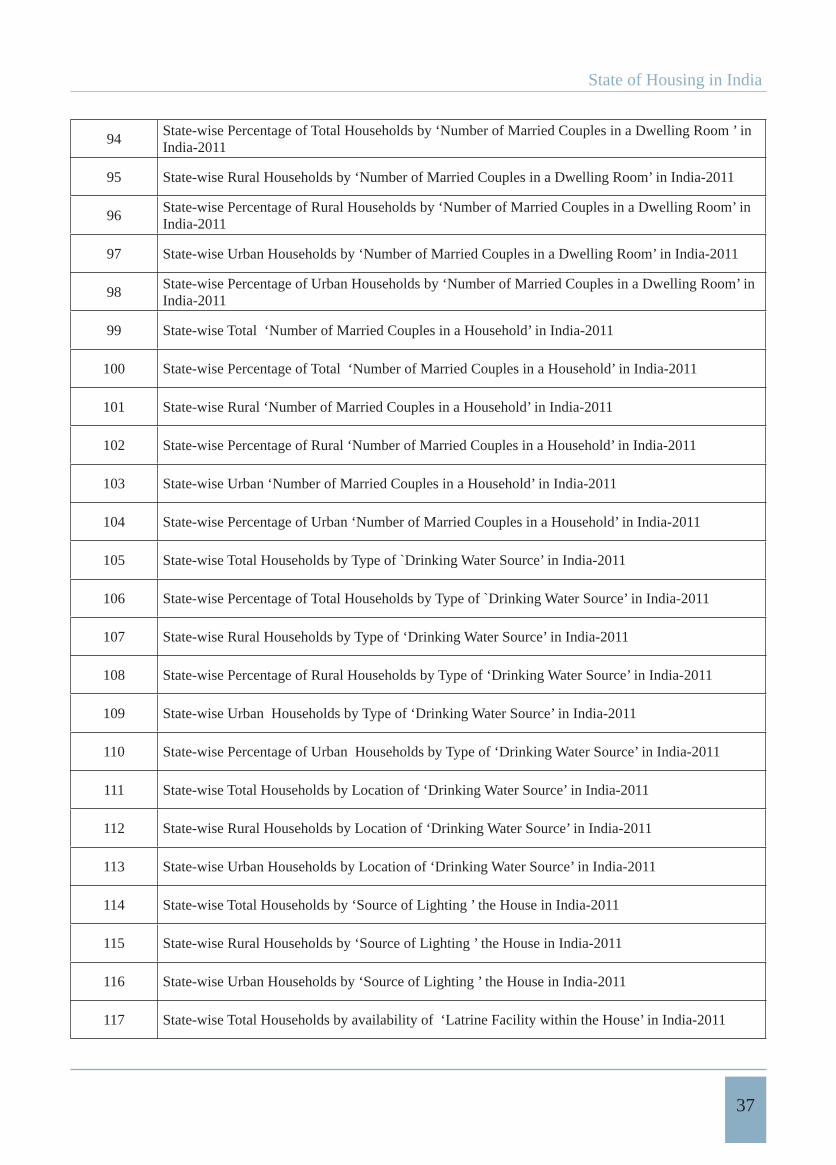
State of Housing in India
37
94State-wise Percentage of Total Households by ‘Number of Married Couples in a Dwelling Room ’ in India-2011
95 State-wise Rural Households by ‘Number of Married Couples in a Dwelling Room’ in India-2011
96State-wise Percentage of Rural Households by ‘Number of Married Couples in a Dwelling Room’ in India-2011
97 State-wise Urban Households by ‘Number of Married Couples in a Dwelling Room’ in India-2011
98State-wise Percentage of Urban Households by ‘Number of Married Couples in a Dwelling Room’ in India-2011
99 State-wise Total ‘Number of Married Couples in a Household’ in India-2011
100 State-wise Percentage of Total ‘Number of Married Couples in a Household’ in India-2011
101 State-wise Rural ‘Number of Married Couples in a Household’ in India-2011
102 State-wise Percentage of Rural ‘Number of Married Couples in a Household’ in India-2011
103 State-wise Urban ‘Number of Married Couples in a Household’ in India-2011
104 State-wise Percentage of Urban ‘Number of Married Couples in a Household’ in India-2011
105 State-wise Total Households by Type of `Drinking Water Source’ in India-2011
106 State-wise Percentage of Total Households by Type of `Drinking Water Source’ in India-2011
107 State-wise Rural Households by Type of ‘Drinking Water Source’ in India-2011
108 State-wise Percentage of Rural Households by Type of ‘Drinking Water Source’ in India-2011
109 State-wise Urban Households by Type of ‘Drinking Water Source’ in India-2011
110 State-wise Percentage of Urban Households by Type of ‘Drinking Water Source’ in India-2011
111 State-wise Total Households by Location of ‘Drinking Water Source’ in India-2011
112 State-wise Rural Households by Location of ‘Drinking Water Source’ in India-2011
113 State-wise Urban Households by Location of ‘Drinking Water Source’ in India-2011
114 State-wise Total Households by ‘Source of Lighting ’ the House in India-2011
115 State-wise Rural Households by ‘Source of Lighting ’ the House in India-2011
116 State-wise Urban Households by ‘Source of Lighting ’ the House in India-2011
117 State-wise Total Households by availability of ‘Latrine Facility within the House’ in India-2011
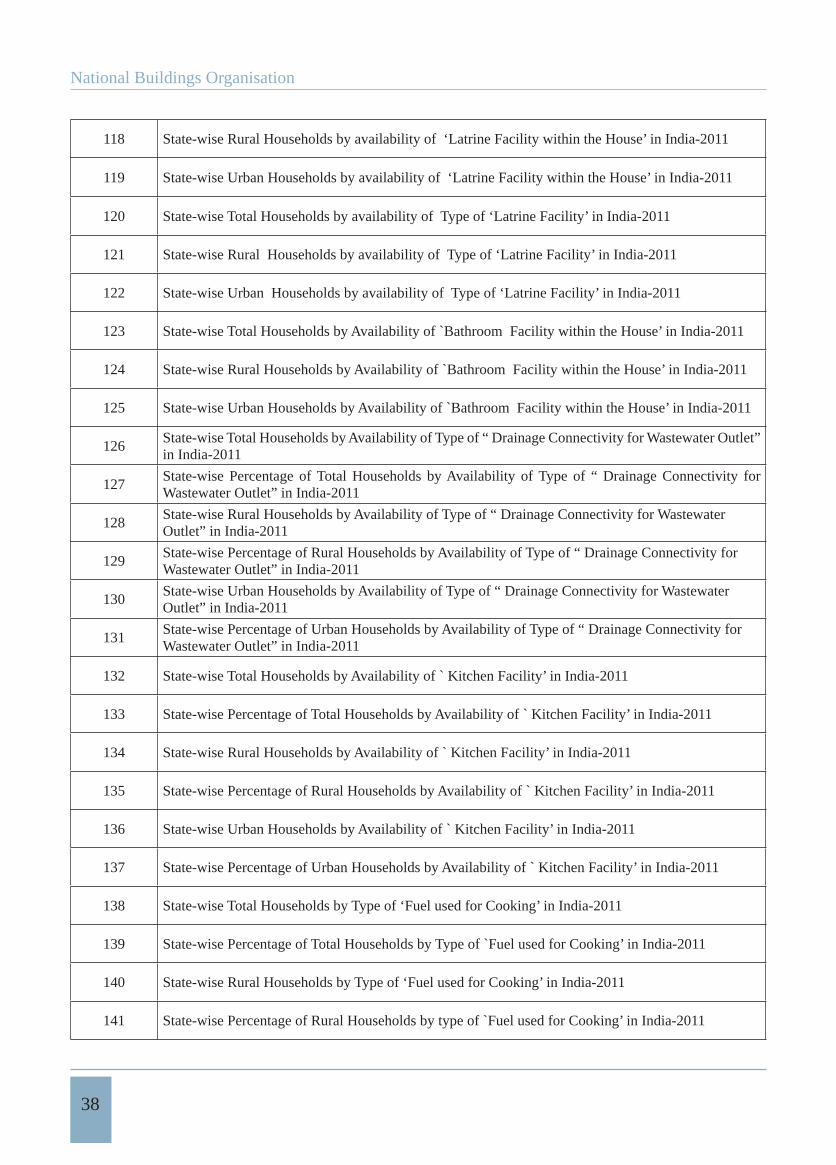
National Buildings Organisation
38
118 State-wise Rural Households by availability of ‘Latrine Facility within the House’ in India-2011
119 State-wise Urban Households by availability of ‘Latrine Facility within the House’ in India-2011
120 State-wise Total Households by availability of Type of ‘Latrine Facility’ in India-2011
121 State-wise Rural Households by availability of Type of ‘Latrine Facility’ in India-2011
122 State-wise Urban Households by availability of Type of ‘Latrine Facility’ in India-2011
123 State-wise Total Households by Availability of `Bathroom Facility within the House’ in India-2011
124 State-wise Rural Households by Availability of `Bathroom Facility within the House’ in India-2011
125 State-wise Urban Households by Availability of `Bathroom Facility within the House’ in India-2011
126State-wise Total Households by Availability of Type of “ Drainage Connectivity for Wastewater Outlet” in India-2011
127State-wise Percentage of Total Households by Availability of Type of “ Drainage Connectivity for Wastewater Outlet” in India-2011
128State-wise Rural Households by Availability of Type of “ Drainage Connectivity for Wastewater Outlet” in India-2011
129State-wise Percentage of Rural Households by Availability of Type of “ Drainage Connectivity for Wastewater Outlet” in India-2011
130State-wise Urban Households by Availability of Type of “ Drainage Connectivity for Wastewater Outlet” in India-2011
131State-wise Percentage of Urban Households by Availability of Type of “ Drainage Connectivity for Wastewater Outlet” in India-2011
132 State-wise Total Households by Availability of ` Kitchen Facility’ in India-2011
133 State-wise Percentage of Total Households by Availability of ` Kitchen Facility’ in India-2011
134 State-wise Rural Households by Availability of ` Kitchen Facility’ in India-2011
135 State-wise Percentage of Rural Households by Availability of ` Kitchen Facility’ in India-2011
136 State-wise Urban Households by Availability of ` Kitchen Facility’ in India-2011
137 State-wise Percentage of Urban Households by Availability of ` Kitchen Facility’ in India-2011
138 State-wise Total Households by Type of ‘Fuel used for Cooking’ in India-2011
139 State-wise Percentage of Total Households by Type of `Fuel used for Cooking’ in India-2011
140 State-wise Rural Households by Type of ‘Fuel used for Cooking’ in India-2011
141 State-wise Percentage of Rural Households by type of `Fuel used for Cooking’ in India-2011
State of Housing in India
39
142 State-wise Urban Households by Type of ‘Fuel used for Cooking’ in India-2011
143 State-wise Percentage of Urban Households by type of `Fuel used for Cooking’ in India-2011
144 State-wise Households (Total, Rural & Urban) availing `Banking Services’ in India-2011
145
146India-2011
147
148India-2011
149
150India-2011
151 State-wise Houseless Population in India-2001
152 Houseless Population in Metropolitans Cities – 2001
National Buildings Organisation
40
3 Housing Condition in India –NSSO Reports
1. NSSO Surveys
1.1 The National Sample Survey Organisation (NSSO) conducts regular Sample Surveys on Housing
Condition on quinquennial basis for the entire country. NSSO started collecting data relating to housing condition in India
almost since its inception, i.e. 1954. Data on the structural aspects of dwelling units and basic housing amenities such as
drinking water, bathroom, sewerage, latrines, lighting etc. are being collected through sample surveys conducted from
time to time.
1.2 The recent NSSO survey reports available on Housing Condition include:
Housing Condition in India 49i. th Round (Jan.1993-June 1993)
Housing Condition in India 58th Round (July to December 2002)ii.
Housing Condition and Amenities in India, 65iii. th Round 2008-09 (July2008-June 2009)
“Housing Condition and Amenities in India, 2008-09” is the latest Report presenting the result of the survey on
housing condition from the NSS 65th round, covering the aspects of basic housing amenities available to households,
characteristics and conditions of dwelling units, micro-environmental elements surrounding dwellings, and certain
aspects of construction including cost of construction undertaken by the households.
2. Availability of Basic Amenities
Drinking Water Facility
2.1 The availability of drinking water is one of the most basic human needs. The study of drinking water facilities
component has other aspects such as distance travelled to the source of drinking water and whether the water source is
shared with other households or for exclusive use of the individual household.
Source of Drinking Water (Table-29, Figure-29):
2.2 Table-29 shows the pattern of use of different sources of drinking water by rural and urban households and the
changes in the patterns of use of drinking water sources in different NSS rounds. The change in the pattern of usage over
the period 1993 (49th round) to 2009 (65th
tap water usage, has increased from 32.4 to 43.1 per cent over this period and the usage of well water has gone down
to 9.3 per cent in 2009 from 25.7 per cent in 1993. One noticeable feature of urban households was the use of ‘bottled
water’ as a major source of drinking water, which contributed 2.7 per cent of the urban households. It is also interesting
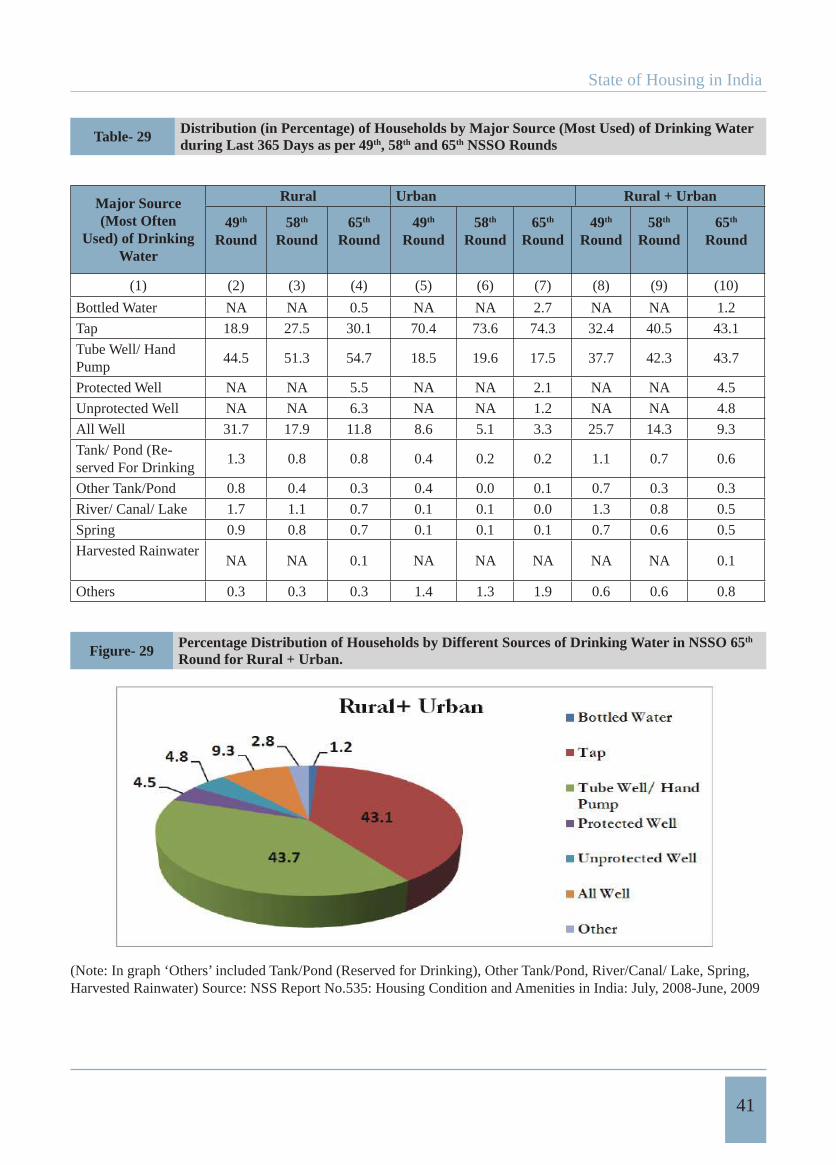
State of Housing in India
41
Table- 29 Distribution (in Percentage) of Households by Major Source (Most Used) of Drinking Water during Last 365 Days as per 49th, 58th and 65th NSSO Rounds
Major Source (Most Often
Used) of Drinking Water
Rural Urban Rural + Urban
49th
Round58th
Round65th
Round49th
Round58th
Round65th
Round49th
Round58th
Round65th
Round
(1) (2) (3) (4) (5) (6) (7) (8) (9) (10)
Bottled Water NA NA 0.5 NA NA 2.7 NA NA 1.2
Tap 18.9 27.5 30.1 70.4 73.6 74.3 32.4 40.5 43.1
Tube Well/ Hand Pump
44.5 51.3 54.7 18.5 19.6 17.5 37.7 42.3 43.7
Protected Well NA NA 5.5 NA NA 2.1 NA NA 4.5
Unprotected Well NA NA 6.3 NA NA 1.2 NA NA 4.8
All Well 31.7 17.9 11.8 8.6 5.1 3.3 25.7 14.3 9.3
Tank/ Pond (Re-served For Drinking
1.3 0.8 0.8 0.4 0.2 0.2 1.1 0.7 0.6
Other Tank/Pond 0.8 0.4 0.3 0.4 0.0 0.1 0.7 0.3 0.3
River/ Canal/ Lake 1.7 1.1 0.7 0.1 0.1 0.0 1.3 0.8 0.5
Spring 0.9 0.8 0.7 0.1 0.1 0.1 0.7 0.6 0.5
Harvested RainwaterNA NA 0.1 NA NA NA NA NA 0.1
Others 0.3 0.3 0.3 1.4 1.3 1.9 0.6 0.6 0.8
Figure- 29 Percentage Distribution of Households by Different Sources of Drinking Water in NSSO 65th
Round for Rural + Urban.
(Note: In graph ‘Others’ included Tank/Pond (Reserved for Drinking), Other Tank/Pond, River/Canal/ Lake, Spring, Harvested Rainwater) Source: NSS Report No.535: Housing Condition and Amenities in India: July, 2008-June, 2009
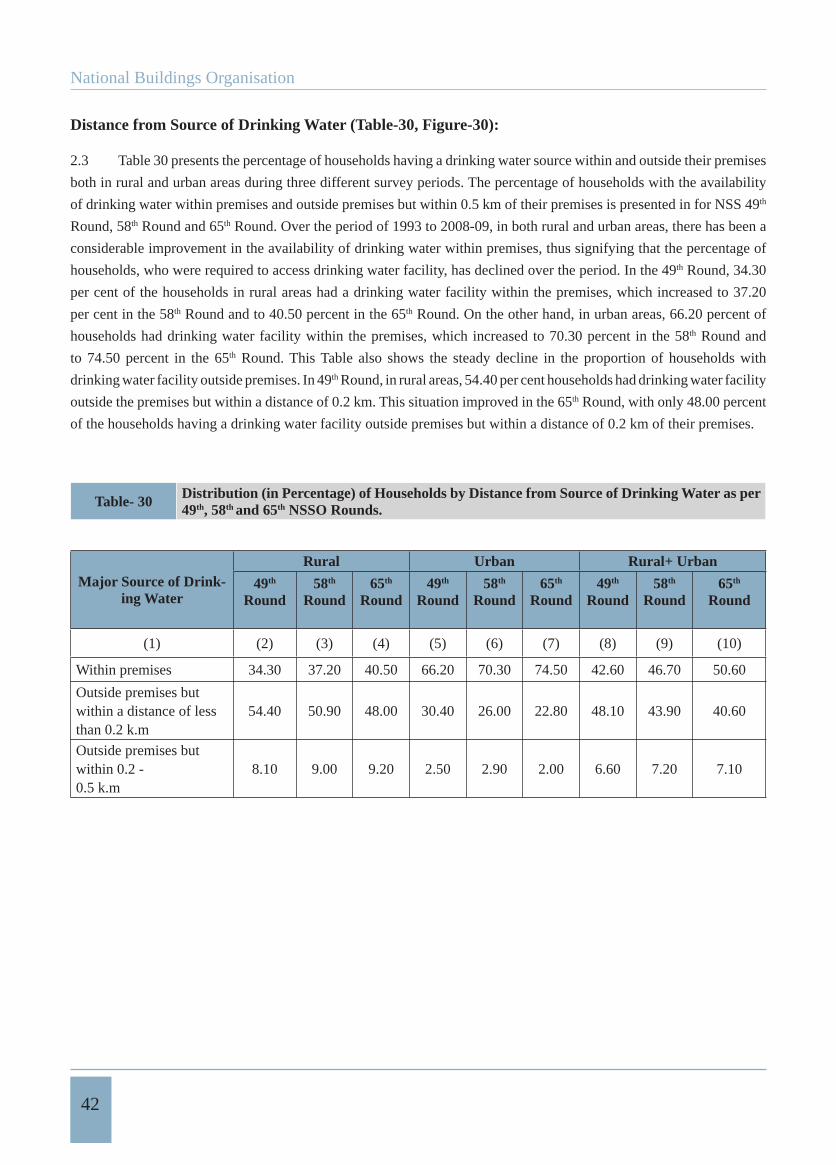
National Buildings Organisation
42
Distance from Source of Drinking Water (Table-30, Figure-30):
2.3 Table 30 presents the percentage of households having a drinking water source within and outside their premises
both in rural and urban areas during three different survey periods. The percentage of households with the availability
of drinking water within premises and outside premises but within 0.5 km of their premises is presented in for NSS 49th
Round, 58th Round and 65th Round. Over the period of 1993 to 2008-09, in both rural and urban areas, there has been a
considerable improvement in the availability of drinking water within premises, thus signifying that the percentage of
households, who were required to access drinking water facility, has declined over the period. In the 49th Round, 34.30
per cent of the households in rural areas had a drinking water facility within the premises, which increased to 37.20
per cent in the 58th Round and to 40.50 percent in the 65th Round. On the other hand, in urban areas, 66.20 percent of
households had drinking water facility within the premises, which increased to 70.30 percent in the 58th Round and
to 74.50 percent in the 65th Round. This Table also shows the steady decline in the proportion of households with
drinking water facility outside premises. In 49th Round, in rural areas, 54.40 per cent households had drinking water facility
outside the premises but within a distance of 0.2 km. This situation improved in the 65th Round, with only 48.00 percent
of the households having a drinking water facility outside premises but within a distance of 0.2 km of their premises.
Table- 30 Distribution (in Percentage) of Households by Distance from Source of Drinking Water as per 49th, 58th and 65th NSSO Rounds.
Major Source of Drink-ing Water
Rural Urban Rural+ Urban
49th
Round58th
Round65th
Round49th
Round58th
Round65th
Round49th
Round58th
Round65th
Round
(1) (2) (3) (4) (5) (6) (7) (8) (9) (10)
Within premises 34.30 37.20 40.50 66.20 70.30 74.50 42.60 46.70 50.60
Outside premises but within a distance of lessthan 0.2 k.m
54.40 50.90 48.00 30.40 26.00 22.80 48.10 43.90 40.60
Outside premises but within 0.2 -0.5 k.m
8.10 9.00 9.20 2.50 2.90 2.00 6.60 7.20 7.10
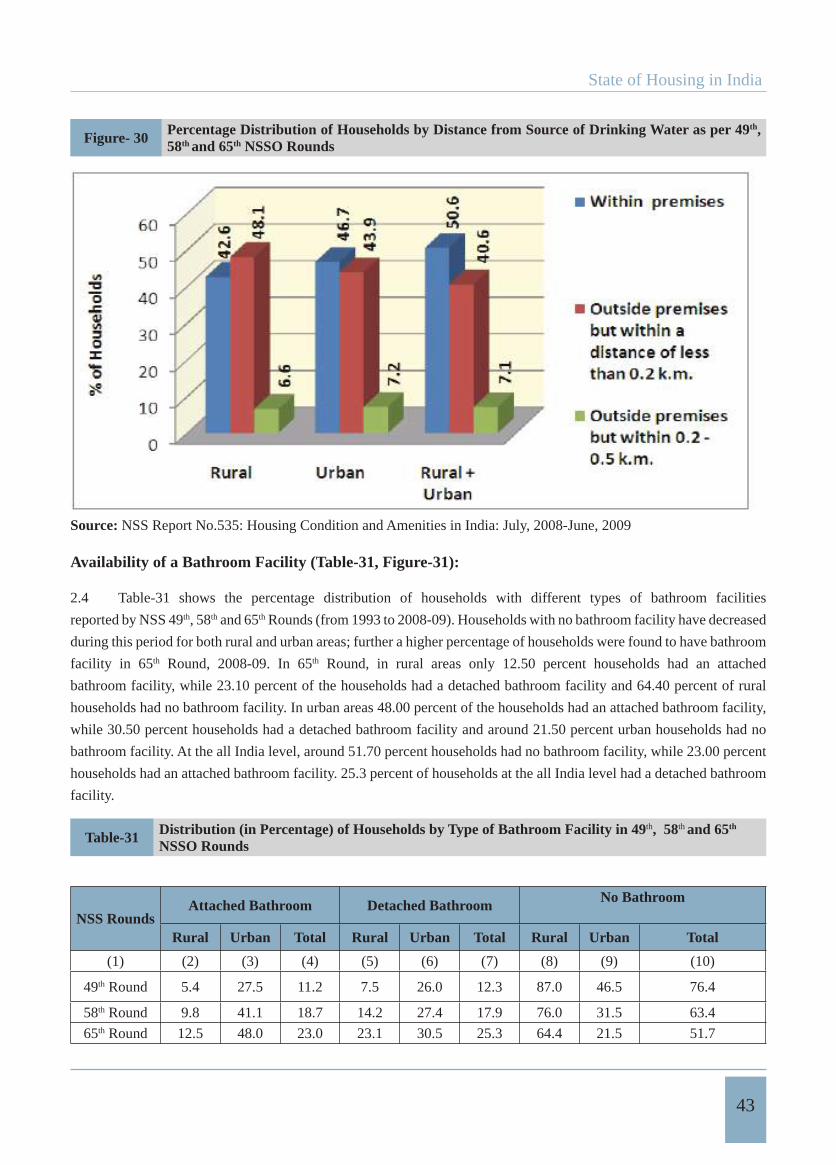
State of Housing in India
43
Figure- 30 Percentage Distribution of Households by Distance from Source of Drinking Water as per 49th,58th and 65th NSSO Rounds
Source: NSS Report No.535: Housing Condition and Amenities in India: July, 2008-June, 2009
Availability of a Bathroom Facility (Table-31, Figure-31):
2.4 Table-31 shows the percentage distribution of households with different types of bathroom facilities
reported by NSS 49th, 58th and 65th Rounds (from 1993 to 2008-09). Households with no bathroom facility have decreased
during this period for both rural and urban areas; further a higher percentage of households were found to have bathroom
facility in 65th Round, 2008-09. In 65th Round, in rural areas only 12.50 percent households had an attached
bathroom facility, while 23.10 percent of the households had a detached bathroom facility and 64.40 percent of rural
households had no bathroom facility. In urban areas 48.00 percent of the households had an attached bathroom facility,
while 30.50 percent households had a detached bathroom facility and around 21.50 percent urban households had no
bathroom facility. At the all India level, around 51.70 percent households had no bathroom facility, while 23.00 percent
households had an attached bathroom facility. 25.3 percent of households at the all India level had a detached bathroom
facility.
Table-31 Distribution (in Percentage) of Households by Type of Bathroom Facility in 49th, 58th and 65th
NSSO Rounds
NSS RoundsAttached Bathroom Detached Bathroom No Bathroom
Rural Urban Total Rural Urban Total Rural Urban Total
(1) (2) (3) (4) (5) (6) (7) (8) (9) (10)
49th Round 5.4 27.5 11.2 7.5 26.0 12.3 87.0 46.5 76.4
58th Round 9.8 41.1 18.7 14.2 27.4 17.9 76.0 31.5 63.4
65th Round 12.5 48.0 23.0 23.1 30.5 25.3 64.4 21.5 51.7
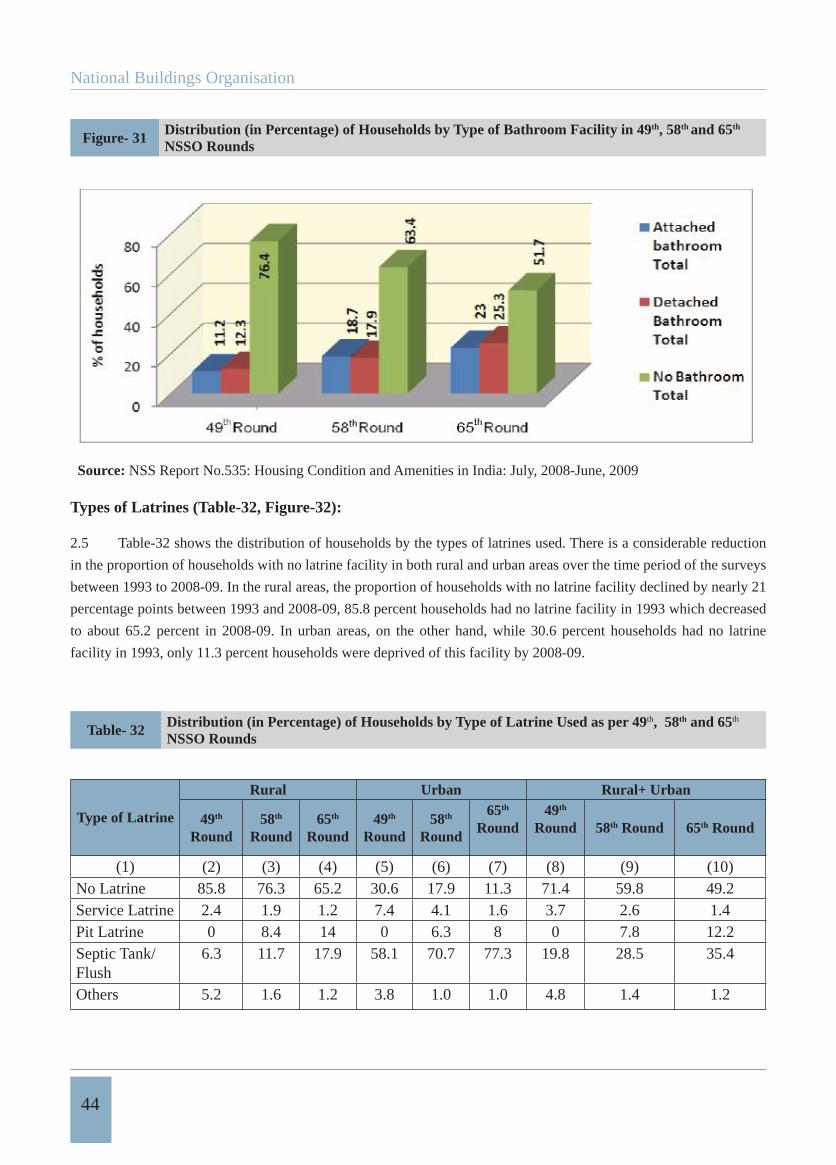
National Buildings Organisation
44
Figure- 31 Distribution (in Percentage) of Households by Type of Bathroom Facility in 49th, 58th and 65th
NSSO Rounds
Source: NSS Report No.535: Housing Condition and Amenities in India: July, 2008-June, 2009
Types of Latrines (Table-32, Figure-32):
2.5 Table-32 shows the distribution of households by the types of latrines used. There is a considerable reduction
in the proportion of households with no latrine facility in both rural and urban areas over the time period of the surveys
between 1993 to 2008-09. In the rural areas, the proportion of households with no latrine facility declined by nearly 21
percentage points between 1993 and 2008-09, 85.8 percent households had no latrine facility in 1993 which decreased
to about 65.2 percent in 2008-09. In urban areas, on the other hand, while 30.6 percent households had no latrine
facility in 1993, only 11.3 percent households were deprived of this facility by 2008-09.
Table- 32 Distribution (in Percentage) of Households by Type of Latrine Used as per 49th, 58th and 65th
NSSO Rounds
Type of Latrine
Rural Urban Rural+ Urban
49th
Round58th
Round65th
Round49th
Round58th
Round
65th
Round49th
Round 58th Round 65th Round
(1) (2) (3) (4) (5) (6) (7) (8) (9) (10)No Latrine 85.8 76.3 65.2 30.6 17.9 11.3 71.4 59.8 49.2Service Latrine 2.4 1.9 1.2 7.4 4.1 1.6 3.7 2.6 1.4Pit Latrine 0 8.4 14 0 6.3 8 0 7.8 12.2Septic Tank/ Flush
6.3 11.7 17.9 58.1 70.7 77.3 19.8 28.5 35.4
Others 5.2 1.6 1.2 3.8 1.0 1.0 4.8 1.4 1.2
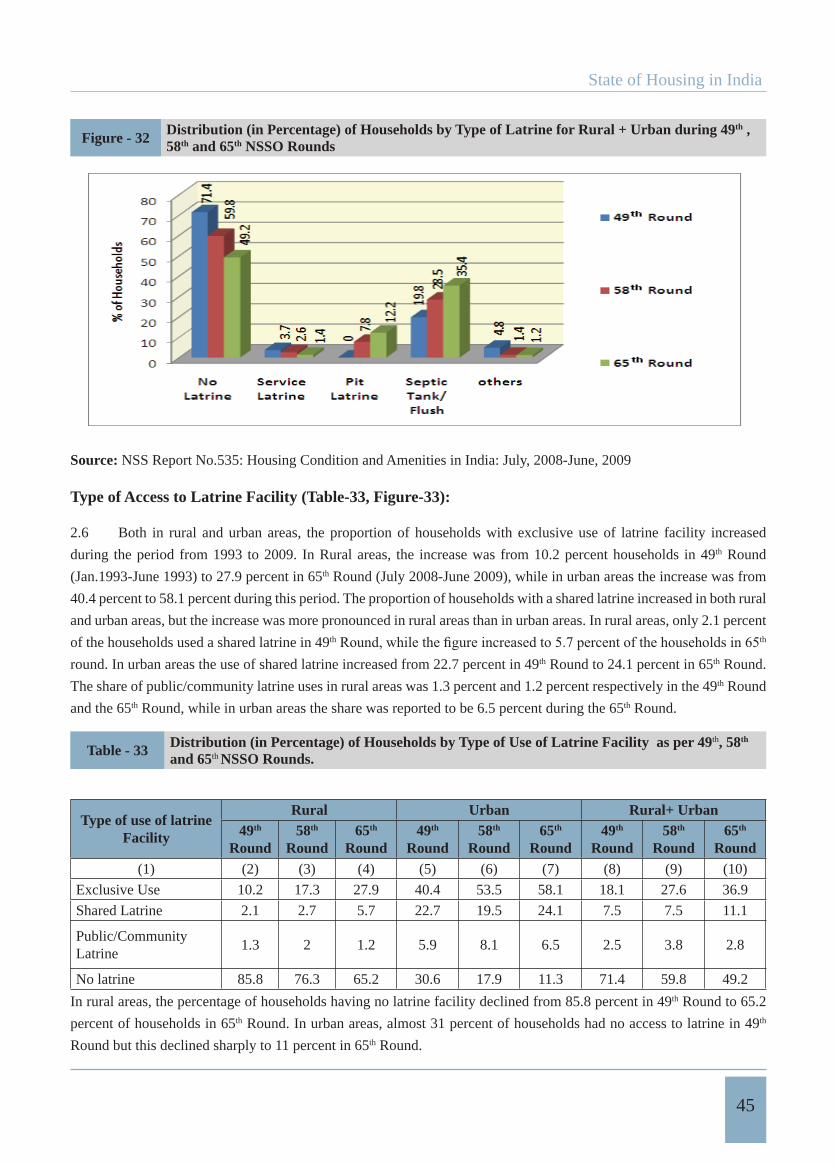
State of Housing in India
45
Figure - 32 Distribution (in Percentage) of Households by Type of Latrine for Rural + Urban during 49th , 58th and 65th NSSO Rounds
Source: NSS Report No.535: Housing Condition and Amenities in India: July, 2008-June, 2009
Type of Access to Latrine Facility (Table-33, Figure-33):
2.6 Both in rural and urban areas, the proportion of households with exclusive use of latrine facility increased
during the period from 1993 to 2009. In Rural areas, the increase was from 10.2 percent households in 49th Round
(Jan.1993-June 1993) to 27.9 percent in 65th Round (July 2008-June 2009), while in urban areas the increase was from
40.4 percent to 58.1 percent during this period. The proportion of households with a shared latrine increased in both rural
and urban areas, but the increase was more pronounced in rural areas than in urban areas. In rural areas, only 2.1 percent
of the households used a shared latrine in 49th th
round. In urban areas the use of shared latrine increased from 22.7 percent in 49th Round to 24.1 percent in 65th Round.
The share of public/community latrine uses in rural areas was 1.3 percent and 1.2 percent respectively in the 49th Round
and the 65th Round, while in urban areas the share was reported to be 6.5 percent during the 65th Round.
Table - 33 Distribution (in Percentage) of Households by Type of Use of Latrine Facility as per 49th, 58th
and 65th NSSO Rounds.
Type of use of latrine Facility
Rural Urban Rural+ Urban49th
Round58th
Round65th
Round49th
Round58th
Round65th
Round49th
Round58th
Round65th
Round(1) (2) (3) (4) (5) (6) (7) (8) (9) (10)
Exclusive Use 10.2 17.3 27.9 40.4 53.5 58.1 18.1 27.6 36.9
Shared Latrine 2.1 2.7 5.7 22.7 19.5 24.1 7.5 7.5 11.1
Public/CommunityLatrine
1.3 2 1.2 5.9 8.1 6.5 2.5 3.8 2.8
No latrine 85.8 76.3 65.2 30.6 17.9 11.3 71.4 59.8 49.2
In rural areas, the percentage of households having no latrine facility declined from 85.8 percent in 49th Round to 65.2
percent of households in 65th Round. In urban areas, almost 31 percent of households had no access to latrine in 49th
Round but this declined sharply to 11 percent in 65th Round.
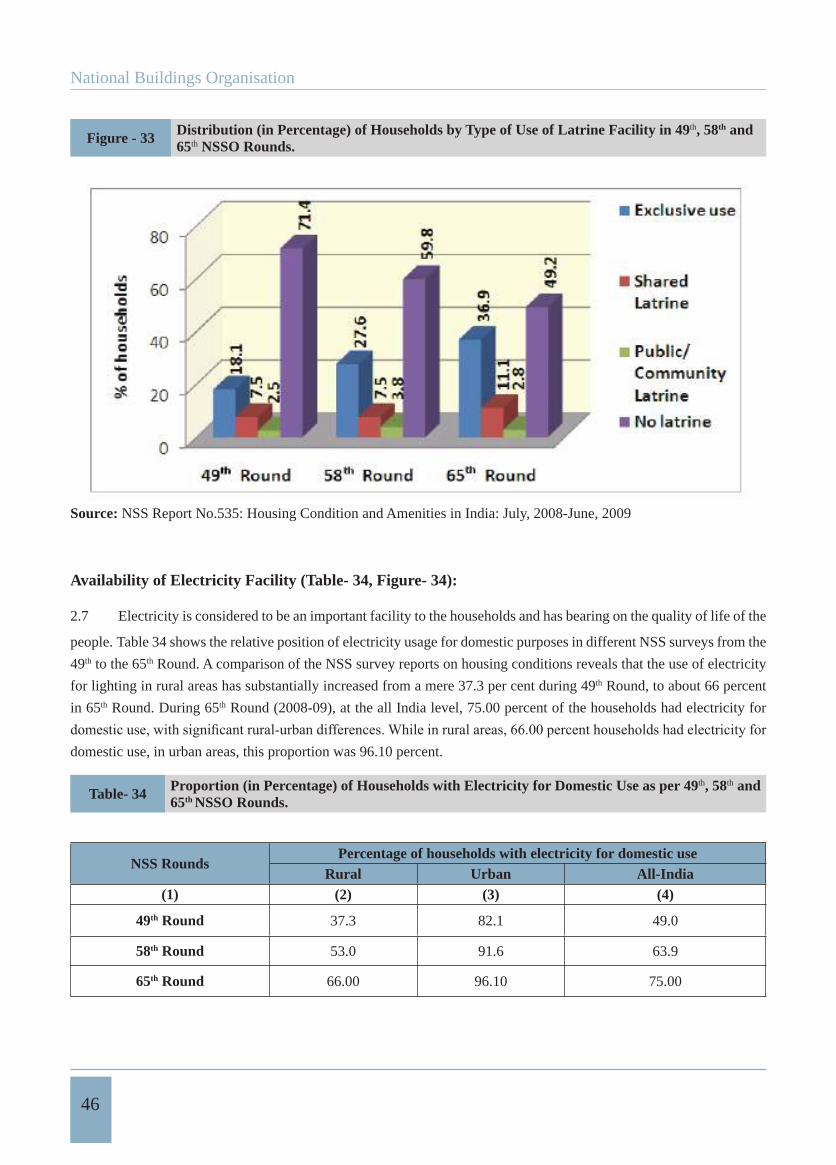
National Buildings Organisation
46
Figure - 33 Distribution (in Percentage) of Households by Type of Use of Latrine Facility in 49th, 58th and 65th NSSO Rounds.
Source: NSS Report No.535: Housing Condition and Amenities in India: July, 2008-June, 2009
Availability of Electricity Facility (Table- 34, Figure- 34):
2.7 Electricity is considered to be an important facility to the households and has bearing on the quality of life of the
people. Table 34 shows the relative position of electricity usage for domestic purposes in different NSS surveys from the
49th to the 65th Round. A comparison of the NSS survey reports on housing conditions reveals that the use of electricity
for lighting in rural areas has substantially increased from a mere 37.3 per cent during 49th Round, to about 66 percent
in 65th Round. During 65th Round (2008-09), at the all India level, 75.00 percent of the households had electricity for
domestic use, in urban areas, this proportion was 96.10 percent.
Table- 34 Proportion (in Percentage) of Households with Electricity for Domestic Use as per 49th, 58th and 65th NSSO Rounds.
NSS RoundsPercentage of households with electricity for domestic use
Rural Urban All-India(1) (2) (3) (4)
49th Round 37.3 82.1 49.0
58th Round 53.0 91.6 63.9
65th Round 66.00 96.10 75.00
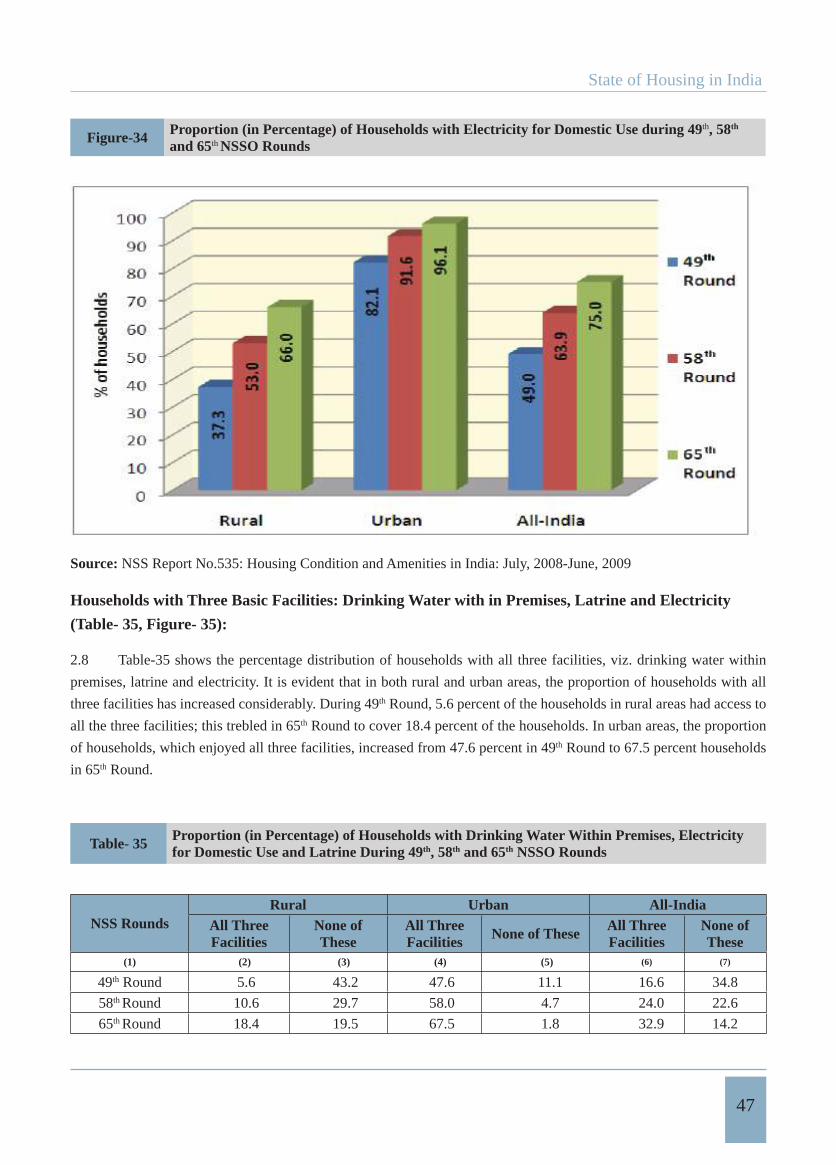
State of Housing in India
47
Figure-34 Proportion (in Percentage) of Households with Electricity for Domestic Use during 49th, 58th
and 65th NSSO Rounds
Source: NSS Report No.535: Housing Condition and Amenities in India: July, 2008-June, 2009
Households with Three Basic Facilities: Drinking Water with in Premises, Latrine and Electricity
(Table- 35, Figure- 35):
2.8 Table-35 shows the percentage distribution of households with all three facilities, viz. drinking water within
premises, latrine and electricity. It is evident that in both rural and urban areas, the proportion of households with all
three facilities has increased considerably. During 49th Round, 5.6 percent of the households in rural areas had access to
all the three facilities; this trebled in 65th Round to cover 18.4 percent of the households. In urban areas, the proportion
of households, which enjoyed all three facilities, increased from 47.6 percent in 49th Round to 67.5 percent households
in 65th Round.
Table- 35 Proportion (in Percentage) of Households with Drinking Water Within Premises, Electricity for Domestic Use and Latrine During 49th, 58th and 65th NSSO Rounds
NSS RoundsRural Urban All-India
All Three Facilities
None of These
All Three Facilities None of These All Three
FacilitiesNone of These
(1) (2) (3) (4) (5) (6) (7)
49th Round 5.6 43.2 47.6 11.1 16.6 34.8
58th Round 10.6 29.7 58.0 4.7 24.0 22.6
65th Round 18.4 19.5 67.5 1.8 32.9 14.2
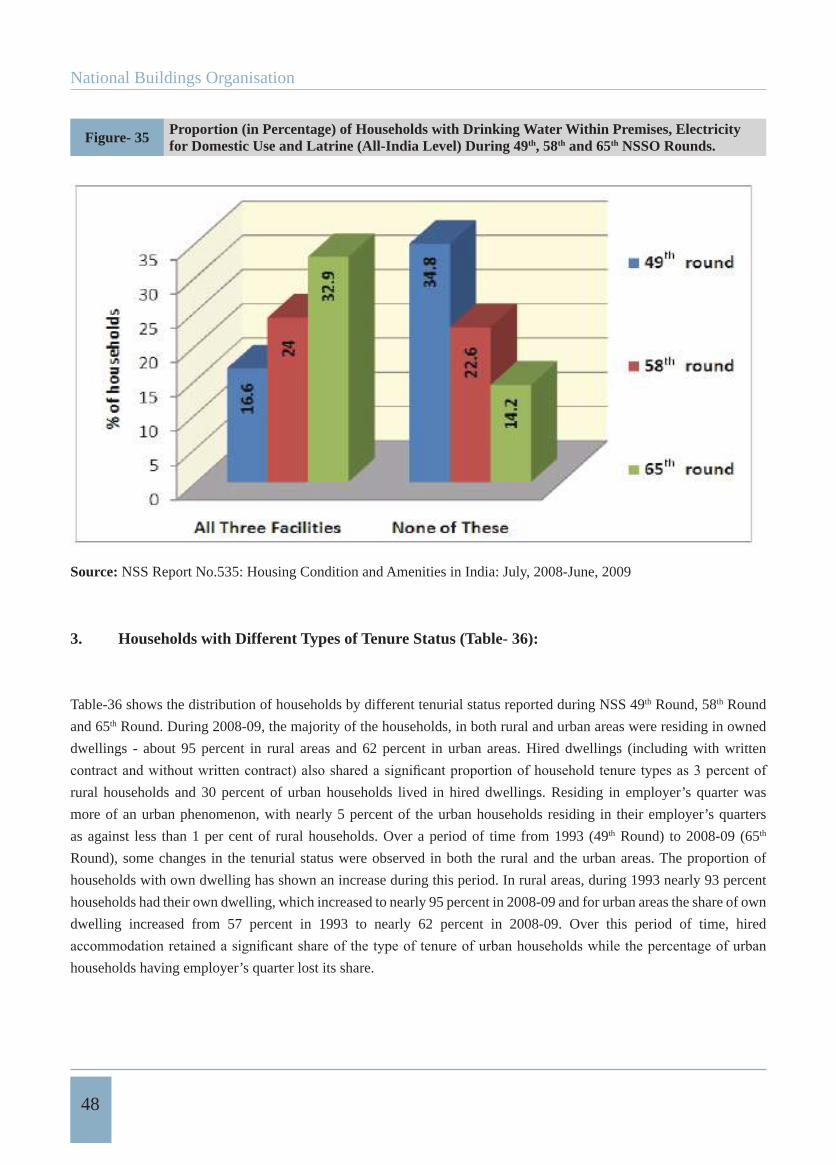
National Buildings Organisation
48
Figure- 35 Proportion (in Percentage) of Households with Drinking Water Within Premises, Electricity for Domestic Use and Latrine (All-India Level) During 49th, 58th and 65th NSSO Rounds.
Source: NSS Report No.535: Housing Condition and Amenities in India: July, 2008-June, 2009
3. Households with Different Types of Tenure Status (Table- 36):
Table-36 shows the distribution of households by different tenurial status reported during NSS 49th Round, 58th Round
and 65th Round. During 2008-09, the majority of the households, in both rural and urban areas were residing in owned
dwellings - about 95 percent in rural areas and 62 percent in urban areas. Hired dwellings (including with written
rural households and 30 percent of urban households lived in hired dwellings. Residing in employer’s quarter was
more of an urban phenomenon, with nearly 5 percent of the urban households residing in their employer’s quarters
as against less than 1 per cent of rural households. Over a period of time from 1993 (49th Round) to 2008-09 (65th
Round), some changes in the tenurial status were observed in both the rural and the urban areas. The proportion of
households with own dwelling has shown an increase during this period. In rural areas, during 1993 nearly 93 percent
households had their own dwelling, which increased to nearly 95 percent in 2008-09 and for urban areas the share of own
dwelling increased from 57 percent in 1993 to nearly 62 percent in 2008-09. Over this period of time, hired
households having employer’s quarter lost its share.
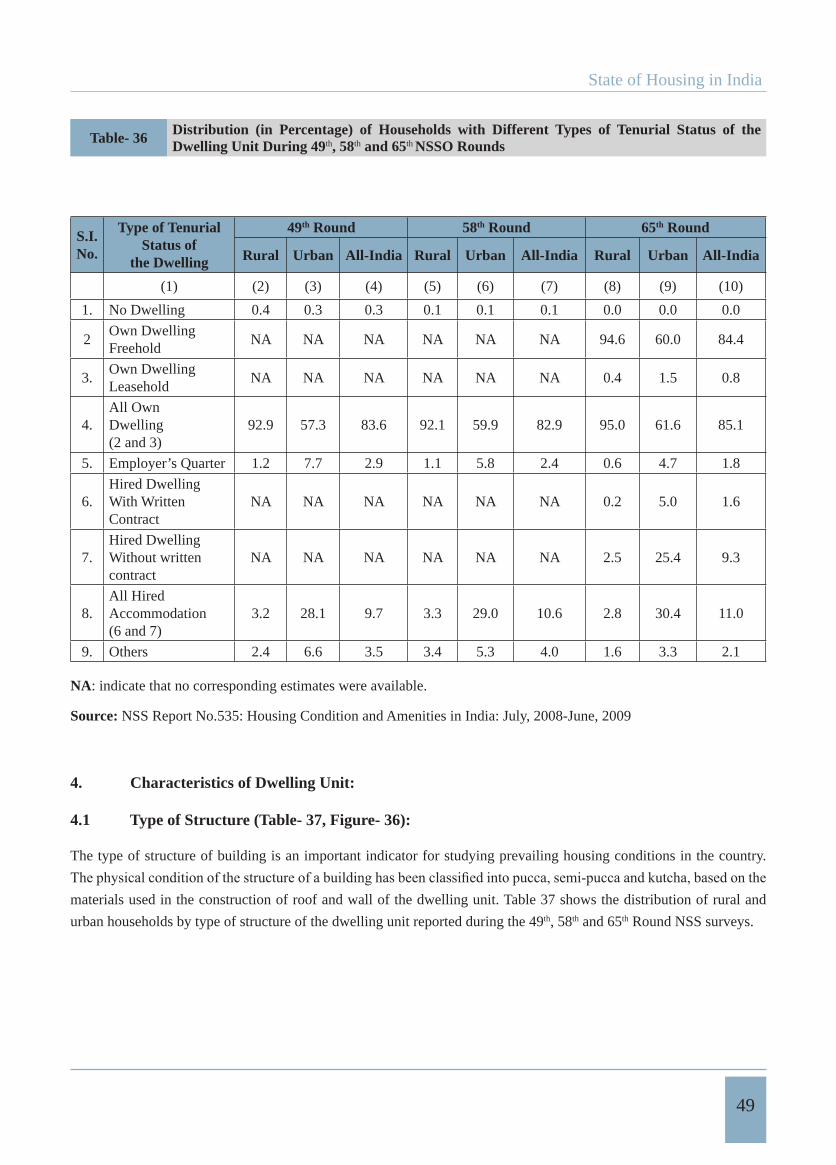
State of Housing in India
49
Table- 36 Distribution (in Percentage) of Households with Different Types of Tenurial Status of the Dwelling Unit During 49th, 58th and 65th NSSO Rounds
S.I.No.
Type of Tenurial Status of
the Dwelling
49th Round 58th Round 65th Round
Rural Urban All-India Rural Urban All-India Rural Urban All-India
(1) (2) (3) (4) (5) (6) (7) (8) (9) (10)
1. No Dwelling 0.4 0.3 0.3 0.1 0.1 0.1 0.0 0.0 0.0
2Own Dwelling Freehold
NA NA NA NA NA NA 94.6 60.0 84.4
3.Own Dwelling Leasehold
NA NA NA NA NA NA 0.4 1.5 0.8
4.All Own Dwelling(2 and 3)
92.9 57.3 83.6 92.1 59.9 82.9 95.0 61.6 85.1
5. Employer’s Quarter 1.2 7.7 2.9 1.1 5.8 2.4 0.6 4.7 1.8
6.Hired Dwelling With Written Contract
NA NA NA NA NA NA 0.2 5.0 1.6
7.Hired Dwelling Without written contract
NA NA NA NA NA NA 2.5 25.4 9.3
8.All Hired Accommodation(6 and 7)
3.2 28.1 9.7 3.3 29.0 10.6 2.8 30.4 11.0
9. Others 2.4 6.6 3.5 3.4 5.3 4.0 1.6 3.3 2.1
NA: indicate that no corresponding estimates were available.
Source: NSS Report No.535: Housing Condition and Amenities in India: July, 2008-June, 2009
4. Characteristics of Dwelling Unit:
4.1 Type of Structure (Table- 37, Figure- 36):
The type of structure of building is an important indicator for studying prevailing housing conditions in the country.
materials used in the construction of roof and wall of the dwelling unit. Table 37 shows the distribution of rural and
urban households by type of structure of the dwelling unit reported during the 49th, 58th and 65th Round NSS surveys.
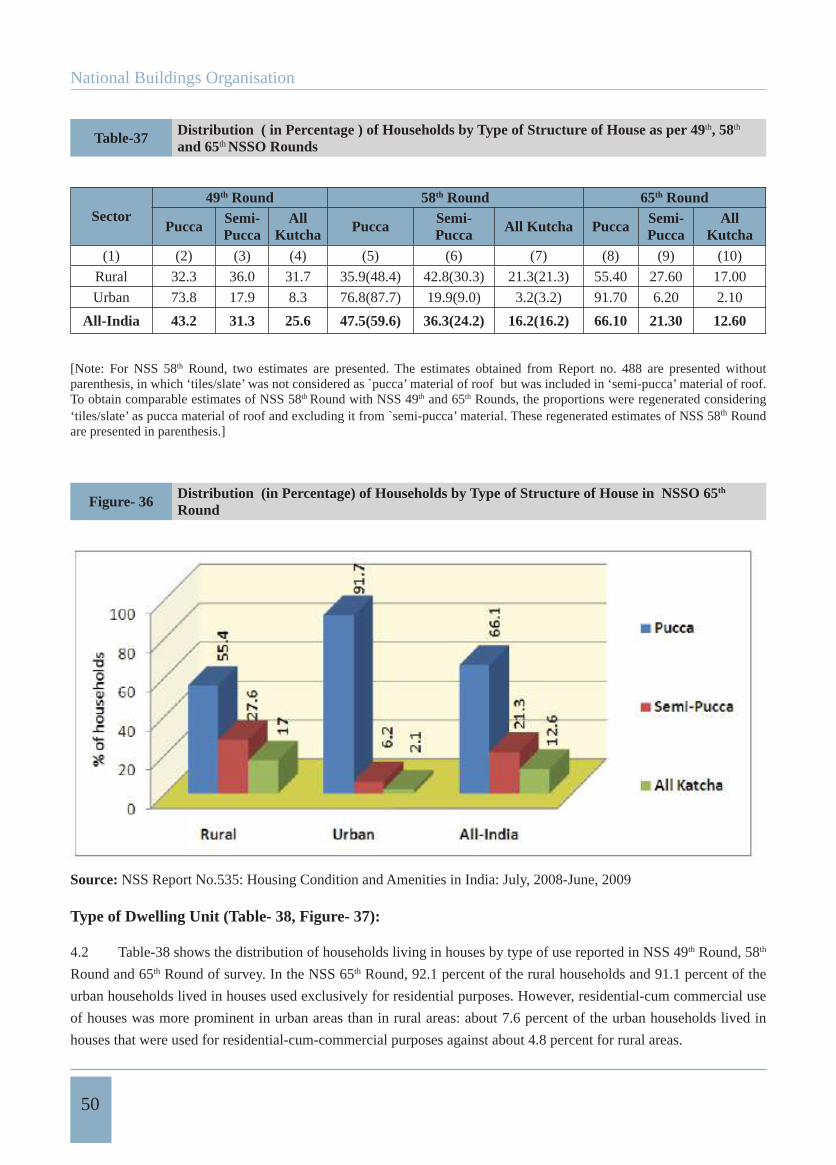
National Buildings Organisation
50
Table-37 Distribution ( in Percentage ) of Households by Type of Structure of House as per 49th, 58th
and 65th NSSO Rounds
Sector49th Round 58th Round 65th Round
Pucca Semi-Pucca
AllKutcha Pucca Semi-
Pucca All Kutcha Pucca Semi-Pucca
AllKutcha
(1) (2) (3) (4) (5) (6) (7) (8) (9) (10)
Rural 32.3 36.0 31.7 35.9(48.4) 42.8(30.3) 21.3(21.3) 55.40 27.60 17.00
Urban 73.8 17.9 8.3 76.8(87.7) 19.9(9.0) 3.2(3.2) 91.70 6.20 2.10
All-India 43.2 31.3 25.6 47.5(59.6) 36.3(24.2) 16.2(16.2) 66.10 21.30 12.60
[Note: For NSS 58th Round, two estimates are presented. The estimates obtained from Report no. 488 are presented without parenthesis, in which ‘tiles/slate’ was not considered as `pucca’ material of roof but was included in ‘semi-pucca’ material of roof. To obtain comparable estimates of NSS 58th Round with NSS 49th and 65th Rounds, the proportions were regenerated considering ‘tiles/slate’ as pucca material of roof and excluding it from `semi-pucca’ material. These regenerated estimates of NSS 58th Round are presented in parenthesis.]
Figure- 36 Distribution (in Percentage) of Households by Type of Structure of House in NSSO 65th
Round
Source: NSS Report No.535: Housing Condition and Amenities in India: July, 2008-June, 2009
Type of Dwelling Unit (Table- 38, Figure- 37):
4.2 Table-38 shows the distribution of households living in houses by type of use reported in NSS 49th Round, 58th
Round and 65th Round of survey. In the NSS 65th Round, 92.1 percent of the rural households and 91.1 percent of the
urban households lived in houses used exclusively for residential purposes. However, residential-cum commercial use
of houses was more prominent in urban areas than in rural areas: about 7.6 percent of the urban households lived in
houses that were used for residential-cum-commercial purposes against about 4.8 percent for rural areas.
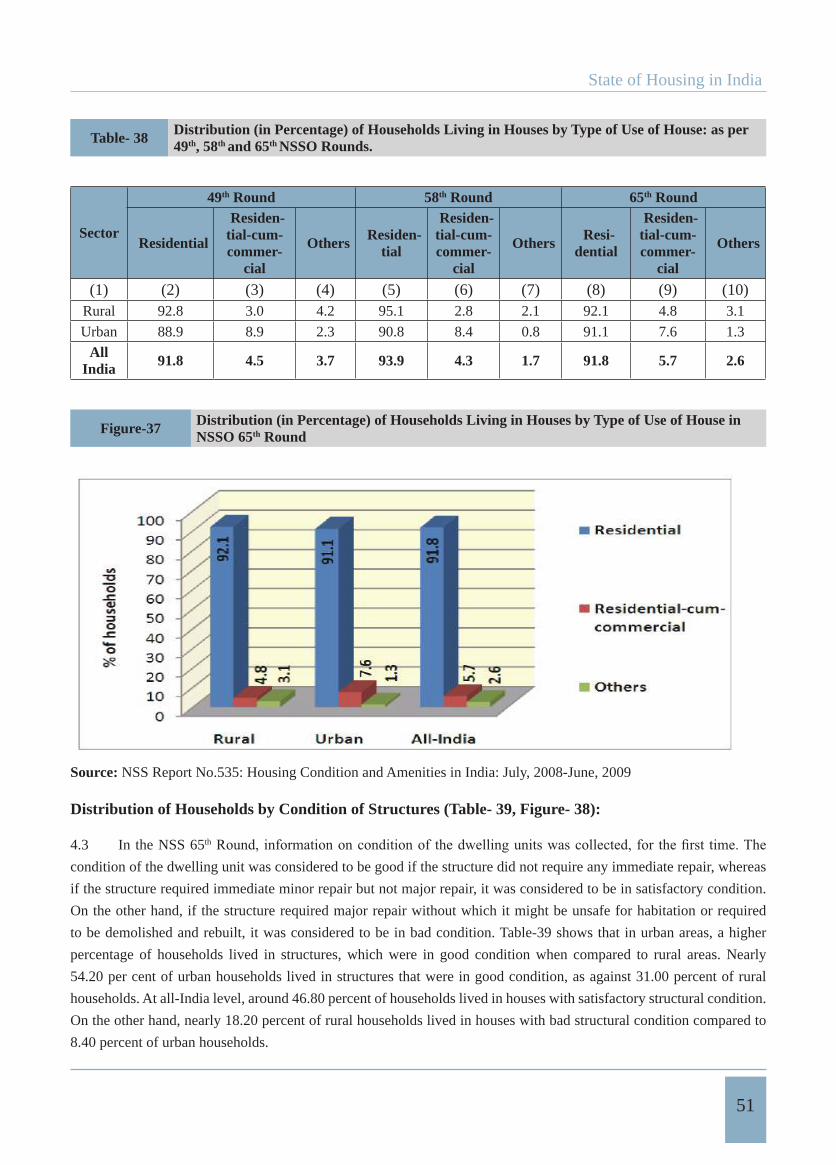
State of Housing in India
51
Table- 38 Distribution (in Percentage) of Households Living in Houses by Type of Use of House: as per 49th, 58th and 65th NSSO Rounds.
Sector
49th Round 58th Round 65th Round
Residential
Residen-tial-cum-commer-
cial
Others Residen-tial
Residen-tial-cum-commer-
cial
Others Resi-dential
Residen-tial-cum-commer-
cial
Others
(1) (2) (3) (4) (5) (6) (7) (8) (9) (10)Rural 92.8 3.0 4.2 95.1 2.8 2.1 92.1 4.8 3.1
Urban 88.9 8.9 2.3 90.8 8.4 0.8 91.1 7.6 1.3
AllIndia 91.8 4.5 3.7 93.9 4.3 1.7 91.8 5.7 2.6
Figure-37 Distribution (in Percentage) of Households Living in Houses by Type of Use of House in NSSO 65th Round
Source: NSS Report No.535: Housing Condition and Amenities in India: July, 2008-June, 2009
Distribution of Households by Condition of Structures (Table- 39, Figure- 38):
4.3 In the NSS 65th
condition of the dwelling unit was considered to be good if the structure did not require any immediate repair, whereas
if the structure required immediate minor repair but not major repair, it was considered to be in satisfactory condition.
On the other hand, if the structure required major repair without which it might be unsafe for habitation or required
to be demolished and rebuilt, it was considered to be in bad condition. Table-39 shows that in urban areas, a higher
percentage of households lived in structures, which were in good condition when compared to rural areas. Nearly
54.20 per cent of urban households lived in structures that were in good condition, as against 31.00 percent of rural
households. At all-India level, around 46.80 percent of households lived in houses with satisfactory structural condition.
On the other hand, nearly 18.20 percent of rural households lived in houses with bad structural condition compared to
8.40 percent of urban households.
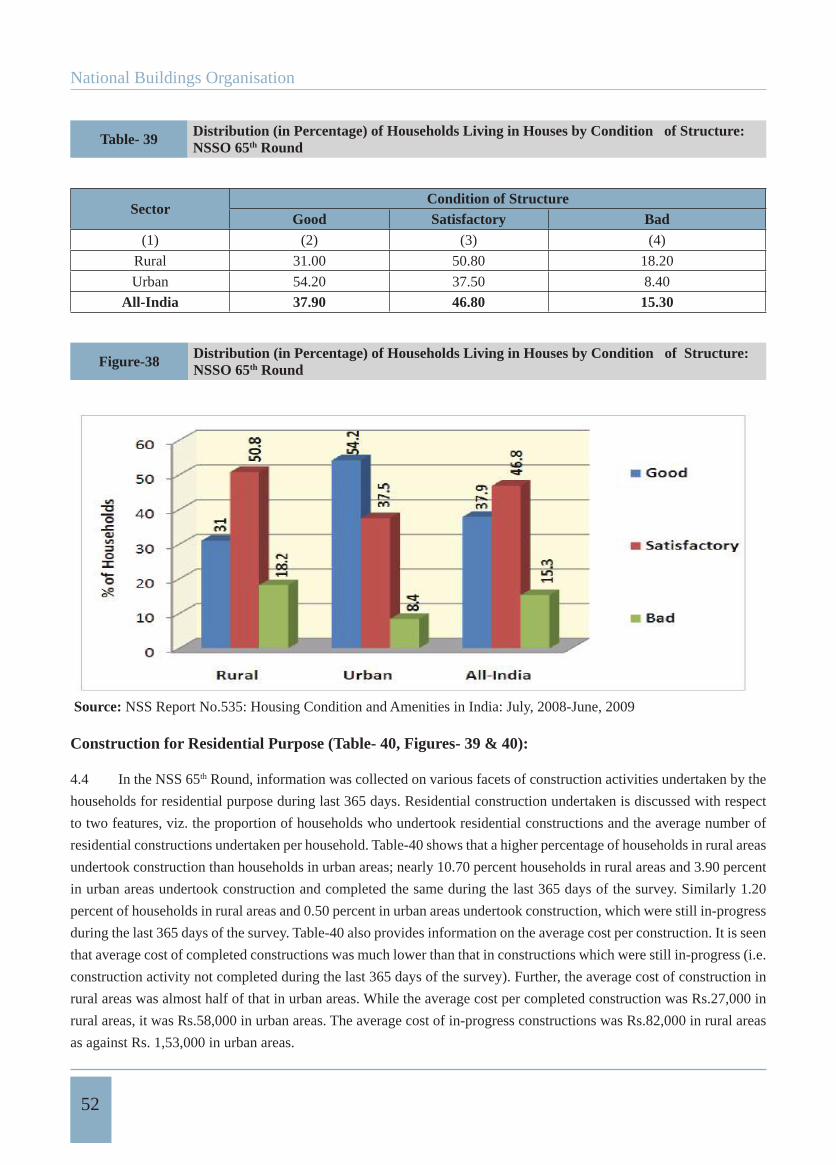
National Buildings Organisation
52
Table- 39 Distribution (in Percentage) of Households Living in Houses by Condition of Structure: NSSO 65th Round
SectorCondition of Structure
Good Satisfactory Bad(1) (2) (3) (4)
Rural 31.00 50.80 18.20
Urban 54.20 37.50 8.40
All-India 37.90 46.80 15.30
Figure-38 Distribution (in Percentage) of Households Living in Houses by Condition of Structure: NSSO 65th Round
Source: NSS Report No.535: Housing Condition and Amenities in India: July, 2008-June, 2009
Construction for Residential Purpose (Table- 40, Figures- 39 & 40):
4.4 In the NSS 65th Round, information was collected on various facets of construction activities undertaken by the
households for residential purpose during last 365 days. Residential construction undertaken is discussed with respect
to two features, viz. the proportion of households who undertook residential constructions and the average number of
residential constructions undertaken per household. Table-40 shows that a higher percentage of households in rural areas
undertook construction than households in urban areas; nearly 10.70 percent households in rural areas and 3.90 percent
in urban areas undertook construction and completed the same during the last 365 days of the survey. Similarly 1.20
percent of households in rural areas and 0.50 percent in urban areas undertook construction, which were still in-progress
during the last 365 days of the survey. Table-40 also provides information on the average cost per construction. It is seen
that average cost of completed constructions was much lower than that in constructions which were still in-progress (i.e.
construction activity not completed during the last 365 days of the survey). Further, the average cost of construction in
rural areas was almost half of that in urban areas. While the average cost per completed construction was Rs.27,000 in
rural areas, it was Rs.58,000 in urban areas. The average cost of in-progress constructions was Rs.82,000 in rural areas
as against Rs. 1,53,000 in urban areas.
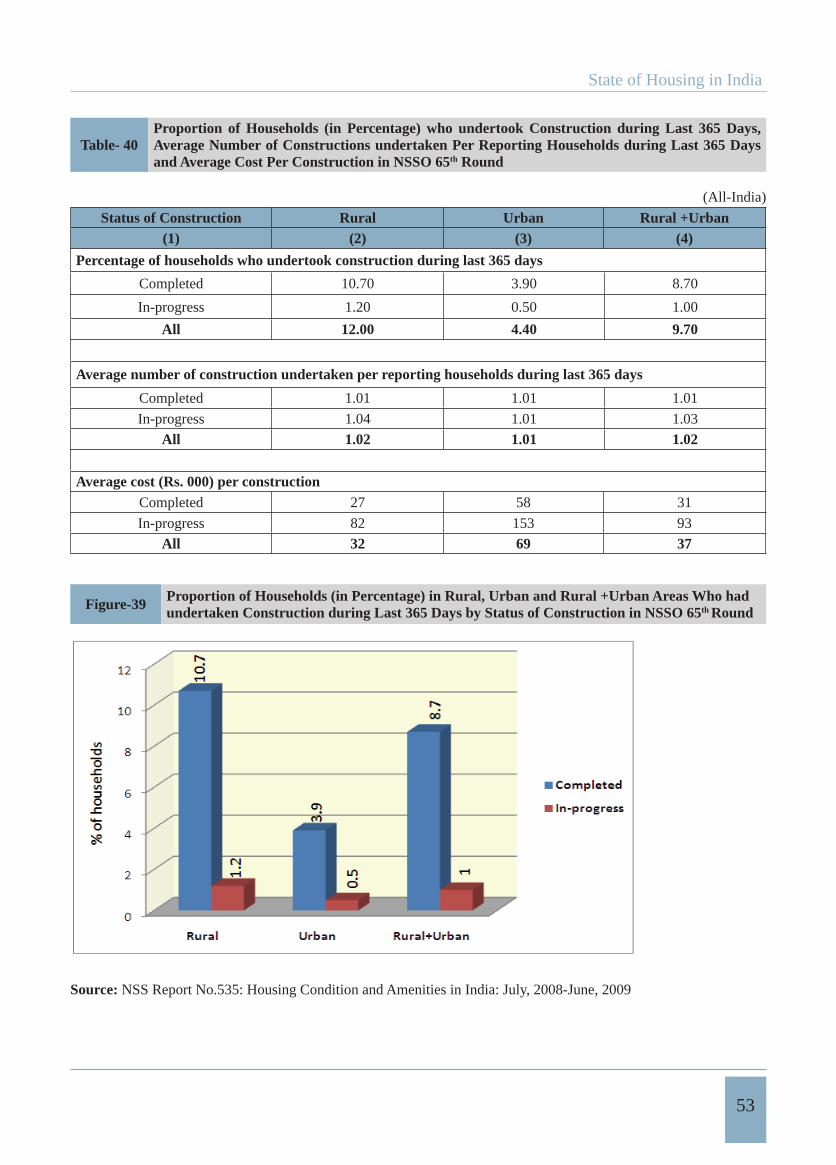
State of Housing in India
53
Table- 40Proportion of Households (in Percentage) who undertook Construction during Last 365 Days, Average Number of Constructions undertaken Per Reporting Households during Last 365 Days and Average Cost Per Construction in NSSO 65th Round
(All-India)
Status of Construction Rural Urban Rural +Urban(1) (2) (3) (4)
Percentage of households who undertook construction during last 365 days
Completed 10.70 3.90 8.70
In-progress 1.20 0.50 1.00
All 12.00 4.40 9.70
Average number of construction undertaken per reporting households during last 365 days
Completed 1.01 1.01 1.01
In-progress 1.04 1.01 1.03
All 1.02 1.01 1.02
Average cost (Rs. 000) per constructionCompleted 27 58 31
In-progress 82 153 93
All 32 69 37
Figure-39 Proportion of Households (in Percentage) in Rural, Urban and Rural +Urban Areas Who had undertaken Construction during Last 365 Days by Status of Construction in NSSO 65th Round
Source: NSS Report No.535: Housing Condition and Amenities in India: July, 2008-June, 2009
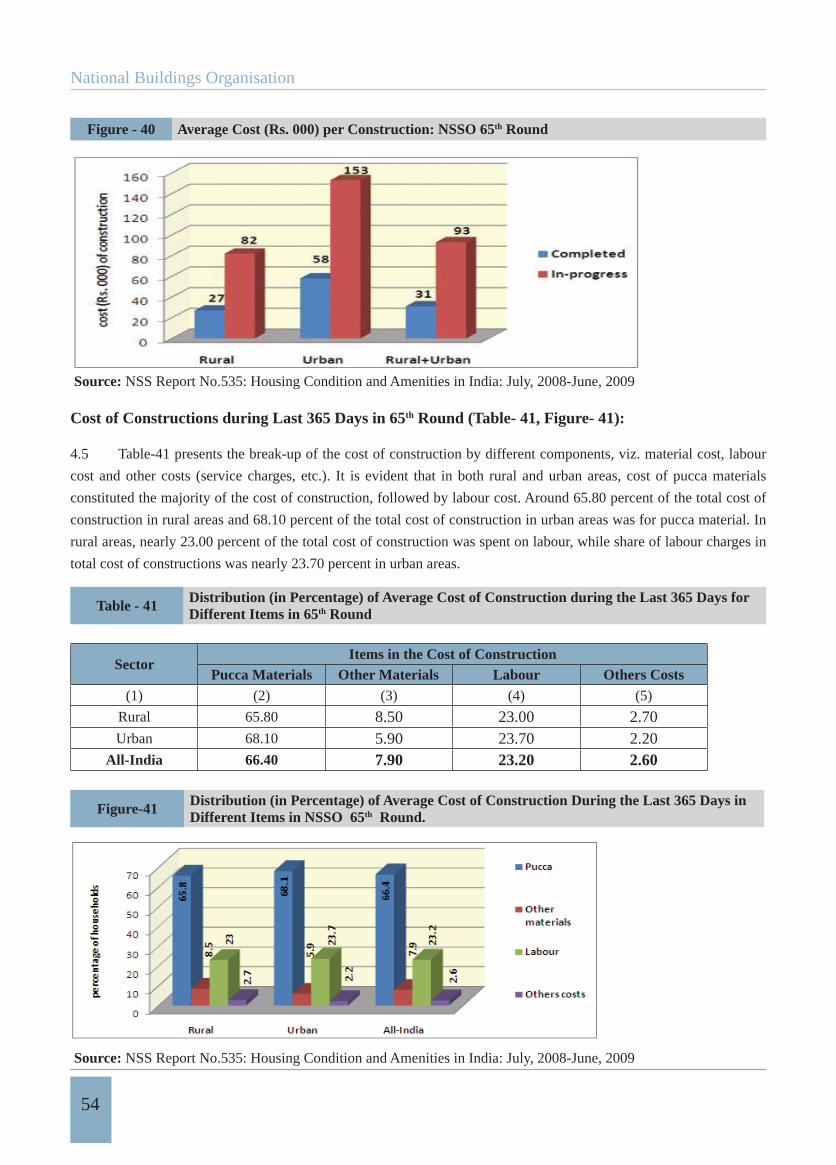
National Buildings Organisation
54
Figure - 40 Average Cost (Rs. 000) per Construction: NSSO 65th Round
Source: NSS Report No.535: Housing Condition and Amenities in India: July, 2008-June, 2009
Cost of Constructions during Last 365 Days in 65th Round (Table- 41, Figure- 41):
4.5 Table-41 presents the break-up of the cost of construction by different components, viz. material cost, labour
cost and other costs (service charges, etc.). It is evident that in both rural and urban areas, cost of pucca materials
constituted the majority of the cost of construction, followed by labour cost. Around 65.80 percent of the total cost of
construction in rural areas and 68.10 percent of the total cost of construction in urban areas was for pucca material. In
rural areas, nearly 23.00 percent of the total cost of construction was spent on labour, while share of labour charges in
total cost of constructions was nearly 23.70 percent in urban areas.
Table - 41 Distribution (in Percentage) of Average Cost of Construction during the Last 365 Days for Different Items in 65th Round
SectorItems in the Cost of Construction
Pucca Materials Other Materials Labour Others Costs(1) (2) (3) (4) (5)
Rural 65.80 8.50 23.00 2.70Urban 68.10 5.90 23.70 2.20
All-India 66.40 7.90 23.20 2.60
Figure-41 Distribution (in Percentage) of Average Cost of Construction During the Last 365 Days in Different Items in NSSO 65th Round.
Source: NSS Report No.535: Housing Condition and Amenities in India: July, 2008-June, 2009
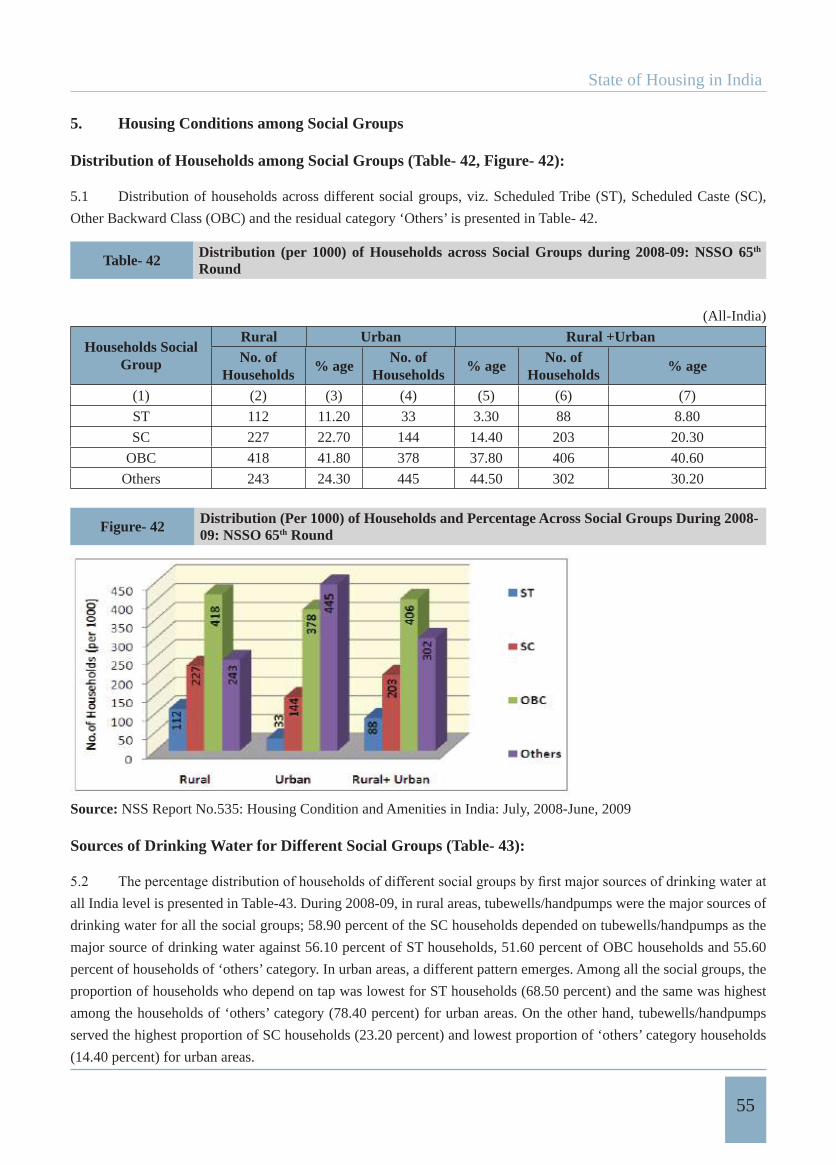
State of Housing in India
55
5. Housing Conditions among Social Groups
Distribution of Households among Social Groups (Table- 42, Figure- 42):
5.1 Distribution of households across different social groups, viz. Scheduled Tribe (ST), Scheduled Caste (SC),
Other Backward Class (OBC) and the residual category ‘Others’ is presented in Table- 42.
Table- 42 Distribution (per 1000) of Households across Social Groups during 2008-09: NSSO 65th
Round
(All-India)
Households Social Group
Rural Urban Rural +UrbanNo. of
Households% age
No. of Households
% ageNo. of
Households% age
(1) (2) (3) (4) (5) (6) (7)
ST 112 11.20 33 3.30 88 8.80
SC 227 22.70 144 14.40 203 20.30
OBC 418 41.80 378 37.80 406 40.60
Others 243 24.30 445 44.50 302 30.20
Figure- 42 Distribution (Per 1000) of Households and Percentage Across Social Groups During 2008-09: NSSO 65th Round
Source: NSS Report No.535: Housing Condition and Amenities in India: July, 2008-June, 2009
Sources of Drinking Water for Different Social Groups (Table- 43):
all India level is presented in Table-43. During 2008-09, in rural areas, tubewells/handpumps were the major sources of
drinking water for all the social groups; 58.90 percent of the SC households depended on tubewells/handpumps as the
major source of drinking water against 56.10 percent of ST households, 51.60 percent of OBC households and 55.60
percent of households of ‘others’ category. In urban areas, a different pattern emerges. Among all the social groups, the
proportion of households who depend on tap was lowest for ST households (68.50 percent) and the same was highest
among the households of ‘others’ category (78.40 percent) for urban areas. On the other hand, tubewells/handpumps
served the highest proportion of SC households (23.20 percent) and lowest proportion of ‘others’ category households
(14.40 percent) for urban areas.
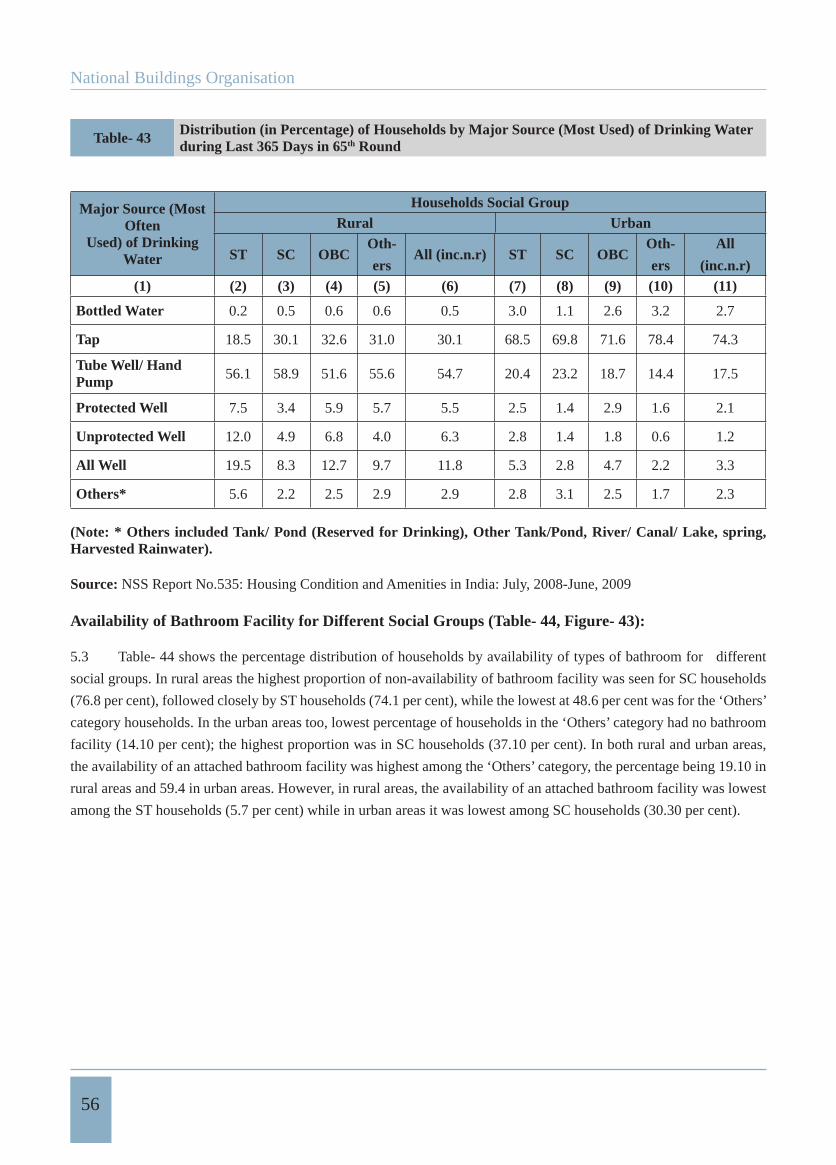
National Buildings Organisation
56
Table- 43 Distribution (in Percentage) of Households by Major Source (Most Used) of Drinking Water during Last 365 Days in 65th Round
Major Source (Most Often
Used) of Drinking Water
Households Social GroupRural Urban
ST SC OBCOth-
ersAll (inc.n.r) ST SC OBC
Oth-
ers
All
(inc.n.r)(1) (2) (3) (4) (5) (6) (7) (8) (9) (10) (11)
Bottled Water 0.2 0.5 0.6 0.6 0.5 3.0 1.1 2.6 3.2 2.7
Tap 18.5 30.1 32.6 31.0 30.1 68.5 69.8 71.6 78.4 74.3
Tube Well/ Hand Pump 56.1 58.9 51.6 55.6 54.7 20.4 23.2 18.7 14.4 17.5
Protected Well 7.5 3.4 5.9 5.7 5.5 2.5 1.4 2.9 1.6 2.1
Unprotected Well 12.0 4.9 6.8 4.0 6.3 2.8 1.4 1.8 0.6 1.2
All Well 19.5 8.3 12.7 9.7 11.8 5.3 2.8 4.7 2.2 3.3
Others* 5.6 2.2 2.5 2.9 2.9 2.8 3.1 2.5 1.7 2.3
(Note: * Others included Tank/ Pond (Reserved for Drinking), Other Tank/Pond, River/ Canal/ Lake, spring, Harvested Rainwater).
Source: NSS Report No.535: Housing Condition and Amenities in India: July, 2008-June, 2009
Availability of Bathroom Facility for Different Social Groups (Table- 44, Figure- 43):
5.3 Table- 44 shows the percentage distribution of households by availability of types of bathroom for different
social groups. In rural areas the highest proportion of non-availability of bathroom facility was seen for SC households
(76.8 per cent), followed closely by ST households (74.1 per cent), while the lowest at 48.6 per cent was for the ‘Others’
category households. In the urban areas too, lowest percentage of households in the ‘Others’ category had no bathroom
facility (14.10 per cent); the highest proportion was in SC households (37.10 per cent). In both rural and urban areas,
the availability of an attached bathroom facility was highest among the ‘Others’ category, the percentage being 19.10 in
rural areas and 59.4 in urban areas. However, in rural areas, the availability of an attached bathroom facility was lowest
among the ST households (5.7 per cent) while in urban areas it was lowest among SC households (30.30 per cent).
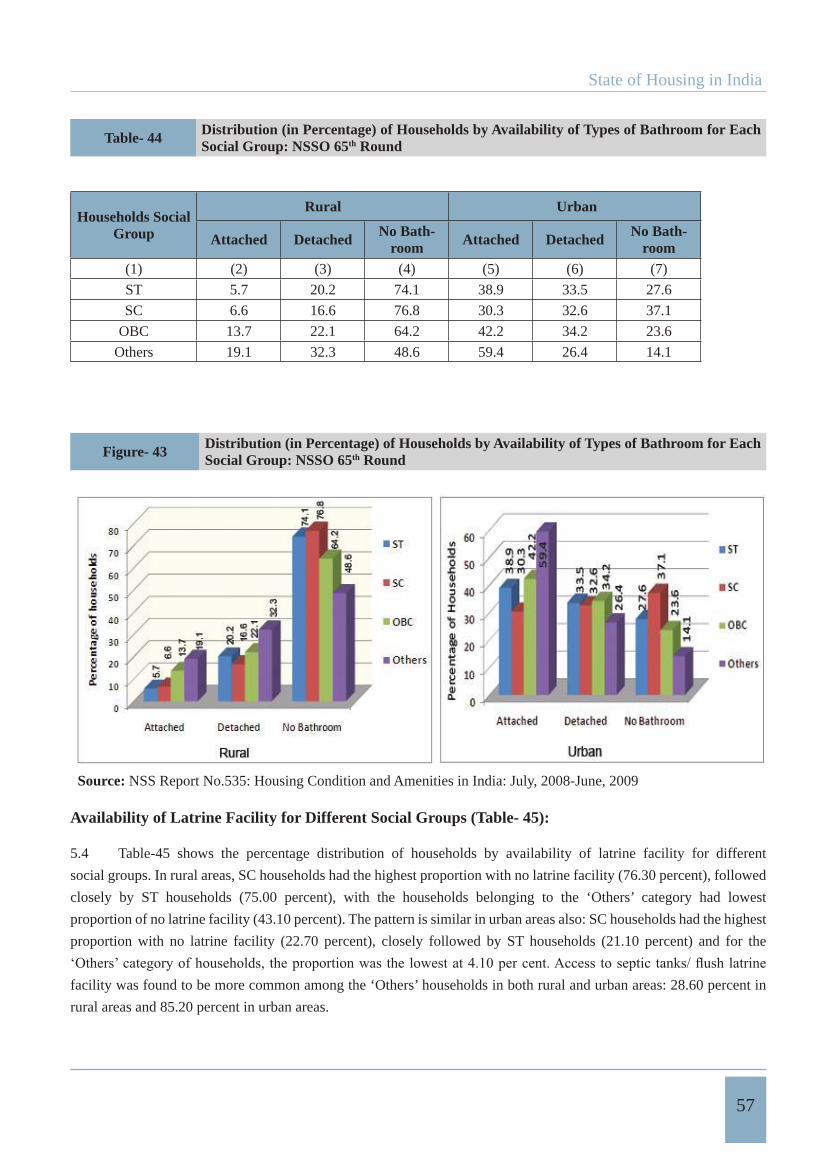
State of Housing in India
57
Table- 44 Distribution (in Percentage) of Households by Availability of Types of Bathroom for Each Social Group: NSSO 65th Round
Households Social Group
Rural Urban
Attached Detached No Bath-room Attached Detached No Bath-
room(1) (2) (3) (4) (5) (6) (7)
ST 5.7 20.2 74.1 38.9 33.5 27.6
SC 6.6 16.6 76.8 30.3 32.6 37.1
OBC 13.7 22.1 64.2 42.2 34.2 23.6
Others 19.1 32.3 48.6 59.4 26.4 14.1
Figure- 43 Distribution (in Percentage) of Households by Availability of Types of Bathroom for Each Social Group: NSSO 65th Round
Source: NSS Report No.535: Housing Condition and Amenities in India: July, 2008-June, 2009
Availability of Latrine Facility for Different Social Groups (Table- 45):
5.4 Table-45 shows the percentage distribution of households by availability of latrine facility for different
social groups. In rural areas, SC households had the highest proportion with no latrine facility (76.30 percent), followed
closely by ST households (75.00 percent), with the households belonging to the ‘Others’ category had lowest
proportion of no latrine facility (43.10 percent). The pattern is similar in urban areas also: SC households had the highest
proportion with no latrine facility (22.70 percent), closely followed by ST households (21.10 percent) and for the
facility was found to be more common among the ‘Others’ households in both rural and urban areas: 28.60 percent in
rural areas and 85.20 percent in urban areas.
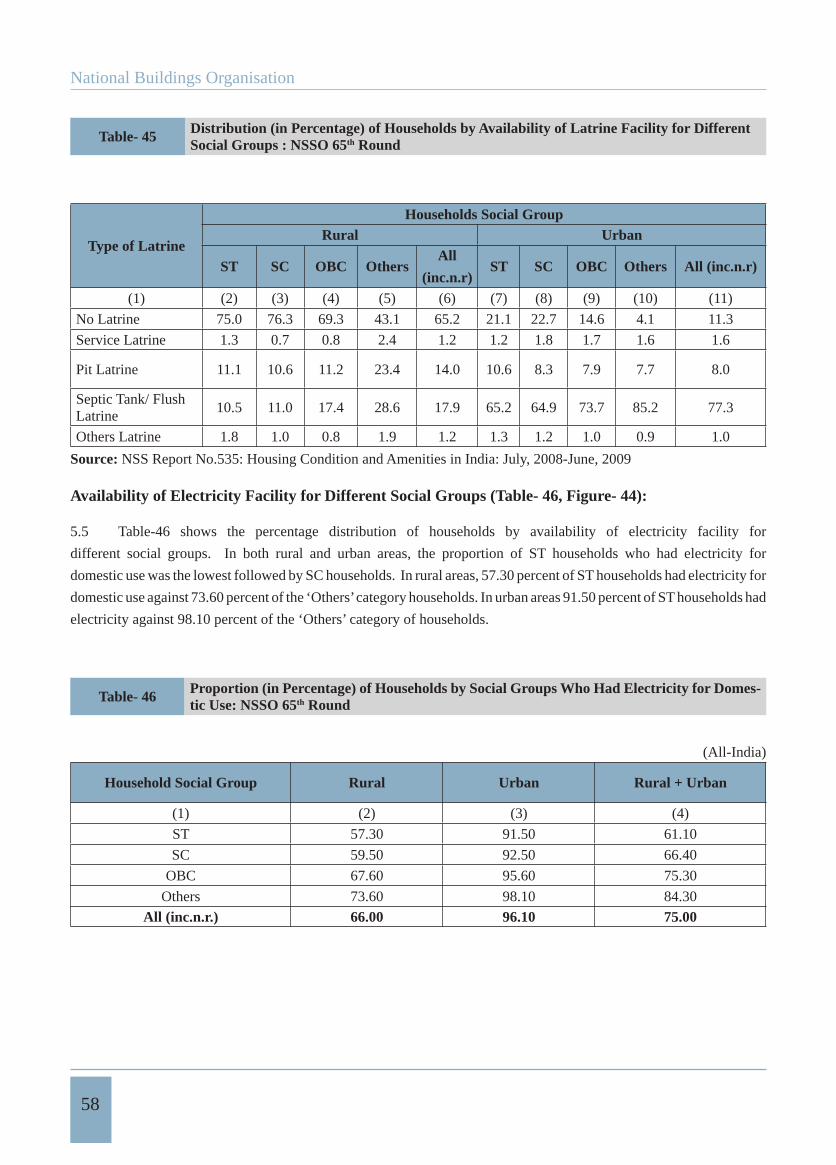
National Buildings Organisation
58
Table- 45 Distribution (in Percentage) of Households by Availability of Latrine Facility for Different Social Groups : NSSO 65th Round
Type of Latrine
Households Social GroupRural Urban
ST SC OBC OthersAll
(inc.n.r)ST SC OBC Others All (inc.n.r)
(1) (2) (3) (4) (5) (6) (7) (8) (9) (10) (11)
No Latrine 75.0 76.3 69.3 43.1 65.2 21.1 22.7 14.6 4.1 11.3
Service Latrine 1.3 0.7 0.8 2.4 1.2 1.2 1.8 1.7 1.6 1.6
Pit Latrine 11.1 10.6 11.2 23.4 14.0 10.6 8.3 7.9 7.7 8.0
Septic Tank/ Flush Latrine
10.5 11.0 17.4 28.6 17.9 65.2 64.9 73.7 85.2 77.3
Others Latrine 1.8 1.0 0.8 1.9 1.2 1.3 1.2 1.0 0.9 1.0
Source: NSS Report No.535: Housing Condition and Amenities in India: July, 2008-June, 2009
Availability of Electricity Facility for Different Social Groups (Table- 46, Figure- 44):
5.5 Table-46 shows the percentage distribution of households by availability of electricity facility for
different social groups. In both rural and urban areas, the proportion of ST households who had electricity for
domestic use was the lowest followed by SC households. In rural areas, 57.30 percent of ST households had electricity for
domestic use against 73.60 percent of the ‘Others’ category households. In urban areas 91.50 percent of ST households had
electricity against 98.10 percent of the ‘Others’ category of households.
Table- 46 Proportion (in Percentage) of Households by Social Groups Who Had Electricity for Domes-tic Use: NSSO 65th Round
(All-India)
Household Social Group Rural Urban Rural + Urban
(1) (2) (3) (4)
ST 57.30 91.50 61.10
SC 59.50 92.50 66.40
OBC 67.60 95.60 75.30
Others 73.60 98.10 84.30
All (inc.n.r.) 66.00 96.10 75.00
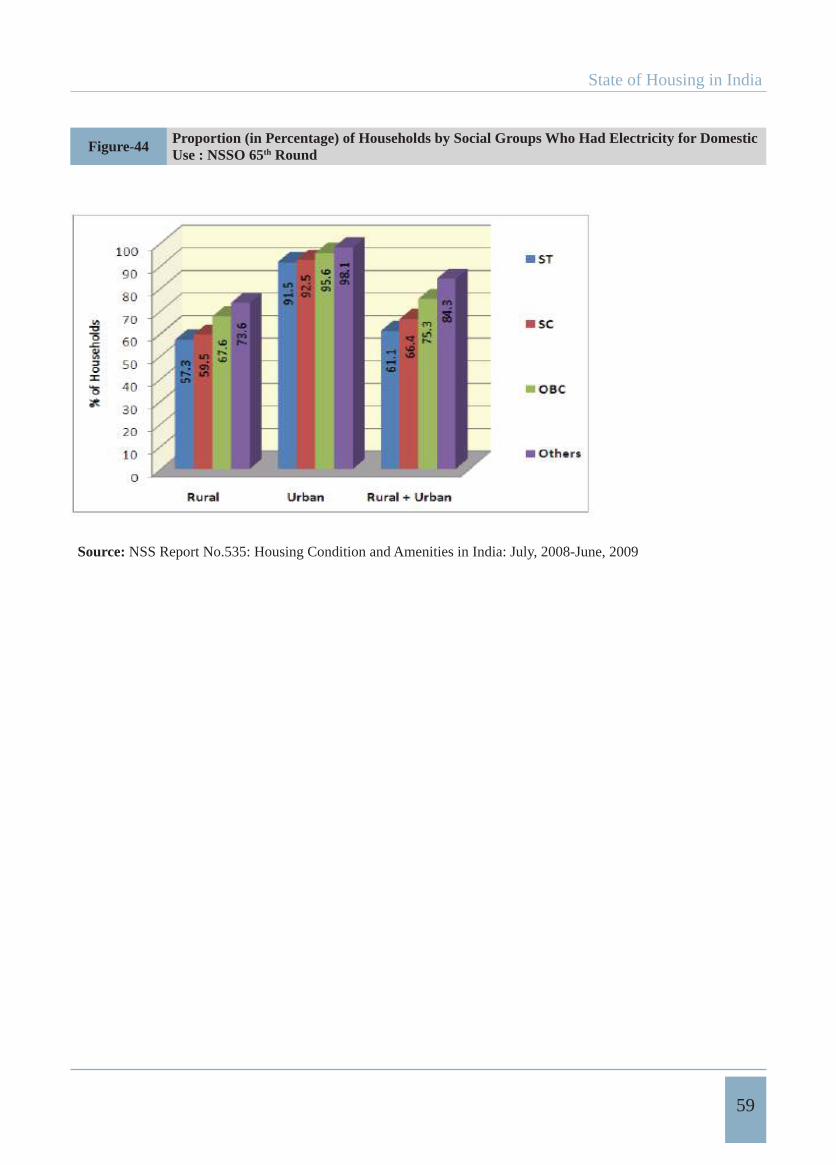
State of Housing in India
59
Figure-44 Proportion (in Percentage) of Households by Social Groups Who Had Electricity for Domestic Use : NSSO 65th Round
Source: NSS Report No.535: Housing Condition and Amenities in India: July, 2008-June, 2009
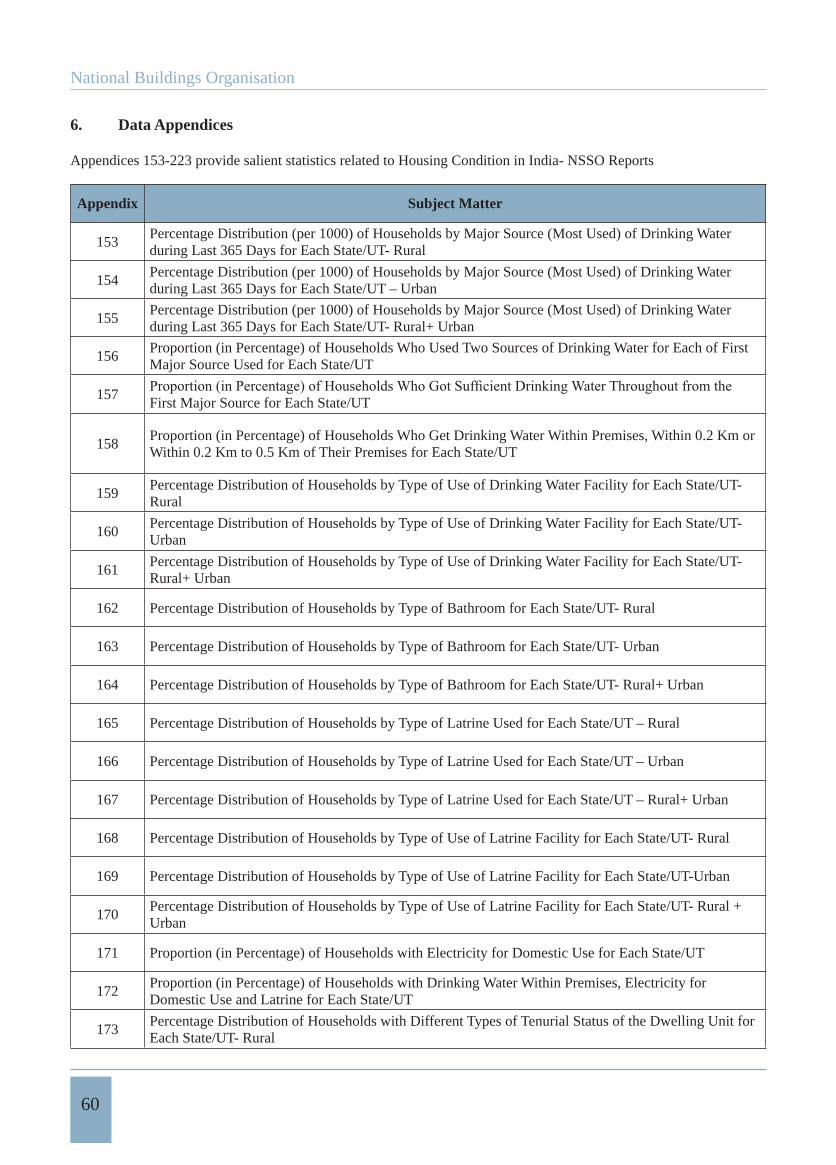
National Buildings Organisation
60
6. Data Appendices
Appendices 153-223 provide salient statistics related to Housing Condition in India- NSSO Reports
Appendix Subject Matter
153Percentage Distribution (per 1000) of Households by Major Source (Most Used) of Drinking Water during Last 365 Days for Each State/UT- Rural
154Percentage Distribution (per 1000) of Households by Major Source (Most Used) of Drinking Water during Last 365 Days for Each State/UT – Urban
155Percentage Distribution (per 1000) of Households by Major Source (Most Used) of Drinking Water during Last 365 Days for Each State/UT- Rural+ Urban
156Proportion (in Percentage) of Households Who Used Two Sources of Drinking Water for Each of First Major Source Used for Each State/UT
157First Major Source for Each State/UT
158Proportion (in Percentage) of Households Who Get Drinking Water Within Premises, Within 0.2 Km or Within 0.2 Km to 0.5 Km of Their Premises for Each State/UT
159Percentage Distribution of Households by Type of Use of Drinking Water Facility for Each State/UT- Rural
160Percentage Distribution of Households by Type of Use of Drinking Water Facility for Each State/UT- Urban
161Percentage Distribution of Households by Type of Use of Drinking Water Facility for Each State/UT- Rural+ Urban
162 Percentage Distribution of Households by Type of Bathroom for Each State/UT- Rural
163 Percentage Distribution of Households by Type of Bathroom for Each State/UT- Urban
164 Percentage Distribution of Households by Type of Bathroom for Each State/UT- Rural+ Urban
165 Percentage Distribution of Households by Type of Latrine Used for Each State/UT – Rural
166 Percentage Distribution of Households by Type of Latrine Used for Each State/UT – Urban
167 Percentage Distribution of Households by Type of Latrine Used for Each State/UT – Rural+ Urban
168 Percentage Distribution of Households by Type of Use of Latrine Facility for Each State/UT- Rural
169 Percentage Distribution of Households by Type of Use of Latrine Facility for Each State/UT-Urban
170Percentage Distribution of Households by Type of Use of Latrine Facility for Each State/UT- Rural + Urban
171 Proportion (in Percentage) of Households with Electricity for Domestic Use for Each State/UT
172Proportion (in Percentage) of Households with Drinking Water Within Premises, Electricity for Domestic Use and Latrine for Each State/UT
173Percentage Distribution of Households with Different Types of Tenurial Status of the Dwelling Unit for Each State/UT- Rural
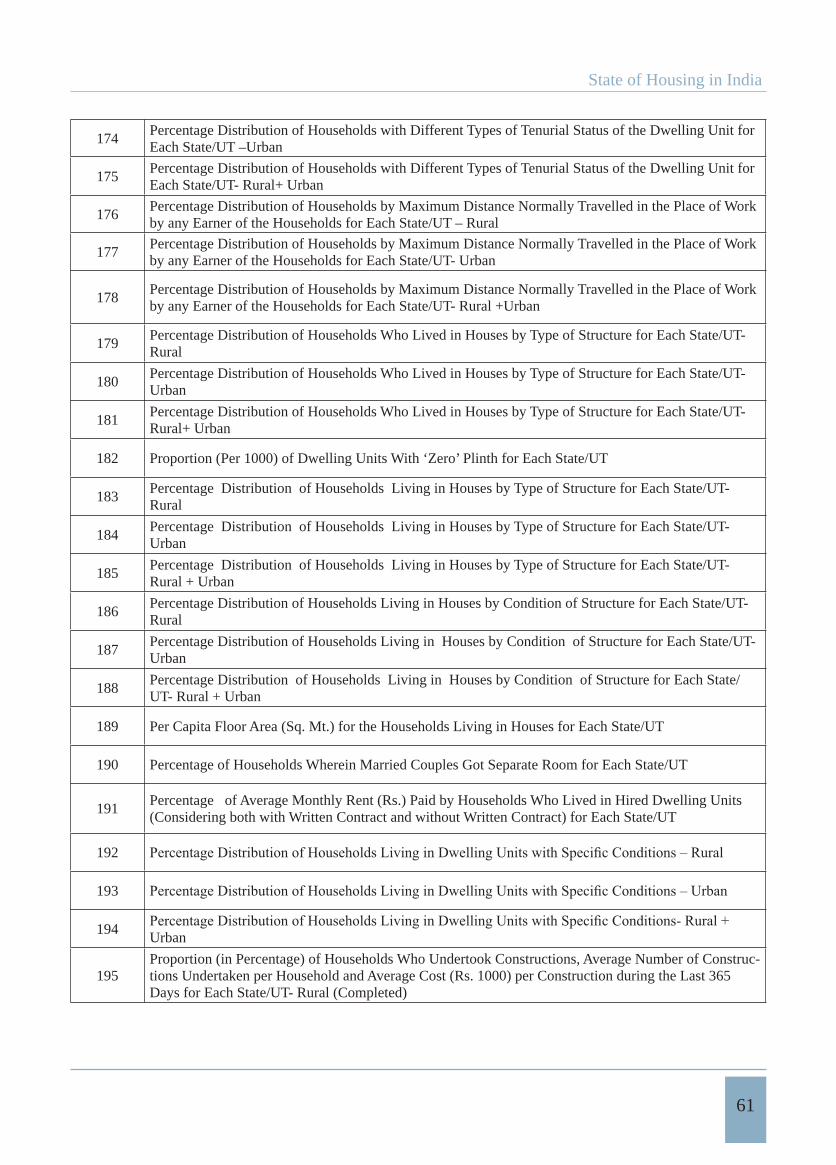
State of Housing in India
61
174Percentage Distribution of Households with Different Types of Tenurial Status of the Dwelling Unit for Each State/UT –Urban
175Percentage Distribution of Households with Different Types of Tenurial Status of the Dwelling Unit for Each State/UT- Rural+ Urban
176Percentage Distribution of Households by Maximum Distance Normally Travelled in the Place of Work by any Earner of the Households for Each State/UT – Rural
177Percentage Distribution of Households by Maximum Distance Normally Travelled in the Place of Work by any Earner of the Households for Each State/UT- Urban
178Percentage Distribution of Households by Maximum Distance Normally Travelled in the Place of Work by any Earner of the Households for Each State/UT- Rural +Urban
179Percentage Distribution of Households Who Lived in Houses by Type of Structure for Each State/UT- Rural
180Percentage Distribution of Households Who Lived in Houses by Type of Structure for Each State/UT- Urban
181Percentage Distribution of Households Who Lived in Houses by Type of Structure for Each State/UT- Rural+ Urban
182 Proportion (Per 1000) of Dwelling Units With ‘Zero’ Plinth for Each State/UT
183Percentage Distribution of Households Living in Houses by Type of Structure for Each State/UT- Rural
184Percentage Distribution of Households Living in Houses by Type of Structure for Each State/UT- Urban
185Percentage Distribution of Households Living in Houses by Type of Structure for Each State/UT- Rural + Urban
186Percentage Distribution of Households Living in Houses by Condition of Structure for Each State/UT- Rural
187Percentage Distribution of Households Living in Houses by Condition of Structure for Each State/UT- Urban
188Percentage Distribution of Households Living in Houses by Condition of Structure for Each State/UT- Rural + Urban
189 Per Capita Floor Area (Sq. Mt.) for the Households Living in Houses for Each State/UT
190 Percentage of Households Wherein Married Couples Got Separate Room for Each State/UT
191Percentage of Average Monthly Rent (Rs.) Paid by Households Who Lived in Hired Dwelling Units (Considering both with Written Contract and without Written Contract) for Each State/UT
192
193
194Urban
195Proportion (in Percentage) of Households Who Undertook Constructions, Average Number of Construc-tions Undertaken per Household and Average Cost (Rs. 1000) per Construction during the Last 365 Days for Each State/UT- Rural (Completed)
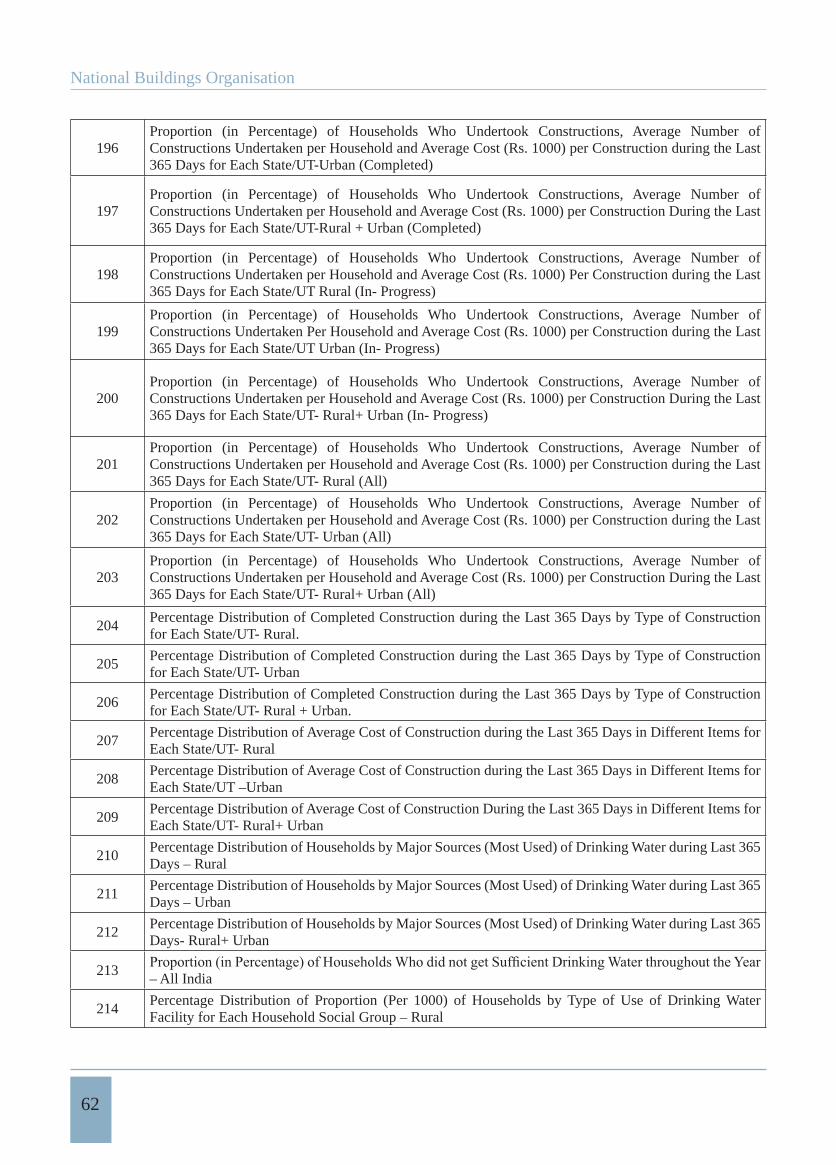
National Buildings Organisation
62
196Proportion (in Percentage) of Households Who Undertook Constructions, Average Number of Constructions Undertaken per Household and Average Cost (Rs. 1000) per Construction during the Last 365 Days for Each State/UT-Urban (Completed)
197Proportion (in Percentage) of Households Who Undertook Constructions, Average Number of Constructions Undertaken per Household and Average Cost (Rs. 1000) per Construction During the Last 365 Days for Each State/UT-Rural + Urban (Completed)
198Proportion (in Percentage) of Households Who Undertook Constructions, Average Number of Constructions Undertaken per Household and Average Cost (Rs. 1000) Per Construction during the Last 365 Days for Each State/UT Rural (In- Progress)
199Proportion (in Percentage) of Households Who Undertook Constructions, Average Number of Constructions Undertaken Per Household and Average Cost (Rs. 1000) per Construction during the Last 365 Days for Each State/UT Urban (In- Progress)
200Proportion (in Percentage) of Households Who Undertook Constructions, Average Number of Constructions Undertaken per Household and Average Cost (Rs. 1000) per Construction During the Last 365 Days for Each State/UT- Rural+ Urban (In- Progress)
201Proportion (in Percentage) of Households Who Undertook Constructions, Average Number of Constructions Undertaken per Household and Average Cost (Rs. 1000) per Construction during the Last 365 Days for Each State/UT- Rural (All)
202Proportion (in Percentage) of Households Who Undertook Constructions, Average Number of Constructions Undertaken per Household and Average Cost (Rs. 1000) per Construction during the Last 365 Days for Each State/UT- Urban (All)
203Proportion (in Percentage) of Households Who Undertook Constructions, Average Number of Constructions Undertaken per Household and Average Cost (Rs. 1000) per Construction During the Last 365 Days for Each State/UT- Rural+ Urban (All)
204Percentage Distribution of Completed Construction during the Last 365 Days by Type of Construction for Each State/UT- Rural.
205Percentage Distribution of Completed Construction during the Last 365 Days by Type of Construction for Each State/UT- Urban
206Percentage Distribution of Completed Construction during the Last 365 Days by Type of Construction for Each State/UT- Rural + Urban.
207Percentage Distribution of Average Cost of Construction during the Last 365 Days in Different Items for Each State/UT- Rural
208Percentage Distribution of Average Cost of Construction during the Last 365 Days in Different Items for Each State/UT –Urban
209Percentage Distribution of Average Cost of Construction During the Last 365 Days in Different Items for Each State/UT- Rural+ Urban
210Percentage Distribution of Households by Major Sources (Most Used) of Drinking Water during Last 365 Days – Rural
211Percentage Distribution of Households by Major Sources (Most Used) of Drinking Water during Last 365 Days – Urban
212Percentage Distribution of Households by Major Sources (Most Used) of Drinking Water during Last 365 Days- Rural+ Urban
213– All India
214Percentage Distribution of Proportion (Per 1000) of Households by Type of Use of Drinking Water Facility for Each Household Social Group – Rural
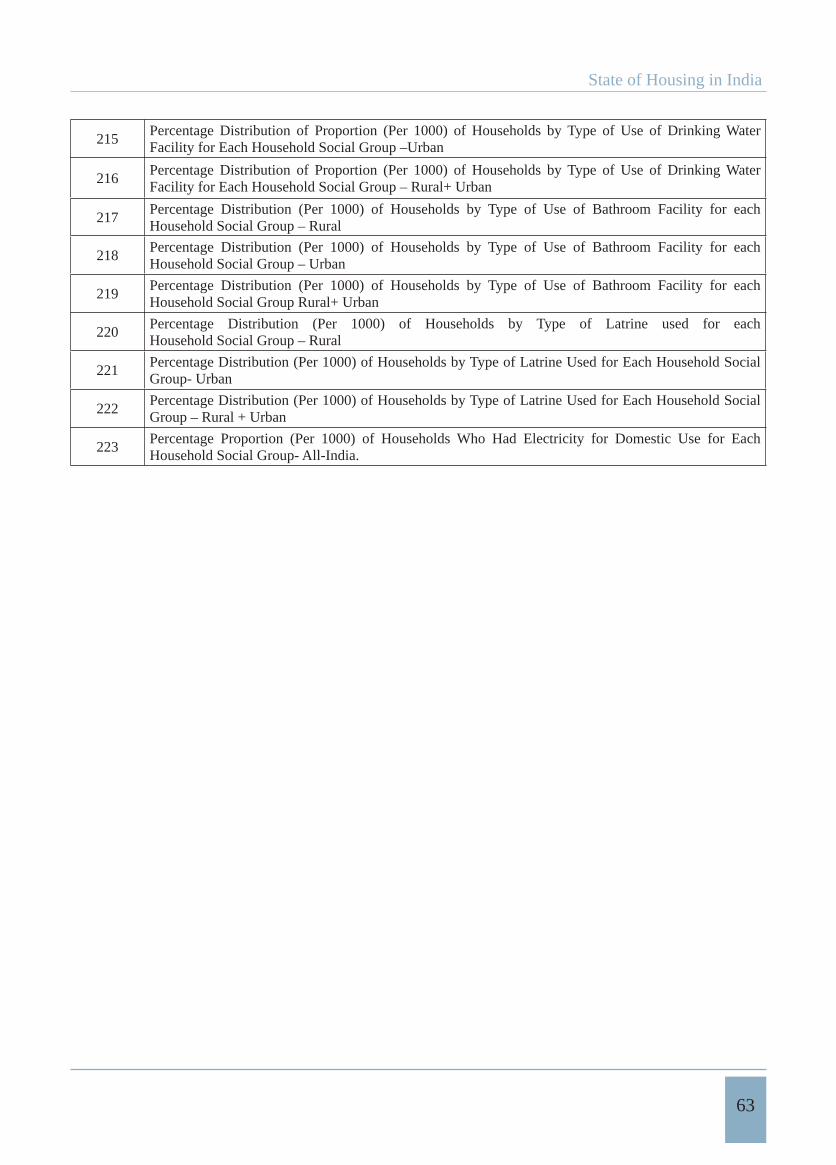
State of Housing in India
63
215Percentage Distribution of Proportion (Per 1000) of Households by Type of Use of Drinking Water Facility for Each Household Social Group –Urban
216Percentage Distribution of Proportion (Per 1000) of Households by Type of Use of Drinking Water Facility for Each Household Social Group – Rural+ Urban
217Percentage Distribution (Per 1000) of Households by Type of Use of Bathroom Facility for each Household Social Group – Rural
218Percentage Distribution (Per 1000) of Households by Type of Use of Bathroom Facility for each Household Social Group – Urban
219Percentage Distribution (Per 1000) of Households by Type of Use of Bathroom Facility for each Household Social Group Rural+ Urban
220Percentage Distribution (Per 1000) of Households by Type of Latrine used for each Household Social Group – Rural
221Percentage Distribution (Per 1000) of Households by Type of Latrine Used for Each Household Social Group- Urban
222Percentage Distribution (Per 1000) of Households by Type of Latrine Used for Each Household Social Group – Rural + Urban
223Percentage Proportion (Per 1000) of Households Who Had Electricity for Domestic Use for Each Household Social Group- All-India.
National Buildings Organisation
64
4 Slums in India
Slum Statistics in India
The nodal agencies in Government of India for collection, collation and dissemination of statistics relating to
Slum Population condition in India are:
(ii) National Sample Survey Organisation (NSSO).
50,000 populations. Subsequently, towns with population between 20,000 and 50,000 were also considered for slum
population enumeration. Census data relating to slums in the 2001 throw up some interesting light on the slum population
listing of slum settlements with the urban bodies and district authorities concerned and lack of proactive action by
States/local authorities in declaring/notifying slums. The 2001 Census data is partial due to exclusion of towns with less
than 20,000 population, and slum clusters, which are not formally or informally recognized if the population was less
than 300. Census 2001 data therefore does not provide all information on slums in 2001.
3. National Sample Survey Organisation (NSSO)
3.1 The second most important data source on slums is NSSO. NSSO is the nodal authority in the country to
conduct major socio-economic surveys. So far NSSO has conducted four surveys on slums, which provide data on
estimated number of slums, households, basic amenities in slums, etc. The NSSO collects data on slums as part of its
survey on Housing Conditions and Slums.
st Round, namely “Conditions of Slum Area in Cities’ was conducted in
1977 and was restricted to Class I cities. The second survey “Slums in India’ was conducted in1993; slum data was
collected separately for rural and urban areas. The third survey was conducted exclusively for urban slum in 2002 namely
“Conditions of Urban Slum”. The fourth and latest i.e. the 65th Round Slum Survey was conducted in 2008-09. So far
four exclusive Slum Surveys have been conducted by NSSO; however the 31st round results cannot be compared with
the rest of three survey results, as it was restricted to Class-I cities only. Being sample survey, NSSO data have their
states in India.
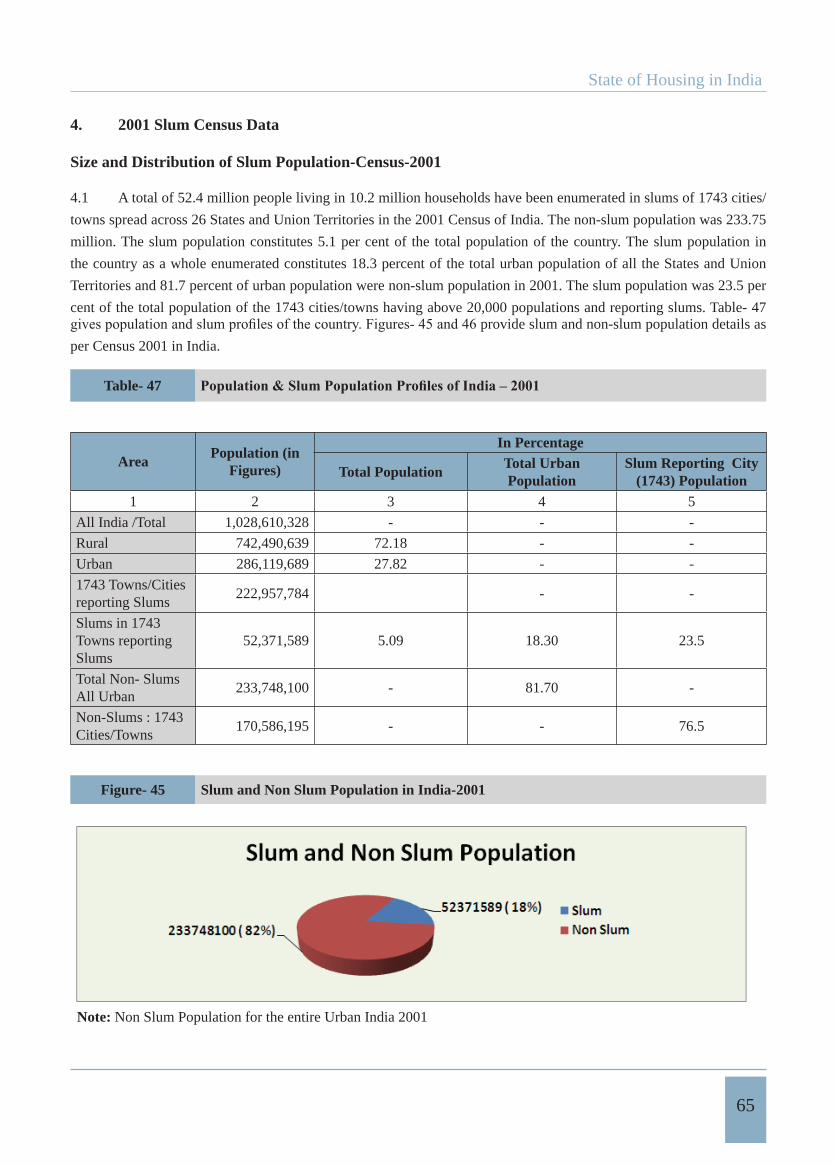
State of Housing in India
65
4. 2001 Slum Census Data
Size and Distribution of Slum Population-Census-2001
4.1 A total of 52.4 million people living in 10.2 million households have been enumerated in slums of 1743 cities/
towns spread across 26 States and Union Territories in the 2001 Census of India. The non-slum population was 233.75
million. The slum population constitutes 5.1 per cent of the total population of the country. The slum population in
the country as a whole enumerated constitutes 18.3 percent of the total urban population of all the States and Union
Territories and 81.7 percent of urban population were non-slum population in 2001. The slum population was 23.5 per
cent of the total population of the 1743 cities/towns having above 20,000 populations and reporting slums. Table- 47 provide slum and non-slum population details as
per Census 2001 in India.
Table- 47
AreaPopulation (in
Figures)
In Percentage
Total PopulationTotal Urban Population
Slum Reporting City (1743) Population
1 2 3 4 5
All India /Total 1,028,610,328 - - -
Rural 742,490,639 72.18 - -
Urban 286,119,689 27.82 - -
1743 Towns/Cities reporting Slums
222,957,784 - -
Slums in 1743 Towns reporting Slums
52,371,589 5.09 18.30 23.5
Total Non- Slums All Urban
233,748,100 - 81.70 -
Non-Slums : 1743 Cities/Towns
170,586,195 - - 76.5
Figure- 45 Slum and Non Slum Population in India-2001
Note: Non Slum Population for the entire Urban India 2001
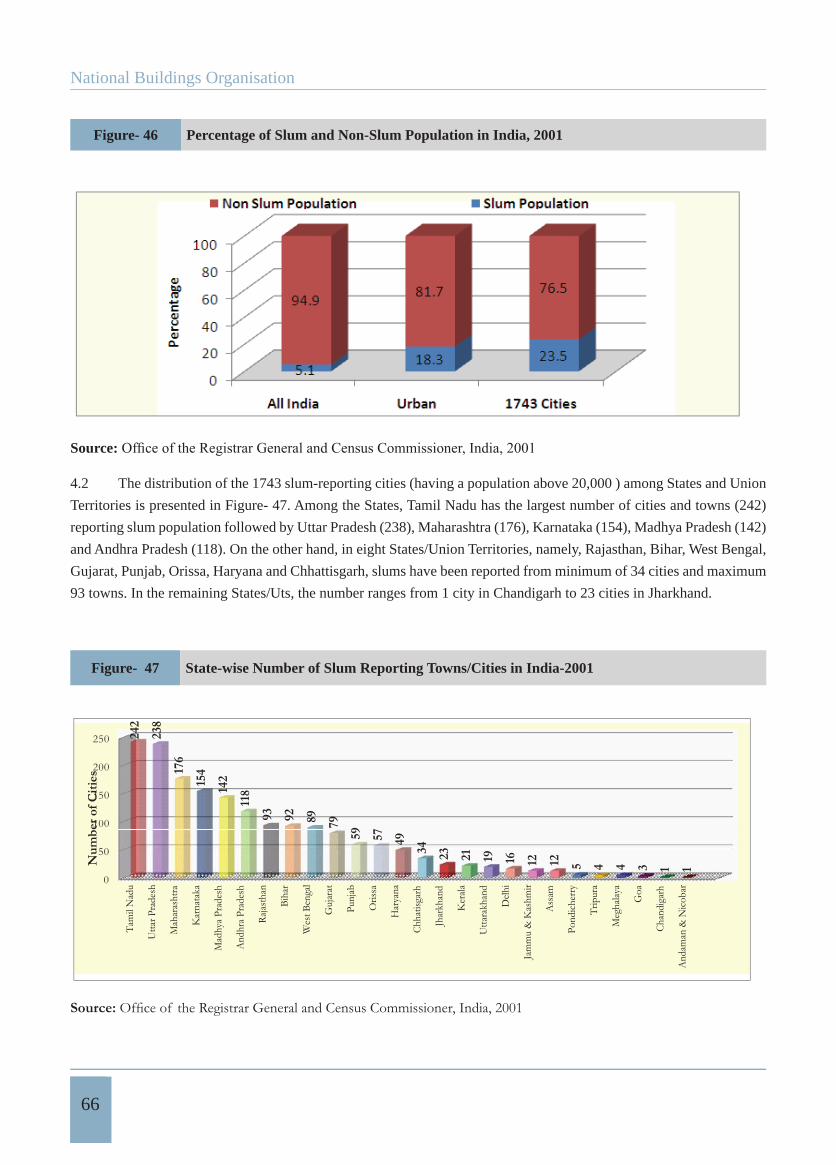
National Buildings Organisation
66
Figure- 46 Percentage of Slum and Non-Slum Population in India, 2001
Source:
4.2 The distribution of the 1743 slum-reporting cities (having a population above 20,000 ) among States and Union
Territories is presented in Figure- 47. Among the States, Tamil Nadu has the largest number of cities and towns (242)
reporting slum population followed by Uttar Pradesh (238), Maharashtra (176), Karnataka (154), Madhya Pradesh (142)
and Andhra Pradesh (118). On the other hand, in eight States/Union Territories, namely, Rajasthan, Bihar, West Bengal,
Gujarat, Punjab, Orissa, Haryana and Chhattisgarh, slums have been reported from minimum of 34 cities and maximum
93 towns. In the remaining States/Uts, the number ranges from 1 city in Chandigarh to 23 cities in Jharkhand.
Figure- 47 State-wise Number of Slum Reporting Towns/Cities in India-2001
0
50
100
150
200
250
Tam
il N
adu
Utta
r Pra
desh
Mah
aras
htra
Kar
nata
ka
Mad
hya P
rade
sh
And
hra P
rade
sh
Rajas
than
Biha
r
Wes
t Ben
gal
Guj
arat
Punj
ab
Oris
sa
Har
yana
Chha
tisga
rh
Jhar
khan
d
Ker
ala
Utta
rakh
and
Delh
i
Jam
mu
& K
ashm
ir
Ass
am
Pond
icher
ry
Trip
ura
Meg
halay
a
Goa
Chan
diga
rh
And
aman
& N
icoba
r
242
238
176
154
142
118
93 92 89 79
59 57 49
34 23 21 19 16 12 12 5 4 4 3 1 1Num
ber
of C
itie
s
Source:
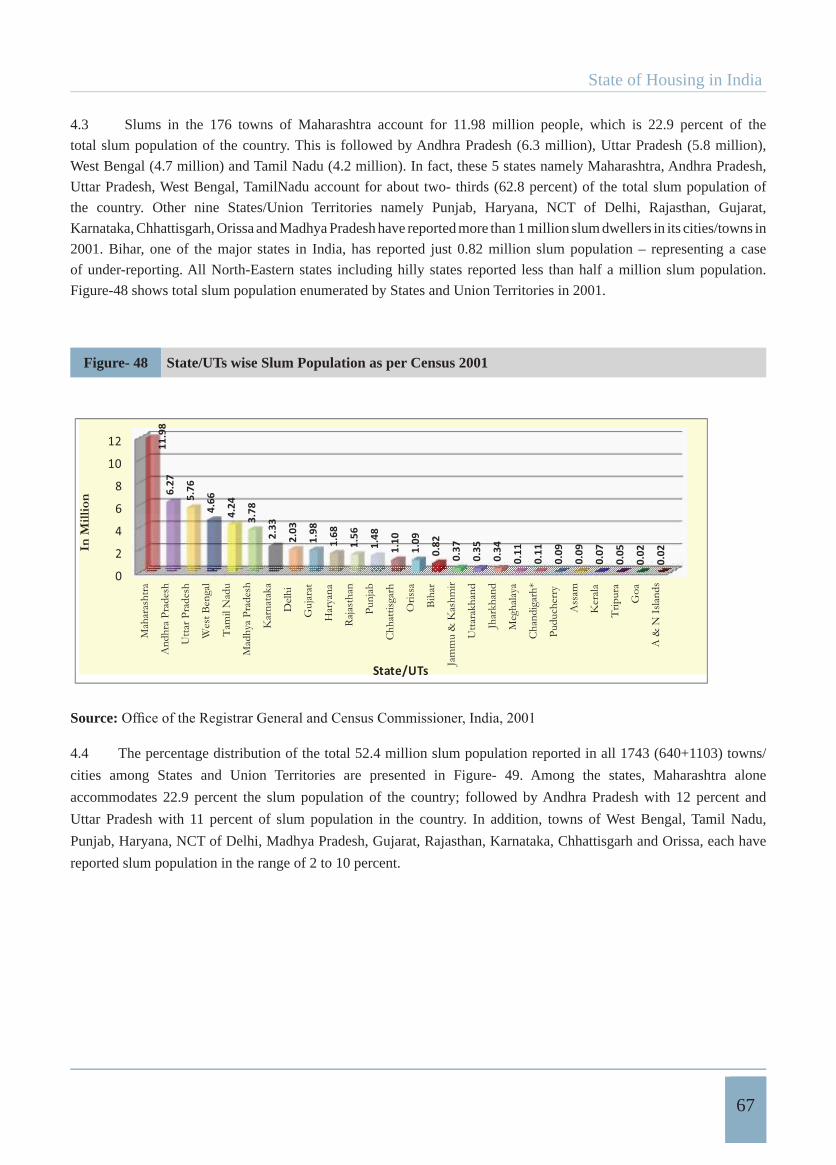
State of Housing in India
67
4.3 Slums in the 176 towns of Maharashtra account for 11.98 million people, which is 22.9 percent of the
total slum population of the country. This is followed by Andhra Pradesh (6.3 million), Uttar Pradesh (5.8 million),
West Bengal (4.7 million) and Tamil Nadu (4.2 million). In fact, these 5 states namely Maharashtra, Andhra Pradesh,
Uttar Pradesh, West Bengal, TamilNadu account for about two- thirds (62.8 percent) of the total slum population of
the country. Other nine States/Union Territories namely Punjab, Haryana, NCT of Delhi, Rajasthan, Gujarat,
Karnataka, Chhattisgarh, Orissa and Madhya Pradesh have reported more than 1 million slum dwellers in its cities/towns in
2001. Bihar, one of the major states in India, has reported just 0.82 million slum population – representing a case
of under-reporting. All North-Eastern states including hilly states reported less than half a million slum population.
Figure-48 shows total slum population enumerated by States and Union Territories in 2001.
Figure- 48 State/UTs wise Slum Population as per Census 2001
0
2
4
6
8
10
12
Mah
aras
htra
And
hra
Prad
esh
Utta
r Pra
desh
Wes
t Ben
gal
Tam
il N
adu
Mad
hya
Prad
esh
Kar
nata
ka
Del
hi
Guj
arat
Har
yana
Raj
asth
an
Punj
ab
Chh
attis
garh
Oris
sa
Biha
r
Jam
mu
& K
ashm
ir
Utta
rakh
and
Jhar
khan
d
Meg
hala
ya
Cha
ndig
arh*
Pudu
cher
ry
Ass
am
Ker
ala
Trip
ura
Goa
11.9
86.
27
5.76
4.66
4.24
3.78
2.33
2.03
1.98
1.68
1.56
1.48
1.10
1.09
0.82
0.37
0.35
0.34
0.11
0.11
0.09
0.09
0.07
0.05
0.02
0.02In
Mil
lion
State/UTs
Source:
4.4 The percentage distribution of the total 52.4 million slum population reported in all 1743 (640+1103) towns/
cities among States and Union Territories are presented in Figure- 49. Among the states, Maharashtra alone
accommodates 22.9 percent the slum population of the country; followed by Andhra Pradesh with 12 percent and
Uttar Pradesh with 11 percent of slum population in the country. In addition, towns of West Bengal, Tamil Nadu,
Punjab, Haryana, NCT of Delhi, Madhya Pradesh, Gujarat, Rajasthan, Karnataka, Chhattisgarh and Orissa, each have
reported slum population in the range of 2 to 10 percent.
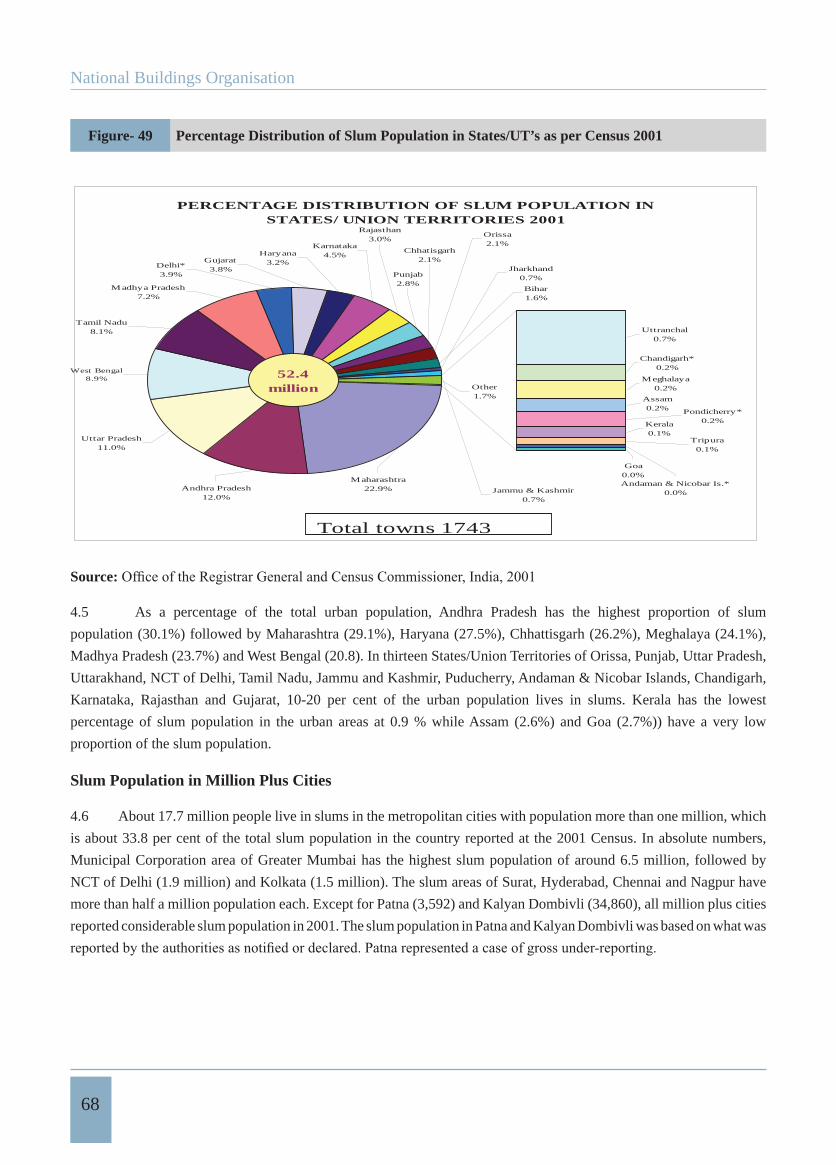
National Buildings Organisation
68
Figure- 49 Percentage Distribution of Slum Population in States/UT’s as per Census 2001
PERCENTAGE DISTRIBUTION OF SLUM POPULATION IN STATES/ UNION TERRITORIES 2001
Tripura0.1%
Kerala0.1%
Pondicherry*0.2%
Goa0.0%Andaman & Nicobar Is.*
0.0%
Assam0.2%
Meghalaya0.2%
Chandigarh*0.2%
Uttranchal0.7%
Punjab2.8%
Rajasthan3.0%
Karnataka4.5%
Chhatisgarh2.1%
Orissa2.1%
Jharkhand0.7%
Bihar1.6%
Other1.7%
Jammu & Kashmir0.7%
Haryana3.2%Gujarat
3.8%Delhi*3.9%
Madhya Pradesh7.2%
Tamil Nadu8.1%
Maharashtra22.9%Andhra Pradesh
12.0%
Uttar Pradesh11.0%
West Bengal8.9% 52.4
million
Total towns 1743
Source:
4.5 As a percentage of the total urban population, Andhra Pradesh has the highest proportion of slum
population (30.1%) followed by Maharashtra (29.1%), Haryana (27.5%), Chhattisgarh (26.2%), Meghalaya (24.1%),
Madhya Pradesh (23.7%) and West Bengal (20.8). In thirteen States/Union Territories of Orissa, Punjab, Uttar Pradesh,
Uttarakhand, NCT of Delhi, Tamil Nadu, Jammu and Kashmir, Puducherry, Andaman & Nicobar Islands, Chandigarh,
Karnataka, Rajasthan and Gujarat, 10-20 per cent of the urban population lives in slums. Kerala has the lowest
percentage of slum population in the urban areas at 0.9 % while Assam (2.6%) and Goa (2.7%)) have a very low
proportion of the slum population.
Slum Population in Million Plus Cities
4.6 About 17.7 million people live in slums in the metropolitan cities with population more than one million, which
is about 33.8 per cent of the total slum population in the country reported at the 2001 Census. In absolute numbers,
Municipal Corporation area of Greater Mumbai has the highest slum population of around 6.5 million, followed by
NCT of Delhi (1.9 million) and Kolkata (1.5 million). The slum areas of Surat, Hyderabad, Chennai and Nagpur have
more than half a million population each. Except for Patna (3,592) and Kalyan Dombivli (34,860), all million plus cities
reported considerable slum population in 2001. The slum population in Patna and Kalyan Dombivli was based on what was
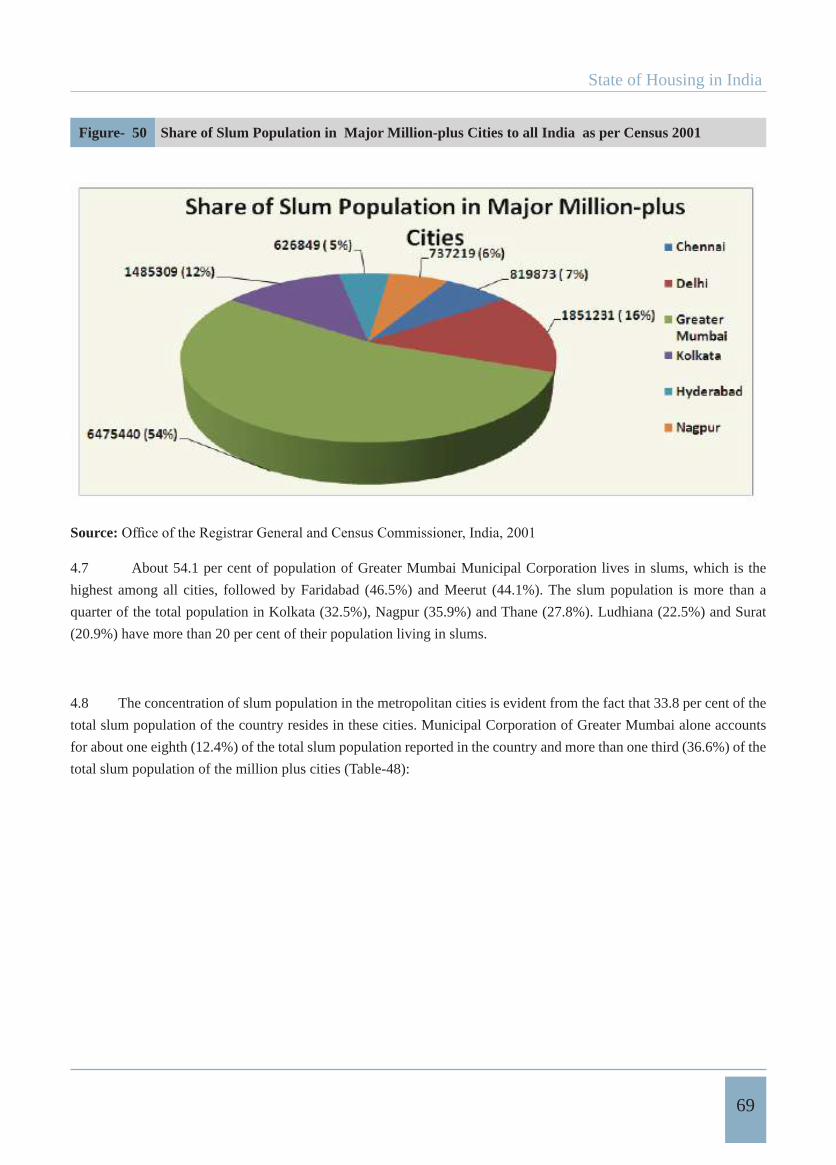
State of Housing in India
69
Figure- 50 Share of Slum Population in Major Million-plus Cities to all India as per Census 2001
Source:
4.7 About 54.1 per cent of population of Greater Mumbai Municipal Corporation lives in slums, which is the
highest among all cities, followed by Faridabad (46.5%) and Meerut (44.1%). The slum population is more than a
quarter of the total population in Kolkata (32.5%), Nagpur (35.9%) and Thane (27.8%). Ludhiana (22.5%) and Surat
(20.9%) have more than 20 per cent of their population living in slums.
4.8 The concentration of slum population in the metropolitan cities is evident from the fact that 33.8 per cent of the
total slum population of the country resides in these cities. Municipal Corporation of Greater Mumbai alone accounts
for about one eighth (12.4%) of the total slum population reported in the country and more than one third (36.6%) of the
total slum population of the million plus cities (Table-48):
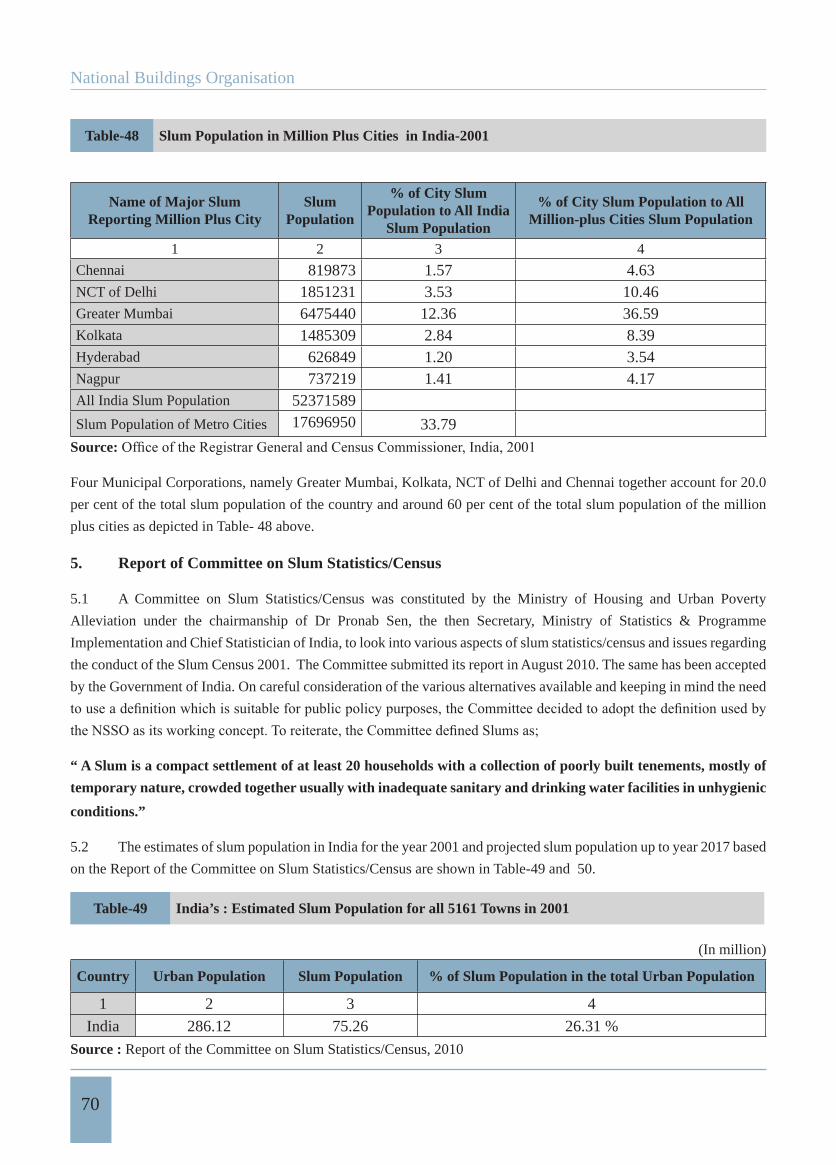
National Buildings Organisation
70
Table-48 Slum Population in Million Plus Cities in India-2001
Name of Major Slum Reporting Million Plus City
SlumPopulation
% of City Slum Population to All India
Slum Population
% of City Slum Population to All Million-plus Cities Slum Population
1 2 3 4
Chennai 819873 1.57 4.63NCT of Delhi 1851231 3.53 10.46Greater Mumbai 6475440 12.36 36.59Kolkata 1485309 2.84 8.39Hyderabad 626849 1.20 3.54Nagpur 737219 1.41 4.17All India Slum Population 52371589
Slum Population of Metro Cities 17696950 33.79
Source:
Four Municipal Corporations, namely Greater Mumbai, Kolkata, NCT of Delhi and Chennai together account for 20.0
per cent of the total slum population of the country and around 60 per cent of the total slum population of the million
plus cities as depicted in Table- 48 above.
5. Report of Committee on Slum Statistics/Census
5.1 A Committee on Slum Statistics/Census was constituted by the Ministry of Housing and Urban Poverty
Alleviation under the chairmanship of Dr Pronab Sen, the then Secretary, Ministry of Statistics & Programme
Implementation and Chief Statistician of India, to look into various aspects of slum statistics/census and issues regarding
the conduct of the Slum Census 2001. The Committee submitted its report in August 2010. The same has been accepted
by the Government of India. On careful consideration of the various alternatives available and keeping in mind the need
“ A Slum is a compact settlement of at least 20 households with a collection of poorly built tenements, mostly of
temporary nature, crowded together usually with inadequate sanitary and drinking water facilities in unhygienic
conditions.”
5.2 The estimates of slum population in India for the year 2001 and projected slum population up to year 2017 based
on the Report of the Committee on Slum Statistics/Census are shown in Table-49 and 50.
Table-49 India’s : Estimated Slum Population for all 5161 Towns in 2001
(In million)
Country Urban Population Slum Population % of Slum Population in the total Urban Population
1 2 3 4
India 286.12 75.26 26.31 %
Source : Report of the Committee on Slum Statistics/Census, 2010
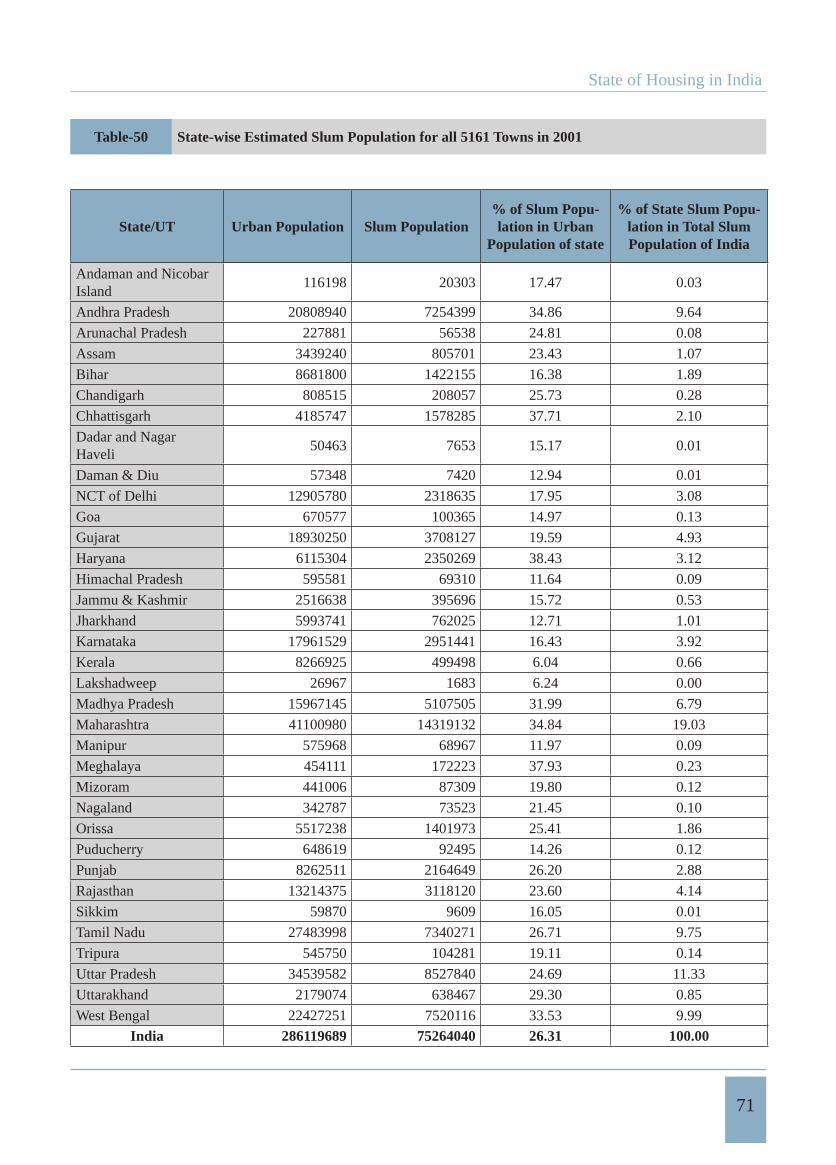
State of Housing in India
71
Table-50 State-wise Estimated Slum Population for all 5161 Towns in 2001
State/UT Urban Population Slum Population% of Slum Popu-lation in Urban
Population of state
% of State Slum Popu-lation in Total Slum Population of India
Andaman and Nicobar Island
116198 20303 17.47 0.03
Andhra Pradesh 20808940 7254399 34.86 9.64
Arunachal Pradesh 227881 56538 24.81 0.08
Assam 3439240 805701 23.43 1.07
Bihar 8681800 1422155 16.38 1.89
Chandigarh 808515 208057 25.73 0.28
Chhattisgarh 4185747 1578285 37.71 2.10
Dadar and Nagar Haveli
50463 7653 15.17 0.01
Daman & Diu 57348 7420 12.94 0.01
NCT of Delhi 12905780 2318635 17.95 3.08
Goa 670577 100365 14.97 0.13
Gujarat 18930250 3708127 19.59 4.93
Haryana 6115304 2350269 38.43 3.12
Himachal Pradesh 595581 69310 11.64 0.09
Jammu & Kashmir 2516638 395696 15.72 0.53
Jharkhand 5993741 762025 12.71 1.01
Karnataka 17961529 2951441 16.43 3.92
Kerala 8266925 499498 6.04 0.66
Lakshadweep 26967 1683 6.24 0.00
Madhya Pradesh 15967145 5107505 31.99 6.79
Maharashtra 41100980 14319132 34.84 19.03
Manipur 575968 68967 11.97 0.09
Meghalaya 454111 172223 37.93 0.23
Mizoram 441006 87309 19.80 0.12
Nagaland 342787 73523 21.45 0.10
Orissa 5517238 1401973 25.41 1.86
Puducherry 648619 92495 14.26 0.12
Punjab 8262511 2164649 26.20 2.88
Rajasthan 13214375 3118120 23.60 4.14
Sikkim 59870 9609 16.05 0.01
Tamil Nadu 27483998 7340271 26.71 9.75
Tripura 545750 104281 19.11 0.14
Uttar Pradesh 34539582 8527840 24.69 11.33
Uttarakhand 2179074 638467 29.30 0.85
West Bengal 22427251 7520116 33.53 9.99
India 286119689 75264040 26.31 100.00
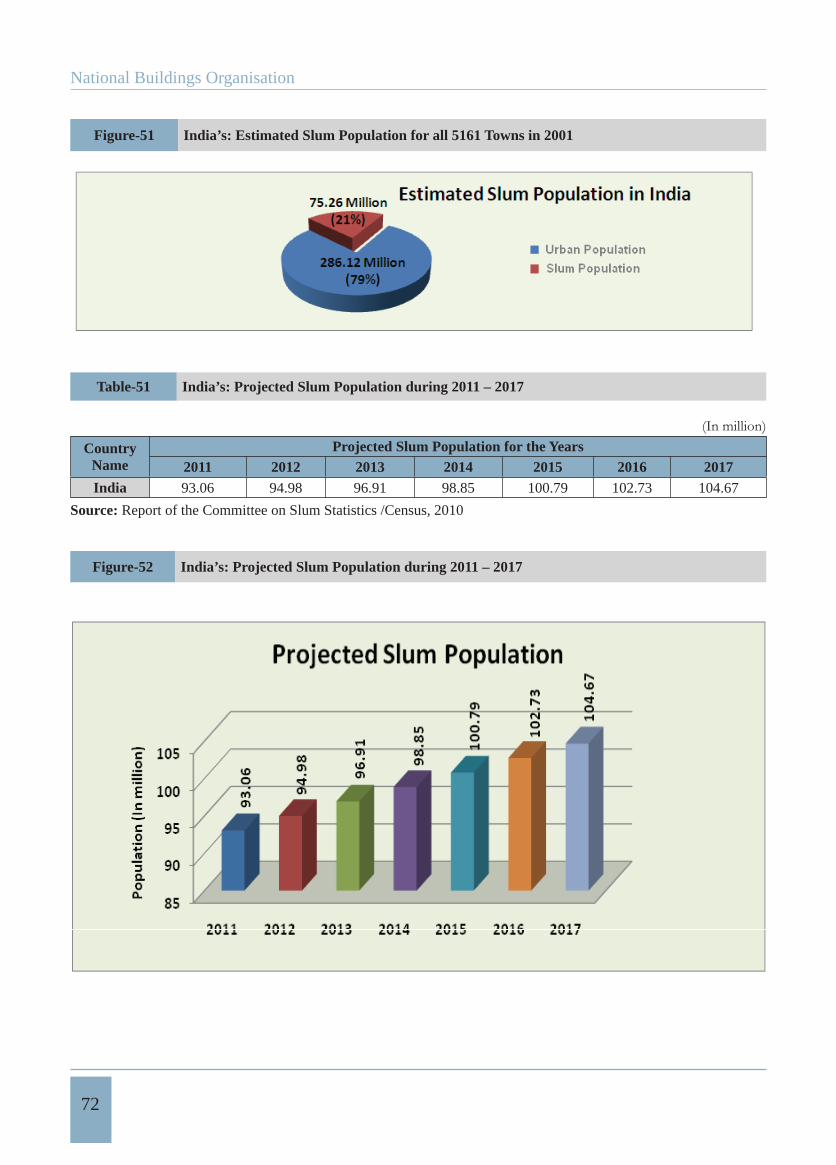
National Buildings Organisation
72
Figure-51 India’s: Estimated Slum Population for all 5161 Towns in 2001
Table-51 India’s: Projected Slum Population during 2011 – 2017
CountryName
Projected Slum Population for the Years2011 2012 2013 2014 2015 2016 2017
India 93.06 94.98 96.91 98.85 100.79 102.73 104.67
Source: Report of the Committee on Slum Statistics /Census, 2010
Figure-52 India’s: Projected Slum Population during 2011 – 2017
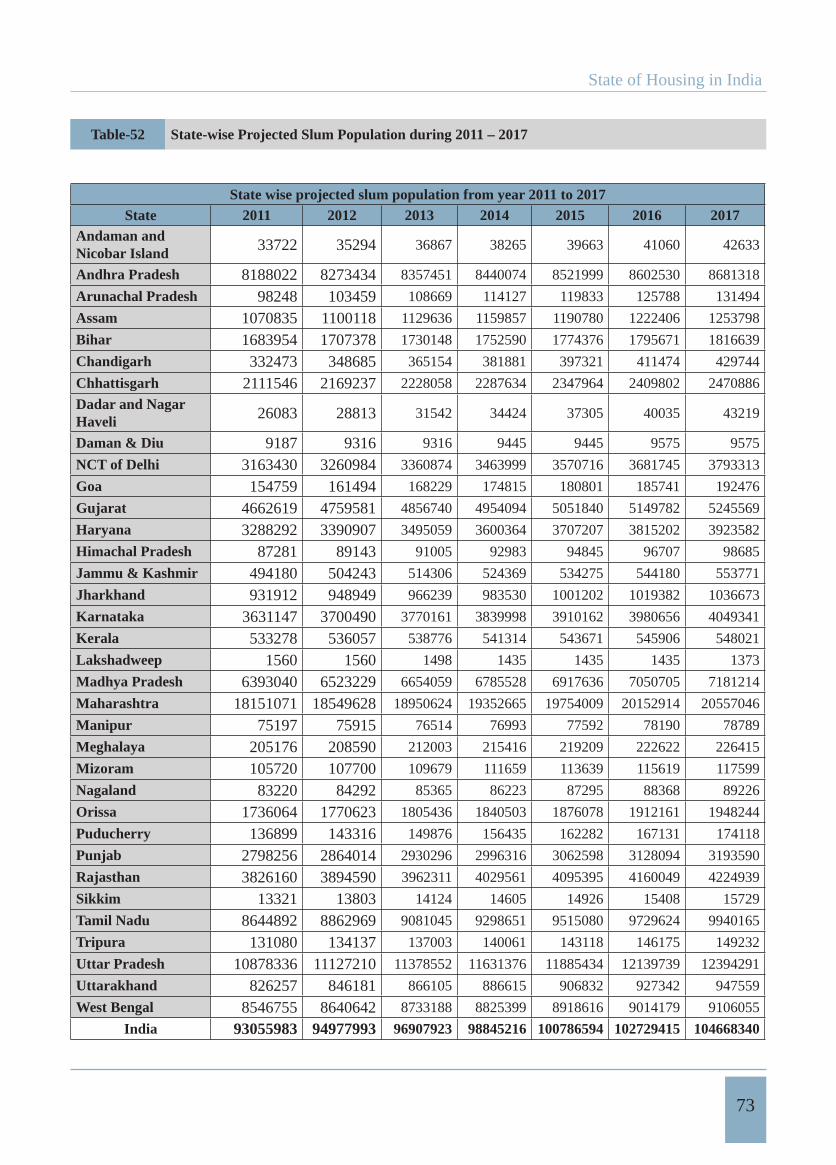
State of Housing in India
73
Table-52 State-wise Projected Slum Population during 2011 – 2017
State wise projected slum population from year 2011 to 2017State 2011 2012 2013 2014 2015 2016 2017
Andaman and Nicobar Island 33722 35294 36867 38265 39663 41060 42633
Andhra Pradesh 8188022 8273434 8357451 8440074 8521999 8602530 8681318
Arunachal Pradesh 98248 103459 108669 114127 119833 125788 131494
Assam 1070835 1100118 1129636 1159857 1190780 1222406 1253798
Bihar 1683954 1707378 1730148 1752590 1774376 1795671 1816639
Chandigarh 332473 348685 365154 381881 397321 411474 429744
Chhattisgarh 2111546 2169237 2228058 2287634 2347964 2409802 2470886
Dadar and Nagar Haveli 26083 28813 31542 34424 37305 40035 43219
Daman & Diu 9187 9316 9316 9445 9445 9575 9575
NCT of Delhi 3163430 3260984 3360874 3463999 3570716 3681745 3793313
Goa 154759 161494 168229 174815 180801 185741 192476
Gujarat 4662619 4759581 4856740 4954094 5051840 5149782 5245569
Haryana 3288292 3390907 3495059 3600364 3707207 3815202 3923582
Himachal Pradesh 87281 89143 91005 92983 94845 96707 98685
Jammu & Kashmir 494180 504243 514306 524369 534275 544180 553771
Jharkhand 931912 948949 966239 983530 1001202 1019382 1036673
Karnataka 3631147 3700490 3770161 3839998 3910162 3980656 4049341
Kerala 533278 536057 538776 541314 543671 545906 548021
Lakshadweep 1560 1560 1498 1435 1435 1435 1373
Madhya Pradesh 6393040 6523229 6654059 6785528 6917636 7050705 7181214
Maharashtra 18151071 18549628 18950624 19352665 19754009 20152914 20557046
Manipur 75197 75915 76514 76993 77592 78190 78789
Meghalaya 205176 208590 212003 215416 219209 222622 226415
Mizoram 105720 107700 109679 111659 113639 115619 117599
Nagaland 83220 84292 85365 86223 87295 88368 89226
Orissa 1736064 1770623 1805436 1840503 1876078 1912161 1948244
Puducherry 136899 143316 149876 156435 162282 167131 174118
Punjab 2798256 2864014 2930296 2996316 3062598 3128094 3193590
Rajasthan 3826160 3894590 3962311 4029561 4095395 4160049 4224939
Sikkim 13321 13803 14124 14605 14926 15408 15729
Tamil Nadu 8644892 8862969 9081045 9298651 9515080 9729624 9940165
Tripura 131080 134137 137003 140061 143118 146175 149232
Uttar Pradesh 10878336 11127210 11378552 11631376 11885434 12139739 12394291
Uttarakhand 826257 846181 866105 886615 906832 927342 947559
West Bengal 8546755 8640642 8733188 8825399 8918616 9014179 9106055
India 93055983 94977993 96907923 98845216 100786594 102729415 104668340
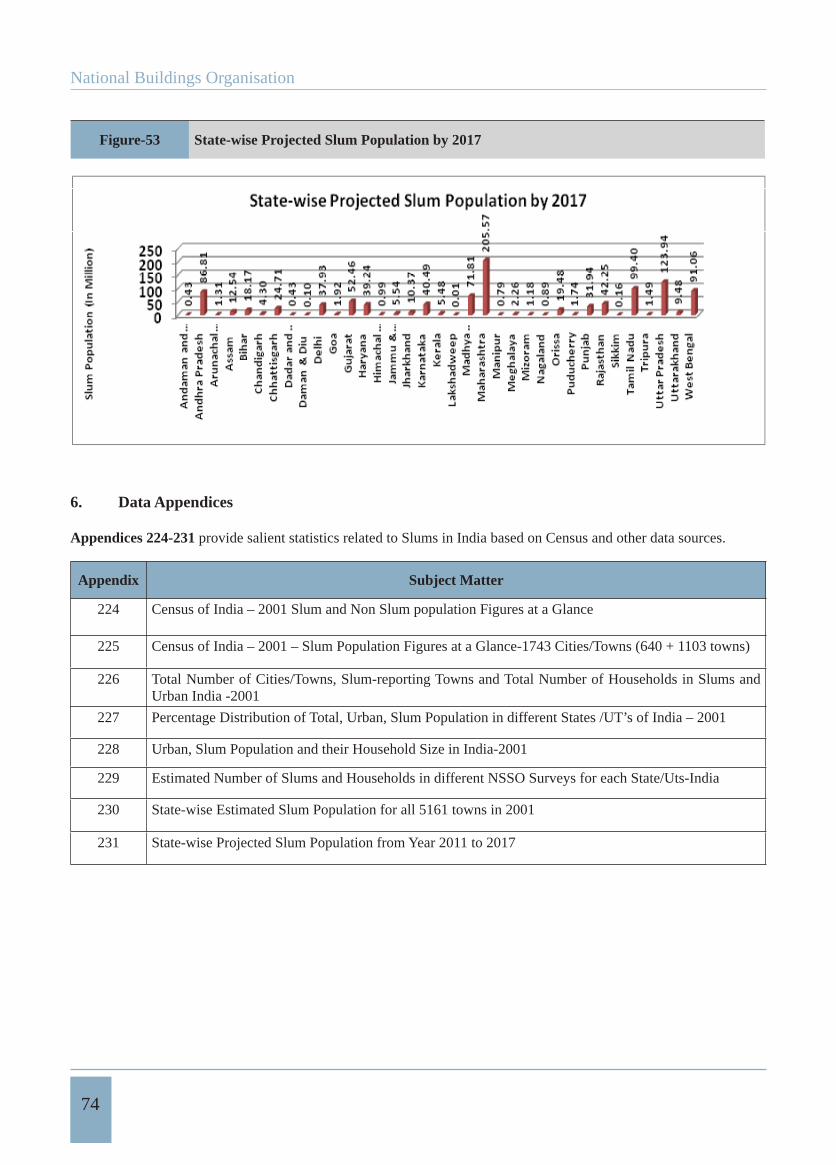
National Buildings Organisation
74
Figure-53 State-wise Projected Slum Population by 2017
6. Data Appendices
Appendices 224-231 provide salient statistics related to Slums in India based on Census and other data sources.
Appendix Subject Matter
224 Census of India – 2001 Slum and Non Slum population Figures at a Glance
225 Census of India – 2001 – Slum Population Figures at a Glance-1743 Cities/Towns (640 + 1103 towns)
226 Total Number of Cities/Towns, Slum-reporting Towns and Total Number of Households in Slums and Urban India -2001
227 Percentage Distribution of Total, Urban, Slum Population in different States /UT’s of India – 2001
228 Urban, Slum Population and their Household Size in India-2001
229 Estimated Number of Slums and Households in different NSSO Surveys for each State/Uts-India
230 State-wise Estimated Slum Population for all 5161 towns in 2001
231 State-wise Projected Slum Population from Year 2011 to 2017
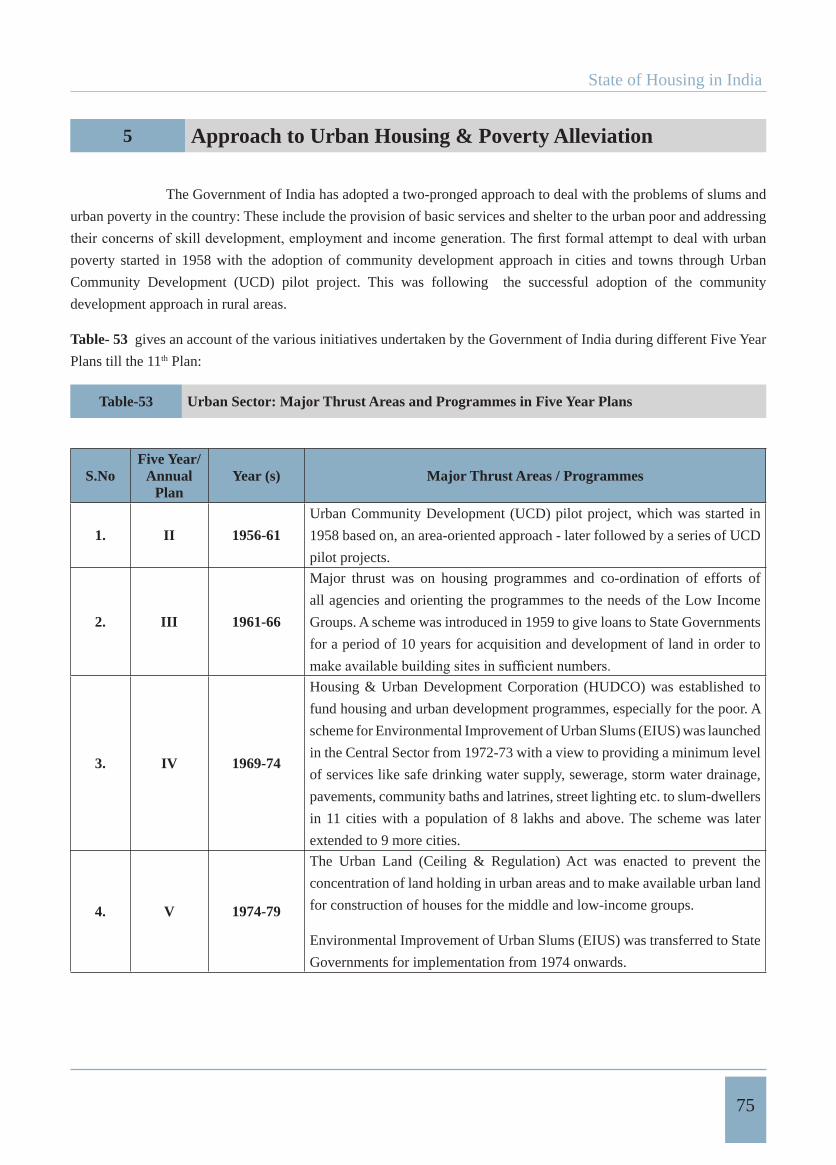
State of Housing in India
75
5 Approach to Urban Housing & Poverty Alleviation
The Government of India has adopted a two-pronged approach to deal with the problems of slums and
urban poverty in the country: These include the provision of basic services and shelter to the urban poor and addressing
poverty started in 1958 with the adoption of community development approach in cities and towns through Urban
Community Development (UCD) pilot project. This was following the successful adoption of the community
development approach in rural areas.
Table- 53 gives an account of the various initiatives undertaken by the Government of India during different Five Year
Plans till the 11th Plan:
Table-53 Urban Sector: Major Thrust Areas and Programmes in Five Year Plans
S.NoFive Year/
AnnualPlan
Year (s) Major Thrust Areas / Programmes
1. II 1956-61
Urban Community Development (UCD) pilot project, which was started in
1958 based on, an area-oriented approach - later followed by a series of UCD
pilot projects.
2. III 1961-66
Major thrust was on housing programmes and co-ordination of efforts of
all agencies and orienting the programmes to the needs of the Low Income
Groups. A scheme was introduced in 1959 to give loans to State Governments
for a period of 10 years for acquisition and development of land in order to
3. IV 1969-74
Housing & Urban Development Corporation (HUDCO) was established to
fund housing and urban development programmes, especially for the poor. A
scheme for Environmental Improvement of Urban Slums (EIUS) was launched
in the Central Sector from 1972-73 with a view to providing a minimum level
of services like safe drinking water supply, sewerage, storm water drainage,
pavements, community baths and latrines, street lighting etc. to slum-dwellers
in 11 cities with a population of 8 lakhs and above. The scheme was later
extended to 9 more cities.
4. V 1974-79
The Urban Land (Ceiling & Regulation) Act was enacted to prevent the
concentration of land holding in urban areas and to make available urban land
for construction of houses for the middle and low-income groups.
Environmental Improvement of Urban Slums (EIUS) was transferred to State
Governments for implementation from 1974 onwards.
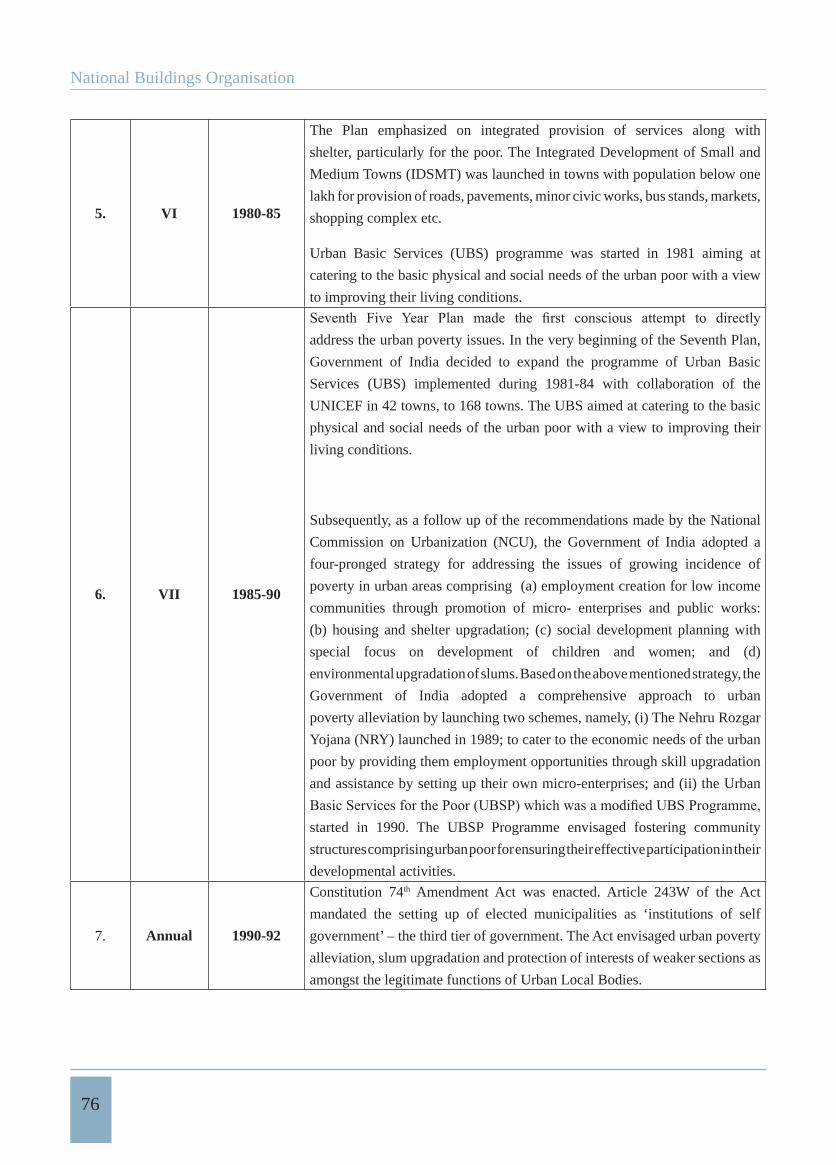
National Buildings Organisation
76
5. VI 1980-85
The Plan emphasized on integrated provision of services along with
shelter, particularly for the poor. The Integrated Development of Small and
Medium Towns (IDSMT) was launched in towns with population below one
lakh for provision of roads, pavements, minor civic works, bus stands, markets,
shopping complex etc.
Urban Basic Services (UBS) programme was started in 1981 aiming at
catering to the basic physical and social needs of the urban poor with a view
to improving their living conditions.
6. VII 1985-90
address the urban poverty issues. In the very beginning of the Seventh Plan,
Government of India decided to expand the programme of Urban Basic
Services (UBS) implemented during 1981-84 with collaboration of the
UNICEF in 42 towns, to 168 towns. The UBS aimed at catering to the basic
physical and social needs of the urban poor with a view to improving their
living conditions.
Subsequently, as a follow up of the recommendations made by the National
Commission on Urbanization (NCU), the Government of India adopted a
four-pronged strategy for addressing the issues of growing incidence of
poverty in urban areas comprising (a) employment creation for low income
communities through promotion of micro- enterprises and public works:
(b) housing and shelter upgradation; (c) social development planning with
special focus on development of children and women; and (d)
environmental upgradation of slums. Based on the above mentioned strategy, the
Government of India adopted a comprehensive approach to urban
poverty alleviation by launching two schemes, namely, (i) The Nehru Rozgar
Yojana (NRY) launched in 1989; to cater to the economic needs of the urban
poor by providing them employment opportunities through skill upgradation
and assistance by setting up their own micro-enterprises; and (ii) the Urban
started in 1990. The UBSP Programme envisaged fostering community
structures comprising urban poor for ensuring their effective participation in their
developmental activities.
7. Annual 1990-92
Constitution 74th Amendment Act was enacted. Article 243W of the Act
mandated the setting up of elected municipalities as ‘institutions of self
government’ – the third tier of government. The Act envisaged urban poverty
alleviation, slum upgradation and protection of interests of weaker sections as
amongst the legitimate functions of Urban Local Bodies.
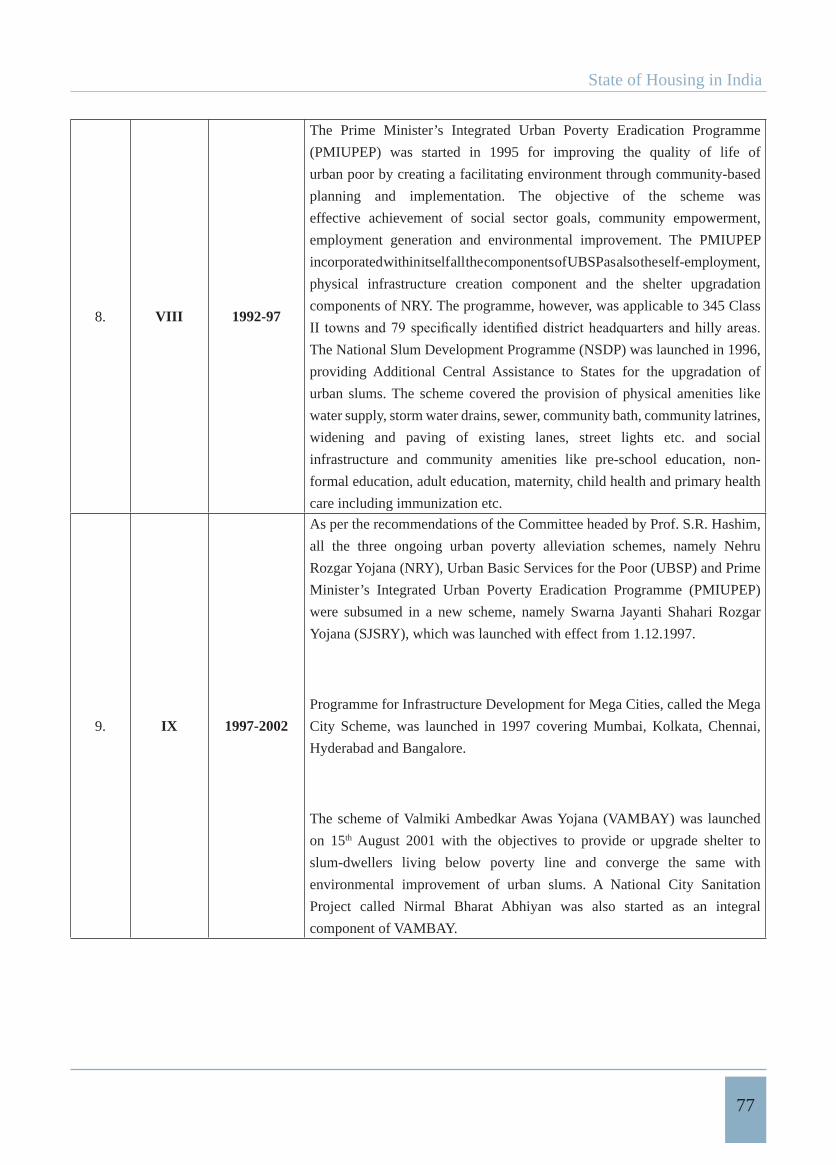
State of Housing in India
77
8. VIII 1992-97
The Prime Minister’s Integrated Urban Poverty Eradication Programme
(PMIUPEP) was started in 1995 for improving the quality of life of
urban poor by creating a facilitating environment through community-based
planning and implementation. The objective of the scheme was
effective achievement of social sector goals, community empowerment,
employment generation and environmental improvement. The PMIUPEP
incorporated within itself all the components of UBSP as also the self-employment,
physical infrastructure creation component and the shelter upgradation
components of NRY. The programme, however, was applicable to 345 Class
The National Slum Development Programme (NSDP) was launched in 1996,
providing Additional Central Assistance to States for the upgradation of
urban slums. The scheme covered the provision of physical amenities like
water supply, storm water drains, sewer, community bath, community latrines,
widening and paving of existing lanes, street lights etc. and social
infrastructure and community amenities like pre-school education, non-
formal education, adult education, maternity, child health and primary health
care including immunization etc.
9. IX 1997-2002
As per the recommendations of the Committee headed by Prof. S.R. Hashim,
all the three ongoing urban poverty alleviation schemes, namely Nehru
Rozgar Yojana (NRY), Urban Basic Services for the Poor (UBSP) and Prime
Minister’s Integrated Urban Poverty Eradication Programme (PMIUPEP)
were subsumed in a new scheme, namely Swarna Jayanti Shahari Rozgar
Yojana (SJSRY), which was launched with effect from 1.12.1997.
Programme for Infrastructure Development for Mega Cities, called the Mega
City Scheme, was launched in 1997 covering Mumbai, Kolkata, Chennai,
Hyderabad and Bangalore.
The scheme of Valmiki Ambedkar Awas Yojana (VAMBAY) was launched
on 15th August 2001 with the objectives to provide or upgrade shelter to
slum-dwellers living below poverty line and converge the same with
environmental improvement of urban slums. A National City Sanitation
Project called Nirmal Bharat Abhiyan was also started as an integral
component of VAMBAY.
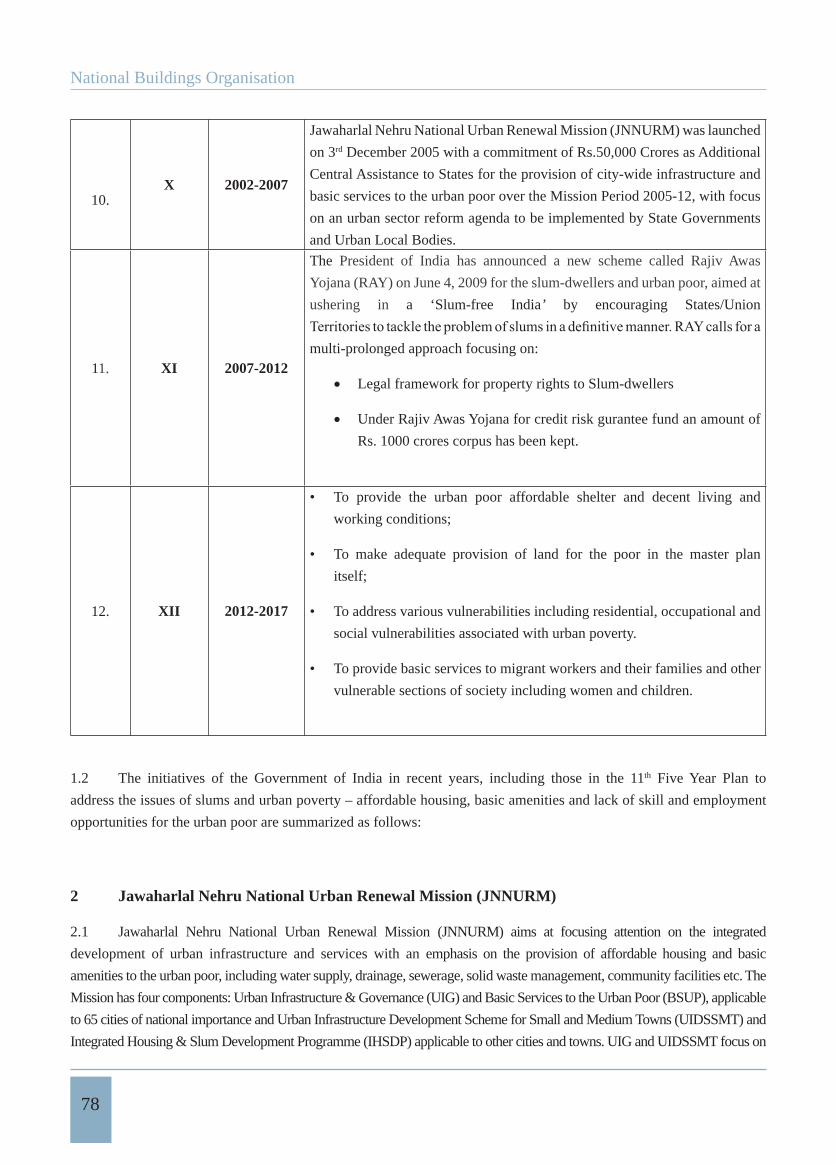
National Buildings Organisation
78
10.X 2002-2007
Jawaharlal Nehru National Urban Renewal Mission (JNNURM) was launched
on 3rd December 2005 with a commitment of Rs.50,000 Crores as Additional
Central Assistance to States for the provision of city-wide infrastructure and
basic services to the urban poor over the Mission Period 2005-12, with focus
on an urban sector reform agenda to be implemented by State Governments
and Urban Local Bodies.
11. XI 2007-2012
The President of India has announced a new scheme called Rajiv Awas
Yojana (RAY) on June 4, 2009 for the slum-dwellers and urban poor, aimed at
ushering in a ‘Slum-free India’ by encouraging States/Union
multi-prolonged approach focusing on:
Legal framework for property rights to Slum-dwellers
Under Rajiv Awas Yojana for credit risk gurantee fund an amount of
Rs. 1000 crores corpus has been kept.
12. XII 2012-2017
To provide the urban poor affordable shelter and decent living and
working conditions;
To make adequate provision of land for the poor in the master plan
itself;
To address various vulnerabilities including residential, occupational and
social vulnerabilities associated with urban poverty.
To provide basic services to migrant workers and their families and other
vulnerable sections of society including women and children.
1.2 The initiatives of the Government of India in recent years, including those in the 11th Five Year Plan to
address the issues of slums and urban poverty – affordable housing, basic amenities and lack of skill and employment
opportunities for the urban poor are summarized as follows:
2 Jawaharlal Nehru National Urban Renewal Mission (JNNURM)
2.1 Jawaharlal Nehru National Urban Renewal Mission (JNNURM) aims at focusing attention on the integrated
development of urban infrastructure and services with an emphasis on the provision of affordable housing and basic
amenities to the urban poor, including water supply, drainage, sewerage, solid waste management, community facilities etc. The
Mission has four components: Urban Infrastructure & Governance (UIG) and Basic Services to the Urban Poor (BSUP), applicable
to 65 cities of national importance and Urban Infrastructure Development Scheme for Small and Medium Towns (UIDSSMT) and
Integrated Housing & Slum Development Programme (IHSDP) applicable to other cities and towns. UIG and UIDSSMT focus on
State of Housing in India
79
the development of city-wide infrastructure, whereas BSUP and IHSDP focus on housing and basic amenities to the urban poor,
especially slum-dwellers. The earlier schemes of National Slum Development Programme (NSDP) and Valmiki Ambedkar Awas
Yojana (VAMBAY) have been subsumed under IHSDP.
2.2 The broad objectives of Jawaharlal Nehru National Urban Renewal Mission (JNNURM) are:
Planned urban development;
Integrated development of urban infrastructural services;
Effective linkages between asset creation and asset management;
Ensuring adequate investment of funds in cities;
Scaling up delivery of civic amenities and provision of utilities with emphasis on universal access to the urban
poor;
Taking up urban renewal programme, i.e., redevelopment of inner (old) cities area to reduce congestion; and
Provision of basic services to the urban poor including security of tenure at affordable prices, where possible in
situ, improved housing, water supply, sanitation, education, health and social security.
2.3 The Basic Services to the Urban Poor (BSUP) and Integrated Housing & Slum Development Programme
(IHSDP) components of JNNURM aim at the integrated provision of affordable housing and basic amenities to the
urban poor, with focus on slums. They contemplate the following key reforms relating to pro-poor governance:
Earmarking at least 20-25% of developed land in all housing projects (both public and private agencies) for
EWS/LIG category with a system of cross-subsidization;
Internal earmarking within local body budgets for basic services to the urban poor; and
Implementation of 7-Point Charter, i.e. provision of basic services to the urban poor, including security of
tenure at affordable prices, improved housing, water supply, sanitation and ensuring delivery of already existing
universal services of the Government for education, health and social security within the Mission period
(2005-12) as per agreed timelines.
The essence of the above reforms are: (i) enabling the urban poor to have access to urban land and not
squeezing them out of the urban land market in the face of sky-rocketing land prices; (ii) facilitating a dedicated
upgradation, including the provision of land and housing to the poor; and (iii) providing basic entitlements and services to be
provided to the urban poor based on agreed milestones and deliberately planned efforts to develop “inclusive” cities.
These reforms are to be undertaken in conjunction with other reforms aimed at creating an enabling framework of good
urban governance for planned and sustainable development of cities and towns.
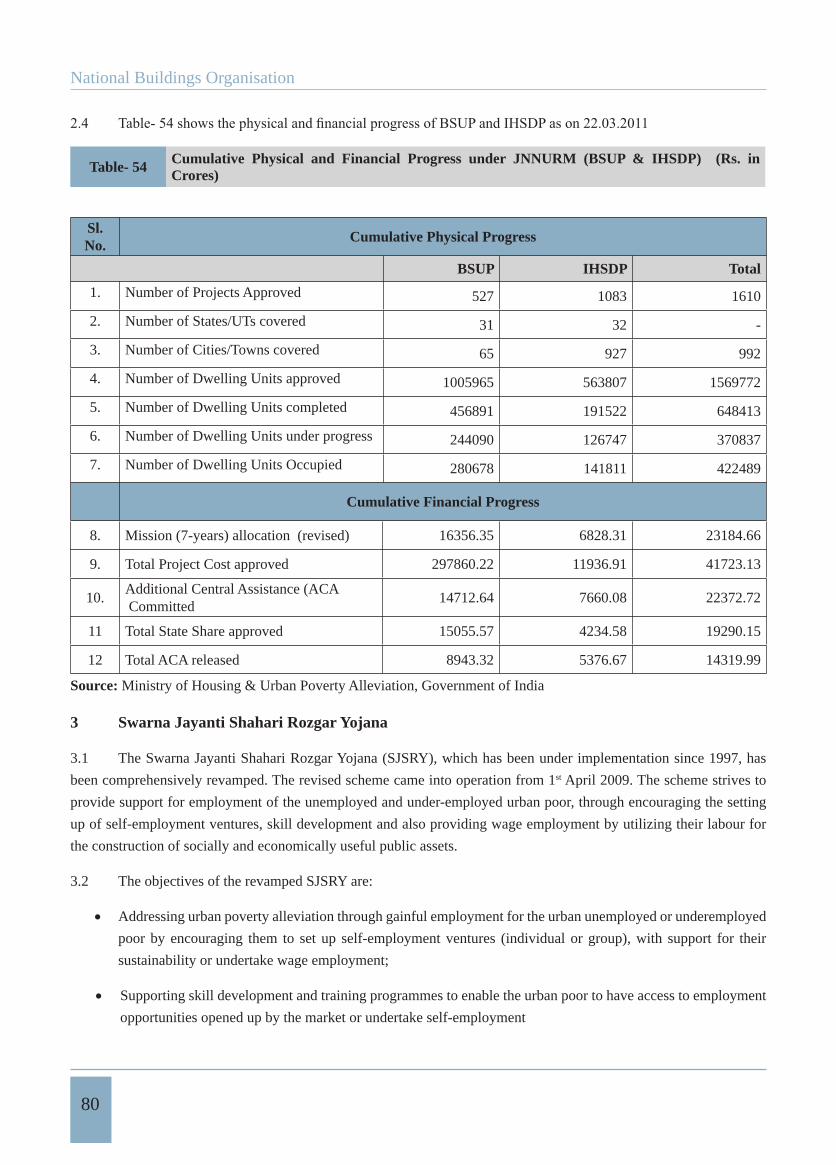
National Buildings Organisation
80
Table- 54 Cumulative Physical and Financial Progress under JNNURM (BSUP & IHSDP) (Rs. in Crores)
Sl.No.
Cumulative Physical Progress
BSUP IHSDP Total
1. Number of Projects Approved 527 1083 1610
2. Number of States/UTs covered 31 32 -
3. Number of Cities/Towns covered 65 927 992
4. Number of Dwelling Units approved 1005965 563807 1569772
5. Number of Dwelling Units completed 456891 191522 648413
6. Number of Dwelling Units under progress 244090 126747 370837
7. Number of Dwelling Units Occupied 280678 141811 422489
Cumulative Financial Progress
8. Mission (7-years) allocation (revised) 16356.35 6828.31 23184.66
9. Total Project Cost approved 297860.22 11936.91 41723.13
10.Additional Central Assistance (ACA Committed
14712.64 7660.08 22372.72
11 Total State Share approved 15055.57 4234.58 19290.15
12 Total ACA released 8943.32 5376.67 14319.99
Source: Ministry of Housing & Urban Poverty Alleviation, Government of India
3 Swarna Jayanti Shahari Rozgar Yojana
3.1 The Swarna Jayanti Shahari Rozgar Yojana (SJSRY), which has been under implementation since 1997, has
been comprehensively revamped. The revised scheme came into operation from 1st April 2009. The scheme strives to
provide support for employment of the unemployed and under-employed urban poor, through encouraging the setting
up of self-employment ventures, skill development and also providing wage employment by utilizing their labour for
the construction of socially and economically useful public assets.
3.2 The objectives of the revamped SJSRY are:
Addressing urban poverty alleviation through gainful employment for the urban unemployed or underemployed
poor by encouraging them to set up self-employment ventures (individual or group), with support for their
sustainability or undertake wage employment;
Supporting skill development and training programmes to enable the urban poor to have access to employment
opportunities opened up by the market or undertake self-employment
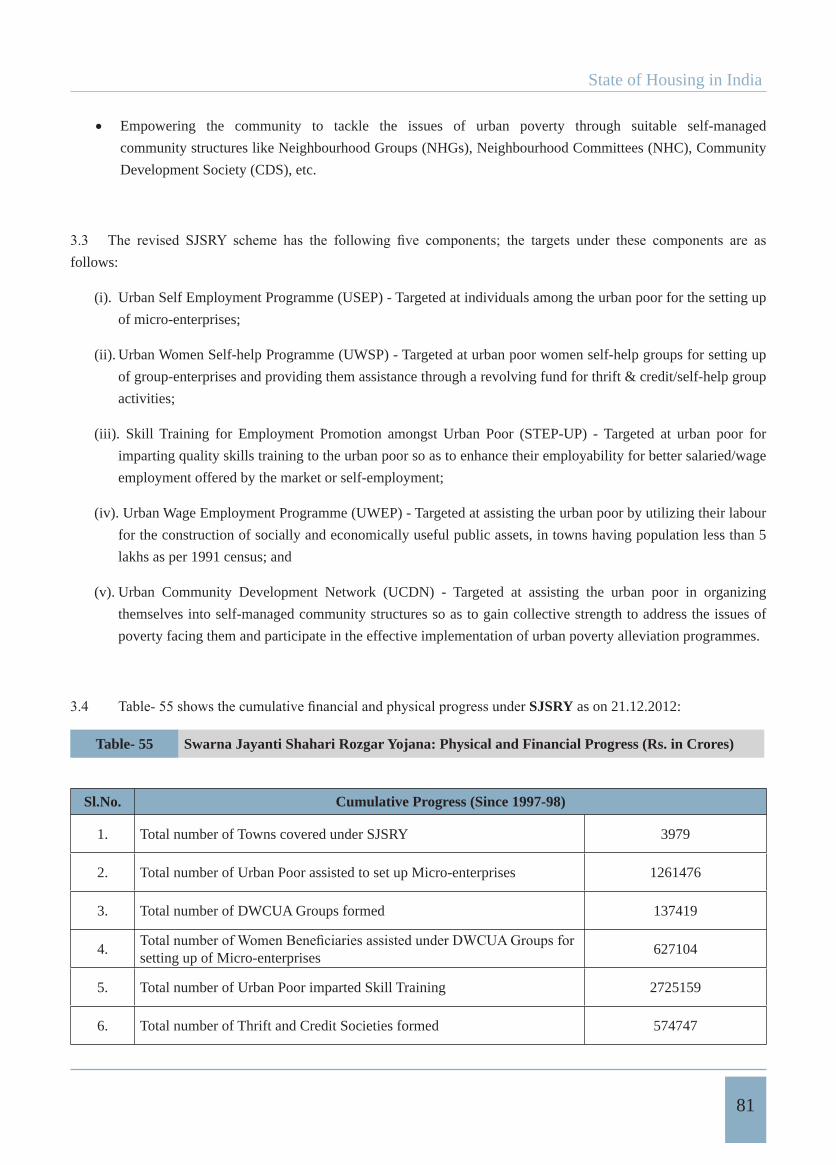
State of Housing in India
81
Empowering the community to tackle the issues of urban poverty through suitable self-managed
community structures like Neighbourhood Groups (NHGs), Neighbourhood Committees (NHC), Community
Development Society (CDS), etc.
follows:
(i). Urban Self Employment Programme (USEP) - Targeted at individuals among the urban poor for the setting up
of micro-enterprises;
(ii). Urban Women Self-help Programme (UWSP) - Targeted at urban poor women self-help groups for setting up
of group-enterprises and providing them assistance through a revolving fund for thrift & credit/self-help group
activities;
(iii). Skill Training for Employment Promotion amongst Urban Poor (STEP-UP) - Targeted at urban poor for
imparting quality skills training to the urban poor so as to enhance their employability for better salaried/wage
employment offered by the market or self-employment;
(iv). Urban Wage Employment Programme (UWEP) - Targeted at assisting the urban poor by utilizing their labour
for the construction of socially and economically useful public assets, in towns having population less than 5
lakhs as per 1991 census; and
(v). Urban Community Development Network (UCDN) - Targeted at assisting the urban poor in organizing
themselves into self-managed community structures so as to gain collective strength to address the issues of
poverty facing them and participate in the effective implementation of urban poverty alleviation programmes.
SJSRY as on 21.12.2012:
Table- 55 Swarna Jayanti Shahari Rozgar Yojana: Physical and Financial Progress (Rs. in Crores)
Sl.No. Cumulative Progress (Since 1997-98)
1. Total number of Towns covered under SJSRY 3979
2. Total number of Urban Poor assisted to set up Micro-enterprises 1261476
3. Total number of DWCUA Groups formed 137419
4.setting up of Micro-enterprises
627104
5. Total number of Urban Poor imparted Skill Training 2725159
6. Total number of Thrift and Credit Societies formed 574747
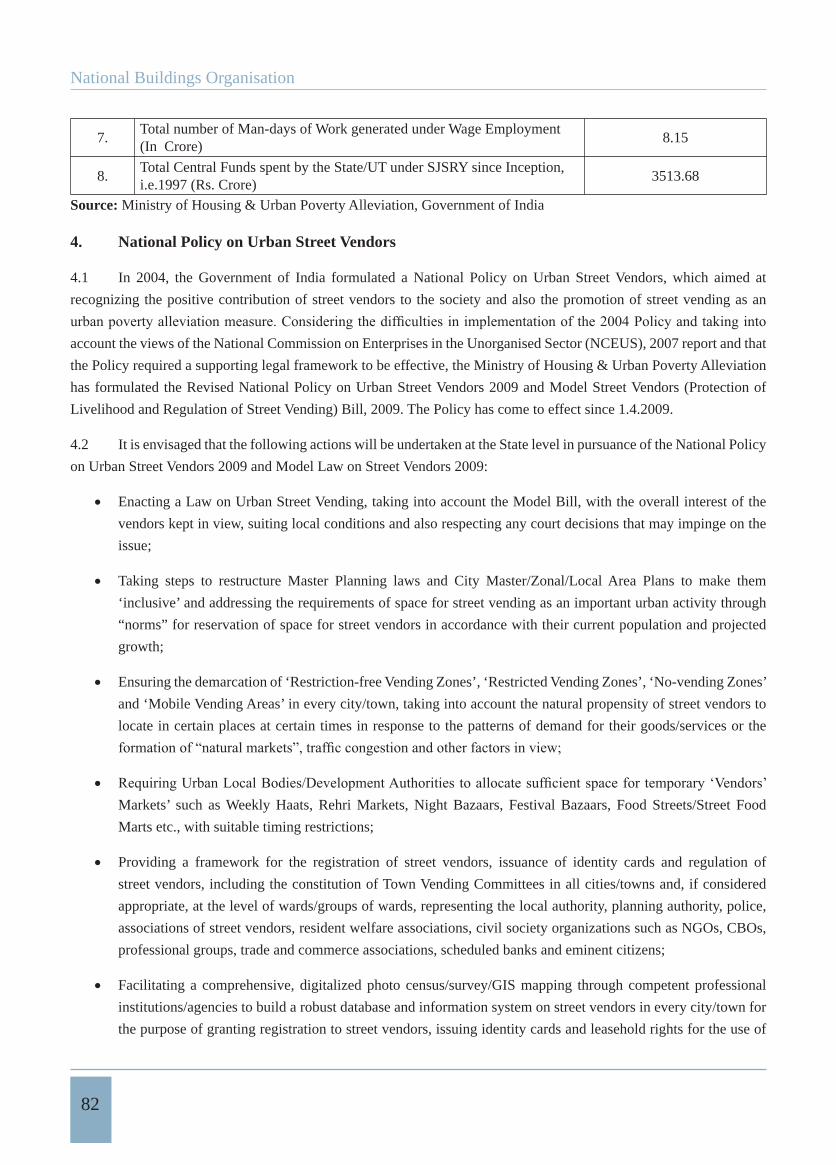
National Buildings Organisation
82
7.Total number of Man-days of Work generated under Wage Employment (In Crore)
8.15
8.Total Central Funds spent by the State/UT under SJSRY since Inception,i.e.1997 (Rs. Crore)
3513.68
Source: Ministry of Housing & Urban Poverty Alleviation, Government of India
4. National Policy on Urban Street Vendors
4.1 In 2004, the Government of India formulated a National Policy on Urban Street Vendors, which aimed at
recognizing the positive contribution of street vendors to the society and also the promotion of street vending as an
account the views of the National Commission on Enterprises in the Unorganised Sector (NCEUS), 2007 report and that
the Policy required a supporting legal framework to be effective, the Ministry of Housing & Urban Poverty Alleviation
has formulated the Revised National Policy on Urban Street Vendors 2009 and Model Street Vendors (Protection of
Livelihood and Regulation of Street Vending) Bill, 2009. The Policy has come to effect since 1.4.2009.
4.2 It is envisaged that the following actions will be undertaken at the State level in pursuance of the National Policy
on Urban Street Vendors 2009 and Model Law on Street Vendors 2009:
Enacting a Law on Urban Street Vending, taking into account the Model Bill, with the overall interest of the
vendors kept in view, suiting local conditions and also respecting any court decisions that may impinge on the
issue;
Taking steps to restructure Master Planning laws and City Master/Zonal/Local Area Plans to make them
‘inclusive’ and addressing the requirements of space for street vending as an important urban activity through
“norms” for reservation of space for street vendors in accordance with their current population and projected
growth;
Ensuring the demarcation of ‘Restriction-free Vending Zones’, ‘Restricted Vending Zones’, ‘No-vending Zones’
and ‘Mobile Vending Areas’ in every city/town, taking into account the natural propensity of street vendors to
locate in certain places at certain times in response to the patterns of demand for their goods/services or the
Markets’ such as Weekly Haats, Rehri Markets, Night Bazaars, Festival Bazaars, Food Streets/Street Food
Marts etc., with suitable timing restrictions;
Providing a framework for the registration of street vendors, issuance of identity cards and regulation of
street vendors, including the constitution of Town Vending Committees in all cities/towns and, if considered
appropriate, at the level of wards/groups of wards, representing the local authority, planning authority, police,
associations of street vendors, resident welfare associations, civil society organizations such as NGOs, CBOs,
professional groups, trade and commerce associations, scheduled banks and eminent citizens;
Facilitating a comprehensive, digitalized photo census/survey/GIS mapping through competent professional
institutions/agencies to build a robust database and information system on street vendors in every city/town for
the purpose of granting registration to street vendors, issuing identity cards and leasehold rights for the use of
State of Housing in India
83
vending spaces/stalls;
Formulating a scheme for street vendors to enable them to earn an honest livelihood without harassment
insurance, social security, rehabilitation of child vendors, promotion of Vendors’ Organisations and
maintenance of health and hygiene in vending places and vendors’ markets;
grievances of street vendors and reporting to the Government of India from time to time.
5. National Urban Housing & Habitat Policy 2007
5.1 The Ministry of Housing and Urban Poverty Alleviation has formulated the National Urban Housing &
Habitat Policy, 2007 (NUHHP-2007) which primarily aims at providing a framework for provision of housing and basic
infrastructure facilities to Economically Weaker Sections (EWS)/ Low Income Groups (LIG) and other sections of the
society at affordable cost. The salient features of NUHHP-2007 are:
Target at Affordable Urban Housing for All with special emphasis on the urban poor, especially Scheduled
Castes/Scheduled Tribes/Backward Classes/ Minorities and on empowerment of Women;
Lay emphasis on inclusive urban planning and increasing supply of land for affordable housing, removing legal
impediments, using spatial incentives like additional Floor Area Ratio (FAR), Transferable Development Rights
of renewable sources of energy and adoption of participatory approach;
Encouraging Integrated Townships and Special Economic Zones that are inclusive;
Reserving 10-15% of land in every new public/private housing projects or 20-25% Floor Area Ratio (FAR),
whichever is greater for EWS/LIG housing through appropriate spatial incentives;
Public-Private-Partnerships (PPP): The private sector to undertake land assembly within the purview of
Master Plans with focus on inclusion. Action Plans for urban Slum-dwellers and special package for Cooperative
Housing, Labour Housing and Employees Housing to be prepared.
Accord primacy to the provision of shelter to urban poor at their present location or near their work place with
be on encouraging the use of proven cost-effective technology and building materials, developing mass rapid
transit system at sub-regional level, and creating green cover in and habitats cities for balanced ecological
development.
National Buildings Organisation
84
5.2 NHHUP-2007 envisages that the States/UTs would develop a “Habitat Infrastructure Action Plan” for all
cities with a population of over one lakh. It also envisages that they prepare 10-year perspective plan for housing of
EWS/LIG. Encouragement and support are to be provided by the Central Government to State Governments for the
preparation of State Urban Housing and Habitat Policy and Action Plan. State/UT policy is required to provide a road
6. Integrated Low Cost Sanitation Scheme (ILCS)
6.1 Low cost sanitation is seen as an important solution to the dehumanizing practice of manual scavenging. The
thereby liberating manual scavengers from the age-old, obnoxious practice of manually carrying the night soil. The
scheme has recently been revised to implement it more effectively. The focus of the scheme is on conversion of dry
latrines and construction of new latrines for latrine-less households so as to address the issues of sanitation in cities and
towns.
households only and does not entail a loan component.
7 Affordable Housing in Partnership (AHP)
7.1 A scheme for Affordable Housing in Partnership (AHP) has been launched in 2009 as part of the existing
Sub-Mission of Basic Services to the Urban Poor (BSUP) under the Jawaharlal Nehru National Urban Renewal Mission
(JNNURM). The scheme is in response to the recognition of the constraints on supply of housing for the economically
poor categories and is aimed at incentivizing land assembly for affordable housing for the urban poor in various kinds
of partnerships. It also intends to provide a stimulus to economic activities through the multiplier effects of housing on
other sectors of the economy.
7.2 The scheme of AHP has an outlay of Rs. 5,000 crores for the 11th Plan and a target of construction of one
million houses for Economically Weaker Section (EWS)/Low Income Group (LIG)/Middle Income Group (MIG)
categories with at least 25% for EWS category. The scheme aims at partnership between various agencies: Government/
Parastatals/ Urban Local Bodies/ Developers for realizing the goal of affordable housing for all and facilitating the
creation of inclusive habitats.
Interest Subsidy Scheme for Housing the Urban Poor (ISHUP)
8.1 The interest Subsidy Scheme for Housing the Urban Poor (ISHUP), launched in 2008-09, seeks to provide a
subsidy of 5 per cent per annum on interest on loans up to Rs 1 lakh taken for housing purposes by the urban poor,
State of Housing in India
85
(with monthly income of up to Rs 5,000) and LIG (with monthly income between Rs 5,001 and Rs 10,000). EWS and
LIG households can avail an affordable housing loan for the purchase of house or for the construction of new house
subject to review after a minimum period of 5 years. Mortgage of the dwelling unit is to be accepted as the primary
security under ISHUP. There would be no collateral security/third party guarantee for loans up to and inclusive of Rs. 1
lakh, excluding group guarantee. No levy of prepayment charges would be permitted.
8.2 Under ISHUP, the Net Present Value (NPV) subsidy is given to the lenders on an up-front and quarterly basis.
The NPV subsidy to the lender will be deducted from the principal loan amount of the borrower, who will then have to
pay interest to the Bank/Housing Finance Institution (HFI) at an agreed document rate for the whole duration of the loan.
The advantages of this method are as under:
amount;
loan period quarterly;
The transactional complexity of administering and accounting of provision of subsidy disbursal through
quarterly loan periods as well as cost involved for the PLIs claiming subsidy periodically and National Housing
Bank (NHB) / HUDCO on behalf of the Government of India effecting payments is reduced;
of periodical subsidy payment;
The lenders prefer the upfront adjustment mechanism not only for reasons of administrative convenience but
also for facilitating credit risk evaluation. This is because the borrower’s equity in the house goes up or the
loan-to-value ratio comes down. This should also facilitate greater coverage of borrowers.
9. Rajiv Awas Yojana
9.1 ThePresident of India has announced a new scheme called Rajiv Awas Yojana (RAY) on June 4, 2009 for the
slum-dwellers and urban poor, aimed at ushering in a ‘Slum-free India’ by encouraging States/Union Territories to tackle
Bringing existing slums within the formal system and enabling them to avail of the same level of basic amenities
as the rest of the town;
Redressing the failures of the formal system that lie behind the creation of slums and squatter settlements; and
Tackling the shortages of urban land and housing that keep shelter out of reach of the urban poor and force them
to resort to extra-legal solutions in a bid to retain their sources of livelihood and employment.
Rajiv Awas Yojana would dovetail the schemes of Affordable Housing in Partnership and Interest Subsidy for Housing
the Urban Poor. It would extend support to States that are willing to assign property rights to people living in slum areas.
Property right need not be land; it could preferably be dwelling space.
National Buildings Organisation
86
9.2 As with JNNURM, the goals of RAY will be driven and incentivised by the provision of central support for slum
redevelopment and construction of affordable housing conditional to a set of reforms necessary for urban development
to become inclusive.
9.3 As part of the preparatory activities for Rajiv Awas Yojana, the Government of India has launched a scheme
called Slum-free City Planning Scheme with a view to supporting States and Urban Local Bodies in activities like slum
survey, Slum MIS, GIS mapping of slums, GIS-MIS integration and preparation of Slum-free City and State Plans.
10 12Th Five-Year Plan: Strategy
10.1 The 12th Five Year Plan has adopted ‘inclusive growth’ as the dominant paradigm for India’s development.
The monitorable socio-economic targets for the 12th Five Year Plan, set out by the Planning Commission as part of the
inclusive growth strategy, include the following:
Real GDP Growth Rate of 8.2 percent.
Agriculture Growth Rate of 4.0 percent.
Manufacturing Growth Rate of 10.0 percent.
Accelerate the growth rate of GDP from 8% to 9% and then maintain GDP growth at 8.2 % in the 12th Plan.
Generate 50 million new work opportunities in the non-farm sector and provide skill training to equivalent
numbers.
Head Count Ratio of consumption poverty to be reduced by 10 percentage points over the preceding
estimates.
As may be seen, employment creation, reduction in unemployment, raising real wages of unskilled workers through skill
development and reducing poverty are among the core objectives of the 12th Five Year Plan.
10.2 The 12th
Structural - which include socially constructed constraints to opportunities for low-income groups; i)
ii)housing and basic amenities;
High cost of living, including the cost of health care and medical facilities, housing, transport and education;iii)
Lack of urban planning, especially for housing low-income categories and the provision of land for informal iv)sector activities;
Absence of adequate regulation to protect the economic interest of the poor; and v)
Lack of involvement of the poor in urban planning and developmental processes.vi)
State of Housing in India
87
10.3 The 12th Five Year Plan has adopted the objectives of urban poverty alleviation and slum development/
upgradation as part of the strategy of ‘inclusive growth’ (see Boxes 1 & 2). ‘Inclusive cities’ are needed as key
instruments of ‘Faster, Sustainable and More inclusive growth’. The development of inclusive cities needs meticulous
and ‘informed’ planning, policy-making, programme formulation and implementation based on authentic and reliable
data.
Box 1
12th Plan: Objective for Urban Poverty Alleviation
To provide the urban poor affordable shelter and decent living and working conditions;
To make adequate provision of land for the poor in the master plan itself;
To address various vulnerabilities including residential, occupational and social vulnerabilities associated
with urban poverty.
To provide basic services to migrant workers their families and other venerable sections of society including
women and children.
Source: 12th Five Year Plan Document, Planning Commission of India
Box 2
12th Plan: Objective for Slum Development
Creating and updating database on slums;
Integrated City Development Plan;
Augmenting and facilitating access to basic services like clean water, sanitation, affordable housing etc, for slum dwellers;
Granting tenure security to slum dwellers;
In-situ upgradation and resettlement options for slum improvement;
Using land as a resource for housing and shelter development for slum dwellers.
Source: 12th Five Year Plan Document, Planning Commission of India.
National Buildings Organisation
88
References
Census of India 2011: General Population Tables (India, States and Union Territories, Table A-4, Part II). New NCT of Delhi. Ministry of Home Affairs.
____Series H: Table on Houses, Household Amenities & Assets
Ministry of Housing and Urban Poverty Alleviation, Government of India. 2012. Report of the Technical Group (12th Five Year Plan: 2012-17) on Estimation of Urban Housing Shortage. New NCT of Delhi:
____ (2009). India Urban Poverty Report: 2009. New NCT of Delhi: Oxford University Press.
National Buildings Organisation, Ministry of Housing and Urban Poverty Alleviation, Government of India: Re port of the Committee on Slum Statistics/Census, 2010
National Sample Survey Organisation: Conditions of Slum Area in Cities, NSSO 31st Round Survey, 1977
____ (1993) Slums in India, NSSO 58th Round Survey, Report No. 417
____ (1994) Housing Condition in India, NSSO 49th Round (Jan.1993-June.1993)
____ (2000) Employment and Unemployment Situation in India, 1999-2000 (Part I)’, NSSO 61st Round (July 1999-June 2000), Report No. 458
____ (2000) Literacy and Levels of Education in India 1999-2000, NSS 55th Round, July 1999-June 2000.
____ (2002) Housing Condition in India, NSSO 58th Round (July to December 2002)
____(2002)Conditions of Slums 2002, NSSO 58th Round Survey, Report No. 486
____ (2005) Employment and Unemployment Situation in India, 2004-05 (Part I), NSSO 61st Round (July 2004-June 2005), Report No. 518
____ (2009) Housing Condition and Amenities in India, 2008-09 65th Round (July 2008-June 2009)
____(2010) Some Characteristics of Urban Slums 2008-09, NSSO 65th Round, Report No. 534
Planning Commission, Government of India (1979), Report of the Task Force on Projections of Minimum Needs and Effective Consumption Demand, Perspective Planning Division.
____ (1993), Expert Group on Estimation of Proportion and Number of Poor
____ (2007), Estimates of Poverty, Press Release dated 21st March 2007
____ (2010), Eleventh Five Year Plan Mid-Term Review Press Note 2010
____ (2011), Estimates of Poverty, Press Release dated 27th January 2011
UN-Habitat: Challenges of Slums: Global Report on Human Settlements 2003
____ (2003)
State of Housing in India
89
____ (2006) The State of the World’s Cities Report 2006/2007
____ (2010) The State of World’s Cities 2010/2011 – Cities for All: Bridging the Urban Divide
Draft Twelfth Five Year Plan Document –December, 2012
United Nations, World Urbanisation Prospects, The 2007 Revision, United Nations 2008.

Data Appendices (1-152)
In India- Census 2011

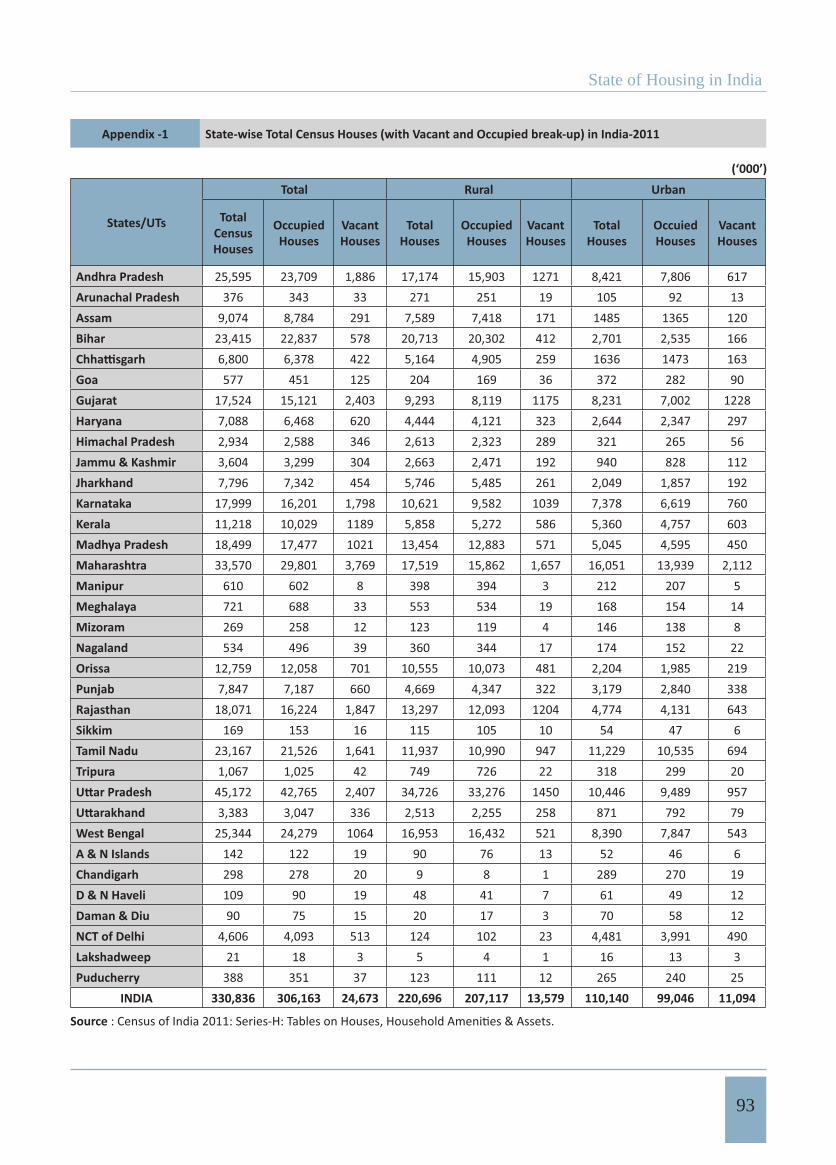
State of Housing in India
93
Appendix -1 State-wise Total Census Houses (with Vacant and Occupied break-up) in India-2011
(‘000’)
States/UTs
Total Rural Urban
Total CensusHouses
OccupiedHouses
Vacant Houses
Total Houses
OccupiedHouses
Vacant Houses
Total Houses
OccuiedHouses
Vacant Houses
Andhra Pradesh 25,595 23,709 1,886 17,174 15,903 1271 8,421 7,806 617Arunachal Pradesh 376 343 33 271 251 19 105 92 13Assam 9,074 8,784 291 7,589 7,418 171 1485 1365 120Bihar 23,415 22,837 578 20,713 20,302 412 2,701 2,535 166
6,800 6,378 422 5,164 4,905 259 1636 1473 163Goa 577 451 125 204 169 36 372 282 90Gujarat 17,524 15,121 2,403 9,293 8,119 1175 8,231 7,002 1228Haryana 7,088 6,468 620 4,444 4,121 323 2,644 2,347 297Himachal Pradesh 2,934 2,588 346 2,613 2,323 289 321 265 56Jammu & Kashmir 3,604 3,299 304 2,663 2,471 192 940 828 112Jharkhand 7,796 7,342 454 5,746 5,485 261 2,049 1,857 192Karnataka 17,999 16,201 1,798 10,621 9,582 1039 7,378 6,619 760Kerala 11,218 10,029 1189 5,858 5,272 586 5,360 4,757 603Madhya Pradesh 18,499 17,477 1021 13,454 12,883 571 5,045 4,595 450Maharashtra 33,570 29,801 3,769 17,519 15,862 1,657 16,051 13,939 2,112Manipur 610 602 8 398 394 3 212 207 5Meghalaya 721 688 33 553 534 19 168 154 14Mizoram 269 258 12 123 119 4 146 138 8Nagaland 534 496 39 360 344 17 174 152 22Orissa 12,759 12,058 701 10,555 10,073 481 2,204 1,985 219Punjab 7,847 7,187 660 4,669 4,347 322 3,179 2,840 338Rajasthan 18,071 16,224 1,847 13,297 12,093 1204 4,774 4,131 643Sikkim 169 153 16 115 105 10 54 47 6Tamil Nadu 23,167 21,526 1,641 11,937 10,990 947 11,229 10,535 694Tripura 1,067 1,025 42 749 726 22 318 299 20
45,172 42,765 2,407 34,726 33,276 1450 10,446 9,489 9573,383 3,047 336 2,513 2,255 258 871 792 79
West Bengal 25,344 24,279 1064 16,953 16,432 521 8,390 7,847 543A & N Islands 142 122 19 90 76 13 52 46 6Chandigarh 298 278 20 9 8 1 289 270 19D & N Haveli 109 90 19 48 41 7 61 49 12Daman & Diu 90 75 15 20 17 3 70 58 12NCT of Delhi 4,606 4,093 513 124 102 23 4,481 3,991 490Lakshadweep 21 18 3 5 4 1 16 13 3Puducherry 388 351 37 123 111 12 265 240 25
INDIA 330,836 306,163 24,673 220,696 207,117 13,579 110,140 99,046 11,094
Source
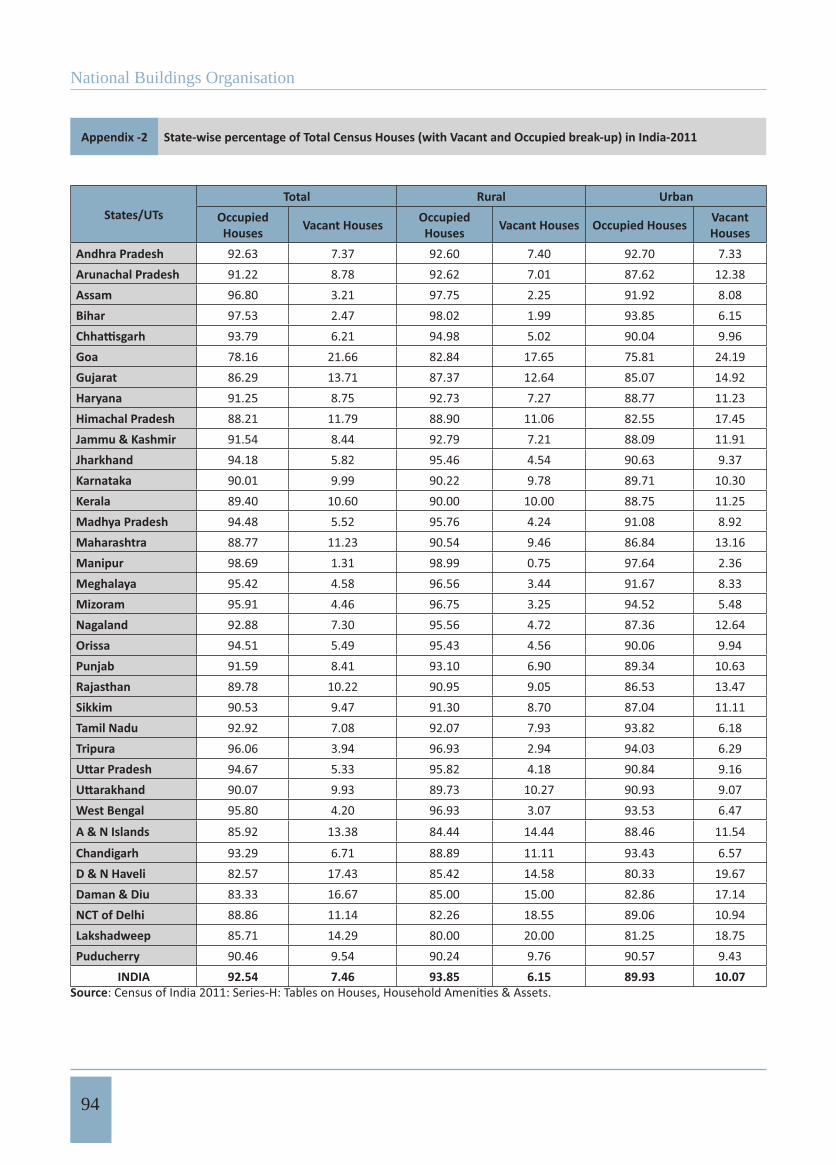
National Buildings Organisation
94
Appendix -2 State-wise percentage of Total Census Houses (with Vacant and Occupied break-up) in India-2011
States/UTsTotal Rural Urban
OccupiedHouses Vacant Houses Occupied
Houses Vacant Houses Occupied Houses Vacant Houses
Andhra Pradesh 92.63 7.37 92.60 7.40 92.70 7.33Arunachal Pradesh 91.22 8.78 92.62 7.01 87.62 12.38Assam 96.80 3.21 97.75 2.25 91.92 8.08Bihar 97.53 2.47 98.02 1.99 93.85 6.15
93.79 6.21 94.98 5.02 90.04 9.96Goa 78.16 21.66 82.84 17.65 75.81 24.19Gujarat 86.29 13.71 87.37 12.64 85.07 14.92Haryana 91.25 8.75 92.73 7.27 88.77 11.23Himachal Pradesh 88.21 11.79 88.90 11.06 82.55 17.45Jammu & Kashmir 91.54 8.44 92.79 7.21 88.09 11.91Jharkhand 94.18 5.82 95.46 4.54 90.63 9.37Karnataka 90.01 9.99 90.22 9.78 89.71 10.30Kerala 89.40 10.60 90.00 10.00 88.75 11.25Madhya Pradesh 94.48 5.52 95.76 4.24 91.08 8.92Maharashtra 88.77 11.23 90.54 9.46 86.84 13.16Manipur 98.69 1.31 98.99 0.75 97.64 2.36Meghalaya 95.42 4.58 96.56 3.44 91.67 8.33Mizoram 95.91 4.46 96.75 3.25 94.52 5.48Nagaland 92.88 7.30 95.56 4.72 87.36 12.64Orissa 94.51 5.49 95.43 4.56 90.06 9.94Punjab 91.59 8.41 93.10 6.90 89.34 10.63Rajasthan 89.78 10.22 90.95 9.05 86.53 13.47Sikkim 90.53 9.47 91.30 8.70 87.04 11.11Tamil Nadu 92.92 7.08 92.07 7.93 93.82 6.18Tripura 96.06 3.94 96.93 2.94 94.03 6.29
94.67 5.33 95.82 4.18 90.84 9.1690.07 9.93 89.73 10.27 90.93 9.07
West Bengal 95.80 4.20 96.93 3.07 93.53 6.47
A & N Islands 85.92 13.38 84.44 14.44 88.46 11.54
Chandigarh 93.29 6.71 88.89 11.11 93.43 6.57D & N Haveli 82.57 17.43 85.42 14.58 80.33 19.67Daman & Diu 83.33 16.67 85.00 15.00 82.86 17.14NCT of Delhi 88.86 11.14 82.26 18.55 89.06 10.94Lakshadweep 85.71 14.29 80.00 20.00 81.25 18.75Puducherry 90.46 9.54 90.24 9.76 90.57 9.43
INDIA 92.54 7.46 93.85 6.15 89.93 10.07Source
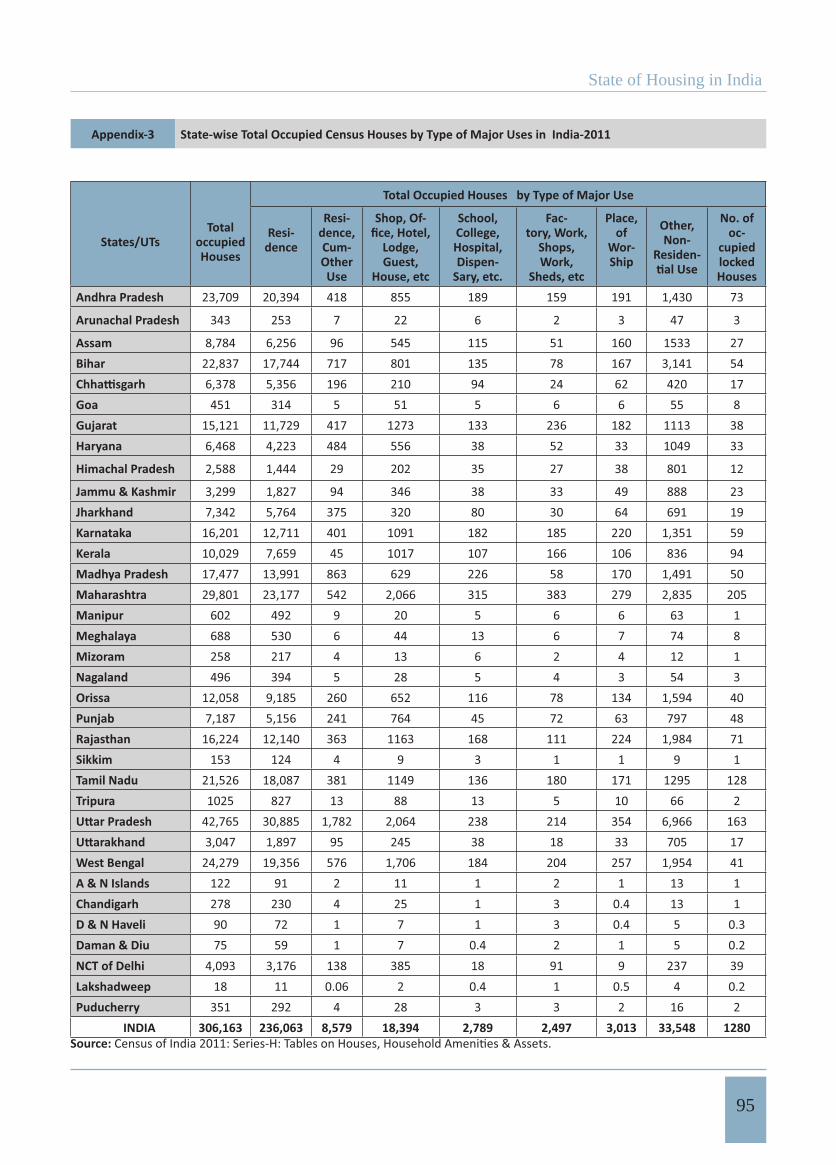
State of Housing in India
95
Appendix-3 State-wise Total Occupied Census Houses by Type of Major Uses in India-2011
States/UTsTotal
occupiedHouses
Total Occupied Houses by Type of Major Use
Resi-dence
Resi-dence,Cum-OtherUse
Shop, Of-
Lodge, Guest,
House, etc
School,College, Hospital, Dispen-
Sary, etc.
Fac-tory, Work,
Shops, Work,
Sheds, etc
Place,of
Wor-Ship
Other, Non-
Residen-
No. of oc-
cupiedlocked Houses
Andhra Pradesh 23,709 20,394 418 855 189 159 191 1,430 73
Arunachal Pradesh 343 253 7 22 6 2 3 47 3
Assam 8,784 6,256 96 545 115 51 160 1533 27Bihar 22,837 17,744 717 801 135 78 167 3,141 54
6,378 5,356 196 210 94 24 62 420 17Goa 451 314 5 51 5 6 6 55 8Gujarat 15,121 11,729 417 1273 133 236 182 1113 38Haryana 6,468 4,223 484 556 38 52 33 1049 33
Himachal Pradesh 2,588 1,444 29 202 35 27 38 801 12
Jammu & Kashmir 3,299 1,827 94 346 38 33 49 888 23Jharkhand 7,342 5,764 375 320 80 30 64 691 19Karnataka 16,201 12,711 401 1091 182 185 220 1,351 59Kerala 10,029 7,659 45 1017 107 166 106 836 94Madhya Pradesh 17,477 13,991 863 629 226 58 170 1,491 50Maharashtra 29,801 23,177 542 2,066 315 383 279 2,835 205Manipur 602 492 9 20 5 6 6 63 1Meghalaya 688 530 6 44 13 6 7 74 8Mizoram 258 217 4 13 6 2 4 12 1Nagaland 496 394 5 28 5 4 3 54 3Orissa 12,058 9,185 260 652 116 78 134 1,594 40Punjab 7,187 5,156 241 764 45 72 63 797 48Rajasthan 16,224 12,140 363 1163 168 111 224 1,984 71Sikkim 153 124 4 9 3 1 1 9 1Tamil Nadu 21,526 18,087 381 1149 136 180 171 1295 128Tripura 1025 827 13 88 13 5 10 66 2
42,765 30,885 1,782 2,064 238 214 354 6,966 1633,047 1,897 95 245 38 18 33 705 17
West Bengal 24,279 19,356 576 1,706 184 204 257 1,954 41A & N Islands 122 91 2 11 1 2 1 13 1Chandigarh 278 230 4 25 1 3 0.4 13 1D & N Haveli 90 72 1 7 1 3 0.4 5 0.3Daman & Diu 75 59 1 7 0.4 2 1 5 0.2NCT of Delhi 4,093 3,176 138 385 18 91 9 237 39Lakshadweep 18 11 0.06 2 0.4 1 0.5 4 0.2Puducherry 351 292 4 28 3 3 2 16 2
INDIA 306,163 236,063 8,579 18,394 2,789 2,497 3,013 33,548 1280Source:
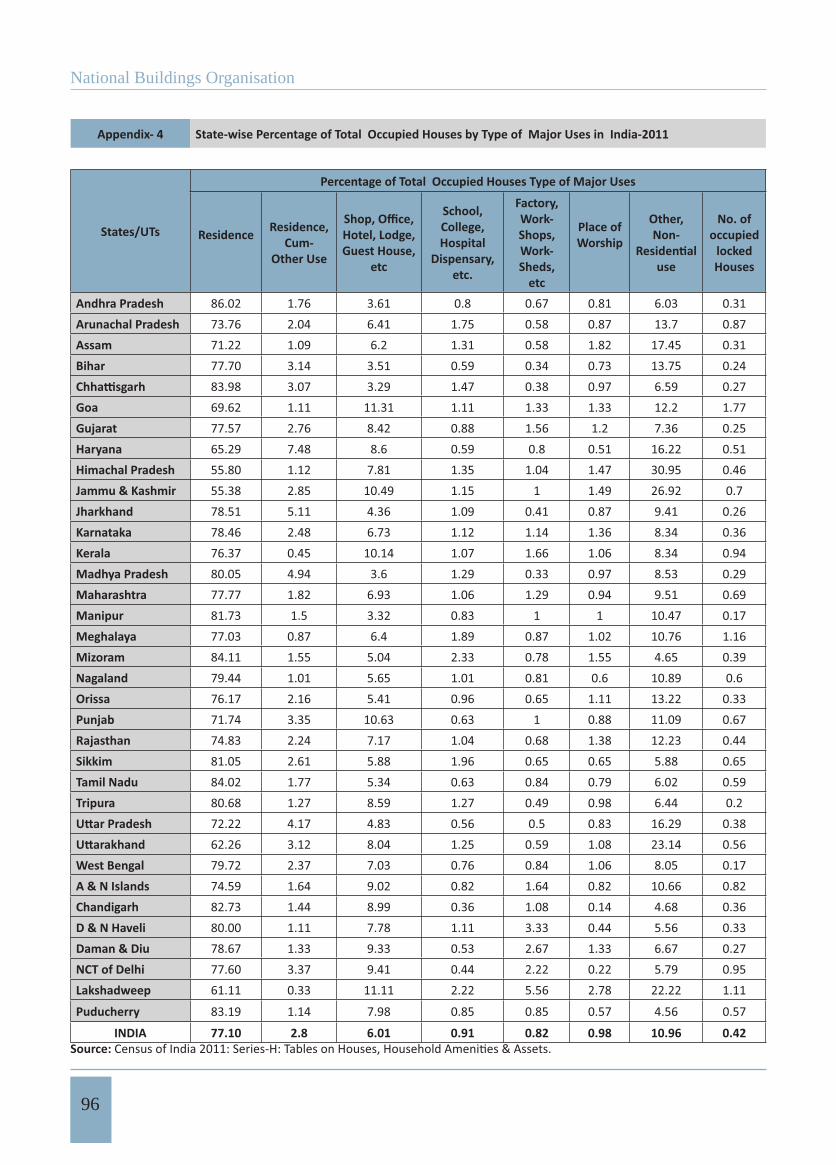
National Buildings Organisation
96
Appendix- 4 State-wise Percentage of Total Occupied Houses by Type of Major Uses in India-2011
States/UTs
Percentage of Total Occupied Houses Type of Major Uses
Residence Residence, Cum-
Other Use
Hotel, Lodge, Guest House,
etc
School,College, Hospital
Dispensary, etc.
Factory, Work- Shops, Work- Sheds,
etc
Place of Worship
Other, Non-
use
No. of occupied
locked Houses
Andhra Pradesh 86.02 1.76 3.61 0.8 0.67 0.81 6.03 0.31Arunachal Pradesh 73.76 2.04 6.41 1.75 0.58 0.87 13.7 0.87Assam 71.22 1.09 6.2 1.31 0.58 1.82 17.45 0.31Bihar 77.70 3.14 3.51 0.59 0.34 0.73 13.75 0.24
83.98 3.07 3.29 1.47 0.38 0.97 6.59 0.27Goa 69.62 1.11 11.31 1.11 1.33 1.33 12.2 1.77Gujarat 77.57 2.76 8.42 0.88 1.56 1.2 7.36 0.25Haryana 65.29 7.48 8.6 0.59 0.8 0.51 16.22 0.51Himachal Pradesh 55.80 1.12 7.81 1.35 1.04 1.47 30.95 0.46Jammu & Kashmir 55.38 2.85 10.49 1.15 1 1.49 26.92 0.7Jharkhand 78.51 5.11 4.36 1.09 0.41 0.87 9.41 0.26Karnataka 78.46 2.48 6.73 1.12 1.14 1.36 8.34 0.36Kerala 76.37 0.45 10.14 1.07 1.66 1.06 8.34 0.94Madhya Pradesh 80.05 4.94 3.6 1.29 0.33 0.97 8.53 0.29Maharashtra 77.77 1.82 6.93 1.06 1.29 0.94 9.51 0.69Manipur 81.73 1.5 3.32 0.83 1 1 10.47 0.17Meghalaya 77.03 0.87 6.4 1.89 0.87 1.02 10.76 1.16Mizoram 84.11 1.55 5.04 2.33 0.78 1.55 4.65 0.39Nagaland 79.44 1.01 5.65 1.01 0.81 0.6 10.89 0.6Orissa 76.17 2.16 5.41 0.96 0.65 1.11 13.22 0.33Punjab 71.74 3.35 10.63 0.63 1 0.88 11.09 0.67Rajasthan 74.83 2.24 7.17 1.04 0.68 1.38 12.23 0.44Sikkim 81.05 2.61 5.88 1.96 0.65 0.65 5.88 0.65Tamil Nadu 84.02 1.77 5.34 0.63 0.84 0.79 6.02 0.59Tripura 80.68 1.27 8.59 1.27 0.49 0.98 6.44 0.2
72.22 4.17 4.83 0.56 0.5 0.83 16.29 0.3862.26 3.12 8.04 1.25 0.59 1.08 23.14 0.56
West Bengal 79.72 2.37 7.03 0.76 0.84 1.06 8.05 0.17A & N Islands 74.59 1.64 9.02 0.82 1.64 0.82 10.66 0.82Chandigarh 82.73 1.44 8.99 0.36 1.08 0.14 4.68 0.36D & N Haveli 80.00 1.11 7.78 1.11 3.33 0.44 5.56 0.33Daman & Diu 78.67 1.33 9.33 0.53 2.67 1.33 6.67 0.27NCT of Delhi 77.60 3.37 9.41 0.44 2.22 0.22 5.79 0.95Lakshadweep 61.11 0.33 11.11 2.22 5.56 2.78 22.22 1.11
Puducherry 83.19 1.14 7.98 0.85 0.85 0.57 4.56 0.57
INDIA 77.10 2.8 6.01 0.91 0.82 0.98 10.96 0.42Source:
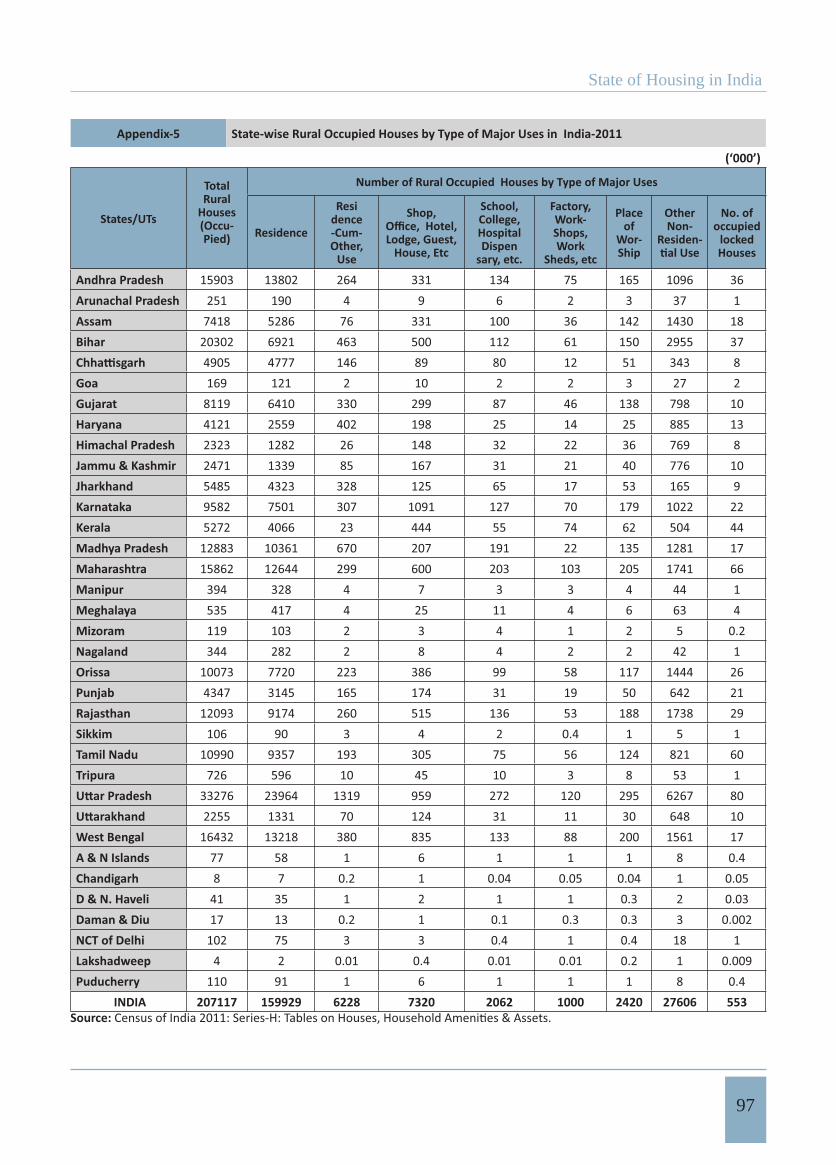
State of Housing in India
97
Appendix-5 State-wise Rural Occupied Houses by Type of Major Uses in India-2011
(‘000’)
States/UTs
Total Rural
Houses(Occu-Pied)
Number of Rural Occupied Houses by Type of Major Uses
Residence
Resi dence-Cum-Other,
Use
Shop,
Lodge, Guest, House, Etc
School,College, Hospital Dispen
sary, etc.
Factory, Work-Shops, Work
Sheds, etc
Placeof
Wor-Ship
Other Non-
Residen-
No. of occupied
locked Houses
Andhra Pradesh 15903 13802 264 331 134 75 165 1096 36Arunachal Pradesh 251 190 4 9 6 2 3 37 1Assam 7418 5286 76 331 100 36 142 1430 18Bihar 20302 6921 463 500 112 61 150 2955 37
4905 4777 146 89 80 12 51 343 8Goa 169 121 2 10 2 2 3 27 2Gujarat 8119 6410 330 299 87 46 138 798 10Haryana 4121 2559 402 198 25 14 25 885 13Himachal Pradesh 2323 1282 26 148 32 22 36 769 8Jammu & Kashmir 2471 1339 85 167 31 21 40 776 10Jharkhand 5485 4323 328 125 65 17 53 165 9Karnataka 9582 7501 307 1091 127 70 179 1022 22Kerala 5272 4066 23 444 55 74 62 504 44Madhya Pradesh 12883 10361 670 207 191 22 135 1281 17Maharashtra 15862 12644 299 600 203 103 205 1741 66Manipur 394 328 4 7 3 3 4 44 1Meghalaya 535 417 4 25 11 4 6 63 4Mizoram 119 103 2 3 4 1 2 5 0.2Nagaland 344 282 2 8 4 2 2 42 1Orissa 10073 7720 223 386 99 58 117 1444 26Punjab 4347 3145 165 174 31 19 50 642 21Rajasthan 12093 9174 260 515 136 53 188 1738 29Sikkim 106 90 3 4 2 0.4 1 5 1Tamil Nadu 10990 9357 193 305 75 56 124 821 60Tripura 726 596 10 45 10 3 8 53 1
33276 23964 1319 959 272 120 295 6267 802255 1331 70 124 31 11 30 648 10
West Bengal 16432 13218 380 835 133 88 200 1561 17A & N Islands 77 58 1 6 1 1 1 8 0.4Chandigarh 8 7 0.2 1 0.04 0.05 0.04 1 0.05D & N. Haveli 41 35 1 2 1 1 0.3 2 0.03Daman & Diu 17 13 0.2 1 0.1 0.3 0.3 3 0.002NCT of Delhi 102 75 3 3 0.4 1 0.4 18 1Lakshadweep 4 2 0.01 0.4 0.01 0.01 0.2 1 0.009Puducherry 110 91 1 6 1 1 1 8 0.4
INDIA 207117 159929 6228 7320 2062 1000 2420 27606 553Source:
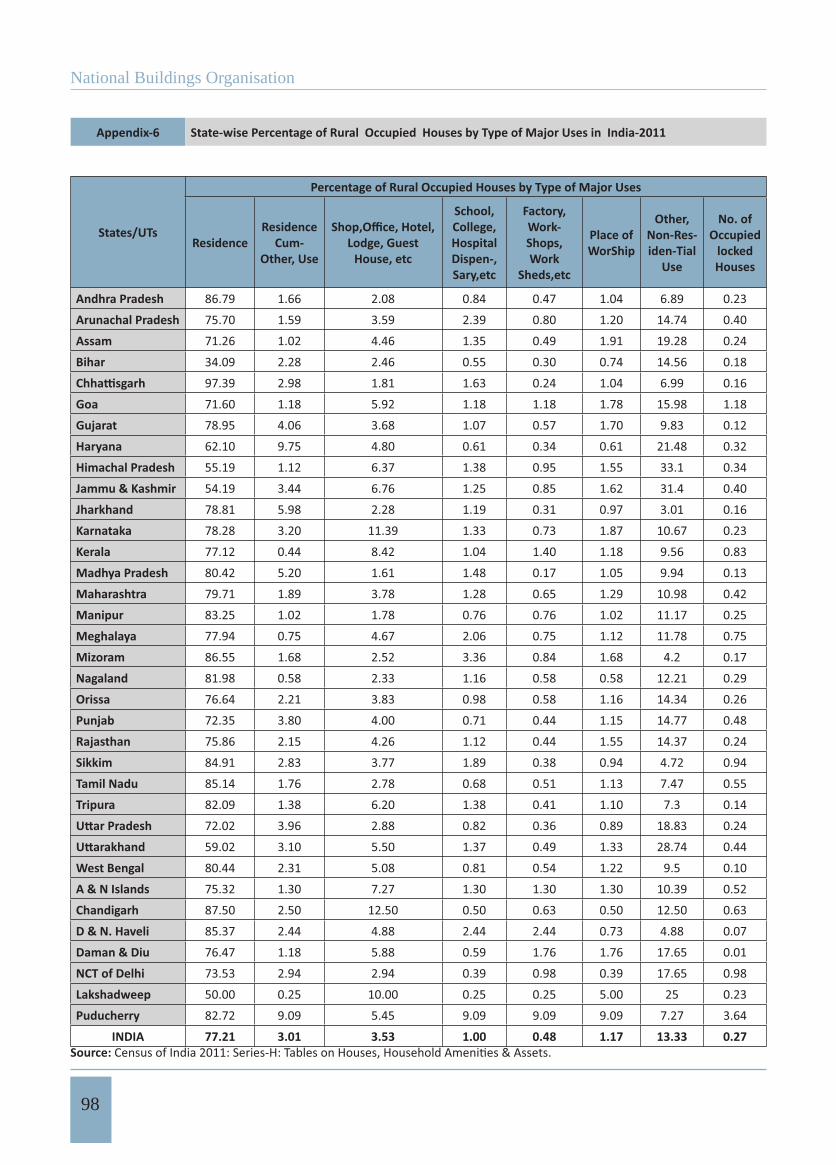
National Buildings Organisation
98
Appendix-6 State-wise Percentage of Rural Occupied Houses by Type of Major Uses in India-2011
States/UTs
Percentage of Rural Occupied Houses by Type of Major Uses
ResidenceResidence
Cum-Other, Use
Lodge, Guest House, etc
School,College, Hospital Dispen-,Sary,etc
Factory, Work-Shops, Work
Sheds,etc
Place of WorShip
Other, Non-Res-iden-Tial
Use
No. of Occupied
locked Houses
Andhra Pradesh 86.79 1.66 2.08 0.84 0.47 1.04 6.89 0.23Arunachal Pradesh 75.70 1.59 3.59 2.39 0.80 1.20 14.74 0.40Assam 71.26 1.02 4.46 1.35 0.49 1.91 19.28 0.24Bihar 34.09 2.28 2.46 0.55 0.30 0.74 14.56 0.18
97.39 2.98 1.81 1.63 0.24 1.04 6.99 0.16Goa 71.60 1.18 5.92 1.18 1.18 1.78 15.98 1.18Gujarat 78.95 4.06 3.68 1.07 0.57 1.70 9.83 0.12Haryana 62.10 9.75 4.80 0.61 0.34 0.61 21.48 0.32Himachal Pradesh 55.19 1.12 6.37 1.38 0.95 1.55 33.1 0.34Jammu & Kashmir 54.19 3.44 6.76 1.25 0.85 1.62 31.4 0.40Jharkhand 78.81 5.98 2.28 1.19 0.31 0.97 3.01 0.16Karnataka 78.28 3.20 11.39 1.33 0.73 1.87 10.67 0.23Kerala 77.12 0.44 8.42 1.04 1.40 1.18 9.56 0.83Madhya Pradesh 80.42 5.20 1.61 1.48 0.17 1.05 9.94 0.13Maharashtra 79.71 1.89 3.78 1.28 0.65 1.29 10.98 0.42Manipur 83.25 1.02 1.78 0.76 0.76 1.02 11.17 0.25Meghalaya 77.94 0.75 4.67 2.06 0.75 1.12 11.78 0.75Mizoram 86.55 1.68 2.52 3.36 0.84 1.68 4.2 0.17Nagaland 81.98 0.58 2.33 1.16 0.58 0.58 12.21 0.29Orissa 76.64 2.21 3.83 0.98 0.58 1.16 14.34 0.26Punjab 72.35 3.80 4.00 0.71 0.44 1.15 14.77 0.48Rajasthan 75.86 2.15 4.26 1.12 0.44 1.55 14.37 0.24Sikkim 84.91 2.83 3.77 1.89 0.38 0.94 4.72 0.94Tamil Nadu 85.14 1.76 2.78 0.68 0.51 1.13 7.47 0.55Tripura 82.09 1.38 6.20 1.38 0.41 1.10 7.3 0.14
72.02 3.96 2.88 0.82 0.36 0.89 18.83 0.2459.02 3.10 5.50 1.37 0.49 1.33 28.74 0.44
West Bengal 80.44 2.31 5.08 0.81 0.54 1.22 9.5 0.10A & N Islands 75.32 1.30 7.27 1.30 1.30 1.30 10.39 0.52Chandigarh 87.50 2.50 12.50 0.50 0.63 0.50 12.50 0.63D & N. Haveli 85.37 2.44 4.88 2.44 2.44 0.73 4.88 0.07Daman & Diu 76.47 1.18 5.88 0.59 1.76 1.76 17.65 0.01NCT of Delhi 73.53 2.94 2.94 0.39 0.98 0.39 17.65 0.98Lakshadweep 50.00 0.25 10.00 0.25 0.25 5.00 25 0.23Puducherry 82.72 9.09 5.45 9.09 9.09 9.09 7.27 3.64
INDIA 77.21 3.01 3.53 1.00 0.48 1.17 13.33 0.27Source:
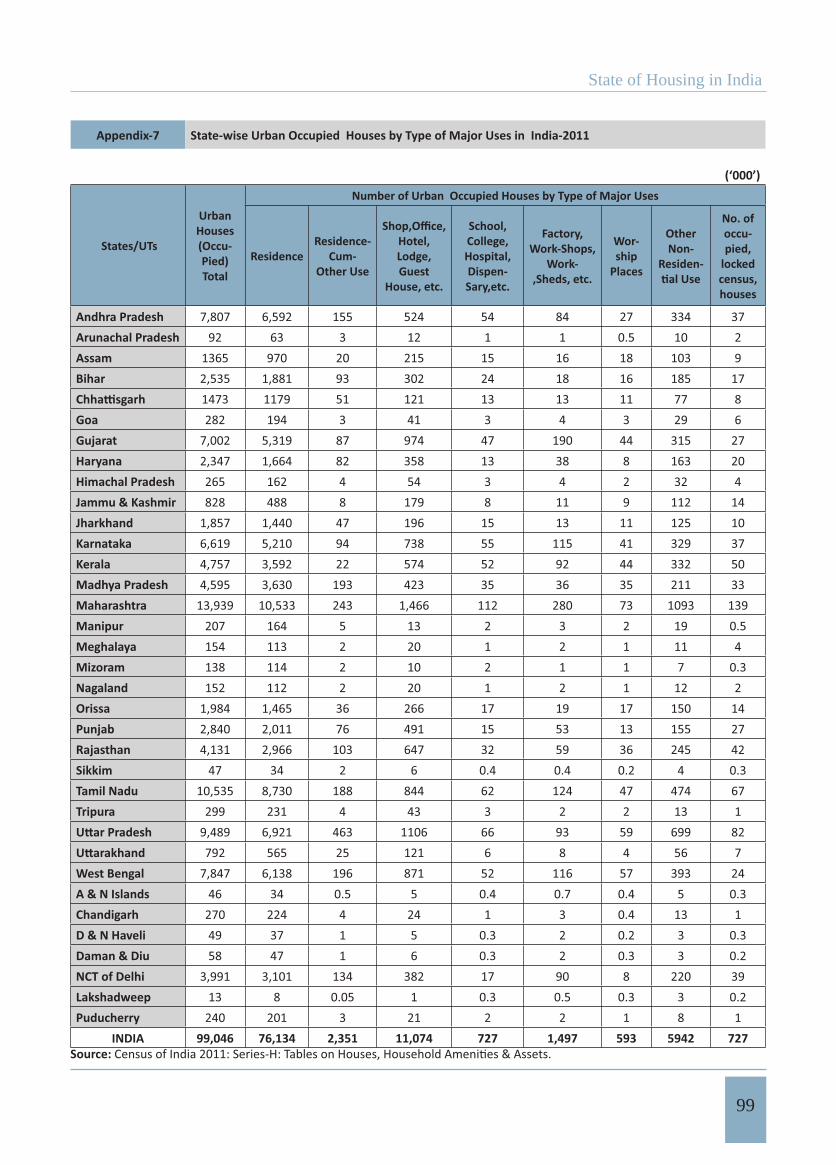
State of Housing in India
99
Appendix-7 State-wise Urban Occupied Houses by Type of Major Uses in India-2011
(‘000’)
States/UTs
UrbanHouses(Occu-Pied)Total
Number of Urban Occupied Houses by Type of Major Uses
ResidenceResidence-
Cum-Other Use
Hotel, Lodge, Guest
House, etc.
School,College, Hospital, Dispen-Sary,etc.
Factory, Work-Shops,
Work-,Sheds, etc.
Wor-ship
Places
OtherNon-
Residen-
No. of occu-pied,
locked census,houses
Andhra Pradesh 7,807 6,592 155 524 54 84 27 334 37Arunachal Pradesh 92 63 3 12 1 1 0.5 10 2Assam 1365 970 20 215 15 16 18 103 9Bihar 2,535 1,881 93 302 24 18 16 185 17
1473 1179 51 121 13 13 11 77 8Goa 282 194 3 41 3 4 3 29 6Gujarat 7,002 5,319 87 974 47 190 44 315 27Haryana 2,347 1,664 82 358 13 38 8 163 20Himachal Pradesh 265 162 4 54 3 4 2 32 4Jammu & Kashmir 828 488 8 179 8 11 9 112 14Jharkhand 1,857 1,440 47 196 15 13 11 125 10Karnataka 6,619 5,210 94 738 55 115 41 329 37Kerala 4,757 3,592 22 574 52 92 44 332 50Madhya Pradesh 4,595 3,630 193 423 35 36 35 211 33Maharashtra 13,939 10,533 243 1,466 112 280 73 1093 139Manipur 207 164 5 13 2 3 2 19 0.5Meghalaya 154 113 2 20 1 2 1 11 4Mizoram 138 114 2 10 2 1 1 7 0.3Nagaland 152 112 2 20 1 2 1 12 2Orissa 1,984 1,465 36 266 17 19 17 150 14Punjab 2,840 2,011 76 491 15 53 13 155 27Rajasthan 4,131 2,966 103 647 32 59 36 245 42Sikkim 47 34 2 6 0.4 0.4 0.2 4 0.3Tamil Nadu 10,535 8,730 188 844 62 124 47 474 67Tripura 299 231 4 43 3 2 2 13 1
9,489 6,921 463 1106 66 93 59 699 82792 565 25 121 6 8 4 56 7
West Bengal 7,847 6,138 196 871 52 116 57 393 24A & N Islands 46 34 0.5 5 0.4 0.7 0.4 5 0.3Chandigarh 270 224 4 24 1 3 0.4 13 1D & N Haveli 49 37 1 5 0.3 2 0.2 3 0.3Daman & Diu 58 47 1 6 0.3 2 0.3 3 0.2NCT of Delhi 3,991 3,101 134 382 17 90 8 220 39Lakshadweep 13 8 0.05 1 0.3 0.5 0.3 3 0.2Puducherry 240 201 3 21 2 2 1 8 1
INDIA 99,046 76,134 2,351 11,074 727 1,497 593 5942 727Source:
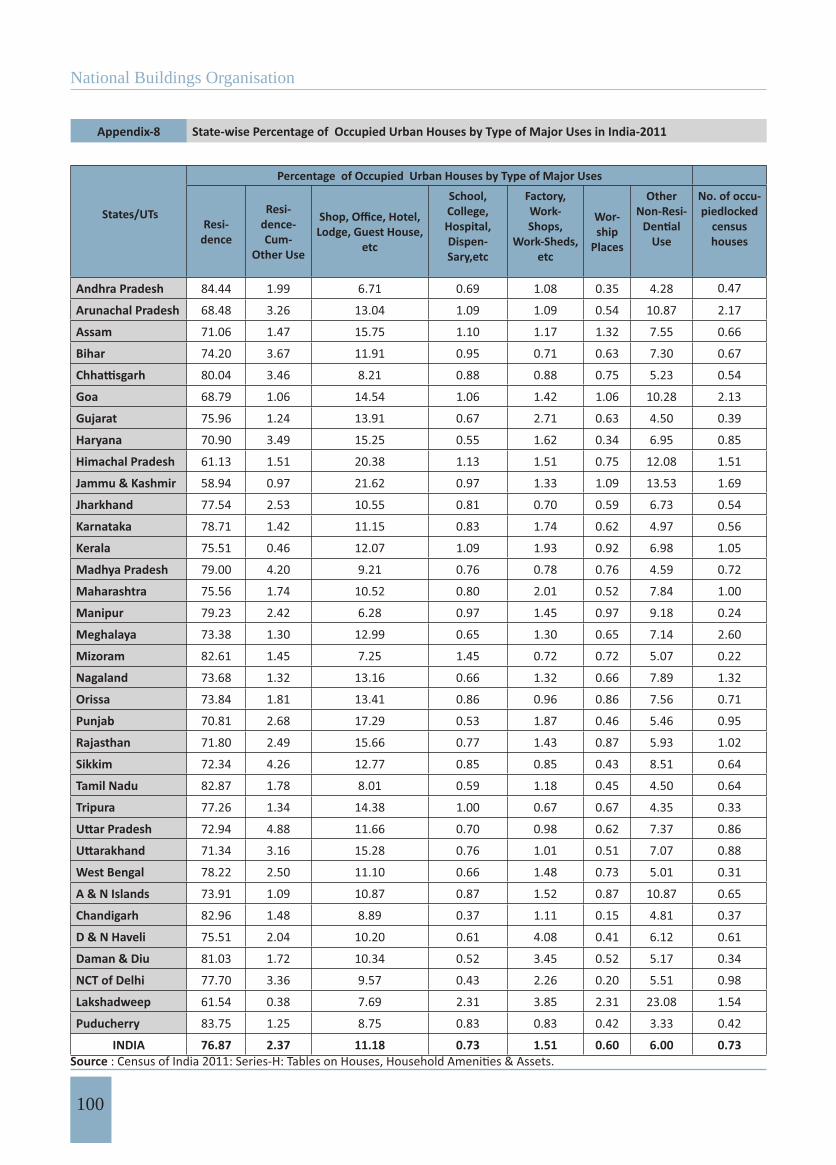
National Buildings Organisation
100
Appendix-8 State-wise Percentage of Occupied Urban Houses by Type of Major Uses in India-2011
States/UTs
Percentage of Occupied Urban Houses by Type of Major Uses
Resi-dence
Resi-dence-Cum-
Other Use
Lodge, Guest House, etc
School,College, Hospital, Dispen-Sary,etc
Factory, Work-Shops,
Work-Sheds, etc
Wor-ship
Places
OtherNon-Resi-
Use
No. of occu-piedlocked
censushouses
Andhra Pradesh 84.44 1.99 6.71 0.69 1.08 0.35 4.28 0.47
Arunachal Pradesh 68.48 3.26 13.04 1.09 1.09 0.54 10.87 2.17
Assam 71.06 1.47 15.75 1.10 1.17 1.32 7.55 0.66
Bihar 74.20 3.67 11.91 0.95 0.71 0.63 7.30 0.67
80.04 3.46 8.21 0.88 0.88 0.75 5.23 0.54
Goa 68.79 1.06 14.54 1.06 1.42 1.06 10.28 2.13
Gujarat 75.96 1.24 13.91 0.67 2.71 0.63 4.50 0.39
Haryana 70.90 3.49 15.25 0.55 1.62 0.34 6.95 0.85
Himachal Pradesh 61.13 1.51 20.38 1.13 1.51 0.75 12.08 1.51
Jammu & Kashmir 58.94 0.97 21.62 0.97 1.33 1.09 13.53 1.69
Jharkhand 77.54 2.53 10.55 0.81 0.70 0.59 6.73 0.54
Karnataka 78.71 1.42 11.15 0.83 1.74 0.62 4.97 0.56
Kerala 75.51 0.46 12.07 1.09 1.93 0.92 6.98 1.05
Madhya Pradesh 79.00 4.20 9.21 0.76 0.78 0.76 4.59 0.72
Maharashtra 75.56 1.74 10.52 0.80 2.01 0.52 7.84 1.00
Manipur 79.23 2.42 6.28 0.97 1.45 0.97 9.18 0.24
Meghalaya 73.38 1.30 12.99 0.65 1.30 0.65 7.14 2.60
Mizoram 82.61 1.45 7.25 1.45 0.72 0.72 5.07 0.22
Nagaland 73.68 1.32 13.16 0.66 1.32 0.66 7.89 1.32
Orissa 73.84 1.81 13.41 0.86 0.96 0.86 7.56 0.71
Punjab 70.81 2.68 17.29 0.53 1.87 0.46 5.46 0.95
Rajasthan 71.80 2.49 15.66 0.77 1.43 0.87 5.93 1.02
Sikkim 72.34 4.26 12.77 0.85 0.85 0.43 8.51 0.64
Tamil Nadu 82.87 1.78 8.01 0.59 1.18 0.45 4.50 0.64
Tripura 77.26 1.34 14.38 1.00 0.67 0.67 4.35 0.33
72.94 4.88 11.66 0.70 0.98 0.62 7.37 0.86
71.34 3.16 15.28 0.76 1.01 0.51 7.07 0.88
West Bengal 78.22 2.50 11.10 0.66 1.48 0.73 5.01 0.31
A & N Islands 73.91 1.09 10.87 0.87 1.52 0.87 10.87 0.65
Chandigarh 82.96 1.48 8.89 0.37 1.11 0.15 4.81 0.37
D & N Haveli 75.51 2.04 10.20 0.61 4.08 0.41 6.12 0.61
Daman & Diu 81.03 1.72 10.34 0.52 3.45 0.52 5.17 0.34
NCT of Delhi 77.70 3.36 9.57 0.43 2.26 0.20 5.51 0.98
Lakshadweep 61.54 0.38 7.69 2.31 3.85 2.31 23.08 1.54
Puducherry 83.75 1.25 8.75 0.83 0.83 0.42 3.33 0.42
INDIA 76.87 2.37 11.18 0.73 1.51 0.60 6.00 0.73Source
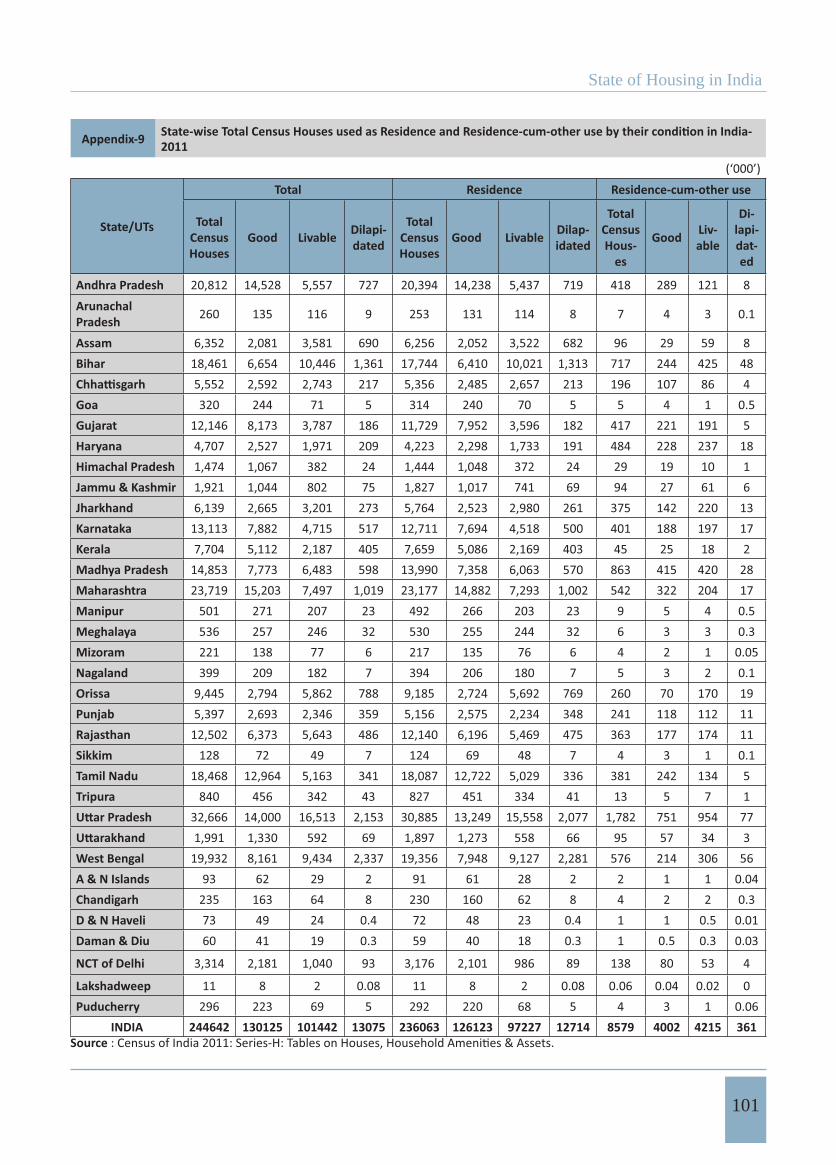
State of Housing in India
101
Appendix-9 2011
(‘000’)
State/UTs
Total Residence Residence-cum-other use
Total CensusHouses
Good Livable Dilapi-dated
Total CensusHouses
Good Livable Dilap-idated
Total Census Hous-
es
Good Liv-able
Di-lapi-dat-ed
Andhra Pradesh 20,812 14,528 5,557 727 20,394 14,238 5,437 719 418 289 121 8ArunachalPradesh 260 135 116 9 253 131 114 8 7 4 3 0.1
Assam 6,352 2,081 3,581 690 6,256 2,052 3,522 682 96 29 59 8Bihar 18,461 6,654 10,446 1,361 17,744 6,410 10,021 1,313 717 244 425 48
5,552 2,592 2,743 217 5,356 2,485 2,657 213 196 107 86 4Goa 320 244 71 5 314 240 70 5 5 4 1 0.5Gujarat 12,146 8,173 3,787 186 11,729 7,952 3,596 182 417 221 191 5Haryana 4,707 2,527 1,971 209 4,223 2,298 1,733 191 484 228 237 18Himachal Pradesh 1,474 1,067 382 24 1,444 1,048 372 24 29 19 10 1Jammu & Kashmir 1,921 1,044 802 75 1,827 1,017 741 69 94 27 61 6Jharkhand 6,139 2,665 3,201 273 5,764 2,523 2,980 261 375 142 220 13Karnataka 13,113 7,882 4,715 517 12,711 7,694 4,518 500 401 188 197 17Kerala 7,704 5,112 2,187 405 7,659 5,086 2,169 403 45 25 18 2Madhya Pradesh 14,853 7,773 6,483 598 13,990 7,358 6,063 570 863 415 420 28Maharashtra 23,719 15,203 7,497 1,019 23,177 14,882 7,293 1,002 542 322 204 17Manipur 501 271 207 23 492 266 203 23 9 5 4 0.5Meghalaya 536 257 246 32 530 255 244 32 6 3 3 0.3Mizoram 221 138 77 6 217 135 76 6 4 2 1 0.05Nagaland 399 209 182 7 394 206 180 7 5 3 2 0.1Orissa 9,445 2,794 5,862 788 9,185 2,724 5,692 769 260 70 170 19Punjab 5,397 2,693 2,346 359 5,156 2,575 2,234 348 241 118 112 11Rajasthan 12,502 6,373 5,643 486 12,140 6,196 5,469 475 363 177 174 11Sikkim 128 72 49 7 124 69 48 7 4 3 1 0.1Tamil Nadu 18,468 12,964 5,163 341 18,087 12,722 5,029 336 381 242 134 5Tripura 840 456 342 43 827 451 334 41 13 5 7 1
32,666 14,000 16,513 2,153 30,885 13,249 15,558 2,077 1,782 751 954 771,991 1,330 592 69 1,897 1,273 558 66 95 57 34 3
West Bengal 19,932 8,161 9,434 2,337 19,356 7,948 9,127 2,281 576 214 306 56A & N Islands 93 62 29 2 91 61 28 2 2 1 1 0.04Chandigarh 235 163 64 8 230 160 62 8 4 2 2 0.3D & N Haveli 73 49 24 0.4 72 48 23 0.4 1 1 0.5 0.01Daman & Diu 60 41 19 0.3 59 40 18 0.3 1 0.5 0.3 0.03
NCT of Delhi 3,314 2,181 1,040 93 3,176 2,101 986 89 138 80 53 4
Lakshadweep 11 8 2 0.08 11 8 2 0.08 0.06 0.04 0.02 0Puducherry 296 223 69 5 292 220 68 5 4 3 1 0.06
INDIA 244642 130125 101442 13075 236063 126123 97227 12714 8579 4002 4215 361Source
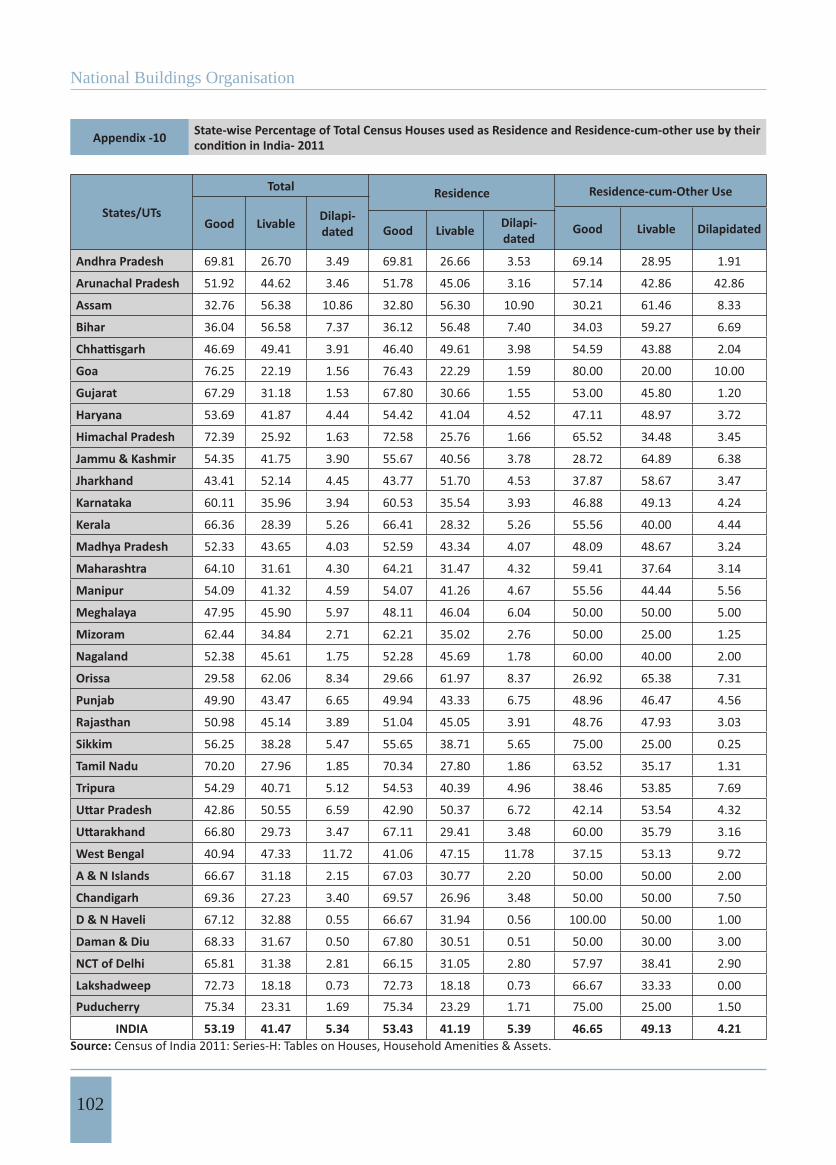
National Buildings Organisation
102
Appendix -10 State-wise Percentage of Total Census Houses used as Residence and Residence-cum-other use by their
States/UTs
Total Residence Residence-cum-Other Use
Good Livable Dilapi-dated Good Livable DilapidatedGood Livable Dilapi-
dated
Andhra Pradesh 69.81 26.70 3.49 69.81 26.66 3.53 69.14 28.95 1.91
Arunachal Pradesh 51.92 44.62 3.46 51.78 45.06 3.16 57.14 42.86 42.86
Assam 32.76 56.38 10.86 32.80 56.30 10.90 30.21 61.46 8.33
Bihar 36.04 56.58 7.37 36.12 56.48 7.40 34.03 59.27 6.69
46.69 49.41 3.91 46.40 49.61 3.98 54.59 43.88 2.04
Goa 76.25 22.19 1.56 76.43 22.29 1.59 80.00 20.00 10.00
Gujarat 67.29 31.18 1.53 67.80 30.66 1.55 53.00 45.80 1.20
Haryana 53.69 41.87 4.44 54.42 41.04 4.52 47.11 48.97 3.72
Himachal Pradesh 72.39 25.92 1.63 72.58 25.76 1.66 65.52 34.48 3.45
Jammu & Kashmir 54.35 41.75 3.90 55.67 40.56 3.78 28.72 64.89 6.38
Jharkhand 43.41 52.14 4.45 43.77 51.70 4.53 37.87 58.67 3.47
Karnataka 60.11 35.96 3.94 60.53 35.54 3.93 46.88 49.13 4.24
Kerala 66.36 28.39 5.26 66.41 28.32 5.26 55.56 40.00 4.44
Madhya Pradesh 52.33 43.65 4.03 52.59 43.34 4.07 48.09 48.67 3.24
Maharashtra 64.10 31.61 4.30 64.21 31.47 4.32 59.41 37.64 3.14
Manipur 54.09 41.32 4.59 54.07 41.26 4.67 55.56 44.44 5.56
Meghalaya 47.95 45.90 5.97 48.11 46.04 6.04 50.00 50.00 5.00
Mizoram 62.44 34.84 2.71 62.21 35.02 2.76 50.00 25.00 1.25
Nagaland 52.38 45.61 1.75 52.28 45.69 1.78 60.00 40.00 2.00
Orissa 29.58 62.06 8.34 29.66 61.97 8.37 26.92 65.38 7.31
Punjab 49.90 43.47 6.65 49.94 43.33 6.75 48.96 46.47 4.56
Rajasthan 50.98 45.14 3.89 51.04 45.05 3.91 48.76 47.93 3.03
Sikkim 56.25 38.28 5.47 55.65 38.71 5.65 75.00 25.00 0.25
Tamil Nadu 70.20 27.96 1.85 70.34 27.80 1.86 63.52 35.17 1.31
Tripura 54.29 40.71 5.12 54.53 40.39 4.96 38.46 53.85 7.69
42.86 50.55 6.59 42.90 50.37 6.72 42.14 53.54 4.32
66.80 29.73 3.47 67.11 29.41 3.48 60.00 35.79 3.16
West Bengal 40.94 47.33 11.72 41.06 47.15 11.78 37.15 53.13 9.72
A & N Islands 66.67 31.18 2.15 67.03 30.77 2.20 50.00 50.00 2.00
Chandigarh 69.36 27.23 3.40 69.57 26.96 3.48 50.00 50.00 7.50
D & N Haveli 67.12 32.88 0.55 66.67 31.94 0.56 100.00 50.00 1.00
Daman & Diu 68.33 31.67 0.50 67.80 30.51 0.51 50.00 30.00 3.00
NCT of Delhi 65.81 31.38 2.81 66.15 31.05 2.80 57.97 38.41 2.90
Lakshadweep 72.73 18.18 0.73 72.73 18.18 0.73 66.67 33.33 0.00
Puducherry 75.34 23.31 1.69 75.34 23.29 1.71 75.00 25.00 1.50
INDIA 53.19 41.47 5.34 53.43 41.19 5.39 46.65 49.13 4.21Source:
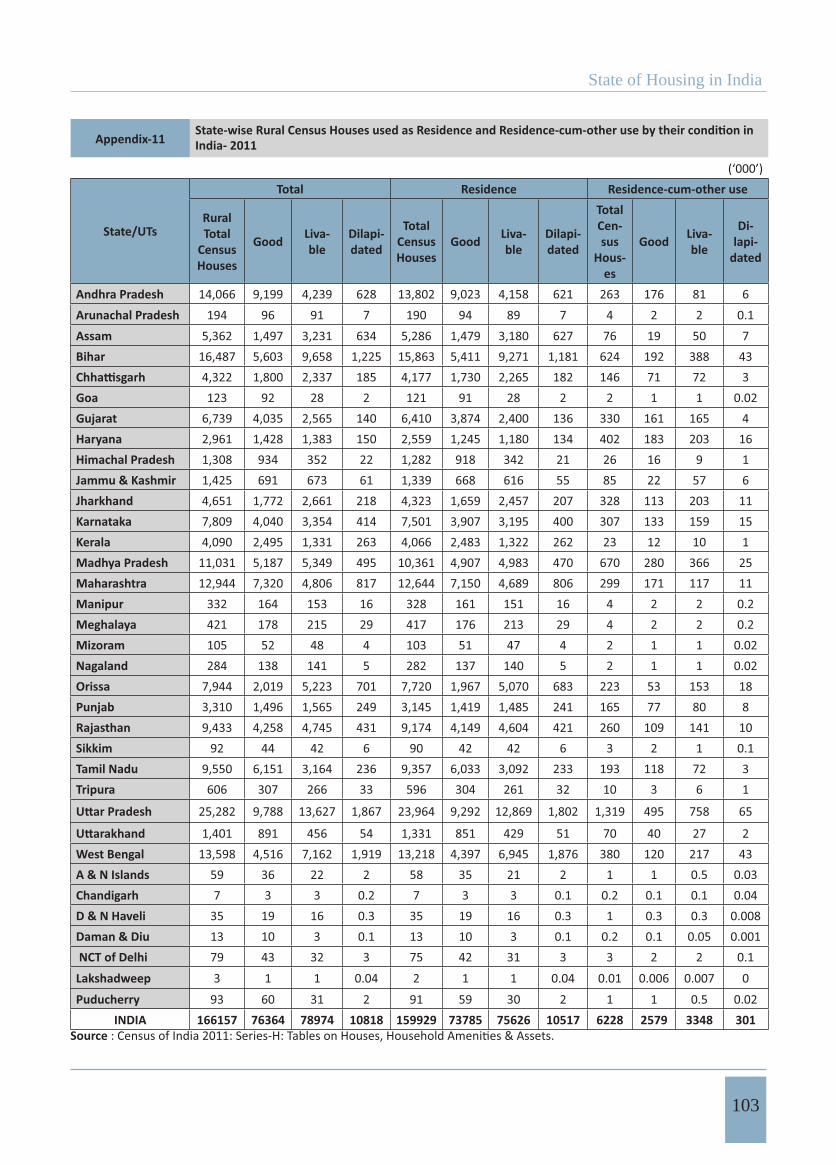
State of Housing in India
103
Appendix-11 India- 2011
(‘000’)
State/UTs
Total Residence Residence-cum-other use
Rural Total
CensusHouses
Good Liva-ble
Dilapi-dated
Total CensusHouses
Good Liva-ble
Dilapi-dated
Total Cen-sus
Hous-es
Good Liva-ble
Di-lapi-
dated
Andhra Pradesh 14,066 9,199 4,239 628 13,802 9,023 4,158 621 263 176 81 6Arunachal Pradesh 194 96 91 7 190 94 89 7 4 2 2 0.1Assam 5,362 1,497 3,231 634 5,286 1,479 3,180 627 76 19 50 7Bihar 16,487 5,603 9,658 1,225 15,863 5,411 9,271 1,181 624 192 388 43
4,322 1,800 2,337 185 4,177 1,730 2,265 182 146 71 72 3Goa 123 92 28 2 121 91 28 2 2 1 1 0.02Gujarat 6,739 4,035 2,565 140 6,410 3,874 2,400 136 330 161 165 4Haryana 2,961 1,428 1,383 150 2,559 1,245 1,180 134 402 183 203 16Himachal Pradesh 1,308 934 352 22 1,282 918 342 21 26 16 9 1Jammu & Kashmir 1,425 691 673 61 1,339 668 616 55 85 22 57 6Jharkhand 4,651 1,772 2,661 218 4,323 1,659 2,457 207 328 113 203 11Karnataka 7,809 4,040 3,354 414 7,501 3,907 3,195 400 307 133 159 15Kerala 4,090 2,495 1,331 263 4,066 2,483 1,322 262 23 12 10 1Madhya Pradesh 11,031 5,187 5,349 495 10,361 4,907 4,983 470 670 280 366 25Maharashtra 12,944 7,320 4,806 817 12,644 7,150 4,689 806 299 171 117 11Manipur 332 164 153 16 328 161 151 16 4 2 2 0.2Meghalaya 421 178 215 29 417 176 213 29 4 2 2 0.2Mizoram 105 52 48 4 103 51 47 4 2 1 1 0.02Nagaland 284 138 141 5 282 137 140 5 2 1 1 0.02Orissa 7,944 2,019 5,223 701 7,720 1,967 5,070 683 223 53 153 18Punjab 3,310 1,496 1,565 249 3,145 1,419 1,485 241 165 77 80 8Rajasthan 9,433 4,258 4,745 431 9,174 4,149 4,604 421 260 109 141 10Sikkim 92 44 42 6 90 42 42 6 3 2 1 0.1Tamil Nadu 9,550 6,151 3,164 236 9,357 6,033 3,092 233 193 118 72 3Tripura 606 307 266 33 596 304 261 32 10 3 6 1
25,282 9,788 13,627 1,867 23,964 9,292 12,869 1,802 1,319 495 758 65
1,401 891 456 54 1,331 851 429 51 70 40 27 2West Bengal 13,598 4,516 7,162 1,919 13,218 4,397 6,945 1,876 380 120 217 43A & N Islands 59 36 22 2 58 35 21 2 1 1 0.5 0.03Chandigarh 7 3 3 0.2 7 3 3 0.1 0.2 0.1 0.1 0.04D & N Haveli 35 19 16 0.3 35 19 16 0.3 1 0.3 0.3 0.008Daman & Diu 13 10 3 0.1 13 10 3 0.1 0.2 0.1 0.05 0.001 NCT of Delhi 79 43 32 3 75 42 31 3 3 2 2 0.1Lakshadweep 3 1 1 0.04 2 1 1 0.04 0.01 0.006 0.007 0Puducherry 93 60 31 2 91 59 30 2 1 1 0.5 0.02
INDIA 166157 76364 78974 10818 159929 73785 75626 10517 6228 2579 3348 301Source
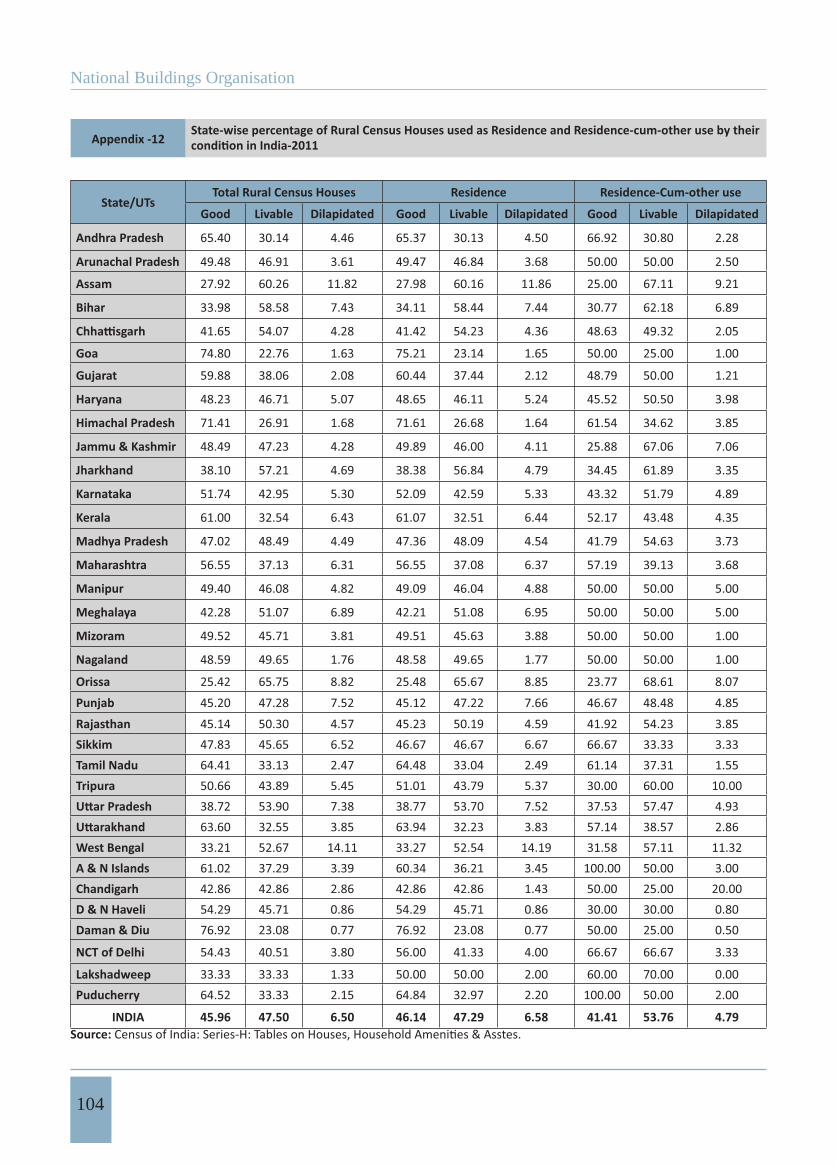
National Buildings Organisation
104
Appendix -12State-wise percentage of Rural Census Houses used as Residence and Residence-cum-other use by their
State/UTsTotal Rural Census Houses Residence Residence-Cum-other use
Good Livable Dilapidated Good Livable Dilapidated Good Livable Dilapidated
Andhra Pradesh 65.40 30.14 4.46 65.37 30.13 4.50 66.92 30.80 2.28
Arunachal Pradesh 49.48 46.91 3.61 49.47 46.84 3.68 50.00 50.00 2.50
Assam 27.92 60.26 11.82 27.98 60.16 11.86 25.00 67.11 9.21
Bihar 33.98 58.58 7.43 34.11 58.44 7.44 30.77 62.18 6.89
41.65 54.07 4.28 41.42 54.23 4.36 48.63 49.32 2.05
Goa 74.80 22.76 1.63 75.21 23.14 1.65 50.00 25.00 1.00
Gujarat 59.88 38.06 2.08 60.44 37.44 2.12 48.79 50.00 1.21
Haryana 48.23 46.71 5.07 48.65 46.11 5.24 45.52 50.50 3.98
Himachal Pradesh 71.41 26.91 1.68 71.61 26.68 1.64 61.54 34.62 3.85
Jammu & Kashmir 48.49 47.23 4.28 49.89 46.00 4.11 25.88 67.06 7.06
Jharkhand 38.10 57.21 4.69 38.38 56.84 4.79 34.45 61.89 3.35
Karnataka 51.74 42.95 5.30 52.09 42.59 5.33 43.32 51.79 4.89
Kerala 61.00 32.54 6.43 61.07 32.51 6.44 52.17 43.48 4.35
Madhya Pradesh 47.02 48.49 4.49 47.36 48.09 4.54 41.79 54.63 3.73
Maharashtra 56.55 37.13 6.31 56.55 37.08 6.37 57.19 39.13 3.68
Manipur 49.40 46.08 4.82 49.09 46.04 4.88 50.00 50.00 5.00
Meghalaya 42.28 51.07 6.89 42.21 51.08 6.95 50.00 50.00 5.00
Mizoram 49.52 45.71 3.81 49.51 45.63 3.88 50.00 50.00 1.00
Nagaland 48.59 49.65 1.76 48.58 49.65 1.77 50.00 50.00 1.00
Orissa 25.42 65.75 8.82 25.48 65.67 8.85 23.77 68.61 8.07Punjab 45.20 47.28 7.52 45.12 47.22 7.66 46.67 48.48 4.85Rajasthan 45.14 50.30 4.57 45.23 50.19 4.59 41.92 54.23 3.85Sikkim 47.83 45.65 6.52 46.67 46.67 6.67 66.67 33.33 3.33Tamil Nadu 64.41 33.13 2.47 64.48 33.04 2.49 61.14 37.31 1.55Tripura 50.66 43.89 5.45 51.01 43.79 5.37 30.00 60.00 10.00
38.72 53.90 7.38 38.77 53.70 7.52 37.53 57.47 4.9363.60 32.55 3.85 63.94 32.23 3.83 57.14 38.57 2.86
West Bengal 33.21 52.67 14.11 33.27 52.54 14.19 31.58 57.11 11.32A & N Islands 61.02 37.29 3.39 60.34 36.21 3.45 100.00 50.00 3.00Chandigarh 42.86 42.86 2.86 42.86 42.86 1.43 50.00 25.00 20.00D & N Haveli 54.29 45.71 0.86 54.29 45.71 0.86 30.00 30.00 0.80Daman & Diu 76.92 23.08 0.77 76.92 23.08 0.77 50.00 25.00 0.50
NCT of Delhi 54.43 40.51 3.80 56.00 41.33 4.00 66.67 66.67 3.33
Lakshadweep 33.33 33.33 1.33 50.00 50.00 2.00 60.00 70.00 0.00Puducherry 64.52 33.33 2.15 64.84 32.97 2.20 100.00 50.00 2.00
INDIA 45.96 47.50 6.50 46.14 47.29 6.58 41.41 53.76 4.79Source:
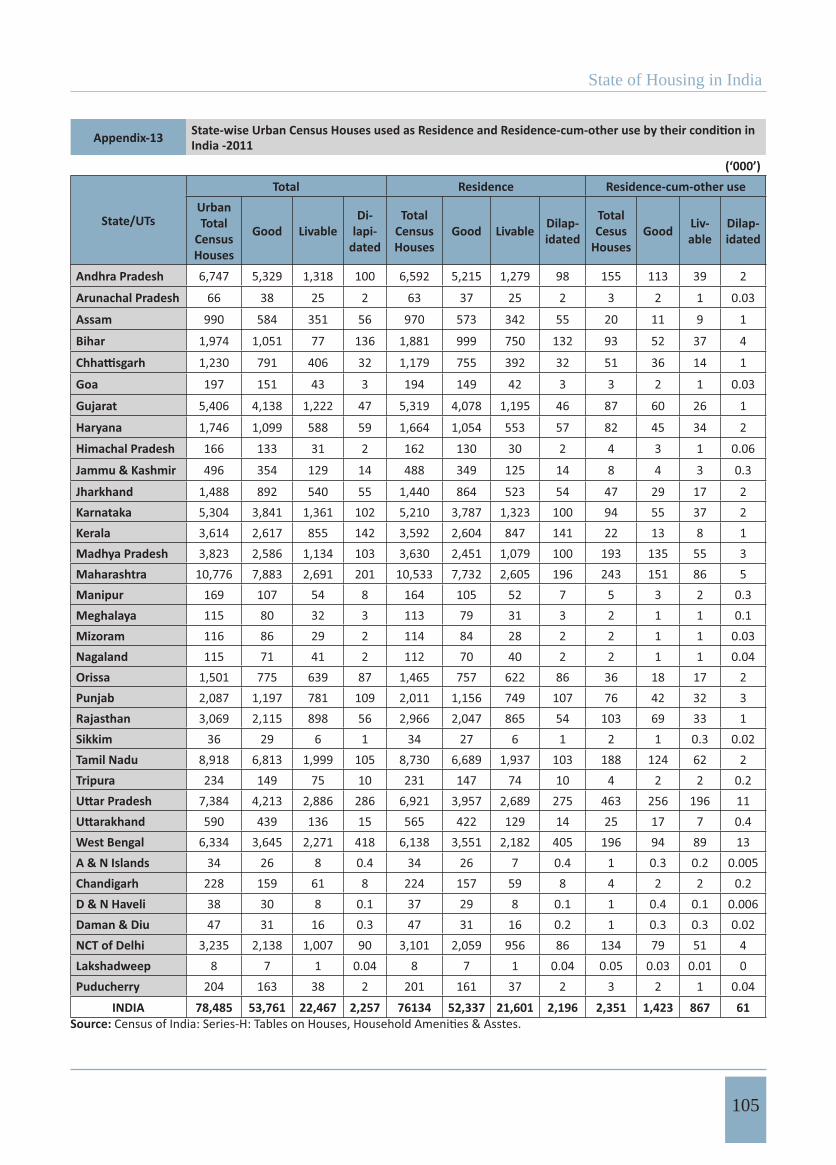
State of Housing in India
105
Appendix-13 India -2011(‘000’)
State/UTs
Total Residence Residence-cum-other useUrbanTotal
CensusHouses
Good LivableDi-
lapi-dated
Total CensusHouses
Good Livable Dilap-idated
Total Cesus
HousesGood Liv-
ableDilap-idated
Andhra Pradesh 6,747 5,329 1,318 100 6,592 5,215 1,279 98 155 113 39 2
Arunachal Pradesh 66 38 25 2 63 37 25 2 3 2 1 0.03
Assam 990 584 351 56 970 573 342 55 20 11 9 1
Bihar 1,974 1,051 77 136 1,881 999 750 132 93 52 37 4
1,230 791 406 32 1,179 755 392 32 51 36 14 1
Goa 197 151 43 3 194 149 42 3 3 2 1 0.03
Gujarat 5,406 4,138 1,222 47 5,319 4,078 1,195 46 87 60 26 1
Haryana 1,746 1,099 588 59 1,664 1,054 553 57 82 45 34 2Himachal Pradesh 166 133 31 2 162 130 30 2 4 3 1 0.06
Jammu & Kashmir 496 354 129 14 488 349 125 14 8 4 3 0.3
Jharkhand 1,488 892 540 55 1,440 864 523 54 47 29 17 2Karnataka 5,304 3,841 1,361 102 5,210 3,787 1,323 100 94 55 37 2Kerala 3,614 2,617 855 142 3,592 2,604 847 141 22 13 8 1Madhya Pradesh 3,823 2,586 1,134 103 3,630 2,451 1,079 100 193 135 55 3Maharashtra 10,776 7,883 2,691 201 10,533 7,732 2,605 196 243 151 86 5Manipur 169 107 54 8 164 105 52 7 5 3 2 0.3Meghalaya 115 80 32 3 113 79 31 3 2 1 1 0.1Mizoram 116 86 29 2 114 84 28 2 2 1 1 0.03Nagaland 115 71 41 2 112 70 40 2 2 1 1 0.04Orissa 1,501 775 639 87 1,465 757 622 86 36 18 17 2Punjab 2,087 1,197 781 109 2,011 1,156 749 107 76 42 32 3Rajasthan 3,069 2,115 898 56 2,966 2,047 865 54 103 69 33 1Sikkim 36 29 6 1 34 27 6 1 2 1 0.3 0.02Tamil Nadu 8,918 6,813 1,999 105 8,730 6,689 1,937 103 188 124 62 2Tripura 234 149 75 10 231 147 74 10 4 2 2 0.2
7,384 4,213 2,886 286 6,921 3,957 2,689 275 463 256 196 11590 439 136 15 565 422 129 14 25 17 7 0.4
West Bengal 6,334 3,645 2,271 418 6,138 3,551 2,182 405 196 94 89 13A & N Islands 34 26 8 0.4 34 26 7 0.4 1 0.3 0.2 0.005Chandigarh 228 159 61 8 224 157 59 8 4 2 2 0.2D & N Haveli 38 30 8 0.1 37 29 8 0.1 1 0.4 0.1 0.006Daman & Diu 47 31 16 0.3 47 31 16 0.2 1 0.3 0.3 0.02NCT of Delhi 3,235 2,138 1,007 90 3,101 2,059 956 86 134 79 51 4Lakshadweep 8 7 1 0.04 8 7 1 0.04 0.05 0.03 0.01 0Puducherry 204 163 38 2 201 161 37 2 3 2 1 0.04
INDIA 78,485 53,761 22,467 2,257 76134 52,337 21,601 2,196 2,351 1,423 867 61Source:
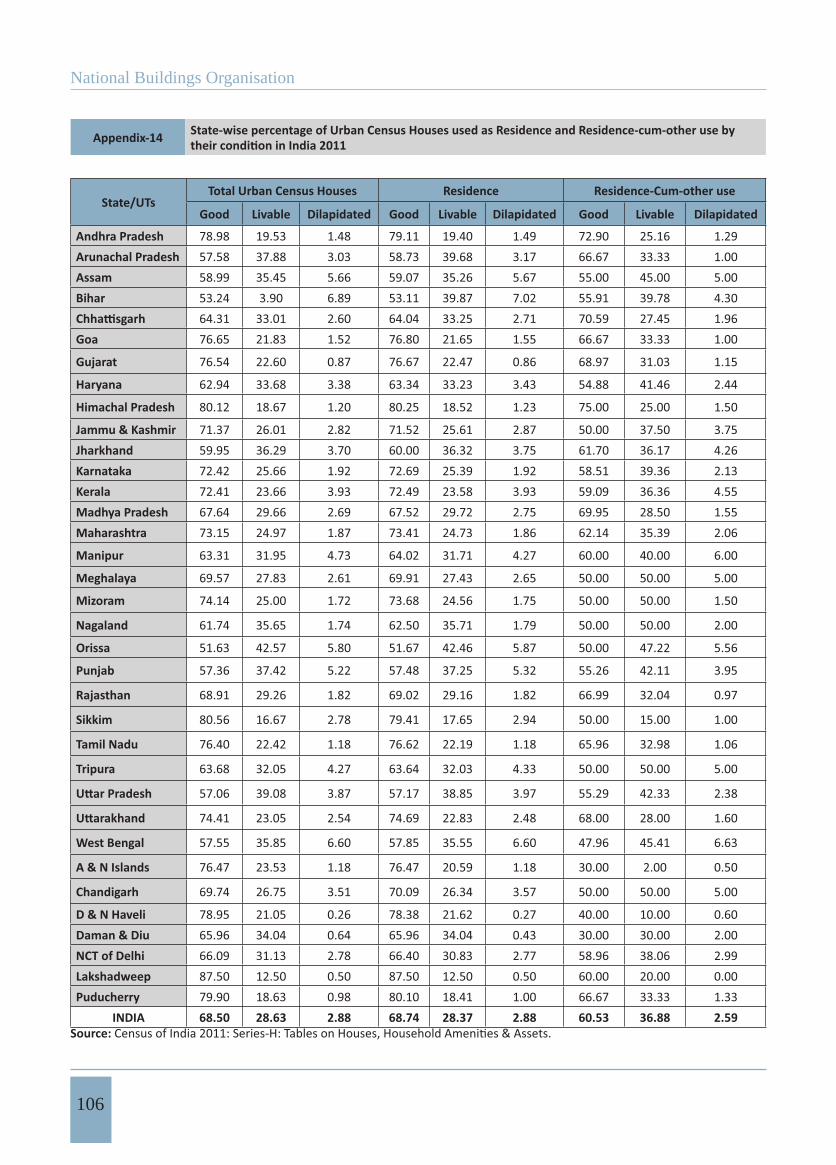
National Buildings Organisation
106
Appendix-14 State-wise percentage of Urban Census Houses used as Residence and Residence-cum-other use by
State/UTsTotal Urban Census Houses Residence Residence-Cum-other use
Good Livable Dilapidated Good Livable Dilapidated Good Livable Dilapidated
Andhra Pradesh 78.98 19.53 1.48 79.11 19.40 1.49 72.90 25.16 1.29Arunachal Pradesh 57.58 37.88 3.03 58.73 39.68 3.17 66.67 33.33 1.00Assam 58.99 35.45 5.66 59.07 35.26 5.67 55.00 45.00 5.00Bihar 53.24 3.90 6.89 53.11 39.87 7.02 55.91 39.78 4.30
64.31 33.01 2.60 64.04 33.25 2.71 70.59 27.45 1.96Goa 76.65 21.83 1.52 76.80 21.65 1.55 66.67 33.33 1.00
Gujarat 76.54 22.60 0.87 76.67 22.47 0.86 68.97 31.03 1.15
Haryana 62.94 33.68 3.38 63.34 33.23 3.43 54.88 41.46 2.44
Himachal Pradesh 80.12 18.67 1.20 80.25 18.52 1.23 75.00 25.00 1.50
Jammu & Kashmir 71.37 26.01 2.82 71.52 25.61 2.87 50.00 37.50 3.75Jharkhand 59.95 36.29 3.70 60.00 36.32 3.75 61.70 36.17 4.26Karnataka 72.42 25.66 1.92 72.69 25.39 1.92 58.51 39.36 2.13Kerala 72.41 23.66 3.93 72.49 23.58 3.93 59.09 36.36 4.55Madhya Pradesh 67.64 29.66 2.69 67.52 29.72 2.75 69.95 28.50 1.55Maharashtra 73.15 24.97 1.87 73.41 24.73 1.86 62.14 35.39 2.06
Manipur 63.31 31.95 4.73 64.02 31.71 4.27 60.00 40.00 6.00
Meghalaya 69.57 27.83 2.61 69.91 27.43 2.65 50.00 50.00 5.00
Mizoram 74.14 25.00 1.72 73.68 24.56 1.75 50.00 50.00 1.50
Nagaland 61.74 35.65 1.74 62.50 35.71 1.79 50.00 50.00 2.00
Orissa 51.63 42.57 5.80 51.67 42.46 5.87 50.00 47.22 5.56
Punjab 57.36 37.42 5.22 57.48 37.25 5.32 55.26 42.11 3.95
Rajasthan 68.91 29.26 1.82 69.02 29.16 1.82 66.99 32.04 0.97
Sikkim 80.56 16.67 2.78 79.41 17.65 2.94 50.00 15.00 1.00
Tamil Nadu 76.40 22.42 1.18 76.62 22.19 1.18 65.96 32.98 1.06
Tripura 63.68 32.05 4.27 63.64 32.03 4.33 50.00 50.00 5.00
57.06 39.08 3.87 57.17 38.85 3.97 55.29 42.33 2.38
74.41 23.05 2.54 74.69 22.83 2.48 68.00 28.00 1.60
West Bengal 57.55 35.85 6.60 57.85 35.55 6.60 47.96 45.41 6.63
A & N Islands 76.47 23.53 1.18 76.47 20.59 1.18 30.00 2.00 0.50
Chandigarh 69.74 26.75 3.51 70.09 26.34 3.57 50.00 50.00 5.00
D & N Haveli 78.95 21.05 0.26 78.38 21.62 0.27 40.00 10.00 0.60Daman & Diu 65.96 34.04 0.64 65.96 34.04 0.43 30.00 30.00 2.00NCT of Delhi 66.09 31.13 2.78 66.40 30.83 2.77 58.96 38.06 2.99Lakshadweep 87.50 12.50 0.50 87.50 12.50 0.50 60.00 20.00 0.00Puducherry 79.90 18.63 0.98 80.10 18.41 1.00 66.67 33.33 1.33
INDIA 68.50 28.63 2.88 68.74 28.37 2.88 60.53 36.88 2.59Source:
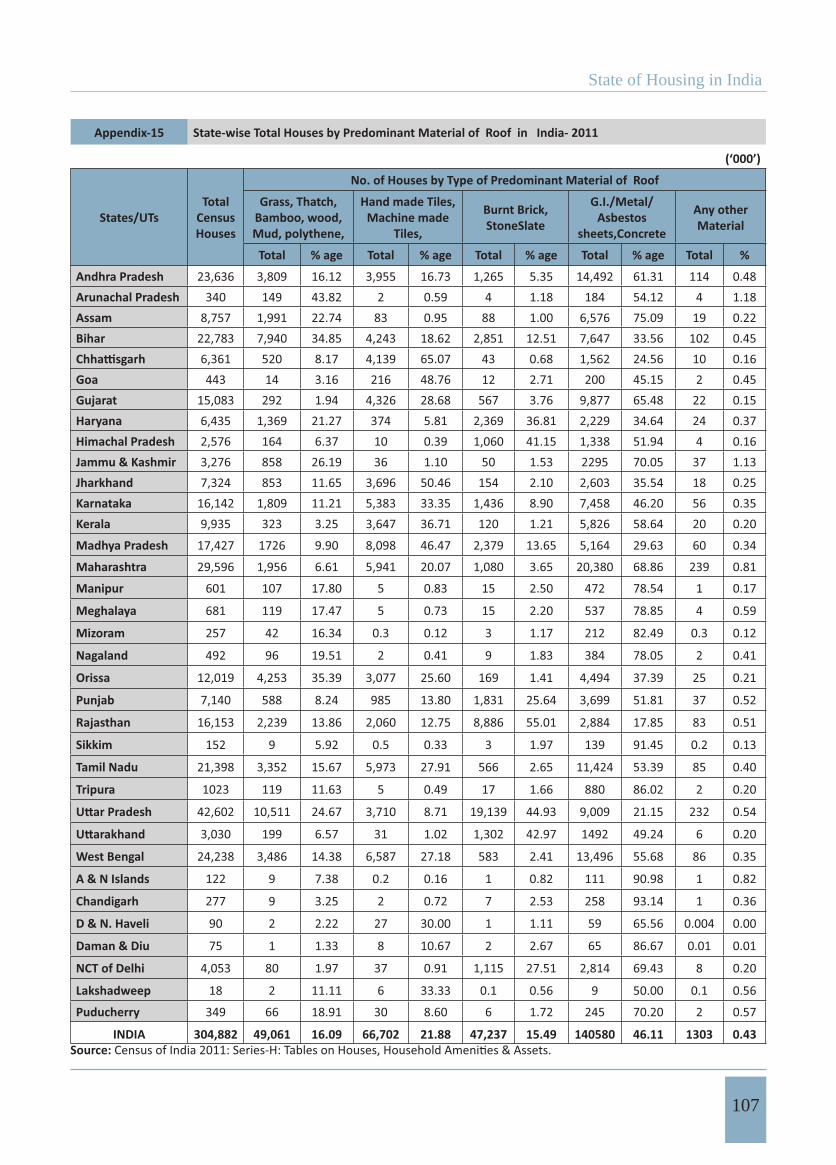
State of Housing in India
107
Appendix-15 State-wise Total Houses by Predominant Material of Roof in India- 2011
(‘000’)
States/UTsTotal
CensusHouses
No. of Houses by Type of Predominant Material of Roof
Grass, Thatch, Bamboo, wood, Mud, polythene,
Hand made Tiles, Machine made
Tiles,
Burnt Brick, StoneSlate
G.I./Metal/Asbestos
sheets,Concrete
Any other Material
Total % age Total % age Total % age Total % age Total %
Andhra Pradesh 23,636 3,809 16.12 3,955 16.73 1,265 5.35 14,492 61.31 114 0.48Arunachal Pradesh 340 149 43.82 2 0.59 4 1.18 184 54.12 4 1.18Assam 8,757 1,991 22.74 83 0.95 88 1.00 6,576 75.09 19 0.22Bihar 22,783 7,940 34.85 4,243 18.62 2,851 12.51 7,647 33.56 102 0.45
6,361 520 8.17 4,139 65.07 43 0.68 1,562 24.56 10 0.16Goa 443 14 3.16 216 48.76 12 2.71 200 45.15 2 0.45Gujarat 15,083 292 1.94 4,326 28.68 567 3.76 9,877 65.48 22 0.15Haryana 6,435 1,369 21.27 374 5.81 2,369 36.81 2,229 34.64 24 0.37Himachal Pradesh 2,576 164 6.37 10 0.39 1,060 41.15 1,338 51.94 4 0.16Jammu & Kashmir 3,276 858 26.19 36 1.10 50 1.53 2295 70.05 37 1.13Jharkhand 7,324 853 11.65 3,696 50.46 154 2.10 2,603 35.54 18 0.25Karnataka 16,142 1,809 11.21 5,383 33.35 1,436 8.90 7,458 46.20 56 0.35Kerala 9,935 323 3.25 3,647 36.71 120 1.21 5,826 58.64 20 0.20
Madhya Pradesh 17,427 1726 9.90 8,098 46.47 2,379 13.65 5,164 29.63 60 0.34
Maharashtra 29,596 1,956 6.61 5,941 20.07 1,080 3.65 20,380 68.86 239 0.81
Manipur 601 107 17.80 5 0.83 15 2.50 472 78.54 1 0.17
Meghalaya 681 119 17.47 5 0.73 15 2.20 537 78.85 4 0.59
Mizoram 257 42 16.34 0.3 0.12 3 1.17 212 82.49 0.3 0.12
Nagaland 492 96 19.51 2 0.41 9 1.83 384 78.05 2 0.41
Orissa 12,019 4,253 35.39 3,077 25.60 169 1.41 4,494 37.39 25 0.21
Punjab 7,140 588 8.24 985 13.80 1,831 25.64 3,699 51.81 37 0.52
Rajasthan 16,153 2,239 13.86 2,060 12.75 8,886 55.01 2,884 17.85 83 0.51
Sikkim 152 9 5.92 0.5 0.33 3 1.97 139 91.45 0.2 0.13
Tamil Nadu 21,398 3,352 15.67 5,973 27.91 566 2.65 11,424 53.39 85 0.40
Tripura 1023 119 11.63 5 0.49 17 1.66 880 86.02 2 0.20
42,602 10,511 24.67 3,710 8.71 19,139 44.93 9,009 21.15 232 0.54
3,030 199 6.57 31 1.02 1,302 42.97 1492 49.24 6 0.20
West Bengal 24,238 3,486 14.38 6,587 27.18 583 2.41 13,496 55.68 86 0.35
A & N Islands 122 9 7.38 0.2 0.16 1 0.82 111 90.98 1 0.82
Chandigarh 277 9 3.25 2 0.72 7 2.53 258 93.14 1 0.36
D & N. Haveli 90 2 2.22 27 30.00 1 1.11 59 65.56 0.004 0.00
Daman & Diu 75 1 1.33 8 10.67 2 2.67 65 86.67 0.01 0.01
NCT of Delhi 4,053 80 1.97 37 0.91 1,115 27.51 2,814 69.43 8 0.20
Lakshadweep 18 2 11.11 6 33.33 0.1 0.56 9 50.00 0.1 0.56
Puducherry 349 66 18.91 30 8.60 6 1.72 245 70.20 2 0.57
INDIA 304,882 49,061 16.09 66,702 21.88 47,237 15.49 140580 46.11 1303 0.43Source:
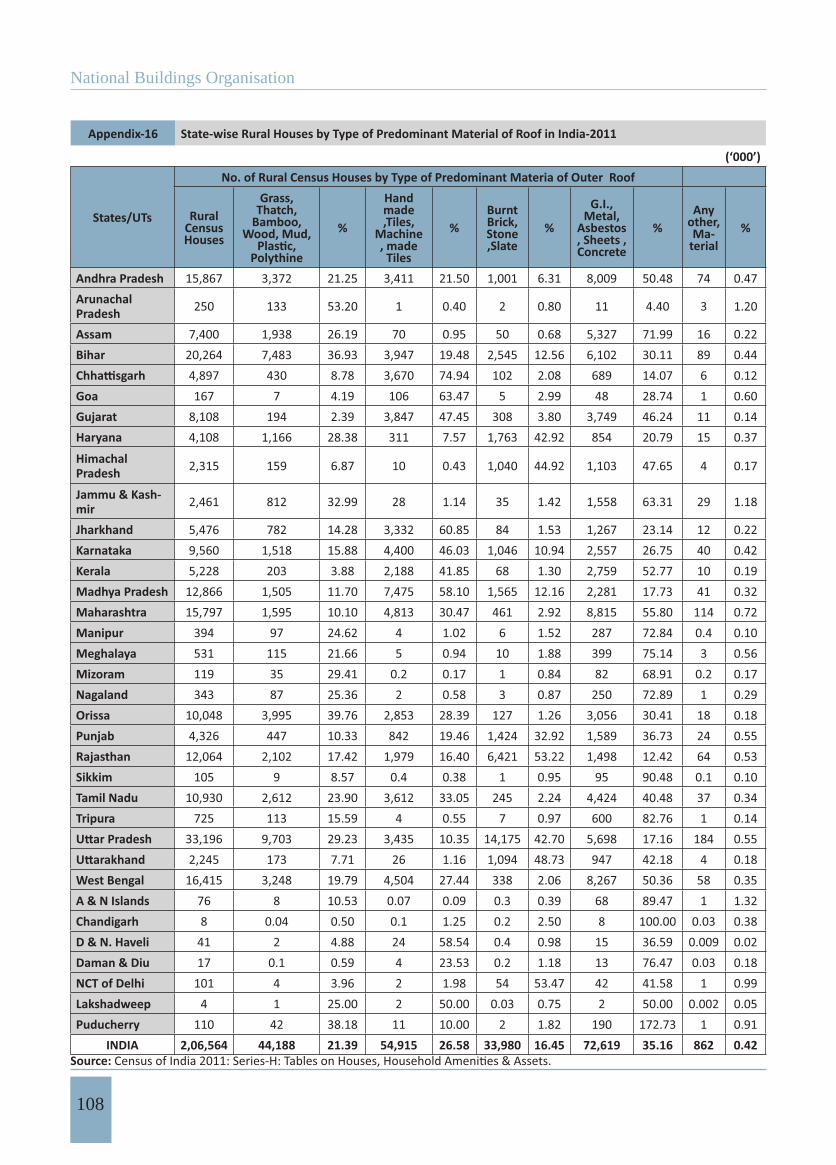
National Buildings Organisation
108
Appendix-16 State-wise Rural Houses by Type of Predominant Material of Roof in India-2011
(‘000’)
States/UTs
No. of Rural Census Houses by Type of Predominant Materia of Outer Roof
Rural CensusHouses
Grass, Thatch,
Bamboo, Wood, Mud,
Polythine
%
Handmade,Tiles,
Machine, made
Tiles
%Burnt Brick,Stone ,Slate
%
G.I.,Metal,
Asbestos , Sheets , Concrete
%Any
other, Ma-
terial%
Andhra Pradesh 15,867 3,372 21.25 3,411 21.50 1,001 6.31 8,009 50.48 74 0.47ArunachalPradesh 250 133 53.20 1 0.40 2 0.80 11 4.40 3 1.20
Assam 7,400 1,938 26.19 70 0.95 50 0.68 5,327 71.99 16 0.22Bihar 20,264 7,483 36.93 3,947 19.48 2,545 12.56 6,102 30.11 89 0.44
4,897 430 8.78 3,670 74.94 102 2.08 689 14.07 6 0.12Goa 167 7 4.19 106 63.47 5 2.99 48 28.74 1 0.60Gujarat 8,108 194 2.39 3,847 47.45 308 3.80 3,749 46.24 11 0.14Haryana 4,108 1,166 28.38 311 7.57 1,763 42.92 854 20.79 15 0.37
HimachalPradesh 2,315 159 6.87 10 0.43 1,040 44.92 1,103 47.65 4 0.17
Jammu & Kash-mir 2,461 812 32.99 28 1.14 35 1.42 1,558 63.31 29 1.18
Jharkhand 5,476 782 14.28 3,332 60.85 84 1.53 1,267 23.14 12 0.22Karnataka 9,560 1,518 15.88 4,400 46.03 1,046 10.94 2,557 26.75 40 0.42Kerala 5,228 203 3.88 2,188 41.85 68 1.30 2,759 52.77 10 0.19Madhya Pradesh 12,866 1,505 11.70 7,475 58.10 1,565 12.16 2,281 17.73 41 0.32Maharashtra 15,797 1,595 10.10 4,813 30.47 461 2.92 8,815 55.80 114 0.72Manipur 394 97 24.62 4 1.02 6 1.52 287 72.84 0.4 0.10Meghalaya 531 115 21.66 5 0.94 10 1.88 399 75.14 3 0.56Mizoram 119 35 29.41 0.2 0.17 1 0.84 82 68.91 0.2 0.17Nagaland 343 87 25.36 2 0.58 3 0.87 250 72.89 1 0.29Orissa 10,048 3,995 39.76 2,853 28.39 127 1.26 3,056 30.41 18 0.18Punjab 4,326 447 10.33 842 19.46 1,424 32.92 1,589 36.73 24 0.55Rajasthan 12,064 2,102 17.42 1,979 16.40 6,421 53.22 1,498 12.42 64 0.53Sikkim 105 9 8.57 0.4 0.38 1 0.95 95 90.48 0.1 0.10Tamil Nadu 10,930 2,612 23.90 3,612 33.05 245 2.24 4,424 40.48 37 0.34Tripura 725 113 15.59 4 0.55 7 0.97 600 82.76 1 0.14
33,196 9,703 29.23 3,435 10.35 14,175 42.70 5,698 17.16 184 0.552,245 173 7.71 26 1.16 1,094 48.73 947 42.18 4 0.18
West Bengal 16,415 3,248 19.79 4,504 27.44 338 2.06 8,267 50.36 58 0.35A & N Islands 76 8 10.53 0.07 0.09 0.3 0.39 68 89.47 1 1.32Chandigarh 8 0.04 0.50 0.1 1.25 0.2 2.50 8 100.00 0.03 0.38D & N. Haveli 41 2 4.88 24 58.54 0.4 0.98 15 36.59 0.009 0.02Daman & Diu 17 0.1 0.59 4 23.53 0.2 1.18 13 76.47 0.03 0.18NCT of Delhi 101 4 3.96 2 1.98 54 53.47 42 41.58 1 0.99Lakshadweep 4 1 25.00 2 50.00 0.03 0.75 2 50.00 0.002 0.05Puducherry 110 42 38.18 11 10.00 2 1.82 190 172.73 1 0.91
INDIA 2,06,564 44,188 21.39 54,915 26.58 33,980 16.45 72,619 35.16 862 0.42Source:

State of Housing in India
109
Appendix-17 State-wise Urban Houses by Type of Predominant Material of Roof in India 2011
(‘000’)
States/Uts
UrbanCensusHous-
es
No. of Urban Houses by Type of Predominant Materia of Outer RoofGrass/
Thatch /Bamboo /
Wood /Mud
Polythine etc.
%
HandmadeTiles/Ma-
chine-madeTiles
%
Burnt Brick/
Stone /Slate
%
G.I./Metal/
Asbestos Sheets/
Concrete
%
Any other-Mate-
rial
%
Andhra Pradesh 7,769 438 5.64 544 7.00 264 3.40 6,483 83.45 41 0.53Arunachal Pradesh 90 14 15.56 1 1.11 3 3.33 73 81.11 1 1.11Assam 1,356 53 3.91 13 0.96 38 2.80 1,250 92.18 3 0.22Bihar 2,519 358 14.21 296 11.75 308 12.23 1,545 61.33 13 0.52
1,464 90 6.15 470 32.10 30 2.05 872 59.56 4 0.27Goa 276 6 2.17 110 39.86 8 2.90 153 55.43 1 0.36Gujarat 6,975 98 1.41 480 6.88 259 3.71 6,128 87.86 11 0.16Haryana 2,327 203 8.72 63 2.71 607 26.09 1,445 62.10 8 0.34Himachal Pradesh 261 5 1.92 2 0.77 20 7.66 234 89.66 0.4 0.15Jammu & Kashmir 815 47 5.77 9 1.10 14 1.72 737 90.43 7 0.86Jharkhand 1,847 71 3.84 364 19.71 70 3.79 1,337 72.39 6 0.32Karnataka 6,581 292 4.44 984 14.95 390 5.93 4,900 74.46 16 0.24Kerala 4,707 120 2.55 1,459 31.00 53 1.13 3,067 65.16 9 0.19Madhya Pradesh 4,562 222 4.87 624 13.68 815 17.86 2,883 63.20 19 0.42Maharashtra 13,800 361 2.62 1,129 8.18 619 4.49 11,565 83.80 125 0.91Manipur 206 10 4.85 2 0.97 9 4.37 186 90.29 0.3 0.15Meghalaya 150 5 3.33 0.4 0.27 5 3.33 239 159.33 2 1.33Mizoram 138 7 5.07 0.3 0.22 2 1.45 129 93.48 0.1 0.07Nagaland 150 9 6.00 1 0.67 6 4.00 134 89.33 0.5 0.33Orissa 1,971 258 13.09 225 11.42 43 2.18 1,439 73.01 7 0.36Punjab 2,814 142 5.05 143 5.08 408 14.50 2,109 74.95 13 0.46Rajasthan 4,089 137 3.35 81 1.98 2,466 60.31 1,386 33.90 19 0.46Sikkim 46 1 2.17 0.1 0.22 1 2.17 45 97.83 0.03 0.07Tamil Nadu 10,468 740 7.07 2,360 22.54 321 3.07 7,000 66.87 47 0.45Tripura 297 6 2.02 1 0.34 11 3.70 280 94.28 1 0.34
9,406 809 8.60 274 2.91 4,964 52.77 3,311 35.20 48 0.51785 26 3.31 5 0.64 208 26.50 545 69.43 1 0.13
West Bengal 7,823 238 3.04 2,083 26.63 245 3.13 5,230 66.85 27 0.35A & N Islands 45 1 2.22 0.1 0.22 0.4 0.89 44 97.78 0.1 0.22Chandigarh 269 9 3.35 2 0.74 7 2.60 251 93.31 1 0.37D & N. Haveli 49 0.4 0.82 3 6.12 1 2.04 44 89.80 0.03 0.06Daman & Diu 58 0.4 0.69 4 6.90 1 1.72 52 89.66 0.05 0.09NCT of Delhi 3,952 76 1.92 36 0.91 1,061 26.85 2,773 70.17 7 0.18Lakshadweep 13 1 7.69 5 38.46 0.1 0.77 7 53.85 0.05 0.38Puducherry 238 25 10.50 18 7.56 4 1.68 190 79.83 1 0.42
INDIA 98,319 4,874 4.96 11,787 11.99 13,257 13.48 67,961 69.12 441 0.45Source:
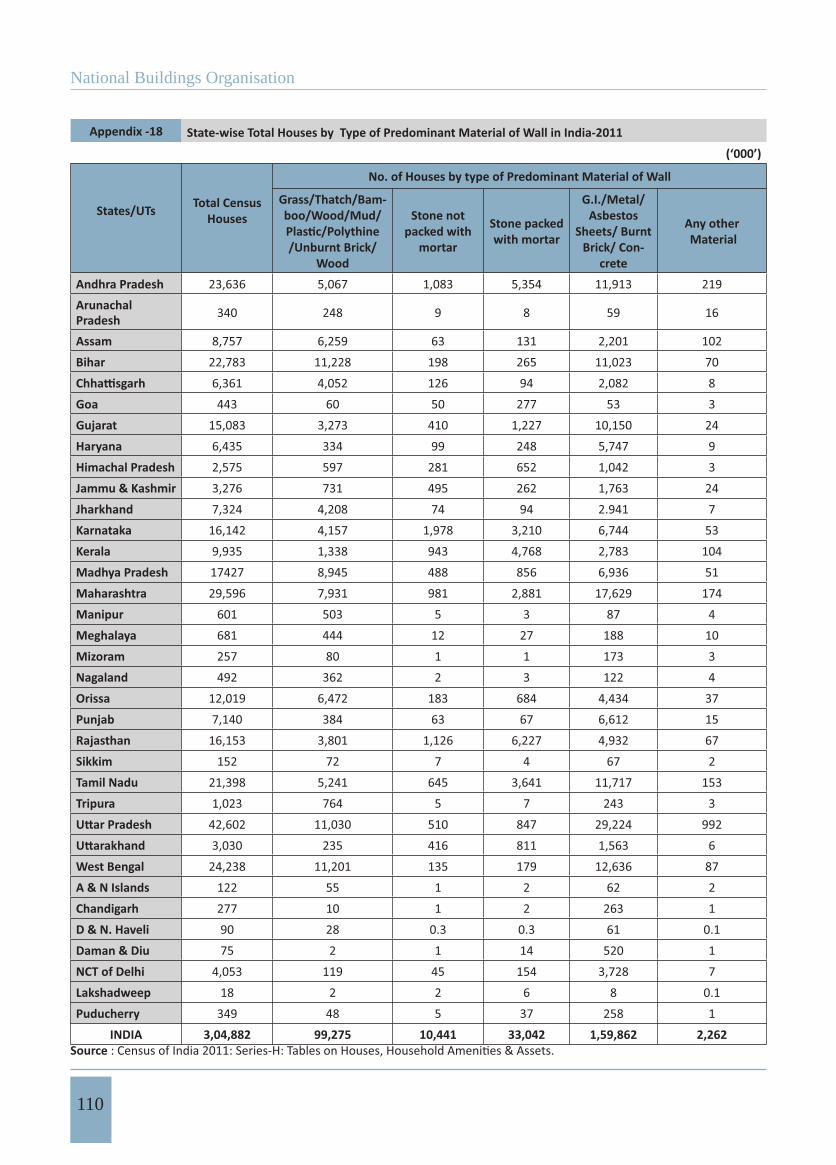
National Buildings Organisation
110
Appendix -18 State-wise Total Houses by Type of Predominant Material of Wall in India-2011(‘000’)
States/UTs Total Census Houses
No. of Houses by type of Predominant Material of Wall
Grass/Thatch/Bam-boo/Wood/Mud/
/Unburnt Brick/Wood
Stone not packed with
mortar
Stone packed with mortar
G.I./Metal/ Asbestos
Sheets/ Burnt Brick/ Con-
crete
Any other Material
Andhra Pradesh 23,636 5,067 1,083 5,354 11,913 219ArunachalPradesh 340 248 9 8 59 16
Assam 8,757 6,259 63 131 2,201 102Bihar 22,783 11,228 198 265 11,023 70
6,361 4,052 126 94 2,082 8Goa 443 60 50 277 53 3Gujarat 15,083 3,273 410 1,227 10,150 24Haryana 6,435 334 99 248 5,747 9Himachal Pradesh 2,575 597 281 652 1,042 3Jammu & Kashmir 3,276 731 495 262 1,763 24Jharkhand 7,324 4,208 74 94 2.941 7Karnataka 16,142 4,157 1,978 3,210 6,744 53Kerala 9,935 1,338 943 4,768 2,783 104Madhya Pradesh 17427 8,945 488 856 6,936 51Maharashtra 29,596 7,931 981 2,881 17,629 174Manipur 601 503 5 3 87 4Meghalaya 681 444 12 27 188 10Mizoram 257 80 1 1 173 3Nagaland 492 362 2 3 122 4Orissa 12,019 6,472 183 684 4,434 37Punjab 7,140 384 63 67 6,612 15Rajasthan 16,153 3,801 1,126 6,227 4,932 67Sikkim 152 72 7 4 67 2Tamil Nadu 21,398 5,241 645 3,641 11,717 153Tripura 1,023 764 5 7 243 3
42,602 11,030 510 847 29,224 9923,030 235 416 811 1,563 6
West Bengal 24,238 11,201 135 179 12,636 87A & N Islands 122 55 1 2 62 2Chandigarh 277 10 1 2 263 1D & N. Haveli 90 28 0.3 0.3 61 0.1Daman & Diu 75 2 1 14 520 1NCT of Delhi 4,053 119 45 154 3,728 7Lakshadweep 18 2 2 6 8 0.1Puducherry 349 48 5 37 258 1
INDIA 3,04,882 99,275 10,441 33,042 1,59,862 2,262Source

State of Housing in India
111
Appendix -19 India-2011
States/UTs
Percentage of Total Houses by type of Predominant Material of Wall
Grass/Thatch/Bam-
Polythine /Unburnt Brick/Wood
Stone not packed with mortar
Stone packed with mortar
G.I./Metal/Asbes-tos/Sheets/Burnt
Brick/Concrete
Any other Material
Andhra Pradesh 21.44 4.58 22.65 50.40 0.93Arunachal Pradesh 72.94 2.65 2.35 17.35 4.71Assam 71.47 0.72 1.50 25.13 1.16Bihar 49.28 0.87 1.16 48.38 0.31
63.70 1.98 1.48 32.73 0.13Goa 13.54 11.29 62.53 11.96 0.68Gujarat 21.70 2.72 8.13 67.29 0.16Haryana 5.19 1.54 3.85 89.31 0.14Himachal Pradesh 23.18 10.91 25.32 40.47 0.12Jammu & Kashmir 22.31 15.11 8.00 53.82 0.73Jharkhand 57.45 1.01 1.28 0.04 0.10Karnataka 25.75 12.25 19.89 41.78 0.33Kerala 13.47 9.49 47.99 28.01 1.05Madhya Pradesh 51.33 2.80 4.91 39.80 0.29Maharashtra 26.80 3.31 9.73 59.57 0.59Manipur 83.69 0.83 0.50 14.48 0.67Meghalaya 65.20 1.76 3.96 27.61 1.47Mizoram 31.13 0.39 0.39 67.32 1.17Nagaland 73.58 0.41 0.61 24.80 0.81Orissa 53.85 1.52 5.69 36.89 0.31Punjab 5.38 0.88 0.94 92.61 0.21Rajasthan 23.53 6.97 38.55 30.53 0.41Sikkim 47.37 4.61 2.63 44.08 1.32Tamil Nadu 24.49 3.01 17.02 54.76 0.72Tripura 74.68 0.49 0.68 23.75 0.29
25.89 1.20 1.99 68.60 2.337.76 13.73 26.77 51.58 0.20
West Bengal 46.21 0.56 0.74 52.13 0.36A & N Islands 45.08 0.82 1.64 50.82 1.64Chandigarh 3.61 0.36 0.72 94.95 0.36D & N. Haveli 31.11 0.33 0.33 67.78 0.11Daman & Diu 2.67 1.33 18.67 693.33 1.33NCT of Delhi 2.94 1.11 3.80 91.98 0.17Lakshadweep 11.11 11.11 33.33 44.44 0.56Puducherry 13.75 1.43 10.60 73.93 0.29
INDIA 32.56 3.42 10.84 52.43 0.74Source:
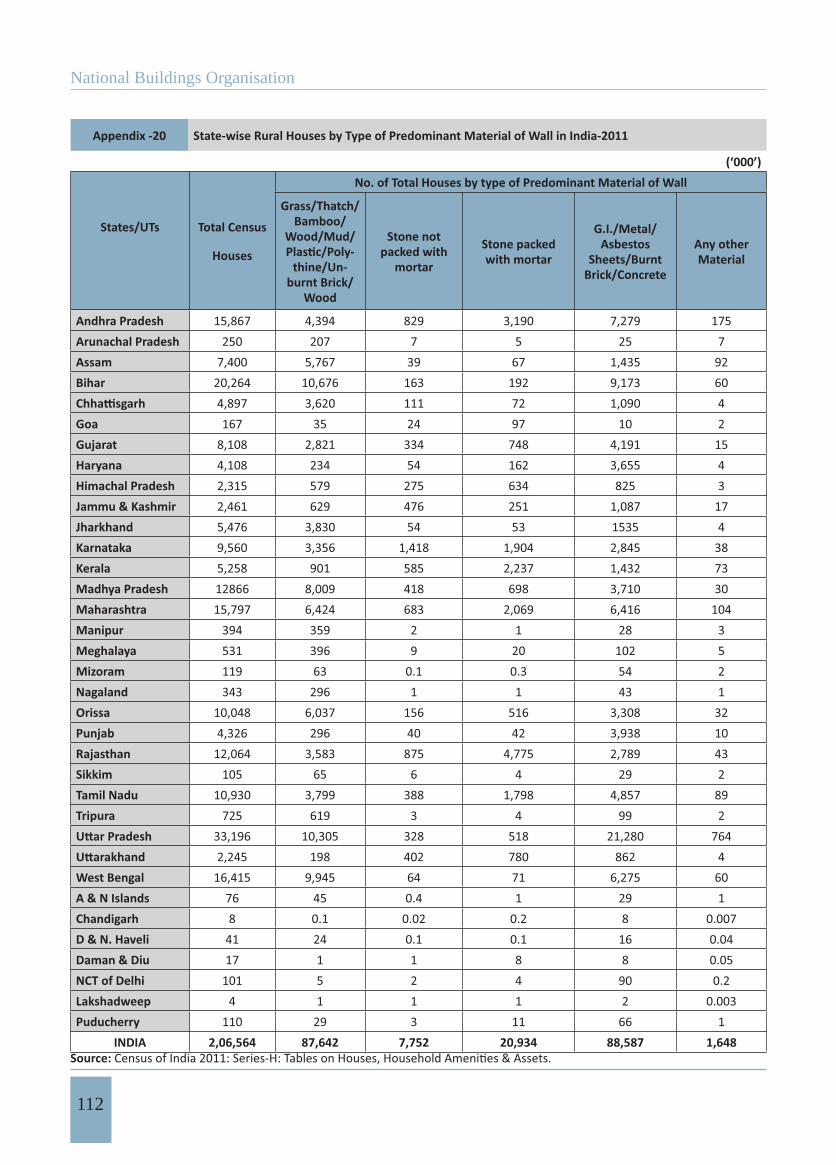
National Buildings Organisation
112
Appendix -20 State-wise Rural Houses by Type of Predominant Material of Wall in India-2011
(‘000’)
States/UTs Total Census
Houses
No. of Total Houses by type of Predominant Material of Wall
Grass/Thatch/Bamboo/
Wood/Mud/-
thine/Un-burnt Brick/
Wood
Stone not packed with
mortar
Stone packed with mortar
G.I./Metal/Asbestos
Sheets/Burnt Brick/Concrete
Any other Material
Andhra Pradesh 15,867 4,394 829 3,190 7,279 175Arunachal Pradesh 250 207 7 5 25 7Assam 7,400 5,767 39 67 1,435 92Bihar 20,264 10,676 163 192 9,173 60
4,897 3,620 111 72 1,090 4Goa 167 35 24 97 10 2Gujarat 8,108 2,821 334 748 4,191 15Haryana 4,108 234 54 162 3,655 4Himachal Pradesh 2,315 579 275 634 825 3Jammu & Kashmir 2,461 629 476 251 1,087 17Jharkhand 5,476 3,830 54 53 1535 4Karnataka 9,560 3,356 1,418 1,904 2,845 38Kerala 5,258 901 585 2,237 1,432 73Madhya Pradesh 12866 8,009 418 698 3,710 30Maharashtra 15,797 6,424 683 2,069 6,416 104Manipur 394 359 2 1 28 3Meghalaya 531 396 9 20 102 5Mizoram 119 63 0.1 0.3 54 2Nagaland 343 296 1 1 43 1Orissa 10,048 6,037 156 516 3,308 32Punjab 4,326 296 40 42 3,938 10Rajasthan 12,064 3,583 875 4,775 2,789 43Sikkim 105 65 6 4 29 2Tamil Nadu 10,930 3,799 388 1,798 4,857 89Tripura 725 619 3 4 99 2
33,196 10,305 328 518 21,280 7642,245 198 402 780 862 4
West Bengal 16,415 9,945 64 71 6,275 60A & N Islands 76 45 0.4 1 29 1Chandigarh 8 0.1 0.02 0.2 8 0.007D & N. Haveli 41 24 0.1 0.1 16 0.04Daman & Diu 17 1 1 8 8 0.05NCT of Delhi 101 5 2 4 90 0.2Lakshadweep 4 1 1 1 2 0.003Puducherry 110 29 3 11 66 1
INDIA 2,06,564 87,642 7,752 20,934 88,587 1,648Source:
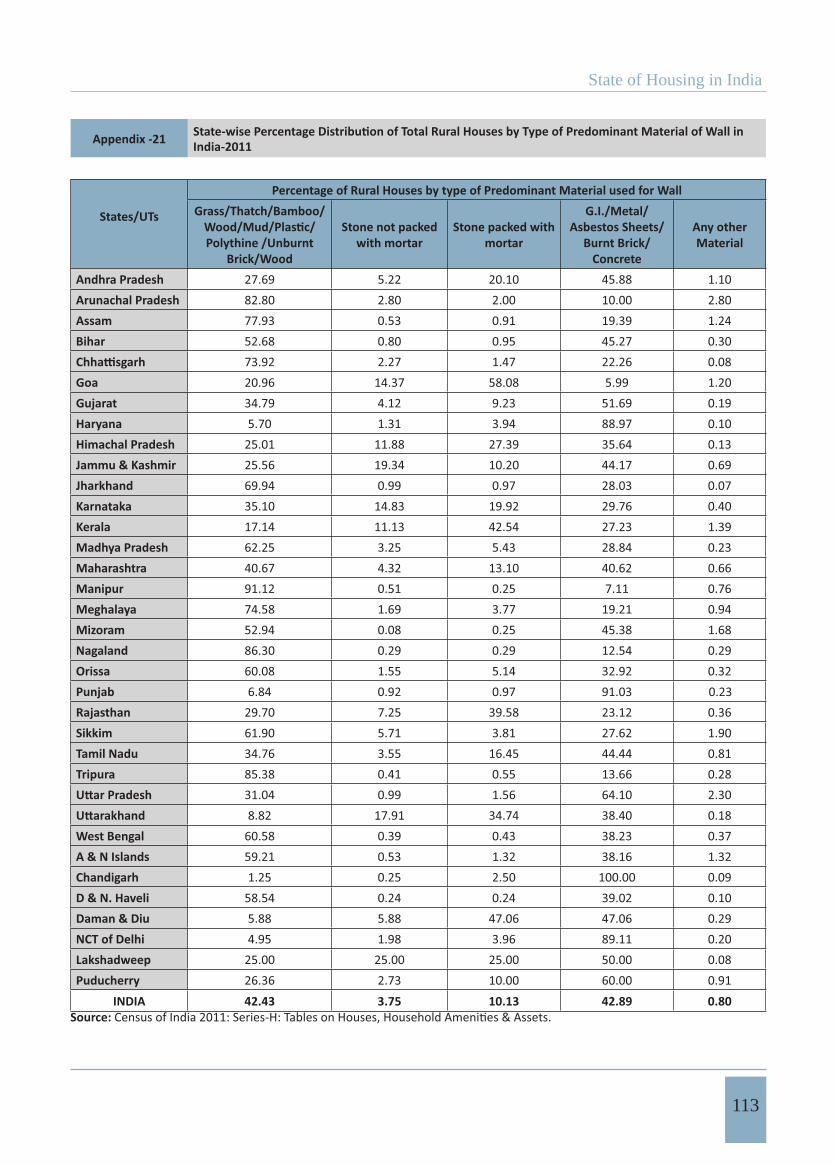
State of Housing in India
113
Appendix -21 India-2011
States/UTs
Percentage of Rural Houses by type of Predominant Material used for WallGrass/Thatch/Bamboo/
Polythine /Unburnt Brick/Wood
Stone not packed with mortar
Stone packed with mortar
G.I./Metal/Asbestos Sheets/
Burnt Brick/Concrete
Any other Material
Andhra Pradesh 27.69 5.22 20.10 45.88 1.10Arunachal Pradesh 82.80 2.80 2.00 10.00 2.80Assam 77.93 0.53 0.91 19.39 1.24Bihar 52.68 0.80 0.95 45.27 0.30
73.92 2.27 1.47 22.26 0.08Goa 20.96 14.37 58.08 5.99 1.20Gujarat 34.79 4.12 9.23 51.69 0.19Haryana 5.70 1.31 3.94 88.97 0.10Himachal Pradesh 25.01 11.88 27.39 35.64 0.13Jammu & Kashmir 25.56 19.34 10.20 44.17 0.69Jharkhand 69.94 0.99 0.97 28.03 0.07Karnataka 35.10 14.83 19.92 29.76 0.40Kerala 17.14 11.13 42.54 27.23 1.39Madhya Pradesh 62.25 3.25 5.43 28.84 0.23Maharashtra 40.67 4.32 13.10 40.62 0.66Manipur 91.12 0.51 0.25 7.11 0.76Meghalaya 74.58 1.69 3.77 19.21 0.94Mizoram 52.94 0.08 0.25 45.38 1.68Nagaland 86.30 0.29 0.29 12.54 0.29Orissa 60.08 1.55 5.14 32.92 0.32Punjab 6.84 0.92 0.97 91.03 0.23Rajasthan 29.70 7.25 39.58 23.12 0.36Sikkim 61.90 5.71 3.81 27.62 1.90Tamil Nadu 34.76 3.55 16.45 44.44 0.81Tripura 85.38 0.41 0.55 13.66 0.28
31.04 0.99 1.56 64.10 2.308.82 17.91 34.74 38.40 0.18
West Bengal 60.58 0.39 0.43 38.23 0.37A & N Islands 59.21 0.53 1.32 38.16 1.32Chandigarh 1.25 0.25 2.50 100.00 0.09D & N. Haveli 58.54 0.24 0.24 39.02 0.10Daman & Diu 5.88 5.88 47.06 47.06 0.29NCT of Delhi 4.95 1.98 3.96 89.11 0.20Lakshadweep 25.00 25.00 25.00 50.00 0.08Puducherry 26.36 2.73 10.00 60.00 0.91
INDIA 42.43 3.75 10.13 42.89 0.80Source:
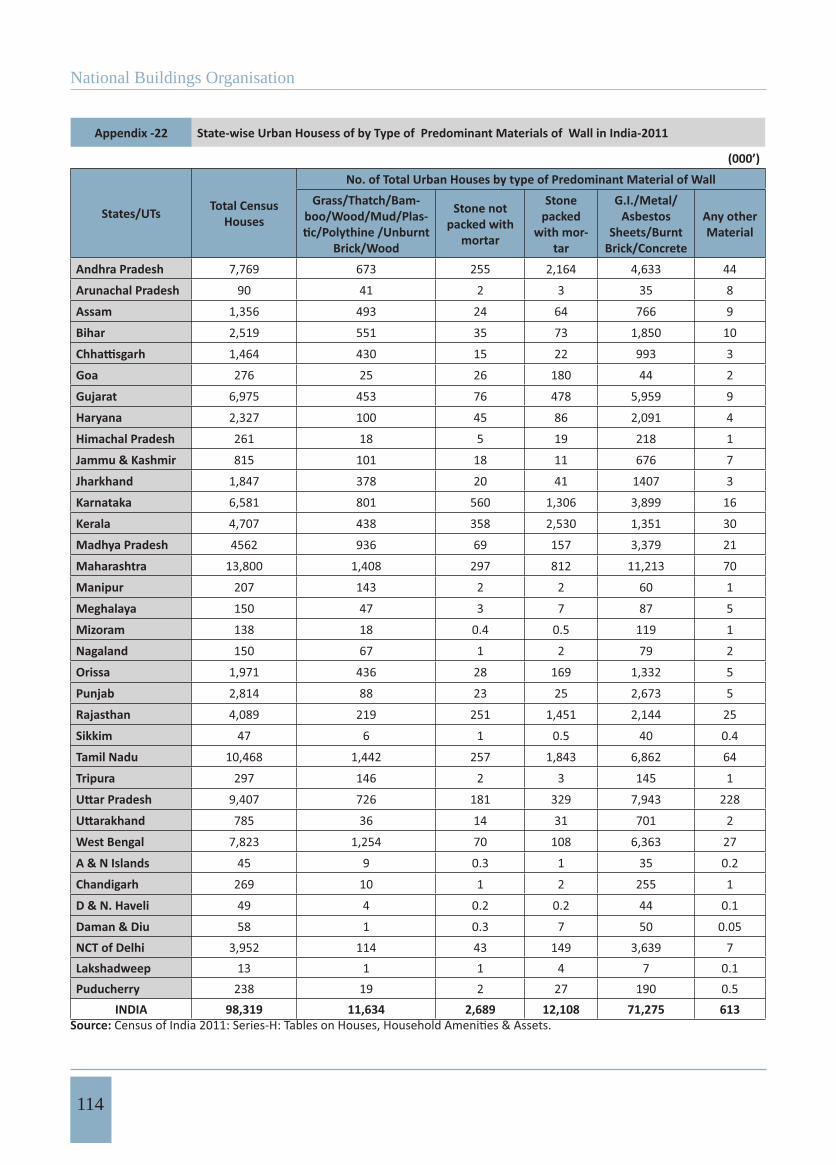
National Buildings Organisation
114
Appendix -22 State-wise Urban Housess of by Type of Predominant Materials of Wall in India-2011
(000’)
States/UTs Total CensusHouses
No. of Total Urban Houses by type of Predominant Material of WallGrass/Thatch/Bam-
boo/Wood/Mud/Plas-
Brick/Wood
Stone not packed with
mortar
Stone packed
with mor-tar
G.I./Metal/Asbestos
Sheets/Burnt Brick/Concrete
Any other Material
Andhra Pradesh 7,769 673 255 2,164 4,633 44
Arunachal Pradesh 90 41 2 3 35 8
Assam 1,356 493 24 64 766 9
Bihar 2,519 551 35 73 1,850 10
1,464 430 15 22 993 3
Goa 276 25 26 180 44 2
Gujarat 6,975 453 76 478 5,959 9
Haryana 2,327 100 45 86 2,091 4
Himachal Pradesh 261 18 5 19 218 1
Jammu & Kashmir 815 101 18 11 676 7
Jharkhand 1,847 378 20 41 1407 3
Karnataka 6,581 801 560 1,306 3,899 16
Kerala 4,707 438 358 2,530 1,351 30
Madhya Pradesh 4562 936 69 157 3,379 21
Maharashtra 13,800 1,408 297 812 11,213 70
Manipur 207 143 2 2 60 1
Meghalaya 150 47 3 7 87 5
Mizoram 138 18 0.4 0.5 119 1
Nagaland 150 67 1 2 79 2
Orissa 1,971 436 28 169 1,332 5
Punjab 2,814 88 23 25 2,673 5
Rajasthan 4,089 219 251 1,451 2,144 25
Sikkim 47 6 1 0.5 40 0.4
Tamil Nadu 10,468 1,442 257 1,843 6,862 64
Tripura 297 146 2 3 145 1
9,407 726 181 329 7,943 228
785 36 14 31 701 2
West Bengal 7,823 1,254 70 108 6,363 27
A & N Islands 45 9 0.3 1 35 0.2
Chandigarh 269 10 1 2 255 1
D & N. Haveli 49 4 0.2 0.2 44 0.1
Daman & Diu 58 1 0.3 7 50 0.05NCT of Delhi 3,952 114 43 149 3,639 7Lakshadweep 13 1 1 4 7 0.1Puducherry 238 19 2 27 190 0.5
INDIA 98,319 11,634 2,689 12,108 71,275 613Source:

State of Housing in India
115
Appendix -23 2011
States/Uts
Percentage of Urban Houses by type of Predominant Material used for Wall
Grass/Thatch/ Bamboo/
Polythine/ Unburnt Brick/Wood
Stone not packed with
mortar
Stone packed with mortar
G.I./Metal/Asbestos Sheets/
Burnt Brick/ Concrete
Any other Material
Andhra Pradesh 8.66 3.28 27.85 59.63 0.57Arunachal Pradesh 45.56 2.22 3.33 38.89 8.89Assam 36.36 1.77 4.72 56.49 0.66Bihar 21.87 1.39 2.90 73.44 0.40
29.37 1.02 1.50 67.83 0.20Goa 9.06 9.42 65.22 15.94 0.72Gujarat 6.49 1.09 6.85 85.43 0.13Haryana 4.30 1.93 3.70 89.86 0.17Himachal Pradesh 6.90 1.92 7.28 83.52 0.38Jammu & Kashmir 12.39 2.21 1.35 82.94 0.86Jharkhand 20.47 1.08 2.22 76.18 0.16Karnataka 12.17 8.51 19.85 59.25 0.24Kerala 9.31 7.61 53.75 28.70 0.64Madhya Pradesh 20.52 1.51 3.44 74.07 0.46Maharashtra 10.20 2.15 5.88 81.25 0.51Manipur 69.08 0.97 0.97 28.99 0.48Meghalaya 31.33 2.00 4.67 58.00 3.33Mizoram 13.04 0.29 0.36 86.23 0.72Nagaland 44.67 0.67 1.33 52.67 1.33Orissa 22.12 1.42 8.57 67.58 0.25Punjab 3.13 0.82 0.89 94.99 0.18Rajasthan 5.36 6.14 35.49 52.43 0.61Sikkim 12.77 2.13 1.06 85.11 0.85Tamil Nadu 13.78 2.46 17.61 65.55 0.61Tripura 49.16 0.67 1.01 48.82 0.34
7.72 1.92 3.50 84.44 2.424.59 1.78 3.95 89.30 0.25
West Bengal 16.03 0.89 1.38 81.34 0.35A & N Islands 20.00 0.67 2.22 77.78 0.44Chandigarh 3.72 0.37 0.74 94.80 0.37D & N. Haveli 8.16 0.41 0.41 89.80 0.20Daman & Diu 1.72 0.52 12.07 86.21 0.09NCT of Delhi 2.88 1.09 3.77 92.08 0.18Lakshadweep 7.69 7.69 30.77 53.85 0.77Puducherry 7.98 0.84 11.34 79.83 0.21
INDIA 11.83 2.73 12.32 72.49 0.62Source

National Buildings Organisation
116
Appendix - 24 State-wise Total Houses by Type of Predominant Material of Floor in India-2011
(‘000’)
State/UTs
No. of Total Houses by Type of Predomiaent Material of Floor
Total Census Houses
Mud/Wood/Bamboo
Burnt Bricks/Stone/Cement Mosaic/Floor/Tiles Any other
Material
Andhra Pradesh 23636 5403 16593 1427 213
Arunachal Pradesh 340 233 105 1 1
Assam 8757 6929 1739 83 6
Bihar 22783 18063 4554 141 24
6361 4464 1704 189 4
Goa 443 73 180 187 4
Gujarat 15083 3942 5633 5460 47
Haryana 6435 1885 4223 306 20
Himachal Pradesh 2576 1231 1242 98 6
Jammu & Kashmir 3276 1800 1423 46 7
Jharkhand 7324 4793 2426 101 4
Karnataka 16142 3622 9424 3026 70
Kerala 9935 946 6812 2017 160
Madhya Pradesh 17427 11680 4492 1229 25
Maharashtra 29596 10275 7929 11035 358
Manipur 601 478 117 6 0.4
Meghalaya 681 440 235 4 1
Mizoram 257 179 76 2 0.4
Nagaland 492 340 149 4 0.4
Orissa 12019 7367 4469 167 16
Punjab 7140 1806 5110 205 19
Rajasthan 16153 6373 8878 834 69
Sikkim 152 58 91 3 0.1
Tamil Nadu 21398 3602 13950 3540 308
Tripura 1023 762 254 6 1
42602 29152 12718 689 43
3030 1341 1579 103 6
West Bengal 24238 13803 9864 547 25
A & N Islands 122 36 78 8 0.2
Chandigarh 277 13 226 36 3
D & N. Haveli 90 31 33 26 0.3
Daman & Diu 75 3 45 27 0.1
NCT of Delhi 4053 104 3312 620 17
Lakshadweep 18 2 12 3 0.07
Puducherry 349 36 217 94 3
INDIA 98,319 11742 60818 24836 924Source:
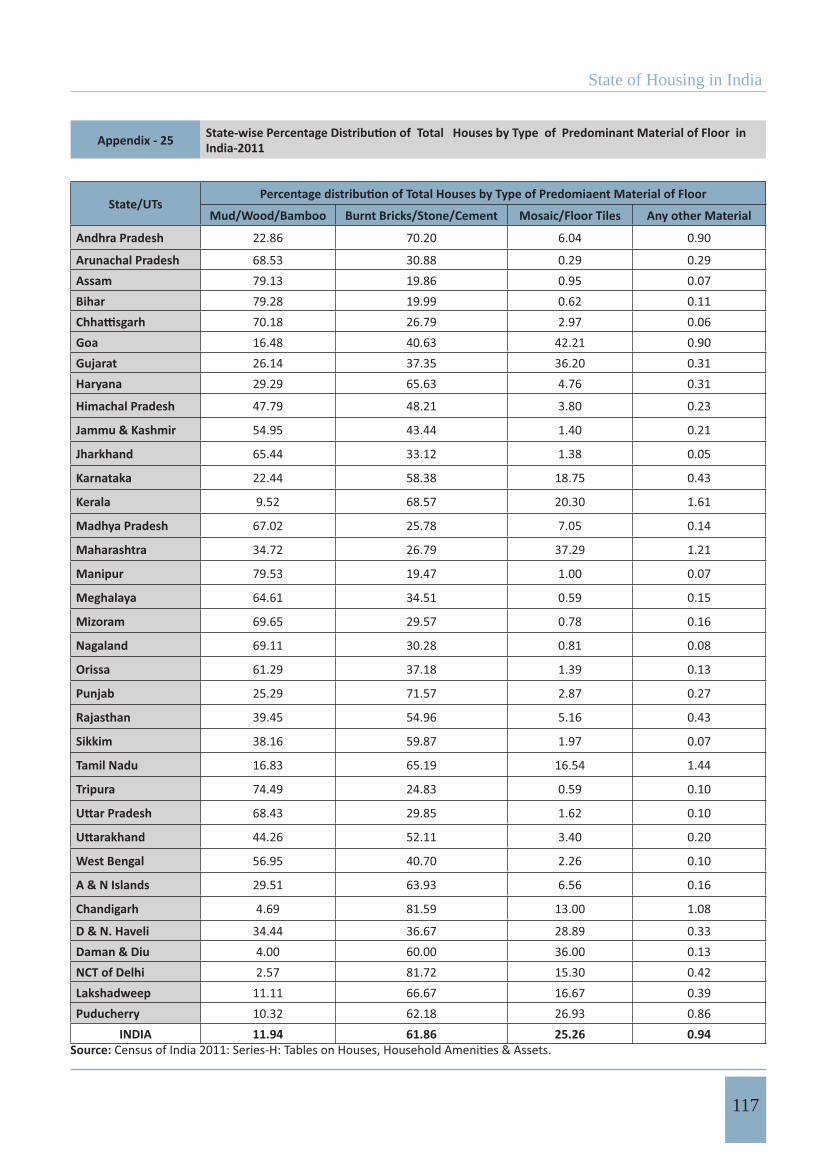
State of Housing in India
117
Appendix - 25 India-2011
State/UTsMud/Wood/Bamboo Burnt Bricks/Stone/Cement Mosaic/Floor Tiles Any other Material
Andhra Pradesh 22.86 70.20 6.04 0.90
Arunachal Pradesh 68.53 30.88 0.29 0.29Assam 79.13 19.86 0.95 0.07Bihar 79.28 19.99 0.62 0.11
70.18 26.79 2.97 0.06Goa 16.48 40.63 42.21 0.90Gujarat 26.14 37.35 36.20 0.31Haryana 29.29 65.63 4.76 0.31
Himachal Pradesh 47.79 48.21 3.80 0.23
Jammu & Kashmir 54.95 43.44 1.40 0.21
Jharkhand 65.44 33.12 1.38 0.05
Karnataka 22.44 58.38 18.75 0.43
Kerala 9.52 68.57 20.30 1.61
Madhya Pradesh 67.02 25.78 7.05 0.14
Maharashtra 34.72 26.79 37.29 1.21
Manipur 79.53 19.47 1.00 0.07
Meghalaya 64.61 34.51 0.59 0.15
Mizoram 69.65 29.57 0.78 0.16
Nagaland 69.11 30.28 0.81 0.08
Orissa 61.29 37.18 1.39 0.13
Punjab 25.29 71.57 2.87 0.27
Rajasthan 39.45 54.96 5.16 0.43
Sikkim 38.16 59.87 1.97 0.07
Tamil Nadu 16.83 65.19 16.54 1.44
Tripura 74.49 24.83 0.59 0.10
68.43 29.85 1.62 0.10
44.26 52.11 3.40 0.20
West Bengal 56.95 40.70 2.26 0.10
A & N Islands 29.51 63.93 6.56 0.16
Chandigarh 4.69 81.59 13.00 1.08
D & N. Haveli 34.44 36.67 28.89 0.33Daman & Diu 4.00 60.00 36.00 0.13NCT of Delhi 2.57 81.72 15.30 0.42Lakshadweep 11.11 66.67 16.67 0.39Puducherry 10.32 62.18 26.93 0.86
INDIA 11.94 61.86 25.26 0.94Source:
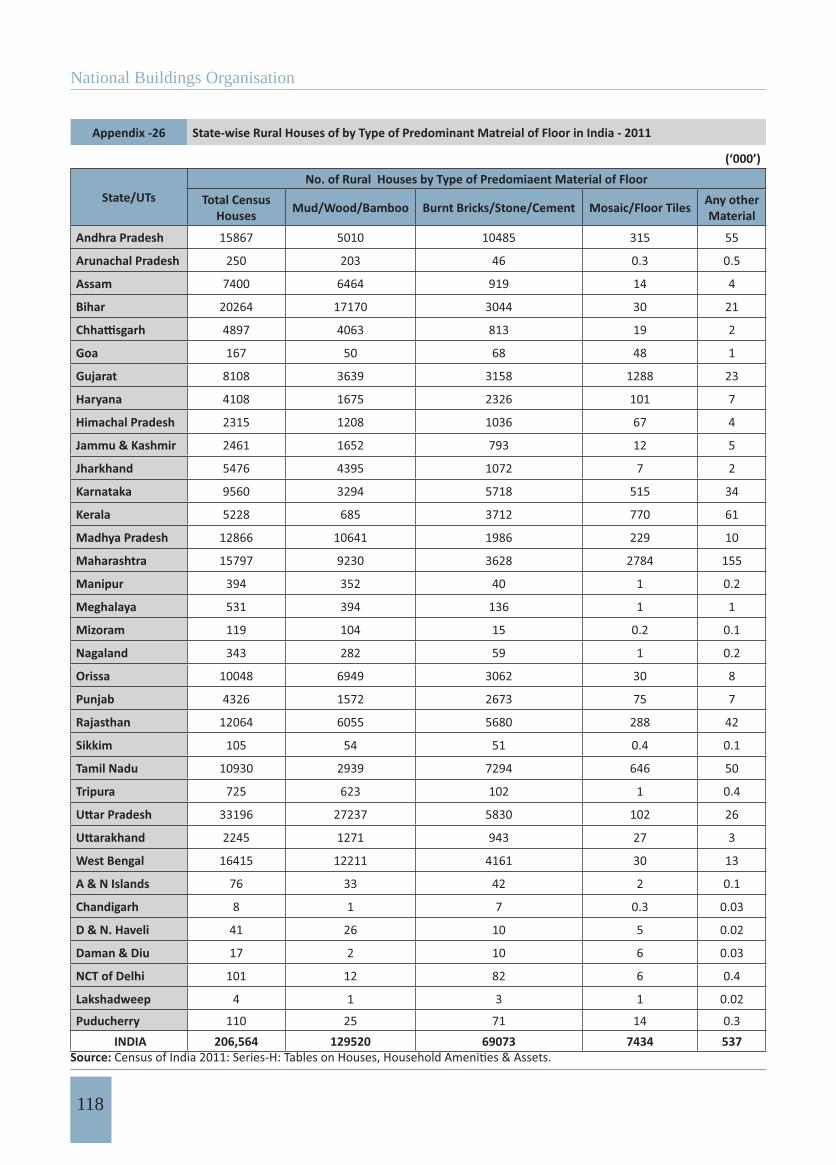
National Buildings Organisation
118
Appendix -26 State-wise Rural Houses of by Type of Predominant Matreial of Floor in India - 2011
(‘000’)
State/UTsNo. of Rural Houses by Type of Predomiaent Material of Floor
Total Census Houses Mud/Wood/Bamboo Burnt Bricks/Stone/Cement Mosaic/Floor Tiles Any other
Material
Andhra Pradesh 15867 5010 10485 315 55
Arunachal Pradesh 250 203 46 0.3 0.5
Assam 7400 6464 919 14 4
Bihar 20264 17170 3044 30 21
4897 4063 813 19 2
Goa 167 50 68 48 1
Gujarat 8108 3639 3158 1288 23
Haryana 4108 1675 2326 101 7
Himachal Pradesh 2315 1208 1036 67 4
Jammu & Kashmir 2461 1652 793 12 5
Jharkhand 5476 4395 1072 7 2
Karnataka 9560 3294 5718 515 34
Kerala 5228 685 3712 770 61
Madhya Pradesh 12866 10641 1986 229 10
Maharashtra 15797 9230 3628 2784 155
Manipur 394 352 40 1 0.2
Meghalaya 531 394 136 1 1
Mizoram 119 104 15 0.2 0.1
Nagaland 343 282 59 1 0.2
Orissa 10048 6949 3062 30 8
Punjab 4326 1572 2673 75 7
Rajasthan 12064 6055 5680 288 42
Sikkim 105 54 51 0.4 0.1
Tamil Nadu 10930 2939 7294 646 50
Tripura 725 623 102 1 0.4
33196 27237 5830 102 26
2245 1271 943 27 3
West Bengal 16415 12211 4161 30 13
A & N Islands 76 33 42 2 0.1
Chandigarh 8 1 7 0.3 0.03
D & N. Haveli 41 26 10 5 0.02
Daman & Diu 17 2 10 6 0.03
NCT of Delhi 101 12 82 6 0.4
Lakshadweep 4 1 3 1 0.02
Puducherry 110 25 71 14 0.3 INDIA 206,564 129520 69073 7434 537
Source:
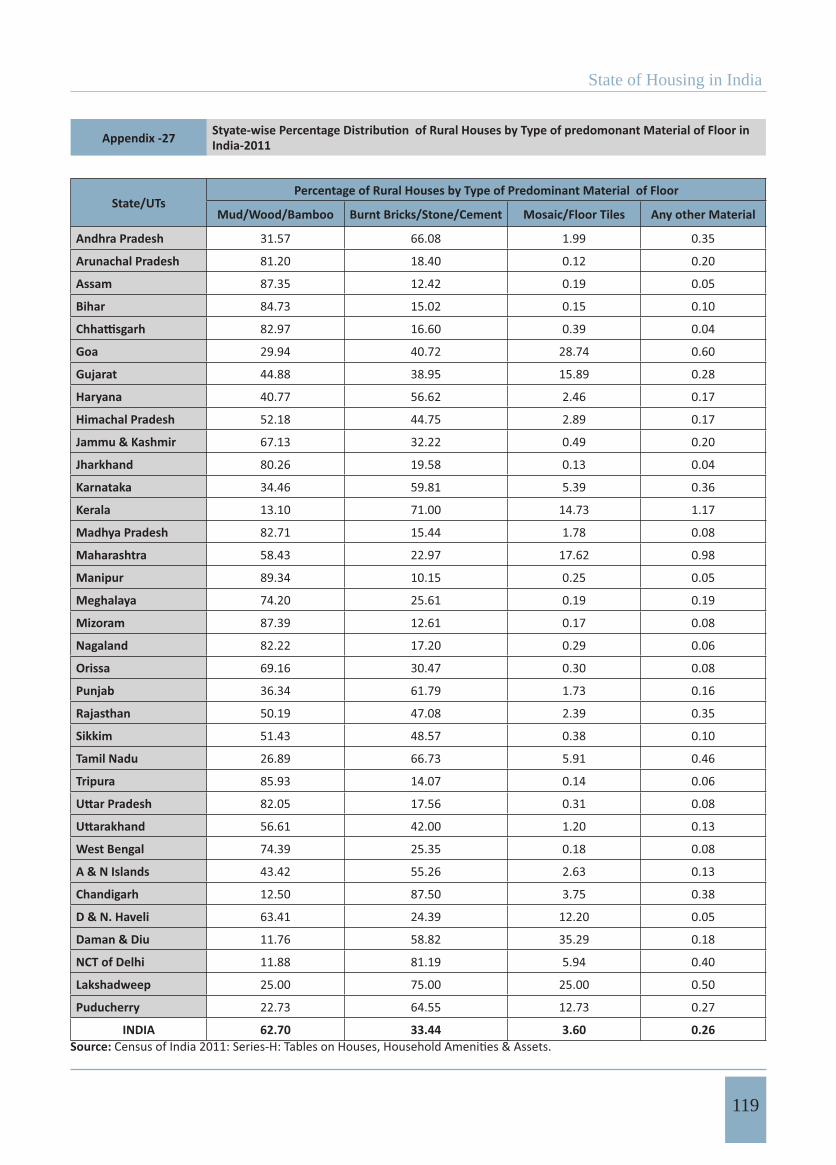
State of Housing in India
119
Appendix -27 India-2011
State/UTsPercentage of Rural Houses by Type of Predominant Material of Floor
Mud/Wood/Bamboo Burnt Bricks/Stone/Cement Mosaic/Floor Tiles Any other Material
Andhra Pradesh 31.57 66.08 1.99 0.35
Arunachal Pradesh 81.20 18.40 0.12 0.20
Assam 87.35 12.42 0.19 0.05
Bihar 84.73 15.02 0.15 0.10
82.97 16.60 0.39 0.04
Goa 29.94 40.72 28.74 0.60
Gujarat 44.88 38.95 15.89 0.28
Haryana 40.77 56.62 2.46 0.17
Himachal Pradesh 52.18 44.75 2.89 0.17
Jammu & Kashmir 67.13 32.22 0.49 0.20
Jharkhand 80.26 19.58 0.13 0.04
Karnataka 34.46 59.81 5.39 0.36
Kerala 13.10 71.00 14.73 1.17
Madhya Pradesh 82.71 15.44 1.78 0.08
Maharashtra 58.43 22.97 17.62 0.98
Manipur 89.34 10.15 0.25 0.05
Meghalaya 74.20 25.61 0.19 0.19
Mizoram 87.39 12.61 0.17 0.08
Nagaland 82.22 17.20 0.29 0.06
Orissa 69.16 30.47 0.30 0.08
Punjab 36.34 61.79 1.73 0.16
Rajasthan 50.19 47.08 2.39 0.35
Sikkim 51.43 48.57 0.38 0.10
Tamil Nadu 26.89 66.73 5.91 0.46
Tripura 85.93 14.07 0.14 0.06
82.05 17.56 0.31 0.08
56.61 42.00 1.20 0.13
West Bengal 74.39 25.35 0.18 0.08
A & N Islands 43.42 55.26 2.63 0.13
Chandigarh 12.50 87.50 3.75 0.38
D & N. Haveli 63.41 24.39 12.20 0.05
Daman & Diu 11.76 58.82 35.29 0.18
NCT of Delhi 11.88 81.19 5.94 0.40
Lakshadweep 25.00 75.00 25.00 0.50
Puducherry 22.73 64.55 12.73 0.27
INDIA 62.70 33.44 3.60 0.26Source:
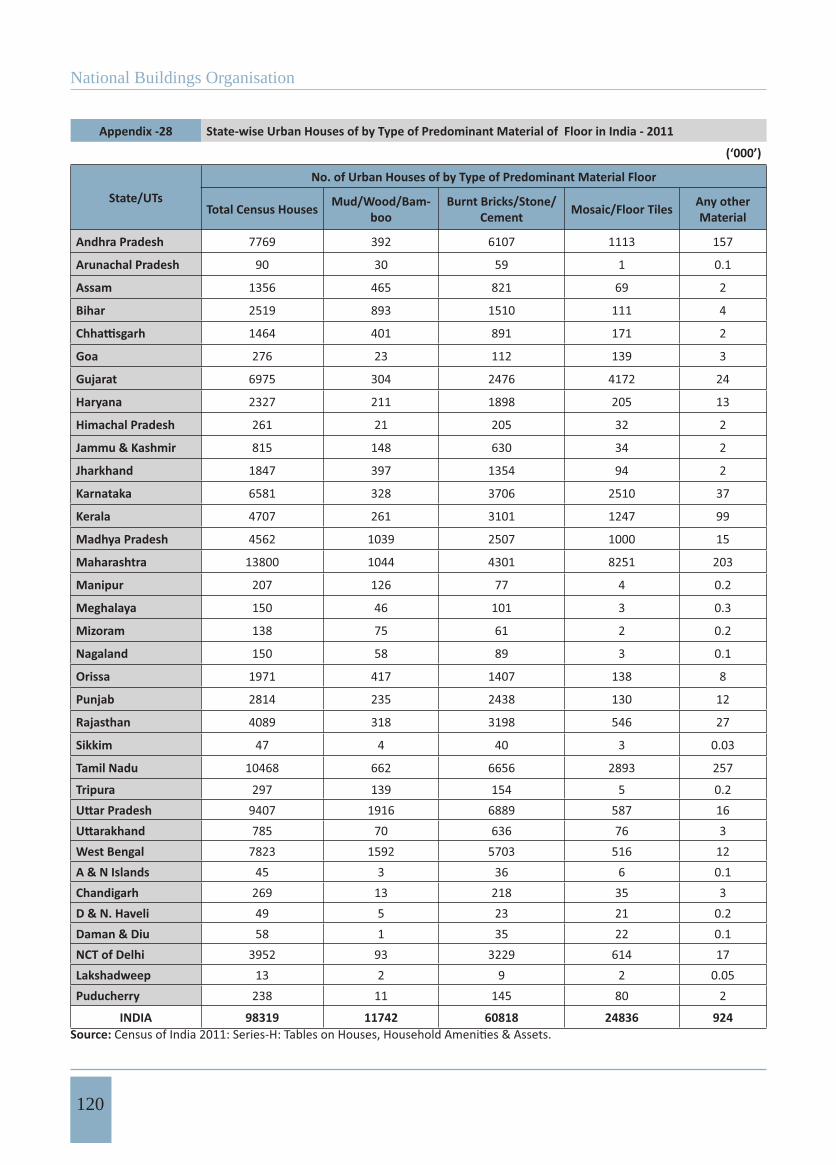
National Buildings Organisation
120
Appendix -28 State-wise Urban Houses of by Type of Predominant Material of Floor in India - 2011
(‘000’)
State/UTsNo. of Urban Houses of by Type of Predominant Material Floor
Total Census Houses Mud/Wood/Bam-boo
Burnt Bricks/Stone/Cement Mosaic/Floor Tiles Any other
Material
Andhra Pradesh 7769 392 6107 1113 157
Arunachal Pradesh 90 30 59 1 0.1
Assam 1356 465 821 69 2
Bihar 2519 893 1510 111 4
1464 401 891 171 2
Goa 276 23 112 139 3
Gujarat 6975 304 2476 4172 24
Haryana 2327 211 1898 205 13
Himachal Pradesh 261 21 205 32 2
Jammu & Kashmir 815 148 630 34 2
Jharkhand 1847 397 1354 94 2
Karnataka 6581 328 3706 2510 37
Kerala 4707 261 3101 1247 99
Madhya Pradesh 4562 1039 2507 1000 15
Maharashtra 13800 1044 4301 8251 203
Manipur 207 126 77 4 0.2
Meghalaya 150 46 101 3 0.3
Mizoram 138 75 61 2 0.2
Nagaland 150 58 89 3 0.1
Orissa 1971 417 1407 138 8
Punjab 2814 235 2438 130 12
Rajasthan 4089 318 3198 546 27
Sikkim 47 4 40 3 0.03
Tamil Nadu 10468 662 6656 2893 257
Tripura 297 139 154 5 0.29407 1916 6889 587 16785 70 636 76 3
West Bengal 7823 1592 5703 516 12A & N Islands 45 3 36 6 0.1Chandigarh 269 13 218 35 3D & N. Haveli 49 5 23 21 0.2Daman & Diu 58 1 35 22 0.1NCT of Delhi 3952 93 3229 614 17Lakshadweep 13 2 9 2 0.05Puducherry 238 11 145 80 2
INDIA 98319 11742 60818 24836 924Source:
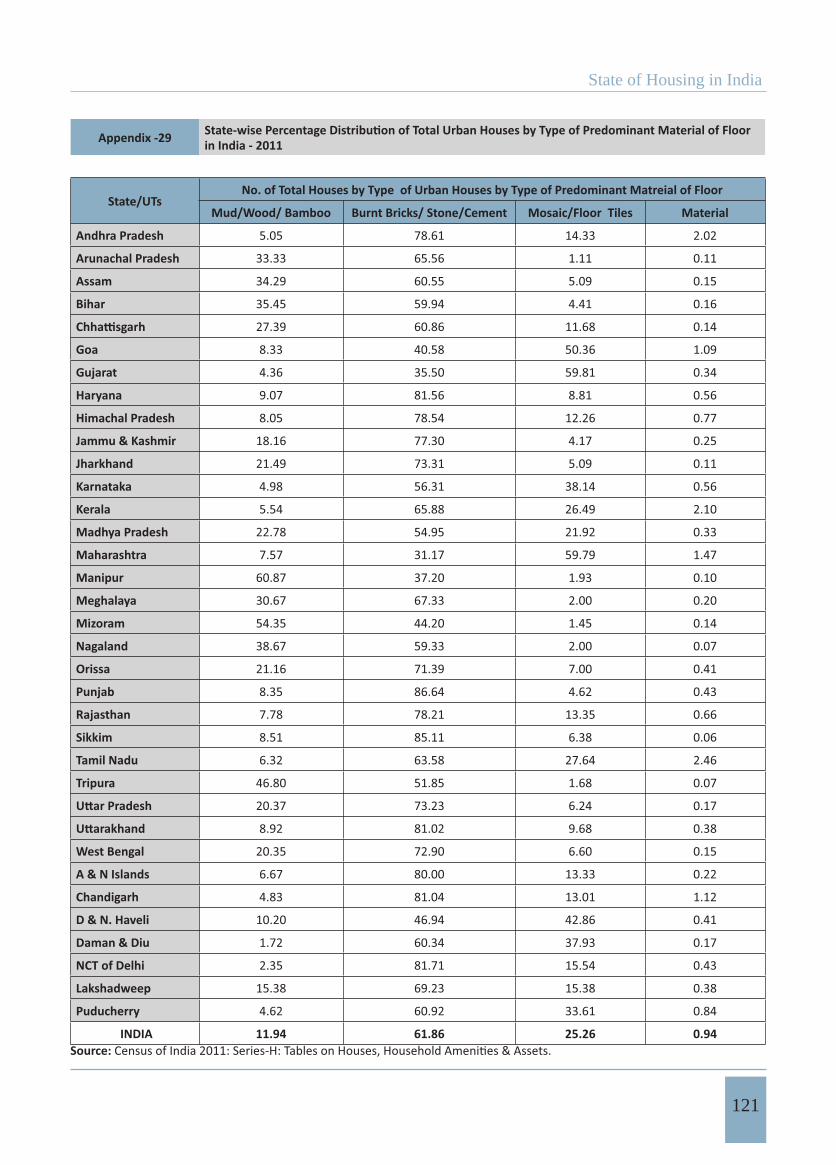
State of Housing in India
121
Appendix -29 in India - 2011
State/UTsNo. of Total Houses by Type of Urban Houses by Type of Predominant Matreial of Floor
Mud/Wood/ Bamboo Burnt Bricks/ Stone/Cement Mosaic/Floor Tiles Material
Andhra Pradesh 5.05 78.61 14.33 2.02
Arunachal Pradesh 33.33 65.56 1.11 0.11
Assam 34.29 60.55 5.09 0.15
Bihar 35.45 59.94 4.41 0.16
27.39 60.86 11.68 0.14
Goa 8.33 40.58 50.36 1.09
Gujarat 4.36 35.50 59.81 0.34
Haryana 9.07 81.56 8.81 0.56
Himachal Pradesh 8.05 78.54 12.26 0.77
Jammu & Kashmir 18.16 77.30 4.17 0.25
Jharkhand 21.49 73.31 5.09 0.11
Karnataka 4.98 56.31 38.14 0.56
Kerala 5.54 65.88 26.49 2.10
Madhya Pradesh 22.78 54.95 21.92 0.33
Maharashtra 7.57 31.17 59.79 1.47
Manipur 60.87 37.20 1.93 0.10
Meghalaya 30.67 67.33 2.00 0.20
Mizoram 54.35 44.20 1.45 0.14
Nagaland 38.67 59.33 2.00 0.07
Orissa 21.16 71.39 7.00 0.41
Punjab 8.35 86.64 4.62 0.43
Rajasthan 7.78 78.21 13.35 0.66
Sikkim 8.51 85.11 6.38 0.06
Tamil Nadu 6.32 63.58 27.64 2.46
Tripura 46.80 51.85 1.68 0.07
20.37 73.23 6.24 0.17
8.92 81.02 9.68 0.38
West Bengal 20.35 72.90 6.60 0.15
A & N Islands 6.67 80.00 13.33 0.22
Chandigarh 4.83 81.04 13.01 1.12
D & N. Haveli 10.20 46.94 42.86 0.41
Daman & Diu 1.72 60.34 37.93 0.17
NCT of Delhi 2.35 81.71 15.54 0.43
Lakshadweep 15.38 69.23 15.38 0.38
Puducherry 4.62 60.92 33.61 0.84
INDIA 11.94 61.86 25.26 0.94Source:
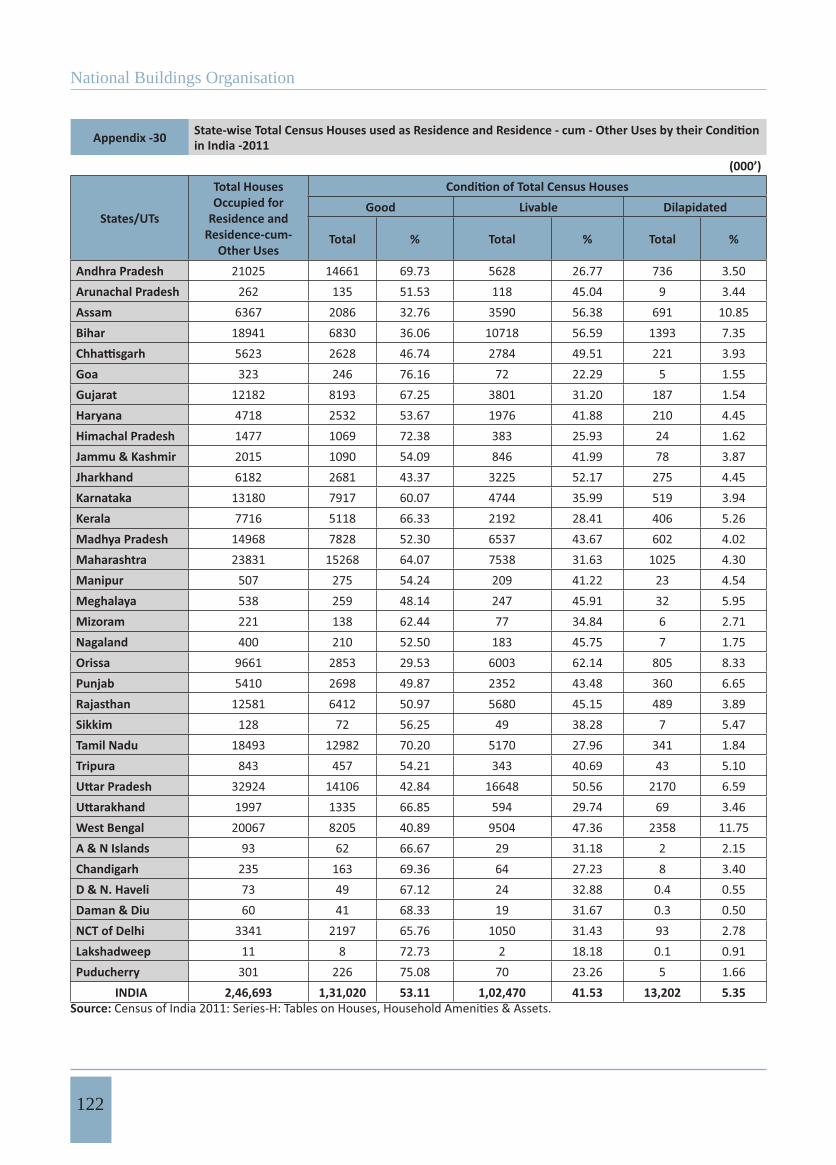
National Buildings Organisation
122
Appendix -30 in India -2011(000’)
States/UTs
Total Houses Occupied for
Residence and Residence-cum-
Other Uses
Good Livable Dilapidated
Total % Total % Total %
Andhra Pradesh 21025 14661 69.73 5628 26.77 736 3.50Arunachal Pradesh 262 135 51.53 118 45.04 9 3.44Assam 6367 2086 32.76 3590 56.38 691 10.85Bihar 18941 6830 36.06 10718 56.59 1393 7.35
5623 2628 46.74 2784 49.51 221 3.93Goa 323 246 76.16 72 22.29 5 1.55Gujarat 12182 8193 67.25 3801 31.20 187 1.54Haryana 4718 2532 53.67 1976 41.88 210 4.45Himachal Pradesh 1477 1069 72.38 383 25.93 24 1.62Jammu & Kashmir 2015 1090 54.09 846 41.99 78 3.87Jharkhand 6182 2681 43.37 3225 52.17 275 4.45Karnataka 13180 7917 60.07 4744 35.99 519 3.94Kerala 7716 5118 66.33 2192 28.41 406 5.26Madhya Pradesh 14968 7828 52.30 6537 43.67 602 4.02Maharashtra 23831 15268 64.07 7538 31.63 1025 4.30Manipur 507 275 54.24 209 41.22 23 4.54Meghalaya 538 259 48.14 247 45.91 32 5.95Mizoram 221 138 62.44 77 34.84 6 2.71Nagaland 400 210 52.50 183 45.75 7 1.75Orissa 9661 2853 29.53 6003 62.14 805 8.33Punjab 5410 2698 49.87 2352 43.48 360 6.65Rajasthan 12581 6412 50.97 5680 45.15 489 3.89Sikkim 128 72 56.25 49 38.28 7 5.47Tamil Nadu 18493 12982 70.20 5170 27.96 341 1.84Tripura 843 457 54.21 343 40.69 43 5.10
32924 14106 42.84 16648 50.56 2170 6.591997 1335 66.85 594 29.74 69 3.46
West Bengal 20067 8205 40.89 9504 47.36 2358 11.75A & N Islands 93 62 66.67 29 31.18 2 2.15Chandigarh 235 163 69.36 64 27.23 8 3.40D & N. Haveli 73 49 67.12 24 32.88 0.4 0.55Daman & Diu 60 41 68.33 19 31.67 0.3 0.50NCT of Delhi 3341 2197 65.76 1050 31.43 93 2.78Lakshadweep 11 8 72.73 2 18.18 0.1 0.91Puducherry 301 226 75.08 70 23.26 5 1.66
INDIA 2,46,693 1,31,020 53.11 1,02,470 41.53 13,202 5.35Source:

State of Housing in India
123
Appendix -31 State-wise Total Census Houses used as Residence and Residence - cum - Other Uses by their
(‘000’)
States/UTs
Total Census OccupiedResidence
Houses
Good Livable Dilapidated
Total % Total % Total %
Andhra Pradesh 20612 14376 69.75 5509 26.73 727 3.53
Arunachal Pradesh 255 132 51.76 115 45.10 8 3.14Assam 6272 2058 32.81 3531 56.30 684 10.91Bihar 18226 6587 36.14 10294 56.48 1345 7.38
5430 2512 46.26 2699 49.71 217 4.00Goa 318 242 76.10 71 22.33 5 1.57Gujarat 11767 7973 67.76 3611 30.69 183 1.56Haryana 4235 2304 54.40 1739 41.06 191 4.51Himachal Pradesh 1448 1051 72.58 374 25.83 24 1.66Jammu & Kashmir 1922 1064 55.36 786 40.89 72 3.75Jharkhand 5808 2540 43.73 3005 51.74 263 4.53Karnataka 12784 7733 60.49 4549 35.58 502 3.93Kerala 7678 5097 66.38 2177 28.35 404 5.26Madhya Pradesh 14106 7414 52.56 6117 43.36 575 4.08Maharashtra 23295 14949 64.17 7337 31.50 1008 4.33Manipur 498 270 54.22 205 41.16 23 4.62Meghalaya 533 256 48.03 245 45.97 32 6.00
Mizoram 218 136 62.39 76 34.86 6 2.75
Nagaland 395 207 52.41 181 45.82 7 1.77
Orissa 9406 2786 29.62 5835 62.03 786 8.36
Punjab 5170 2580 49.90 2241 43.35 349 6.75
Rajasthan 12220 6235 51.02 5506 45.06 478 3.91
Sikkim 124 69 55.65 48 38.71 7 5.65
Tamil Nadu 18127 12748 70.33 5042 27.81 337 1.86
Tripura 830 452 54.46 336 40.48 42 5.06
31152 13360 42.89 15698 50.39 2094 6.72
1904 1278 67.12 560 29.41 66 3.47
West Bengal 19495 7993 41.00 9199 47.19 2302 11.81
A & N Islands 92 61 66.30 29 31.52 2 2.17
Chandigarh 231 161 69.70 62 26.84 8 3.46
D & N. Haveli 72 48 66.67 23 31.94 0.4 0.56
Daman & Diu 60 41 68.33 19 31.67 0.3 0.50
NCT of Delhi 3203 2117 66.09 997 31.13 89 2.78
Lakshadweep 11 8 72.73 2 18.18 0.1 0.91
Puducherry 297 223 75.08 69 23.23 5 1.68
INDIA 238189 127061 53.34 98285 41.26 12,843 5.39Source:
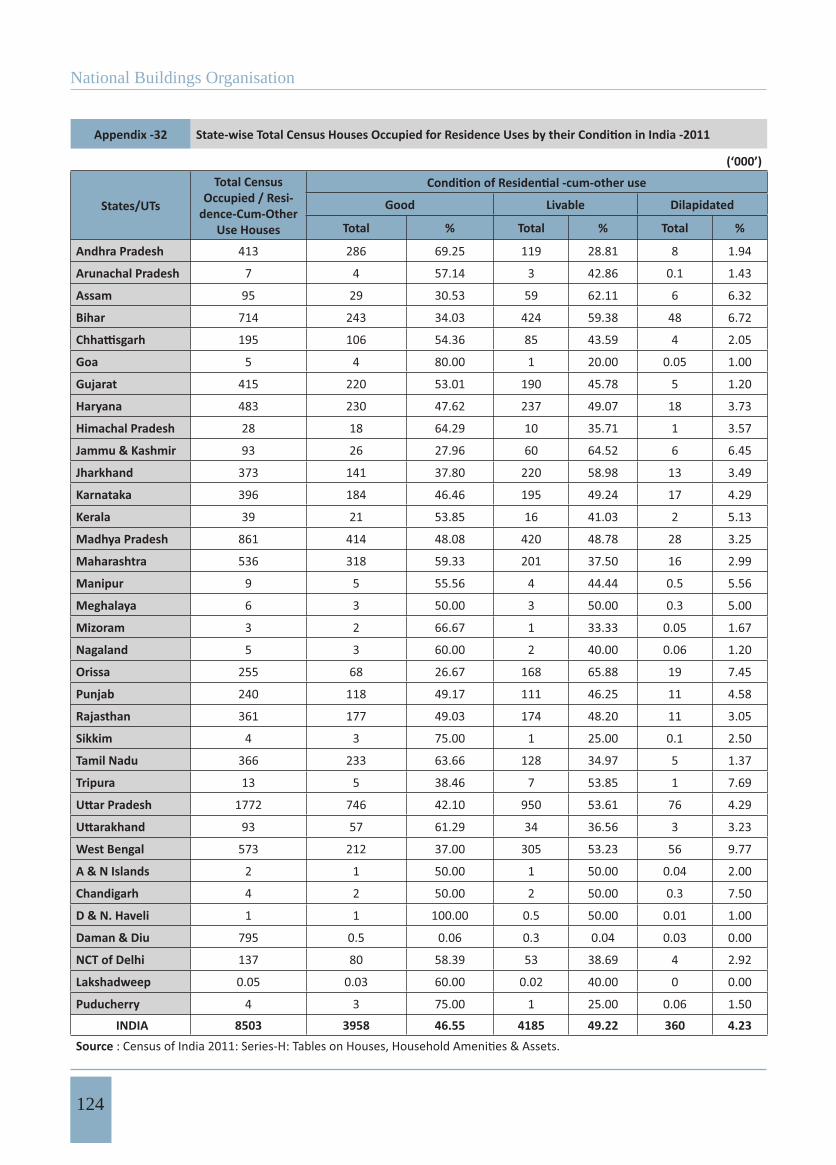
National Buildings Organisation
124
Appendix -32
(‘000’)
States/UTs
Total Census Occupied / Resi-
dence-Cum-OtherUse Houses
Good Livable Dilapidated
Total % Total % Total %
Andhra Pradesh 413 286 69.25 119 28.81 8 1.94
Arunachal Pradesh 7 4 57.14 3 42.86 0.1 1.43
Assam 95 29 30.53 59 62.11 6 6.32
Bihar 714 243 34.03 424 59.38 48 6.72
195 106 54.36 85 43.59 4 2.05
Goa 5 4 80.00 1 20.00 0.05 1.00
Gujarat 415 220 53.01 190 45.78 5 1.20
Haryana 483 230 47.62 237 49.07 18 3.73
Himachal Pradesh 28 18 64.29 10 35.71 1 3.57
Jammu & Kashmir 93 26 27.96 60 64.52 6 6.45
Jharkhand 373 141 37.80 220 58.98 13 3.49
Karnataka 396 184 46.46 195 49.24 17 4.29
Kerala 39 21 53.85 16 41.03 2 5.13
Madhya Pradesh 861 414 48.08 420 48.78 28 3.25
Maharashtra 536 318 59.33 201 37.50 16 2.99
Manipur 9 5 55.56 4 44.44 0.5 5.56
Meghalaya 6 3 50.00 3 50.00 0.3 5.00
Mizoram 3 2 66.67 1 33.33 0.05 1.67
Nagaland 5 3 60.00 2 40.00 0.06 1.20
Orissa 255 68 26.67 168 65.88 19 7.45
Punjab 240 118 49.17 111 46.25 11 4.58
Rajasthan 361 177 49.03 174 48.20 11 3.05
Sikkim 4 3 75.00 1 25.00 0.1 2.50
Tamil Nadu 366 233 63.66 128 34.97 5 1.37
Tripura 13 5 38.46 7 53.85 1 7.69
1772 746 42.10 950 53.61 76 4.29
93 57 61.29 34 36.56 3 3.23
West Bengal 573 212 37.00 305 53.23 56 9.77
A & N Islands 2 1 50.00 1 50.00 0.04 2.00
Chandigarh 4 2 50.00 2 50.00 0.3 7.50
D & N. Haveli 1 1 100.00 0.5 50.00 0.01 1.00
Daman & Diu 795 0.5 0.06 0.3 0.04 0.03 0.00
NCT of Delhi 137 80 58.39 53 38.69 4 2.92
Lakshadweep 0.05 0.03 60.00 0.02 40.00 0 0.00
Puducherry 4 3 75.00 1 25.00 0.06 1.50
INDIA 8503 3958 46.55 4185 49.22 360 4.23Source
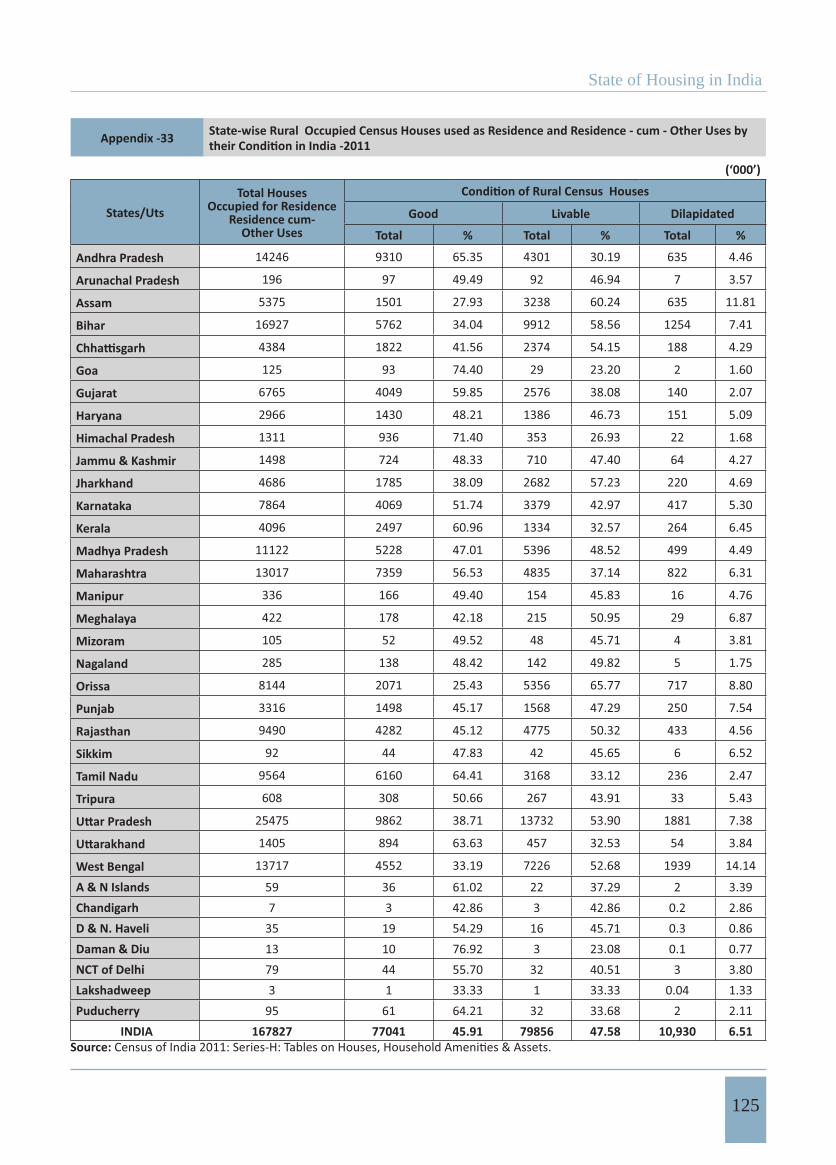
State of Housing in India
125
Appendix -33 State-wise Rural Occupied Census Houses used as Residence and Residence - cum - Other Uses by
(‘000’)
States/UtsTotal Houses
Occupied for Residence Residence cum-
Other UsesGood Livable Dilapidated
Total % Total % Total %
Andhra Pradesh 14246 9310 65.35 4301 30.19 635 4.46
Arunachal Pradesh 196 97 49.49 92 46.94 7 3.57
Assam 5375 1501 27.93 3238 60.24 635 11.81
Bihar 16927 5762 34.04 9912 58.56 1254 7.41
4384 1822 41.56 2374 54.15 188 4.29
Goa 125 93 74.40 29 23.20 2 1.60
Gujarat 6765 4049 59.85 2576 38.08 140 2.07
Haryana 2966 1430 48.21 1386 46.73 151 5.09
Himachal Pradesh 1311 936 71.40 353 26.93 22 1.68
Jammu & Kashmir 1498 724 48.33 710 47.40 64 4.27
Jharkhand 4686 1785 38.09 2682 57.23 220 4.69
Karnataka 7864 4069 51.74 3379 42.97 417 5.30
Kerala 4096 2497 60.96 1334 32.57 264 6.45
Madhya Pradesh 11122 5228 47.01 5396 48.52 499 4.49
Maharashtra 13017 7359 56.53 4835 37.14 822 6.31
Manipur 336 166 49.40 154 45.83 16 4.76
Meghalaya 422 178 42.18 215 50.95 29 6.87
Mizoram 105 52 49.52 48 45.71 4 3.81
Nagaland 285 138 48.42 142 49.82 5 1.75
Orissa 8144 2071 25.43 5356 65.77 717 8.80
Punjab 3316 1498 45.17 1568 47.29 250 7.54
Rajasthan 9490 4282 45.12 4775 50.32 433 4.56
Sikkim 92 44 47.83 42 45.65 6 6.52
Tamil Nadu 9564 6160 64.41 3168 33.12 236 2.47
Tripura 608 308 50.66 267 43.91 33 5.43
25475 9862 38.71 13732 53.90 1881 7.38
1405 894 63.63 457 32.53 54 3.84
West Bengal 13717 4552 33.19 7226 52.68 1939 14.14
A & N Islands 59 36 61.02 22 37.29 2 3.39Chandigarh 7 3 42.86 3 42.86 0.2 2.86D & N. Haveli 35 19 54.29 16 45.71 0.3 0.86Daman & Diu 13 10 76.92 3 23.08 0.1 0.77NCT of Delhi 79 44 55.70 32 40.51 3 3.80Lakshadweep 3 1 33.33 1 33.33 0.04 1.33Puducherry 95 61 64.21 32 33.68 2 2.11
INDIA 167827 77041 45.91 79856 47.58 10,930 6.51Source:
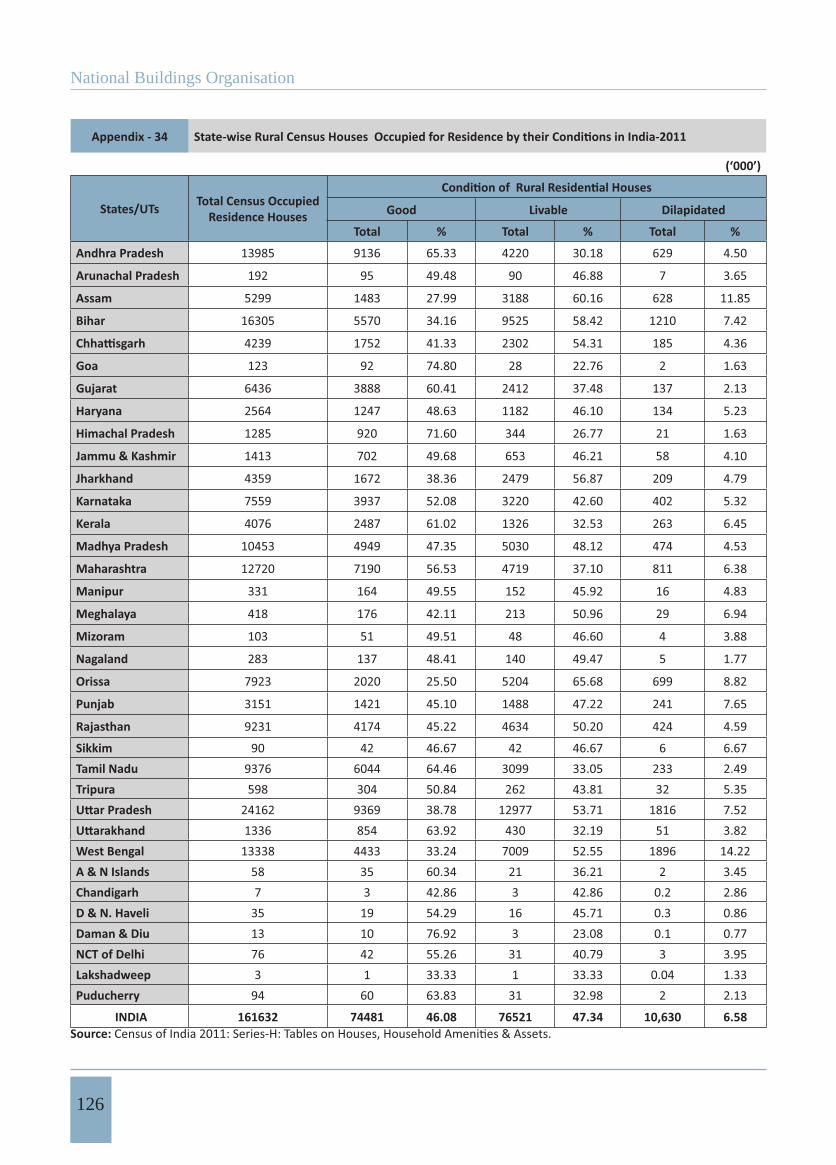
National Buildings Organisation
126
Appendix - 34
(‘000’)
States/UTs Total Census Occupied Residence Houses Good Livable Dilapidated
Total % Total % Total %
Andhra Pradesh 13985 9136 65.33 4220 30.18 629 4.50
Arunachal Pradesh 192 95 49.48 90 46.88 7 3.65
Assam 5299 1483 27.99 3188 60.16 628 11.85
Bihar 16305 5570 34.16 9525 58.42 1210 7.42
4239 1752 41.33 2302 54.31 185 4.36
Goa 123 92 74.80 28 22.76 2 1.63
Gujarat 6436 3888 60.41 2412 37.48 137 2.13
Haryana 2564 1247 48.63 1182 46.10 134 5.23
Himachal Pradesh 1285 920 71.60 344 26.77 21 1.63
Jammu & Kashmir 1413 702 49.68 653 46.21 58 4.10
Jharkhand 4359 1672 38.36 2479 56.87 209 4.79
Karnataka 7559 3937 52.08 3220 42.60 402 5.32
Kerala 4076 2487 61.02 1326 32.53 263 6.45
Madhya Pradesh 10453 4949 47.35 5030 48.12 474 4.53
Maharashtra 12720 7190 56.53 4719 37.10 811 6.38
Manipur 331 164 49.55 152 45.92 16 4.83
Meghalaya 418 176 42.11 213 50.96 29 6.94
Mizoram 103 51 49.51 48 46.60 4 3.88
Nagaland 283 137 48.41 140 49.47 5 1.77
Orissa 7923 2020 25.50 5204 65.68 699 8.82
Punjab 3151 1421 45.10 1488 47.22 241 7.65
Rajasthan 9231 4174 45.22 4634 50.20 424 4.59
Sikkim 90 42 46.67 42 46.67 6 6.67Tamil Nadu 9376 6044 64.46 3099 33.05 233 2.49Tripura 598 304 50.84 262 43.81 32 5.35
24162 9369 38.78 12977 53.71 1816 7.521336 854 63.92 430 32.19 51 3.82
West Bengal 13338 4433 33.24 7009 52.55 1896 14.22A & N Islands 58 35 60.34 21 36.21 2 3.45Chandigarh 7 3 42.86 3 42.86 0.2 2.86D & N. Haveli 35 19 54.29 16 45.71 0.3 0.86Daman & Diu 13 10 76.92 3 23.08 0.1 0.77NCT of Delhi 76 42 55.26 31 40.79 3 3.95Lakshadweep 3 1 33.33 1 33.33 0.04 1.33Puducherry 94 60 63.83 31 32.98 2 2.13
INDIA 161632 74481 46.08 76521 47.34 10,630 6.58Source:
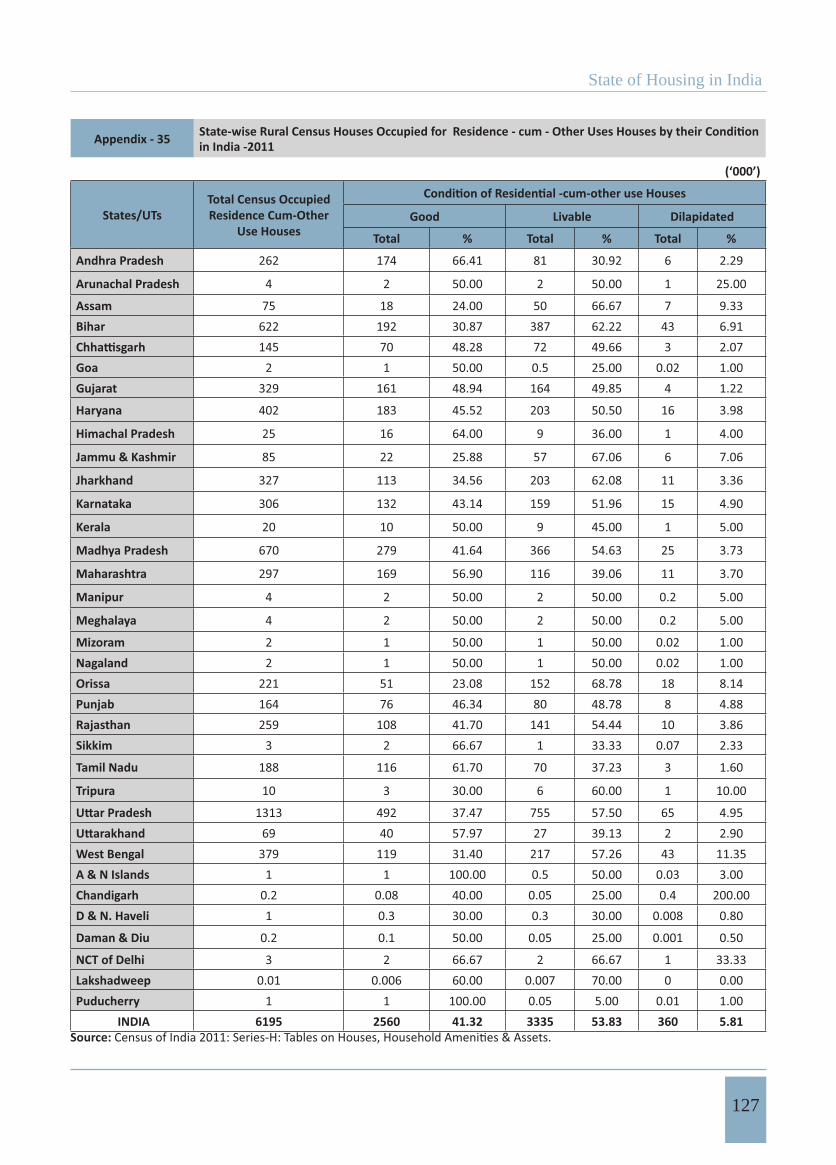
State of Housing in India
127
Appendix - 35 in India -2011
(‘000’)
States/UTsTotal Census Occupied Residence Cum-Other
Use HousesGood Livable Dilapidated
Total % Total % Total %
Andhra Pradesh 262 174 66.41 81 30.92 6 2.29
Arunachal Pradesh 4 2 50.00 2 50.00 1 25.00
Assam 75 18 24.00 50 66.67 7 9.33Bihar 622 192 30.87 387 62.22 43 6.91
145 70 48.28 72 49.66 3 2.07Goa 2 1 50.00 0.5 25.00 0.02 1.00Gujarat 329 161 48.94 164 49.85 4 1.22
Haryana 402 183 45.52 203 50.50 16 3.98
Himachal Pradesh 25 16 64.00 9 36.00 1 4.00
Jammu & Kashmir 85 22 25.88 57 67.06 6 7.06
Jharkhand 327 113 34.56 203 62.08 11 3.36
Karnataka 306 132 43.14 159 51.96 15 4.90
Kerala 20 10 50.00 9 45.00 1 5.00
Madhya Pradesh 670 279 41.64 366 54.63 25 3.73
Maharashtra 297 169 56.90 116 39.06 11 3.70
Manipur 4 2 50.00 2 50.00 0.2 5.00
Meghalaya 4 2 50.00 2 50.00 0.2 5.00
Mizoram 2 1 50.00 1 50.00 0.02 1.00Nagaland 2 1 50.00 1 50.00 0.02 1.00Orissa 221 51 23.08 152 68.78 18 8.14Punjab 164 76 46.34 80 48.78 8 4.88Rajasthan 259 108 41.70 141 54.44 10 3.86Sikkim 3 2 66.67 1 33.33 0.07 2.33
Tamil Nadu 188 116 61.70 70 37.23 3 1.60
Tripura 10 3 30.00 6 60.00 1 10.00
1313 492 37.47 755 57.50 65 4.9569 40 57.97 27 39.13 2 2.90
West Bengal 379 119 31.40 217 57.26 43 11.35A & N Islands 1 1 100.00 0.5 50.00 0.03 3.00Chandigarh 0.2 0.08 40.00 0.05 25.00 0.4 200.00D & N. Haveli 1 0.3 30.00 0.3 30.00 0.008 0.80
Daman & Diu 0.2 0.1 50.00 0.05 25.00 0.001 0.50
NCT of Delhi 3 2 66.67 2 66.67 1 33.33Lakshadweep 0.01 0.006 60.00 0.007 70.00 0 0.00Puducherry 1 1 100.00 0.05 5.00 0.01 1.00
INDIA 6195 2560 41.32 3335 53.83 360 5.81Source:
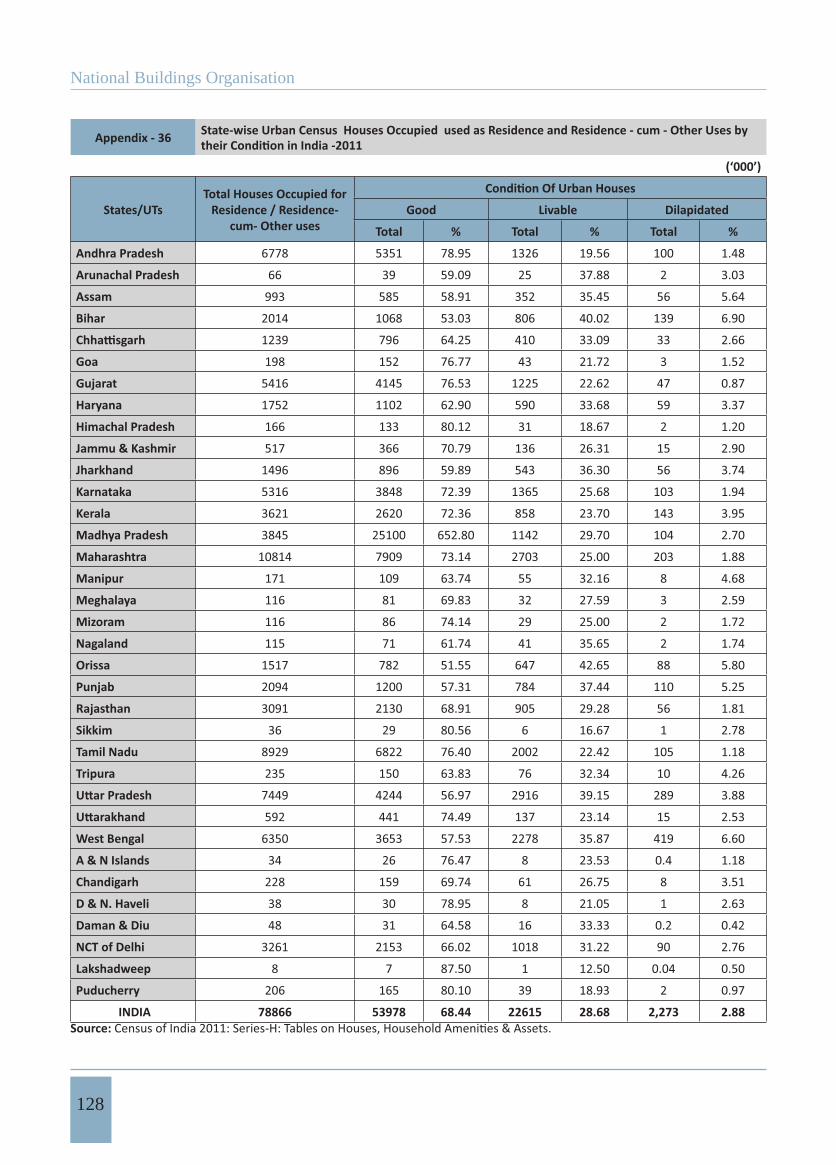
National Buildings Organisation
128
Appendix - 36 State-wise Urban Census Houses Occupied used as Residence and Residence - cum - Other Uses by
(‘000’)
States/UTsTotal Houses Occupied for
Residence / Residence-cum- Other uses
Good Livable Dilapidated
Total % Total % Total %
Andhra Pradesh 6778 5351 78.95 1326 19.56 100 1.48
Arunachal Pradesh 66 39 59.09 25 37.88 2 3.03
Assam 993 585 58.91 352 35.45 56 5.64
Bihar 2014 1068 53.03 806 40.02 139 6.90
1239 796 64.25 410 33.09 33 2.66
Goa 198 152 76.77 43 21.72 3 1.52
Gujarat 5416 4145 76.53 1225 22.62 47 0.87
Haryana 1752 1102 62.90 590 33.68 59 3.37
Himachal Pradesh 166 133 80.12 31 18.67 2 1.20
Jammu & Kashmir 517 366 70.79 136 26.31 15 2.90
Jharkhand 1496 896 59.89 543 36.30 56 3.74
Karnataka 5316 3848 72.39 1365 25.68 103 1.94
Kerala 3621 2620 72.36 858 23.70 143 3.95
Madhya Pradesh 3845 25100 652.80 1142 29.70 104 2.70
Maharashtra 10814 7909 73.14 2703 25.00 203 1.88
Manipur 171 109 63.74 55 32.16 8 4.68
Meghalaya 116 81 69.83 32 27.59 3 2.59
Mizoram 116 86 74.14 29 25.00 2 1.72
Nagaland 115 71 61.74 41 35.65 2 1.74
Orissa 1517 782 51.55 647 42.65 88 5.80
Punjab 2094 1200 57.31 784 37.44 110 5.25
Rajasthan 3091 2130 68.91 905 29.28 56 1.81
Sikkim 36 29 80.56 6 16.67 1 2.78
Tamil Nadu 8929 6822 76.40 2002 22.42 105 1.18
Tripura 235 150 63.83 76 32.34 10 4.26
7449 4244 56.97 2916 39.15 289 3.88
592 441 74.49 137 23.14 15 2.53
West Bengal 6350 3653 57.53 2278 35.87 419 6.60
A & N Islands 34 26 76.47 8 23.53 0.4 1.18
Chandigarh 228 159 69.74 61 26.75 8 3.51
D & N. Haveli 38 30 78.95 8 21.05 1 2.63
Daman & Diu 48 31 64.58 16 33.33 0.2 0.42
NCT of Delhi 3261 2153 66.02 1018 31.22 90 2.76
Lakshadweep 8 7 87.50 1 12.50 0.04 0.50
Puducherry 206 165 80.10 39 18.93 2 0.97
INDIA 78866 53978 68.44 22615 28.68 2,273 2.88Source:

State of Housing in India
129
Appendix - 37
(‘000’)
States/UTsTotal Census
Occupied Residence Houses
Good Livable Dilapidated
Total % Total % Total %
Andhra Pradesh 6627 5240 79.07 1288 19.44 98 1.48
Arunachal Pradesh 63 37 58.73 25 39.68 2 3.17
Assam 973 575 59.10 343 35.25 55 5.65
Bihar 1921 1017 52.94 769 40.03 135 7.03
1189 760 63.92 397 33.39 32 2.69
Goa 195 150 76.92 42 21.54 3 1.54
Gujarat 5331 4085 76.63 1199 22.49 46 0.86
Haryana 1671 1057 63.26 556 33.27 57 3.41
Himachal Pradesh 163 131 80.37 30 18.40 2 1.23
Jammu & Kashmir 509 362 71.12 133 26.13 15 2.95
Jharkhand 1449 868 59.90 527 36.37 54 3.73
Karnataka 5226 3796 72.64 1329 25.43 100 1.91
Kerala 3602 2610 72.46 851 23.63 142 3.94
Madhya Pradesh 3654 2465 67.46 1088 29.78 101 2.76
Maharashtra 10575 7760 73.38 2618 24.76 198 1.87
Manipur 167 106 63.47 53 31.74 7 4.19
Meghalaya 114 80 70.18 32 28.07 3 2.63
Mizoram 114 84 73.68 28 24.56 2 1.75
Nagaland 113 70 61.95 41 36.28 2 1.77
Orissa 1483 766 51.65 631 42.55 87 5.87
Punjab 2018 1159 57.43 752 37.26 107 5.30
Rajasthan 2981 2062 69.17 872 29.25 55 1.85
Sikkim 34 27 79.41 6 17.65 1 2.94
Tamil Nadu 8751 6704 76.61 1943 22.20 104 1.19Tripura 231 148 64.07 80 34.63 10 4.33
6990 3990 57.08 2721 38.93 278 3.98568 424 74.65 130 22.89 15 2.64
West Bengal 6156 3560 57.83 2190 35.58 406 6.60A & N Islands 34 26 76.47 7 20.59 0.4 1.18Chandigarh 224 157 70.09 59 26.34 8 3.57D & N. Haveli 37 29 78.38 8 21.62 1 2.70Daman & Diu 47 31 65.96 16 34.04 0.2 0.43NCT of Delhi 3128 2075 66.34 967 30.91 86 2.75Lakshadweep 8 7 87.50 1 12.50 0.04 0.50Puducherry 203 163 80.30 38 18.72 2 0.99
INDIA 76558 52580 68.68 21764 28.43 2,213 2.89Source:
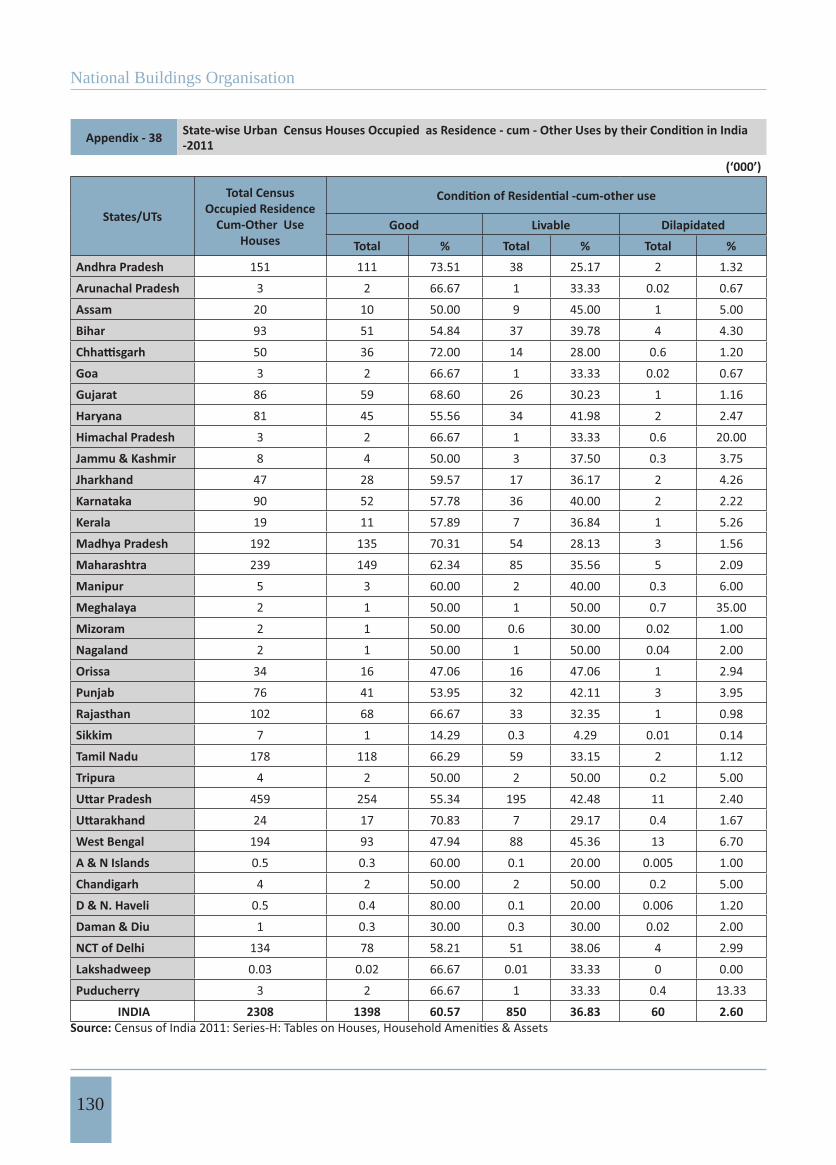
National Buildings Organisation
130
Appendix - 38 -2011
(‘000’)
States/UTs
Total Census Occupied Residence
Cum-Other Use Houses
Good Livable DilapidatedTotal % Total % Total %
Andhra Pradesh 151 111 73.51 38 25.17 2 1.32
Arunachal Pradesh 3 2 66.67 1 33.33 0.02 0.67
Assam 20 10 50.00 9 45.00 1 5.00
Bihar 93 51 54.84 37 39.78 4 4.30
50 36 72.00 14 28.00 0.6 1.20
Goa 3 2 66.67 1 33.33 0.02 0.67
Gujarat 86 59 68.60 26 30.23 1 1.16
Haryana 81 45 55.56 34 41.98 2 2.47
Himachal Pradesh 3 2 66.67 1 33.33 0.6 20.00
Jammu & Kashmir 8 4 50.00 3 37.50 0.3 3.75
Jharkhand 47 28 59.57 17 36.17 2 4.26
Karnataka 90 52 57.78 36 40.00 2 2.22
Kerala 19 11 57.89 7 36.84 1 5.26
Madhya Pradesh 192 135 70.31 54 28.13 3 1.56
Maharashtra 239 149 62.34 85 35.56 5 2.09
Manipur 5 3 60.00 2 40.00 0.3 6.00
Meghalaya 2 1 50.00 1 50.00 0.7 35.00
Mizoram 2 1 50.00 0.6 30.00 0.02 1.00
Nagaland 2 1 50.00 1 50.00 0.04 2.00
Orissa 34 16 47.06 16 47.06 1 2.94
Punjab 76 41 53.95 32 42.11 3 3.95
Rajasthan 102 68 66.67 33 32.35 1 0.98
Sikkim 7 1 14.29 0.3 4.29 0.01 0.14
Tamil Nadu 178 118 66.29 59 33.15 2 1.12
Tripura 4 2 50.00 2 50.00 0.2 5.00
459 254 55.34 195 42.48 11 2.40
24 17 70.83 7 29.17 0.4 1.67
West Bengal 194 93 47.94 88 45.36 13 6.70
A & N Islands 0.5 0.3 60.00 0.1 20.00 0.005 1.00
Chandigarh 4 2 50.00 2 50.00 0.2 5.00
D & N. Haveli 0.5 0.4 80.00 0.1 20.00 0.006 1.20
Daman & Diu 1 0.3 30.00 0.3 30.00 0.02 2.00
NCT of Delhi 134 78 58.21 51 38.06 4 2.99
Lakshadweep 0.03 0.02 66.67 0.01 33.33 0 0.00
Puducherry 3 2 66.67 1 33.33 0.4 13.33
INDIA 2308 1398 60.57 850 36.83 60 2.60Source:
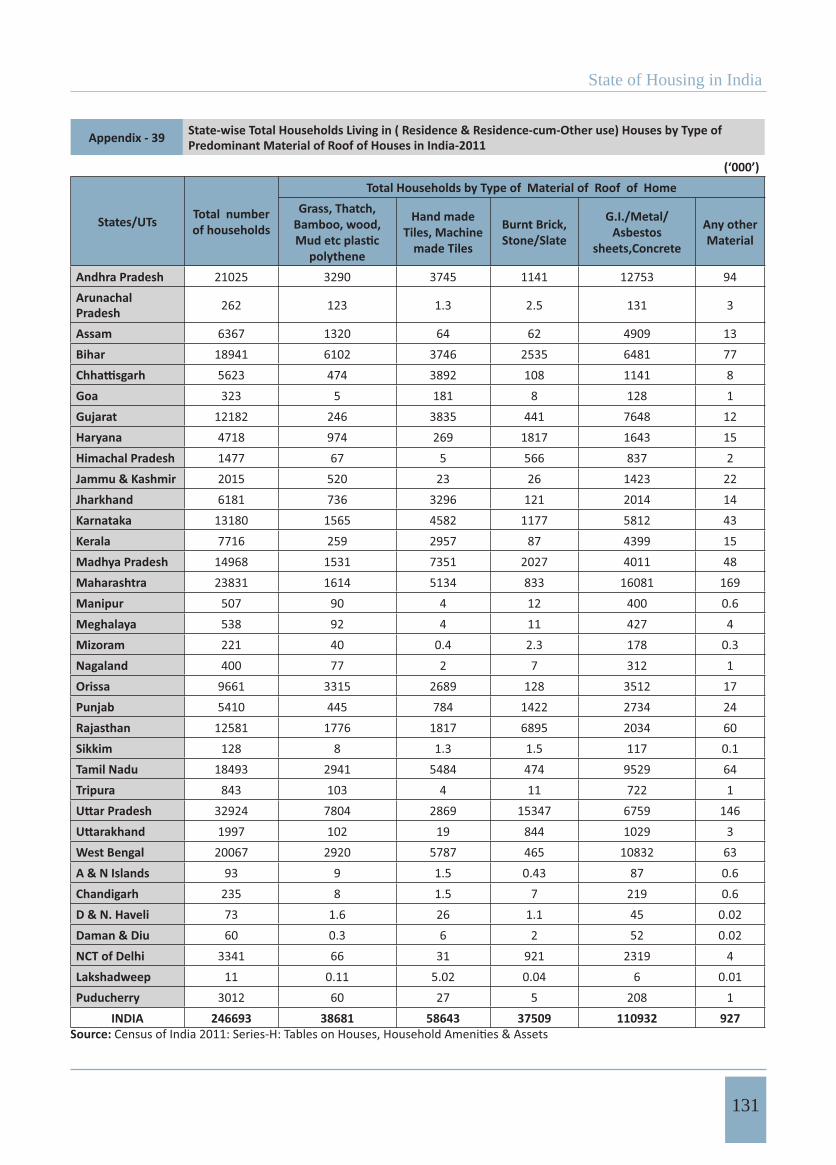
State of Housing in India
131
Appendix - 39 State-wise Total Households Living in ( Residence & Residence-cum-Other use) Houses by Type of Predominant Material of Roof of Houses in India-2011
(‘000’)
States/UTs Total number of households
Total Households by Type of Material of Roof of HomeGrass, Thatch,
Bamboo, wood,
polythene
Hand made Tiles, Machine
made Tiles
Burnt Brick, Stone/Slate
G.I./Metal/Asbestos
sheets,Concrete
Any other Material
Andhra Pradesh 21025 3290 3745 1141 12753 94ArunachalPradesh 262 123 1.3 2.5 131 3
Assam 6367 1320 64 62 4909 13Bihar 18941 6102 3746 2535 6481 77
5623 474 3892 108 1141 8Goa 323 5 181 8 128 1Gujarat 12182 246 3835 441 7648 12Haryana 4718 974 269 1817 1643 15Himachal Pradesh 1477 67 5 566 837 2Jammu & Kashmir 2015 520 23 26 1423 22Jharkhand 6181 736 3296 121 2014 14Karnataka 13180 1565 4582 1177 5812 43Kerala 7716 259 2957 87 4399 15Madhya Pradesh 14968 1531 7351 2027 4011 48Maharashtra 23831 1614 5134 833 16081 169Manipur 507 90 4 12 400 0.6Meghalaya 538 92 4 11 427 4Mizoram 221 40 0.4 2.3 178 0.3Nagaland 400 77 2 7 312 1Orissa 9661 3315 2689 128 3512 17Punjab 5410 445 784 1422 2734 24Rajasthan 12581 1776 1817 6895 2034 60Sikkim 128 8 1.3 1.5 117 0.1Tamil Nadu 18493 2941 5484 474 9529 64Tripura 843 103 4 11 722 1
32924 7804 2869 15347 6759 1461997 102 19 844 1029 3
West Bengal 20067 2920 5787 465 10832 63A & N Islands 93 9 1.5 0.43 87 0.6Chandigarh 235 8 1.5 7 219 0.6D & N. Haveli 73 1.6 26 1.1 45 0.02Daman & Diu 60 0.3 6 2 52 0.02NCT of Delhi 3341 66 31 921 2319 4Lakshadweep 11 0.11 5.02 0.04 6 0.01Puducherry 3012 60 27 5 208 1
INDIA 246693 38681 58643 37509 110932 927Source:
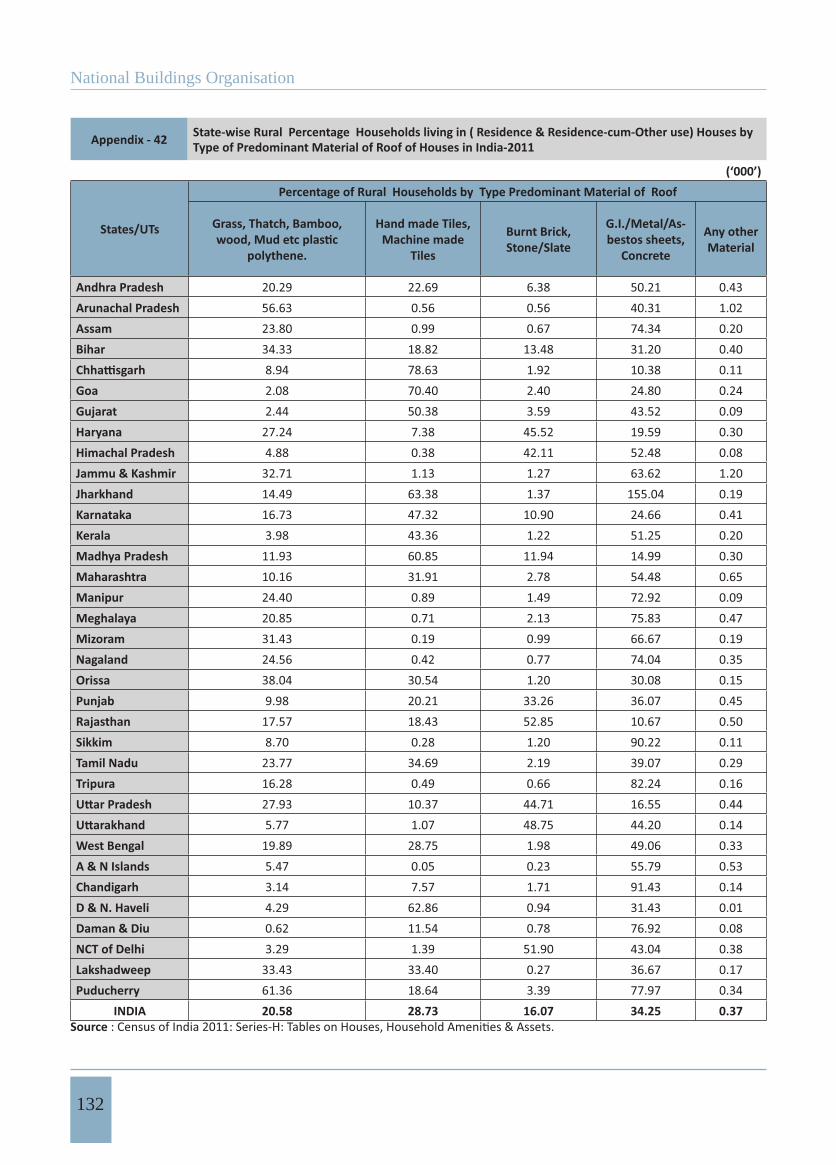
National Buildings Organisation
132
Appendix - 42 State-wise Rural Percentage Households living in ( Residence & Residence-cum-Other use) Houses by Type of Predominant Material of Roof of Houses in India-2011
(‘000’)
States/UTs
Percentage of Rural Households by Type Predominant Material of Roof
Grass, Thatch, Bamboo,
polythene.
Hand made Tiles, Machine made
Tiles
Burnt Brick, Stone/Slate
G.I./Metal/As-bestos sheets,
Concrete
Any other Material
Andhra Pradesh 20.29 22.69 6.38 50.21 0.43Arunachal Pradesh 56.63 0.56 0.56 40.31 1.02Assam 23.80 0.99 0.67 74.34 0.20Bihar 34.33 18.82 13.48 31.20 0.40
8.94 78.63 1.92 10.38 0.11Goa 2.08 70.40 2.40 24.80 0.24Gujarat 2.44 50.38 3.59 43.52 0.09Haryana 27.24 7.38 45.52 19.59 0.30Himachal Pradesh 4.88 0.38 42.11 52.48 0.08Jammu & Kashmir 32.71 1.13 1.27 63.62 1.20Jharkhand 14.49 63.38 1.37 155.04 0.19Karnataka 16.73 47.32 10.90 24.66 0.41Kerala 3.98 43.36 1.22 51.25 0.20Madhya Pradesh 11.93 60.85 11.94 14.99 0.30Maharashtra 10.16 31.91 2.78 54.48 0.65Manipur 24.40 0.89 1.49 72.92 0.09Meghalaya 20.85 0.71 2.13 75.83 0.47Mizoram 31.43 0.19 0.99 66.67 0.19Nagaland 24.56 0.42 0.77 74.04 0.35Orissa 38.04 30.54 1.20 30.08 0.15Punjab 9.98 20.21 33.26 36.07 0.45Rajasthan 17.57 18.43 52.85 10.67 0.50Sikkim 8.70 0.28 1.20 90.22 0.11Tamil Nadu 23.77 34.69 2.19 39.07 0.29Tripura 16.28 0.49 0.66 82.24 0.16
27.93 10.37 44.71 16.55 0.445.77 1.07 48.75 44.20 0.14
West Bengal 19.89 28.75 1.98 49.06 0.33A & N Islands 5.47 0.05 0.23 55.79 0.53Chandigarh 3.14 7.57 1.71 91.43 0.14D & N. Haveli 4.29 62.86 0.94 31.43 0.01Daman & Diu 0.62 11.54 0.78 76.92 0.08NCT of Delhi 3.29 1.39 51.90 43.04 0.38Lakshadweep 33.43 33.40 0.27 36.67 0.17Puducherry 61.36 18.64 3.39 77.97 0.34
INDIA 20.58 28.73 16.07 34.25 0.37Source
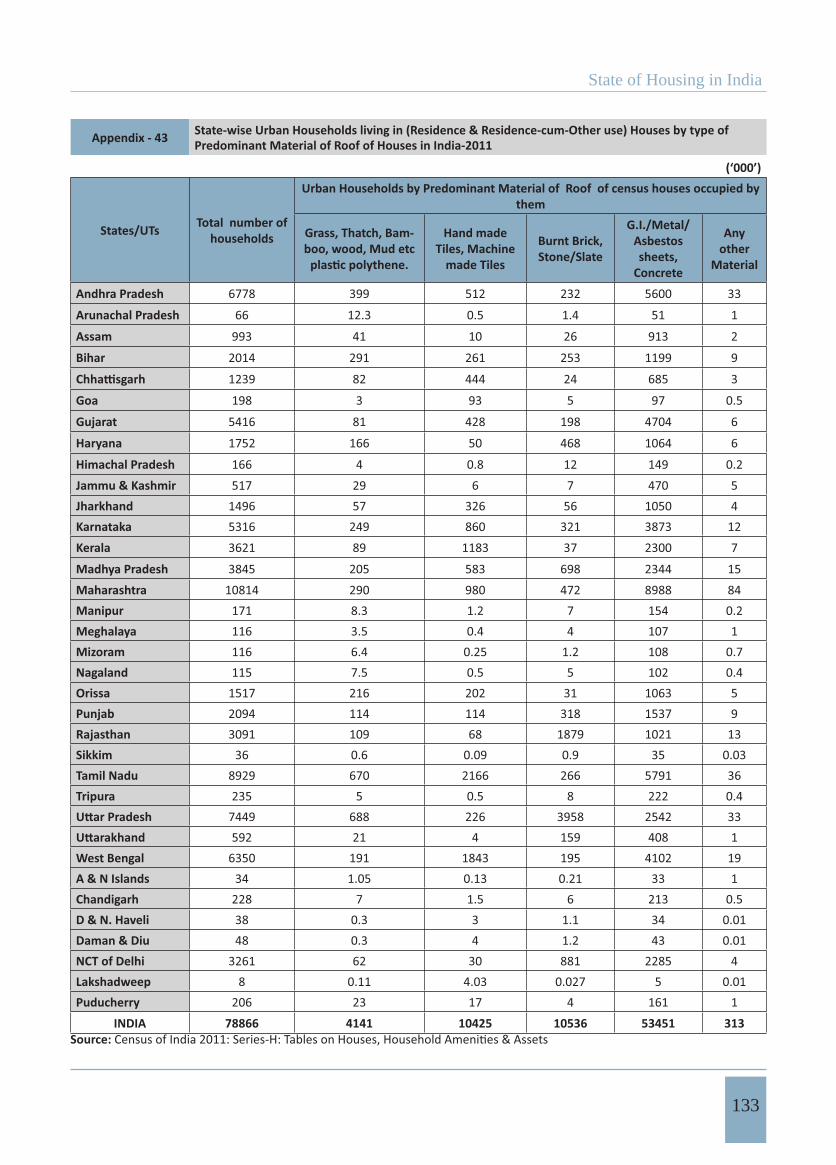
State of Housing in India
133
Appendix - 43 State-wise Urban Households living in (Residence & Residence-cum-Other use) Houses by type of Predominant Material of Roof of Houses in India-2011
(‘000’)
States/UTs Total number of households
Urban Households by Predominant Material of Roof of census houses occupied by them
Grass, Thatch, Bam-boo, wood, Mud etc
Hand made Tiles, Machine
made Tiles
Burnt Brick, Stone/Slate
G.I./Metal/Asbestos sheets,
Concrete
Any other
Material
Andhra Pradesh 6778 399 512 232 5600 33
Arunachal Pradesh 66 12.3 0.5 1.4 51 1
Assam 993 41 10 26 913 2
Bihar 2014 291 261 253 1199 9
1239 82 444 24 685 3
Goa 198 3 93 5 97 0.5
Gujarat 5416 81 428 198 4704 6
Haryana 1752 166 50 468 1064 6
Himachal Pradesh 166 4 0.8 12 149 0.2Jammu & Kashmir 517 29 6 7 470 5Jharkhand 1496 57 326 56 1050 4Karnataka 5316 249 860 321 3873 12Kerala 3621 89 1183 37 2300 7
Madhya Pradesh 3845 205 583 698 2344 15Maharashtra 10814 290 980 472 8988 84Manipur 171 8.3 1.2 7 154 0.2Meghalaya 116 3.5 0.4 4 107 1Mizoram 116 6.4 0.25 1.2 108 0.7Nagaland 115 7.5 0.5 5 102 0.4Orissa 1517 216 202 31 1063 5Punjab 2094 114 114 318 1537 9Rajasthan 3091 109 68 1879 1021 13Sikkim 36 0.6 0.09 0.9 35 0.03Tamil Nadu 8929 670 2166 266 5791 36Tripura 235 5 0.5 8 222 0.4
7449 688 226 3958 2542 33592 21 4 159 408 1
West Bengal 6350 191 1843 195 4102 19A & N Islands 34 1.05 0.13 0.21 33 1Chandigarh 228 7 1.5 6 213 0.5D & N. Haveli 38 0.3 3 1.1 34 0.01Daman & Diu 48 0.3 4 1.2 43 0.01NCT of Delhi 3261 62 30 881 2285 4Lakshadweep 8 0.11 4.03 0.027 5 0.01Puducherry 206 23 17 4 161 1
INDIA 78866 4141 10425 10536 53451 313Source:
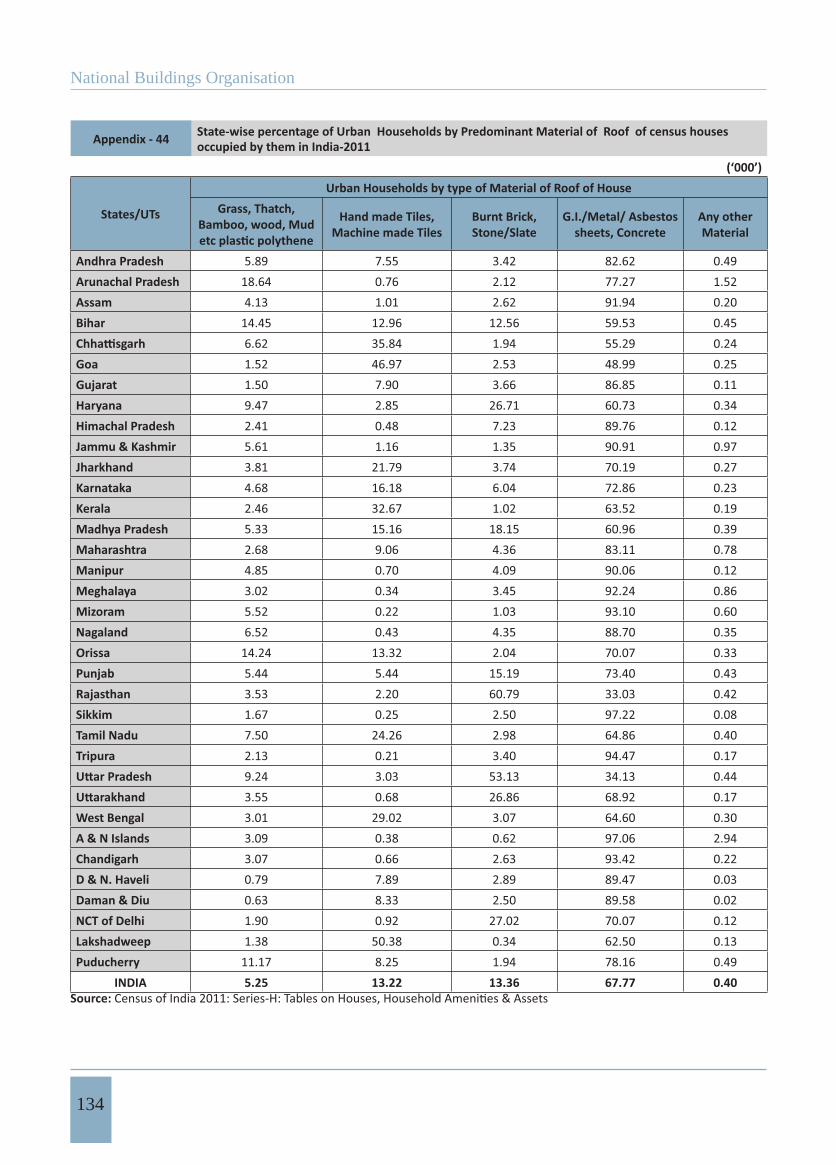
National Buildings Organisation
134
Appendix - 44 State-wise percentage of Urban Households by Predominant Material of Roof of census houses occupied by them in India-2011
(‘000’)
States/UTs
Urban Households by type of Material of Roof of HouseGrass, Thatch,
Bamboo, wood, Mud Hand made Tiles, Machine made Tiles
Burnt Brick, Stone/Slate
G.I./Metal/ Asbestos sheets, Concrete
Any other Material
Andhra Pradesh 5.89 7.55 3.42 82.62 0.49Arunachal Pradesh 18.64 0.76 2.12 77.27 1.52Assam 4.13 1.01 2.62 91.94 0.20Bihar 14.45 12.96 12.56 59.53 0.45
6.62 35.84 1.94 55.29 0.24Goa 1.52 46.97 2.53 48.99 0.25Gujarat 1.50 7.90 3.66 86.85 0.11Haryana 9.47 2.85 26.71 60.73 0.34Himachal Pradesh 2.41 0.48 7.23 89.76 0.12Jammu & Kashmir 5.61 1.16 1.35 90.91 0.97Jharkhand 3.81 21.79 3.74 70.19 0.27Karnataka 4.68 16.18 6.04 72.86 0.23Kerala 2.46 32.67 1.02 63.52 0.19Madhya Pradesh 5.33 15.16 18.15 60.96 0.39Maharashtra 2.68 9.06 4.36 83.11 0.78Manipur 4.85 0.70 4.09 90.06 0.12Meghalaya 3.02 0.34 3.45 92.24 0.86Mizoram 5.52 0.22 1.03 93.10 0.60Nagaland 6.52 0.43 4.35 88.70 0.35Orissa 14.24 13.32 2.04 70.07 0.33Punjab 5.44 5.44 15.19 73.40 0.43Rajasthan 3.53 2.20 60.79 33.03 0.42Sikkim 1.67 0.25 2.50 97.22 0.08Tamil Nadu 7.50 24.26 2.98 64.86 0.40Tripura 2.13 0.21 3.40 94.47 0.17
9.24 3.03 53.13 34.13 0.443.55 0.68 26.86 68.92 0.17
West Bengal 3.01 29.02 3.07 64.60 0.30A & N Islands 3.09 0.38 0.62 97.06 2.94Chandigarh 3.07 0.66 2.63 93.42 0.22D & N. Haveli 0.79 7.89 2.89 89.47 0.03Daman & Diu 0.63 8.33 2.50 89.58 0.02NCT of Delhi 1.90 0.92 27.02 70.07 0.12Lakshadweep 1.38 50.38 0.34 62.50 0.13Puducherry 11.17 8.25 1.94 78.16 0.49
INDIA 5.25 13.22 13.36 67.77 0.40Source:
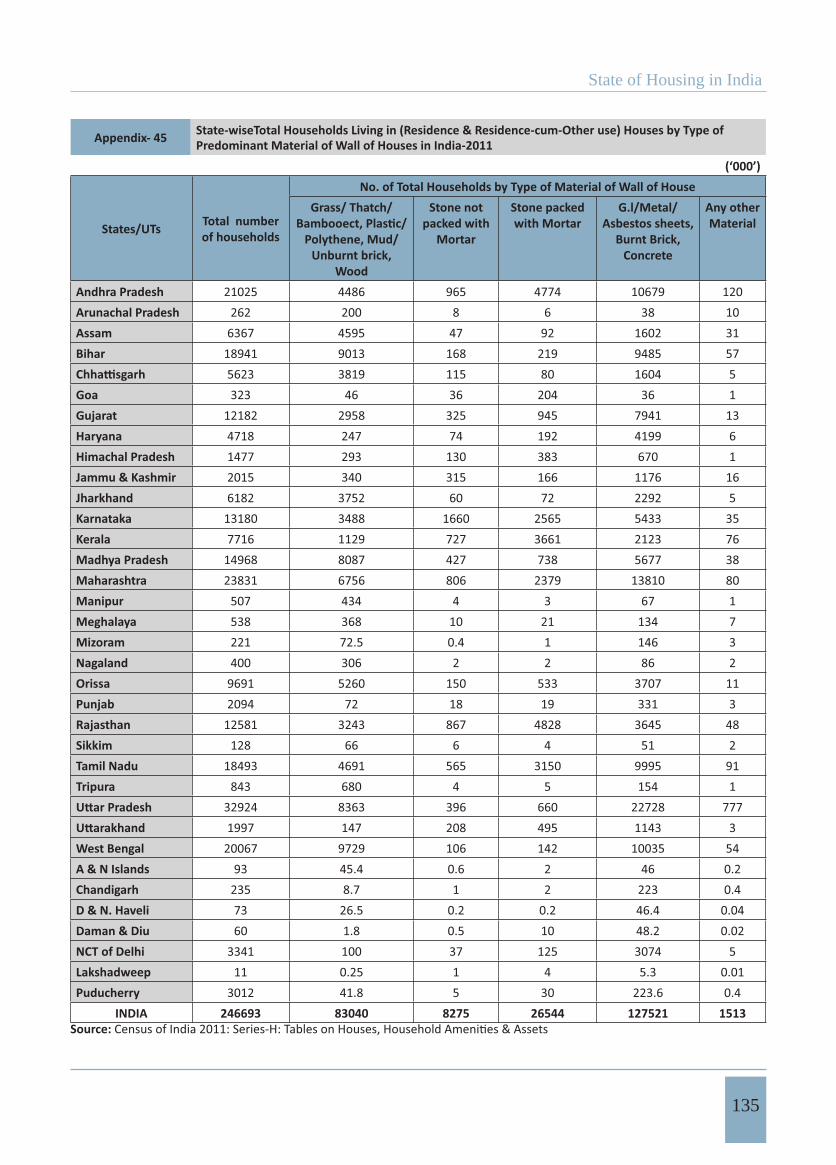
State of Housing in India
135
Appendix- 45 State-wiseTotal Households Living in (Residence & Residence-cum-Other use) Houses by Type of Predominant Material of Wall of Houses in India-2011
(‘000’)
States/UTs Total number of households
No. of Total Households by Type of Material of Wall of HouseGrass/ Thatch/
Polythene, Mud/ Unburnt brick,
Wood
Stone not packed with
Mortar
Stone packed with Mortar
G.l/Metal/Asbestos sheets,
Burnt Brick, Concrete
Any other Material
Andhra Pradesh 21025 4486 965 4774 10679 120Arunachal Pradesh 262 200 8 6 38 10Assam 6367 4595 47 92 1602 31Bihar 18941 9013 168 219 9485 57
5623 3819 115 80 1604 5Goa 323 46 36 204 36 1Gujarat 12182 2958 325 945 7941 13Haryana 4718 247 74 192 4199 6Himachal Pradesh 1477 293 130 383 670 1Jammu & Kashmir 2015 340 315 166 1176 16Jharkhand 6182 3752 60 72 2292 5Karnataka 13180 3488 1660 2565 5433 35Kerala 7716 1129 727 3661 2123 76Madhya Pradesh 14968 8087 427 738 5677 38Maharashtra 23831 6756 806 2379 13810 80Manipur 507 434 4 3 67 1Meghalaya 538 368 10 21 134 7Mizoram 221 72.5 0.4 1 146 3Nagaland 400 306 2 2 86 2Orissa 9691 5260 150 533 3707 11Punjab 2094 72 18 19 331 3Rajasthan 12581 3243 867 4828 3645 48Sikkim 128 66 6 4 51 2Tamil Nadu 18493 4691 565 3150 9995 91Tripura 843 680 4 5 154 1
32924 8363 396 660 22728 7771997 147 208 495 1143 3
West Bengal 20067 9729 106 142 10035 54A & N Islands 93 45.4 0.6 2 46 0.2Chandigarh 235 8.7 1 2 223 0.4D & N. Haveli 73 26.5 0.2 0.2 46.4 0.04Daman & Diu 60 1.8 0.5 10 48.2 0.02NCT of Delhi 3341 100 37 125 3074 5Lakshadweep 11 0.25 1 4 5.3 0.01Puducherry 3012 41.8 5 30 223.6 0.4
INDIA 246693 83040 8275 26544 127521 1513Source:
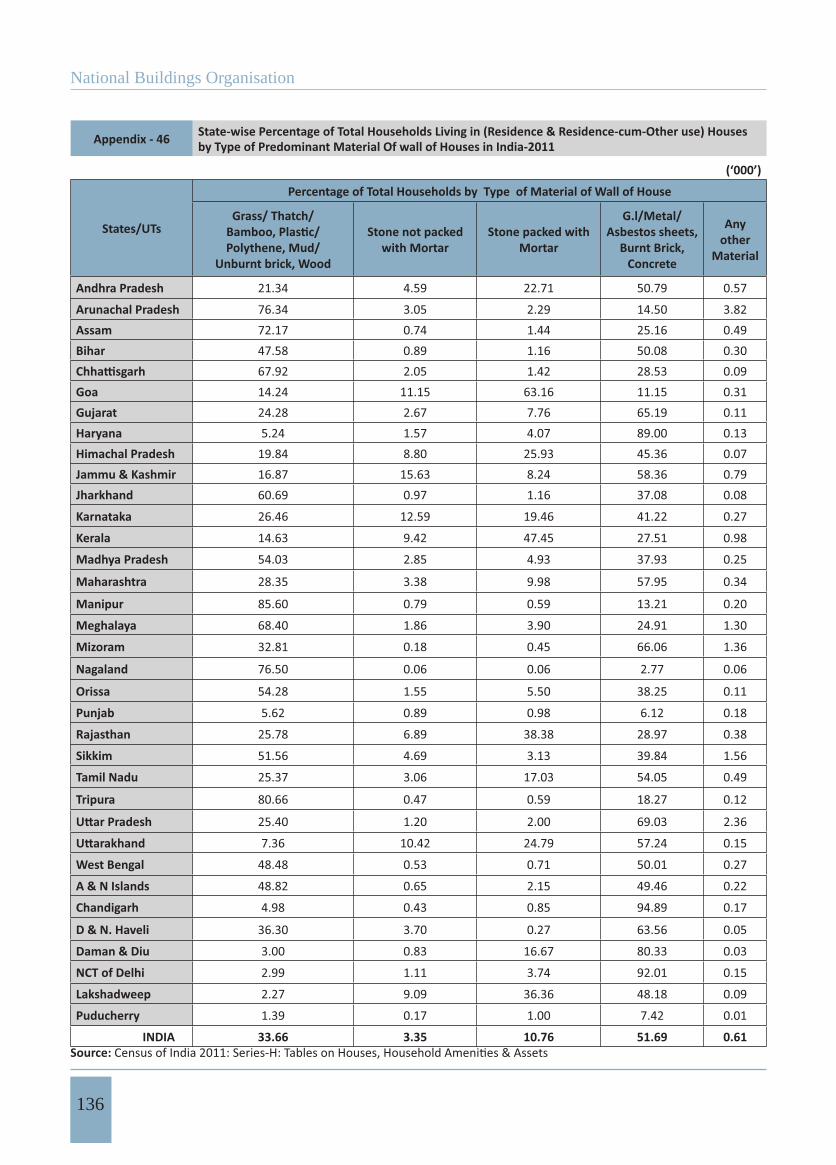
National Buildings Organisation
136
Appendix - 46 State-wise Percentage of Total Households Living in (Residence & Residence-cum-Other use) Houses by Type of Predominant Material Of wall of Houses in India-2011
(‘000’)
States/UTs
Percentage of Total Households by Type of Material of Wall of House
Grass/ Thatch/
Polythene, Mud/ Unburnt brick, Wood
Stone not packed with Mortar
Stone packed with Mortar
G.l/Metal/Asbestos sheets,
Burnt Brick, Concrete
Any other
Material
Andhra Pradesh 21.34 4.59 22.71 50.79 0.57
Arunachal Pradesh 76.34 3.05 2.29 14.50 3.82Assam 72.17 0.74 1.44 25.16 0.49Bihar 47.58 0.89 1.16 50.08 0.30
67.92 2.05 1.42 28.53 0.09Goa 14.24 11.15 63.16 11.15 0.31Gujarat 24.28 2.67 7.76 65.19 0.11Haryana 5.24 1.57 4.07 89.00 0.13Himachal Pradesh 19.84 8.80 25.93 45.36 0.07Jammu & Kashmir 16.87 15.63 8.24 58.36 0.79Jharkhand 60.69 0.97 1.16 37.08 0.08
Karnataka 26.46 12.59 19.46 41.22 0.27
Kerala 14.63 9.42 47.45 27.51 0.98
Madhya Pradesh 54.03 2.85 4.93 37.93 0.25
Maharashtra 28.35 3.38 9.98 57.95 0.34
Manipur 85.60 0.79 0.59 13.21 0.20
Meghalaya 68.40 1.86 3.90 24.91 1.30
Mizoram 32.81 0.18 0.45 66.06 1.36
Nagaland 76.50 0.06 0.06 2.77 0.06
Orissa 54.28 1.55 5.50 38.25 0.11
Punjab 5.62 0.89 0.98 6.12 0.18
Rajasthan 25.78 6.89 38.38 28.97 0.38
Sikkim 51.56 4.69 3.13 39.84 1.56
Tamil Nadu 25.37 3.06 17.03 54.05 0.49
Tripura 80.66 0.47 0.59 18.27 0.12
25.40 1.20 2.00 69.03 2.36
7.36 10.42 24.79 57.24 0.15
West Bengal 48.48 0.53 0.71 50.01 0.27
A & N Islands 48.82 0.65 2.15 49.46 0.22
Chandigarh 4.98 0.43 0.85 94.89 0.17
D & N. Haveli 36.30 3.70 0.27 63.56 0.05
Daman & Diu 3.00 0.83 16.67 80.33 0.03
NCT of Delhi 2.99 1.11 3.74 92.01 0.15
Lakshadweep 2.27 9.09 36.36 48.18 0.09
Puducherry 1.39 0.17 1.00 7.42 0.01
INDIA 33.66 3.35 10.76 51.69 0.61Source:
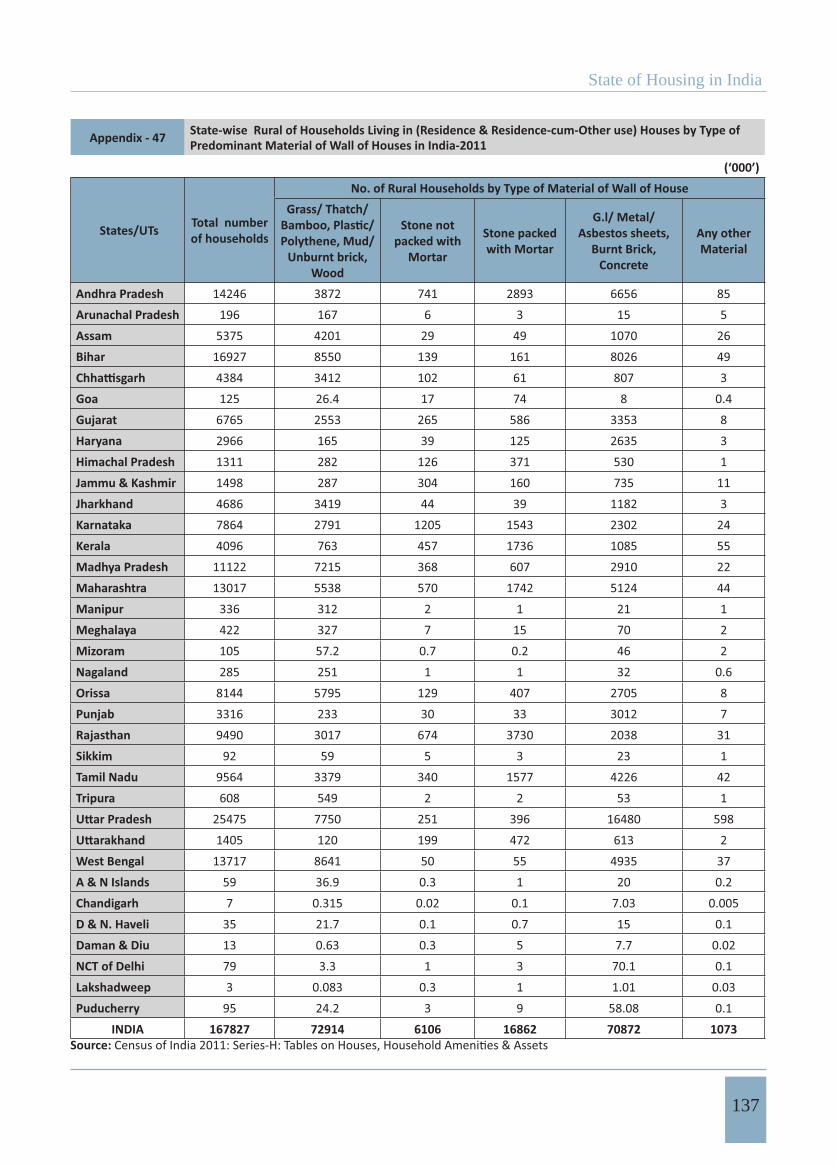
State of Housing in India
137
Appendix - 47 State-wise Rural of Households Living in (Residence & Residence-cum-Other use) Houses by Type of Predominant Material of Wall of Houses in India-2011
(‘000’)
States/UTs Total number of households
No. of Rural Households by Type of Material of Wall of HouseGrass/ Thatch/
Polythene, Mud/ Unburnt brick,
Wood
Stone not packed with
Mortar
Stone packed with Mortar
G.l/ Metal/ Asbestos sheets,
Burnt Brick, Concrete
Any other Material
Andhra Pradesh 14246 3872 741 2893 6656 85Arunachal Pradesh 196 167 6 3 15 5Assam 5375 4201 29 49 1070 26Bihar 16927 8550 139 161 8026 49
4384 3412 102 61 807 3Goa 125 26.4 17 74 8 0.4Gujarat 6765 2553 265 586 3353 8Haryana 2966 165 39 125 2635 3Himachal Pradesh 1311 282 126 371 530 1Jammu & Kashmir 1498 287 304 160 735 11Jharkhand 4686 3419 44 39 1182 3Karnataka 7864 2791 1205 1543 2302 24Kerala 4096 763 457 1736 1085 55Madhya Pradesh 11122 7215 368 607 2910 22Maharashtra 13017 5538 570 1742 5124 44Manipur 336 312 2 1 21 1Meghalaya 422 327 7 15 70 2Mizoram 105 57.2 0.7 0.2 46 2Nagaland 285 251 1 1 32 0.6Orissa 8144 5795 129 407 2705 8Punjab 3316 233 30 33 3012 7Rajasthan 9490 3017 674 3730 2038 31Sikkim 92 59 5 3 23 1Tamil Nadu 9564 3379 340 1577 4226 42Tripura 608 549 2 2 53 1
25475 7750 251 396 16480 5981405 120 199 472 613 2
West Bengal 13717 8641 50 55 4935 37A & N Islands 59 36.9 0.3 1 20 0.2Chandigarh 7 0.315 0.02 0.1 7.03 0.005D & N. Haveli 35 21.7 0.1 0.7 15 0.1Daman & Diu 13 0.63 0.3 5 7.7 0.02NCT of Delhi 79 3.3 1 3 70.1 0.1Lakshadweep 3 0.083 0.3 1 1.01 0.03Puducherry 95 24.2 3 9 58.08 0.1
INDIA 167827 72914 6106 16862 70872 1073Source:
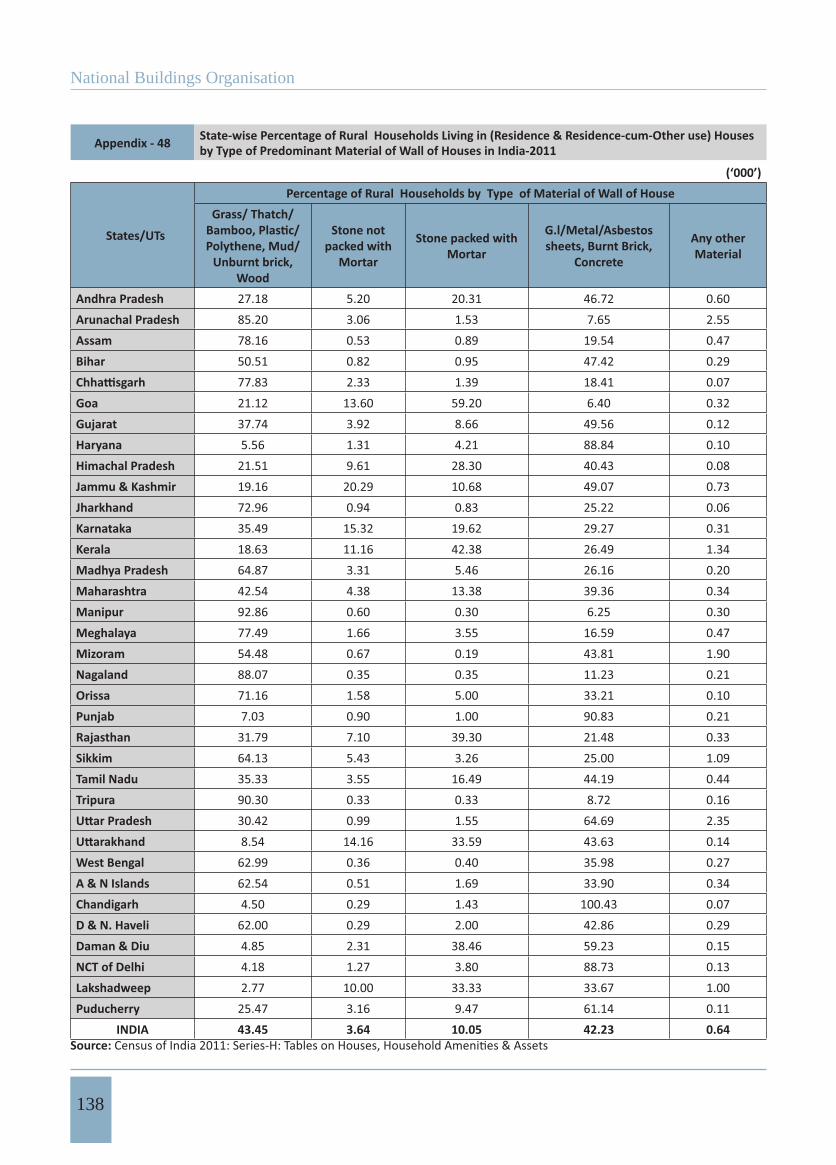
National Buildings Organisation
138
Appendix - 48 State-wise Percentage of Rural Households Living in (Residence & Residence-cum-Other use) Houses by Type of Predominant Material of Wall of Houses in India-2011
(‘000’)
States/UTs
Percentage of Rural Households by Type of Material of Wall of HouseGrass/ Thatch/
Polythene, Mud/ Unburnt brick,
Wood
Stone not packed with
Mortar
Stone packed with Mortar
G.l/Metal/Asbestos sheets, Burnt Brick,
Concrete
Any other Material
Andhra Pradesh 27.18 5.20 20.31 46.72 0.60Arunachal Pradesh 85.20 3.06 1.53 7.65 2.55Assam 78.16 0.53 0.89 19.54 0.47Bihar 50.51 0.82 0.95 47.42 0.29
77.83 2.33 1.39 18.41 0.07Goa 21.12 13.60 59.20 6.40 0.32Gujarat 37.74 3.92 8.66 49.56 0.12Haryana 5.56 1.31 4.21 88.84 0.10Himachal Pradesh 21.51 9.61 28.30 40.43 0.08Jammu & Kashmir 19.16 20.29 10.68 49.07 0.73Jharkhand 72.96 0.94 0.83 25.22 0.06Karnataka 35.49 15.32 19.62 29.27 0.31Kerala 18.63 11.16 42.38 26.49 1.34Madhya Pradesh 64.87 3.31 5.46 26.16 0.20Maharashtra 42.54 4.38 13.38 39.36 0.34Manipur 92.86 0.60 0.30 6.25 0.30Meghalaya 77.49 1.66 3.55 16.59 0.47Mizoram 54.48 0.67 0.19 43.81 1.90Nagaland 88.07 0.35 0.35 11.23 0.21Orissa 71.16 1.58 5.00 33.21 0.10Punjab 7.03 0.90 1.00 90.83 0.21Rajasthan 31.79 7.10 39.30 21.48 0.33Sikkim 64.13 5.43 3.26 25.00 1.09Tamil Nadu 35.33 3.55 16.49 44.19 0.44Tripura 90.30 0.33 0.33 8.72 0.16
30.42 0.99 1.55 64.69 2.358.54 14.16 33.59 43.63 0.14
West Bengal 62.99 0.36 0.40 35.98 0.27A & N Islands 62.54 0.51 1.69 33.90 0.34Chandigarh 4.50 0.29 1.43 100.43 0.07D & N. Haveli 62.00 0.29 2.00 42.86 0.29Daman & Diu 4.85 2.31 38.46 59.23 0.15NCT of Delhi 4.18 1.27 3.80 88.73 0.13Lakshadweep 2.77 10.00 33.33 33.67 1.00Puducherry 25.47 3.16 9.47 61.14 0.11
INDIA 43.45 3.64 10.05 42.23 0.64Source:

State of Housing in India
139
Appendix- 49 State-wise Urban of Households Living in (Residence & Residence-cum-Other use) Houses by Type of Predominant Material of Wall of Houses in India-2011
(‘000’)
States/UTs Total number of households
No. of Urban Households by Type of Material of Wall of HouseGrass/ Thatch/
Polythene/ Mud/ Unburnt brick/
Wood
Stone not packed with
Mortar
Stone packed with Mortar
G.l/Metal/Asbestos sheets/
Burnt Brick/ Concrete
Any other Material
Andhra Pradesh 6778 615 225 1881 4022 34Arunachal Pradesh 66 33 2 2 21.6 6Assam 993 394 18 44 531 6Bihar 2014 460 29 58 1459 7
1239 407 13 18 798 3Goa 198 19 19 130 29 1Gujarat 5416 404 60 360 4587 5Haryana 1752 82 35 67 1564 3Himachal Pradesh 166 11 4 12 140 0.3Jammu & Kashmir 517 55 11 6 441 5Jharkhand 1496 333 16 33 1111 2Karnataka 5316 697 455 1022 3131 11Kerala 3621 367 270 1925 1038 21Madhya Pradesh 3845 872 59 131 2768 16Maharashtra 10814 1218 236 637 8686 36Manipur 171 113 2 2 46 0.3Meghalaya 116 39 2 6 64 4Mizoram 116 15.9 0.3 0.4 99 1Nagaland 115 56 1 1 54 2Orissa 1517 364 22 126 1003 3Punjab 2094 72 18 19 1982 3Rajasthan 3091 178 192 1097 1607 17Sikkim 36 5.1 0.4 0.4 29.4 0.3Tamil Nadu 8929 1312 225 1574 5769 50Tripura 235 130.5 2 3 100 0.5
7449 613 145 264 6248 179592 29 10 23 530 1
West Bengal 6350 1088 57 87 5100 18A & N Islands 34 7.9 0.2 0.5 26 0.02Chandigarh 228 8.6 1 2 216 0.4D & N. Haveli 38 4.2 0.1 0.2 33.3 0.02Daman & Diu 48 0.9 0.2 5 41.1 0.007NCT of Delhi 3261 96 36 121 3004 5Lakshadweep 8 0.136 0.5 3 4.08 0.01Puducherry 206 16.5 2 21 165.5 0.3
INDIA 78866 10127 2169 9682 56449 440Source:

National Buildings Organisation
140
Appendix - 50 State-wise Percentage of Urban Households Living in (Residence & Residence-cum-Other use) Houses by Type of Predominant Material of Wall of Houses in India-2011
States/UTs
Total number of households Percentage of Urban Households by Type of Material of Wall of House
Grass/ Thatch/
Polythene, Mud/ Unburnt brick, Wood
Stone not packed with Mortar
Stone packed with Mortar
G.l/Metal/Asbestos sheets, Burnt Brick,
Concrete
Any other Material
Andhra Pradesh 9.07 3.32 27.75 59.34 0.50
Arunachal Pradesh 50.00 3.03 3.03 32.73 9.09Assam 39.68 1.81 4.43 53.47 0.60Bihar 22.84 1.44 2.88 72.44 0.35
32.85 1.05 1.45 64.41 0.24Goa 9.60 9.60 65.66 14.65 0.51Gujarat 7.46 1.11 6.65 84.69 0.09
Haryana 4.68 2.00 3.82 89.27 0.17
Himachal Pradesh 6.63 2.41 7.23 84.34 0.18Jammu & Kashmir 10.64 2.13 1.16 85.30 0.97
Jharkhand 22.26 1.07 2.21 74.26 0.13
Karnataka 13.11 8.56 19.22 58.90 0.21
Kerala 10.14 7.46 53.16 28.67 0.58
Madhya Pradesh 22.68 1.53 3.41 71.99 0.42
Maharashtra 11.26 2.18 5.89 80.32 0.33
Manipur 66.08 1.17 1.17 26.90 0.18
Meghalaya 33.62 1.72 5.17 55.17 3.45
Mizoram 13.71 0.26 0.34 85.34 0.86Nagaland 48.70 0.87 0.87 46.96 1.74Orissa 23.99 1.45 8.31 66.12 0.20Punjab 3.44 0.86 0.91 94.65 0.14Rajasthan 5.76 6.21 35.49 51.99 0.55Sikkim 14.17 1.11 1.11 81.67 0.83Tamil Nadu 14.69 2.52 17.63 64.61 0.56Tripura 55.53 0.85 1.28 42.55 0.21
8.23 1.95 3.54 83.88 2.404.90 1.69 3.89 89.53 0.17
West Bengal 17.13 0.90 1.37 80.31 0.28A & N Islands 23.24 0.59 1.47 76.47 0.06Chandigarh 3.77 0.44 0.88 94.74 0.18D & N. Haveli 11.05 0.26 0.53 87.63 0.05Daman & Diu 1.88 0.42 10.42 85.63 0.01NCT of Delhi 2.94 1.10 3.71 92.12 0.15Lakshadweep 1.70 6.25 37.50 51.00 0.13Puducherry 8.01 0.97 10.19 80.34 0.15
INDIA 12.84 2.75 12.28 71.58 0.56Source:
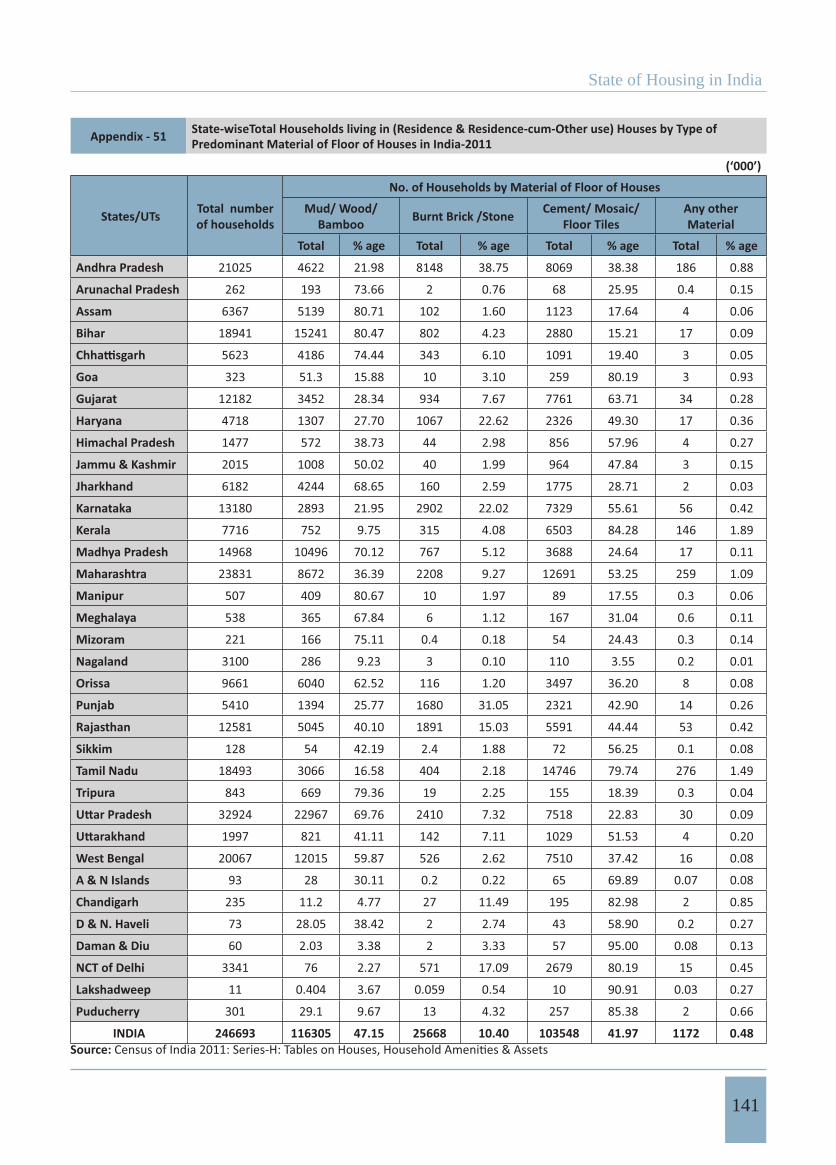
State of Housing in India
141
Appendix - 51 State-wiseTotal Households living in (Residence & Residence-cum-Other use) Houses by Type of Predominant Material of Floor of Houses in India-2011
(‘000’)
States/UTs Total number of households
No. of Households by Material of Floor of Houses
Mud/ Wood/ Bamboo Burnt Brick /Stone Cement/ Mosaic/
Floor TilesAny other Material
Total % age Total % age Total % age Total % age
Andhra Pradesh 21025 4622 21.98 8148 38.75 8069 38.38 186 0.88
Arunachal Pradesh 262 193 73.66 2 0.76 68 25.95 0.4 0.15
Assam 6367 5139 80.71 102 1.60 1123 17.64 4 0.06
Bihar 18941 15241 80.47 802 4.23 2880 15.21 17 0.09
5623 4186 74.44 343 6.10 1091 19.40 3 0.05
Goa 323 51.3 15.88 10 3.10 259 80.19 3 0.93
Gujarat 12182 3452 28.34 934 7.67 7761 63.71 34 0.28
Haryana 4718 1307 27.70 1067 22.62 2326 49.30 17 0.36
Himachal Pradesh 1477 572 38.73 44 2.98 856 57.96 4 0.27
Jammu & Kashmir 2015 1008 50.02 40 1.99 964 47.84 3 0.15
Jharkhand 6182 4244 68.65 160 2.59 1775 28.71 2 0.03
Karnataka 13180 2893 21.95 2902 22.02 7329 55.61 56 0.42
Kerala 7716 752 9.75 315 4.08 6503 84.28 146 1.89
Madhya Pradesh 14968 10496 70.12 767 5.12 3688 24.64 17 0.11
Maharashtra 23831 8672 36.39 2208 9.27 12691 53.25 259 1.09
Manipur 507 409 80.67 10 1.97 89 17.55 0.3 0.06
Meghalaya 538 365 67.84 6 1.12 167 31.04 0.6 0.11
Mizoram 221 166 75.11 0.4 0.18 54 24.43 0.3 0.14
Nagaland 3100 286 9.23 3 0.10 110 3.55 0.2 0.01
Orissa 9661 6040 62.52 116 1.20 3497 36.20 8 0.08
Punjab 5410 1394 25.77 1680 31.05 2321 42.90 14 0.26
Rajasthan 12581 5045 40.10 1891 15.03 5591 44.44 53 0.42
Sikkim 128 54 42.19 2.4 1.88 72 56.25 0.1 0.08
Tamil Nadu 18493 3066 16.58 404 2.18 14746 79.74 276 1.49
Tripura 843 669 79.36 19 2.25 155 18.39 0.3 0.04
32924 22967 69.76 2410 7.32 7518 22.83 30 0.09
1997 821 41.11 142 7.11 1029 51.53 4 0.20
West Bengal 20067 12015 59.87 526 2.62 7510 37.42 16 0.08
A & N Islands 93 28 30.11 0.2 0.22 65 69.89 0.07 0.08
Chandigarh 235 11.2 4.77 27 11.49 195 82.98 2 0.85
D & N. Haveli 73 28.05 38.42 2 2.74 43 58.90 0.2 0.27
Daman & Diu 60 2.03 3.38 2 3.33 57 95.00 0.08 0.13
NCT of Delhi 3341 76 2.27 571 17.09 2679 80.19 15 0.45
Lakshadweep 11 0.404 3.67 0.059 0.54 10 90.91 0.03 0.27
Puducherry 301 29.1 9.67 13 4.32 257 85.38 2 0.66
INDIA 246693 116305 47.15 25668 10.40 103548 41.97 1172 0.48Source:
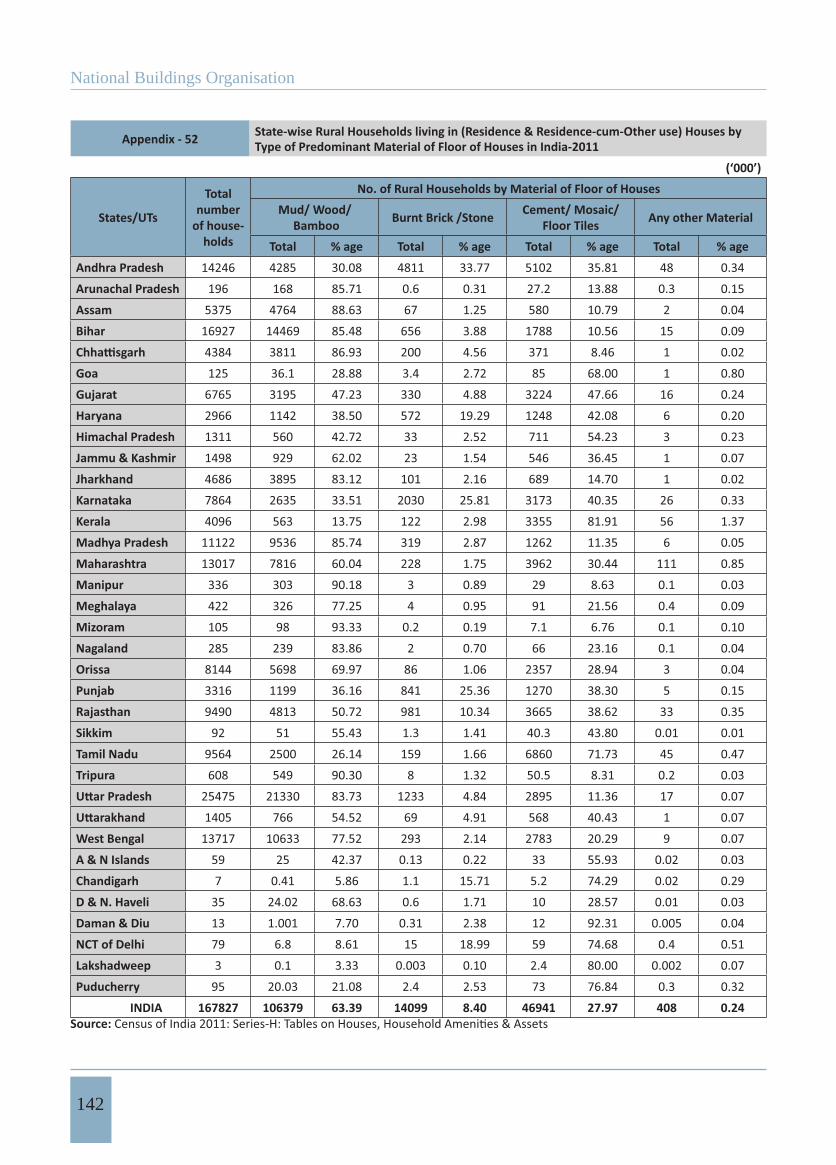
National Buildings Organisation
142
Appendix - 52 State-wise Rural Households living in (Residence & Residence-cum-Other use) Houses by Type of Predominant Material of Floor of Houses in India-2011
(‘000’)
States/UTs
Total number
of house-holds
No. of Rural Households by Material of Floor of HousesMud/ Wood/
Bamboo Burnt Brick /Stone Cement/ Mosaic/ Floor Tiles Any other Material
Total % age Total % age Total % age Total % age
Andhra Pradesh 14246 4285 30.08 4811 33.77 5102 35.81 48 0.34
Arunachal Pradesh 196 168 85.71 0.6 0.31 27.2 13.88 0.3 0.15
Assam 5375 4764 88.63 67 1.25 580 10.79 2 0.04
Bihar 16927 14469 85.48 656 3.88 1788 10.56 15 0.09
4384 3811 86.93 200 4.56 371 8.46 1 0.02
Goa 125 36.1 28.88 3.4 2.72 85 68.00 1 0.80
Gujarat 6765 3195 47.23 330 4.88 3224 47.66 16 0.24
Haryana 2966 1142 38.50 572 19.29 1248 42.08 6 0.20
Himachal Pradesh 1311 560 42.72 33 2.52 711 54.23 3 0.23
Jammu & Kashmir 1498 929 62.02 23 1.54 546 36.45 1 0.07
Jharkhand 4686 3895 83.12 101 2.16 689 14.70 1 0.02
Karnataka 7864 2635 33.51 2030 25.81 3173 40.35 26 0.33
Kerala 4096 563 13.75 122 2.98 3355 81.91 56 1.37
Madhya Pradesh 11122 9536 85.74 319 2.87 1262 11.35 6 0.05
Maharashtra 13017 7816 60.04 228 1.75 3962 30.44 111 0.85
Manipur 336 303 90.18 3 0.89 29 8.63 0.1 0.03
Meghalaya 422 326 77.25 4 0.95 91 21.56 0.4 0.09
Mizoram 105 98 93.33 0.2 0.19 7.1 6.76 0.1 0.10
Nagaland 285 239 83.86 2 0.70 66 23.16 0.1 0.04
Orissa 8144 5698 69.97 86 1.06 2357 28.94 3 0.04
Punjab 3316 1199 36.16 841 25.36 1270 38.30 5 0.15
Rajasthan 9490 4813 50.72 981 10.34 3665 38.62 33 0.35
Sikkim 92 51 55.43 1.3 1.41 40.3 43.80 0.01 0.01
Tamil Nadu 9564 2500 26.14 159 1.66 6860 71.73 45 0.47
Tripura 608 549 90.30 8 1.32 50.5 8.31 0.2 0.03
25475 21330 83.73 1233 4.84 2895 11.36 17 0.07
1405 766 54.52 69 4.91 568 40.43 1 0.07
West Bengal 13717 10633 77.52 293 2.14 2783 20.29 9 0.07
A & N Islands 59 25 42.37 0.13 0.22 33 55.93 0.02 0.03
Chandigarh 7 0.41 5.86 1.1 15.71 5.2 74.29 0.02 0.29
D & N. Haveli 35 24.02 68.63 0.6 1.71 10 28.57 0.01 0.03
Daman & Diu 13 1.001 7.70 0.31 2.38 12 92.31 0.005 0.04
NCT of Delhi 79 6.8 8.61 15 18.99 59 74.68 0.4 0.51
Lakshadweep 3 0.1 3.33 0.003 0.10 2.4 80.00 0.002 0.07
Puducherry 95 20.03 21.08 2.4 2.53 73 76.84 0.3 0.32
INDIA 167827 106379 63.39 14099 8.40 46941 27.97 408 0.24Source:
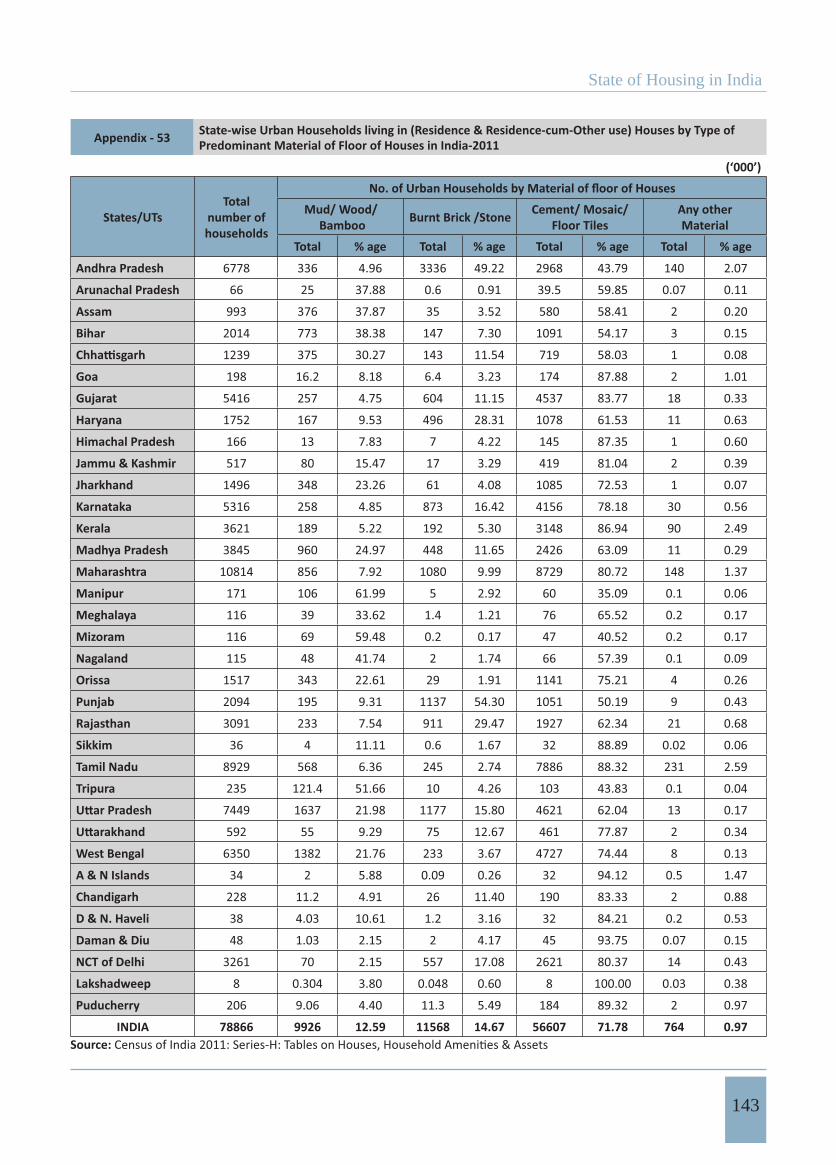
State of Housing in India
143
Appendix - 53 State-wise Urban Households living in (Residence & Residence-cum-Other use) Houses by Type of Predominant Material of Floor of Houses in India-2011
(‘000’)
States/UTsTotal
number of households
Mud/ Wood/ Bamboo Burnt Brick /Stone Cement/ Mosaic/
Floor TilesAny other Material
Total % age Total % age Total % age Total % age
Andhra Pradesh 6778 336 4.96 3336 49.22 2968 43.79 140 2.07
Arunachal Pradesh 66 25 37.88 0.6 0.91 39.5 59.85 0.07 0.11
Assam 993 376 37.87 35 3.52 580 58.41 2 0.20
Bihar 2014 773 38.38 147 7.30 1091 54.17 3 0.15
1239 375 30.27 143 11.54 719 58.03 1 0.08
Goa 198 16.2 8.18 6.4 3.23 174 87.88 2 1.01
Gujarat 5416 257 4.75 604 11.15 4537 83.77 18 0.33
Haryana 1752 167 9.53 496 28.31 1078 61.53 11 0.63
Himachal Pradesh 166 13 7.83 7 4.22 145 87.35 1 0.60
Jammu & Kashmir 517 80 15.47 17 3.29 419 81.04 2 0.39
Jharkhand 1496 348 23.26 61 4.08 1085 72.53 1 0.07
Karnataka 5316 258 4.85 873 16.42 4156 78.18 30 0.56
Kerala 3621 189 5.22 192 5.30 3148 86.94 90 2.49
Madhya Pradesh 3845 960 24.97 448 11.65 2426 63.09 11 0.29
Maharashtra 10814 856 7.92 1080 9.99 8729 80.72 148 1.37
Manipur 171 106 61.99 5 2.92 60 35.09 0.1 0.06
Meghalaya 116 39 33.62 1.4 1.21 76 65.52 0.2 0.17
Mizoram 116 69 59.48 0.2 0.17 47 40.52 0.2 0.17
Nagaland 115 48 41.74 2 1.74 66 57.39 0.1 0.09
Orissa 1517 343 22.61 29 1.91 1141 75.21 4 0.26
Punjab 2094 195 9.31 1137 54.30 1051 50.19 9 0.43
Rajasthan 3091 233 7.54 911 29.47 1927 62.34 21 0.68
Sikkim 36 4 11.11 0.6 1.67 32 88.89 0.02 0.06
Tamil Nadu 8929 568 6.36 245 2.74 7886 88.32 231 2.59
Tripura 235 121.4 51.66 10 4.26 103 43.83 0.1 0.04
7449 1637 21.98 1177 15.80 4621 62.04 13 0.17
592 55 9.29 75 12.67 461 77.87 2 0.34
West Bengal 6350 1382 21.76 233 3.67 4727 74.44 8 0.13
A & N Islands 34 2 5.88 0.09 0.26 32 94.12 0.5 1.47
Chandigarh 228 11.2 4.91 26 11.40 190 83.33 2 0.88
D & N. Haveli 38 4.03 10.61 1.2 3.16 32 84.21 0.2 0.53
Daman & Diu 48 1.03 2.15 2 4.17 45 93.75 0.07 0.15
NCT of Delhi 3261 70 2.15 557 17.08 2621 80.37 14 0.43
Lakshadweep 8 0.304 3.80 0.048 0.60 8 100.00 0.03 0.38
Puducherry 206 9.06 4.40 11.3 5.49 184 89.32 2 0.97
INDIA 78866 9926 12.59 11568 14.67 56607 71.78 764 0.97Source:
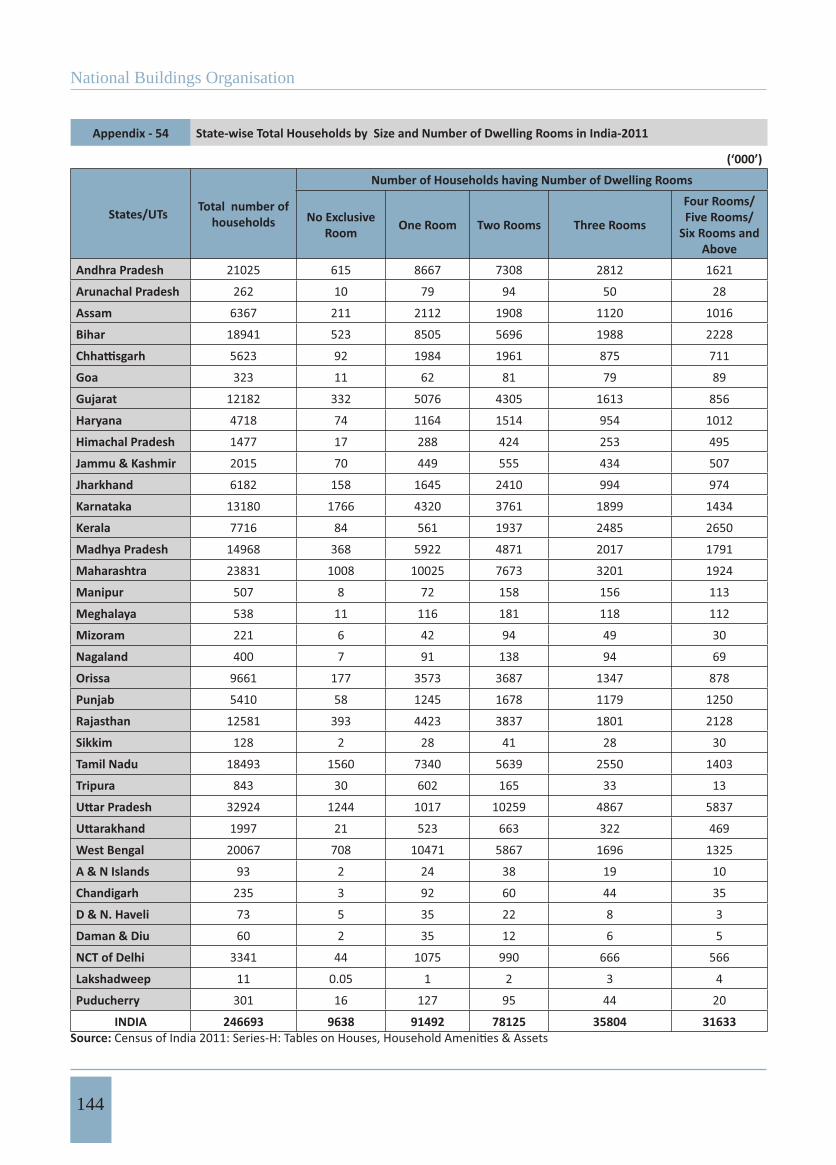
National Buildings Organisation
144
Appendix - 54 State-wise Total Households by Size and Number of Dwelling Rooms in India-2011
(‘000’)
States/UTs Total number of households
Number of Households having Number of Dwelling Rooms
No Exclusive Room One Room Two Rooms Three Rooms
Four Rooms/Five Rooms/
Six Rooms and Above
Andhra Pradesh 21025 615 8667 7308 2812 1621
Arunachal Pradesh 262 10 79 94 50 28
Assam 6367 211 2112 1908 1120 1016
Bihar 18941 523 8505 5696 1988 2228
5623 92 1984 1961 875 711
Goa 323 11 62 81 79 89
Gujarat 12182 332 5076 4305 1613 856
Haryana 4718 74 1164 1514 954 1012
Himachal Pradesh 1477 17 288 424 253 495
Jammu & Kashmir 2015 70 449 555 434 507
Jharkhand 6182 158 1645 2410 994 974
Karnataka 13180 1766 4320 3761 1899 1434
Kerala 7716 84 561 1937 2485 2650
Madhya Pradesh 14968 368 5922 4871 2017 1791
Maharashtra 23831 1008 10025 7673 3201 1924
Manipur 507 8 72 158 156 113
Meghalaya 538 11 116 181 118 112
Mizoram 221 6 42 94 49 30
Nagaland 400 7 91 138 94 69
Orissa 9661 177 3573 3687 1347 878
Punjab 5410 58 1245 1678 1179 1250
Rajasthan 12581 393 4423 3837 1801 2128
Sikkim 128 2 28 41 28 30
Tamil Nadu 18493 1560 7340 5639 2550 1403
Tripura 843 30 602 165 33 13
32924 1244 1017 10259 4867 5837
1997 21 523 663 322 469
West Bengal 20067 708 10471 5867 1696 1325
A & N Islands 93 2 24 38 19 10
Chandigarh 235 3 92 60 44 35
D & N. Haveli 73 5 35 22 8 3
Daman & Diu 60 2 35 12 6 5
NCT of Delhi 3341 44 1075 990 666 566
Lakshadweep 11 0.05 1 2 3 4
Puducherry 301 16 127 95 44 20
INDIA 246693 9638 91492 78125 35804 31633Source:
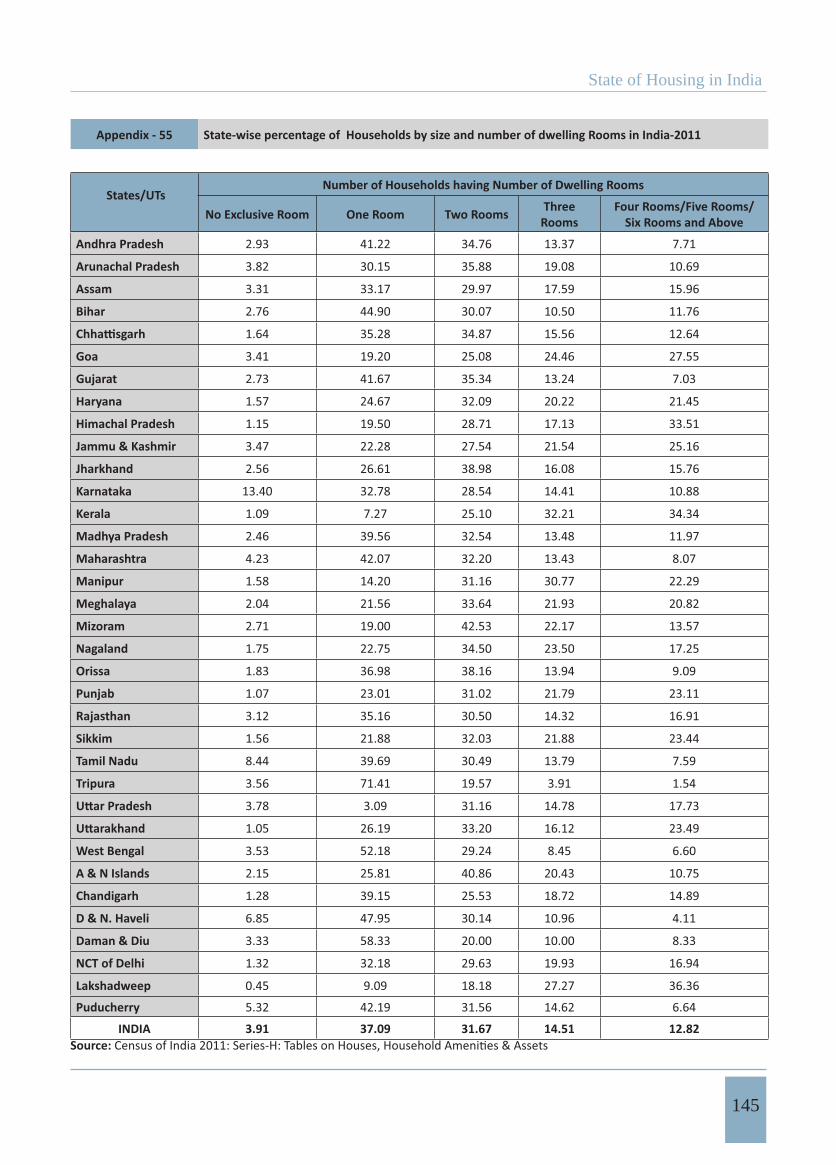
State of Housing in India
145
Appendix - 55 State-wise percentage of Households by size and number of dwelling Rooms in India-2011
States/UTsNumber of Households having Number of Dwelling Rooms
No Exclusive Room One Room Two Rooms Three Rooms
Four Rooms/Five Rooms/ Six Rooms and Above
Andhra Pradesh 2.93 41.22 34.76 13.37 7.71
Arunachal Pradesh 3.82 30.15 35.88 19.08 10.69
Assam 3.31 33.17 29.97 17.59 15.96
Bihar 2.76 44.90 30.07 10.50 11.76
1.64 35.28 34.87 15.56 12.64
Goa 3.41 19.20 25.08 24.46 27.55
Gujarat 2.73 41.67 35.34 13.24 7.03
Haryana 1.57 24.67 32.09 20.22 21.45
Himachal Pradesh 1.15 19.50 28.71 17.13 33.51
Jammu & Kashmir 3.47 22.28 27.54 21.54 25.16
Jharkhand 2.56 26.61 38.98 16.08 15.76
Karnataka 13.40 32.78 28.54 14.41 10.88
Kerala 1.09 7.27 25.10 32.21 34.34
Madhya Pradesh 2.46 39.56 32.54 13.48 11.97
Maharashtra 4.23 42.07 32.20 13.43 8.07
Manipur 1.58 14.20 31.16 30.77 22.29
Meghalaya 2.04 21.56 33.64 21.93 20.82
Mizoram 2.71 19.00 42.53 22.17 13.57
Nagaland 1.75 22.75 34.50 23.50 17.25
Orissa 1.83 36.98 38.16 13.94 9.09
Punjab 1.07 23.01 31.02 21.79 23.11
Rajasthan 3.12 35.16 30.50 14.32 16.91
Sikkim 1.56 21.88 32.03 21.88 23.44
Tamil Nadu 8.44 39.69 30.49 13.79 7.59
Tripura 3.56 71.41 19.57 3.91 1.54
3.78 3.09 31.16 14.78 17.73
1.05 26.19 33.20 16.12 23.49
West Bengal 3.53 52.18 29.24 8.45 6.60
A & N Islands 2.15 25.81 40.86 20.43 10.75
Chandigarh 1.28 39.15 25.53 18.72 14.89
D & N. Haveli 6.85 47.95 30.14 10.96 4.11
Daman & Diu 3.33 58.33 20.00 10.00 8.33
NCT of Delhi 1.32 32.18 29.63 19.93 16.94
Lakshadweep 0.45 9.09 18.18 27.27 36.36
Puducherry 5.32 42.19 31.56 14.62 6.64
INDIA 3.91 37.09 31.67 14.51 12.82Source:

National Buildings Organisation
146
Appendix - 56 State-wise Rural Households by size and Number of Dwelling Rooms in India-2011
(‘000’)
States/UTs Total number of households
Number of Rural Households having Number of Dwelling Room
No Exclusive Room One Room Two Rooms Three Rooms
Four Rooms/Five Rooms/
Six Rooms and Above
Andhra Pradesh 14246 462 6452 5099 1434 799Arunachal Pradesh 196 9 65 68 34 19Assam 5375 190 1871 1631 925 758Bihar 16927 478 7852 5076 1671 1850
4384 74 1646 1547 633 485Goa 125 4 22 32 28 39Gujarat 6765 201 3152 2499 648 266Haryana 2966 43 704 997 581 641Himachal Pradesh 1311 14 242 373 226 455Jammu & Kashmir 1498 55 371 439 314 319Jharkhand 4686 115 1314 1834 721 700Karnataka 7864 1388 2746 2115 901 714Kerala 4096 51 334 1092 1310 1309Madhya Pradesh 11122 317 4951 3629 1277 949Maharashtra 13017 483 5517 4600 1540 877Manipur 336 6 49 109 104 69Meghalaya 422 11 91 148 94 79Mizoram 105 4 27 46 20 7Nagaland 285 6 65 104 69 41Orissa 8144 151 3144 3177 1051 620Punjab 3316 31 716 1066 728 774Rajasthan 9490 342 3623 2939 1216 1371Sikkim 92 1 16 30 23 22Tamil Nadu 9564 1142 4059 2816 1022 524Tripura 608 22 456 110 16 4.5
25475 1065 8388 7983 3627 44131405 15 350 480 211 349
West Bengal 13717 519 7824 3855 837 683A & N Islands 59 2 15 24 12 5Chandigarh 7 0.08 5 1 0.5 0.6D & N. Haveli 35 2 16 12 4 1.4Daman & Diu 13 0.5 5 4 2 1.6NCT of Delhi 79 1 23 22 16 18Lakshadweep 3 0.02 0.2 0.5 0.6 1.3Puducherry 95 6 44 30 11 4.3
INDIA 167827 7212 66155 53988 21309 19163Source:

State of Housing in India
147
Appendix- 57 State-wise percentage of Rural Households by size and number of Dwelling Rooms in India-2011
States/UTsPercentage of Rural Households by Number of Dwelling Rooms
No Exclusive Room One Room Two Rooms Three RoomsFour Rooms/Five
Rooms/ Six Rooms and Above
Andhra Pradesh 3.24 45.29 35.79 10.07 5.61
Arunachal Pradesh 4.59 33.16 34.69 17.35 9.69
Assam 3.53 34.81 30.34 17.21 14.10
Bihar 2.82 46.39 29.99 9.87 10.93
1.69 37.55 35.29 14.44 11.06
Goa 3.20 17.60 25.60 22.40 31.20
Gujarat 2.97 46.59 36.94 9.58 3.93
Haryana 1.45 23.74 33.61 19.59 21.61
Himachal Pradesh 1.07 18.46 28.45 17.24 34.71
Jammu & Kashmir 3.67 24.77 29.31 20.96 21.30
Jharkhand 2.45 28.04 39.14 15.39 14.94
Karnataka 17.65 34.92 26.89 11.46 9.08
Kerala 1.25 8.15 26.66 31.98 31.96
Madhya Pradesh 2.85 44.52 32.63 11.48 8.53
Maharashtra 3.71 42.38 35.34 11.83 6.74
Manipur 1.79 14.58 32.44 30.95 20.54
Meghalaya 2.61 21.56 35.07 22.27 18.72
Mizoram 3.81 25.71 43.81 19.05 6.67
Nagaland 2.11 22.81 36.49 24.21 14.39
Orissa 1.85 38.61 39.01 12.91 7.61
Punjab 0.93 21.59 32.15 21.95 23.34
Rajasthan 3.60 38.18 30.97 12.81 14.45
Sikkim 1.09 17.39 32.61 25.00 23.91
Tamil Nadu 11.94 42.44 29.44 10.69 5.48
Tripura 3.62 75.00 18.09 2.63 0.74
4.18 32.93 31.34 14.24 17.32
1.07 24.91 34.16 15.02 24.84
West Bengal 3.78 57.04 28.10 6.10 4.98
A & N Islands 3.39 25.42 40.68 20.34 8.47
Chandigarh 1.14 71.43 14.29 7.14 8.57
D & N. Haveli 5.71 45.71 34.29 11.43 4.00
Daman & Diu 3.85 38.46 30.77 15.38 12.31
NCT of Delhi 1.27 29.11 27.85 20.25 22.78
Lakshadweep 0.67 6.67 16.67 20.00 43.33
Puducherry 6.32 46.32 31.58 11.58 4.53
INDIA 4.30 39.42 32.17 12.70 11.42Source:
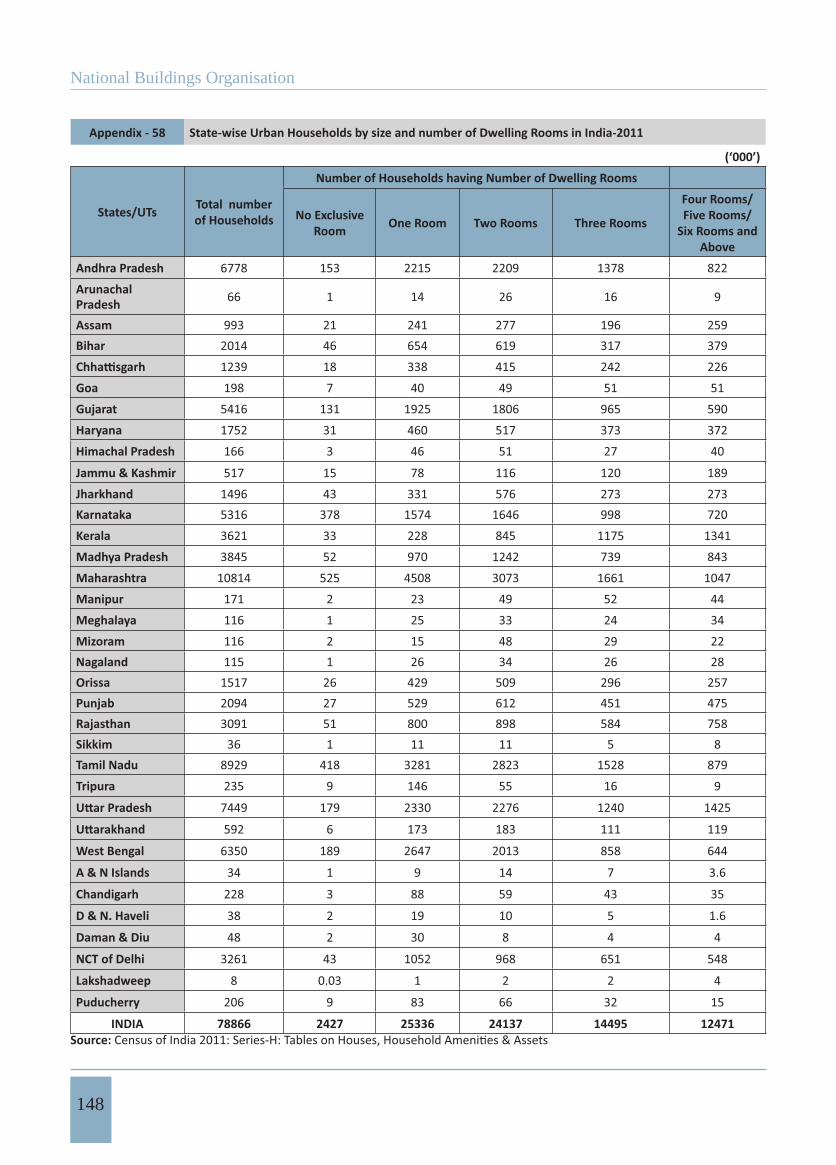
National Buildings Organisation
148
Appendix - 58 State-wise Urban Households by size and number of Dwelling Rooms in India-2011
(‘000’)
States/UTs Total number of Households
Number of Households having Number of Dwelling Rooms
No Exclusive Room One Room Two Rooms Three Rooms
Four Rooms/Five Rooms/
Six Rooms and Above
Andhra Pradesh 6778 153 2215 2209 1378 822ArunachalPradesh 66 1 14 26 16 9
Assam 993 21 241 277 196 259Bihar 2014 46 654 619 317 379
1239 18 338 415 242 226Goa 198 7 40 49 51 51Gujarat 5416 131 1925 1806 965 590Haryana 1752 31 460 517 373 372Himachal Pradesh 166 3 46 51 27 40
Jammu & Kashmir 517 15 78 116 120 189Jharkhand 1496 43 331 576 273 273Karnataka 5316 378 1574 1646 998 720Kerala 3621 33 228 845 1175 1341Madhya Pradesh 3845 52 970 1242 739 843Maharashtra 10814 525 4508 3073 1661 1047Manipur 171 2 23 49 52 44Meghalaya 116 1 25 33 24 34Mizoram 116 2 15 48 29 22Nagaland 115 1 26 34 26 28Orissa 1517 26 429 509 296 257Punjab 2094 27 529 612 451 475Rajasthan 3091 51 800 898 584 758Sikkim 36 1 11 11 5 8Tamil Nadu 8929 418 3281 2823 1528 879Tripura 235 9 146 55 16 9
7449 179 2330 2276 1240 1425
592 6 173 183 111 119
West Bengal 6350 189 2647 2013 858 644
A & N Islands 34 1 9 14 7 3.6
Chandigarh 228 3 88 59 43 35
D & N. Haveli 38 2 19 10 5 1.6
Daman & Diu 48 2 30 8 4 4
NCT of Delhi 3261 43 1052 968 651 548
Lakshadweep 8 0.03 1 2 2 4
Puducherry 206 9 83 66 32 15
INDIA 78866 2427 25336 24137 14495 12471Source:

State of Housing in India
149
Appendix - 59 State-wise percentage of Urban Households Size and Number of Dwelling Rooms in india 2011
States/UTs
Percentage of Urban Households by Number of Dwelling Rooms
No Exclusive Room One Room Two Rooms Three RoomsFour Rooms/Five
Rooms/ Six Rooms and Above
Andhra Pradesh 2.26 32.68 32.59 20.33 12.13
Arunachal Pradesh 1.52 21.21 39.39 24.24 13.64
Assam 2.11 24.27 27.90 19.74 26.08
Bihar 2.28 32.47 30.73 15.74 18.82
1.45 27.28 33.49 19.53 18.24
Goa 3.54 20.20 24.75 25.76 25.76
Gujarat 2.42 35.54 33.35 17.82 10.89
Haryana 1.77 26.26 29.51 21.29 21.23
Himachal Pradesh 1.81 27.71 30.72 16.27 24.10
Jammu & Kashmir 2.90 15.09 22.44 23.21 36.56
Jharkhand 2.87 22.13 38.50 18.25 18.25
Karnataka 7.11 29.61 30.96 18.77 13.54
Kerala 0.91 6.30 23.34 32.45 37.03
Madhya Pradesh 1.35 25.23 32.30 19.22 21.92
Maharashtra 4.85 41.69 28.42 15.36 9.68
Manipur 1.17 13.45 28.65 30.41 25.73
Meghalaya 0.86 21.55 28.45 20.69 29.31
Mizoram 1.72 12.93 41.38 25.00 18.97
Nagaland 0.87 22.61 29.57 22.61 24.35
Orissa 1.71 28.28 33.55 19.51 16.94
Punjab 1.29 25.26 29.23 21.54 22.68
Rajasthan 1.65 25.88 29.05 18.89 24.52
Sikkim 2.78 30.56 30.56 13.89 22.22
Tamil Nadu 4.68 36.75 31.62 17.11 9.84
Tripura 3.83 62.13 23.40 6.81 3.83
2.40 31.28 30.55 16.65 19.13
1.01 29.22 30.91 18.75 20.10
West Bengal 2.98 41.69 31.70 13.51 10.14
A & N Islands 2.94 26.47 41.18 20.59 10.59
Chandigarh 1.32 38.60 25.88 18.86 15.35
D & N. Haveli 5.26 50.00 26.32 13.16 4.21
Daman & Diu 4.17 62.50 16.67 8.33 8.33
NCT of Delhi 1.32 32.26 29.68 19.96 16.80
Lakshadweep 0.38 12.50 25.00 25.00 50.00
Puducherry 4.37 40.29 32.04 15.53 7.28
INDIA 3.08 32.13 30.61 18.38 15.81Source:
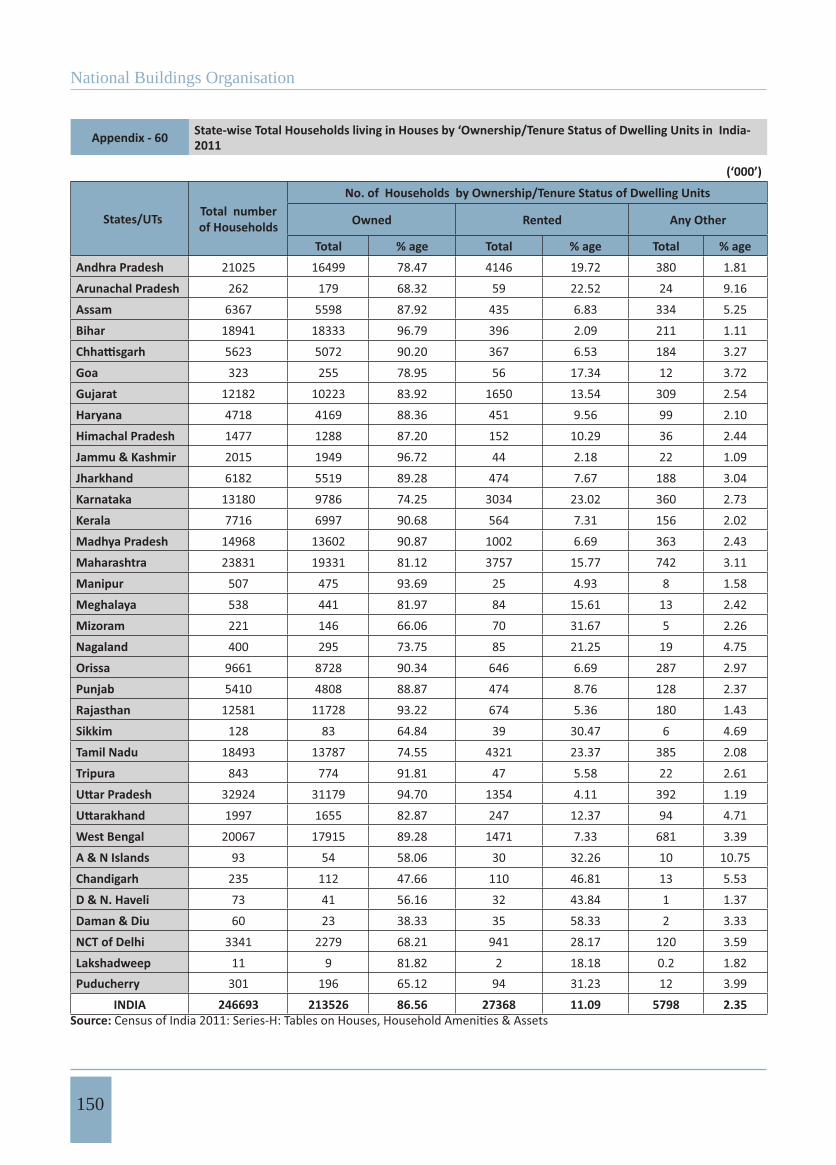
National Buildings Organisation
150
Appendix - 60 State-wise Total Households living in Houses by ‘Ownership/Tenure Status of Dwelling Units in India-2011
(‘000’)
States/UTs Total number of Households
No. of Households by Ownership/Tenure Status of Dwelling Units
Owned Rented Any Other
Total % age Total % age Total % age
Andhra Pradesh 21025 16499 78.47 4146 19.72 380 1.81Arunachal Pradesh 262 179 68.32 59 22.52 24 9.16Assam 6367 5598 87.92 435 6.83 334 5.25Bihar 18941 18333 96.79 396 2.09 211 1.11
5623 5072 90.20 367 6.53 184 3.27Goa 323 255 78.95 56 17.34 12 3.72Gujarat 12182 10223 83.92 1650 13.54 309 2.54Haryana 4718 4169 88.36 451 9.56 99 2.10Himachal Pradesh 1477 1288 87.20 152 10.29 36 2.44Jammu & Kashmir 2015 1949 96.72 44 2.18 22 1.09Jharkhand 6182 5519 89.28 474 7.67 188 3.04Karnataka 13180 9786 74.25 3034 23.02 360 2.73Kerala 7716 6997 90.68 564 7.31 156 2.02Madhya Pradesh 14968 13602 90.87 1002 6.69 363 2.43Maharashtra 23831 19331 81.12 3757 15.77 742 3.11Manipur 507 475 93.69 25 4.93 8 1.58Meghalaya 538 441 81.97 84 15.61 13 2.42Mizoram 221 146 66.06 70 31.67 5 2.26Nagaland 400 295 73.75 85 21.25 19 4.75Orissa 9661 8728 90.34 646 6.69 287 2.97Punjab 5410 4808 88.87 474 8.76 128 2.37Rajasthan 12581 11728 93.22 674 5.36 180 1.43Sikkim 128 83 64.84 39 30.47 6 4.69Tamil Nadu 18493 13787 74.55 4321 23.37 385 2.08Tripura 843 774 91.81 47 5.58 22 2.61
32924 31179 94.70 1354 4.11 392 1.191997 1655 82.87 247 12.37 94 4.71
West Bengal 20067 17915 89.28 1471 7.33 681 3.39A & N Islands 93 54 58.06 30 32.26 10 10.75Chandigarh 235 112 47.66 110 46.81 13 5.53D & N. Haveli 73 41 56.16 32 43.84 1 1.37Daman & Diu 60 23 38.33 35 58.33 2 3.33NCT of Delhi 3341 2279 68.21 941 28.17 120 3.59Lakshadweep 11 9 81.82 2 18.18 0.2 1.82Puducherry 301 196 65.12 94 31.23 12 3.99
INDIA 246693 213526 86.56 27368 11.09 5798 2.35Source:
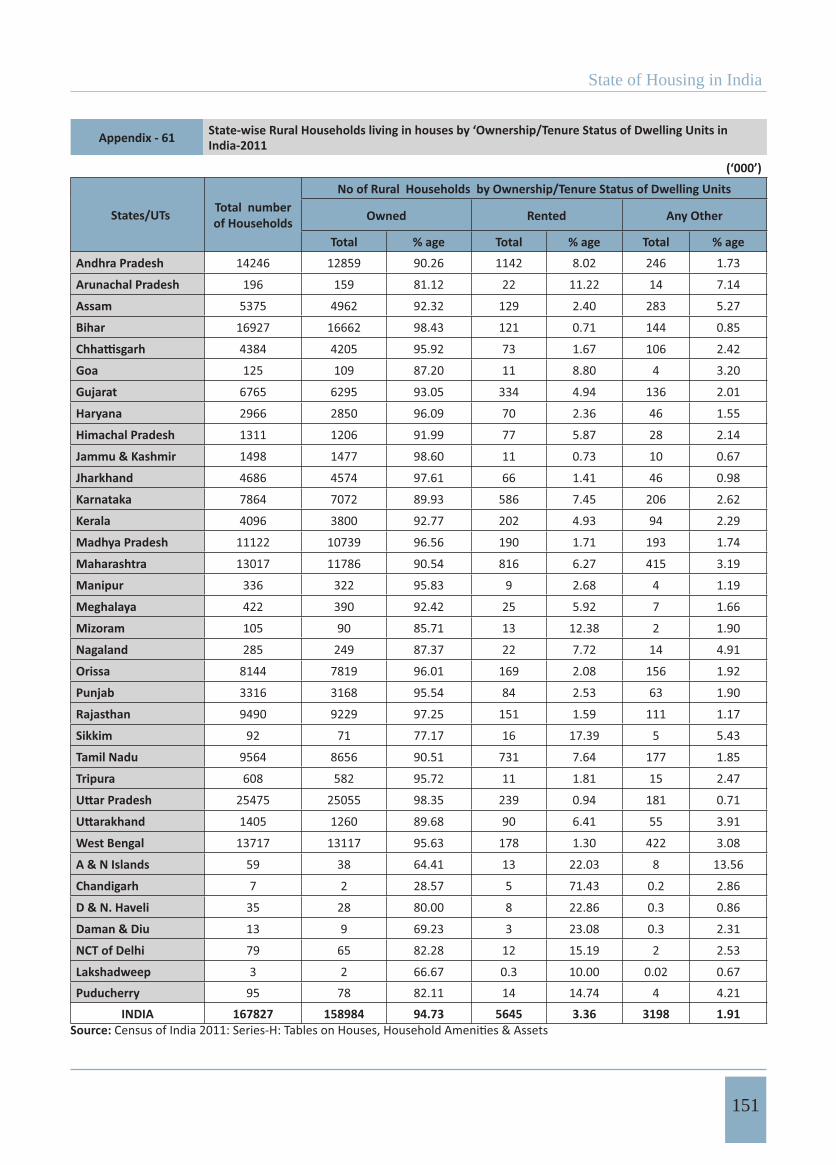
State of Housing in India
151
Appendix - 61 State-wise Rural Households living in houses by ‘Ownership/Tenure Status of Dwelling Units in India-2011
(‘000’)
States/UTs Total number of Households
No of Rural Households by Ownership/Tenure Status of Dwelling Units
Owned Rented Any Other
Total % age Total % age Total % age
Andhra Pradesh 14246 12859 90.26 1142 8.02 246 1.73
Arunachal Pradesh 196 159 81.12 22 11.22 14 7.14
Assam 5375 4962 92.32 129 2.40 283 5.27
Bihar 16927 16662 98.43 121 0.71 144 0.85
4384 4205 95.92 73 1.67 106 2.42
Goa 125 109 87.20 11 8.80 4 3.20
Gujarat 6765 6295 93.05 334 4.94 136 2.01
Haryana 2966 2850 96.09 70 2.36 46 1.55
Himachal Pradesh 1311 1206 91.99 77 5.87 28 2.14
Jammu & Kashmir 1498 1477 98.60 11 0.73 10 0.67
Jharkhand 4686 4574 97.61 66 1.41 46 0.98
Karnataka 7864 7072 89.93 586 7.45 206 2.62
Kerala 4096 3800 92.77 202 4.93 94 2.29
Madhya Pradesh 11122 10739 96.56 190 1.71 193 1.74
Maharashtra 13017 11786 90.54 816 6.27 415 3.19
Manipur 336 322 95.83 9 2.68 4 1.19
Meghalaya 422 390 92.42 25 5.92 7 1.66
Mizoram 105 90 85.71 13 12.38 2 1.90
Nagaland 285 249 87.37 22 7.72 14 4.91
Orissa 8144 7819 96.01 169 2.08 156 1.92
Punjab 3316 3168 95.54 84 2.53 63 1.90
Rajasthan 9490 9229 97.25 151 1.59 111 1.17
Sikkim 92 71 77.17 16 17.39 5 5.43
Tamil Nadu 9564 8656 90.51 731 7.64 177 1.85
Tripura 608 582 95.72 11 1.81 15 2.47
25475 25055 98.35 239 0.94 181 0.71
1405 1260 89.68 90 6.41 55 3.91
West Bengal 13717 13117 95.63 178 1.30 422 3.08
A & N Islands 59 38 64.41 13 22.03 8 13.56
Chandigarh 7 2 28.57 5 71.43 0.2 2.86
D & N. Haveli 35 28 80.00 8 22.86 0.3 0.86
Daman & Diu 13 9 69.23 3 23.08 0.3 2.31
NCT of Delhi 79 65 82.28 12 15.19 2 2.53
Lakshadweep 3 2 66.67 0.3 10.00 0.02 0.67Puducherry 95 78 82.11 14 14.74 4 4.21
INDIA 167827 158984 94.73 5645 3.36 3198 1.91Source:
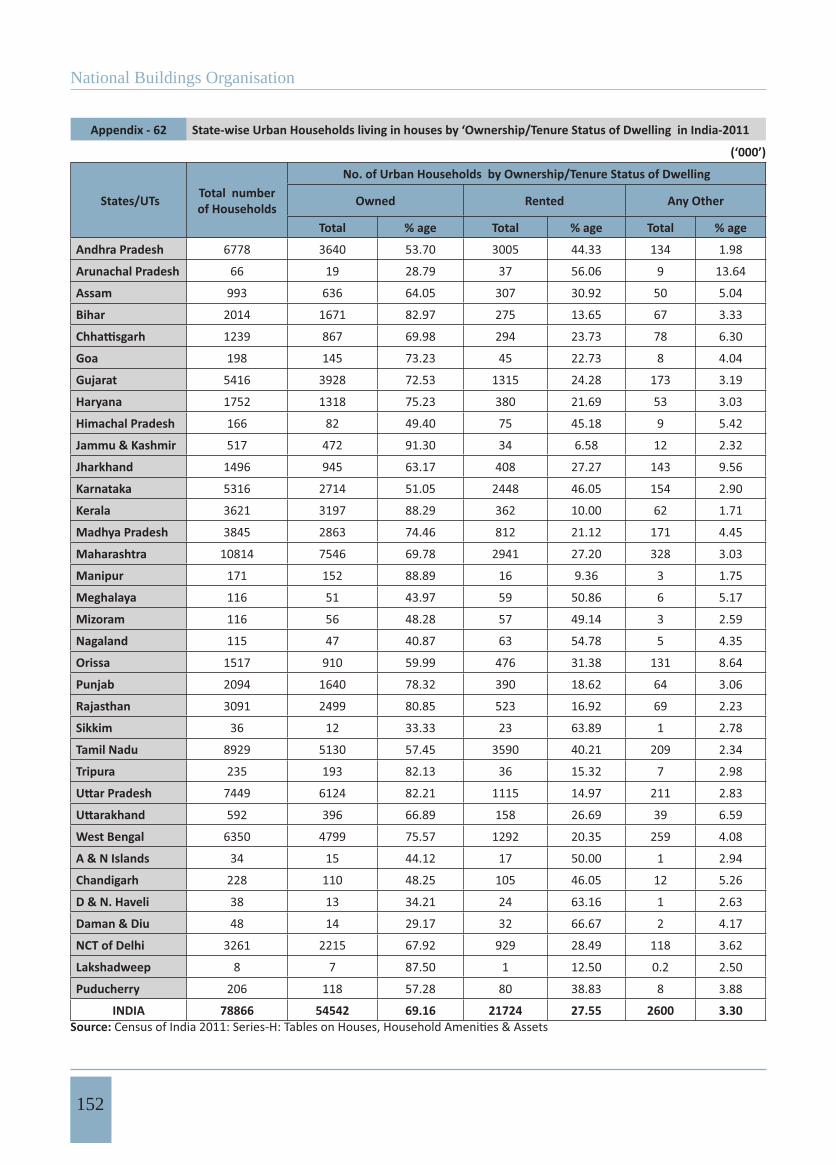
National Buildings Organisation
152
Appendix - 62 State-wise Urban Households living in houses by ‘Ownership/Tenure Status of Dwelling in India-2011
(‘000’)
States/UTs Total number of Households
No. of Urban Households by Ownership/Tenure Status of Dwelling
Owned Rented Any Other
Total % age Total % age Total % age
Andhra Pradesh 6778 3640 53.70 3005 44.33 134 1.98
Arunachal Pradesh 66 19 28.79 37 56.06 9 13.64
Assam 993 636 64.05 307 30.92 50 5.04
Bihar 2014 1671 82.97 275 13.65 67 3.33
1239 867 69.98 294 23.73 78 6.30
Goa 198 145 73.23 45 22.73 8 4.04
Gujarat 5416 3928 72.53 1315 24.28 173 3.19
Haryana 1752 1318 75.23 380 21.69 53 3.03
Himachal Pradesh 166 82 49.40 75 45.18 9 5.42
Jammu & Kashmir 517 472 91.30 34 6.58 12 2.32
Jharkhand 1496 945 63.17 408 27.27 143 9.56
Karnataka 5316 2714 51.05 2448 46.05 154 2.90
Kerala 3621 3197 88.29 362 10.00 62 1.71
Madhya Pradesh 3845 2863 74.46 812 21.12 171 4.45
Maharashtra 10814 7546 69.78 2941 27.20 328 3.03
Manipur 171 152 88.89 16 9.36 3 1.75
Meghalaya 116 51 43.97 59 50.86 6 5.17
Mizoram 116 56 48.28 57 49.14 3 2.59
Nagaland 115 47 40.87 63 54.78 5 4.35
Orissa 1517 910 59.99 476 31.38 131 8.64
Punjab 2094 1640 78.32 390 18.62 64 3.06
Rajasthan 3091 2499 80.85 523 16.92 69 2.23
Sikkim 36 12 33.33 23 63.89 1 2.78
Tamil Nadu 8929 5130 57.45 3590 40.21 209 2.34
Tripura 235 193 82.13 36 15.32 7 2.98
7449 6124 82.21 1115 14.97 211 2.83
592 396 66.89 158 26.69 39 6.59
West Bengal 6350 4799 75.57 1292 20.35 259 4.08
A & N Islands 34 15 44.12 17 50.00 1 2.94
Chandigarh 228 110 48.25 105 46.05 12 5.26
D & N. Haveli 38 13 34.21 24 63.16 1 2.63
Daman & Diu 48 14 29.17 32 66.67 2 4.17
NCT of Delhi 3261 2215 67.92 929 28.49 118 3.62
Lakshadweep 8 7 87.50 1 12.50 0.2 2.50
Puducherry 206 118 57.28 80 38.83 8 3.88
INDIA 78866 54542 69.16 21724 27.55 2600 3.30Source:
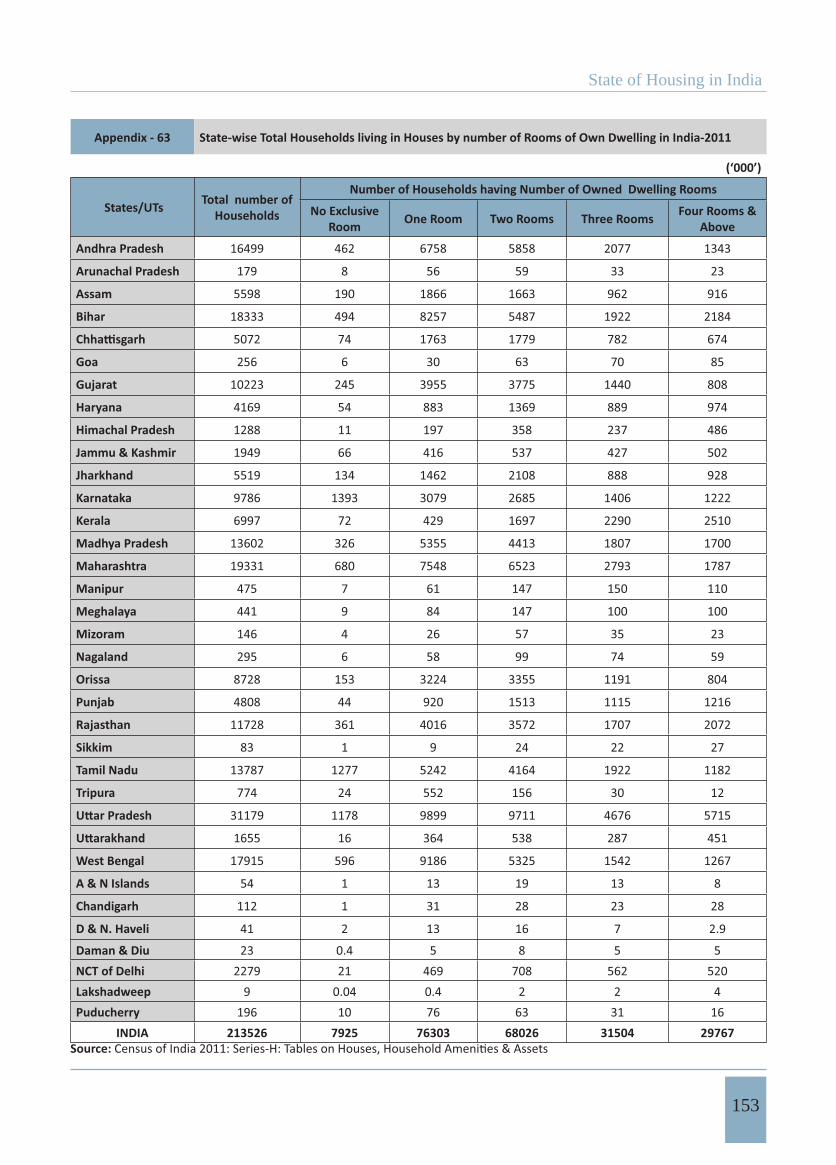
State of Housing in India
153
Appendix - 63 State-wise Total Households living in Houses by number of Rooms of Own Dwelling in India-2011
(‘000’)
States/UTs Total number of Households
Number of Households having Number of Owned Dwelling Rooms
No Exclusive Room One Room Two Rooms Three Rooms Four Rooms &
Above
Andhra Pradesh 16499 462 6758 5858 2077 1343
Arunachal Pradesh 179 8 56 59 33 23
Assam 5598 190 1866 1663 962 916
Bihar 18333 494 8257 5487 1922 2184
5072 74 1763 1779 782 674
Goa 256 6 30 63 70 85
Gujarat 10223 245 3955 3775 1440 808
Haryana 4169 54 883 1369 889 974
Himachal Pradesh 1288 11 197 358 237 486
Jammu & Kashmir 1949 66 416 537 427 502
Jharkhand 5519 134 1462 2108 888 928
Karnataka 9786 1393 3079 2685 1406 1222
Kerala 6997 72 429 1697 2290 2510
Madhya Pradesh 13602 326 5355 4413 1807 1700
Maharashtra 19331 680 7548 6523 2793 1787
Manipur 475 7 61 147 150 110
Meghalaya 441 9 84 147 100 100
Mizoram 146 4 26 57 35 23
Nagaland 295 6 58 99 74 59
Orissa 8728 153 3224 3355 1191 804
Punjab 4808 44 920 1513 1115 1216
Rajasthan 11728 361 4016 3572 1707 2072
Sikkim 83 1 9 24 22 27
Tamil Nadu 13787 1277 5242 4164 1922 1182
Tripura 774 24 552 156 30 12
31179 1178 9899 9711 4676 5715
1655 16 364 538 287 451
West Bengal 17915 596 9186 5325 1542 1267
A & N Islands 54 1 13 19 13 8
Chandigarh 112 1 31 28 23 28
D & N. Haveli 41 2 13 16 7 2.9
Daman & Diu 23 0.4 5 8 5 5NCT of Delhi 2279 21 469 708 562 520Lakshadweep 9 0.04 0.4 2 2 4Puducherry 196 10 76 63 31 16
INDIA 213526 7925 76303 68026 31504 29767Source:
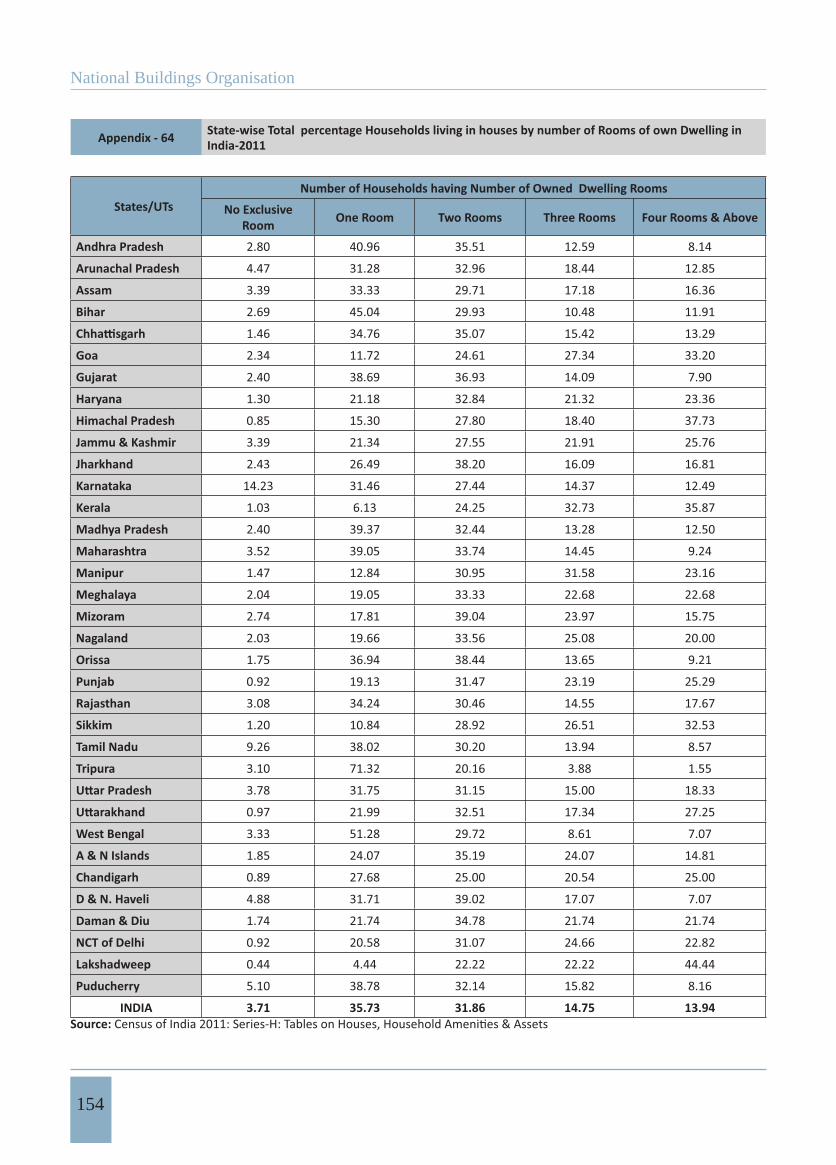
National Buildings Organisation
154
Appendix - 64 State-wise Total percentage Households living in houses by number of Rooms of own Dwelling in India-2011
States/UTsNumber of Households having Number of Owned Dwelling Rooms
No Exclusive Room One Room Two Rooms Three Rooms Four Rooms & Above
Andhra Pradesh 2.80 40.96 35.51 12.59 8.14
Arunachal Pradesh 4.47 31.28 32.96 18.44 12.85
Assam 3.39 33.33 29.71 17.18 16.36
Bihar 2.69 45.04 29.93 10.48 11.91
1.46 34.76 35.07 15.42 13.29
Goa 2.34 11.72 24.61 27.34 33.20
Gujarat 2.40 38.69 36.93 14.09 7.90
Haryana 1.30 21.18 32.84 21.32 23.36
Himachal Pradesh 0.85 15.30 27.80 18.40 37.73
Jammu & Kashmir 3.39 21.34 27.55 21.91 25.76
Jharkhand 2.43 26.49 38.20 16.09 16.81
Karnataka 14.23 31.46 27.44 14.37 12.49
Kerala 1.03 6.13 24.25 32.73 35.87
Madhya Pradesh 2.40 39.37 32.44 13.28 12.50
Maharashtra 3.52 39.05 33.74 14.45 9.24
Manipur 1.47 12.84 30.95 31.58 23.16
Meghalaya 2.04 19.05 33.33 22.68 22.68
Mizoram 2.74 17.81 39.04 23.97 15.75
Nagaland 2.03 19.66 33.56 25.08 20.00
Orissa 1.75 36.94 38.44 13.65 9.21
Punjab 0.92 19.13 31.47 23.19 25.29
Rajasthan 3.08 34.24 30.46 14.55 17.67
Sikkim 1.20 10.84 28.92 26.51 32.53
Tamil Nadu 9.26 38.02 30.20 13.94 8.57
Tripura 3.10 71.32 20.16 3.88 1.55
3.78 31.75 31.15 15.00 18.33
0.97 21.99 32.51 17.34 27.25
West Bengal 3.33 51.28 29.72 8.61 7.07
A & N Islands 1.85 24.07 35.19 24.07 14.81
Chandigarh 0.89 27.68 25.00 20.54 25.00
D & N. Haveli 4.88 31.71 39.02 17.07 7.07
Daman & Diu 1.74 21.74 34.78 21.74 21.74
NCT of Delhi 0.92 20.58 31.07 24.66 22.82
Lakshadweep 0.44 4.44 22.22 22.22 44.44
Puducherry 5.10 38.78 32.14 15.82 8.16
INDIA 3.71 35.73 31.86 14.75 13.94Source:

State of Housing in India
155
Appendix - 65 State-wise Rural Households living in houses by number of Rooms of Rented Dwelling in India-2011
(‘000’)
States/UTs Total number of Households
Number of Households having Number of Rented Dwelling Rooms
No Exclusive Room One Room Two Rooms Three Rooms Four Rooms &
Above
Andhra Pradesh 4146 111 1692 1380 704 259
Arunachal Pradesh 59 1 16 26 12 3
Assam 435 11 165 142 73 44
Bihar 396 11 142 156 57 30
367 7 134 132 68 25
Goa 56 4 26 16 8 2.8
Gujarat 1650 67 940 455 149 39
Haryana 451 13 234 119 52 31
Himachal Pradesh 152 4 73 56 14 6
Jammu & Kashmir 44 2 21 13 5 3.5
Jharkhand 474 16 135 218 73 31
Karnataka 3034 298 1105 991 452 187
Kerala 564 7 87 192 163 114
Madhya Pradesh 1002 20 403 356 158 65
Maharashtra 3757 259 2053 991 343 111
Manipur 25 1 8 9 5 2.9
Meghalaya 84 2 29 30 15 9
Mizoram 70 2 14 35 13 5.5
Nagaland 85 1 27 32 16 9
Orissa 646 13 212 240 124 58
Punjab 474 9 263 130 49 23
Rajasthan 674 17 325 214 75 42
Sikkim 39 1 16 15 5 2.8
Tamil Nadu 4321 236 1914 1382 586 204
Tripura 47 3 34 7 2 1.2
1354 38 650 433 145 88
247 3 120 92 23 9
West Bengal 1471 63 876 386 107 39
A & N Islands 30 0.6 9 15 4 1.2
Chandigarh 110 2 53 29 20 8
D & N. Haveli 31 3 21 6 2 0.26
Daman & Diu 35 2 29 3 1 0.28
NCT of Delhi 941 18 537 254 93 41
Lakshadweep 2 0.01 0.3 0.5 0.5 0.25
Puducherry 94 5 45 30 11 2.7
INDIA 27368 1250 12408 8586 3627 1498Source:
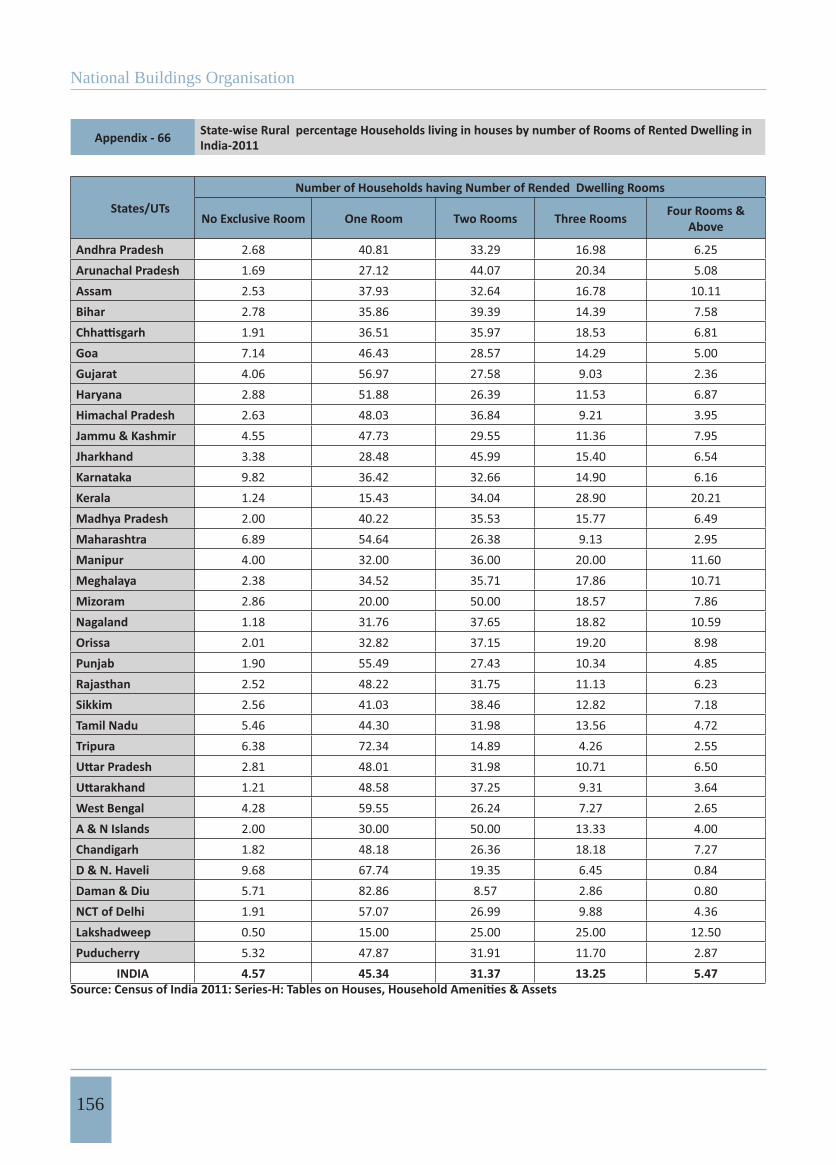
National Buildings Organisation
156
Appendix - 66 State-wise Rural percentage Households living in houses by number of Rooms of Rented Dwelling in India-2011
States/UTsNumber of Households having Number of Rended Dwelling Rooms
No Exclusive Room One Room Two Rooms Three Rooms Four Rooms & Above
Andhra Pradesh 2.68 40.81 33.29 16.98 6.25Arunachal Pradesh 1.69 27.12 44.07 20.34 5.08Assam 2.53 37.93 32.64 16.78 10.11Bihar 2.78 35.86 39.39 14.39 7.58
1.91 36.51 35.97 18.53 6.81Goa 7.14 46.43 28.57 14.29 5.00Gujarat 4.06 56.97 27.58 9.03 2.36Haryana 2.88 51.88 26.39 11.53 6.87Himachal Pradesh 2.63 48.03 36.84 9.21 3.95Jammu & Kashmir 4.55 47.73 29.55 11.36 7.95Jharkhand 3.38 28.48 45.99 15.40 6.54Karnataka 9.82 36.42 32.66 14.90 6.16Kerala 1.24 15.43 34.04 28.90 20.21Madhya Pradesh 2.00 40.22 35.53 15.77 6.49Maharashtra 6.89 54.64 26.38 9.13 2.95Manipur 4.00 32.00 36.00 20.00 11.60Meghalaya 2.38 34.52 35.71 17.86 10.71Mizoram 2.86 20.00 50.00 18.57 7.86Nagaland 1.18 31.76 37.65 18.82 10.59Orissa 2.01 32.82 37.15 19.20 8.98Punjab 1.90 55.49 27.43 10.34 4.85Rajasthan 2.52 48.22 31.75 11.13 6.23Sikkim 2.56 41.03 38.46 12.82 7.18Tamil Nadu 5.46 44.30 31.98 13.56 4.72Tripura 6.38 72.34 14.89 4.26 2.55
2.81 48.01 31.98 10.71 6.501.21 48.58 37.25 9.31 3.64
West Bengal 4.28 59.55 26.24 7.27 2.65A & N Islands 2.00 30.00 50.00 13.33 4.00Chandigarh 1.82 48.18 26.36 18.18 7.27D & N. Haveli 9.68 67.74 19.35 6.45 0.84Daman & Diu 5.71 82.86 8.57 2.86 0.80NCT of Delhi 1.91 57.07 26.99 9.88 4.36Lakshadweep 0.50 15.00 25.00 25.00 12.50Puducherry 5.32 47.87 31.91 11.70 2.87
INDIA 4.57 45.34 31.37 13.25 5.47

State of Housing in India
157
Appendix - 67 State-wise Urban Households living in houses by number of Rooms of Any Other Dwelling in India-2011
(‘000’)
States/UTs Total number of households
Number of Households having Number of Any Other Dwelling Rooms
No Exclusive Room One Room Two Rooms Three Rooms Four Rooms &
Above
Andhra Pradesh 380 42 218 71 31 18
Arunachal Pradesh 24 1 6 9 5 1.5
Assam 334 10 81 103 85 55
Bihar 211 19 107 52 20 14
184 11 86 50 25 12
Goa 12 1 6 2 1 0.9
Gujarat 309 20 182 74 24 9
Haryana 99 6 47 26 13 6
Himachal Pradesh 36 2 19 10 3 3.4
Jammu & Kashmir 22 2 12 5 2 1.5
Jharkhand 188 8 48 84 33 15
Karnataka 360 75 135 85 41 24
Kerala 156 5 44 48 32 27
Madhya Pradesh 363 22 163 102 52 24
Maharashtra 742 69 424 158 65 26
Manipur 8 0.4 3 2 1 1.3
Meghalaya 13 0.4 4 4 3 1.9
Mizoram 5 0.3 1 2 1 0.56
Nagaland 19 0.4 5 7 4 1.7
Orissa 287 11 137 92 32 15
Punjab 128 5 62 35 16 9
Rajasthan 180 15 82 51 18 13
Sikkim 6 0.2 2 2 1 0.6
Tamil Nadu 385 47 184 94 42 19
Tripura 22 3 16 2 0.4 0.17
392 29 168 115 46 29
94 2 40 33 12 7
West Bengal 681 50 409 157 47 20
A & N Islands 10 1 3 3 2 0.46
Chandigarh 13 0.4 8 2 1 0.5
D & N. Haveli 1 0.3 0.6 0.2 0.1 0.044
Daman & Diu 2 0.1 1 0.3 0.1 0.08
NCT of Delhi 120 5 70 28 12 5
Lakshadweep 0.2 0.003 0.03 0.04 0.04 0.07
Puducherry 12 1 7 3 1 0.7
INDIA 5798 463 2781 1512 673 369Source:
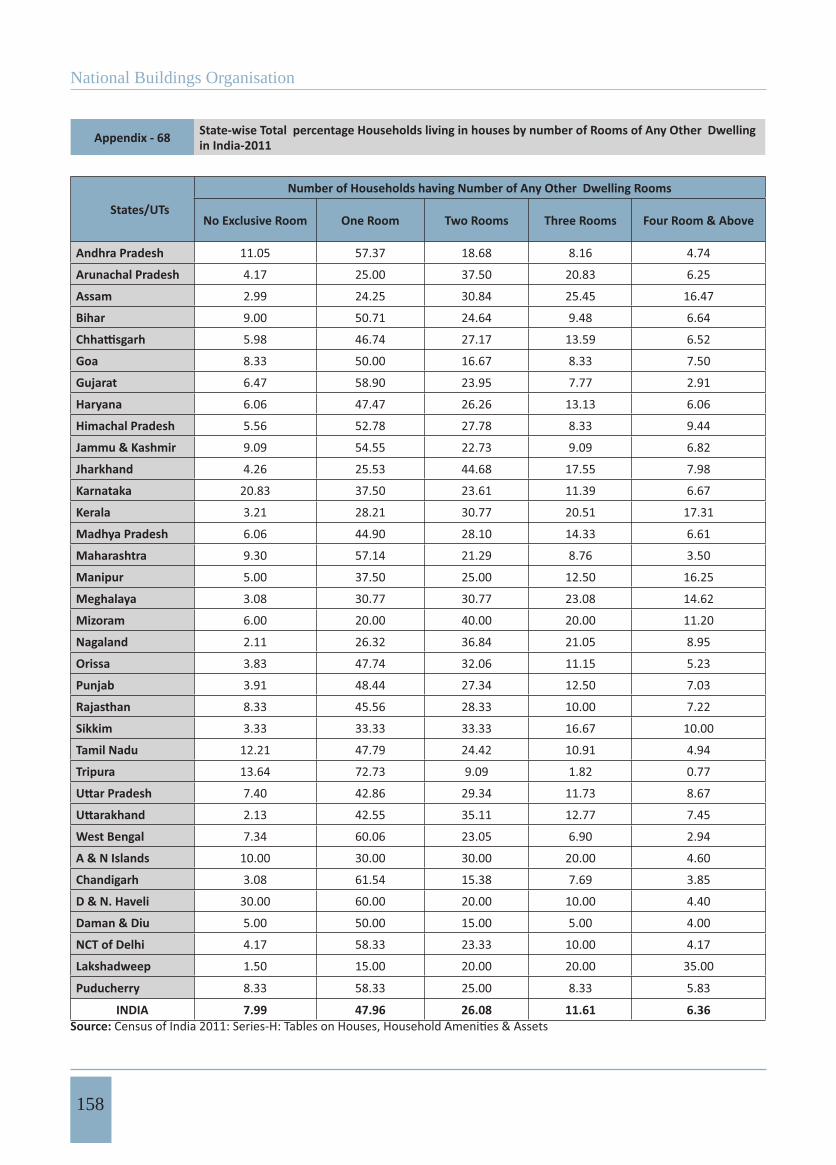
National Buildings Organisation
158
Appendix - 68 State-wise Total percentage Households living in houses by number of Rooms of Any Other Dwelling in India-2011
States/UTs
Number of Households having Number of Any Other Dwelling Rooms
No Exclusive Room One Room Two Rooms Three Rooms Four Room & Above
Andhra Pradesh 11.05 57.37 18.68 8.16 4.74
Arunachal Pradesh 4.17 25.00 37.50 20.83 6.25
Assam 2.99 24.25 30.84 25.45 16.47
Bihar 9.00 50.71 24.64 9.48 6.64
5.98 46.74 27.17 13.59 6.52
Goa 8.33 50.00 16.67 8.33 7.50
Gujarat 6.47 58.90 23.95 7.77 2.91
Haryana 6.06 47.47 26.26 13.13 6.06
Himachal Pradesh 5.56 52.78 27.78 8.33 9.44
Jammu & Kashmir 9.09 54.55 22.73 9.09 6.82
Jharkhand 4.26 25.53 44.68 17.55 7.98
Karnataka 20.83 37.50 23.61 11.39 6.67
Kerala 3.21 28.21 30.77 20.51 17.31
Madhya Pradesh 6.06 44.90 28.10 14.33 6.61
Maharashtra 9.30 57.14 21.29 8.76 3.50
Manipur 5.00 37.50 25.00 12.50 16.25
Meghalaya 3.08 30.77 30.77 23.08 14.62
Mizoram 6.00 20.00 40.00 20.00 11.20
Nagaland 2.11 26.32 36.84 21.05 8.95
Orissa 3.83 47.74 32.06 11.15 5.23
Punjab 3.91 48.44 27.34 12.50 7.03
Rajasthan 8.33 45.56 28.33 10.00 7.22
Sikkim 3.33 33.33 33.33 16.67 10.00
Tamil Nadu 12.21 47.79 24.42 10.91 4.94
Tripura 13.64 72.73 9.09 1.82 0.77
7.40 42.86 29.34 11.73 8.67
2.13 42.55 35.11 12.77 7.45
West Bengal 7.34 60.06 23.05 6.90 2.94
A & N Islands 10.00 30.00 30.00 20.00 4.60
Chandigarh 3.08 61.54 15.38 7.69 3.85
D & N. Haveli 30.00 60.00 20.00 10.00 4.40
Daman & Diu 5.00 50.00 15.00 5.00 4.00
NCT of Delhi 4.17 58.33 23.33 10.00 4.17
Lakshadweep 1.50 15.00 20.00 20.00 35.00
Puducherry 8.33 58.33 25.00 8.33 5.83
INDIA 7.99 47.96 26.08 11.61 6.36Source:

State of Housing in India
159
Appendix - 69 State-wise Total Households living in houses by number of Rooms of Rented Dwelling in India-2011
(‘000’)
States/UTs Total number of households
Number of Households having Number of Owned Dwelling Rooms
No Exclusive Room One Room Two Rooms Three Rooms Four Rooms &
Above
Andhra Pradesh 12859 391 5723 4687 1302 756
Arunachal Pradesh 159 8 54 53 27 18
Assam 4962 178 1761 1500 828 695
Bihar 16662 457 7728 4999 1649 1829
4205 63 1552 1498 615 476
Goa 109 2 14 28 27 38
Gujarat 6295 182 2883 2363 612 257
Haryana 2850 37 643 967 570 634
Himachal Pradesh 1206 10 187 340 218 450
Jammu & Kashmir 1477 53 360 434 312 317
Jharkhand 4574 109 1278 1789 706 692
Karnataka 7072 1226 2423 1916 831 676
Kerala 3800 45 264 988 1243 1260
Madhya Pradesh 10739 292 4751 3523 1239 933
Maharashtra 11786 400 4824 4264 1451 846
Manipur 322 6 44 104 101 67
Meghalaya 390 9 80 137 88 76
Mizoram 90 3 22 39 19 7
Nagaland 249 5 55 89 61 38
Orissa 7819 139 2997 3069 1012 602
Punjab 3168 27 637 1025 714 764
Rajasthan 9229 324 3496 2862 1194 1354
Sikkim 71 1 8 22 19 22
Tamil Nadu 8656 1045 3615 2563 940 493Tripura 582 18 436 107 16 4.5
25055 1037 8211 7856 3582 4370
1260 12 279 429 199 341West Bengal 13117 475 7477 3703 797 665A & N Islands 38 1 9 14 9 5Chandigarh 2 0.004 0.2 0.4 0.4 0.6
D & N. Haveli 28 1 10 11 3 1.4
Daman & Diu 9 0.2 3 3 1 1.6NCT of Delhi 65 0.5 13 19 15 17
Lakshadweep 2 0.02 0.1 0.4 0.5 1.1
Puducherry 78 5 34 25 10 4.3
INDIA 158984 6562 61871 51428 20412 18711Source:

National Buildings Organisation
160
Appendix - 70 State-wise Total percentage Households living in houses by number of Rooms of own Dwelling in India-2011
States/UTs
Number of Households having Number of Owned Dwelling Rooms
No Exclusive Room One Room Two Rooms Three Rooms Four Rooms & Above
Andhra Pradesh 3.04 44.51 36.45 10.13 5.88
Arunachal Pradesh 5.03 33.96 33.33 16.98 11.32
Assam 3.59 35.49 30.23 16.69 14.01
Bihar 2.74 46.38 30.00 9.90 10.98
1.50 36.91 35.62 14.63 11.32
Goa 1.83 12.84 25.69 24.77 34.86
Gujarat 2.89 45.80 37.54 9.72 4.08
Haryana 1.30 22.56 33.93 20.00 22.25
Himachal Pradesh 0.83 15.51 28.19 18.08 37.31
Jammu & Kashmir 3.59 24.37 29.38 21.12 21.46
Jharkhand 2.38 27.94 39.11 15.44 15.13
Karnataka 17.34 34.26 27.09 11.75 9.56
Kerala 1.18 6.95 26.00 32.71 33.16
Madhya Pradesh 2.72 44.24 32.81 11.54 8.69
Maharashtra 3.39 40.93 36.18 12.31 7.18
Manipur 1.86 13.66 32.30 31.37 20.81
Meghalaya 2.31 20.51 35.13 22.56 19.49
Mizoram 3.33 24.44 43.33 21.11 7.78
Nagaland 2.01 22.09 35.74 24.50 15.26
Orissa 1.78 38.33 39.25 12.94 7.70
Punjab 0.85 20.11 32.35 22.54 24.12
Rajasthan 3.51 37.88 31.01 12.94 14.67
Sikkim 1.41 11.27 30.99 26.76 29.58
Tamil Nadu 12.07 41.76 29.61 10.86 5.70
Tripura 3.09 74.91 18.38 2.75 0.77
4.14 32.77 31.36 14.30 17.44
0.95 22.14 34.05 15.79 27.06
West Bengal 3.62 57.00 28.23 6.08 5.07
A & N Islands 2.63 23.68 36.84 23.68 13.16
Chandigarh 0.20 10.00 20.00 20.00 30.00
D & N. Haveli 3.57 35.71 39.29 10.71 5.00
Daman & Diu 2.22 33.33 33.33 11.11 17.78
NCT of Delhi 0.77 20.00 29.23 23.08 26.15
Lakshadweep 1.00 5.00 20.00 25.00 55.00
Puducherry 6.41 43.59 32.05 12.82 5.51
INDIA 4.13 38.92 32.35 12.84 11.77Source:
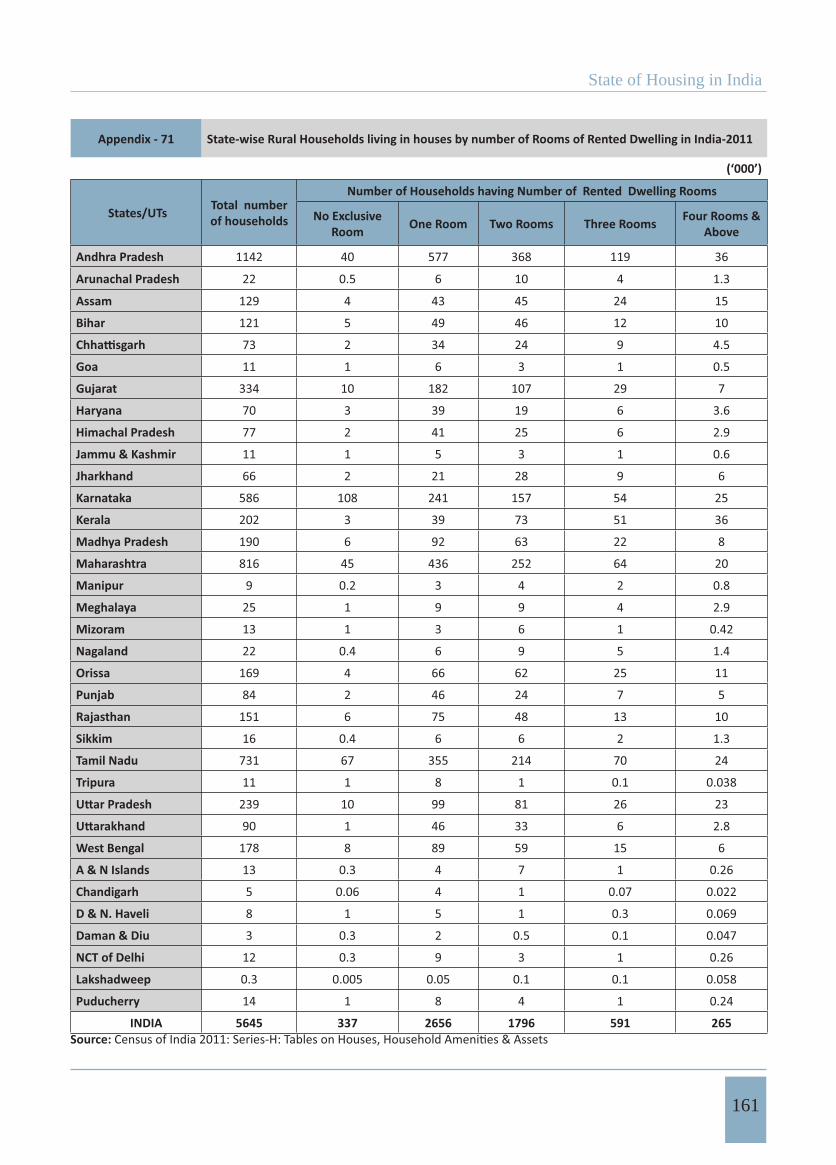
State of Housing in India
161
Appendix - 71 State-wise Rural Households living in houses by number of Rooms of Rented Dwelling in India-2011
(‘000’)
States/UTs Total number of households
Number of Households having Number of Rented Dwelling Rooms
No Exclusive Room One Room Two Rooms Three Rooms Four Rooms &
Above
Andhra Pradesh 1142 40 577 368 119 36
Arunachal Pradesh 22 0.5 6 10 4 1.3
Assam 129 4 43 45 24 15
Bihar 121 5 49 46 12 10
73 2 34 24 9 4.5
Goa 11 1 6 3 1 0.5
Gujarat 334 10 182 107 29 7
Haryana 70 3 39 19 6 3.6
Himachal Pradesh 77 2 41 25 6 2.9
Jammu & Kashmir 11 1 5 3 1 0.6
Jharkhand 66 2 21 28 9 6
Karnataka 586 108 241 157 54 25
Kerala 202 3 39 73 51 36
Madhya Pradesh 190 6 92 63 22 8
Maharashtra 816 45 436 252 64 20
Manipur 9 0.2 3 4 2 0.8
Meghalaya 25 1 9 9 4 2.9
Mizoram 13 1 3 6 1 0.42
Nagaland 22 0.4 6 9 5 1.4
Orissa 169 4 66 62 25 11
Punjab 84 2 46 24 7 5
Rajasthan 151 6 75 48 13 10
Sikkim 16 0.4 6 6 2 1.3
Tamil Nadu 731 67 355 214 70 24
Tripura 11 1 8 1 0.1 0.038
239 10 99 81 26 23
90 1 46 33 6 2.8
West Bengal 178 8 89 59 15 6
A & N Islands 13 0.3 4 7 1 0.26
Chandigarh 5 0.06 4 1 0.07 0.022
D & N. Haveli 8 1 5 1 0.3 0.069
Daman & Diu 3 0.3 2 0.5 0.1 0.047
NCT of Delhi 12 0.3 9 3 1 0.26
Lakshadweep 0.3 0.005 0.05 0.1 0.1 0.058
Puducherry 14 1 8 4 1 0.24
INDIA 5645 337 2656 1796 591 265Source:

National Buildings Organisation
162
Appendix - 72 State-wise Rural percentage Households living in houses by number of Rooms of Rented Dwelling in India-2011
States/UTs
Number of Households having Number of Rented Dwelling Rooms
No Exclusive Room One Room Two Rooms Three Rooms Four Rooms &
Above
Andhra Pradesh 3.50 50.53 32.22 10.42 3.15
Arunachal Pradesh 2.27 27.27 45.45 18.18 5.91
Assam 3.10 33.33 34.88 18.60 11.63
Bihar 4.13 40.50 38.02 9.92 8.26
2.74 46.58 32.88 12.33 6.16
Goa 9.09 54.55 27.27 9.09 4.55
Gujarat 2.99 54.49 32.04 8.68 2.10
Haryana 4.29 55.71 27.14 8.57 5.14
Himachal Pradesh 2.60 53.25 32.47 7.79 3.77
Jammu & Kashmir 9.09 45.45 27.27 9.09 5.45
Jharkhand 3.03 31.82 42.42 13.64 9.09
Karnataka 18.43 41.13 26.79 9.22 4.27
Kerala 1.49 19.31 36.14 25.25 17.82
Madhya Pradesh 3.16 48.42 33.16 11.58 4.21
Maharashtra 5.51 53.43 30.88 7.84 2.45
Manipur 2.22 33.33 33.33 22.22 8.89
Meghalaya 4.00 36.00 36.00 16.00 11.60
Mizoram 7.69 30.77 46.15 7.69 3.23
Nagaland 1.82 27.27 40.91 22.73 6.36
Orissa 2.37 39.05 36.69 14.79 6.51
Punjab 2.38 54.76 28.57 8.33 5.95
Rajasthan 3.97 49.67 31.79 8.61 6.62
Sikkim 2.50 37.50 37.50 12.50 8.13
Tamil Nadu 9.17 48.56 29.27 9.58 3.28
Tripura 9.09 72.73 9.09 0.91 0.35
4.18 41.42 33.89 10.88 9.62
1.11 51.11 36.67 6.67 3.11
West Bengal 4.49 50.00 33.15 8.43 3.37
A & N Islands 2.31 30.77 53.85 7.69 2.00
Chandigarh 1.20 80.00 20.00 1.40 0.44
D & N. Haveli 12.50 62.50 12.50 3.75 0.86
Daman & Diu 10.00 66.67 16.67 3.33 1.57
NCT of Delhi 2.50 75.00 25.00 8.33 2.17
Lakshadweep 1.67 16.67 33.33 33.33 19.33
Puducherry 7.14 57.14 28.57 7.14 1.71
INDIA 5.97 47.05 31.82 10.47 4.69Source:
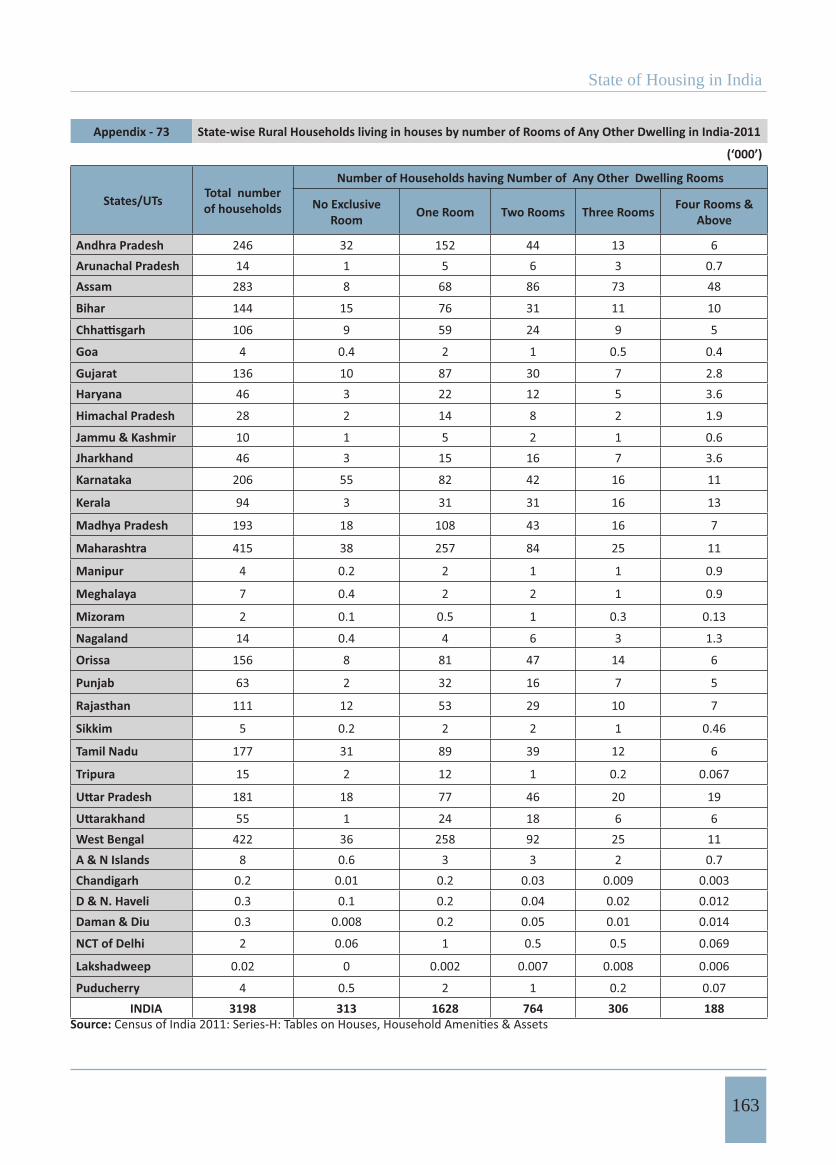
State of Housing in India
163
Appendix - 73 State-wise Rural Households living in houses by number of Rooms of Any Other Dwelling in India-2011
(‘000’)
States/UTs Total number of households
Number of Households having Number of Any Other Dwelling Rooms
No Exclusive Room One Room Two Rooms Three Rooms Four Rooms &
Above
Andhra Pradesh 246 32 152 44 13 6Arunachal Pradesh 14 1 5 6 3 0.7Assam 283 8 68 86 73 48
Bihar 144 15 76 31 11 10
106 9 59 24 9 5
Goa 4 0.4 2 1 0.5 0.4
Gujarat 136 10 87 30 7 2.8Haryana 46 3 22 12 5 3.6
Himachal Pradesh 28 2 14 8 2 1.9
Jammu & Kashmir 10 1 5 2 1 0.6Jharkhand 46 3 15 16 7 3.6
Karnataka 206 55 82 42 16 11
Kerala 94 3 31 31 16 13
Madhya Pradesh 193 18 108 43 16 7
Maharashtra 415 38 257 84 25 11
Manipur 4 0.2 2 1 1 0.9
Meghalaya 7 0.4 2 2 1 0.9
Mizoram 2 0.1 0.5 1 0.3 0.13
Nagaland 14 0.4 4 6 3 1.3
Orissa 156 8 81 47 14 6
Punjab 63 2 32 16 7 5
Rajasthan 111 12 53 29 10 7
Sikkim 5 0.2 2 2 1 0.46
Tamil Nadu 177 31 89 39 12 6
Tripura 15 2 12 1 0.2 0.067
181 18 77 46 20 19
55 1 24 18 6 6West Bengal 422 36 258 92 25 11A & N Islands 8 0.6 3 3 2 0.7Chandigarh 0.2 0.01 0.2 0.03 0.009 0.003D & N. Haveli 0.3 0.1 0.2 0.04 0.02 0.012Daman & Diu 0.3 0.008 0.2 0.05 0.01 0.014
NCT of Delhi 2 0.06 1 0.5 0.5 0.069
Lakshadweep 0.02 0 0.002 0.007 0.008 0.006
Puducherry 4 0.5 2 1 0.2 0.07 INDIA 3198 313 1628 764 306 188
Source:
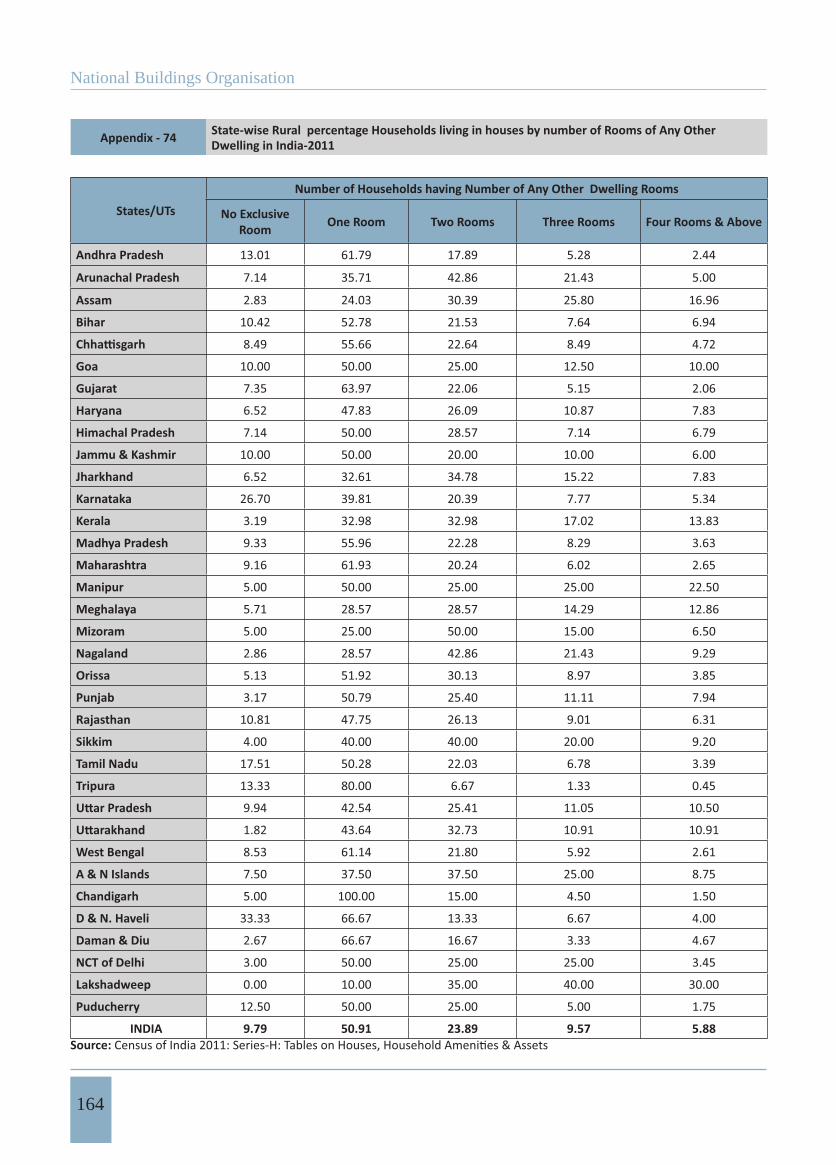
National Buildings Organisation
164
Appendix - 74 State-wise Rural percentage Households living in houses by number of Rooms of Any Other Dwelling in India-2011
States/UTs
Number of Households having Number of Any Other Dwelling Rooms
No Exclusive Room One Room Two Rooms Three Rooms Four Rooms & Above
Andhra Pradesh 13.01 61.79 17.89 5.28 2.44
Arunachal Pradesh 7.14 35.71 42.86 21.43 5.00
Assam 2.83 24.03 30.39 25.80 16.96
Bihar 10.42 52.78 21.53 7.64 6.94
8.49 55.66 22.64 8.49 4.72
Goa 10.00 50.00 25.00 12.50 10.00
Gujarat 7.35 63.97 22.06 5.15 2.06
Haryana 6.52 47.83 26.09 10.87 7.83
Himachal Pradesh 7.14 50.00 28.57 7.14 6.79
Jammu & Kashmir 10.00 50.00 20.00 10.00 6.00
Jharkhand 6.52 32.61 34.78 15.22 7.83
Karnataka 26.70 39.81 20.39 7.77 5.34
Kerala 3.19 32.98 32.98 17.02 13.83
Madhya Pradesh 9.33 55.96 22.28 8.29 3.63
Maharashtra 9.16 61.93 20.24 6.02 2.65
Manipur 5.00 50.00 25.00 25.00 22.50
Meghalaya 5.71 28.57 28.57 14.29 12.86
Mizoram 5.00 25.00 50.00 15.00 6.50
Nagaland 2.86 28.57 42.86 21.43 9.29
Orissa 5.13 51.92 30.13 8.97 3.85
Punjab 3.17 50.79 25.40 11.11 7.94
Rajasthan 10.81 47.75 26.13 9.01 6.31
Sikkim 4.00 40.00 40.00 20.00 9.20
Tamil Nadu 17.51 50.28 22.03 6.78 3.39
Tripura 13.33 80.00 6.67 1.33 0.45
9.94 42.54 25.41 11.05 10.50
1.82 43.64 32.73 10.91 10.91
West Bengal 8.53 61.14 21.80 5.92 2.61
A & N Islands 7.50 37.50 37.50 25.00 8.75
Chandigarh 5.00 100.00 15.00 4.50 1.50
D & N. Haveli 33.33 66.67 13.33 6.67 4.00
Daman & Diu 2.67 66.67 16.67 3.33 4.67
NCT of Delhi 3.00 50.00 25.00 25.00 3.45
Lakshadweep 0.00 10.00 35.00 40.00 30.00
Puducherry 12.50 50.00 25.00 5.00 1.75
INDIA 9.79 50.91 23.89 9.57 5.88Source:
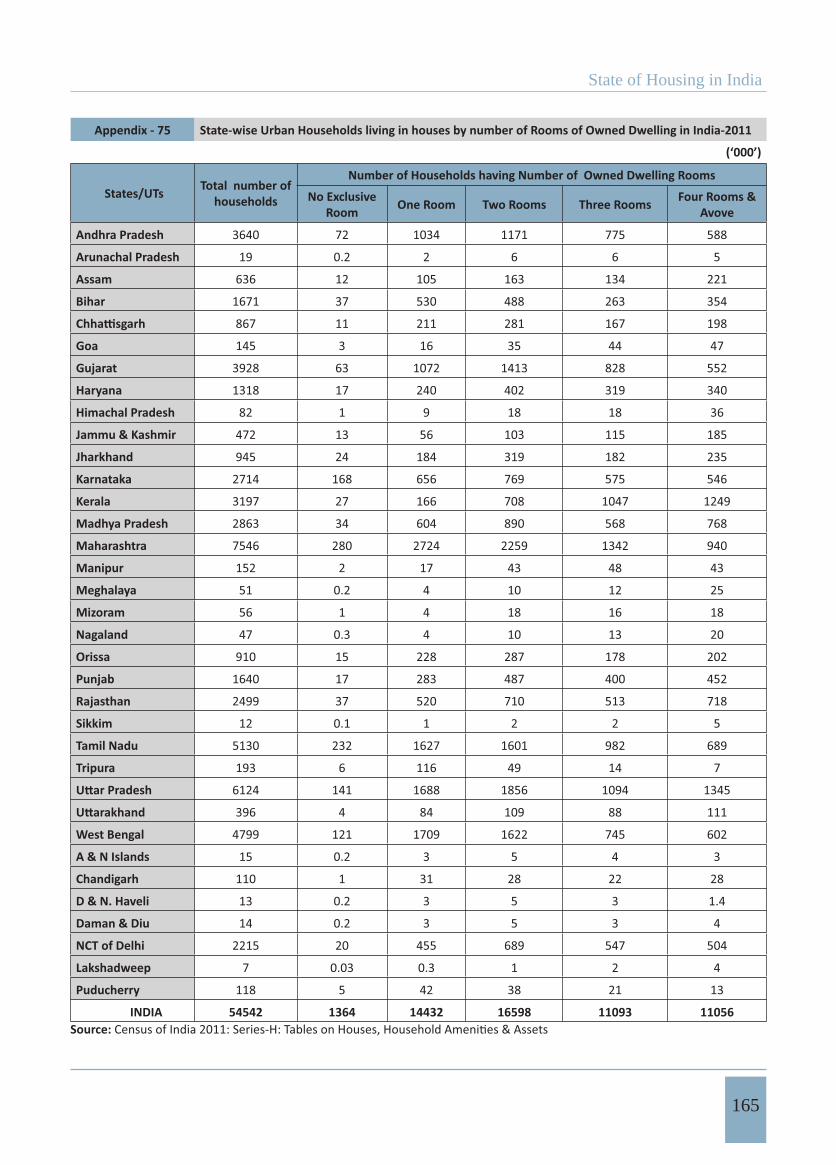
State of Housing in India
165
Appendix - 75 State-wise Urban Households living in houses by number of Rooms of Owned Dwelling in India-2011
(‘000’)
States/UTs Total number of households
Number of Households having Number of Owned Dwelling Rooms
No Exclusive Room One Room Two Rooms Three Rooms Four Rooms &
Avove
Andhra Pradesh 3640 72 1034 1171 775 588
Arunachal Pradesh 19 0.2 2 6 6 5
Assam 636 12 105 163 134 221
Bihar 1671 37 530 488 263 354
867 11 211 281 167 198
Goa 145 3 16 35 44 47
Gujarat 3928 63 1072 1413 828 552
Haryana 1318 17 240 402 319 340
Himachal Pradesh 82 1 9 18 18 36
Jammu & Kashmir 472 13 56 103 115 185
Jharkhand 945 24 184 319 182 235
Karnataka 2714 168 656 769 575 546
Kerala 3197 27 166 708 1047 1249
Madhya Pradesh 2863 34 604 890 568 768
Maharashtra 7546 280 2724 2259 1342 940
Manipur 152 2 17 43 48 43
Meghalaya 51 0.2 4 10 12 25
Mizoram 56 1 4 18 16 18
Nagaland 47 0.3 4 10 13 20
Orissa 910 15 228 287 178 202
Punjab 1640 17 283 487 400 452
Rajasthan 2499 37 520 710 513 718
Sikkim 12 0.1 1 2 2 5
Tamil Nadu 5130 232 1627 1601 982 689
Tripura 193 6 116 49 14 7
6124 141 1688 1856 1094 1345
396 4 84 109 88 111
West Bengal 4799 121 1709 1622 745 602
A & N Islands 15 0.2 3 5 4 3
Chandigarh 110 1 31 28 22 28
D & N. Haveli 13 0.2 3 5 3 1.4
Daman & Diu 14 0.2 3 5 3 4
NCT of Delhi 2215 20 455 689 547 504
Lakshadweep 7 0.03 0.3 1 2 4
Puducherry 118 5 42 38 21 13
INDIA 54542 1364 14432 16598 11093 11056Source:
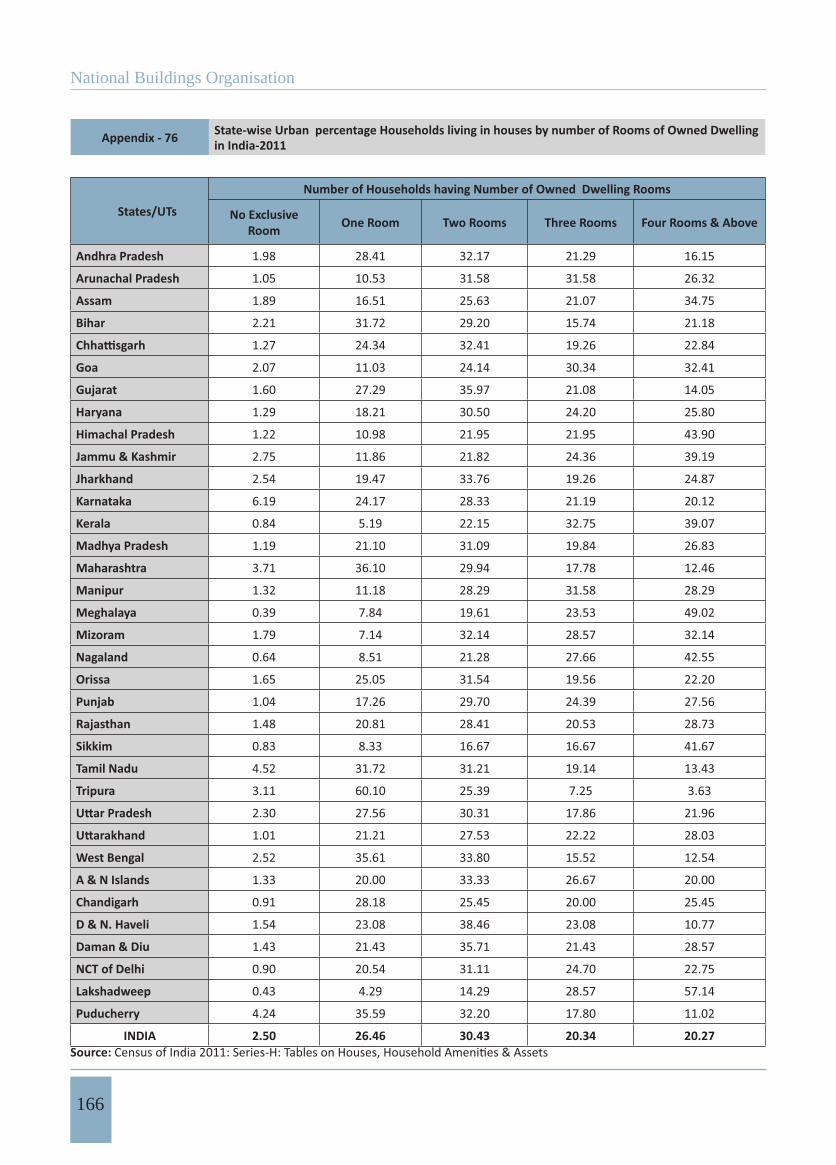
National Buildings Organisation
166
Appendix - 76 State-wise Urban percentage Households living in houses by number of Rooms of Owned Dwelling in India-2011
States/UTs
Number of Households having Number of Owned Dwelling Rooms
No Exclusive Room One Room Two Rooms Three Rooms Four Rooms & Above
Andhra Pradesh 1.98 28.41 32.17 21.29 16.15
Arunachal Pradesh 1.05 10.53 31.58 31.58 26.32
Assam 1.89 16.51 25.63 21.07 34.75
Bihar 2.21 31.72 29.20 15.74 21.18
1.27 24.34 32.41 19.26 22.84
Goa 2.07 11.03 24.14 30.34 32.41
Gujarat 1.60 27.29 35.97 21.08 14.05
Haryana 1.29 18.21 30.50 24.20 25.80
Himachal Pradesh 1.22 10.98 21.95 21.95 43.90
Jammu & Kashmir 2.75 11.86 21.82 24.36 39.19
Jharkhand 2.54 19.47 33.76 19.26 24.87
Karnataka 6.19 24.17 28.33 21.19 20.12
Kerala 0.84 5.19 22.15 32.75 39.07
Madhya Pradesh 1.19 21.10 31.09 19.84 26.83
Maharashtra 3.71 36.10 29.94 17.78 12.46
Manipur 1.32 11.18 28.29 31.58 28.29
Meghalaya 0.39 7.84 19.61 23.53 49.02
Mizoram 1.79 7.14 32.14 28.57 32.14
Nagaland 0.64 8.51 21.28 27.66 42.55
Orissa 1.65 25.05 31.54 19.56 22.20
Punjab 1.04 17.26 29.70 24.39 27.56
Rajasthan 1.48 20.81 28.41 20.53 28.73
Sikkim 0.83 8.33 16.67 16.67 41.67
Tamil Nadu 4.52 31.72 31.21 19.14 13.43
Tripura 3.11 60.10 25.39 7.25 3.63
2.30 27.56 30.31 17.86 21.96
1.01 21.21 27.53 22.22 28.03
West Bengal 2.52 35.61 33.80 15.52 12.54
A & N Islands 1.33 20.00 33.33 26.67 20.00
Chandigarh 0.91 28.18 25.45 20.00 25.45
D & N. Haveli 1.54 23.08 38.46 23.08 10.77
Daman & Diu 1.43 21.43 35.71 21.43 28.57
NCT of Delhi 0.90 20.54 31.11 24.70 22.75
Lakshadweep 0.43 4.29 14.29 28.57 57.14
Puducherry 4.24 35.59 32.20 17.80 11.02
INDIA 2.50 26.46 30.43 20.34 20.27Source:

State of Housing in India
167
Appendix - 77 State-wise Urban Households living in houses by number of Rooms of Rented Dwelling in India-2011
(‘000’)
States/UTs Total number of households
Number of Households having Number of Rented Dwelling Rooms
No Exclusive Room One Room Two Rooms Three Rooms Four Rooms &
Above
Andhra Pradesh 3005 71 1115 1012 585 222
Arunachal Pradesh 37 1 10 17 8 2.7
Assam 307 8 122 97 50 30
Bihar 275 6 93 111 45 20
294 5 100 108 58 21
Goa 45 3 20 13 7 1.6
Gujarat 1315 58 758 348 120 32
Haryana 380 10 196 101 46 28
Himachal Pradesh 75 2 32 30 8 2.9
Jammu & Kashmir 34 1 16 10 4 2
Jharkhand 408 14 114 189 64 27
Karnataka 2448 190 865 834 398 162
Kerala 362 4 48 119 112 79
Madhya Pradesh 812 14 311 293 136 58
Maharashtra 2941 214 1617 740 279 90
Manipur 16 0.5 5 5 3 1.7
Meghalaya 59 1 20 21 11 6
Mizoram 57 1 10 28 12 5.5
Nagaland 63 1 21 23 12 7
Orissa 476 8 146 177 98 46
Punjab 390 7 216 106 42 19
Rajasthan 523 11 250 167 62 33
Sikkim 23 1 10 8 3 1.4
Tamil Nadu 3590 169 1559 1167 515 178
Tripura 36 2 25 6 2 1.2
1115 27 551 352 120 65
158 2 73 59 17 7
West Bengal 1292 55 787 326 91 33
A & N Islands 17 0.3 5 8 3 0.66
Chandigarh 105 2 49 28 20 8
D & N. Haveli 24 2 16 5 1 0.15
Daman & Diu 32 2 26 3 1 0.62
NCT of Delhi 929 17 528 252 92 40
Lakshadweep 1 0.005 0.3 0.5 0.4 0.14
Puducherry 80 4 37 26 11 2.6
INDIA 21724 913 9751 6790 3036 1233Source:
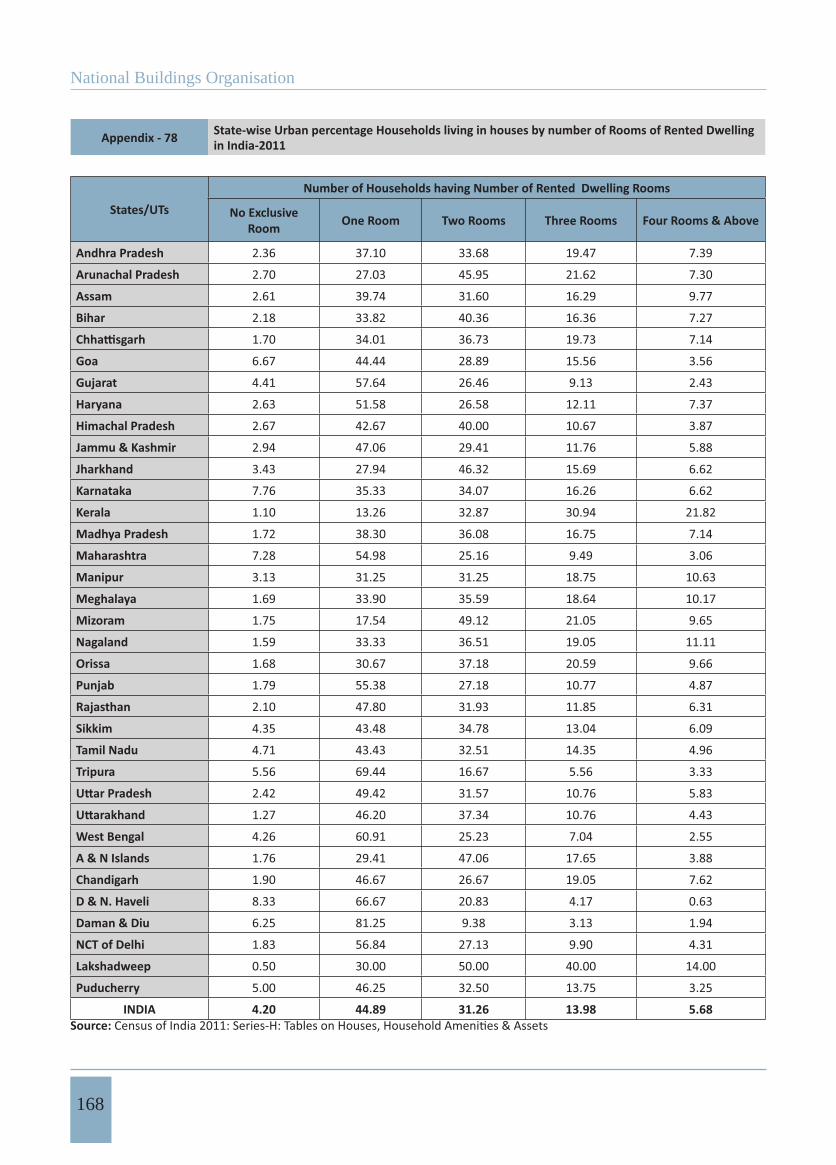
National Buildings Organisation
168
Appendix - 78 State-wise Urban percentage Households living in houses by number of Rooms of Rented Dwelling in India-2011
States/UTs
Number of Households having Number of Rented Dwelling Rooms
No Exclusive Room One Room Two Rooms Three Rooms Four Rooms & Above
Andhra Pradesh 2.36 37.10 33.68 19.47 7.39
Arunachal Pradesh 2.70 27.03 45.95 21.62 7.30
Assam 2.61 39.74 31.60 16.29 9.77
Bihar 2.18 33.82 40.36 16.36 7.27
1.70 34.01 36.73 19.73 7.14
Goa 6.67 44.44 28.89 15.56 3.56
Gujarat 4.41 57.64 26.46 9.13 2.43
Haryana 2.63 51.58 26.58 12.11 7.37
Himachal Pradesh 2.67 42.67 40.00 10.67 3.87
Jammu & Kashmir 2.94 47.06 29.41 11.76 5.88
Jharkhand 3.43 27.94 46.32 15.69 6.62
Karnataka 7.76 35.33 34.07 16.26 6.62
Kerala 1.10 13.26 32.87 30.94 21.82
Madhya Pradesh 1.72 38.30 36.08 16.75 7.14
Maharashtra 7.28 54.98 25.16 9.49 3.06
Manipur 3.13 31.25 31.25 18.75 10.63
Meghalaya 1.69 33.90 35.59 18.64 10.17
Mizoram 1.75 17.54 49.12 21.05 9.65
Nagaland 1.59 33.33 36.51 19.05 11.11
Orissa 1.68 30.67 37.18 20.59 9.66
Punjab 1.79 55.38 27.18 10.77 4.87
Rajasthan 2.10 47.80 31.93 11.85 6.31
Sikkim 4.35 43.48 34.78 13.04 6.09
Tamil Nadu 4.71 43.43 32.51 14.35 4.96
Tripura 5.56 69.44 16.67 5.56 3.33
2.42 49.42 31.57 10.76 5.83
1.27 46.20 37.34 10.76 4.43
West Bengal 4.26 60.91 25.23 7.04 2.55
A & N Islands 1.76 29.41 47.06 17.65 3.88
Chandigarh 1.90 46.67 26.67 19.05 7.62
D & N. Haveli 8.33 66.67 20.83 4.17 0.63
Daman & Diu 6.25 81.25 9.38 3.13 1.94
NCT of Delhi 1.83 56.84 27.13 9.90 4.31
Lakshadweep 0.50 30.00 50.00 40.00 14.00
Puducherry 5.00 46.25 32.50 13.75 3.25
INDIA 4.20 44.89 31.26 13.98 5.68Source:

State of Housing in India
169
Appendix-79 State-wise Urban Households living in houses by number of Rooms of Any Other Dwelling in India-2011
(‘000’)
States/UTsTotal
number of households
Number of Households having Number of Any Other Dwelling Rooms
No Exclusive Room One Room Two Rooms Three Rooms Four Rooms &
Above
Andhra Pradesh 134 10 66 27 18 12
Arunachal Pradesh 9 0.2 2 4 3 1.3
Assam 50 1 13 17 12 8
Bihar 67 3 30 21 9 4
78 2 27 26 16 7
Goa 8 1 4 2 1 0.5
Gujarat 173 10 95 44 17 6
Haryana 53 3 24 14 8 3.1
Himachal Pradesh 9 0.5 4 2 1 0.6
Jammu & Kashmir 12 1 6 3 1 0.6
Jharkhand 143 4 33 68 27 11
Karnataka 154 20 54 43 24 12
Kerala 62 2 14 17 15 13
Madhya Pradesh 171 4 55 59 35 17
Maharashtra 328 30 167 74 40 16
Manipur 3 0.2 1 1 0.6 0.5
Meghalaya 6 0.06 1 2 2 1.5
Mizoram 3 0.1 1 1 1 0.9
Nagaland 5 0.1 1 2 1 0.9
Orissa 131 3 56 45 19 9
Punjab 64 2 30 19 9 5
Rajasthan 69 3 29 22 9 6
Sikkim 1 0.02 0.5 0.4 0.3 0.15
Tamil Nadu 209 16 95 55 30 12
Tripura 7 0.5 5 1 0.2 0.74
211 10 91 68 26 15
39 1 16 14 6 2.9
West Bengal 259 13 151 65 22 8
A & N Islands 1 0.1 0.5 0.5 0.3 0.08
Chandigarh 12 0.4 8 2 1 0.5
D & N. Haveli 1 0.2 0.4 0.1 0.1 0.028
Daman & Diu 2 0.1 1 0.3 0.1 0.06
NCT of Delhi 118 5 69 27 11 5
Lakshadweep 0.2 0.003 0.02 0.04 0.03 0.07
Puducherry 8 1 4 2 0.6 0.23
INDIA 2600 150 1153 749 367 181Source:

National Buildings Organisation
170
Appendix - 80 State-wise Urban percentage Households living in houses by number of Rooms of Any Other Dwelling in India-2011
States/UTs
Number of Households having Number of Any Other Dwelling Rooms
No Exclusive Room One Room Two Rooms Three Rooms Four Rooms & Above
Andhra Pradesh 7.46 49.25 20.15 13.43 8.96
Arunachal Pradesh 2.22 22.22 44.44 33.33 14.44
Assam 2.00 26.00 34.00 24.00 16.00
Bihar 4.48 44.78 31.34 13.43 5.97
2.56 34.62 33.33 20.51 8.97
Goa 12.50 50.00 25.00 12.50 6.25
Gujarat 5.78 54.91 25.43 9.83 3.47
Haryana 5.66 45.28 26.42 15.09 5.85
Himachal Pradesh 5.56 44.44 22.22 11.11 6.67
Jammu & Kashmir 8.33 50.00 25.00 8.33 5.00
Jharkhand 2.80 23.08 47.55 18.88 7.69
Karnataka 12.99 35.06 27.92 15.58 7.79
Kerala 3.23 22.58 27.42 24.19 20.97
Madhya Pradesh 2.34 32.16 34.50 20.47 9.94
Maharashtra 9.15 50.91 22.56 12.20 4.88
Manipur 6.67 33.33 33.33 20.00 16.67
Meghalaya 1.00 16.67 33.33 33.33 25.00
Mizoram 3.33 33.33 33.33 33.33 30.00
Nagaland 2.00 20.00 40.00 20.00 18.00
Orissa 2.29 42.75 34.35 14.50 6.87
Punjab 3.13 46.88 29.69 14.06 7.81
Rajasthan 4.35 42.03 31.88 13.04 8.70
Sikkim 2.00 50.00 40.00 30.00 15.00
Tamil Nadu 7.66 45.45 26.32 14.35 5.74Tripura 7.14 71.43 14.29 2.86 10.57
4.74 43.13 32.23 12.32 7.112.56 41.03 35.90 15.38 7.44
West Bengal 5.02 58.30 25.10 8.49 3.09A & N Islands 10.00 50.00 50.00 30.00 8.00Chandigarh 3.33 66.67 16.67 8.33 4.17D & N. Haveli 20.00 40.00 10.00 10.00 2.80Daman & Diu 5.00 50.00 15.00 5.00 3.00NCT of Delhi 4.24 58.47 22.88 9.32 4.24Lakshadweep 1.50 10.00 20.00 15.00 35.00Puducherry 12.50 50.00 25.00 7.50 2.88
INDIA 5.77 44.35 28.81 14.12 6.96Source:
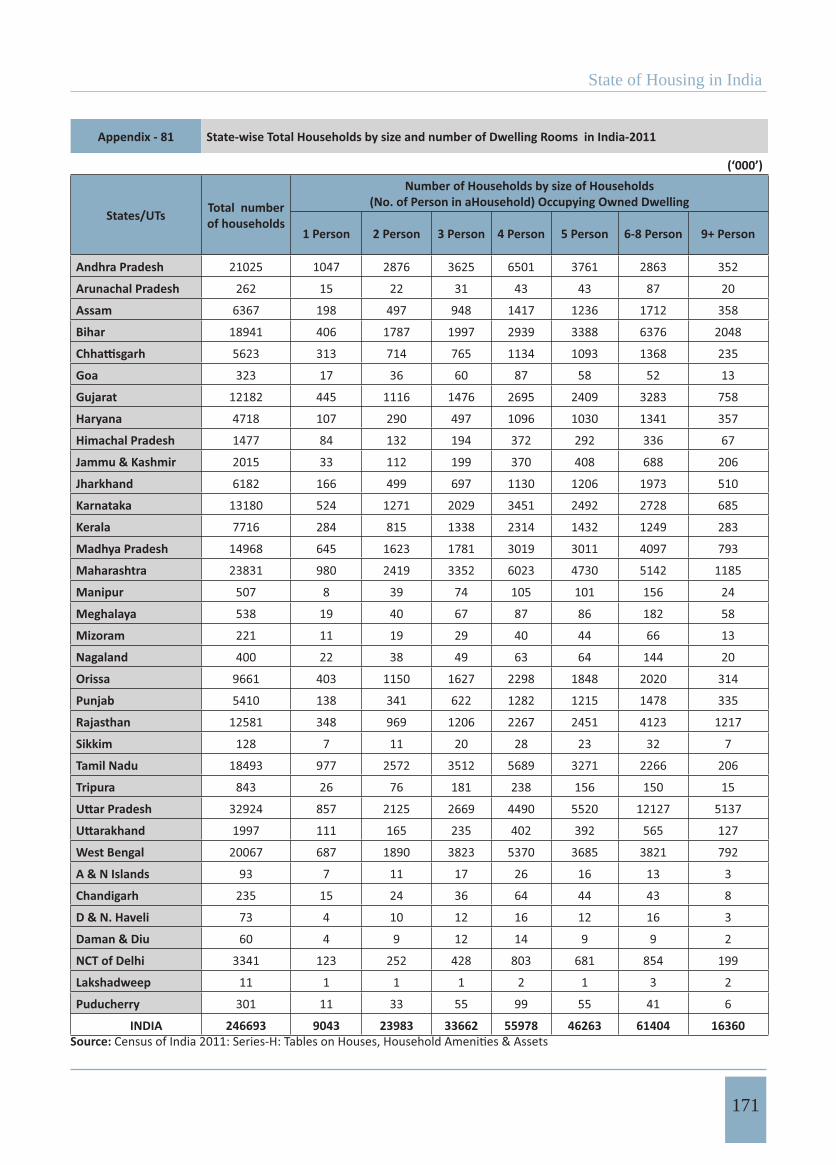
State of Housing in India
171
Appendix - 81 State-wise Total Households by size and number of Dwelling Rooms in India-2011
(‘000’)
States/UTs Total number of households
Number of Households by size of Households (No. of Person in aHousehold) Occupying Owned Dwelling
1 Person 2 Person 3 Person 4 Person 5 Person 6-8 Person 9+ Person
Andhra Pradesh 21025 1047 2876 3625 6501 3761 2863 352
Arunachal Pradesh 262 15 22 31 43 43 87 20
Assam 6367 198 497 948 1417 1236 1712 358
Bihar 18941 406 1787 1997 2939 3388 6376 2048
5623 313 714 765 1134 1093 1368 235
Goa 323 17 36 60 87 58 52 13
Gujarat 12182 445 1116 1476 2695 2409 3283 758
Haryana 4718 107 290 497 1096 1030 1341 357
Himachal Pradesh 1477 84 132 194 372 292 336 67
Jammu & Kashmir 2015 33 112 199 370 408 688 206
Jharkhand 6182 166 499 697 1130 1206 1973 510
Karnataka 13180 524 1271 2029 3451 2492 2728 685
Kerala 7716 284 815 1338 2314 1432 1249 283
Madhya Pradesh 14968 645 1623 1781 3019 3011 4097 793
Maharashtra 23831 980 2419 3352 6023 4730 5142 1185
Manipur 507 8 39 74 105 101 156 24
Meghalaya 538 19 40 67 87 86 182 58
Mizoram 221 11 19 29 40 44 66 13
Nagaland 400 22 38 49 63 64 144 20
Orissa 9661 403 1150 1627 2298 1848 2020 314
Punjab 5410 138 341 622 1282 1215 1478 335
Rajasthan 12581 348 969 1206 2267 2451 4123 1217
Sikkim 128 7 11 20 28 23 32 7
Tamil Nadu 18493 977 2572 3512 5689 3271 2266 206
Tripura 843 26 76 181 238 156 150 15
32924 857 2125 2669 4490 5520 12127 5137
1997 111 165 235 402 392 565 127
West Bengal 20067 687 1890 3823 5370 3685 3821 792
A & N Islands 93 7 11 17 26 16 13 3
Chandigarh 235 15 24 36 64 44 43 8
D & N. Haveli 73 4 10 12 16 12 16 3
Daman & Diu 60 4 9 12 14 9 9 2
NCT of Delhi 3341 123 252 428 803 681 854 199
Lakshadweep 11 1 1 1 2 1 3 2
Puducherry 301 11 33 55 99 55 41 6
INDIA 246693 9043 23983 33662 55978 46263 61404 16360Source:
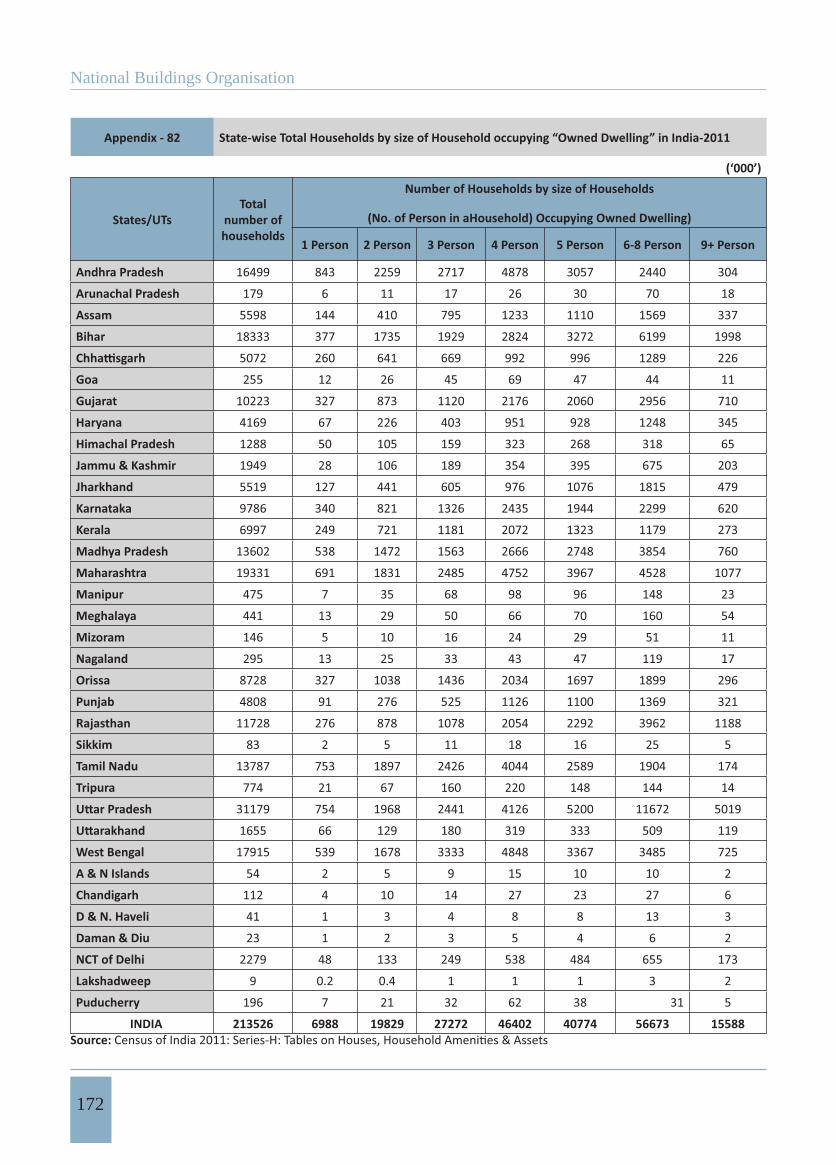
National Buildings Organisation
172
Appendix - 82 State-wise Total Households by size of Household occupying “Owned Dwelling” in India-2011
(‘000’)
States/UTsTotal
number of households
Number of Households by size of Households
(No. of Person in aHousehold) Occupying Owned Dwelling)
1 Person 2 Person 3 Person 4 Person 5 Person 6-8 Person 9+ Person
Andhra Pradesh 16499 843 2259 2717 4878 3057 2440 304
Arunachal Pradesh 179 6 11 17 26 30 70 18
Assam 5598 144 410 795 1233 1110 1569 337
Bihar 18333 377 1735 1929 2824 3272 6199 1998
5072 260 641 669 992 996 1289 226
Goa 255 12 26 45 69 47 44 11
Gujarat 10223 327 873 1120 2176 2060 2956 710
Haryana 4169 67 226 403 951 928 1248 345
Himachal Pradesh 1288 50 105 159 323 268 318 65
Jammu & Kashmir 1949 28 106 189 354 395 675 203
Jharkhand 5519 127 441 605 976 1076 1815 479
Karnataka 9786 340 821 1326 2435 1944 2299 620
Kerala 6997 249 721 1181 2072 1323 1179 273
Madhya Pradesh 13602 538 1472 1563 2666 2748 3854 760
Maharashtra 19331 691 1831 2485 4752 3967 4528 1077
Manipur 475 7 35 68 98 96 148 23
Meghalaya 441 13 29 50 66 70 160 54
Mizoram 146 5 10 16 24 29 51 11
Nagaland 295 13 25 33 43 47 119 17
Orissa 8728 327 1038 1436 2034 1697 1899 296
Punjab 4808 91 276 525 1126 1100 1369 321
Rajasthan 11728 276 878 1078 2054 2292 3962 1188
Sikkim 83 2 5 11 18 16 25 5
Tamil Nadu 13787 753 1897 2426 4044 2589 1904 174
Tripura 774 21 67 160 220 148 144 14
31179 754 1968 2441 4126 5200 11672 5019
1655 66 129 180 319 333 509 119
West Bengal 17915 539 1678 3333 4848 3367 3485 725
A & N Islands 54 2 5 9 15 10 10 2
Chandigarh 112 4 10 14 27 23 27 6
D & N. Haveli 41 1 3 4 8 8 13 3
Daman & Diu 23 1 2 3 5 4 6 2
NCT of Delhi 2279 48 133 249 538 484 655 173
Lakshadweep 9 0.2 0.4 1 1 1 3 2
Puducherry 196 7 21 32 62 38 31 5
INDIA 213526 6988 19829 27272 46402 40774 56673 15588Source:
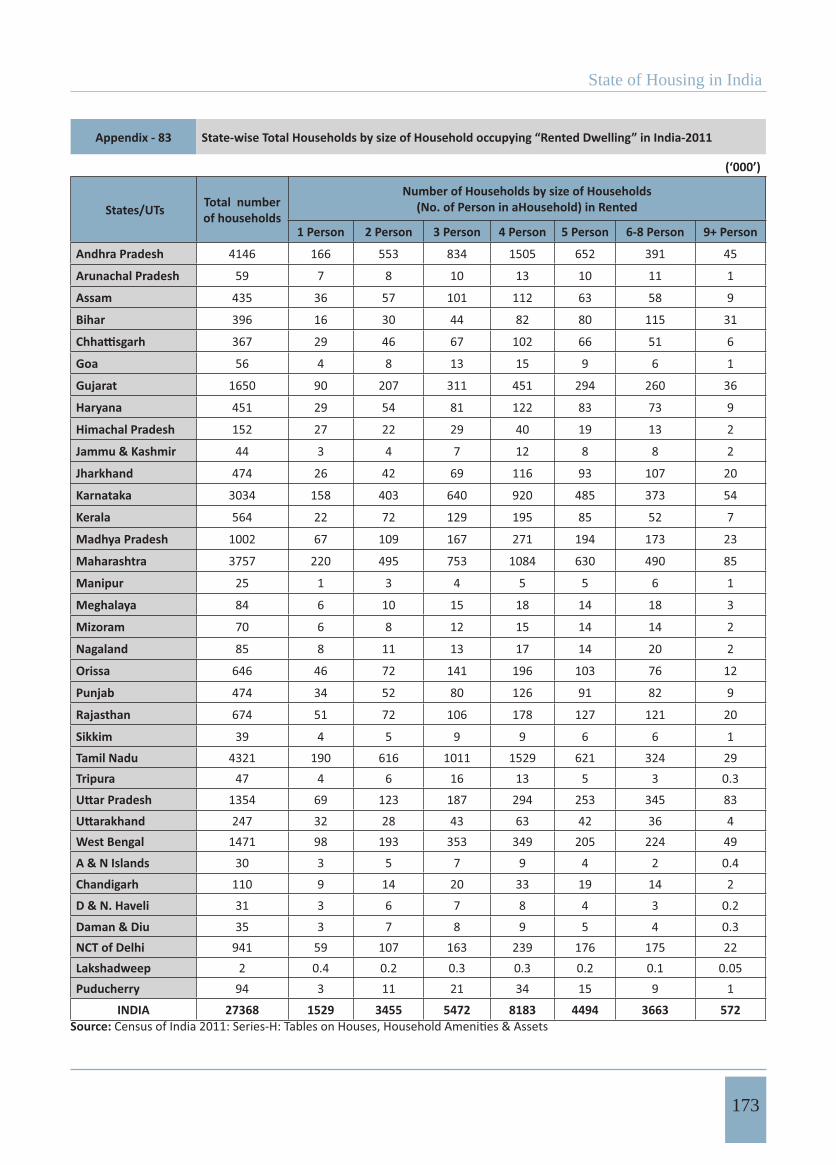
State of Housing in India
173
Appendix - 83 State-wise Total Households by size of Household occupying “Rented Dwelling” in India-2011
(‘000’)
States/UTs Total number of households
Number of Households by size of Households (No. of Person in aHousehold) in Rented
1 Person 2 Person 3 Person 4 Person 5 Person 6-8 Person 9+ Person
Andhra Pradesh 4146 166 553 834 1505 652 391 45
Arunachal Pradesh 59 7 8 10 13 10 11 1
Assam 435 36 57 101 112 63 58 9
Bihar 396 16 30 44 82 80 115 31
367 29 46 67 102 66 51 6
Goa 56 4 8 13 15 9 6 1
Gujarat 1650 90 207 311 451 294 260 36
Haryana 451 29 54 81 122 83 73 9
Himachal Pradesh 152 27 22 29 40 19 13 2
Jammu & Kashmir 44 3 4 7 12 8 8 2
Jharkhand 474 26 42 69 116 93 107 20
Karnataka 3034 158 403 640 920 485 373 54
Kerala 564 22 72 129 195 85 52 7
Madhya Pradesh 1002 67 109 167 271 194 173 23
Maharashtra 3757 220 495 753 1084 630 490 85
Manipur 25 1 3 4 5 5 6 1
Meghalaya 84 6 10 15 18 14 18 3
Mizoram 70 6 8 12 15 14 14 2
Nagaland 85 8 11 13 17 14 20 2
Orissa 646 46 72 141 196 103 76 12
Punjab 474 34 52 80 126 91 82 9
Rajasthan 674 51 72 106 178 127 121 20
Sikkim 39 4 5 9 9 6 6 1
Tamil Nadu 4321 190 616 1011 1529 621 324 29Tripura 47 4 6 16 13 5 3 0.3
1354 69 123 187 294 253 345 83
247 32 28 43 63 42 36 4West Bengal 1471 98 193 353 349 205 224 49
A & N Islands 30 3 5 7 9 4 2 0.4
Chandigarh 110 9 14 20 33 19 14 2
D & N. Haveli 31 3 6 7 8 4 3 0.2
Daman & Diu 35 3 7 8 9 5 4 0.3NCT of Delhi 941 59 107 163 239 176 175 22Lakshadweep 2 0.4 0.2 0.3 0.3 0.2 0.1 0.05Puducherry 94 3 11 21 34 15 9 1
INDIA 27368 1529 3455 5472 8183 4494 3663 572Source:
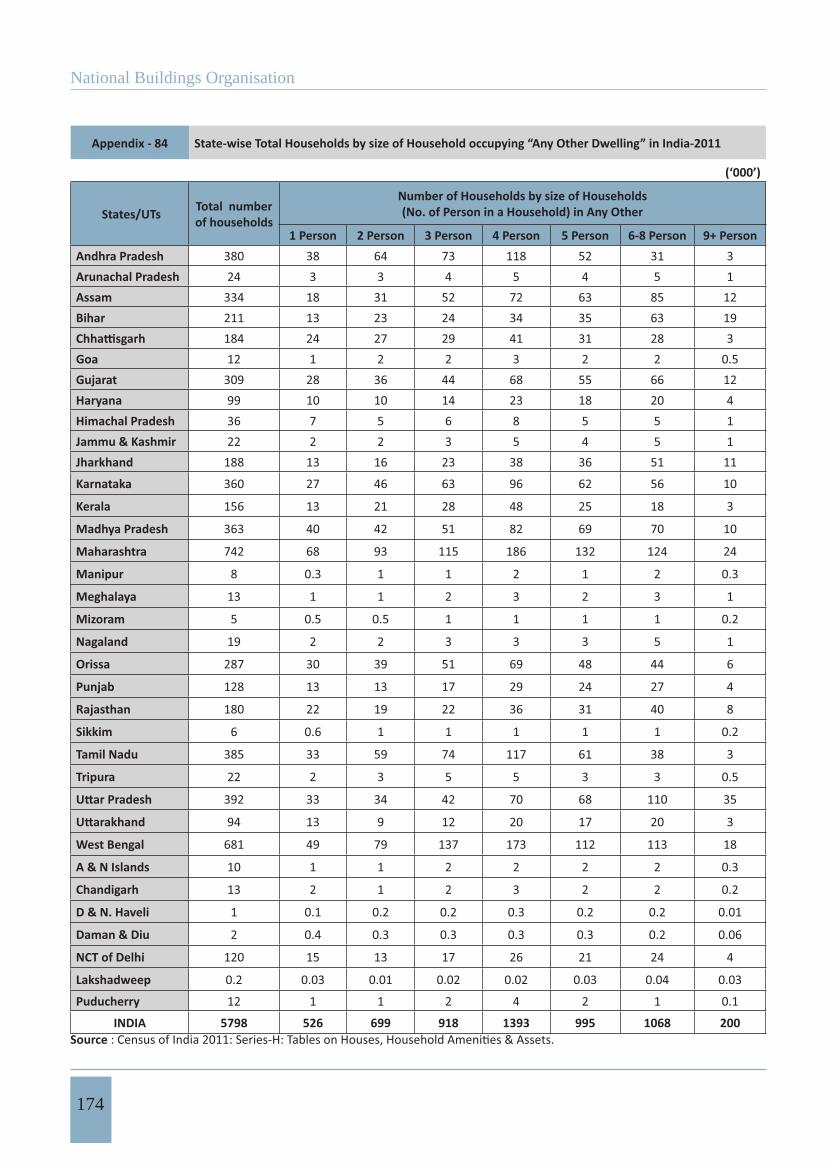
National Buildings Organisation
174
Appendix - 84 State-wise Total Households by size of Household occupying “Any Other Dwelling” in India-2011
(‘000’)
States/UTs Total number of households
Number of Households by size of Households (No. of Person in a Household) in Any Other
1 Person 2 Person 3 Person 4 Person 5 Person 6-8 Person 9+ Person Andhra Pradesh 380 38 64 73 118 52 31 3Arunachal Pradesh 24 3 3 4 5 4 5 1Assam 334 18 31 52 72 63 85 12Bihar 211 13 23 24 34 35 63 19
184 24 27 29 41 31 28 3Goa 12 1 2 2 3 2 2 0.5Gujarat 309 28 36 44 68 55 66 12Haryana 99 10 10 14 23 18 20 4Himachal Pradesh 36 7 5 6 8 5 5 1Jammu & Kashmir 22 2 2 3 5 4 5 1Jharkhand 188 13 16 23 38 36 51 11
Karnataka 360 27 46 63 96 62 56 10
Kerala 156 13 21 28 48 25 18 3
Madhya Pradesh 363 40 42 51 82 69 70 10
Maharashtra 742 68 93 115 186 132 124 24
Manipur 8 0.3 1 1 2 1 2 0.3
Meghalaya 13 1 1 2 3 2 3 1
Mizoram 5 0.5 0.5 1 1 1 1 0.2
Nagaland 19 2 2 3 3 3 5 1
Orissa 287 30 39 51 69 48 44 6
Punjab 128 13 13 17 29 24 27 4
Rajasthan 180 22 19 22 36 31 40 8
Sikkim 6 0.6 1 1 1 1 1 0.2
Tamil Nadu 385 33 59 74 117 61 38 3
Tripura 22 2 3 5 5 3 3 0.5
392 33 34 42 70 68 110 35
94 13 9 12 20 17 20 3
West Bengal 681 49 79 137 173 112 113 18
A & N Islands 10 1 1 2 2 2 2 0.3
Chandigarh 13 2 1 2 3 2 2 0.2
D & N. Haveli 1 0.1 0.2 0.2 0.3 0.2 0.2 0.01
Daman & Diu 2 0.4 0.3 0.3 0.3 0.3 0.2 0.06
NCT of Delhi 120 15 13 17 26 21 24 4
Lakshadweep 0.2 0.03 0.01 0.02 0.02 0.03 0.04 0.03
Puducherry 12 1 1 2 4 2 1 0.1
INDIA 5798 526 699 918 1393 995 1068 200Source

State of Housing in India
175
Appendix - 85 State-wise Rural Households by size of Household occupying “Owned Dwelling” in India-2011
(‘000’)
States/UTs Total number of households
Number of Households by size of Households (No. of Person in aHousehold) Occupying Owned Dwelling
1 Person 2 Person 3 Person 4 Person 5 Person 6-8 Person 9+ Person Andhra Pradesh 14246 816 2059 2426 4267 2535 1933 210Arunachal Pradesh 196 9 14 21 30 32 71 18Assam 5375 151 408 759 1149 1063 1530 313Bihar 16927 362 1654 1806 2588 3003 5714 1801
4384 252 591 590 838 843 1097 173Goa 125 7 13 21 32 24 22 5Gujarat 6765 252 628 682 1288 1354 2082 480Haryana 2966 54 159 276 641 655 921 261Himachal Pradesh 1311 66 111 165 325 266 314 63Jammu & Kashmir 1498 23 88 147 251 291 540 157Jharkhand 4686 119 395 521 812 905 1547 388Karnataka 7864 322 693 1059 1945 1553 1814 479
Kerala 4096 162 441 700 1216 777 668 132
Madhya Pradesh 11122 507 1316 1316 2151 2221 3094 517
Maharashtra 13017 560 1368 1573 3071 2696 3093 656Manipur 336 5 26 47 65 66 110 17Meghalaya 422 14 30 51 65 66 149 48
Mizoram 105 5 7 13 18 20 33 7
Nagaland 285 15 26 33 42 44 111 14
Orissa 8144 334 1007 1361 1890 1571 1735 245
Punjab 3316 74 193 352 732 757 980 227
Rajasthan 9490 252 750 885 1611 1831 3248 912
Sikkim 92 4 7 13 20 17 26 5
Tamil Nadu 9564 601 1367 1659 2717 1800 1315 104
Tripura 608 18 53 118 167 120 121 11
25475 677 1673 1949 3166 4150 9666 4193
1405 84 119 156 262 275 419 91
West Bengal 13717 435 1229 2367 3751 2682 2733 520
A & N Islands 50 5 7 10 16 10 9 2
Chandigarh 7 1 1 1 2 1 1 0.2
D & N. Haveli 35 2 4 4 6 6 11 3
Daman & Diu 13 1 1 2 3 2 3 1
NCT of Delhi 79 2 4 8 17 17 24 6
Lakshadweep 3 0.1 0.2 0.2 0.4 0.4 1 0.5
Puducherry 95 4 10 16 30 19 14 2
INDIA 167827 6195 16455 21108 35182 31675 45149 12064Source

National Buildings Organisation
176
Appendix - 86 State-wise Rural Households by size of Household occupying “Owned Dwelling” in India-2011
(‘000’)
States/UTs Total number of households
Number of Households by size of Households (No. of Person in aHousehold) Occupying Owned Dwelling
1 Person 2 Person 3 Person 4 Person 5 Person 6-8 Person 9+ Person
Andhra Pradesh 12859 716 1838 2145 3779 2345 1834 201
Arunachal Pradesh 159 5 10 15 23 26 63 17
Assam 4962 128 367 691 1062 987 1427 299
Bihar 16662 348 1626 1776 2547 2958 5632 1775
4205 225 562 561 799 814 1073 171
Goa 109 5 11 18 28 22 20 5
Gujarat 6295 218 571 608 1173 1267 1993 467
Haryana 2850 43 146 260 615 633 896 256
Himachal Pradesh 1206 46 97 147 300 252 302 61
Jammu & Kashmir 1477 22 86 144 247 288 534 156
Jharkhand 4574 109 383 505 789 884 1520 383
Karnataka 7072 263 585 913 1719 1420 1709 463
Kerala 3800 145 401 638 1117 731 640 128
Madhya Pradesh 10739 462 1266 1260 2064 2152 3026 510
Maharashtra 11786 462 1205 1359 2725 2481 2925 630
Manipur 322 5 25 45 62 64 106 17
Meghalaya 390 11 26 45 58 61 141 47
Mizoram 90 3 7 11 15 17 31 6
Nagaland 249 11 22 28 36 39 101 13
Orissa 7819 299 960 1299 1810 1520 1691 240
Punjab 3168 61 178 332 700 728 947 222
Rajasthan 9229 224 721 851 1556 1783 3191 902
Sikkim 71 2 4 9 15 14 22 5
Tamil Nadu 8656 532 1224 1467 2421 1668 1245 99
Tripura 582 16 50 112 160 116 117 11
25055 646 1637 1907 3102 4082 9536 4146
1260 58 103 136 231 252 393 87
West Bengal 13117 396 1158 2243 3596 2581 2636 507
A & N Islands 38 2 4 6 11 7 7 2
Chandigarh 2 0.03 0.1 0.1 0.4 0.3 0.5 0.2
D & N. Haveli 28 0.5 2 2 4 5 10 2
Daman & Diu 9 0.5 1 1 2 2 3 1
NCT of Delhi 65 1 3 5 14 15 21 6
Lakshadweep 2 0.1 0.1 0.2 0.3 0.4 1 0.4
Puducherry 78 3 8 12 24 16 12 1
INDIA 158984 5467 15288 19552 32806 30228 43807 11836Source
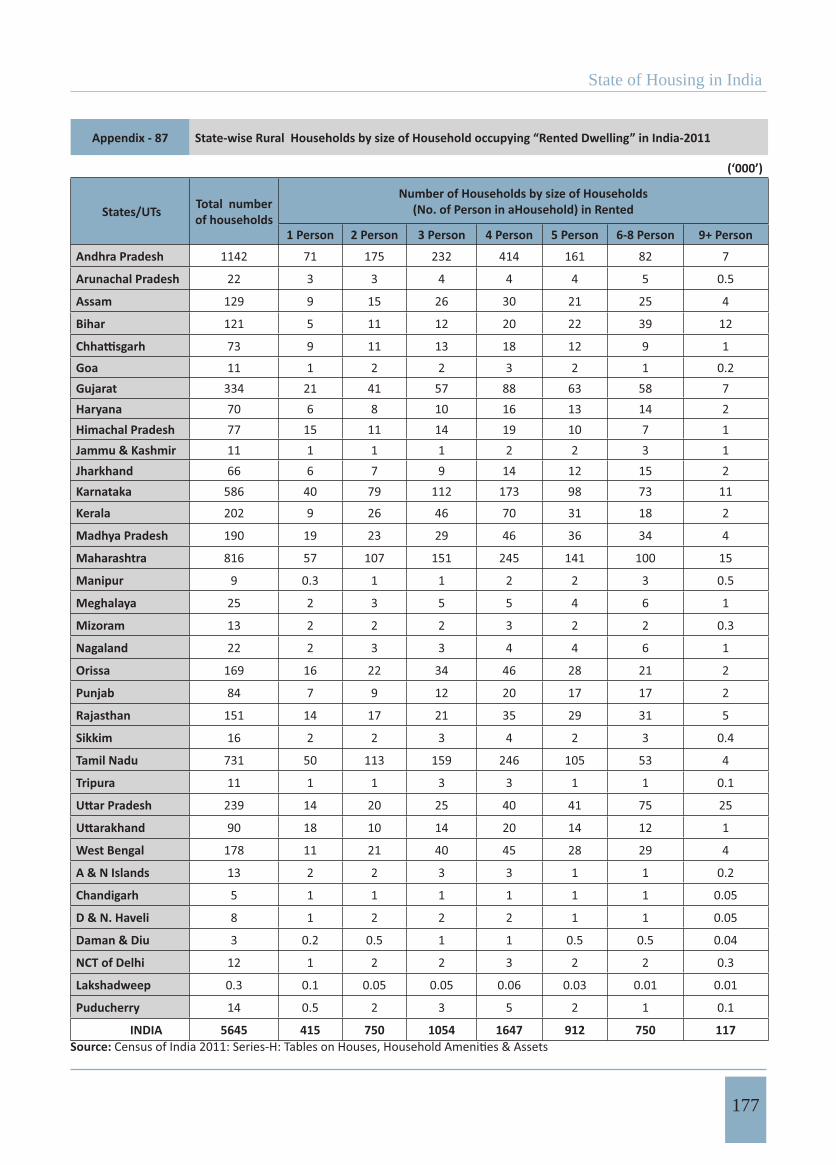
State of Housing in India
177
Appendix - 87 State-wise Rural Households by size of Household occupying “Rented Dwelling” in India-2011
(‘000’)
States/UTs Total number of households
Number of Households by size of Households (No. of Person in aHousehold) in Rented
1 Person 2 Person 3 Person 4 Person 5 Person 6-8 Person 9+ Person
Andhra Pradesh 1142 71 175 232 414 161 82 7
Arunachal Pradesh 22 3 3 4 4 4 5 0.5
Assam 129 9 15 26 30 21 25 4
Bihar 121 5 11 12 20 22 39 12
73 9 11 13 18 12 9 1
Goa 11 1 2 2 3 2 1 0.2Gujarat 334 21 41 57 88 63 58 7Haryana 70 6 8 10 16 13 14 2Himachal Pradesh 77 15 11 14 19 10 7 1Jammu & Kashmir 11 1 1 1 2 2 3 1Jharkhand 66 6 7 9 14 12 15 2Karnataka 586 40 79 112 173 98 73 11
Kerala 202 9 26 46 70 31 18 2
Madhya Pradesh 190 19 23 29 46 36 34 4
Maharashtra 816 57 107 151 245 141 100 15
Manipur 9 0.3 1 1 2 2 3 0.5
Meghalaya 25 2 3 5 5 4 6 1
Mizoram 13 2 2 2 3 2 2 0.3
Nagaland 22 2 3 3 4 4 6 1
Orissa 169 16 22 34 46 28 21 2
Punjab 84 7 9 12 20 17 17 2
Rajasthan 151 14 17 21 35 29 31 5
Sikkim 16 2 2 3 4 2 3 0.4
Tamil Nadu 731 50 113 159 246 105 53 4
Tripura 11 1 1 3 3 1 1 0.1
239 14 20 25 40 41 75 25
90 18 10 14 20 14 12 1
West Bengal 178 11 21 40 45 28 29 4
A & N Islands 13 2 2 3 3 1 1 0.2
Chandigarh 5 1 1 1 1 1 1 0.05
D & N. Haveli 8 1 2 2 2 1 1 0.05
Daman & Diu 3 0.2 0.5 1 1 0.5 0.5 0.04
NCT of Delhi 12 1 2 2 3 2 2 0.3
Lakshadweep 0.3 0.1 0.05 0.05 0.06 0.03 0.01 0.01
Puducherry 14 0.5 2 3 5 2 1 0.1
INDIA 5645 415 750 1054 1647 912 750 117Source:
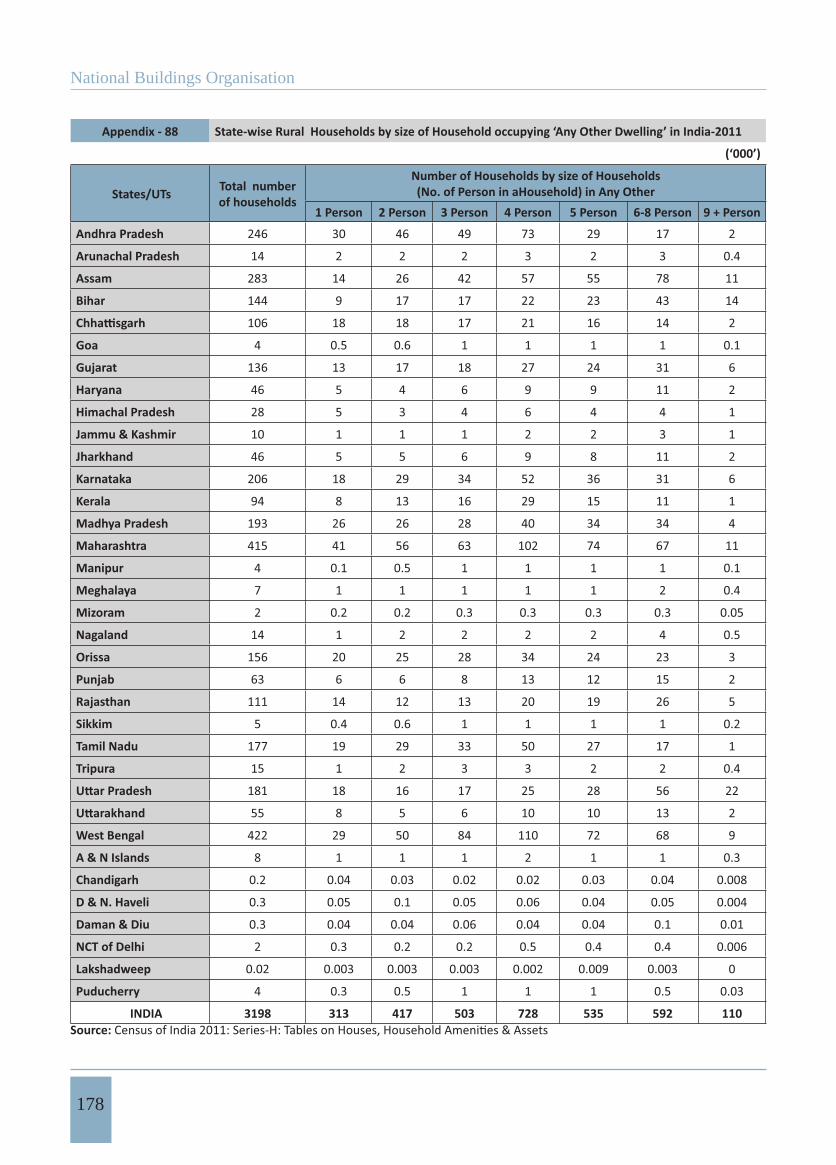
National Buildings Organisation
178
Appendix - 88 State-wise Rural Households by size of Household occupying ‘Any Other Dwelling’ in India-2011
(‘000’)
States/UTs Total number of households
Number of Households by size of Households (No. of Person in aHousehold) in Any Other
1 Person 2 Person 3 Person 4 Person 5 Person 6-8 Person 9 + Person
Andhra Pradesh 246 30 46 49 73 29 17 2
Arunachal Pradesh 14 2 2 2 3 2 3 0.4
Assam 283 14 26 42 57 55 78 11
Bihar 144 9 17 17 22 23 43 14
106 18 18 17 21 16 14 2
Goa 4 0.5 0.6 1 1 1 1 0.1
Gujarat 136 13 17 18 27 24 31 6
Haryana 46 5 4 6 9 9 11 2
Himachal Pradesh 28 5 3 4 6 4 4 1
Jammu & Kashmir 10 1 1 1 2 2 3 1
Jharkhand 46 5 5 6 9 8 11 2
Karnataka 206 18 29 34 52 36 31 6
Kerala 94 8 13 16 29 15 11 1
Madhya Pradesh 193 26 26 28 40 34 34 4
Maharashtra 415 41 56 63 102 74 67 11
Manipur 4 0.1 0.5 1 1 1 1 0.1
Meghalaya 7 1 1 1 1 1 2 0.4
Mizoram 2 0.2 0.2 0.3 0.3 0.3 0.3 0.05
Nagaland 14 1 2 2 2 2 4 0.5
Orissa 156 20 25 28 34 24 23 3
Punjab 63 6 6 8 13 12 15 2
Rajasthan 111 14 12 13 20 19 26 5
Sikkim 5 0.4 0.6 1 1 1 1 0.2
Tamil Nadu 177 19 29 33 50 27 17 1
Tripura 15 1 2 3 3 2 2 0.4
181 18 16 17 25 28 56 22
55 8 5 6 10 10 13 2
West Bengal 422 29 50 84 110 72 68 9
A & N Islands 8 1 1 1 2 1 1 0.3
Chandigarh 0.2 0.04 0.03 0.02 0.02 0.03 0.04 0.008
D & N. Haveli 0.3 0.05 0.1 0.05 0.06 0.04 0.05 0.004
Daman & Diu 0.3 0.04 0.04 0.06 0.04 0.04 0.1 0.01
NCT of Delhi 2 0.3 0.2 0.2 0.5 0.4 0.4 0.006
Lakshadweep 0.02 0.003 0.003 0.003 0.002 0.009 0.003 0
Puducherry 4 0.3 0.5 1 1 1 0.5 0.03
INDIA 3198 313 417 503 728 535 592 110Source:

State of Housing in India
179
Appendix - 89 State-wise Total Urban Households by size of Household occupying number of Dwelling in India-2011
(‘000’)
States/UTs Total number of households
Number of Households by size of Households (No. of Person in aHousehold) Occupying Dwelling
1 Person 2 Person 3 Person 4 Person 5 Person 6-8 Person 9+ Person
Andhra Pradesh 6778 230 817 1198 2234 1226 930 142
Arunachal Pradesh 66 6 7 10 14 11 15 3
Assam 993 47 89 189 268 173 182 45
Bihar 2014 44 133 191 351 385 662 247
1239 60 123 174 297 251 271 62
Goa 198 10 23 39 55 34 29 8
Gujarat 5416 193 488 793 1407 1056 1201 278
Haryana 1752 53 132 221 455 374 420 97
Himachal Pradesh 166 18 20 29 47 26 22 4
Jammu & Kashmir 517 9 24 52 119 116 148 48
Jharkhand 1496 47 104 176 319 301 426 122
Karnataka 5316 202 578 970 1507 939 915 205
Kerala 3621 123 374 638 1098 655 581 151
Madhya Pradesh 3845 138 307 464 868 790 1003 275
Maharashtra 10814 420 1051 1780 2952 2034 2049 529
Manipur 171 3 13 27 40 35 47 7
Meghalaya 116 6 10 16 22 20 33 9
Mizoram 116 6 10 15 22 24 33 7
Nagaland 115 8 12 16 21 20 34 6
Orissa 1517 69 143 266 408 277 285 69
Punjab 2094 64 147 270 549 458 498 108
Rajasthan 3091 96 219 321 656 619 874 305
Sikkim 36 2 4 7 9 6 7 1
Tamil Nadu 8929 376 1205 1853 2972 1471 951 102
Tripura 235 8 23 63 72 37 29 4
7449 179 452 721 1324 1370 2460 944
592 27 47 79 141 117 147 36
West Bengal 6350 251 661 1456 1619 1003 1088 272A & N Islands 34 2 4 7 11 6 4 1Chandigarh 228 14 23 35 62 43 42 8D & N. Haveli 38 3 6 8 10 6 5 1Daman & Diu 48 4 8 10 12 7 6 1
NCT of Delhi 3261 121 248 421 786 664 830 192
Lakshadweep 8 0.5 0.5 1 1 1 2 2
Puducherry 206 7 23 39 69 36 27 5
INDIA 78866 2848 7528 12554 20796 14588 16255 4297Source

National Buildings Organisation
180
Appendix - 90 State-wise Urban Households by size of Household occupying “Owned Dwelling” in India-2011
(‘000’)
States/UTs Total number of households
Number of Households by size of Households (No. of Person in aHousehold) Occupying Owned Dwelling
1 Person 2 Person 3 Person 4 Person 5 Person 6-8 Person 9+ Person
Andhra Pradesh 3640 127 421 572 1098 712 607 103
Arunachal Pradesh 19 1 1 2 3 3 7 2
Assam 636 15 43 103 171 123 142 39
Bihar 1671 29 109 153 277 315 567 223
867 34 79 108 193 182 216 55
Goa 145 7 16 27 41 26 23 7
Gujarat 3928 109 303 512 1003 793 964 244
Haryana 1318 24 80 143 336 295 353 89
Himachal Pradesh 82 4 8 12 23 16 15 4
Jammu & Kashmir 472 6 20 45 106 108 140 47
Jharkhand 945 18 58 99 187 192 294 96
Karnataka 2714 77 236 413 715 524 590 157
Kerala 3197 104 320 543 954 592 539 144
Madhya Pradesh 2863 76 206 304 602 596 829 250
Maharashtra 7546 230 626 1126 2028 1487 1603 446
Manipur 152 2 11 24 36 32 42 6
Meghalaya 51 1 3 5 8 9 19 7
Mizoram 56 2 3 5 9 12 20 5
Nagaland 47 1 3 5 7 8 18 4
Orissa 910 29 79 137 234 178 208 56
Punjab 1640 30 98 193 427 372 422 99
Rajasthan 244 51 157 227 498 509 771 286
Sikkim 12 0.3 1 2 3 2 3 1
Tamil Nadu 5130 221 673 959 1622 920 659 75
Tripura 193 5 17 48 60 32 27 3
6124 108 331 534 1024 1118 2137 873
396 9 26 44 88 81 116 32
West Bengal 4799 143 459 1090 1253 786 848 218
A & N Islands 15 0.6 1 3 5 3 3 1
Chandigarh 110 4 10 14 27 23 27 6
D & N. Haveli 13 0.3 1 2 4 2 3 1
Daman & Diu 14 1 1 2 3 3 3 1
NCT of Delhi 2215 47 130 243 524 469 634 167
Lakshadweep 7 0.2 0.3 0.5 1 1 2 2
Puducherry 118 4 12 20 38 22 18 4
INDIA 54542 1521 4541 7720 13596 10546 12866 3752Source:

State of Housing in India
181
Appendix - 91 State-wise Urban Households by size of Household occupying ‘Rented Dwelling’ in India-2011
(‘000’)
States/UTs Total number of households
Number of Households by size of Households (No. of Person in aHousehold) Occupying Rented Dwelling
1 Person 2 Person 3 Person 4 Person 5 Person 6-8 Person 9+ Person
Andhra Pradesh 3005 95 378 602 1091 492 309 38
Arunachal Pradesh 37 4 5 6 8 6 6 1
Assam 307 27 42 76 83 42 33 5
Bihar 275 10 19 31 62 58 75 19
294 19 36 54 84 54 41 5
Goa 45 3 6 10 12 7 5 1
Gujarat 1315 69 166 255 363 232 203 29
Haryana 380 23 46 70 106 70 59 7
Himachal Pradesh 75 12 11 15 21 9 5 1
Jammu & Kashmir 34 3 3 5 9 7 5 1
Jharkhand 408 20 35 60 102 81 92 18
Karnataka 2448 117 324 528 747 387 300 44
Kerala 362 14 46 84 125 54 35 5
Madhya Pradesh 812 48 85 138 225 159 139 19
Maharashtra 2941 163 388 602 840 488 390 70
Manipur 16 1 2 2 3 3 4 0.5
Meghalaya 59 4 7 11 13 10 12 2
Mizoram 57 4 6 9 12 11 12 2
Nagaland 63 6 8 10 13 11 14 2
Orissa 476 30 50 106 150 76 56 9
Punjab 390 28 43 67 106 74 64 7
Rajasthan 523 37 55 85 143 99 90 15
Sikkim 23 2 3 5 5 3 3 0.5Tamil Nadu 3590 140 503 852 1283 517 271 25Tripura 36 3 5 13 10 3 2 0.2
1115 56 103 162 254 212 270 58158 13 17 29 43 28 24 3
West Bengal 1292 87 172 313 304 177 195 45A & N Islands 17 1 2 4 5 2 1 0.3Chandigarh 105 9 13 20 32 18 13 1D & N. Haveli 24 2 4 6 6 3 2 0.2Daman & Diu 32 2 6 8 8 4 3 0.3NCT of Delhi 929 58 105 161 236 174 173 21Lakshadweep 1 0.2 0.2 0.2 0.3 0.1 0.1 0.03Puducherry 80 2 9 18 29 13 8 1
INDIA 21724 1115 2706 4418 6535 3582 2913 455Source:
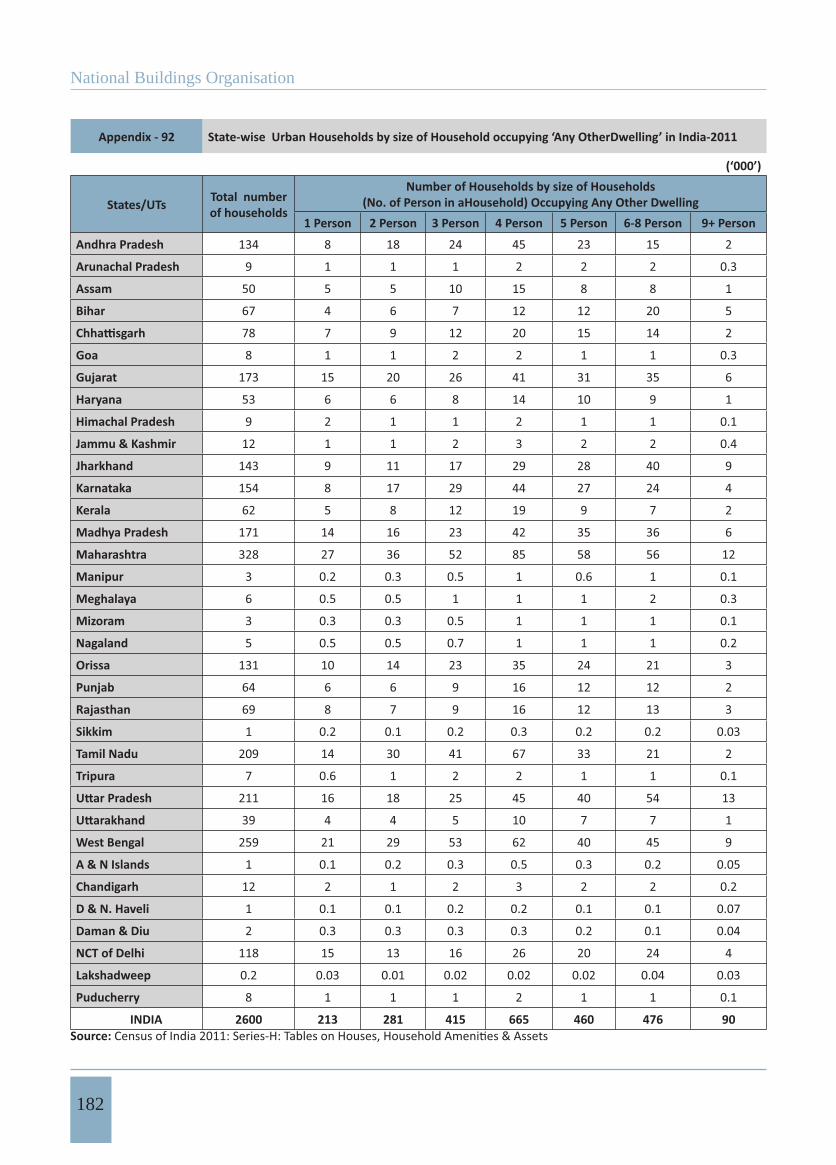
National Buildings Organisation
182
Appendix - 92 State-wise Urban Households by size of Household occupying ‘Any OtherDwelling’ in India-2011
(‘000’)
States/UTs Total number of households
Number of Households by size of Households (No. of Person in aHousehold) Occupying Any Other Dwelling
1 Person 2 Person 3 Person 4 Person 5 Person 6-8 Person 9+ Person
Andhra Pradesh 134 8 18 24 45 23 15 2
Arunachal Pradesh 9 1 1 1 2 2 2 0.3
Assam 50 5 5 10 15 8 8 1
Bihar 67 4 6 7 12 12 20 5
78 7 9 12 20 15 14 2
Goa 8 1 1 2 2 1 1 0.3
Gujarat 173 15 20 26 41 31 35 6
Haryana 53 6 6 8 14 10 9 1
Himachal Pradesh 9 2 1 1 2 1 1 0.1
Jammu & Kashmir 12 1 1 2 3 2 2 0.4
Jharkhand 143 9 11 17 29 28 40 9
Karnataka 154 8 17 29 44 27 24 4
Kerala 62 5 8 12 19 9 7 2
Madhya Pradesh 171 14 16 23 42 35 36 6
Maharashtra 328 27 36 52 85 58 56 12
Manipur 3 0.2 0.3 0.5 1 0.6 1 0.1
Meghalaya 6 0.5 0.5 1 1 1 2 0.3
Mizoram 3 0.3 0.3 0.5 1 1 1 0.1
Nagaland 5 0.5 0.5 0.7 1 1 1 0.2
Orissa 131 10 14 23 35 24 21 3
Punjab 64 6 6 9 16 12 12 2
Rajasthan 69 8 7 9 16 12 13 3
Sikkim 1 0.2 0.1 0.2 0.3 0.2 0.2 0.03
Tamil Nadu 209 14 30 41 67 33 21 2
Tripura 7 0.6 1 2 2 1 1 0.1
211 16 18 25 45 40 54 13
39 4 4 5 10 7 7 1
West Bengal 259 21 29 53 62 40 45 9
A & N Islands 1 0.1 0.2 0.3 0.5 0.3 0.2 0.05
Chandigarh 12 2 1 2 3 2 2 0.2
D & N. Haveli 1 0.1 0.1 0.2 0.2 0.1 0.1 0.07
Daman & Diu 2 0.3 0.3 0.3 0.3 0.2 0.1 0.04
NCT of Delhi 118 15 13 16 26 20 24 4
Lakshadweep 0.2 0.03 0.01 0.02 0.02 0.02 0.04 0.03
Puducherry 8 1 1 1 2 1 1 0.1
INDIA 2600 213 281 415 665 460 476 90Source:
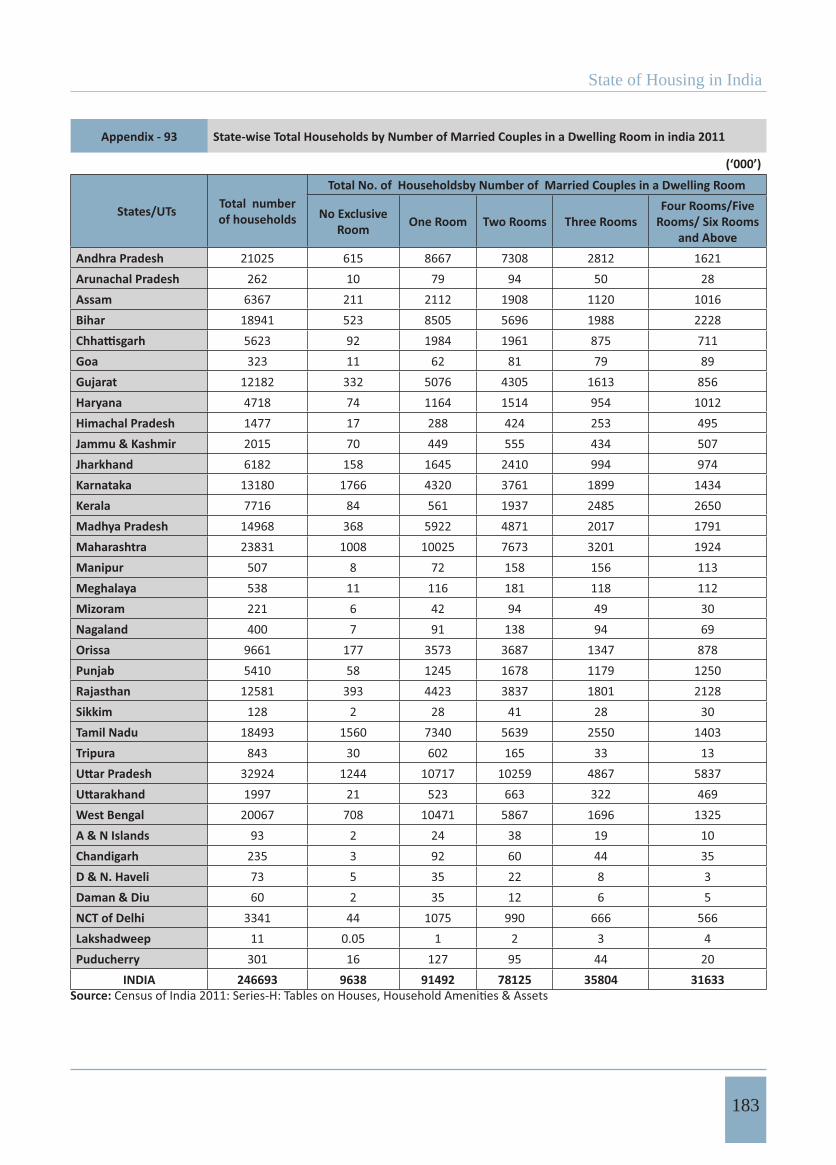
State of Housing in India
183
Appendix - 93 State-wise Total Households by Number of Married Couples in a Dwelling Room in india 2011
(‘000’)
States/UTs Total number of households
Total No. of Householdsby Number of Married Couples in a Dwelling Room
No Exclusive Room One Room Two Rooms Three Rooms
Four Rooms/Five Rooms/ Six Rooms
and AboveAndhra Pradesh 21025 615 8667 7308 2812 1621Arunachal Pradesh 262 10 79 94 50 28Assam 6367 211 2112 1908 1120 1016Bihar 18941 523 8505 5696 1988 2228
5623 92 1984 1961 875 711Goa 323 11 62 81 79 89Gujarat 12182 332 5076 4305 1613 856Haryana 4718 74 1164 1514 954 1012Himachal Pradesh 1477 17 288 424 253 495Jammu & Kashmir 2015 70 449 555 434 507Jharkhand 6182 158 1645 2410 994 974Karnataka 13180 1766 4320 3761 1899 1434Kerala 7716 84 561 1937 2485 2650Madhya Pradesh 14968 368 5922 4871 2017 1791Maharashtra 23831 1008 10025 7673 3201 1924Manipur 507 8 72 158 156 113Meghalaya 538 11 116 181 118 112Mizoram 221 6 42 94 49 30Nagaland 400 7 91 138 94 69Orissa 9661 177 3573 3687 1347 878Punjab 5410 58 1245 1678 1179 1250Rajasthan 12581 393 4423 3837 1801 2128Sikkim 128 2 28 41 28 30Tamil Nadu 18493 1560 7340 5639 2550 1403Tripura 843 30 602 165 33 13
32924 1244 10717 10259 4867 58371997 21 523 663 322 469
West Bengal 20067 708 10471 5867 1696 1325A & N Islands 93 2 24 38 19 10Chandigarh 235 3 92 60 44 35D & N. Haveli 73 5 35 22 8 3Daman & Diu 60 2 35 12 6 5NCT of Delhi 3341 44 1075 990 666 566Lakshadweep 11 0.05 1 2 3 4Puducherry 301 16 127 95 44 20
INDIA 246693 9638 91492 78125 35804 31633Source:
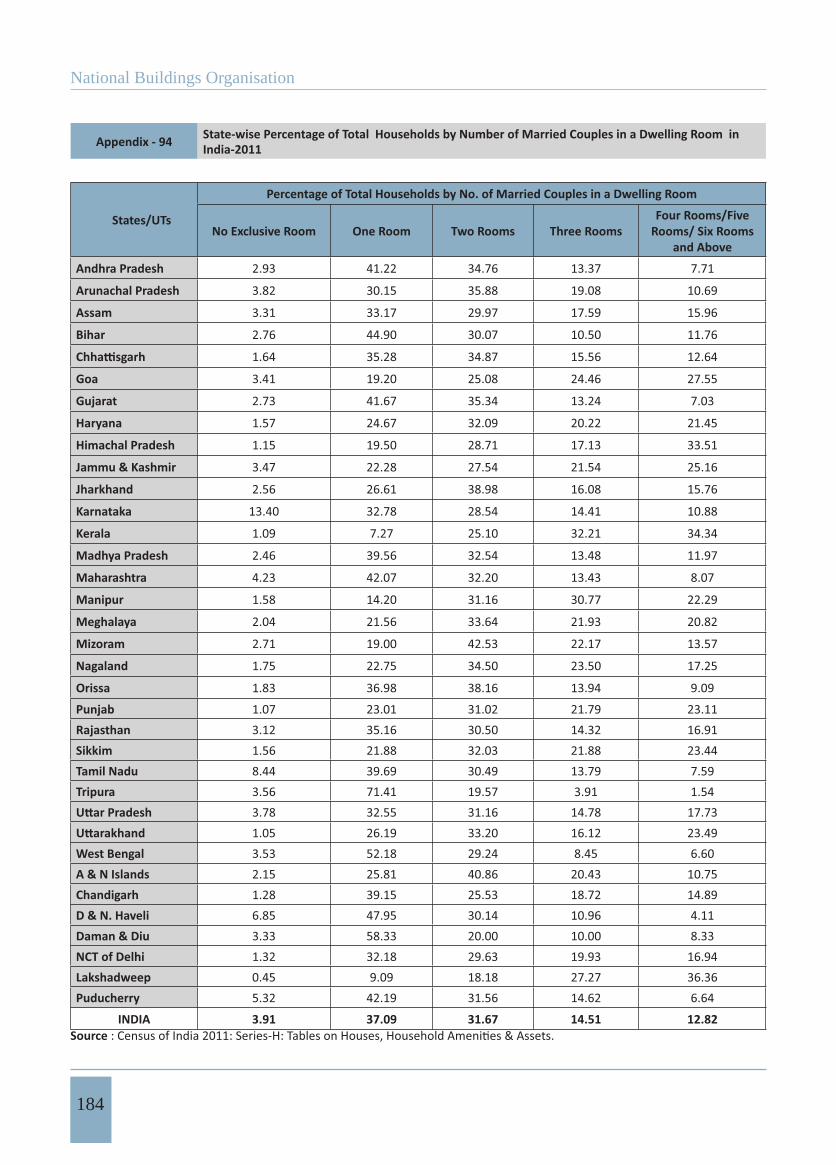
National Buildings Organisation
184
Appendix - 94 State-wise Percentage of Total Households by Number of Married Couples in a Dwelling Room in India-2011
States/UTs
Percentage of Total Households by No. of Married Couples in a Dwelling Room
No Exclusive Room One Room Two Rooms Three RoomsFour Rooms/Five
Rooms/ Six Rooms and Above
Andhra Pradesh 2.93 41.22 34.76 13.37 7.71
Arunachal Pradesh 3.82 30.15 35.88 19.08 10.69
Assam 3.31 33.17 29.97 17.59 15.96
Bihar 2.76 44.90 30.07 10.50 11.76
1.64 35.28 34.87 15.56 12.64
Goa 3.41 19.20 25.08 24.46 27.55
Gujarat 2.73 41.67 35.34 13.24 7.03
Haryana 1.57 24.67 32.09 20.22 21.45
Himachal Pradesh 1.15 19.50 28.71 17.13 33.51
Jammu & Kashmir 3.47 22.28 27.54 21.54 25.16
Jharkhand 2.56 26.61 38.98 16.08 15.76
Karnataka 13.40 32.78 28.54 14.41 10.88
Kerala 1.09 7.27 25.10 32.21 34.34
Madhya Pradesh 2.46 39.56 32.54 13.48 11.97
Maharashtra 4.23 42.07 32.20 13.43 8.07
Manipur 1.58 14.20 31.16 30.77 22.29
Meghalaya 2.04 21.56 33.64 21.93 20.82
Mizoram 2.71 19.00 42.53 22.17 13.57
Nagaland 1.75 22.75 34.50 23.50 17.25
Orissa 1.83 36.98 38.16 13.94 9.09
Punjab 1.07 23.01 31.02 21.79 23.11Rajasthan 3.12 35.16 30.50 14.32 16.91Sikkim 1.56 21.88 32.03 21.88 23.44Tamil Nadu 8.44 39.69 30.49 13.79 7.59Tripura 3.56 71.41 19.57 3.91 1.54
3.78 32.55 31.16 14.78 17.731.05 26.19 33.20 16.12 23.49
West Bengal 3.53 52.18 29.24 8.45 6.60A & N Islands 2.15 25.81 40.86 20.43 10.75Chandigarh 1.28 39.15 25.53 18.72 14.89D & N. Haveli 6.85 47.95 30.14 10.96 4.11Daman & Diu 3.33 58.33 20.00 10.00 8.33NCT of Delhi 1.32 32.18 29.63 19.93 16.94Lakshadweep 0.45 9.09 18.18 27.27 36.36Puducherry 5.32 42.19 31.56 14.62 6.64
INDIA 3.91 37.09 31.67 14.51 12.82Source
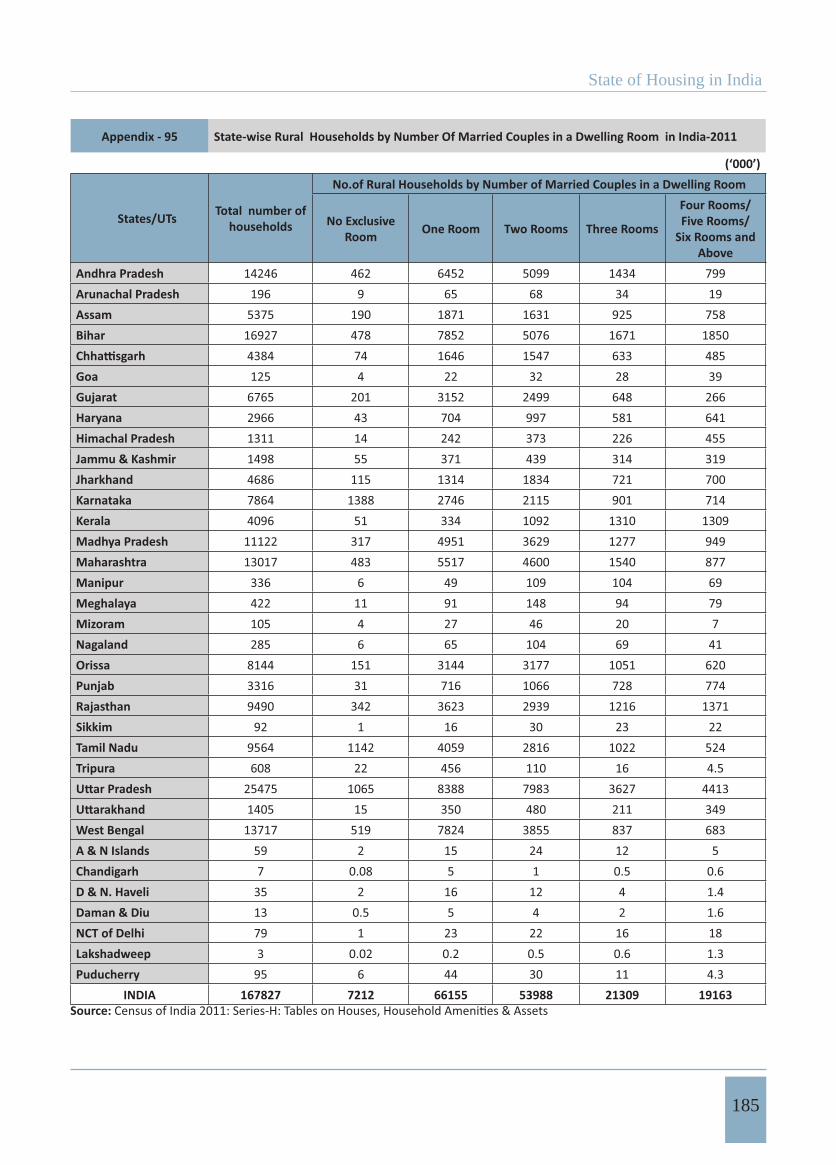
State of Housing in India
185
Appendix - 95 State-wise Rural Households by Number Of Married Couples in a Dwelling Room in India-2011
(‘000’)
States/UTs Total number of households
No.of Rural Households by Number of Married Couples in a Dwelling Room
No Exclusive Room One Room Two Rooms Three Rooms
Four Rooms/Five Rooms/
Six Rooms and Above
Andhra Pradesh 14246 462 6452 5099 1434 799Arunachal Pradesh 196 9 65 68 34 19Assam 5375 190 1871 1631 925 758Bihar 16927 478 7852 5076 1671 1850
4384 74 1646 1547 633 485Goa 125 4 22 32 28 39Gujarat 6765 201 3152 2499 648 266Haryana 2966 43 704 997 581 641Himachal Pradesh 1311 14 242 373 226 455Jammu & Kashmir 1498 55 371 439 314 319Jharkhand 4686 115 1314 1834 721 700Karnataka 7864 1388 2746 2115 901 714Kerala 4096 51 334 1092 1310 1309Madhya Pradesh 11122 317 4951 3629 1277 949Maharashtra 13017 483 5517 4600 1540 877Manipur 336 6 49 109 104 69Meghalaya 422 11 91 148 94 79Mizoram 105 4 27 46 20 7Nagaland 285 6 65 104 69 41Orissa 8144 151 3144 3177 1051 620Punjab 3316 31 716 1066 728 774Rajasthan 9490 342 3623 2939 1216 1371Sikkim 92 1 16 30 23 22Tamil Nadu 9564 1142 4059 2816 1022 524Tripura 608 22 456 110 16 4.5
25475 1065 8388 7983 3627 44131405 15 350 480 211 349
West Bengal 13717 519 7824 3855 837 683A & N Islands 59 2 15 24 12 5Chandigarh 7 0.08 5 1 0.5 0.6D & N. Haveli 35 2 16 12 4 1.4Daman & Diu 13 0.5 5 4 2 1.6NCT of Delhi 79 1 23 22 16 18Lakshadweep 3 0.02 0.2 0.5 0.6 1.3Puducherry 95 6 44 30 11 4.3
INDIA 167827 7212 66155 53988 21309 19163Source:
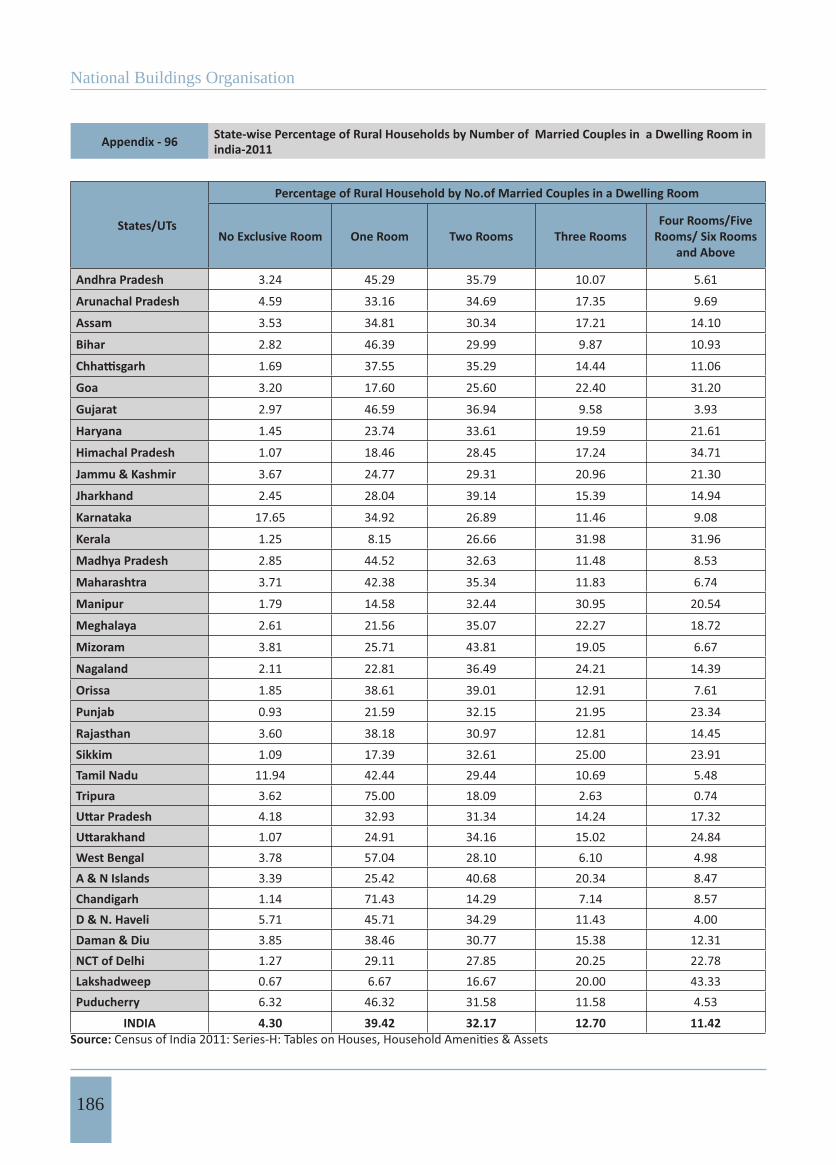
National Buildings Organisation
186
Appendix - 96 State-wise Percentage of Rural Households by Number of Married Couples in a Dwelling Room in india-2011
States/UTs
Percentage of Rural Household by No.of Married Couples in a Dwelling Room
No Exclusive Room One Room Two Rooms Three RoomsFour Rooms/Five
Rooms/ Six Rooms and Above
Andhra Pradesh 3.24 45.29 35.79 10.07 5.61
Arunachal Pradesh 4.59 33.16 34.69 17.35 9.69
Assam 3.53 34.81 30.34 17.21 14.10
Bihar 2.82 46.39 29.99 9.87 10.93
1.69 37.55 35.29 14.44 11.06
Goa 3.20 17.60 25.60 22.40 31.20
Gujarat 2.97 46.59 36.94 9.58 3.93
Haryana 1.45 23.74 33.61 19.59 21.61
Himachal Pradesh 1.07 18.46 28.45 17.24 34.71
Jammu & Kashmir 3.67 24.77 29.31 20.96 21.30
Jharkhand 2.45 28.04 39.14 15.39 14.94
Karnataka 17.65 34.92 26.89 11.46 9.08
Kerala 1.25 8.15 26.66 31.98 31.96
Madhya Pradesh 2.85 44.52 32.63 11.48 8.53
Maharashtra 3.71 42.38 35.34 11.83 6.74
Manipur 1.79 14.58 32.44 30.95 20.54
Meghalaya 2.61 21.56 35.07 22.27 18.72
Mizoram 3.81 25.71 43.81 19.05 6.67
Nagaland 2.11 22.81 36.49 24.21 14.39
Orissa 1.85 38.61 39.01 12.91 7.61
Punjab 0.93 21.59 32.15 21.95 23.34
Rajasthan 3.60 38.18 30.97 12.81 14.45Sikkim 1.09 17.39 32.61 25.00 23.91Tamil Nadu 11.94 42.44 29.44 10.69 5.48Tripura 3.62 75.00 18.09 2.63 0.74
4.18 32.93 31.34 14.24 17.321.07 24.91 34.16 15.02 24.84
West Bengal 3.78 57.04 28.10 6.10 4.98A & N Islands 3.39 25.42 40.68 20.34 8.47Chandigarh 1.14 71.43 14.29 7.14 8.57D & N. Haveli 5.71 45.71 34.29 11.43 4.00Daman & Diu 3.85 38.46 30.77 15.38 12.31NCT of Delhi 1.27 29.11 27.85 20.25 22.78Lakshadweep 0.67 6.67 16.67 20.00 43.33Puducherry 6.32 46.32 31.58 11.58 4.53
INDIA 4.30 39.42 32.17 12.70 11.42Source:
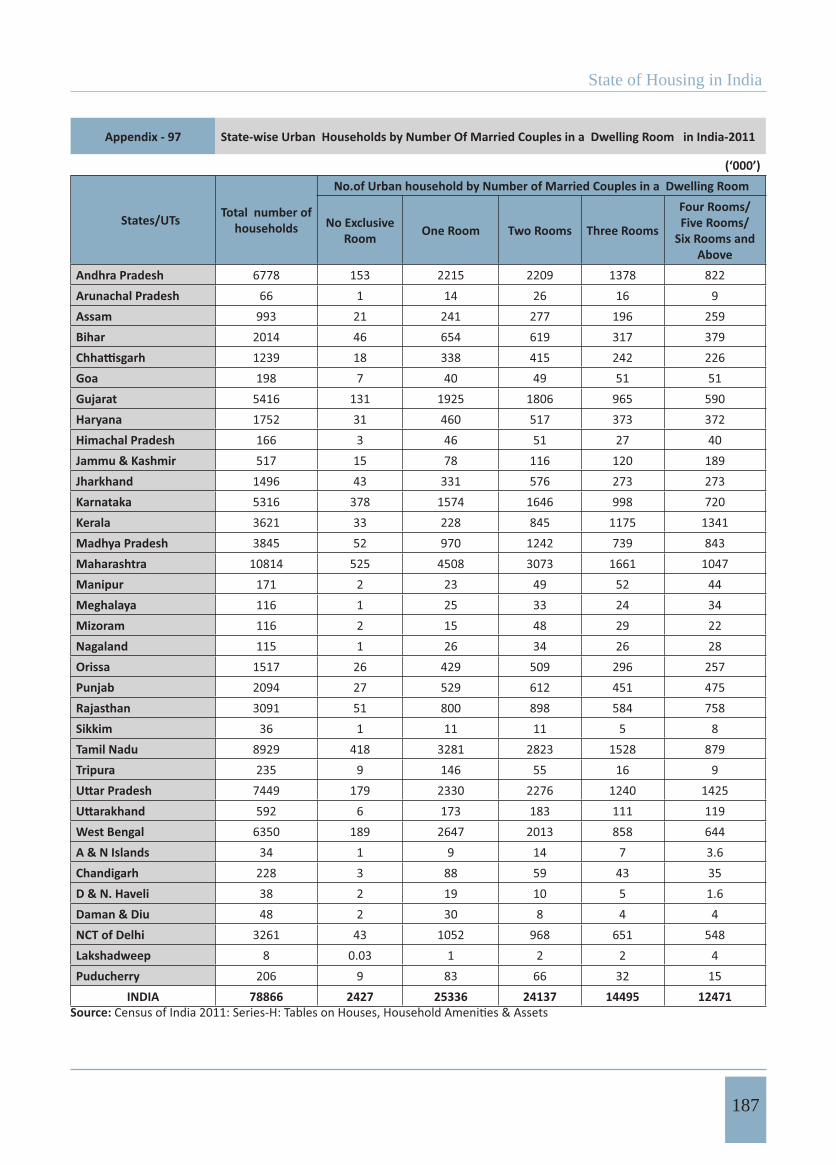
State of Housing in India
187
Appendix - 97 State-wise Urban Households by Number Of Married Couples in a Dwelling Room in India-2011
(‘000’)
States/UTs Total number of households
No.of Urban household by Number of Married Couples in a Dwelling Room
No Exclusive Room One Room Two Rooms Three Rooms
Four Rooms/Five Rooms/
Six Rooms and Above
Andhra Pradesh 6778 153 2215 2209 1378 822Arunachal Pradesh 66 1 14 26 16 9Assam 993 21 241 277 196 259Bihar 2014 46 654 619 317 379
1239 18 338 415 242 226Goa 198 7 40 49 51 51Gujarat 5416 131 1925 1806 965 590Haryana 1752 31 460 517 373 372Himachal Pradesh 166 3 46 51 27 40Jammu & Kashmir 517 15 78 116 120 189Jharkhand 1496 43 331 576 273 273Karnataka 5316 378 1574 1646 998 720Kerala 3621 33 228 845 1175 1341Madhya Pradesh 3845 52 970 1242 739 843Maharashtra 10814 525 4508 3073 1661 1047Manipur 171 2 23 49 52 44Meghalaya 116 1 25 33 24 34Mizoram 116 2 15 48 29 22Nagaland 115 1 26 34 26 28Orissa 1517 26 429 509 296 257Punjab 2094 27 529 612 451 475Rajasthan 3091 51 800 898 584 758Sikkim 36 1 11 11 5 8Tamil Nadu 8929 418 3281 2823 1528 879Tripura 235 9 146 55 16 9
7449 179 2330 2276 1240 1425592 6 173 183 111 119
West Bengal 6350 189 2647 2013 858 644A & N Islands 34 1 9 14 7 3.6Chandigarh 228 3 88 59 43 35D & N. Haveli 38 2 19 10 5 1.6Daman & Diu 48 2 30 8 4 4NCT of Delhi 3261 43 1052 968 651 548Lakshadweep 8 0.03 1 2 2 4Puducherry 206 9 83 66 32 15
INDIA 78866 2427 25336 24137 14495 12471Source:
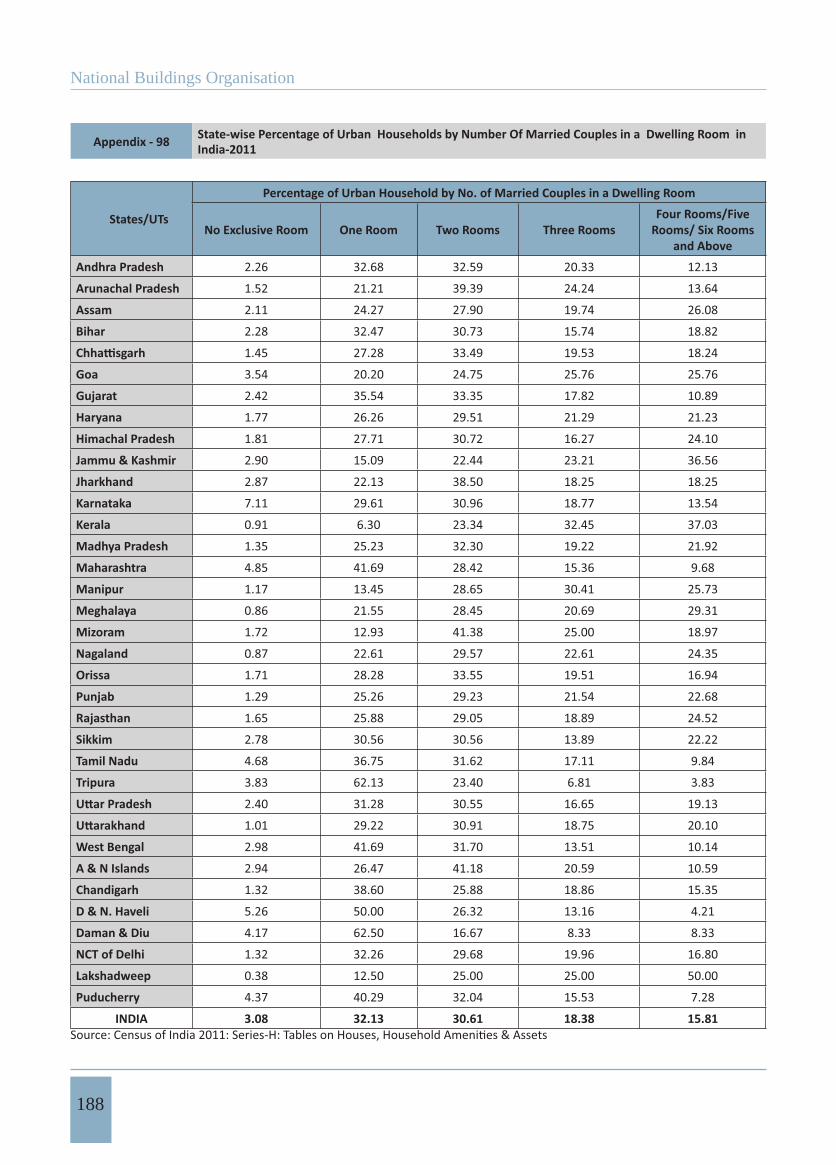
National Buildings Organisation
188
Appendix - 98 State-wise Percentage of Urban Households by Number Of Married Couples in a Dwelling Room in India-2011
States/UTs
Percentage of Urban Household by No. of Married Couples in a Dwelling Room
No Exclusive Room One Room Two Rooms Three RoomsFour Rooms/Five
Rooms/ Six Rooms and Above
Andhra Pradesh 2.26 32.68 32.59 20.33 12.13
Arunachal Pradesh 1.52 21.21 39.39 24.24 13.64
Assam 2.11 24.27 27.90 19.74 26.08
Bihar 2.28 32.47 30.73 15.74 18.82
1.45 27.28 33.49 19.53 18.24
Goa 3.54 20.20 24.75 25.76 25.76
Gujarat 2.42 35.54 33.35 17.82 10.89
Haryana 1.77 26.26 29.51 21.29 21.23
Himachal Pradesh 1.81 27.71 30.72 16.27 24.10
Jammu & Kashmir 2.90 15.09 22.44 23.21 36.56
Jharkhand 2.87 22.13 38.50 18.25 18.25
Karnataka 7.11 29.61 30.96 18.77 13.54
Kerala 0.91 6.30 23.34 32.45 37.03
Madhya Pradesh 1.35 25.23 32.30 19.22 21.92
Maharashtra 4.85 41.69 28.42 15.36 9.68
Manipur 1.17 13.45 28.65 30.41 25.73
Meghalaya 0.86 21.55 28.45 20.69 29.31
Mizoram 1.72 12.93 41.38 25.00 18.97
Nagaland 0.87 22.61 29.57 22.61 24.35
Orissa 1.71 28.28 33.55 19.51 16.94
Punjab 1.29 25.26 29.23 21.54 22.68
Rajasthan 1.65 25.88 29.05 18.89 24.52
Sikkim 2.78 30.56 30.56 13.89 22.22
Tamil Nadu 4.68 36.75 31.62 17.11 9.84
Tripura 3.83 62.13 23.40 6.81 3.83
2.40 31.28 30.55 16.65 19.13
1.01 29.22 30.91 18.75 20.10
West Bengal 2.98 41.69 31.70 13.51 10.14
A & N Islands 2.94 26.47 41.18 20.59 10.59
Chandigarh 1.32 38.60 25.88 18.86 15.35
D & N. Haveli 5.26 50.00 26.32 13.16 4.21
Daman & Diu 4.17 62.50 16.67 8.33 8.33
NCT of Delhi 1.32 32.26 29.68 19.96 16.80
Lakshadweep 0.38 12.50 25.00 25.00 50.00
Puducherry 4.37 40.29 32.04 15.53 7.28
INDIA 3.08 32.13 30.61 18.38 15.81
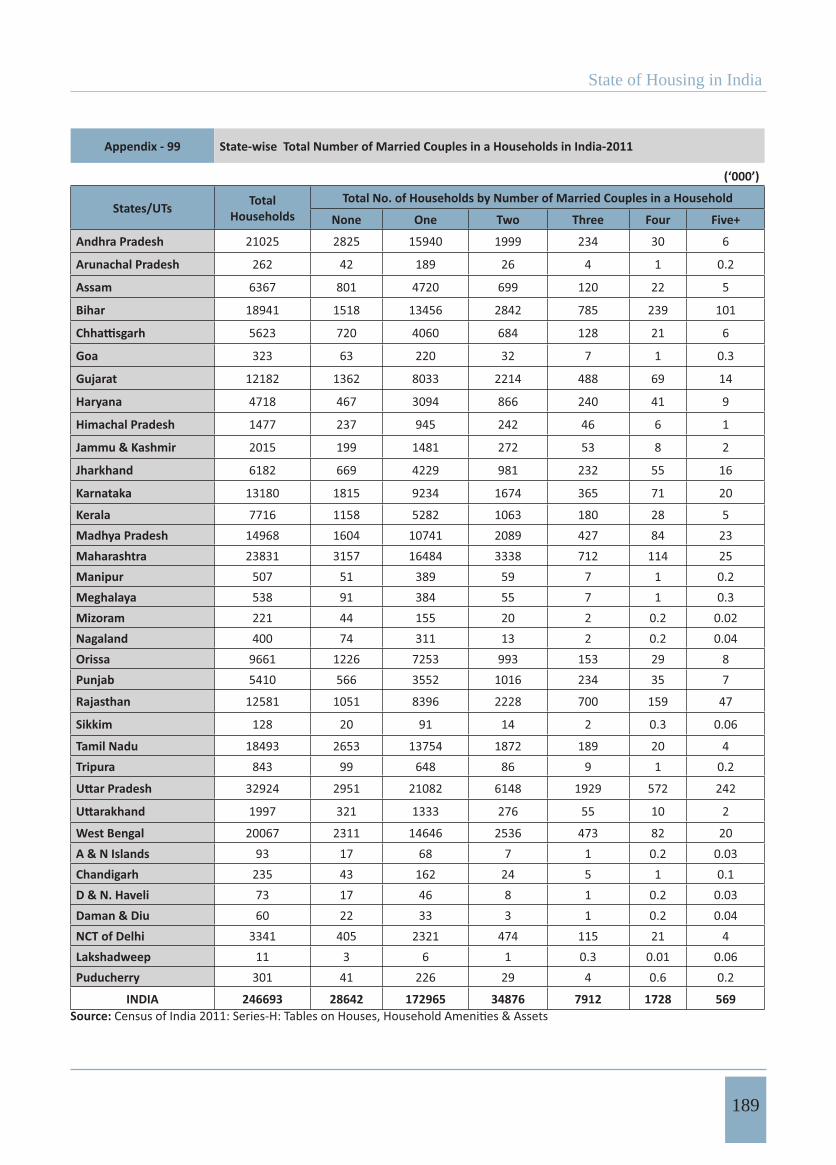
State of Housing in India
189
Appendix - 99 State-wise Total Number of Married Couples in a Households in India-2011
(‘000’)
States/UTs Total Households
Total No. of Households by Number of Married Couples in a Household
None One Two Three Four Five+
Andhra Pradesh 21025 2825 15940 1999 234 30 6
Arunachal Pradesh 262 42 189 26 4 1 0.2
Assam 6367 801 4720 699 120 22 5
Bihar 18941 1518 13456 2842 785 239 101
5623 720 4060 684 128 21 6
Goa 323 63 220 32 7 1 0.3
Gujarat 12182 1362 8033 2214 488 69 14
Haryana 4718 467 3094 866 240 41 9
Himachal Pradesh 1477 237 945 242 46 6 1
Jammu & Kashmir 2015 199 1481 272 53 8 2
Jharkhand 6182 669 4229 981 232 55 16
Karnataka 13180 1815 9234 1674 365 71 20
Kerala 7716 1158 5282 1063 180 28 5Madhya Pradesh 14968 1604 10741 2089 427 84 23Maharashtra 23831 3157 16484 3338 712 114 25Manipur 507 51 389 59 7 1 0.2Meghalaya 538 91 384 55 7 1 0.3Mizoram 221 44 155 20 2 0.2 0.02Nagaland 400 74 311 13 2 0.2 0.04Orissa 9661 1226 7253 993 153 29 8Punjab 5410 566 3552 1016 234 35 7
Rajasthan 12581 1051 8396 2228 700 159 47
Sikkim 128 20 91 14 2 0.3 0.06
Tamil Nadu 18493 2653 13754 1872 189 20 4Tripura 843 99 648 86 9 1 0.2
32924 2951 21082 6148 1929 572 242
1997 321 1333 276 55 10 2
West Bengal 20067 2311 14646 2536 473 82 20A & N Islands 93 17 68 7 1 0.2 0.03Chandigarh 235 43 162 24 5 1 0.1D & N. Haveli 73 17 46 8 1 0.2 0.03Daman & Diu 60 22 33 3 1 0.2 0.04NCT of Delhi 3341 405 2321 474 115 21 4Lakshadweep 11 3 6 1 0.3 0.01 0.06Puducherry 301 41 226 29 4 0.6 0.2
INDIA 246693 28642 172965 34876 7912 1728 569Source:
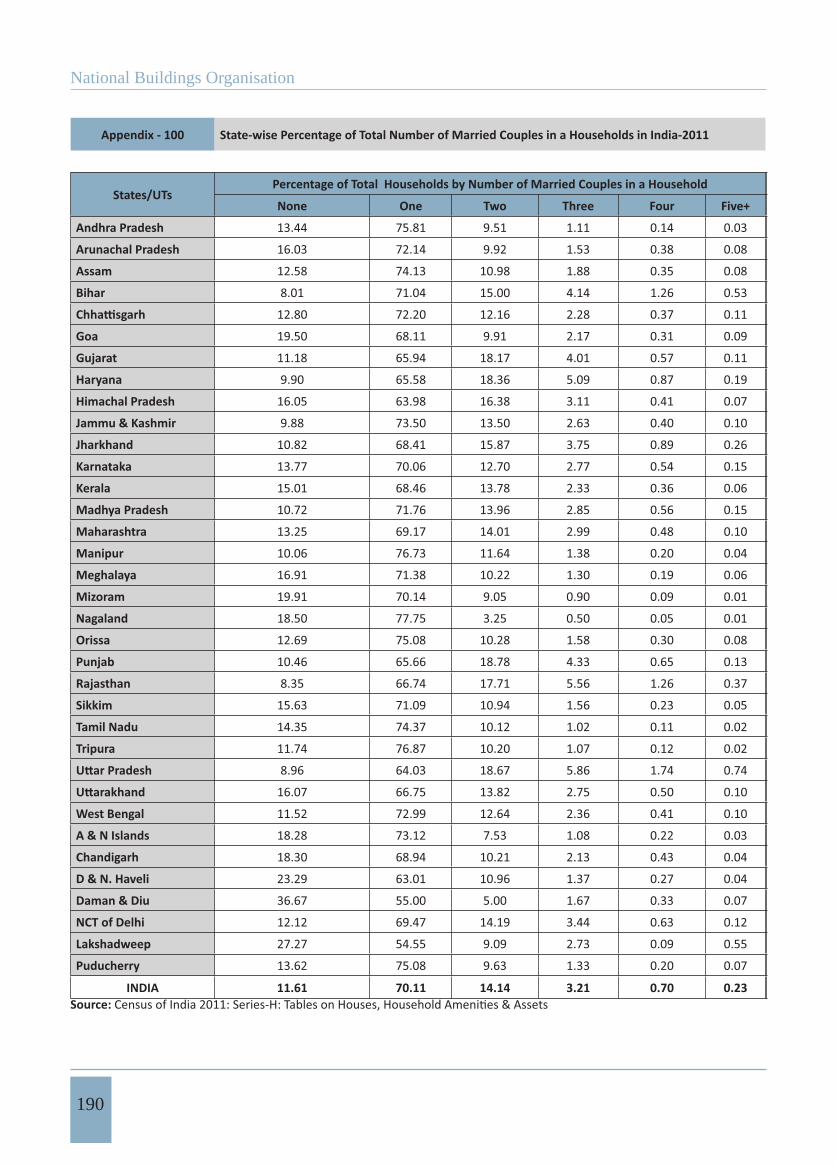
National Buildings Organisation
190
Appendix - 100 State-wise Percentage of Total Number of Married Couples in a Households in India-2011
States/UTsPercentage of Total Households by Number of Married Couples in a Household
None One Two Three Four Five+
Andhra Pradesh 13.44 75.81 9.51 1.11 0.14 0.03
Arunachal Pradesh 16.03 72.14 9.92 1.53 0.38 0.08
Assam 12.58 74.13 10.98 1.88 0.35 0.08
Bihar 8.01 71.04 15.00 4.14 1.26 0.53
12.80 72.20 12.16 2.28 0.37 0.11
Goa 19.50 68.11 9.91 2.17 0.31 0.09
Gujarat 11.18 65.94 18.17 4.01 0.57 0.11
Haryana 9.90 65.58 18.36 5.09 0.87 0.19
Himachal Pradesh 16.05 63.98 16.38 3.11 0.41 0.07
Jammu & Kashmir 9.88 73.50 13.50 2.63 0.40 0.10
Jharkhand 10.82 68.41 15.87 3.75 0.89 0.26
Karnataka 13.77 70.06 12.70 2.77 0.54 0.15
Kerala 15.01 68.46 13.78 2.33 0.36 0.06
Madhya Pradesh 10.72 71.76 13.96 2.85 0.56 0.15
Maharashtra 13.25 69.17 14.01 2.99 0.48 0.10
Manipur 10.06 76.73 11.64 1.38 0.20 0.04
Meghalaya 16.91 71.38 10.22 1.30 0.19 0.06
Mizoram 19.91 70.14 9.05 0.90 0.09 0.01
Nagaland 18.50 77.75 3.25 0.50 0.05 0.01
Orissa 12.69 75.08 10.28 1.58 0.30 0.08
Punjab 10.46 65.66 18.78 4.33 0.65 0.13
Rajasthan 8.35 66.74 17.71 5.56 1.26 0.37
Sikkim 15.63 71.09 10.94 1.56 0.23 0.05
Tamil Nadu 14.35 74.37 10.12 1.02 0.11 0.02
Tripura 11.74 76.87 10.20 1.07 0.12 0.02
8.96 64.03 18.67 5.86 1.74 0.74
16.07 66.75 13.82 2.75 0.50 0.10
West Bengal 11.52 72.99 12.64 2.36 0.41 0.10
A & N Islands 18.28 73.12 7.53 1.08 0.22 0.03
Chandigarh 18.30 68.94 10.21 2.13 0.43 0.04
D & N. Haveli 23.29 63.01 10.96 1.37 0.27 0.04
Daman & Diu 36.67 55.00 5.00 1.67 0.33 0.07
NCT of Delhi 12.12 69.47 14.19 3.44 0.63 0.12
Lakshadweep 27.27 54.55 9.09 2.73 0.09 0.55
Puducherry 13.62 75.08 9.63 1.33 0.20 0.07
INDIA 11.61 70.11 14.14 3.21 0.70 0.23Source:
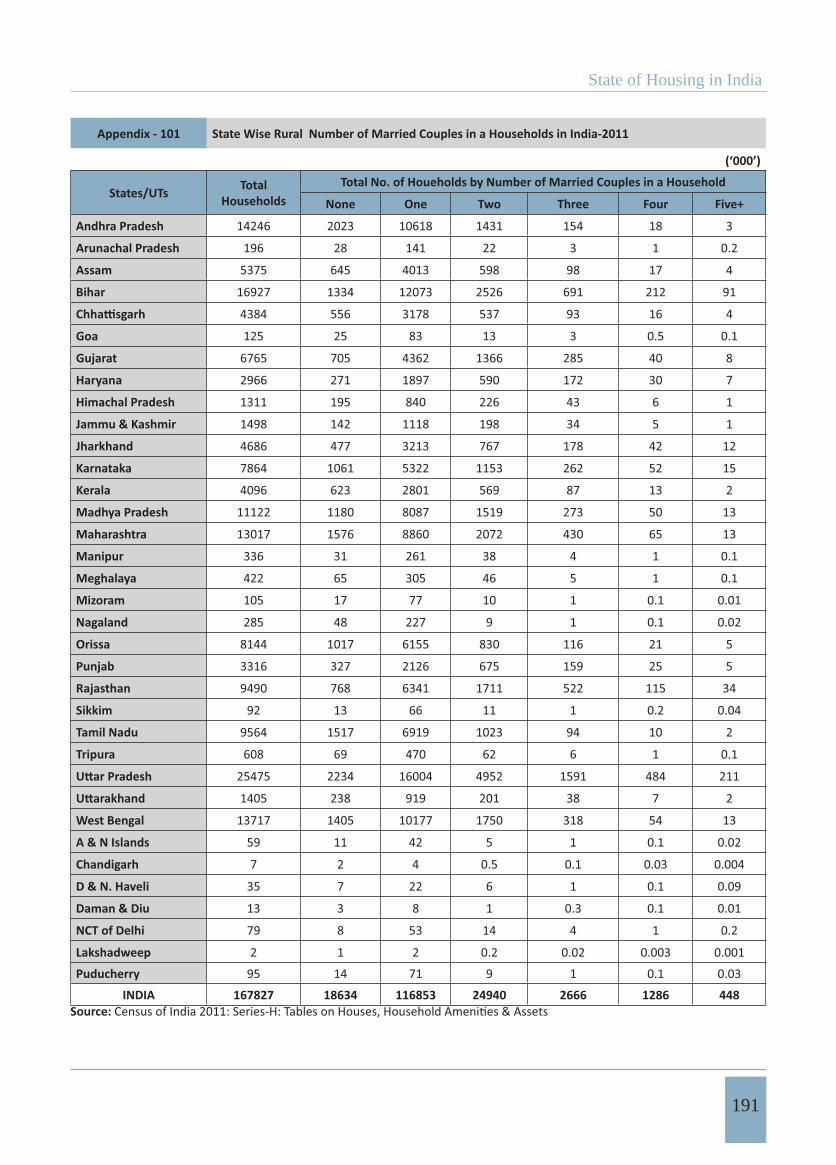
State of Housing in India
191
Appendix - 101 State Wise Rural Number of Married Couples in a Households in India-2011
(‘000’)
States/UTs Total Households
Total No. of Houeholds by Number of Married Couples in a Household
None One Two Three Four Five+
Andhra Pradesh 14246 2023 10618 1431 154 18 3
Arunachal Pradesh 196 28 141 22 3 1 0.2
Assam 5375 645 4013 598 98 17 4
Bihar 16927 1334 12073 2526 691 212 91
4384 556 3178 537 93 16 4
Goa 125 25 83 13 3 0.5 0.1
Gujarat 6765 705 4362 1366 285 40 8
Haryana 2966 271 1897 590 172 30 7
Himachal Pradesh 1311 195 840 226 43 6 1
Jammu & Kashmir 1498 142 1118 198 34 5 1
Jharkhand 4686 477 3213 767 178 42 12
Karnataka 7864 1061 5322 1153 262 52 15
Kerala 4096 623 2801 569 87 13 2
Madhya Pradesh 11122 1180 8087 1519 273 50 13
Maharashtra 13017 1576 8860 2072 430 65 13
Manipur 336 31 261 38 4 1 0.1
Meghalaya 422 65 305 46 5 1 0.1
Mizoram 105 17 77 10 1 0.1 0.01
Nagaland 285 48 227 9 1 0.1 0.02
Orissa 8144 1017 6155 830 116 21 5
Punjab 3316 327 2126 675 159 25 5
Rajasthan 9490 768 6341 1711 522 115 34
Sikkim 92 13 66 11 1 0.2 0.04
Tamil Nadu 9564 1517 6919 1023 94 10 2
Tripura 608 69 470 62 6 1 0.1
25475 2234 16004 4952 1591 484 211
1405 238 919 201 38 7 2
West Bengal 13717 1405 10177 1750 318 54 13
A & N Islands 59 11 42 5 1 0.1 0.02
Chandigarh 7 2 4 0.5 0.1 0.03 0.004
D & N. Haveli 35 7 22 6 1 0.1 0.09
Daman & Diu 13 3 8 1 0.3 0.1 0.01
NCT of Delhi 79 8 53 14 4 1 0.2
Lakshadweep 2 1 2 0.2 0.02 0.003 0.001
Puducherry 95 14 71 9 1 0.1 0.03
INDIA 167827 18634 116853 24940 2666 1286 448Source:
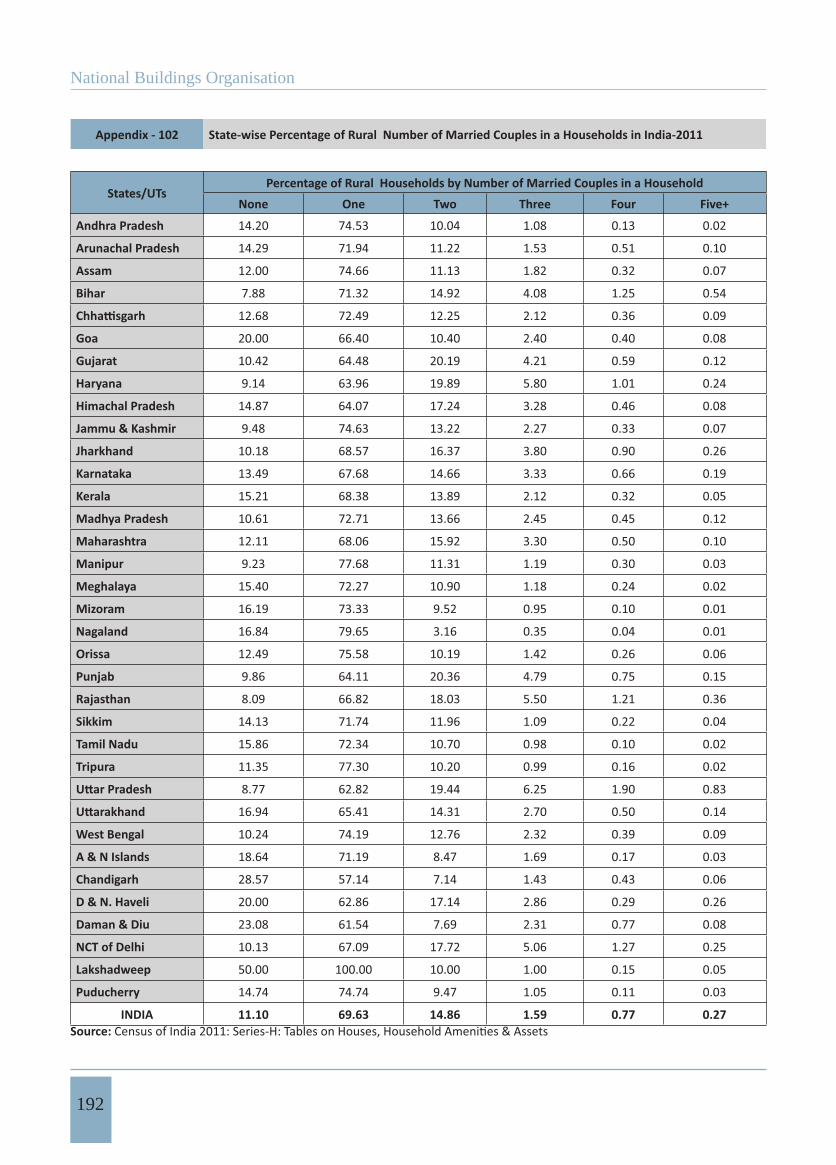
National Buildings Organisation
192
Appendix - 102 State-wise Percentage of Rural Number of Married Couples in a Households in India-2011
States/UTsPercentage of Rural Households by Number of Married Couples in a Household
None One Two Three Four Five+
Andhra Pradesh 14.20 74.53 10.04 1.08 0.13 0.02
Arunachal Pradesh 14.29 71.94 11.22 1.53 0.51 0.10
Assam 12.00 74.66 11.13 1.82 0.32 0.07
Bihar 7.88 71.32 14.92 4.08 1.25 0.54
12.68 72.49 12.25 2.12 0.36 0.09
Goa 20.00 66.40 10.40 2.40 0.40 0.08
Gujarat 10.42 64.48 20.19 4.21 0.59 0.12
Haryana 9.14 63.96 19.89 5.80 1.01 0.24
Himachal Pradesh 14.87 64.07 17.24 3.28 0.46 0.08
Jammu & Kashmir 9.48 74.63 13.22 2.27 0.33 0.07
Jharkhand 10.18 68.57 16.37 3.80 0.90 0.26
Karnataka 13.49 67.68 14.66 3.33 0.66 0.19
Kerala 15.21 68.38 13.89 2.12 0.32 0.05
Madhya Pradesh 10.61 72.71 13.66 2.45 0.45 0.12
Maharashtra 12.11 68.06 15.92 3.30 0.50 0.10
Manipur 9.23 77.68 11.31 1.19 0.30 0.03
Meghalaya 15.40 72.27 10.90 1.18 0.24 0.02
Mizoram 16.19 73.33 9.52 0.95 0.10 0.01
Nagaland 16.84 79.65 3.16 0.35 0.04 0.01
Orissa 12.49 75.58 10.19 1.42 0.26 0.06
Punjab 9.86 64.11 20.36 4.79 0.75 0.15
Rajasthan 8.09 66.82 18.03 5.50 1.21 0.36
Sikkim 14.13 71.74 11.96 1.09 0.22 0.04
Tamil Nadu 15.86 72.34 10.70 0.98 0.10 0.02
Tripura 11.35 77.30 10.20 0.99 0.16 0.02
8.77 62.82 19.44 6.25 1.90 0.83
16.94 65.41 14.31 2.70 0.50 0.14
West Bengal 10.24 74.19 12.76 2.32 0.39 0.09
A & N Islands 18.64 71.19 8.47 1.69 0.17 0.03
Chandigarh 28.57 57.14 7.14 1.43 0.43 0.06
D & N. Haveli 20.00 62.86 17.14 2.86 0.29 0.26
Daman & Diu 23.08 61.54 7.69 2.31 0.77 0.08
NCT of Delhi 10.13 67.09 17.72 5.06 1.27 0.25
Lakshadweep 50.00 100.00 10.00 1.00 0.15 0.05
Puducherry 14.74 74.74 9.47 1.05 0.11 0.03
INDIA 11.10 69.63 14.86 1.59 0.77 0.27Source:
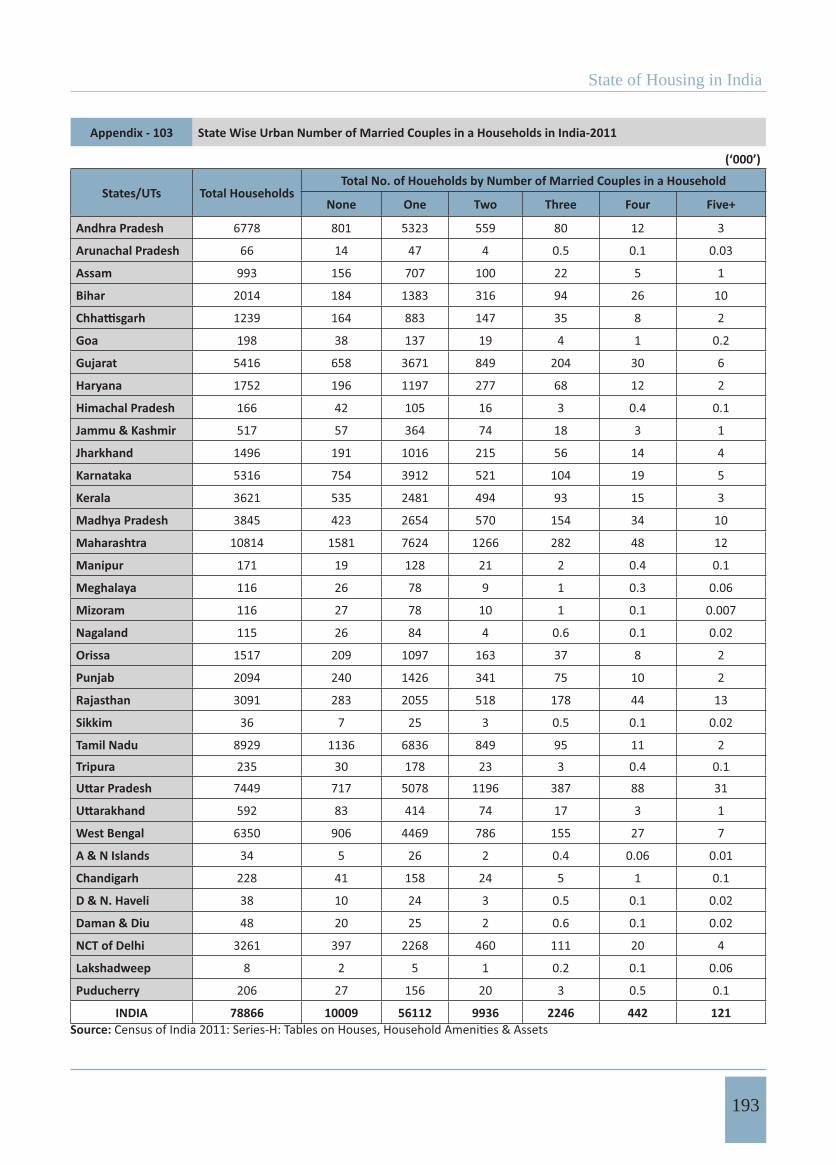
State of Housing in India
193
Appendix - 103 State Wise Urban Number of Married Couples in a Households in India-2011
(‘000’)
States/UTs Total HouseholdsTotal No. of Houeholds by Number of Married Couples in a Household
None One Two Three Four Five+
Andhra Pradesh 6778 801 5323 559 80 12 3
Arunachal Pradesh 66 14 47 4 0.5 0.1 0.03
Assam 993 156 707 100 22 5 1
Bihar 2014 184 1383 316 94 26 10
1239 164 883 147 35 8 2
Goa 198 38 137 19 4 1 0.2
Gujarat 5416 658 3671 849 204 30 6
Haryana 1752 196 1197 277 68 12 2
Himachal Pradesh 166 42 105 16 3 0.4 0.1
Jammu & Kashmir 517 57 364 74 18 3 1
Jharkhand 1496 191 1016 215 56 14 4
Karnataka 5316 754 3912 521 104 19 5
Kerala 3621 535 2481 494 93 15 3
Madhya Pradesh 3845 423 2654 570 154 34 10
Maharashtra 10814 1581 7624 1266 282 48 12
Manipur 171 19 128 21 2 0.4 0.1
Meghalaya 116 26 78 9 1 0.3 0.06
Mizoram 116 27 78 10 1 0.1 0.007
Nagaland 115 26 84 4 0.6 0.1 0.02
Orissa 1517 209 1097 163 37 8 2
Punjab 2094 240 1426 341 75 10 2
Rajasthan 3091 283 2055 518 178 44 13
Sikkim 36 7 25 3 0.5 0.1 0.02
Tamil Nadu 8929 1136 6836 849 95 11 2
Tripura 235 30 178 23 3 0.4 0.1
7449 717 5078 1196 387 88 31
592 83 414 74 17 3 1
West Bengal 6350 906 4469 786 155 27 7
A & N Islands 34 5 26 2 0.4 0.06 0.01
Chandigarh 228 41 158 24 5 1 0.1
D & N. Haveli 38 10 24 3 0.5 0.1 0.02
Daman & Diu 48 20 25 2 0.6 0.1 0.02
NCT of Delhi 3261 397 2268 460 111 20 4
Lakshadweep 8 2 5 1 0.2 0.1 0.06
Puducherry 206 27 156 20 3 0.5 0.1
INDIA 78866 10009 56112 9936 2246 442 121Source:
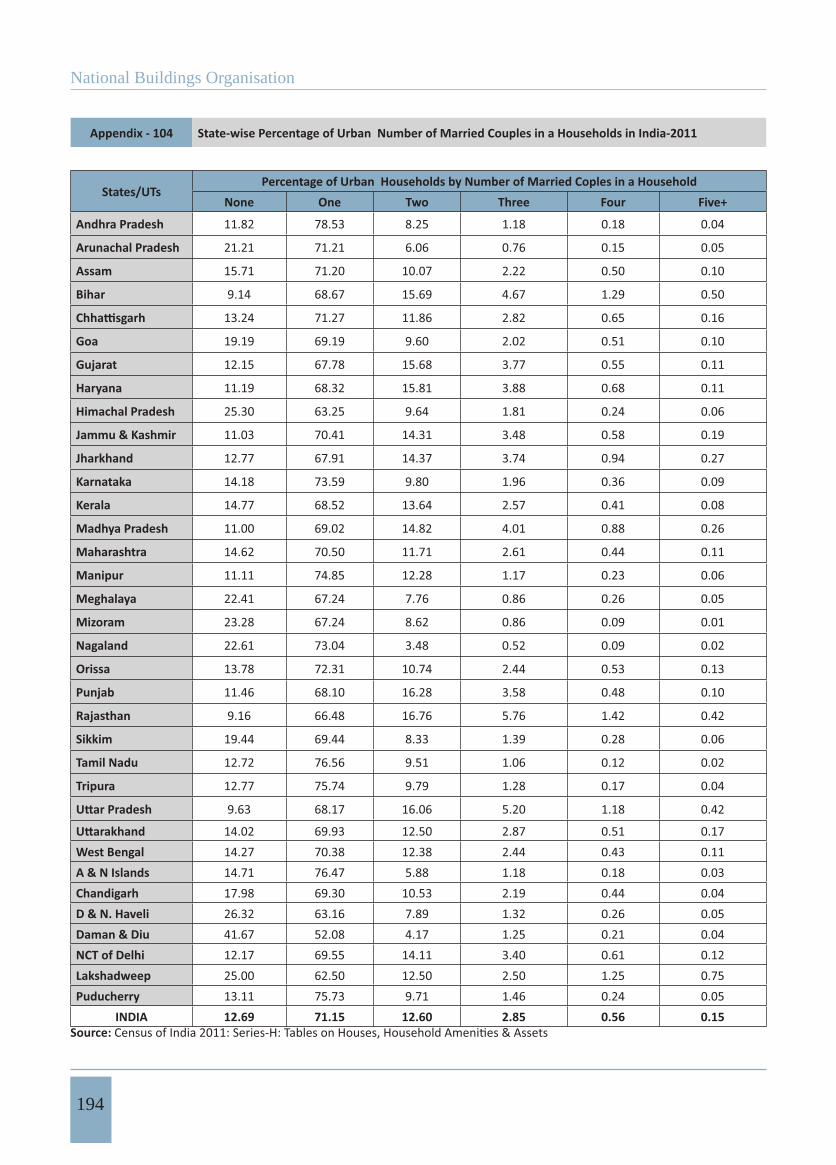
National Buildings Organisation
194
Appendix - 104 State-wise Percentage of Urban Number of Married Couples in a Households in India-2011
States/UTsPercentage of Urban Households by Number of Married Coples in a Household
None One Two Three Four Five+
Andhra Pradesh 11.82 78.53 8.25 1.18 0.18 0.04
Arunachal Pradesh 21.21 71.21 6.06 0.76 0.15 0.05
Assam 15.71 71.20 10.07 2.22 0.50 0.10
Bihar 9.14 68.67 15.69 4.67 1.29 0.50
13.24 71.27 11.86 2.82 0.65 0.16
Goa 19.19 69.19 9.60 2.02 0.51 0.10
Gujarat 12.15 67.78 15.68 3.77 0.55 0.11
Haryana 11.19 68.32 15.81 3.88 0.68 0.11
Himachal Pradesh 25.30 63.25 9.64 1.81 0.24 0.06
Jammu & Kashmir 11.03 70.41 14.31 3.48 0.58 0.19
Jharkhand 12.77 67.91 14.37 3.74 0.94 0.27
Karnataka 14.18 73.59 9.80 1.96 0.36 0.09
Kerala 14.77 68.52 13.64 2.57 0.41 0.08
Madhya Pradesh 11.00 69.02 14.82 4.01 0.88 0.26
Maharashtra 14.62 70.50 11.71 2.61 0.44 0.11
Manipur 11.11 74.85 12.28 1.17 0.23 0.06
Meghalaya 22.41 67.24 7.76 0.86 0.26 0.05
Mizoram 23.28 67.24 8.62 0.86 0.09 0.01
Nagaland 22.61 73.04 3.48 0.52 0.09 0.02
Orissa 13.78 72.31 10.74 2.44 0.53 0.13
Punjab 11.46 68.10 16.28 3.58 0.48 0.10
Rajasthan 9.16 66.48 16.76 5.76 1.42 0.42
Sikkim 19.44 69.44 8.33 1.39 0.28 0.06
Tamil Nadu 12.72 76.56 9.51 1.06 0.12 0.02
Tripura 12.77 75.74 9.79 1.28 0.17 0.04
9.63 68.17 16.06 5.20 1.18 0.42
14.02 69.93 12.50 2.87 0.51 0.17West Bengal 14.27 70.38 12.38 2.44 0.43 0.11A & N Islands 14.71 76.47 5.88 1.18 0.18 0.03Chandigarh 17.98 69.30 10.53 2.19 0.44 0.04D & N. Haveli 26.32 63.16 7.89 1.32 0.26 0.05Daman & Diu 41.67 52.08 4.17 1.25 0.21 0.04NCT of Delhi 12.17 69.55 14.11 3.40 0.61 0.12Lakshadweep 25.00 62.50 12.50 2.50 1.25 0.75Puducherry 13.11 75.73 9.71 1.46 0.24 0.05
INDIA 12.69 71.15 12.60 2.85 0.56 0.15Source:

State of Housing in India
195
Appendix - 105 State-wise Total Households by type of ‘Drinking Water Source’ in India-2011
(‘000’)
States/UTs Total number of households
Number of Households (Hhs) by Source of Drinking Water
Tap water from
treated source
Tap water from
untreated surce
Covered well
Un-covered
well
Handpump, Tube-well Bore-hole
Spring, River/ Canal, Tank/ Pond/
Lake
OtherSources
Andhra Pradesh 21025 10298 4393 104 1232 4338 221 440Arunachal Pradesh 262 69 102 4 11 34 33 8Assam 6367 583 83 106 1096 3783 592 125Bihar 18941 582 253 126 696 16969 58 257
5623 691 471 46 594 3690 103 29Goa 323 265 11 13 23 1.3 6 4Gujarat 12182 4854 3555 280 584 2585 80 244Haryana 4718 2635 610 35 108 1178 59 92Himachal Pradesh 1477 1239 82 23 20 63 22 28Jammu & Kashmir 2015 699 589 37 94 258 273 63Jharkhand 6182 616 179 118 2139 2922 161 46Karnataka 13180 5433 3274 131 1052 2832 274 184Kerala 7716 1802 461 1129 3657 319 180 162Madhya Pradesh 14968 2462 1035 158 2833 8180 214 86Maharashtra 23831 13427 2753 526 2914 3700 266 246Manipur 507 130 66 14 24 35 222 17Meghalaya 538 150 62 37 99 29 147 14Mizoram 221 87 43 4 6 4 62 15Nagaland 400 24 164 26 76 27 73 11Orissa 9661 964 373 216 1671 5933 429 75Punjab 5410 2223 535 13 11 2519 19 90Rajasthan 12581 4031 1075 152 1210 4716 853 545Sikkim 128 37 72 0.6 0.2 0.07 15.5 3Tamil Nadu 18493 10324 4429 228 710 2361 173 267Tripura 843 171 109 24 206 289 35 8
32924 6655 2322 189 1115 22343 76 2241997 1077 285 14 9 479 54 79
West Bengal 20067 4221 880 133 1077 13405 195 156A & N Islands 93 64 15 1 6 0.51 4 2Chandigarh 235 220 7 0.1 0.04 6 0.25 1D & N. Haveli 73 19 15 1 4 33 0.63 0.3Daman & Diu 60 33 12 0.3 0.1 14 0.022 0.3NCT of Delhi 3341 2512 205 3 1 458 41.7 121Lakshadweep 11 1 1 1 7 0.35 0.041 0.5Puducherry 301 274 13 0.4 5 7 0.17 1 INDIA 246693 78873 28534 3895 23290 103516 4941 3644
Source:
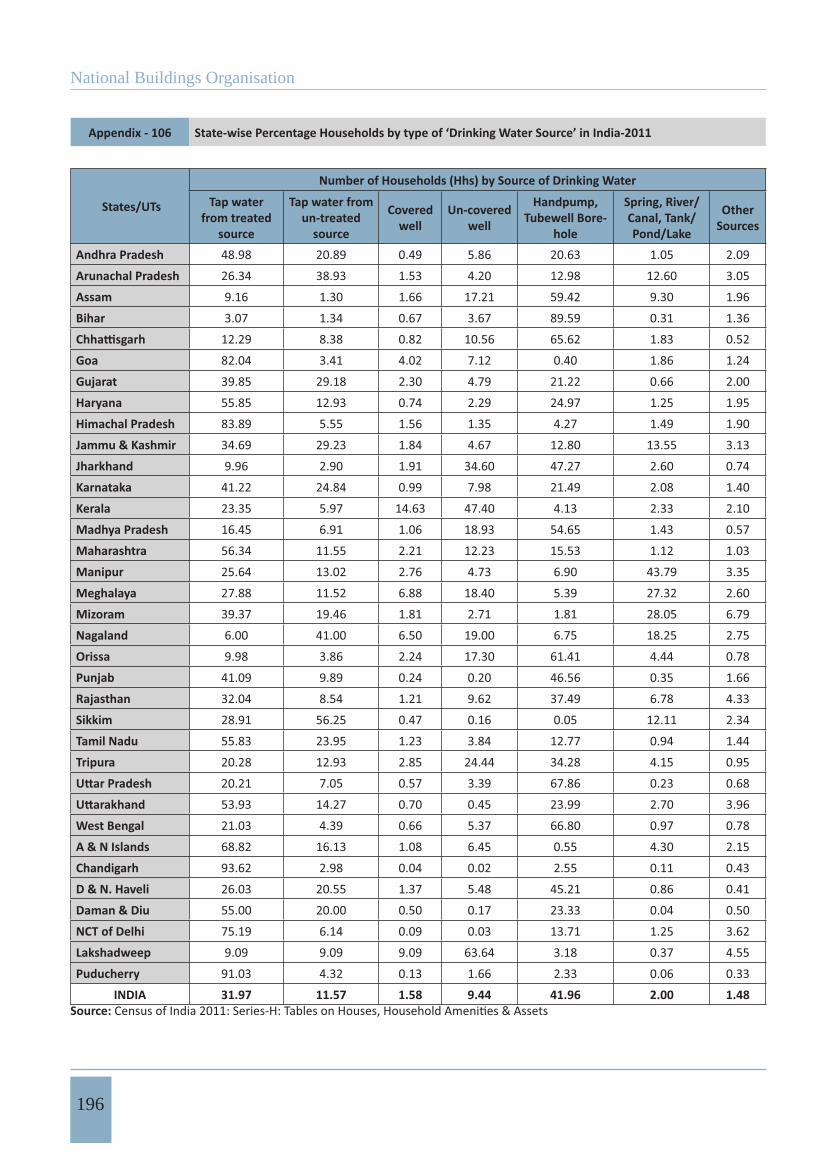
National Buildings Organisation
196
Appendix - 106 State-wise Percentage Households by type of ‘Drinking Water Source’ in India-2011
States/UTs
Number of Households (Hhs) by Source of Drinking Water
Tap water from treated
source
Tap water from un-treated
source
Covered well
Un-covered well
Handpump,Tubewell Bore-
hole
Spring, River/Canal, Tank/Pond/Lake
OtherSources
Andhra Pradesh 48.98 20.89 0.49 5.86 20.63 1.05 2.09
Arunachal Pradesh 26.34 38.93 1.53 4.20 12.98 12.60 3.05
Assam 9.16 1.30 1.66 17.21 59.42 9.30 1.96
Bihar 3.07 1.34 0.67 3.67 89.59 0.31 1.36
12.29 8.38 0.82 10.56 65.62 1.83 0.52
Goa 82.04 3.41 4.02 7.12 0.40 1.86 1.24
Gujarat 39.85 29.18 2.30 4.79 21.22 0.66 2.00
Haryana 55.85 12.93 0.74 2.29 24.97 1.25 1.95
Himachal Pradesh 83.89 5.55 1.56 1.35 4.27 1.49 1.90
Jammu & Kashmir 34.69 29.23 1.84 4.67 12.80 13.55 3.13
Jharkhand 9.96 2.90 1.91 34.60 47.27 2.60 0.74
Karnataka 41.22 24.84 0.99 7.98 21.49 2.08 1.40
Kerala 23.35 5.97 14.63 47.40 4.13 2.33 2.10
Madhya Pradesh 16.45 6.91 1.06 18.93 54.65 1.43 0.57
Maharashtra 56.34 11.55 2.21 12.23 15.53 1.12 1.03
Manipur 25.64 13.02 2.76 4.73 6.90 43.79 3.35
Meghalaya 27.88 11.52 6.88 18.40 5.39 27.32 2.60
Mizoram 39.37 19.46 1.81 2.71 1.81 28.05 6.79
Nagaland 6.00 41.00 6.50 19.00 6.75 18.25 2.75
Orissa 9.98 3.86 2.24 17.30 61.41 4.44 0.78
Punjab 41.09 9.89 0.24 0.20 46.56 0.35 1.66
Rajasthan 32.04 8.54 1.21 9.62 37.49 6.78 4.33
Sikkim 28.91 56.25 0.47 0.16 0.05 12.11 2.34
Tamil Nadu 55.83 23.95 1.23 3.84 12.77 0.94 1.44
Tripura 20.28 12.93 2.85 24.44 34.28 4.15 0.95
20.21 7.05 0.57 3.39 67.86 0.23 0.68
53.93 14.27 0.70 0.45 23.99 2.70 3.96
West Bengal 21.03 4.39 0.66 5.37 66.80 0.97 0.78
A & N Islands 68.82 16.13 1.08 6.45 0.55 4.30 2.15
Chandigarh 93.62 2.98 0.04 0.02 2.55 0.11 0.43
D & N. Haveli 26.03 20.55 1.37 5.48 45.21 0.86 0.41
Daman & Diu 55.00 20.00 0.50 0.17 23.33 0.04 0.50
NCT of Delhi 75.19 6.14 0.09 0.03 13.71 1.25 3.62
Lakshadweep 9.09 9.09 9.09 63.64 3.18 0.37 4.55
Puducherry 91.03 4.32 0.13 1.66 2.33 0.06 0.33
INDIA 31.97 11.57 1.58 9.44 41.96 2.00 1.48Source:
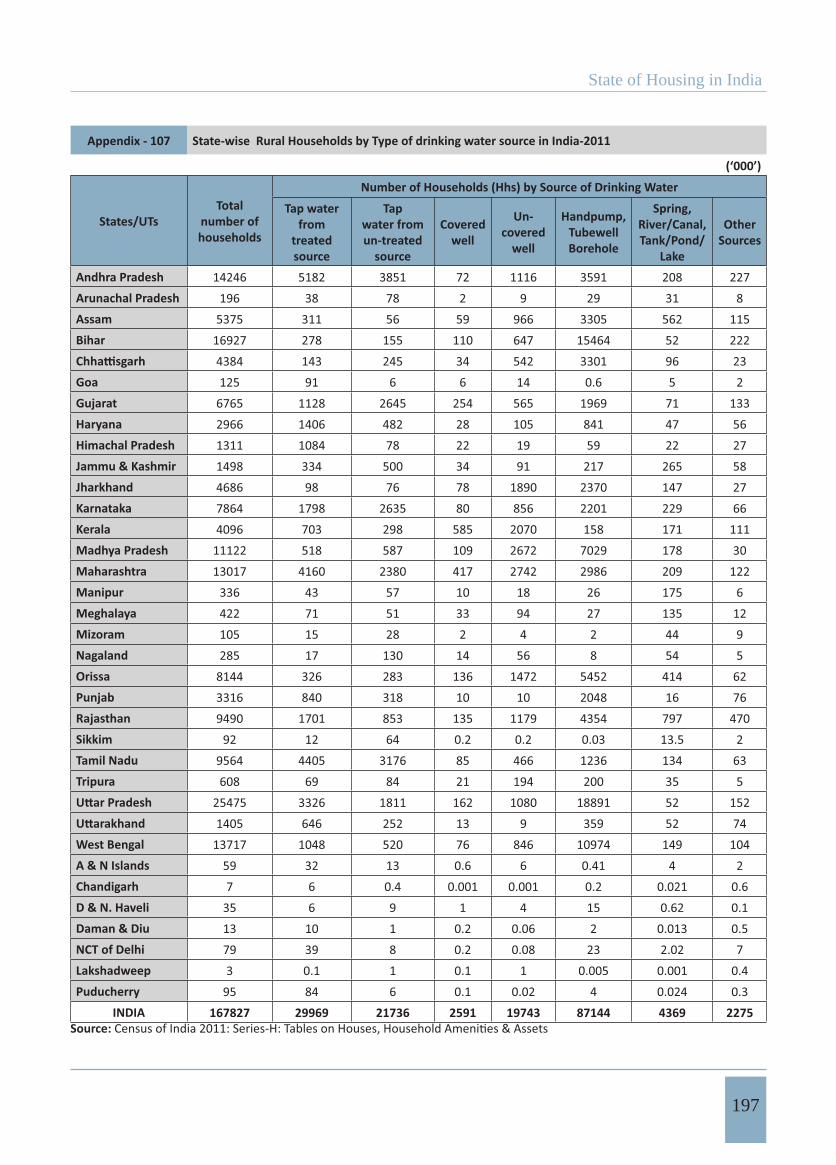
State of Housing in India
197
Appendix - 107 State-wise Rural Households by Type of drinking water source in India-2011
(‘000’)
States/UTsTotal
number of households
Number of Households (Hhs) by Source of Drinking Water
Tap water from
treated source
Tap water from un-treated
source
Covered well
Un-covered
well
Handpump,Tubewell Borehole
Spring, River/Canal, Tank/Pond/
Lake
OtherSources
Andhra Pradesh 14246 5182 3851 72 1116 3591 208 227Arunachal Pradesh 196 38 78 2 9 29 31 8Assam 5375 311 56 59 966 3305 562 115Bihar 16927 278 155 110 647 15464 52 222
4384 143 245 34 542 3301 96 23Goa 125 91 6 6 14 0.6 5 2Gujarat 6765 1128 2645 254 565 1969 71 133Haryana 2966 1406 482 28 105 841 47 56Himachal Pradesh 1311 1084 78 22 19 59 22 27Jammu & Kashmir 1498 334 500 34 91 217 265 58Jharkhand 4686 98 76 78 1890 2370 147 27Karnataka 7864 1798 2635 80 856 2201 229 66Kerala 4096 703 298 585 2070 158 171 111Madhya Pradesh 11122 518 587 109 2672 7029 178 30Maharashtra 13017 4160 2380 417 2742 2986 209 122Manipur 336 43 57 10 18 26 175 6Meghalaya 422 71 51 33 94 27 135 12Mizoram 105 15 28 2 4 2 44 9Nagaland 285 17 130 14 56 8 54 5Orissa 8144 326 283 136 1472 5452 414 62Punjab 3316 840 318 10 10 2048 16 76Rajasthan 9490 1701 853 135 1179 4354 797 470Sikkim 92 12 64 0.2 0.2 0.03 13.5 2Tamil Nadu 9564 4405 3176 85 466 1236 134 63Tripura 608 69 84 21 194 200 35 5
25475 3326 1811 162 1080 18891 52 1521405 646 252 13 9 359 52 74
West Bengal 13717 1048 520 76 846 10974 149 104A & N Islands 59 32 13 0.6 6 0.41 4 2Chandigarh 7 6 0.4 0.001 0.001 0.2 0.021 0.6D & N. Haveli 35 6 9 1 4 15 0.62 0.1Daman & Diu 13 10 1 0.2 0.06 2 0.013 0.5NCT of Delhi 79 39 8 0.2 0.08 23 2.02 7Lakshadweep 3 0.1 1 0.1 1 0.005 0.001 0.4Puducherry 95 84 6 0.1 0.02 4 0.024 0.3
INDIA 167827 29969 21736 2591 19743 87144 4369 2275Source:
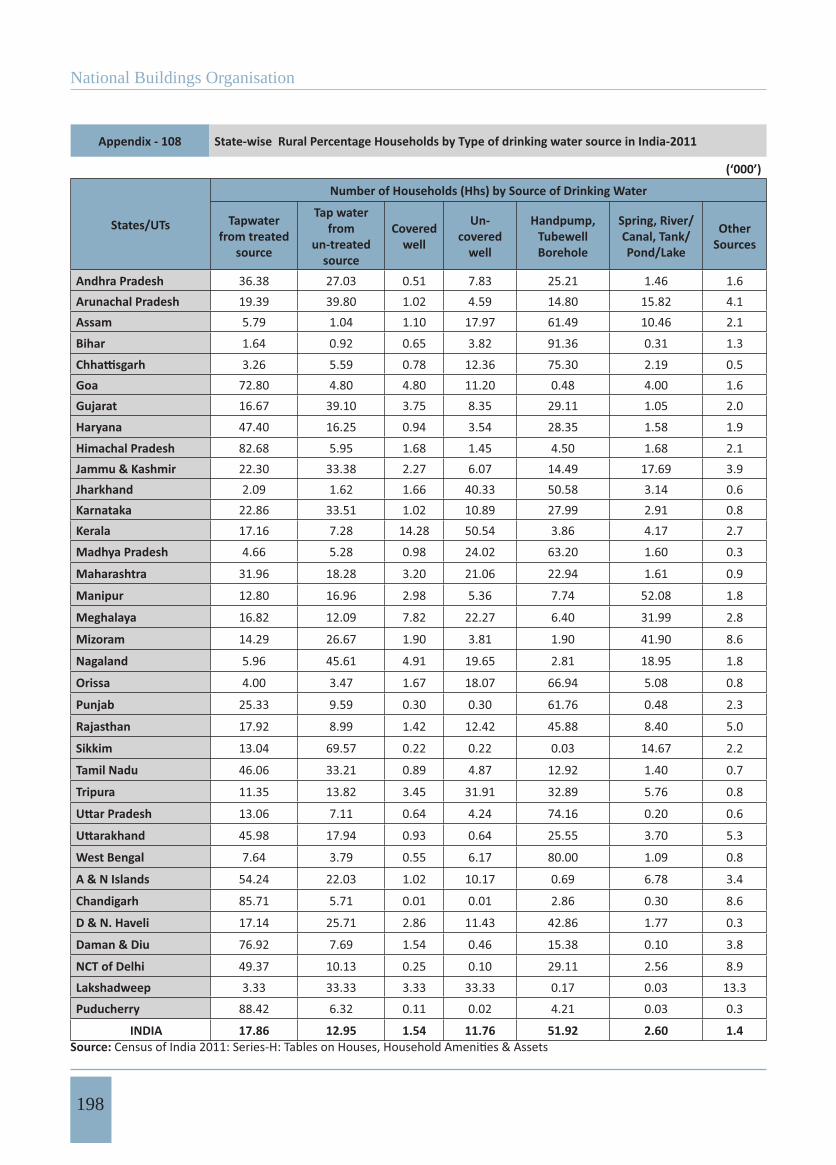
National Buildings Organisation
198
Appendix - 108 State-wise Rural Percentage Households by Type of drinking water source in India-2011
(‘000’)
States/UTs
Number of Households (Hhs) by Source of Drinking Water
Tapwater from treated
source
Tap water from
un-treated source
Covered well
Un-covered
well
Handpump,Tubewell Borehole
Spring, River/Canal, Tank/Pond/Lake
OtherSources
Andhra Pradesh 36.38 27.03 0.51 7.83 25.21 1.46 1.6Arunachal Pradesh 19.39 39.80 1.02 4.59 14.80 15.82 4.1Assam 5.79 1.04 1.10 17.97 61.49 10.46 2.1
Bihar 1.64 0.92 0.65 3.82 91.36 0.31 1.3
3.26 5.59 0.78 12.36 75.30 2.19 0.5Goa 72.80 4.80 4.80 11.20 0.48 4.00 1.6Gujarat 16.67 39.10 3.75 8.35 29.11 1.05 2.0
Haryana 47.40 16.25 0.94 3.54 28.35 1.58 1.9
Himachal Pradesh 82.68 5.95 1.68 1.45 4.50 1.68 2.1Jammu & Kashmir 22.30 33.38 2.27 6.07 14.49 17.69 3.9Jharkhand 2.09 1.62 1.66 40.33 50.58 3.14 0.6Karnataka 22.86 33.51 1.02 10.89 27.99 2.91 0.8Kerala 17.16 7.28 14.28 50.54 3.86 4.17 2.7
Madhya Pradesh 4.66 5.28 0.98 24.02 63.20 1.60 0.3
Maharashtra 31.96 18.28 3.20 21.06 22.94 1.61 0.9
Manipur 12.80 16.96 2.98 5.36 7.74 52.08 1.8
Meghalaya 16.82 12.09 7.82 22.27 6.40 31.99 2.8
Mizoram 14.29 26.67 1.90 3.81 1.90 41.90 8.6
Nagaland 5.96 45.61 4.91 19.65 2.81 18.95 1.8
Orissa 4.00 3.47 1.67 18.07 66.94 5.08 0.8
Punjab 25.33 9.59 0.30 0.30 61.76 0.48 2.3
Rajasthan 17.92 8.99 1.42 12.42 45.88 8.40 5.0
Sikkim 13.04 69.57 0.22 0.22 0.03 14.67 2.2
Tamil Nadu 46.06 33.21 0.89 4.87 12.92 1.40 0.7
Tripura 11.35 13.82 3.45 31.91 32.89 5.76 0.8
13.06 7.11 0.64 4.24 74.16 0.20 0.6
45.98 17.94 0.93 0.64 25.55 3.70 5.3
West Bengal 7.64 3.79 0.55 6.17 80.00 1.09 0.8
A & N Islands 54.24 22.03 1.02 10.17 0.69 6.78 3.4
Chandigarh 85.71 5.71 0.01 0.01 2.86 0.30 8.6
D & N. Haveli 17.14 25.71 2.86 11.43 42.86 1.77 0.3
Daman & Diu 76.92 7.69 1.54 0.46 15.38 0.10 3.8
NCT of Delhi 49.37 10.13 0.25 0.10 29.11 2.56 8.9
Lakshadweep 3.33 33.33 3.33 33.33 0.17 0.03 13.3
Puducherry 88.42 6.32 0.11 0.02 4.21 0.03 0.3
INDIA 17.86 12.95 1.54 11.76 51.92 2.60 1.4Source:

State of Housing in India
199
Appendix - 109 State-wise Urban Households by type of ‘Drinking Water Source’ in India-2011
(‘000’)
States/UTs Total number of households
Number of Households (Hhs) by Source of Drinking Water
Tap water from
treated source
Tap water from un-treated
source
Covered well
Un-covered
well
Handpump,Tubewell Borehole
Spring, River/ Canal,Tank/
Pond/Lake
OtherSources
Andhra Pradesh 6778 5116 543 32 116 747 11 213
Arunachal Pradesh 66 31 25 1 2 5 2.2 0.5
Assam 993 272 27 47 130 476 30 10
Bihar 2014 304 98 16 50 1505 6 35
1239 548 226 12 52 389 6 6
Goa 198 174 5 7 9 0.4 1 2
Gujarat 5416 3726 9010 26 18 616 10 111
Haryana 1752 1230 128 7 3 336 12.5 36
Himachal Pradesh 166 155 4 1 0.5 4 1.4 1
Jammu & Kashmir 517 365 89 4 3 42 9 5
Jharkhand 1496 518 103 40 249 551 14 20
Karnataka 5316 3635 640 52 196 630 45 118
Kerala 3621 1099 163 544 1588 165 10 51Madhya Pradesh 3845 1944 448 49 161 1151 36 57Maharashtra 10814 9266 372 109 172 714 56 125Manipur 171 87 9 4 5 7.5 46 11Meghalaya 116 79 11 4 5 2.5 12.3 2Mizoram 116 72 15 3 2 2 18 6Nagaland 115 7 34 12 21 19 18 6Orissa 1517 639 90 80 199 481 15 13Punjab 2094 1384 217 3 2 471 4 14Rajasthan 3091 2331 221 16 31 361 55 75Sikkim 36 25 8 0.3 0.01 0.036 2.07 0.1Tamil Nadu 8929 5919 1253 143 244 1125 40 205Tripura 235 102 25 3 12 89 1 3
7449 3328 511 27 35 3453 24 73592 431 34 1 0.3 120 1.8 5
West Bengal 6350 3173 360 57 231 2432 46 52A & N Islands 34 31 2 0.06 0.3 0.043 0.135 0.1Chandigarh 228 214 7 0.1 0.04 6 0.25 1D & N. Haveli 38 13 6 0.3 0.1 18 0.037 0.1Daman & Diu 48 23 11 0.1 0.1 13 0.012 0.3NCT of Delhi 3261 2472 197 2 0.5 436 39.7 114Lakshadweep 8 1 0.4 1 5 0.304 0.041 0.1Puducherry 206 189 7 0.3 5 3 0.509 0.6
INDIA 78866 48904 6798 1304 3547 16371 571 1369Source:
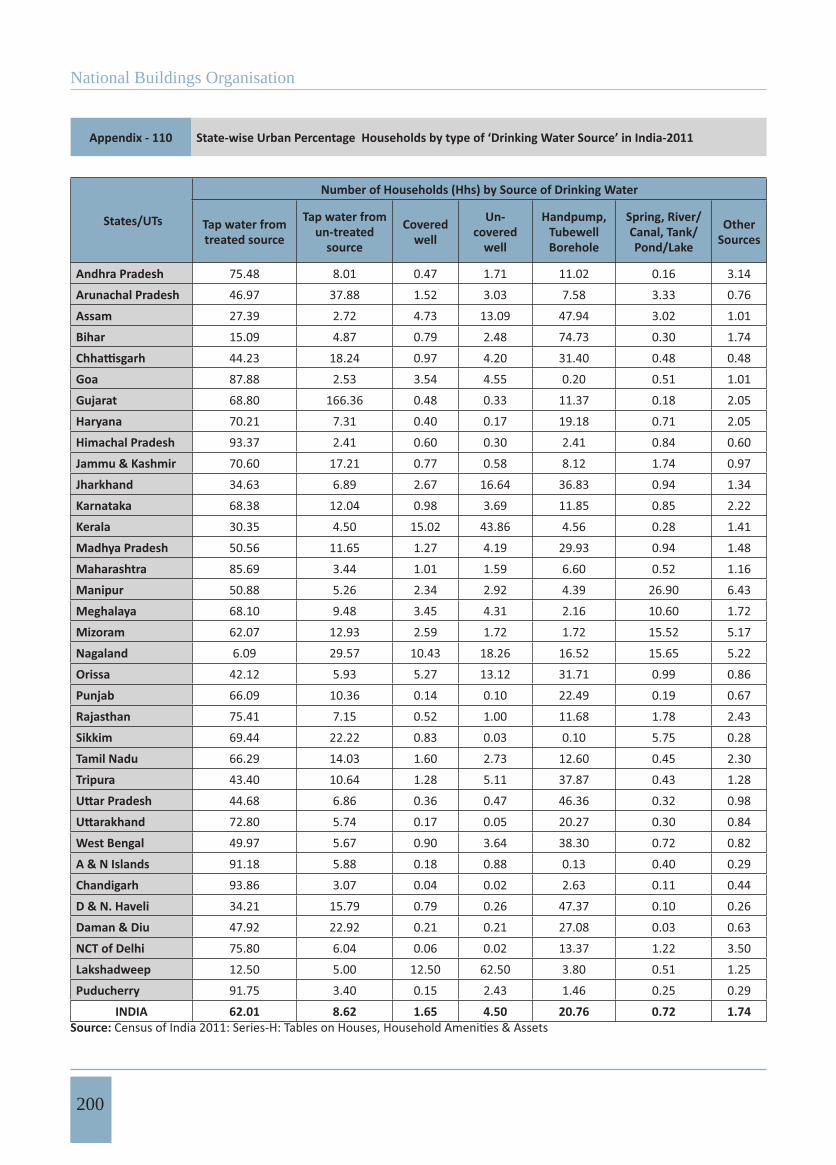
National Buildings Organisation
200
Appendix - 110 State-wise Urban Percentage Households by type of ‘Drinking Water Source’ in India-2011
States/UTs
Number of Households (Hhs) by Source of Drinking Water
Tap water from treated source
Tap water from un-treated
source
Covered well
Un-covered
well
Handpump,Tubewell Borehole
Spring, River/Canal, Tank/Pond/Lake
OtherSources
Andhra Pradesh 75.48 8.01 0.47 1.71 11.02 0.16 3.14Arunachal Pradesh 46.97 37.88 1.52 3.03 7.58 3.33 0.76Assam 27.39 2.72 4.73 13.09 47.94 3.02 1.01Bihar 15.09 4.87 0.79 2.48 74.73 0.30 1.74
44.23 18.24 0.97 4.20 31.40 0.48 0.48Goa 87.88 2.53 3.54 4.55 0.20 0.51 1.01Gujarat 68.80 166.36 0.48 0.33 11.37 0.18 2.05Haryana 70.21 7.31 0.40 0.17 19.18 0.71 2.05Himachal Pradesh 93.37 2.41 0.60 0.30 2.41 0.84 0.60Jammu & Kashmir 70.60 17.21 0.77 0.58 8.12 1.74 0.97Jharkhand 34.63 6.89 2.67 16.64 36.83 0.94 1.34Karnataka 68.38 12.04 0.98 3.69 11.85 0.85 2.22Kerala 30.35 4.50 15.02 43.86 4.56 0.28 1.41Madhya Pradesh 50.56 11.65 1.27 4.19 29.93 0.94 1.48Maharashtra 85.69 3.44 1.01 1.59 6.60 0.52 1.16Manipur 50.88 5.26 2.34 2.92 4.39 26.90 6.43Meghalaya 68.10 9.48 3.45 4.31 2.16 10.60 1.72Mizoram 62.07 12.93 2.59 1.72 1.72 15.52 5.17Nagaland 6.09 29.57 10.43 18.26 16.52 15.65 5.22Orissa 42.12 5.93 5.27 13.12 31.71 0.99 0.86Punjab 66.09 10.36 0.14 0.10 22.49 0.19 0.67Rajasthan 75.41 7.15 0.52 1.00 11.68 1.78 2.43Sikkim 69.44 22.22 0.83 0.03 0.10 5.75 0.28Tamil Nadu 66.29 14.03 1.60 2.73 12.60 0.45 2.30Tripura 43.40 10.64 1.28 5.11 37.87 0.43 1.28
44.68 6.86 0.36 0.47 46.36 0.32 0.9872.80 5.74 0.17 0.05 20.27 0.30 0.84
West Bengal 49.97 5.67 0.90 3.64 38.30 0.72 0.82A & N Islands 91.18 5.88 0.18 0.88 0.13 0.40 0.29Chandigarh 93.86 3.07 0.04 0.02 2.63 0.11 0.44D & N. Haveli 34.21 15.79 0.79 0.26 47.37 0.10 0.26Daman & Diu 47.92 22.92 0.21 0.21 27.08 0.03 0.63NCT of Delhi 75.80 6.04 0.06 0.02 13.37 1.22 3.50Lakshadweep 12.50 5.00 12.50 62.50 3.80 0.51 1.25Puducherry 91.75 3.40 0.15 2.43 1.46 0.25 0.29
INDIA 62.01 8.62 1.65 4.50 20.76 0.72 1.74Source:
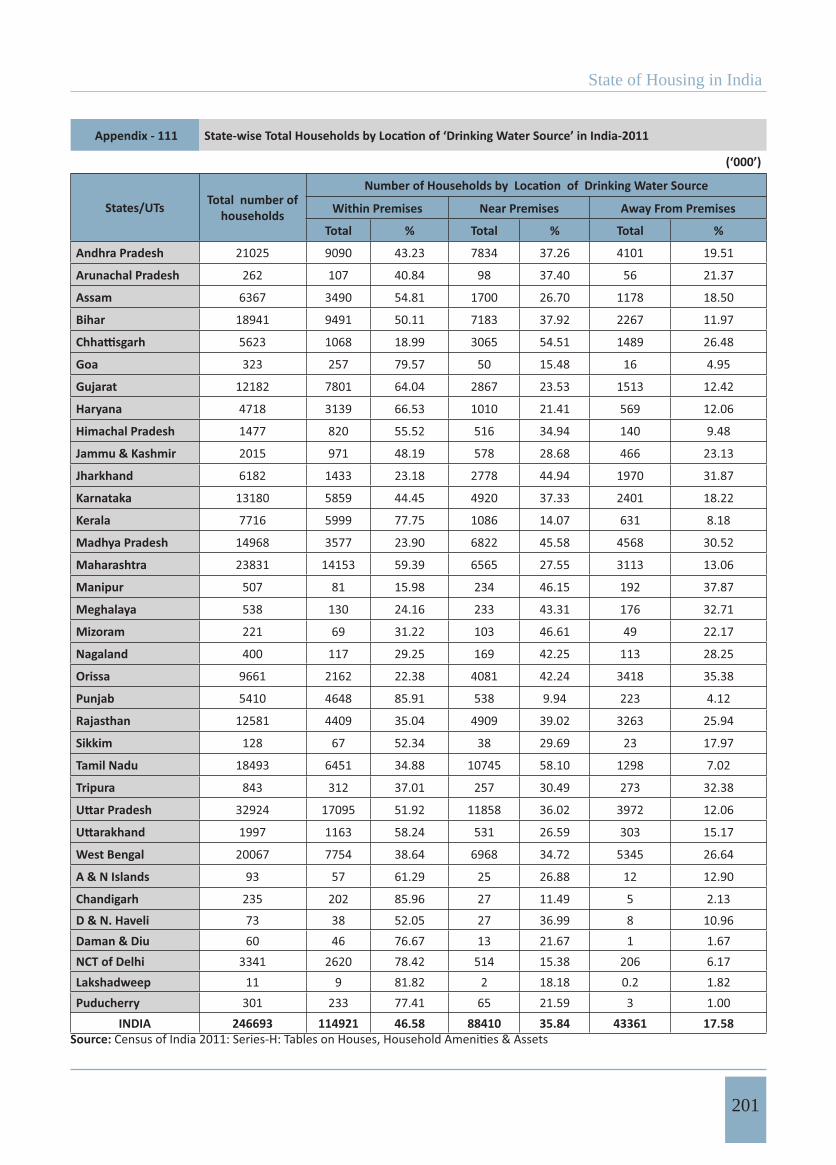
State of Housing in India
201
Appendix - 111
(‘000’)
States/UTs Total number of households Within Premises Near Premises Away From Premises
Total % Total % Total %
Andhra Pradesh 21025 9090 43.23 7834 37.26 4101 19.51
Arunachal Pradesh 262 107 40.84 98 37.40 56 21.37
Assam 6367 3490 54.81 1700 26.70 1178 18.50
Bihar 18941 9491 50.11 7183 37.92 2267 11.97
5623 1068 18.99 3065 54.51 1489 26.48
Goa 323 257 79.57 50 15.48 16 4.95
Gujarat 12182 7801 64.04 2867 23.53 1513 12.42
Haryana 4718 3139 66.53 1010 21.41 569 12.06
Himachal Pradesh 1477 820 55.52 516 34.94 140 9.48
Jammu & Kashmir 2015 971 48.19 578 28.68 466 23.13
Jharkhand 6182 1433 23.18 2778 44.94 1970 31.87
Karnataka 13180 5859 44.45 4920 37.33 2401 18.22
Kerala 7716 5999 77.75 1086 14.07 631 8.18
Madhya Pradesh 14968 3577 23.90 6822 45.58 4568 30.52
Maharashtra 23831 14153 59.39 6565 27.55 3113 13.06
Manipur 507 81 15.98 234 46.15 192 37.87
Meghalaya 538 130 24.16 233 43.31 176 32.71
Mizoram 221 69 31.22 103 46.61 49 22.17
Nagaland 400 117 29.25 169 42.25 113 28.25
Orissa 9661 2162 22.38 4081 42.24 3418 35.38
Punjab 5410 4648 85.91 538 9.94 223 4.12
Rajasthan 12581 4409 35.04 4909 39.02 3263 25.94
Sikkim 128 67 52.34 38 29.69 23 17.97
Tamil Nadu 18493 6451 34.88 10745 58.10 1298 7.02
Tripura 843 312 37.01 257 30.49 273 32.38
32924 17095 51.92 11858 36.02 3972 12.06
1997 1163 58.24 531 26.59 303 15.17
West Bengal 20067 7754 38.64 6968 34.72 5345 26.64
A & N Islands 93 57 61.29 25 26.88 12 12.90
Chandigarh 235 202 85.96 27 11.49 5 2.13
D & N. Haveli 73 38 52.05 27 36.99 8 10.96Daman & Diu 60 46 76.67 13 21.67 1 1.67NCT of Delhi 3341 2620 78.42 514 15.38 206 6.17Lakshadweep 11 9 81.82 2 18.18 0.2 1.82Puducherry 301 233 77.41 65 21.59 3 1.00
INDIA 246693 114921 46.58 88410 35.84 43361 17.58Source:
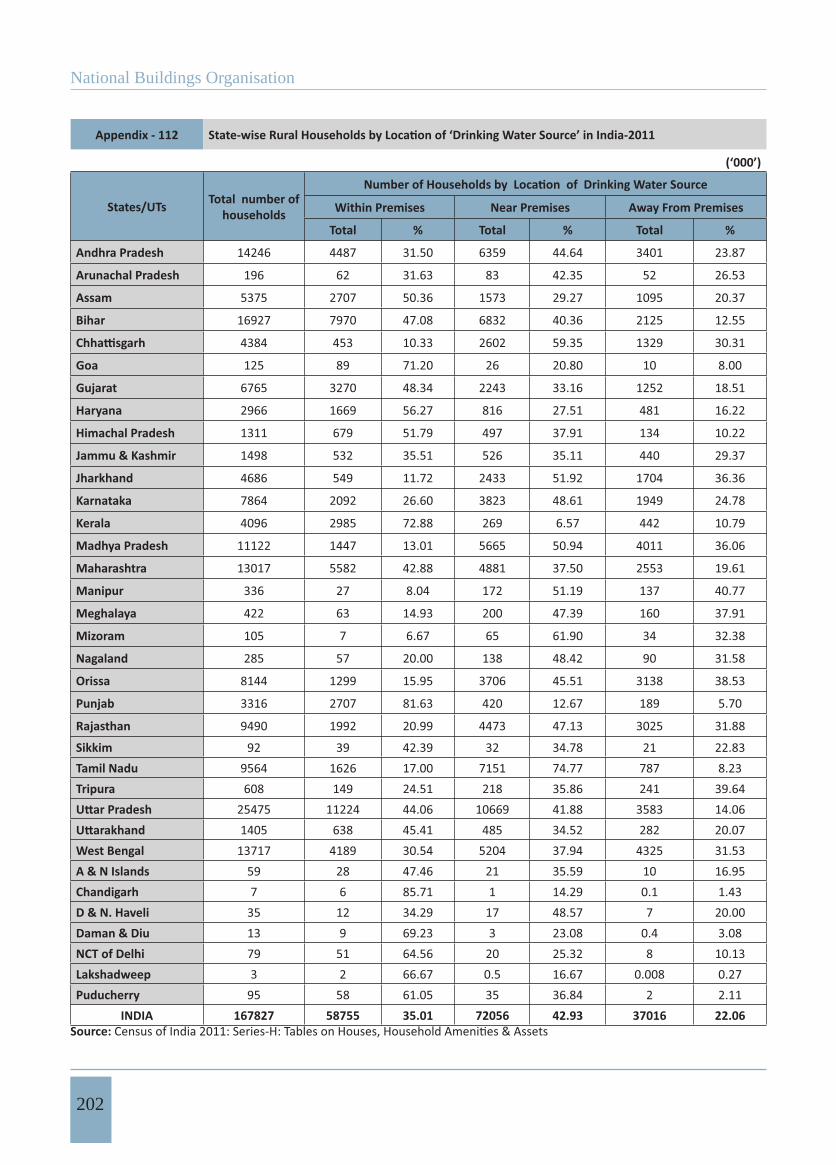
National Buildings Organisation
202
Appendix - 112
(‘000’)
States/UTs Total number of households Within Premises Near Premises Away From Premises
Total % Total % Total %
Andhra Pradesh 14246 4487 31.50 6359 44.64 3401 23.87
Arunachal Pradesh 196 62 31.63 83 42.35 52 26.53
Assam 5375 2707 50.36 1573 29.27 1095 20.37
Bihar 16927 7970 47.08 6832 40.36 2125 12.55
4384 453 10.33 2602 59.35 1329 30.31
Goa 125 89 71.20 26 20.80 10 8.00
Gujarat 6765 3270 48.34 2243 33.16 1252 18.51
Haryana 2966 1669 56.27 816 27.51 481 16.22
Himachal Pradesh 1311 679 51.79 497 37.91 134 10.22
Jammu & Kashmir 1498 532 35.51 526 35.11 440 29.37
Jharkhand 4686 549 11.72 2433 51.92 1704 36.36
Karnataka 7864 2092 26.60 3823 48.61 1949 24.78
Kerala 4096 2985 72.88 269 6.57 442 10.79
Madhya Pradesh 11122 1447 13.01 5665 50.94 4011 36.06
Maharashtra 13017 5582 42.88 4881 37.50 2553 19.61
Manipur 336 27 8.04 172 51.19 137 40.77
Meghalaya 422 63 14.93 200 47.39 160 37.91
Mizoram 105 7 6.67 65 61.90 34 32.38
Nagaland 285 57 20.00 138 48.42 90 31.58
Orissa 8144 1299 15.95 3706 45.51 3138 38.53
Punjab 3316 2707 81.63 420 12.67 189 5.70
Rajasthan 9490 1992 20.99 4473 47.13 3025 31.88
Sikkim 92 39 42.39 32 34.78 21 22.83Tamil Nadu 9564 1626 17.00 7151 74.77 787 8.23Tripura 608 149 24.51 218 35.86 241 39.64
25475 11224 44.06 10669 41.88 3583 14.061405 638 45.41 485 34.52 282 20.07
West Bengal 13717 4189 30.54 5204 37.94 4325 31.53A & N Islands 59 28 47.46 21 35.59 10 16.95Chandigarh 7 6 85.71 1 14.29 0.1 1.43D & N. Haveli 35 12 34.29 17 48.57 7 20.00Daman & Diu 13 9 69.23 3 23.08 0.4 3.08NCT of Delhi 79 51 64.56 20 25.32 8 10.13Lakshadweep 3 2 66.67 0.5 16.67 0.008 0.27Puducherry 95 58 61.05 35 36.84 2 2.11
INDIA 167827 58755 35.01 72056 42.93 37016 22.06Source:
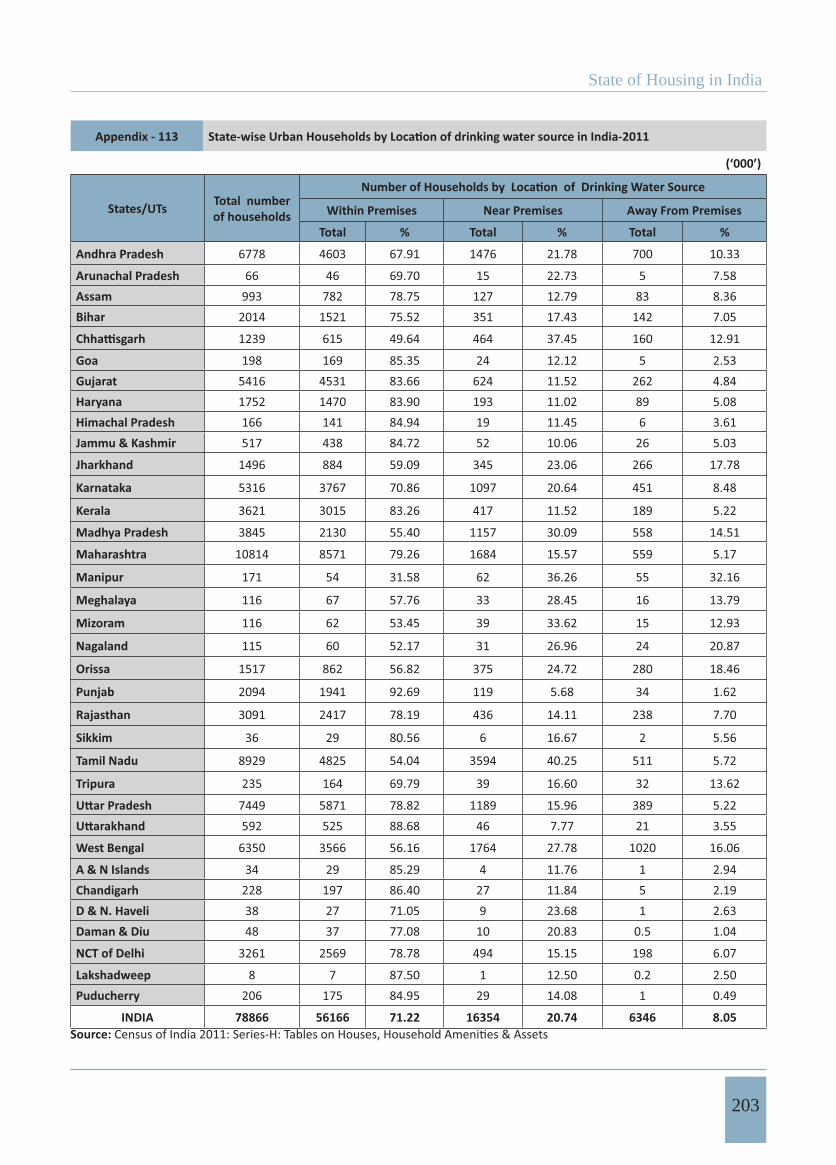
State of Housing in India
203
Appendix - 113
(‘000’)
States/UTs Total number of households Within Premises Near Premises Away From Premises
Total % Total % Total %
Andhra Pradesh 6778 4603 67.91 1476 21.78 700 10.33
Arunachal Pradesh 66 46 69.70 15 22.73 5 7.58Assam 993 782 78.75 127 12.79 83 8.36Bihar 2014 1521 75.52 351 17.43 142 7.05
1239 615 49.64 464 37.45 160 12.91
Goa 198 169 85.35 24 12.12 5 2.53Gujarat 5416 4531 83.66 624 11.52 262 4.84Haryana 1752 1470 83.90 193 11.02 89 5.08Himachal Pradesh 166 141 84.94 19 11.45 6 3.61Jammu & Kashmir 517 438 84.72 52 10.06 26 5.03
Jharkhand 1496 884 59.09 345 23.06 266 17.78
Karnataka 5316 3767 70.86 1097 20.64 451 8.48
Kerala 3621 3015 83.26 417 11.52 189 5.22
Madhya Pradesh 3845 2130 55.40 1157 30.09 558 14.51
Maharashtra 10814 8571 79.26 1684 15.57 559 5.17
Manipur 171 54 31.58 62 36.26 55 32.16
Meghalaya 116 67 57.76 33 28.45 16 13.79
Mizoram 116 62 53.45 39 33.62 15 12.93
Nagaland 115 60 52.17 31 26.96 24 20.87
Orissa 1517 862 56.82 375 24.72 280 18.46
Punjab 2094 1941 92.69 119 5.68 34 1.62
Rajasthan 3091 2417 78.19 436 14.11 238 7.70
Sikkim 36 29 80.56 6 16.67 2 5.56
Tamil Nadu 8929 4825 54.04 3594 40.25 511 5.72
Tripura 235 164 69.79 39 16.60 32 13.62
7449 5871 78.82 1189 15.96 389 5.22592 525 88.68 46 7.77 21 3.55
West Bengal 6350 3566 56.16 1764 27.78 1020 16.06
A & N Islands 34 29 85.29 4 11.76 1 2.94Chandigarh 228 197 86.40 27 11.84 5 2.19D & N. Haveli 38 27 71.05 9 23.68 1 2.63Daman & Diu 48 37 77.08 10 20.83 0.5 1.04
NCT of Delhi 3261 2569 78.78 494 15.15 198 6.07
Lakshadweep 8 7 87.50 1 12.50 0.2 2.50Puducherry 206 175 84.95 29 14.08 1 0.49
INDIA 78866 56166 71.22 16354 20.74 6346 8.05Source:
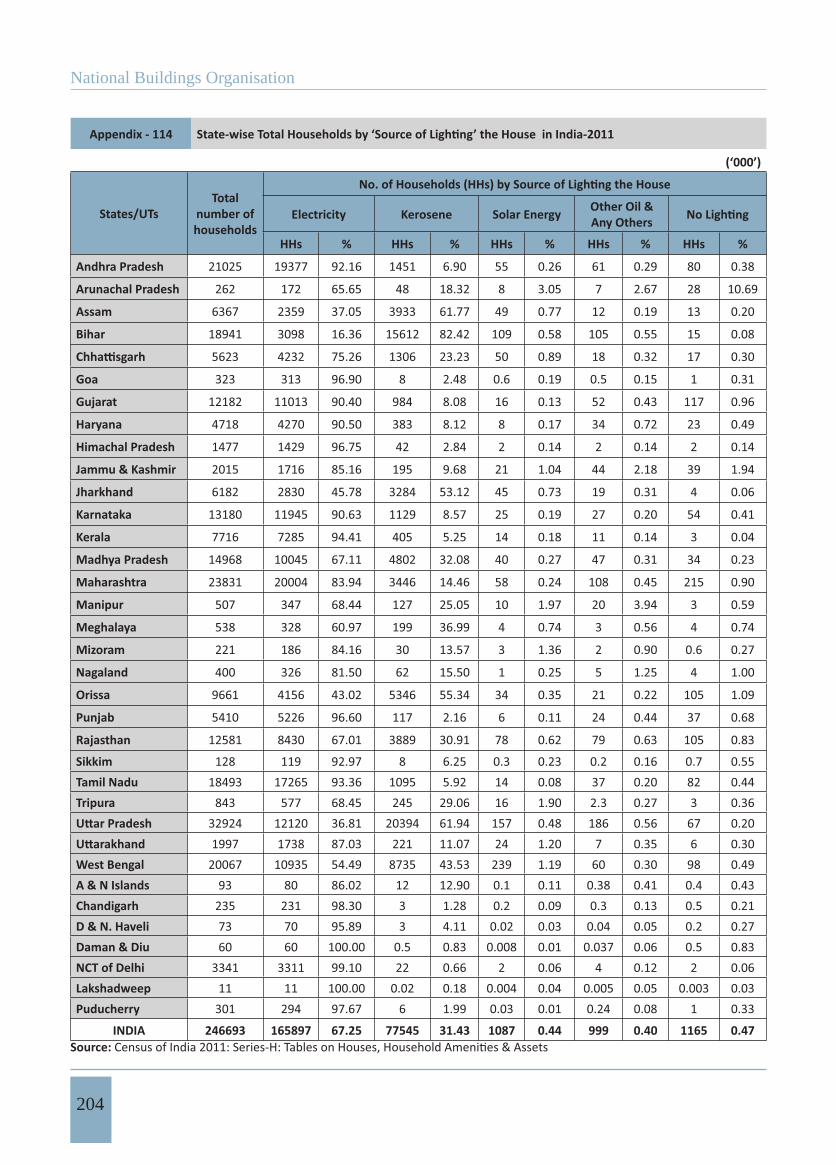
National Buildings Organisation
204
Appendix - 114
(‘000’)
States/UTsTotal
number of households
Electricity Kerosene Solar Energy Other Oil & Any Others
HHs % HHs % HHs % HHs % HHs %
Andhra Pradesh 21025 19377 92.16 1451 6.90 55 0.26 61 0.29 80 0.38
Arunachal Pradesh 262 172 65.65 48 18.32 8 3.05 7 2.67 28 10.69
Assam 6367 2359 37.05 3933 61.77 49 0.77 12 0.19 13 0.20
Bihar 18941 3098 16.36 15612 82.42 109 0.58 105 0.55 15 0.08
5623 4232 75.26 1306 23.23 50 0.89 18 0.32 17 0.30
Goa 323 313 96.90 8 2.48 0.6 0.19 0.5 0.15 1 0.31
Gujarat 12182 11013 90.40 984 8.08 16 0.13 52 0.43 117 0.96
Haryana 4718 4270 90.50 383 8.12 8 0.17 34 0.72 23 0.49
Himachal Pradesh 1477 1429 96.75 42 2.84 2 0.14 2 0.14 2 0.14
Jammu & Kashmir 2015 1716 85.16 195 9.68 21 1.04 44 2.18 39 1.94
Jharkhand 6182 2830 45.78 3284 53.12 45 0.73 19 0.31 4 0.06
Karnataka 13180 11945 90.63 1129 8.57 25 0.19 27 0.20 54 0.41
Kerala 7716 7285 94.41 405 5.25 14 0.18 11 0.14 3 0.04
Madhya Pradesh 14968 10045 67.11 4802 32.08 40 0.27 47 0.31 34 0.23
Maharashtra 23831 20004 83.94 3446 14.46 58 0.24 108 0.45 215 0.90
Manipur 507 347 68.44 127 25.05 10 1.97 20 3.94 3 0.59
Meghalaya 538 328 60.97 199 36.99 4 0.74 3 0.56 4 0.74
Mizoram 221 186 84.16 30 13.57 3 1.36 2 0.90 0.6 0.27
Nagaland 400 326 81.50 62 15.50 1 0.25 5 1.25 4 1.00
Orissa 9661 4156 43.02 5346 55.34 34 0.35 21 0.22 105 1.09
Punjab 5410 5226 96.60 117 2.16 6 0.11 24 0.44 37 0.68
Rajasthan 12581 8430 67.01 3889 30.91 78 0.62 79 0.63 105 0.83
Sikkim 128 119 92.97 8 6.25 0.3 0.23 0.2 0.16 0.7 0.55Tamil Nadu 18493 17265 93.36 1095 5.92 14 0.08 37 0.20 82 0.44Tripura 843 577 68.45 245 29.06 16 1.90 2.3 0.27 3 0.36
32924 12120 36.81 20394 61.94 157 0.48 186 0.56 67 0.201997 1738 87.03 221 11.07 24 1.20 7 0.35 6 0.30
West Bengal 20067 10935 54.49 8735 43.53 239 1.19 60 0.30 98 0.49A & N Islands 93 80 86.02 12 12.90 0.1 0.11 0.38 0.41 0.4 0.43Chandigarh 235 231 98.30 3 1.28 0.2 0.09 0.3 0.13 0.5 0.21D & N. Haveli 73 70 95.89 3 4.11 0.02 0.03 0.04 0.05 0.2 0.27Daman & Diu 60 60 100.00 0.5 0.83 0.008 0.01 0.037 0.06 0.5 0.83NCT of Delhi 3341 3311 99.10 22 0.66 2 0.06 4 0.12 2 0.06Lakshadweep 11 11 100.00 0.02 0.18 0.004 0.04 0.005 0.05 0.003 0.03Puducherry 301 294 97.67 6 1.99 0.03 0.01 0.24 0.08 1 0.33
INDIA 246693 165897 67.25 77545 31.43 1087 0.44 999 0.40 1165 0.47Source:

State of Housing in India
205
Appendix - 115
(‘000’)
States/UTsTotal
number of households
Electricity Kerosene Solar Energy Other Oil & Any Others
HHs % HHs % HHs % HHs % HHs %
Andhra Pradesh 14246 12782 89.72 1313 9.22 33 0.23 51 0.36 67 0.47
Arunachal Pradesh 196 109 55.61 46 23.47 8 4.08 6 3.06 27 13.78
Assam 5375 1524 28.35 3783 70.38 47 0.87 10 0.19 10 0.19
Bihar 16927 1755 10.37 14964 88.40 104 0.61 93 0.55 11 0.06
4384 3071 70.05 1236 28.19 49 1.12 15 0.34 14 0.32
Goa 125 119 95.20 4 3.20 0.3 0.24 0.13 0.10 1 0.80
Gujarat 6765 5749 84.98 869 12.85 14 0.21 41 0.61 92 1.36
Haryana 2966 2585 87.15 336 11.33 6 0.20 24 0.81 15 0.51
Himachal Pradesh 1311 1266 96.57 39 2.97 2 0.15 2 0.15 2 0.15
Jammu & Kashmir 1498 1209 80.71 189 12.62 20 1.34 42 2.80 38 2.54
Jharkhand 4686 1514 32.31 3113 66.43 42 0.90 15 0.32 2 0.04
Karnataka 7864 6820 86.72 966 12.28 19 0.24 18 0.23 41 0.52
Kerala 4096 3772 92.09 304 7.42 11 0.27 6 0.15 2 0.05
Madhya Pradesh 11122 6479 58.25 4547 40.88 36 0.32 36 0.32 25 0.22
Maharashtra 13017 9605 73.79 3107 23.87 49 0.38 83 0.64 172 1.32
Manipur 336 205 61.01 108 32.14 9 2.68 11 3.27 2 0.60
Meghalaya 422 218 51.66 194 45.97 4 0.95 2 0.47 4 0.95
Mizoram 105 72 68.57 28 26.67 3 2.86 1.6 1.52 0.5 0.48
Nagaland 285 214 75.09 60 21.05 1 0.35 5 1.75 4 1.40
Orissa 8144 2895 35.55 5114 62.79 32 0.39 17 0.21 86 1.06
Punjab 3316 3166 95.48 96 2.90 4 0.12 18 0.54 31 0.93
Rajasthan 9490 5528 58.25 3729 39.29 76 0.80 65 0.68 91 0.96
Sikkim 92 83 90.22 8 8.70 0.3 0.33 0.2 0.22 0.5 0.54Tamil Nadu 9564 8683 90.79 791 8.27 9 0.09 24 0.25 56 0.59Tripura 608 362 59.54 229 37.66 13 2.14 1.3 0.21 2 0.33
25475 6055 23.77 19111 75.02 141 0.55 132 0.52 36 0.14
1405 1167 83.06 204 14.52 24 1.71 6 0.43 5 0.36
West Bengal 13717 5529 40.31 7928 57.80 160 1.17 40 0.29 59 0.43A & N Islands 59 47 79.66 11 18.64 0.1 0.17 0.28 0.47 0.3 0.51Chandigarh 7 7 100.00 0.2 2.86 0.001 0.01 0.012 0.17 0.007 0.10D & N. Haveli 35 32 91.43 3 8.57 0.02 0.06 0.028 0.08 0.2 0.57Daman & Diu 13 13 100.00 0.2 1.54 0.004 0.03 0.004 0.03 0.03 0.23NCT of Delhi 79 77 97.47 1 1.27 0.06 0.08 0.3 0.38 0.2 0.25Lakshadweep 3 3 100.00 0.005 0.17 0 0.00 0.001 0.03 0 0.00Puducherry 95 91 95.79 3 3.16 0.02 0.02 0.102 0.11 0.5 0.53
INDIA 167827 92808 55.30 72435 43.16 916 0.55 770 0.46 898 0.54Source:
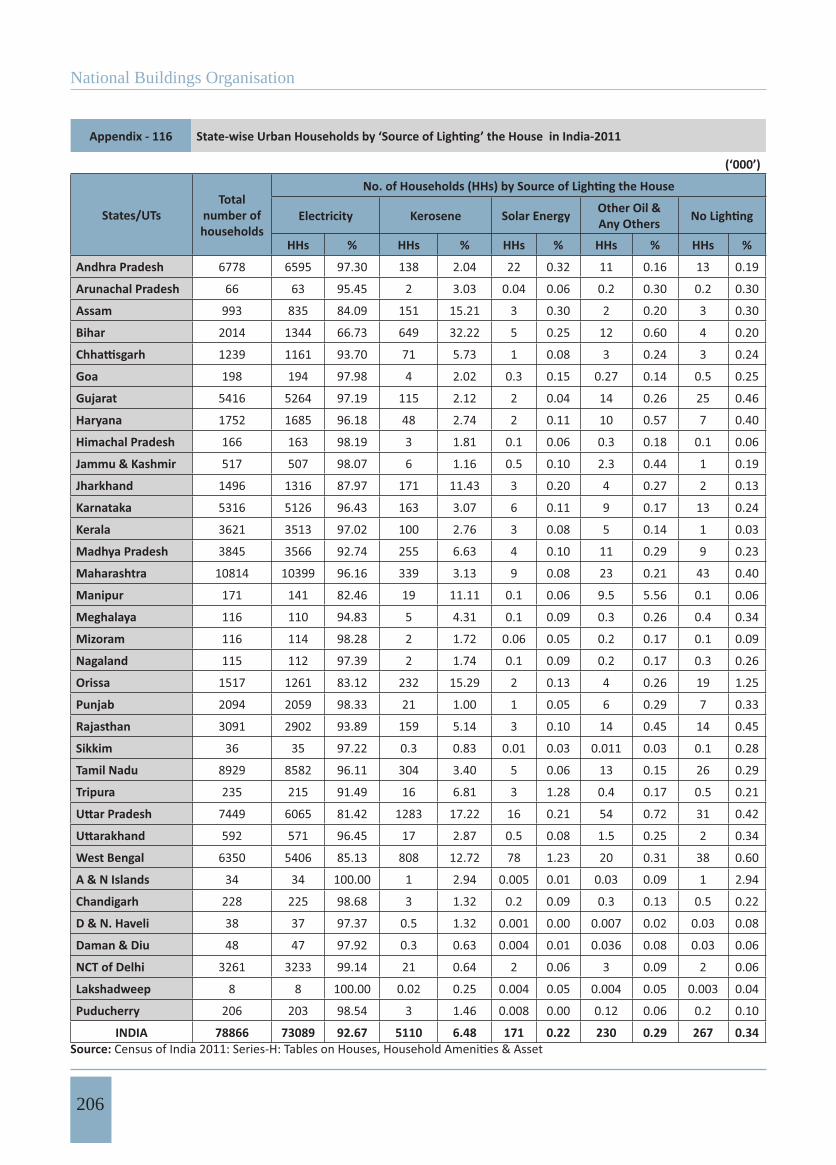
National Buildings Organisation
206
Appendix - 116
(‘000’)
States/UTsTotal
number of households
Electricity Kerosene Solar Energy Other Oil & Any Others
HHs % HHs % HHs % HHs % HHs %
Andhra Pradesh 6778 6595 97.30 138 2.04 22 0.32 11 0.16 13 0.19
Arunachal Pradesh 66 63 95.45 2 3.03 0.04 0.06 0.2 0.30 0.2 0.30
Assam 993 835 84.09 151 15.21 3 0.30 2 0.20 3 0.30
Bihar 2014 1344 66.73 649 32.22 5 0.25 12 0.60 4 0.20
1239 1161 93.70 71 5.73 1 0.08 3 0.24 3 0.24
Goa 198 194 97.98 4 2.02 0.3 0.15 0.27 0.14 0.5 0.25
Gujarat 5416 5264 97.19 115 2.12 2 0.04 14 0.26 25 0.46
Haryana 1752 1685 96.18 48 2.74 2 0.11 10 0.57 7 0.40
Himachal Pradesh 166 163 98.19 3 1.81 0.1 0.06 0.3 0.18 0.1 0.06
Jammu & Kashmir 517 507 98.07 6 1.16 0.5 0.10 2.3 0.44 1 0.19
Jharkhand 1496 1316 87.97 171 11.43 3 0.20 4 0.27 2 0.13
Karnataka 5316 5126 96.43 163 3.07 6 0.11 9 0.17 13 0.24
Kerala 3621 3513 97.02 100 2.76 3 0.08 5 0.14 1 0.03
Madhya Pradesh 3845 3566 92.74 255 6.63 4 0.10 11 0.29 9 0.23
Maharashtra 10814 10399 96.16 339 3.13 9 0.08 23 0.21 43 0.40
Manipur 171 141 82.46 19 11.11 0.1 0.06 9.5 5.56 0.1 0.06
Meghalaya 116 110 94.83 5 4.31 0.1 0.09 0.3 0.26 0.4 0.34
Mizoram 116 114 98.28 2 1.72 0.06 0.05 0.2 0.17 0.1 0.09
Nagaland 115 112 97.39 2 1.74 0.1 0.09 0.2 0.17 0.3 0.26
Orissa 1517 1261 83.12 232 15.29 2 0.13 4 0.26 19 1.25
Punjab 2094 2059 98.33 21 1.00 1 0.05 6 0.29 7 0.33
Rajasthan 3091 2902 93.89 159 5.14 3 0.10 14 0.45 14 0.45
Sikkim 36 35 97.22 0.3 0.83 0.01 0.03 0.011 0.03 0.1 0.28
Tamil Nadu 8929 8582 96.11 304 3.40 5 0.06 13 0.15 26 0.29
Tripura 235 215 91.49 16 6.81 3 1.28 0.4 0.17 0.5 0.21
7449 6065 81.42 1283 17.22 16 0.21 54 0.72 31 0.42
592 571 96.45 17 2.87 0.5 0.08 1.5 0.25 2 0.34
West Bengal 6350 5406 85.13 808 12.72 78 1.23 20 0.31 38 0.60
A & N Islands 34 34 100.00 1 2.94 0.005 0.01 0.03 0.09 1 2.94
Chandigarh 228 225 98.68 3 1.32 0.2 0.09 0.3 0.13 0.5 0.22
D & N. Haveli 38 37 97.37 0.5 1.32 0.001 0.00 0.007 0.02 0.03 0.08
Daman & Diu 48 47 97.92 0.3 0.63 0.004 0.01 0.036 0.08 0.03 0.06
NCT of Delhi 3261 3233 99.14 21 0.64 2 0.06 3 0.09 2 0.06
Lakshadweep 8 8 100.00 0.02 0.25 0.004 0.05 0.004 0.05 0.003 0.04
Puducherry 206 203 98.54 3 1.46 0.008 0.00 0.12 0.06 0.2 0.10
INDIA 78866 73089 92.67 5110 6.48 171 0.22 230 0.29 267 0.34Source:

State of Housing in India
207
Appendix - 117 State-wise Total Households by availability of latrine facility in India-2011
(‘000’)
States/UTs Total number of households
No of households having latrine facility within the
premises
No of household not having latrine facility within the premises
within the premises
% PublicLatrine % Open %
Andhra Pradesh 21025 10424 49.58 515 2.45 10085 47.97Arunachal Pradesh 262 162 61.83 8 3.05 91 34.73Assam 6367 4132 64.90 119 1.87 2117 33.25Bihar 18941 4367 23.06 215 1.14 14359 75.81
5623 1383 24.60 80 1.42 4160 73.98
Goa 323 257 79.57 12 3.72 53 16.41
Gujarat 12182 6986 57.35 274 2.25 4922 40.40
Haryana 4718 3238 68.63 72 1.53 1408 29.84
Himachal Pradesh 1477 1021 69.13 18 1.22 438 29.65
Jammu & Kashmir 2015 1031 51.17 55 2.73 929 46.10
Jharkhand 6182 1362 22.03 60 0.97 4759 76.98
Karnataka 13180 6749 51.21 504 3.82 5926 44.96
Kerala 7716 7346 95.20 81 1.05 290 3.76
Madhya Pradesh 14968 4313 28.81 178 1.19 10477 70.00Maharashtra 23831 12654 53.10 3082 12.93 8094 33.96Manipur 507 453 89.35 9 1.78 45 8.88
Meghalaya 538 389 72.30 15 2.79 185 34.39
Mizoram 221 203 91.86 3 1.36 15 6.79
Nagaland 400 306 76.50 28 7.00 66 16.50
Orissa 9661 2129 22.04 132 1.37 7399 76.59
Punjab 5410 4289 79.28 67 1.24 1053 19.46
Rajasthan 12581 4400 34.97 87 0.69 8095 64.34
Sikkim 128 112 87.50 2 1.56 15 11.72
Tamil Nadu 18493 8931 48.29 1108 5.99 8455 45.72Tripura 843 725 86.00 21 2.49 97 11.51
32924 11737 35.65 433 1.32 20754 63.041997 1314 65.80 23 1.15 661 33.10
West Bengal 20067 11809 58.85 507 2.53 7751 38.63A & N Islands 93 65 69.89 2 2.15 26 27.96Chandigarh 235 206 87.66 29 12.34 21 8.94D & N. Haveli 73 40 54.79 4 5.48 29 39.73Daman & Diu 60 47 78.33 7 11.67 6 10.00NCT of Delhi 3341 2991 89.52 240 7.18 109 3.26Lakshadweep 11 10 90.91 0.04 0.36 0.2 1.82Puducherry 301 206 68.44 13 4.32 82 27.24
INDIA 246693 115737 46.92 7998 3.24 122958 49.84Source:
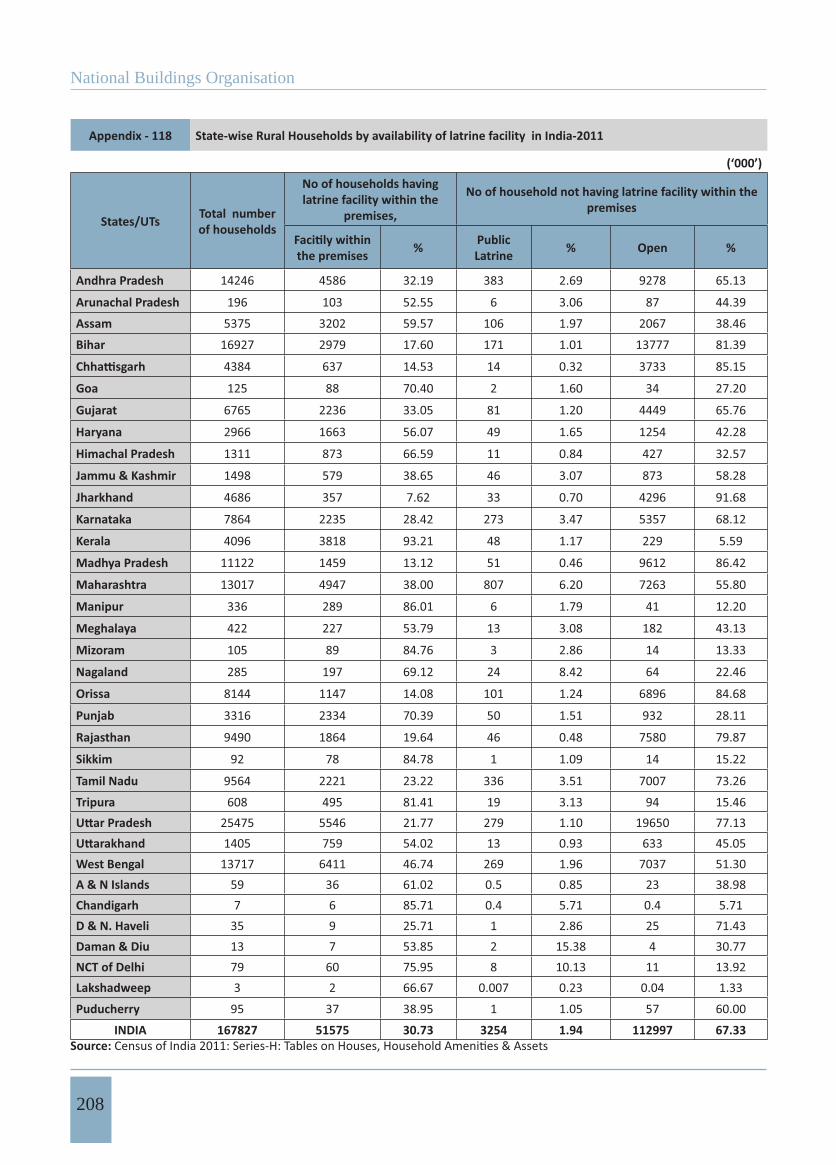
National Buildings Organisation
208
Appendix - 118 State-wise Rural Households by availability of latrine facility in India-2011
(‘000’)
States/UTs Total number of households
No of households having latrine facility within the
premises,
No of household not having latrine facility within the premises
the premises % PublicLatrine % Open %
Andhra Pradesh 14246 4586 32.19 383 2.69 9278 65.13
Arunachal Pradesh 196 103 52.55 6 3.06 87 44.39
Assam 5375 3202 59.57 106 1.97 2067 38.46
Bihar 16927 2979 17.60 171 1.01 13777 81.39
4384 637 14.53 14 0.32 3733 85.15
Goa 125 88 70.40 2 1.60 34 27.20
Gujarat 6765 2236 33.05 81 1.20 4449 65.76
Haryana 2966 1663 56.07 49 1.65 1254 42.28
Himachal Pradesh 1311 873 66.59 11 0.84 427 32.57
Jammu & Kashmir 1498 579 38.65 46 3.07 873 58.28
Jharkhand 4686 357 7.62 33 0.70 4296 91.68
Karnataka 7864 2235 28.42 273 3.47 5357 68.12
Kerala 4096 3818 93.21 48 1.17 229 5.59
Madhya Pradesh 11122 1459 13.12 51 0.46 9612 86.42
Maharashtra 13017 4947 38.00 807 6.20 7263 55.80
Manipur 336 289 86.01 6 1.79 41 12.20
Meghalaya 422 227 53.79 13 3.08 182 43.13
Mizoram 105 89 84.76 3 2.86 14 13.33
Nagaland 285 197 69.12 24 8.42 64 22.46
Orissa 8144 1147 14.08 101 1.24 6896 84.68
Punjab 3316 2334 70.39 50 1.51 932 28.11
Rajasthan 9490 1864 19.64 46 0.48 7580 79.87
Sikkim 92 78 84.78 1 1.09 14 15.22
Tamil Nadu 9564 2221 23.22 336 3.51 7007 73.26
Tripura 608 495 81.41 19 3.13 94 15.4625475 5546 21.77 279 1.10 19650 77.131405 759 54.02 13 0.93 633 45.05
West Bengal 13717 6411 46.74 269 1.96 7037 51.30A & N Islands 59 36 61.02 0.5 0.85 23 38.98Chandigarh 7 6 85.71 0.4 5.71 0.4 5.71D & N. Haveli 35 9 25.71 1 2.86 25 71.43Daman & Diu 13 7 53.85 2 15.38 4 30.77NCT of Delhi 79 60 75.95 8 10.13 11 13.92Lakshadweep 3 2 66.67 0.007 0.23 0.04 1.33
Puducherry 95 37 38.95 1 1.05 57 60.00
INDIA 167827 51575 30.73 3254 1.94 112997 67.33Source:

State of Housing in India
209
Appendix - 119 State-wise Urban Households by availability of latrine facility in India-2011
(‘000’)
States/UTs Total number of households
No of households having latrine facility within the
premises
No of household not having latrine facility within the premises
within the premises
% Public Latrine % Open %
Andhra Pradesh 6778 5838 86.13 132 1.95 808 11.92Arunachal Pradesh 66 59 89.39 2 3.03 4 6.06Assam 993 930 93.66 13 1.31 50 5.04Bihar 2014 1389 68.97 43 2.14 582 28.90
1239 746 60.21 66 5.33 427 34.46Goa 198 169 85.35 10 5.05 19 9.60Gujarat 5416 4750 87.70 193 3.56 473 8.73Haryana 1752 1575 89.90 23 1.31 154 8.79Himachal Pradesh 166 148 89.16 7 4.22 11 6.63Jammu & Kashmir 517 452 87.43 9 1.74 56 10.83Jharkhand 1496 1005 67.18 28 1.87 464 31.02Karnataka 5316 4515 84.93 231 4.35 570 10.72Kerala 3621 3528 97.43 32 0.88 61 1.68Madhya Pradesh 3845 2854 74.23 127 3.30 864 22.47Maharashtra 10814 7707 71.27 2275 21.04 832 7.69Manipur 171 165 96.49 3 1.75 4 2.34Meghalaya 116 111 95.69 2 1.72 3 2.59Mizoram 116 114 98.28 1 0.86 1 0.86Nagaland 115 109 94.78 4 3.48 3 2.61Orissa 1517 983 64.80 31 2.04 503 33.16Punjab 2094 1955 93.36 18 0.86 121 5.78Rajasthan 3091 2535 82.01 40 1.29 515 16.66Sikkim 36 34 94.44 1 2.78 1 2.78Tamil Nadu 8929 6710 75.15 772 8.65 1447 16.21Tripura 235 230 97.87 2 0.85 3 1.28
7449 6191 83.11 154 2.07 1104 14.82592 554 93.58 10 1.69 28 4.73
West Bengal 6350 5398 85.01 237 3.73 714 11.24A & N Islands 34 30 88.24 2 5.88 3 8.82Chandigarh 228 200 87.72 21 9.21 7 3.07D & N. Haveli 38 31 81.58 3 7.89 4 10.53Daman & Diu 48 41 85.42 5 10.42 2 4.17NCT of Delhi 3261 2930 89.85 232 7.11 99 3.04Lakshadweep 8 8 100.00 0.003 0.04 0.2 2.50Puducherry 206 169 82.04 12 5.83 25 12.14
INDIA 78866 64162 81.36 4744 6.02 9960 12.63Source:
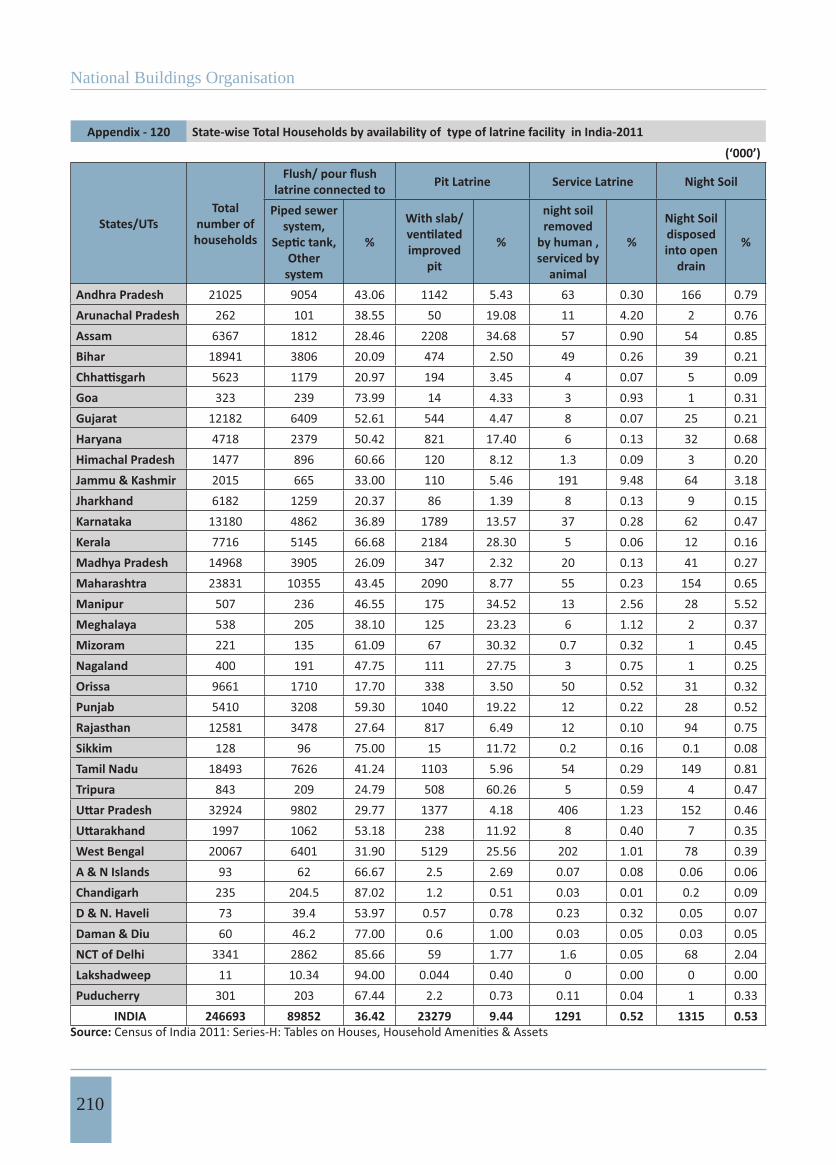
National Buildings Organisation
210
Appendix - 120 State-wise Total Households by availability of type of latrine facility in India-2011
(‘000’)
States/UTsTotal
number of households
latrine connected to Pit Latrine Service Latrine Night Soil
Piped sewer system,
Othersystem
%
With slab/
improved pit
%
night soil removed
by human , serviced by
animal
%
Night Soil disposedinto open
drain
%
Andhra Pradesh 21025 9054 43.06 1142 5.43 63 0.30 166 0.79Arunachal Pradesh 262 101 38.55 50 19.08 11 4.20 2 0.76Assam 6367 1812 28.46 2208 34.68 57 0.90 54 0.85Bihar 18941 3806 20.09 474 2.50 49 0.26 39 0.21
5623 1179 20.97 194 3.45 4 0.07 5 0.09Goa 323 239 73.99 14 4.33 3 0.93 1 0.31Gujarat 12182 6409 52.61 544 4.47 8 0.07 25 0.21Haryana 4718 2379 50.42 821 17.40 6 0.13 32 0.68Himachal Pradesh 1477 896 60.66 120 8.12 1.3 0.09 3 0.20Jammu & Kashmir 2015 665 33.00 110 5.46 191 9.48 64 3.18Jharkhand 6182 1259 20.37 86 1.39 8 0.13 9 0.15Karnataka 13180 4862 36.89 1789 13.57 37 0.28 62 0.47Kerala 7716 5145 66.68 2184 28.30 5 0.06 12 0.16Madhya Pradesh 14968 3905 26.09 347 2.32 20 0.13 41 0.27Maharashtra 23831 10355 43.45 2090 8.77 55 0.23 154 0.65Manipur 507 236 46.55 175 34.52 13 2.56 28 5.52Meghalaya 538 205 38.10 125 23.23 6 1.12 2 0.37Mizoram 221 135 61.09 67 30.32 0.7 0.32 1 0.45Nagaland 400 191 47.75 111 27.75 3 0.75 1 0.25Orissa 9661 1710 17.70 338 3.50 50 0.52 31 0.32Punjab 5410 3208 59.30 1040 19.22 12 0.22 28 0.52Rajasthan 12581 3478 27.64 817 6.49 12 0.10 94 0.75Sikkim 128 96 75.00 15 11.72 0.2 0.16 0.1 0.08Tamil Nadu 18493 7626 41.24 1103 5.96 54 0.29 149 0.81Tripura 843 209 24.79 508 60.26 5 0.59 4 0.47
32924 9802 29.77 1377 4.18 406 1.23 152 0.461997 1062 53.18 238 11.92 8 0.40 7 0.35
West Bengal 20067 6401 31.90 5129 25.56 202 1.01 78 0.39A & N Islands 93 62 66.67 2.5 2.69 0.07 0.08 0.06 0.06Chandigarh 235 204.5 87.02 1.2 0.51 0.03 0.01 0.2 0.09D & N. Haveli 73 39.4 53.97 0.57 0.78 0.23 0.32 0.05 0.07Daman & Diu 60 46.2 77.00 0.6 1.00 0.03 0.05 0.03 0.05NCT of Delhi 3341 2862 85.66 59 1.77 1.6 0.05 68 2.04Lakshadweep 11 10.34 94.00 0.044 0.40 0 0.00 0 0.00Puducherry 301 203 67.44 2.2 0.73 0.11 0.04 1 0.33
INDIA 246693 89852 36.42 23279 9.44 1291 0.52 1315 0.53Source:
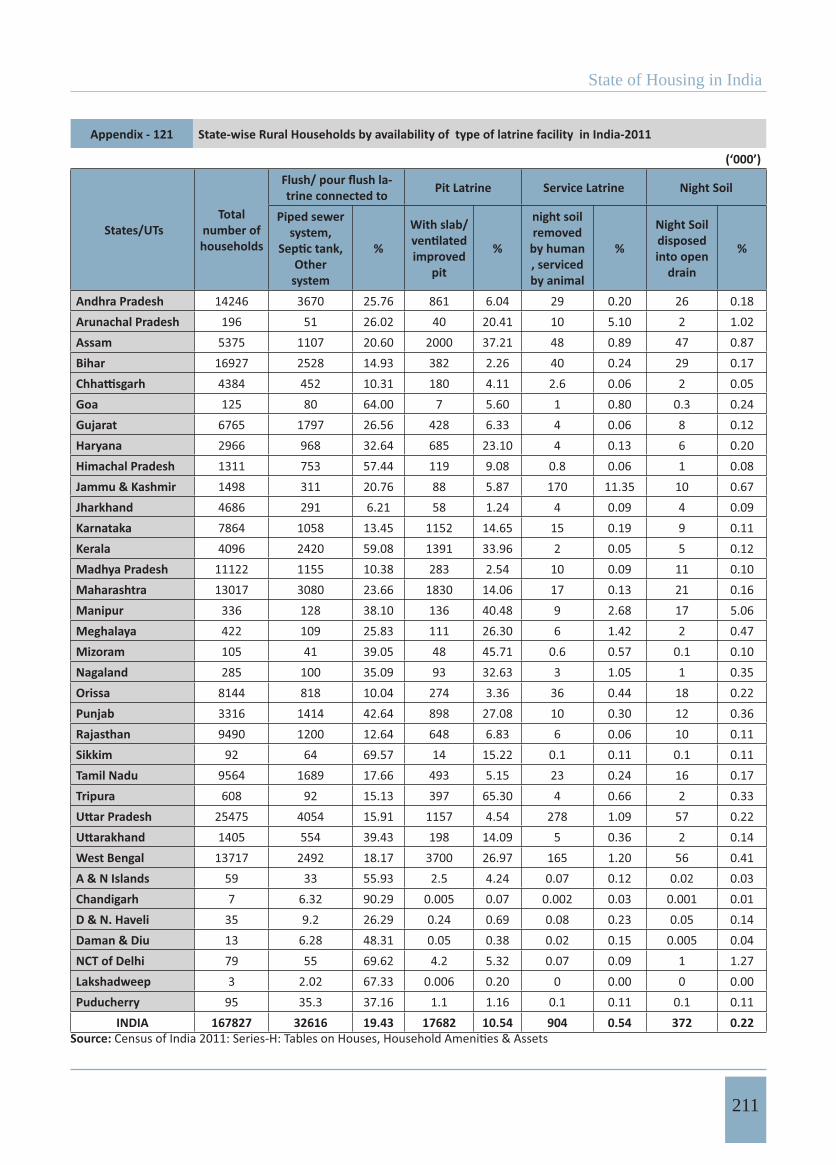
State of Housing in India
211
Appendix - 121 State-wise Rural Households by availability of type of latrine facility in India-2011
(‘000’)
States/UTsTotal
number of households
-trine connected to Pit Latrine Service Latrine Night Soil
Piped sewer system,
Othersystem
%
With slab/
improved pit
%
night soil removed by human , serviced by animal
%
Night Soil disposedinto open
drain
%
Andhra Pradesh 14246 3670 25.76 861 6.04 29 0.20 26 0.18Arunachal Pradesh 196 51 26.02 40 20.41 10 5.10 2 1.02Assam 5375 1107 20.60 2000 37.21 48 0.89 47 0.87Bihar 16927 2528 14.93 382 2.26 40 0.24 29 0.17
4384 452 10.31 180 4.11 2.6 0.06 2 0.05Goa 125 80 64.00 7 5.60 1 0.80 0.3 0.24Gujarat 6765 1797 26.56 428 6.33 4 0.06 8 0.12Haryana 2966 968 32.64 685 23.10 4 0.13 6 0.20Himachal Pradesh 1311 753 57.44 119 9.08 0.8 0.06 1 0.08Jammu & Kashmir 1498 311 20.76 88 5.87 170 11.35 10 0.67Jharkhand 4686 291 6.21 58 1.24 4 0.09 4 0.09Karnataka 7864 1058 13.45 1152 14.65 15 0.19 9 0.11Kerala 4096 2420 59.08 1391 33.96 2 0.05 5 0.12Madhya Pradesh 11122 1155 10.38 283 2.54 10 0.09 11 0.10Maharashtra 13017 3080 23.66 1830 14.06 17 0.13 21 0.16Manipur 336 128 38.10 136 40.48 9 2.68 17 5.06Meghalaya 422 109 25.83 111 26.30 6 1.42 2 0.47Mizoram 105 41 39.05 48 45.71 0.6 0.57 0.1 0.10Nagaland 285 100 35.09 93 32.63 3 1.05 1 0.35Orissa 8144 818 10.04 274 3.36 36 0.44 18 0.22Punjab 3316 1414 42.64 898 27.08 10 0.30 12 0.36Rajasthan 9490 1200 12.64 648 6.83 6 0.06 10 0.11Sikkim 92 64 69.57 14 15.22 0.1 0.11 0.1 0.11Tamil Nadu 9564 1689 17.66 493 5.15 23 0.24 16 0.17Tripura 608 92 15.13 397 65.30 4 0.66 2 0.33
25475 4054 15.91 1157 4.54 278 1.09 57 0.221405 554 39.43 198 14.09 5 0.36 2 0.14
West Bengal 13717 2492 18.17 3700 26.97 165 1.20 56 0.41A & N Islands 59 33 55.93 2.5 4.24 0.07 0.12 0.02 0.03Chandigarh 7 6.32 90.29 0.005 0.07 0.002 0.03 0.001 0.01D & N. Haveli 35 9.2 26.29 0.24 0.69 0.08 0.23 0.05 0.14Daman & Diu 13 6.28 48.31 0.05 0.38 0.02 0.15 0.005 0.04NCT of Delhi 79 55 69.62 4.2 5.32 0.07 0.09 1 1.27Lakshadweep 3 2.02 67.33 0.006 0.20 0 0.00 0 0.00Puducherry 95 35.3 37.16 1.1 1.16 0.1 0.11 0.1 0.11
INDIA 167827 32616 19.43 17682 10.54 904 0.54 372 0.22Source:
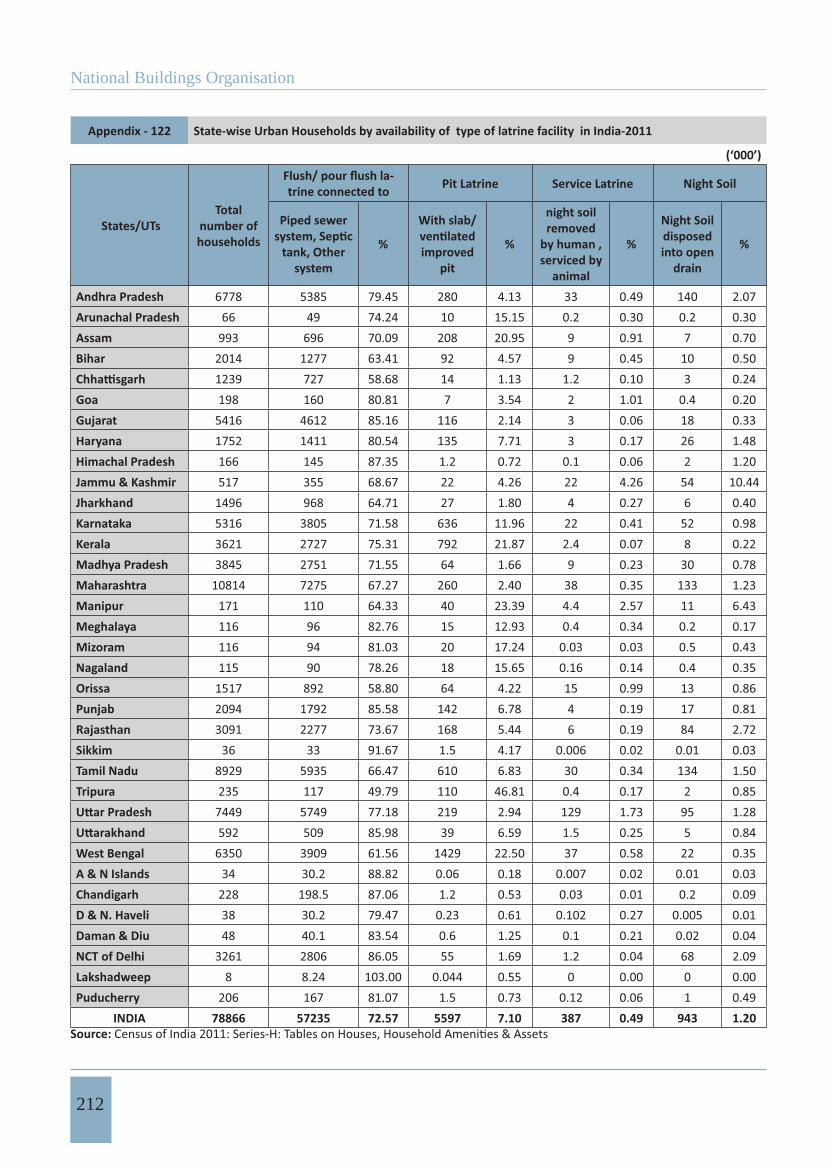
National Buildings Organisation
212
Appendix - 122 State-wise Urban Households by availability of type of latrine facility in India-2011
(‘000’)
States/UTsTotal
number of households
-trine connected to Pit Latrine Service Latrine Night Soil
Piped sewer
tank, Other system
%
With slab/
improved pit
%
night soil removed
by human , serviced by
animal
%
Night Soil disposedinto open
drain
%
Andhra Pradesh 6778 5385 79.45 280 4.13 33 0.49 140 2.07Arunachal Pradesh 66 49 74.24 10 15.15 0.2 0.30 0.2 0.30Assam 993 696 70.09 208 20.95 9 0.91 7 0.70Bihar 2014 1277 63.41 92 4.57 9 0.45 10 0.50
1239 727 58.68 14 1.13 1.2 0.10 3 0.24Goa 198 160 80.81 7 3.54 2 1.01 0.4 0.20Gujarat 5416 4612 85.16 116 2.14 3 0.06 18 0.33Haryana 1752 1411 80.54 135 7.71 3 0.17 26 1.48Himachal Pradesh 166 145 87.35 1.2 0.72 0.1 0.06 2 1.20Jammu & Kashmir 517 355 68.67 22 4.26 22 4.26 54 10.44Jharkhand 1496 968 64.71 27 1.80 4 0.27 6 0.40Karnataka 5316 3805 71.58 636 11.96 22 0.41 52 0.98Kerala 3621 2727 75.31 792 21.87 2.4 0.07 8 0.22Madhya Pradesh 3845 2751 71.55 64 1.66 9 0.23 30 0.78Maharashtra 10814 7275 67.27 260 2.40 38 0.35 133 1.23Manipur 171 110 64.33 40 23.39 4.4 2.57 11 6.43Meghalaya 116 96 82.76 15 12.93 0.4 0.34 0.2 0.17Mizoram 116 94 81.03 20 17.24 0.03 0.03 0.5 0.43Nagaland 115 90 78.26 18 15.65 0.16 0.14 0.4 0.35Orissa 1517 892 58.80 64 4.22 15 0.99 13 0.86Punjab 2094 1792 85.58 142 6.78 4 0.19 17 0.81Rajasthan 3091 2277 73.67 168 5.44 6 0.19 84 2.72Sikkim 36 33 91.67 1.5 4.17 0.006 0.02 0.01 0.03Tamil Nadu 8929 5935 66.47 610 6.83 30 0.34 134 1.50Tripura 235 117 49.79 110 46.81 0.4 0.17 2 0.85
7449 5749 77.18 219 2.94 129 1.73 95 1.28592 509 85.98 39 6.59 1.5 0.25 5 0.84
West Bengal 6350 3909 61.56 1429 22.50 37 0.58 22 0.35A & N Islands 34 30.2 88.82 0.06 0.18 0.007 0.02 0.01 0.03Chandigarh 228 198.5 87.06 1.2 0.53 0.03 0.01 0.2 0.09D & N. Haveli 38 30.2 79.47 0.23 0.61 0.102 0.27 0.005 0.01Daman & Diu 48 40.1 83.54 0.6 1.25 0.1 0.21 0.02 0.04NCT of Delhi 3261 2806 86.05 55 1.69 1.2 0.04 68 2.09Lakshadweep 8 8.24 103.00 0.044 0.55 0 0.00 0 0.00Puducherry 206 167 81.07 1.5 0.73 0.12 0.06 1 0.49
INDIA 78866 57235 72.57 5597 7.10 387 0.49 943 1.20Source:

State of Housing in India
213
Appendix - 123 State-wise Total Households by availability of Bathroom Facility in India-2011
(‘000’)
States/UTs Total Households
Households having Bathroom within the House Enclosure without Roof No Bathroom
% % %Andhra Pradesh 21025 10639 50.6 3475 16.53 6910 32.87Arunachal Pradesh 262 76 29.01 35 13.36 150 57.25Assam 6367 1558 24.47 1101 17.29 3708 58.24Bihar 18941 2133 11.26 4958 26.18 11850 62.56
5623 830 14.76 303 5.39 4490 79.85Goa 323 263 81.42 26 8.05 34 10.53Gujarat 12182 6878 56.46 1337 10.98 3967 32.56Haryana 4718 3213 68.1 678 14.37 826 17.51Himachal Pradesh 1477 996 67.43 109 7.38 372 25.19Jammu & Kashmir 2015 1057 52.46 162 8.04 797 39.55Jharkhand 6182 1019 16.48 554 8.96 4609 74.56Karnataka 13180 9860 74.81 1512 11.47 1808 13.72Kerala 7716 6267 81.22 352 4.56 1097 14.22Madhya Pradesh 14968 3861 25.8 3202 21.39 7904 52.81Maharashtra 23831 15316 64.27 5036 21.13 3479 14.60Manipur 507 158 31.16 102 20.12 248 48.92Meghalaya 538 179 33.27 34 6.32 325 60.41Mizoram 221 144 65.16 22 9.95 55 24.89Nagaland 400 209 52.25 120 30.00 70 17.50Orissa 9661 1360 14.08 542 5.61 7759 80.31Punjab 5410 3866 71.46 945 17.47 599 11.07Rajasthan 12581 4631 36.81 2355 18.72 5596 44.48Sikkim 128 83 64.84 4 3.13 40 31.25Tamil Nadu 18493 9236 49.94 2632 14.23 6625 35.82Tripura 843 159 18.86 111 13.17 572 67.85
32924 9563 29.05 8600 26.12 14761 44.831997 1208 60.49 176 8.81 613 30.70
West Bengal 20067 5446 27.14 1752 8.73 12870 64.14A & N Islands 93 59 63.44 12 12.90 22 23.66Chandigarh 235 204 86.81 7 2.98 24 10.21D & N. Haveli 73 38 52.05 11 15.07 25 34.25Daman & Diu 60 43 71.67 7 11.67 11 18.33NCT of Delhi 3341 2907 87.01 135 4.04 298 8.92Lakshadweep 11 10 90.91 0.1 0.91 0.3 2.73Puducherry 301 211 70.1 41 13.62 50 16.61 INDIA 246693 103680 42.03 40448 16.40 102565 41.58
Source:
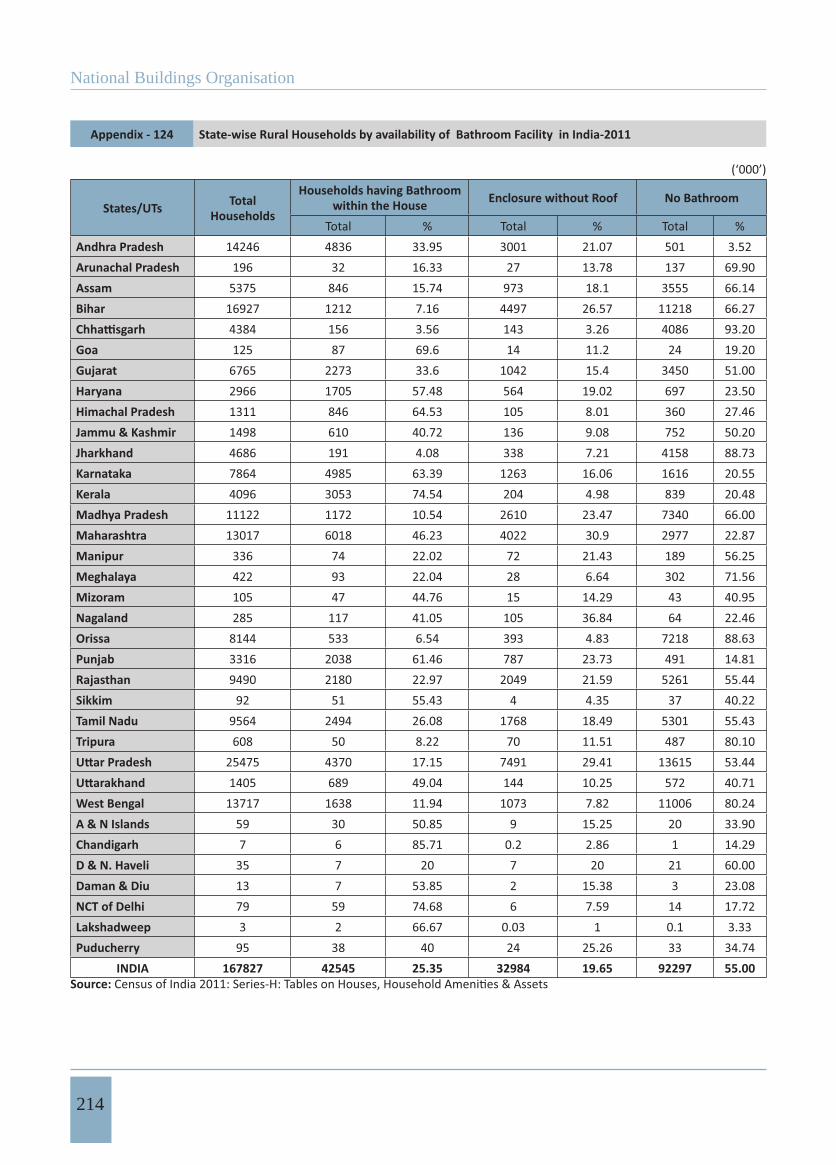
National Buildings Organisation
214
Appendix - 124 State-wise Rural Households by availability of Bathroom Facility in India-2011
(‘000’)
States/UTs Total Households
Households having Bathroom within the House Enclosure without Roof No Bathroom
% % %Andhra Pradesh 14246 4836 33.95 3001 21.07 501 3.52Arunachal Pradesh 196 32 16.33 27 13.78 137 69.90Assam 5375 846 15.74 973 18.1 3555 66.14Bihar 16927 1212 7.16 4497 26.57 11218 66.27
4384 156 3.56 143 3.26 4086 93.20Goa 125 87 69.6 14 11.2 24 19.20Gujarat 6765 2273 33.6 1042 15.4 3450 51.00Haryana 2966 1705 57.48 564 19.02 697 23.50Himachal Pradesh 1311 846 64.53 105 8.01 360 27.46Jammu & Kashmir 1498 610 40.72 136 9.08 752 50.20Jharkhand 4686 191 4.08 338 7.21 4158 88.73Karnataka 7864 4985 63.39 1263 16.06 1616 20.55Kerala 4096 3053 74.54 204 4.98 839 20.48Madhya Pradesh 11122 1172 10.54 2610 23.47 7340 66.00Maharashtra 13017 6018 46.23 4022 30.9 2977 22.87Manipur 336 74 22.02 72 21.43 189 56.25Meghalaya 422 93 22.04 28 6.64 302 71.56Mizoram 105 47 44.76 15 14.29 43 40.95Nagaland 285 117 41.05 105 36.84 64 22.46Orissa 8144 533 6.54 393 4.83 7218 88.63Punjab 3316 2038 61.46 787 23.73 491 14.81Rajasthan 9490 2180 22.97 2049 21.59 5261 55.44Sikkim 92 51 55.43 4 4.35 37 40.22Tamil Nadu 9564 2494 26.08 1768 18.49 5301 55.43Tripura 608 50 8.22 70 11.51 487 80.10
25475 4370 17.15 7491 29.41 13615 53.441405 689 49.04 144 10.25 572 40.71
West Bengal 13717 1638 11.94 1073 7.82 11006 80.24A & N Islands 59 30 50.85 9 15.25 20 33.90Chandigarh 7 6 85.71 0.2 2.86 1 14.29D & N. Haveli 35 7 20 7 20 21 60.00Daman & Diu 13 7 53.85 2 15.38 3 23.08NCT of Delhi 79 59 74.68 6 7.59 14 17.72Lakshadweep 3 2 66.67 0.03 1 0.1 3.33Puducherry 95 38 40 24 25.26 33 34.74
INDIA 167827 42545 25.35 32984 19.65 92297 55.00Source:
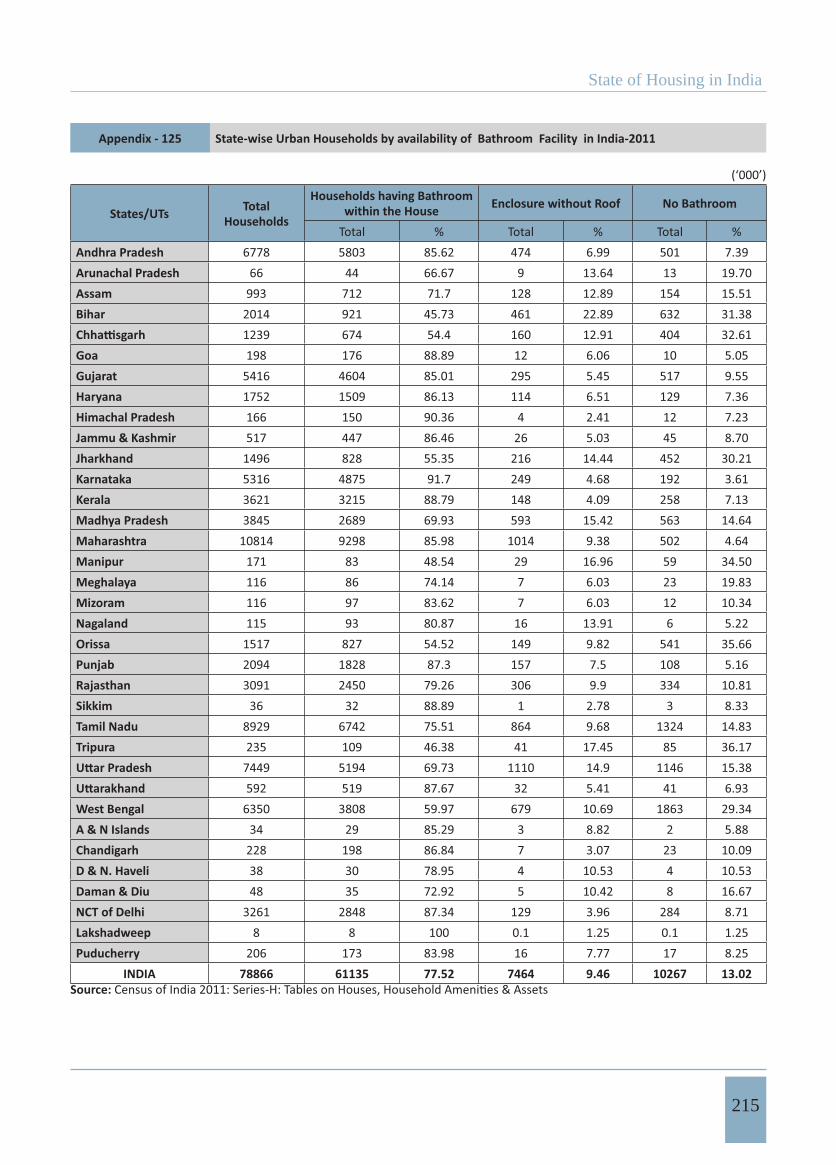
State of Housing in India
215
Appendix - 125 State-wise Urban Households by availability of Bathroom Facility in India-2011
(‘000’)
States/UTs Total Households
Households having Bathroom within the House Enclosure without Roof No Bathroom
% % %Andhra Pradesh 6778 5803 85.62 474 6.99 501 7.39Arunachal Pradesh 66 44 66.67 9 13.64 13 19.70Assam 993 712 71.7 128 12.89 154 15.51Bihar 2014 921 45.73 461 22.89 632 31.38
1239 674 54.4 160 12.91 404 32.61Goa 198 176 88.89 12 6.06 10 5.05Gujarat 5416 4604 85.01 295 5.45 517 9.55Haryana 1752 1509 86.13 114 6.51 129 7.36Himachal Pradesh 166 150 90.36 4 2.41 12 7.23Jammu & Kashmir 517 447 86.46 26 5.03 45 8.70Jharkhand 1496 828 55.35 216 14.44 452 30.21Karnataka 5316 4875 91.7 249 4.68 192 3.61Kerala 3621 3215 88.79 148 4.09 258 7.13Madhya Pradesh 3845 2689 69.93 593 15.42 563 14.64Maharashtra 10814 9298 85.98 1014 9.38 502 4.64Manipur 171 83 48.54 29 16.96 59 34.50Meghalaya 116 86 74.14 7 6.03 23 19.83Mizoram 116 97 83.62 7 6.03 12 10.34Nagaland 115 93 80.87 16 13.91 6 5.22Orissa 1517 827 54.52 149 9.82 541 35.66Punjab 2094 1828 87.3 157 7.5 108 5.16Rajasthan 3091 2450 79.26 306 9.9 334 10.81Sikkim 36 32 88.89 1 2.78 3 8.33Tamil Nadu 8929 6742 75.51 864 9.68 1324 14.83Tripura 235 109 46.38 41 17.45 85 36.17
7449 5194 69.73 1110 14.9 1146 15.38592 519 87.67 32 5.41 41 6.93
West Bengal 6350 3808 59.97 679 10.69 1863 29.34A & N Islands 34 29 85.29 3 8.82 2 5.88Chandigarh 228 198 86.84 7 3.07 23 10.09D & N. Haveli 38 30 78.95 4 10.53 4 10.53Daman & Diu 48 35 72.92 5 10.42 8 16.67NCT of Delhi 3261 2848 87.34 129 3.96 284 8.71Lakshadweep 8 8 100 0.1 1.25 0.1 1.25Puducherry 206 173 83.98 16 7.77 17 8.25
INDIA 78866 61135 77.52 7464 9.46 10267 13.02Source:
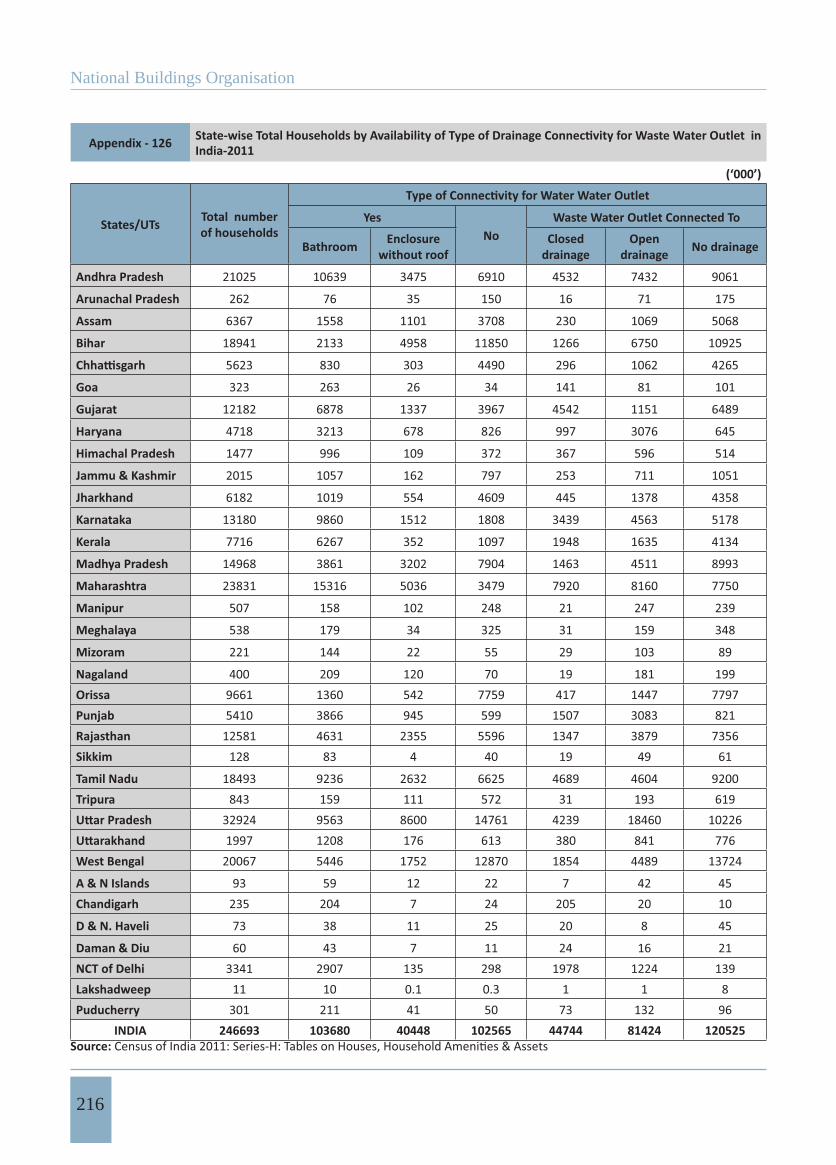
National Buildings Organisation
216
Appendix - 126 India-2011
(‘000’)
States/UTs Total number of households
YesNo
Waste Water Outlet Connected To
Bathroom Enclosure without roof
Closeddrainage
Opendrainage No drainage
Andhra Pradesh 21025 10639 3475 6910 4532 7432 9061
Arunachal Pradesh 262 76 35 150 16 71 175
Assam 6367 1558 1101 3708 230 1069 5068
Bihar 18941 2133 4958 11850 1266 6750 10925
5623 830 303 4490 296 1062 4265
Goa 323 263 26 34 141 81 101
Gujarat 12182 6878 1337 3967 4542 1151 6489
Haryana 4718 3213 678 826 997 3076 645
Himachal Pradesh 1477 996 109 372 367 596 514
Jammu & Kashmir 2015 1057 162 797 253 711 1051
Jharkhand 6182 1019 554 4609 445 1378 4358
Karnataka 13180 9860 1512 1808 3439 4563 5178
Kerala 7716 6267 352 1097 1948 1635 4134
Madhya Pradesh 14968 3861 3202 7904 1463 4511 8993
Maharashtra 23831 15316 5036 3479 7920 8160 7750
Manipur 507 158 102 248 21 247 239
Meghalaya 538 179 34 325 31 159 348
Mizoram 221 144 22 55 29 103 89
Nagaland 400 209 120 70 19 181 199Orissa 9661 1360 542 7759 417 1447 7797Punjab 5410 3866 945 599 1507 3083 821Rajasthan 12581 4631 2355 5596 1347 3879 7356Sikkim 128 83 4 40 19 49 61
Tamil Nadu 18493 9236 2632 6625 4689 4604 9200Tripura 843 159 111 572 31 193 619
32924 9563 8600 14761 4239 18460 102261997 1208 176 613 380 841 776
West Bengal 20067 5446 1752 12870 1854 4489 13724
A & N Islands 93 59 12 22 7 42 45Chandigarh 235 204 7 24 205 20 10
D & N. Haveli 73 38 11 25 20 8 45
Daman & Diu 60 43 7 11 24 16 21NCT of Delhi 3341 2907 135 298 1978 1224 139Lakshadweep 11 10 0.1 0.3 1 1 8Puducherry 301 211 41 50 73 132 96
INDIA 246693 103680 40448 102565 44744 81424 120525Source:
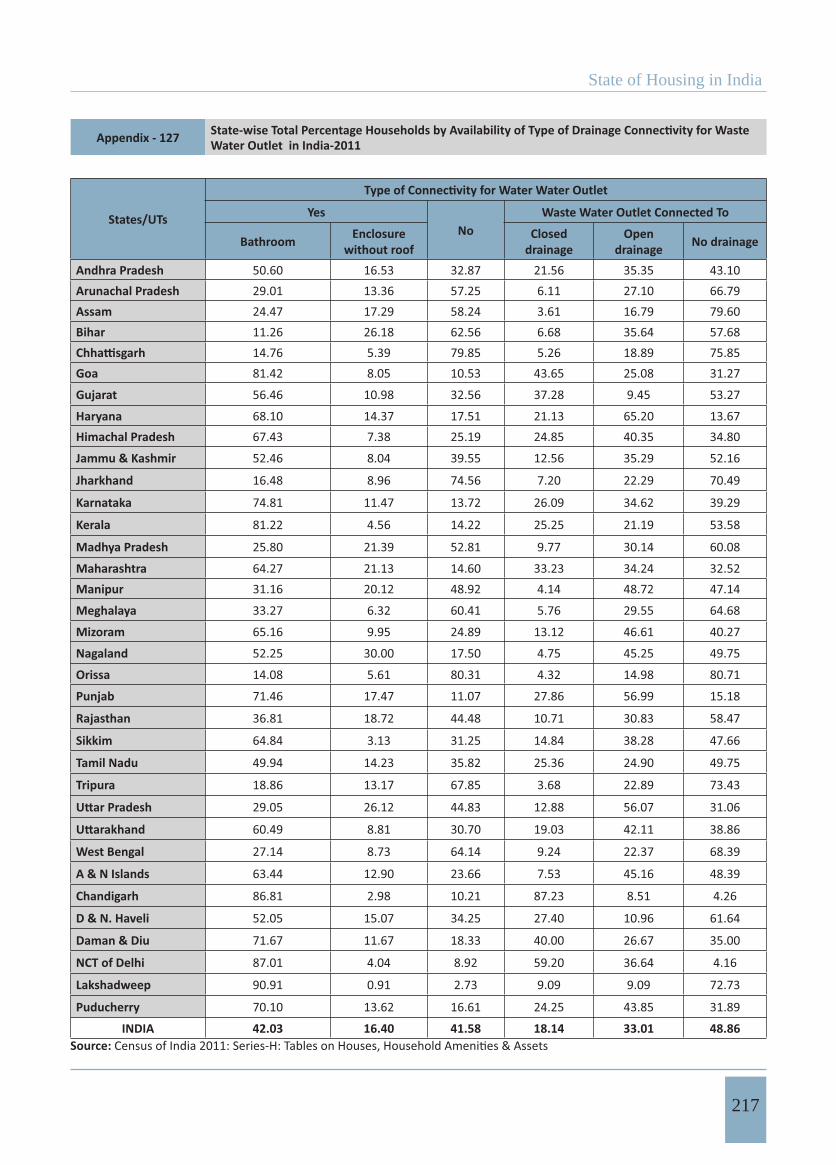
State of Housing in India
217
Appendix - 127 Water Outlet in India-2011
States/UTs YesNo
Waste Water Outlet Connected To
Bathroom Enclosure without roof
Closeddrainage
Opendrainage No drainage
Andhra Pradesh 50.60 16.53 32.87 21.56 35.35 43.10Arunachal Pradesh 29.01 13.36 57.25 6.11 27.10 66.79Assam 24.47 17.29 58.24 3.61 16.79 79.60Bihar 11.26 26.18 62.56 6.68 35.64 57.68
14.76 5.39 79.85 5.26 18.89 75.85Goa 81.42 8.05 10.53 43.65 25.08 31.27
Gujarat 56.46 10.98 32.56 37.28 9.45 53.27
Haryana 68.10 14.37 17.51 21.13 65.20 13.67Himachal Pradesh 67.43 7.38 25.19 24.85 40.35 34.80
Jammu & Kashmir 52.46 8.04 39.55 12.56 35.29 52.16
Jharkhand 16.48 8.96 74.56 7.20 22.29 70.49
Karnataka 74.81 11.47 13.72 26.09 34.62 39.29
Kerala 81.22 4.56 14.22 25.25 21.19 53.58
Madhya Pradesh 25.80 21.39 52.81 9.77 30.14 60.08
Maharashtra 64.27 21.13 14.60 33.23 34.24 32.52Manipur 31.16 20.12 48.92 4.14 48.72 47.14
Meghalaya 33.27 6.32 60.41 5.76 29.55 64.68
Mizoram 65.16 9.95 24.89 13.12 46.61 40.27
Nagaland 52.25 30.00 17.50 4.75 45.25 49.75
Orissa 14.08 5.61 80.31 4.32 14.98 80.71
Punjab 71.46 17.47 11.07 27.86 56.99 15.18
Rajasthan 36.81 18.72 44.48 10.71 30.83 58.47
Sikkim 64.84 3.13 31.25 14.84 38.28 47.66
Tamil Nadu 49.94 14.23 35.82 25.36 24.90 49.75
Tripura 18.86 13.17 67.85 3.68 22.89 73.43
29.05 26.12 44.83 12.88 56.07 31.06
60.49 8.81 30.70 19.03 42.11 38.86
West Bengal 27.14 8.73 64.14 9.24 22.37 68.39
A & N Islands 63.44 12.90 23.66 7.53 45.16 48.39
Chandigarh 86.81 2.98 10.21 87.23 8.51 4.26
D & N. Haveli 52.05 15.07 34.25 27.40 10.96 61.64
Daman & Diu 71.67 11.67 18.33 40.00 26.67 35.00
NCT of Delhi 87.01 4.04 8.92 59.20 36.64 4.16
Lakshadweep 90.91 0.91 2.73 9.09 9.09 72.73
Puducherry 70.10 13.62 16.61 24.25 43.85 31.89
INDIA 42.03 16.40 41.58 18.14 33.01 48.86Source:

National Buildings Organisation
218
Appendix - 128 India - 2011(‘000’)
States/UTs Total number of households
Yes
No
Waste Water Outlet Connected To
Bathroom Enclosure without roof
Closeddrainage
Opendrainage No drainage
Andhra Pradesh 14246 4836 3001 501 3362 2620 796
Arunachal Pradesh 196 32 27 137 5 38 153
Assam 5375 846 973 3555 77 663 4635
Bihar 16927 1212 4497 11218 663 5915 10349
4384 156 143 4086 79 425 3879
Goa 125 87 14 24 32 35 57
Gujarat 6765 2273 1042 3450 781 436 5548
Haryana 2966 1705 564 697 131 2326 509
Himachal Pradesh 1311 846 105 360 259 549 503
Jammu & Kashmir 1498 610 136 752 84 450 964
Jharkhand 4686 191 338 4158 73 691 3922
Karnataka 7864 4985 1263 1616 434 2912 4519
Kerala 4096 3053 204 839 733 874 2488
Madhya Pradesh 11122 1172 2610 7340 236 2573 8314
Maharashtra 13017 6018 4022 2977 1139 5084 6793
Manipur 336 74 72 189 10 137 188
Meghalaya 422 93 28 302 10 87 326Mizoram 105 47 15 43 5 34 65Nagaland 285 117 105 64 9 103 172Orissa 8144 533 393 7218 116 852 7176Punjab 3316 2038 787 491 300 2386 630Rajasthan 9490 2180 2049 5261 282 2284 6924Sikkim 92 51 4 37 5 30 58Tamil Nadu 9564 2494 1768 5301 692 1909 6963Tripura 608 50 70 487 14 84 510
25475 4370 7491 13615 1842 13902 97311405 689 144 572 130 541 734
West Bengal 13717 1638 1073 11006 304 1795 11618
A & N Islands 59 30 9 20 3 16 40
Chandigarh 7 6 0.2 1 6 1 0.4
D & N. Haveli 35 7 7 21 2 2 31
Daman & Diu 13 7 2 3 1 1 10
NCT of Delhi 79 59 6 14 11 59 10Lakshadweep 3 2 0.03 0.1 0.006 0.5 2Puducherry 95 38 24 33 7 28 60
INDIA 167827 42545 32984 92297 9645 52035 106146Source:
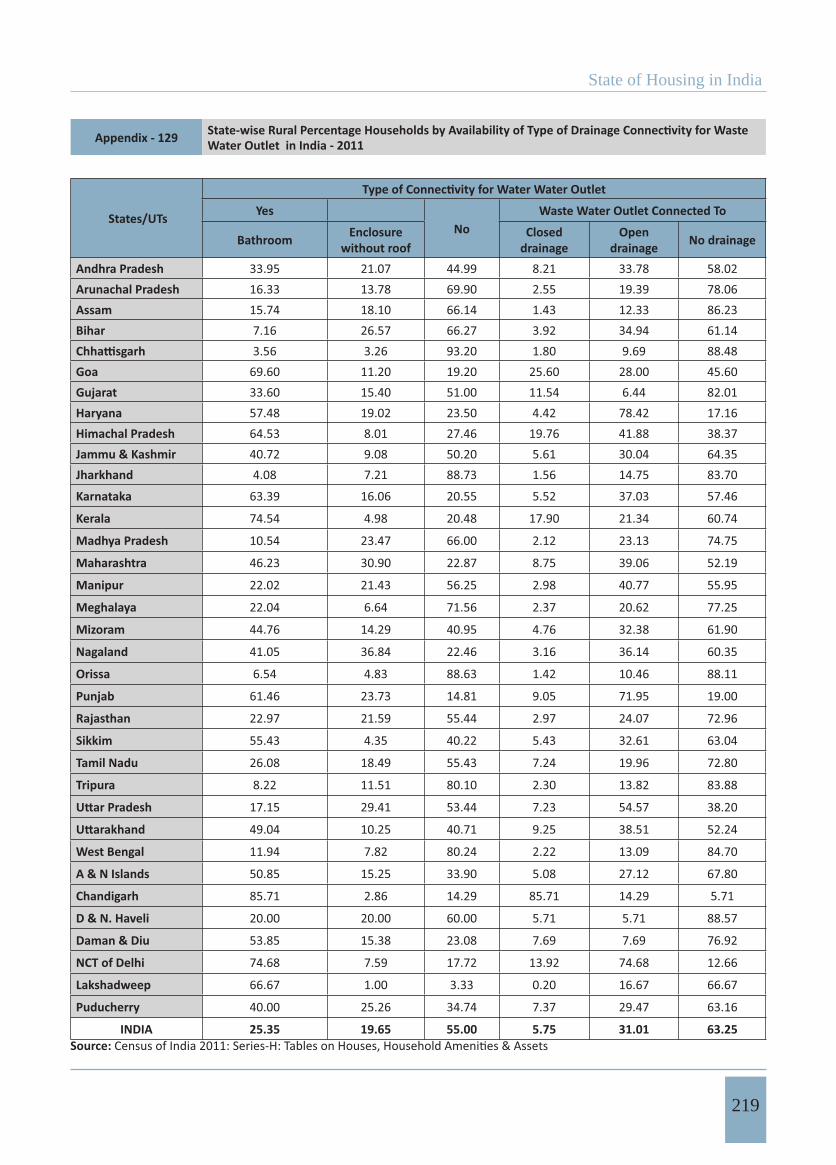
State of Housing in India
219
Appendix - 129 Water Outlet in India - 2011
States/UTs YesNo
Waste Water Outlet Connected To
Bathroom Enclosure without roof
Closeddrainage
Opendrainage No drainage
Andhra Pradesh 33.95 21.07 44.99 8.21 33.78 58.02Arunachal Pradesh 16.33 13.78 69.90 2.55 19.39 78.06Assam 15.74 18.10 66.14 1.43 12.33 86.23Bihar 7.16 26.57 66.27 3.92 34.94 61.14
3.56 3.26 93.20 1.80 9.69 88.48Goa 69.60 11.20 19.20 25.60 28.00 45.60Gujarat 33.60 15.40 51.00 11.54 6.44 82.01Haryana 57.48 19.02 23.50 4.42 78.42 17.16Himachal Pradesh 64.53 8.01 27.46 19.76 41.88 38.37Jammu & Kashmir 40.72 9.08 50.20 5.61 30.04 64.35Jharkhand 4.08 7.21 88.73 1.56 14.75 83.70
Karnataka 63.39 16.06 20.55 5.52 37.03 57.46
Kerala 74.54 4.98 20.48 17.90 21.34 60.74
Madhya Pradesh 10.54 23.47 66.00 2.12 23.13 74.75
Maharashtra 46.23 30.90 22.87 8.75 39.06 52.19
Manipur 22.02 21.43 56.25 2.98 40.77 55.95
Meghalaya 22.04 6.64 71.56 2.37 20.62 77.25
Mizoram 44.76 14.29 40.95 4.76 32.38 61.90
Nagaland 41.05 36.84 22.46 3.16 36.14 60.35
Orissa 6.54 4.83 88.63 1.42 10.46 88.11
Punjab 61.46 23.73 14.81 9.05 71.95 19.00
Rajasthan 22.97 21.59 55.44 2.97 24.07 72.96
Sikkim 55.43 4.35 40.22 5.43 32.61 63.04
Tamil Nadu 26.08 18.49 55.43 7.24 19.96 72.80
Tripura 8.22 11.51 80.10 2.30 13.82 83.88
17.15 29.41 53.44 7.23 54.57 38.20
49.04 10.25 40.71 9.25 38.51 52.24
West Bengal 11.94 7.82 80.24 2.22 13.09 84.70
A & N Islands 50.85 15.25 33.90 5.08 27.12 67.80
Chandigarh 85.71 2.86 14.29 85.71 14.29 5.71
D & N. Haveli 20.00 20.00 60.00 5.71 5.71 88.57
Daman & Diu 53.85 15.38 23.08 7.69 7.69 76.92
NCT of Delhi 74.68 7.59 17.72 13.92 74.68 12.66
Lakshadweep 66.67 1.00 3.33 0.20 16.67 66.67
Puducherry 40.00 25.26 34.74 7.37 29.47 63.16
INDIA 25.35 19.65 55.00 5.75 31.01 63.25Source:
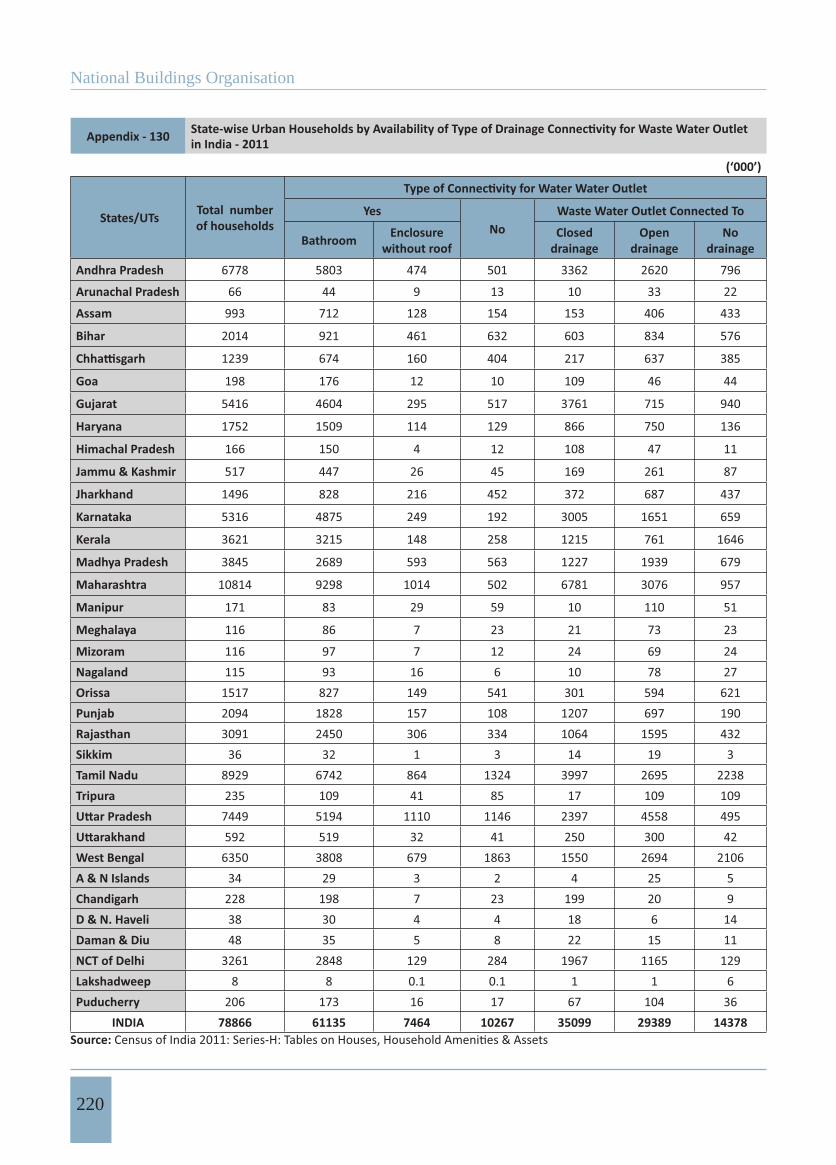
National Buildings Organisation
220
Appendix - 130 in India - 2011
(‘000’)
States/UTs Total number of households
YesNo
Waste Water Outlet Connected To
Bathroom Enclosure without roof
Closeddrainage
Opendrainage
Nodrainage
Andhra Pradesh 6778 5803 474 501 3362 2620 796
Arunachal Pradesh 66 44 9 13 10 33 22
Assam 993 712 128 154 153 406 433
Bihar 2014 921 461 632 603 834 576
1239 674 160 404 217 637 385
Goa 198 176 12 10 109 46 44
Gujarat 5416 4604 295 517 3761 715 940
Haryana 1752 1509 114 129 866 750 136
Himachal Pradesh 166 150 4 12 108 47 11
Jammu & Kashmir 517 447 26 45 169 261 87
Jharkhand 1496 828 216 452 372 687 437
Karnataka 5316 4875 249 192 3005 1651 659
Kerala 3621 3215 148 258 1215 761 1646
Madhya Pradesh 3845 2689 593 563 1227 1939 679
Maharashtra 10814 9298 1014 502 6781 3076 957
Manipur 171 83 29 59 10 110 51
Meghalaya 116 86 7 23 21 73 23
Mizoram 116 97 7 12 24 69 24Nagaland 115 93 16 6 10 78 27Orissa 1517 827 149 541 301 594 621Punjab 2094 1828 157 108 1207 697 190Rajasthan 3091 2450 306 334 1064 1595 432Sikkim 36 32 1 3 14 19 3Tamil Nadu 8929 6742 864 1324 3997 2695 2238Tripura 235 109 41 85 17 109 109
7449 5194 1110 1146 2397 4558 495592 519 32 41 250 300 42
West Bengal 6350 3808 679 1863 1550 2694 2106A & N Islands 34 29 3 2 4 25 5Chandigarh 228 198 7 23 199 20 9D & N. Haveli 38 30 4 4 18 6 14Daman & Diu 48 35 5 8 22 15 11NCT of Delhi 3261 2848 129 284 1967 1165 129Lakshadweep 8 8 0.1 0.1 1 1 6Puducherry 206 173 16 17 67 104 36
INDIA 78866 61135 7464 10267 35099 29389 14378Source:
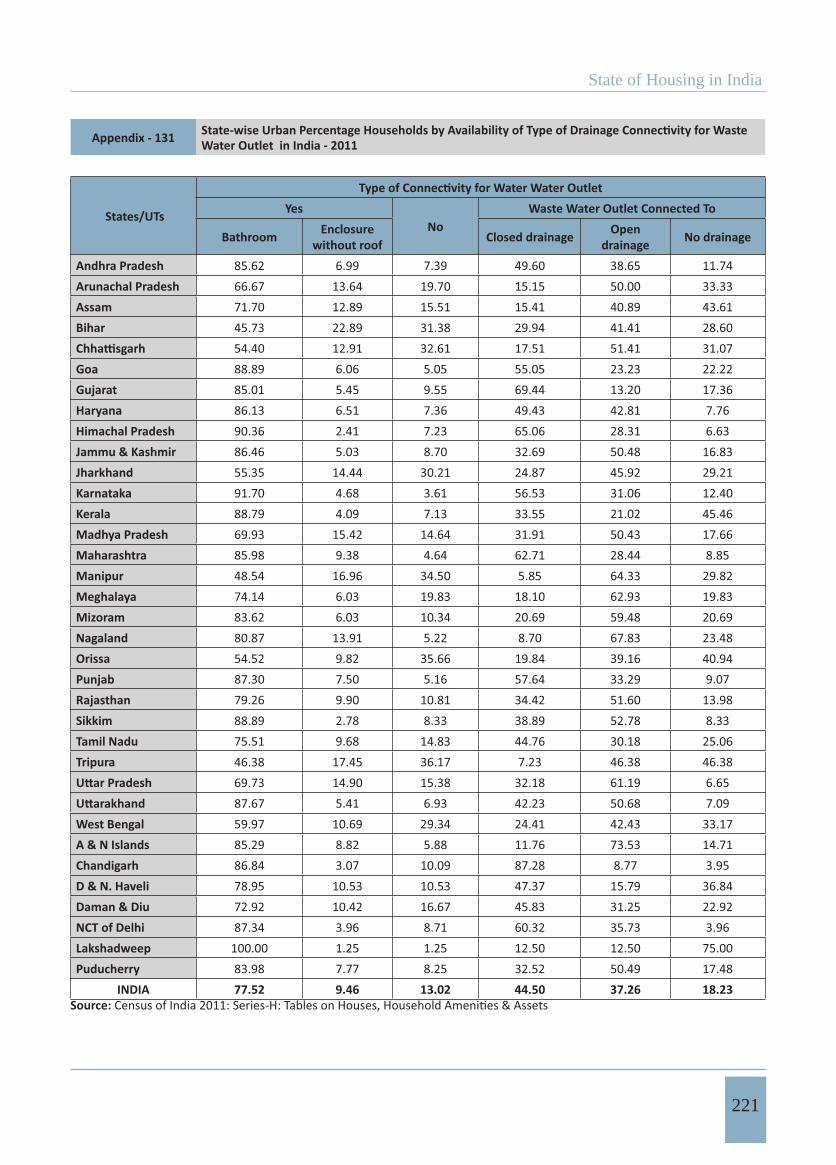
State of Housing in India
221
Appendix - 131 Water Outlet in India - 2011
States/UTs YesNo
Waste Water Outlet Connected To
Bathroom Enclosure without roof Closed drainage Open
drainage No drainage
Andhra Pradesh 85.62 6.99 7.39 49.60 38.65 11.74Arunachal Pradesh 66.67 13.64 19.70 15.15 50.00 33.33Assam 71.70 12.89 15.51 15.41 40.89 43.61Bihar 45.73 22.89 31.38 29.94 41.41 28.60
54.40 12.91 32.61 17.51 51.41 31.07Goa 88.89 6.06 5.05 55.05 23.23 22.22Gujarat 85.01 5.45 9.55 69.44 13.20 17.36Haryana 86.13 6.51 7.36 49.43 42.81 7.76Himachal Pradesh 90.36 2.41 7.23 65.06 28.31 6.63Jammu & Kashmir 86.46 5.03 8.70 32.69 50.48 16.83Jharkhand 55.35 14.44 30.21 24.87 45.92 29.21Karnataka 91.70 4.68 3.61 56.53 31.06 12.40Kerala 88.79 4.09 7.13 33.55 21.02 45.46Madhya Pradesh 69.93 15.42 14.64 31.91 50.43 17.66Maharashtra 85.98 9.38 4.64 62.71 28.44 8.85Manipur 48.54 16.96 34.50 5.85 64.33 29.82Meghalaya 74.14 6.03 19.83 18.10 62.93 19.83Mizoram 83.62 6.03 10.34 20.69 59.48 20.69Nagaland 80.87 13.91 5.22 8.70 67.83 23.48Orissa 54.52 9.82 35.66 19.84 39.16 40.94Punjab 87.30 7.50 5.16 57.64 33.29 9.07Rajasthan 79.26 9.90 10.81 34.42 51.60 13.98Sikkim 88.89 2.78 8.33 38.89 52.78 8.33Tamil Nadu 75.51 9.68 14.83 44.76 30.18 25.06Tripura 46.38 17.45 36.17 7.23 46.38 46.38
69.73 14.90 15.38 32.18 61.19 6.6587.67 5.41 6.93 42.23 50.68 7.09
West Bengal 59.97 10.69 29.34 24.41 42.43 33.17A & N Islands 85.29 8.82 5.88 11.76 73.53 14.71Chandigarh 86.84 3.07 10.09 87.28 8.77 3.95D & N. Haveli 78.95 10.53 10.53 47.37 15.79 36.84Daman & Diu 72.92 10.42 16.67 45.83 31.25 22.92NCT of Delhi 87.34 3.96 8.71 60.32 35.73 3.96Lakshadweep 100.00 1.25 1.25 12.50 12.50 75.00Puducherry 83.98 7.77 8.25 32.52 50.49 17.48
INDIA 77.52 9.46 13.02 44.50 37.26 18.23Source:
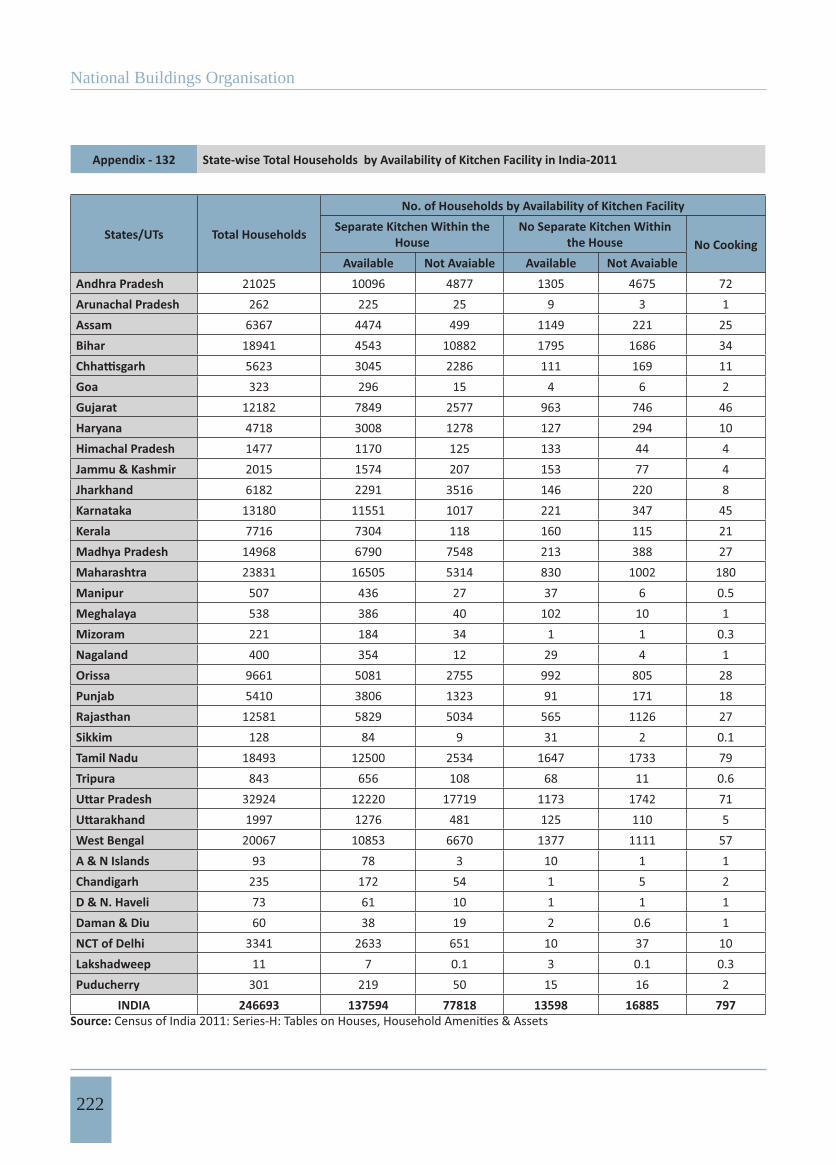
National Buildings Organisation
222
Appendix - 132 State-wise Total Households by Availability of Kitchen Facility in India-2011
States/UTs Total Households
No. of Households by Availability of Kitchen FacilitySeparate Kitchen Within the
HouseNo Separate Kitchen Within
the House No CookingAvailable Not Avaiable Available Not Avaiable
Andhra Pradesh 21025 10096 4877 1305 4675 72Arunachal Pradesh 262 225 25 9 3 1Assam 6367 4474 499 1149 221 25Bihar 18941 4543 10882 1795 1686 34
5623 3045 2286 111 169 11Goa 323 296 15 4 6 2Gujarat 12182 7849 2577 963 746 46Haryana 4718 3008 1278 127 294 10Himachal Pradesh 1477 1170 125 133 44 4Jammu & Kashmir 2015 1574 207 153 77 4Jharkhand 6182 2291 3516 146 220 8Karnataka 13180 11551 1017 221 347 45Kerala 7716 7304 118 160 115 21Madhya Pradesh 14968 6790 7548 213 388 27Maharashtra 23831 16505 5314 830 1002 180Manipur 507 436 27 37 6 0.5Meghalaya 538 386 40 102 10 1Mizoram 221 184 34 1 1 0.3Nagaland 400 354 12 29 4 1Orissa 9661 5081 2755 992 805 28Punjab 5410 3806 1323 91 171 18Rajasthan 12581 5829 5034 565 1126 27Sikkim 128 84 9 31 2 0.1Tamil Nadu 18493 12500 2534 1647 1733 79Tripura 843 656 108 68 11 0.6
32924 12220 17719 1173 1742 711997 1276 481 125 110 5
West Bengal 20067 10853 6670 1377 1111 57A & N Islands 93 78 3 10 1 1Chandigarh 235 172 54 1 5 2D & N. Haveli 73 61 10 1 1 1Daman & Diu 60 38 19 2 0.6 1NCT of Delhi 3341 2633 651 10 37 10Lakshadweep 11 7 0.1 3 0.1 0.3Puducherry 301 219 50 15 16 2
INDIA 246693 137594 77818 13598 16885 797Source:
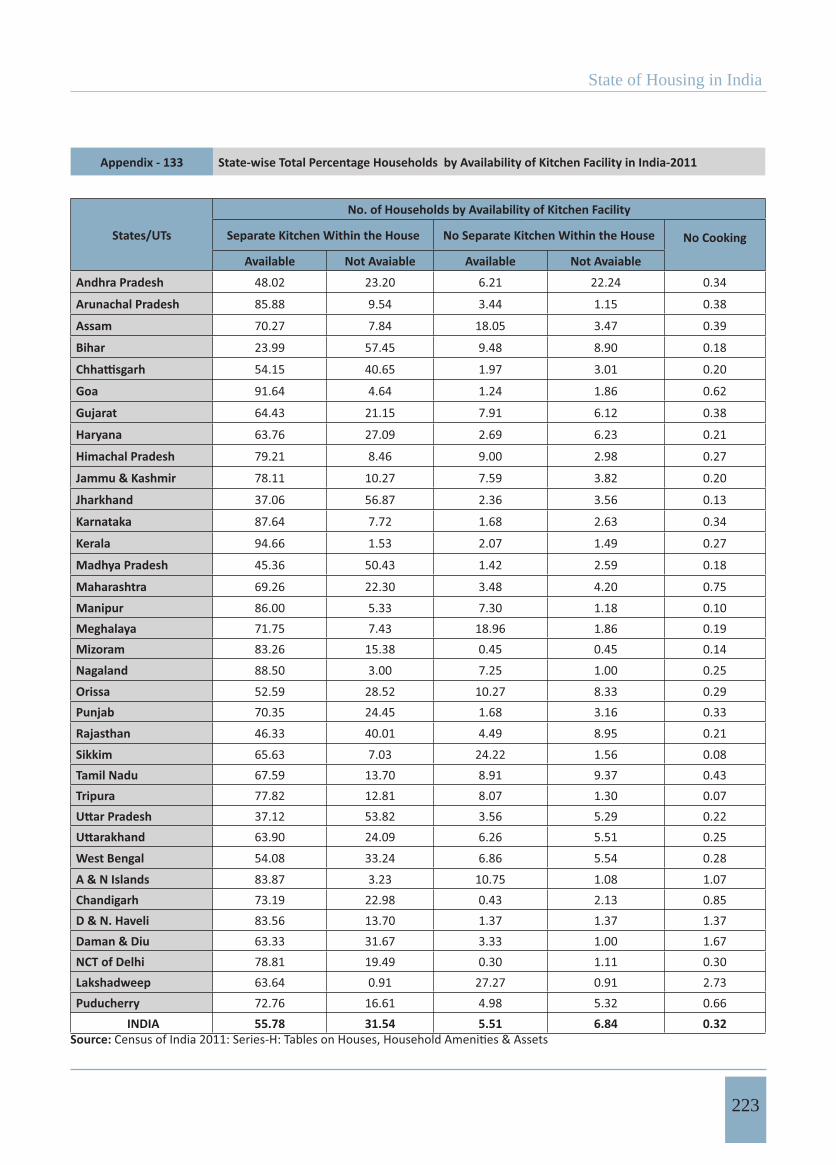
State of Housing in India
223
Appendix - 133 State-wise Total Percentage Households by Availability of Kitchen Facility in India-2011
States/UTs
No. of Households by Availability of Kitchen Facility
Separate Kitchen Within the House No Separate Kitchen Within the House No Cooking
Available Not Avaiable Available Not Avaiable
Andhra Pradesh 48.02 23.20 6.21 22.24 0.34
Arunachal Pradesh 85.88 9.54 3.44 1.15 0.38
Assam 70.27 7.84 18.05 3.47 0.39
Bihar 23.99 57.45 9.48 8.90 0.18
54.15 40.65 1.97 3.01 0.20
Goa 91.64 4.64 1.24 1.86 0.62
Gujarat 64.43 21.15 7.91 6.12 0.38
Haryana 63.76 27.09 2.69 6.23 0.21
Himachal Pradesh 79.21 8.46 9.00 2.98 0.27
Jammu & Kashmir 78.11 10.27 7.59 3.82 0.20
Jharkhand 37.06 56.87 2.36 3.56 0.13
Karnataka 87.64 7.72 1.68 2.63 0.34
Kerala 94.66 1.53 2.07 1.49 0.27
Madhya Pradesh 45.36 50.43 1.42 2.59 0.18
Maharashtra 69.26 22.30 3.48 4.20 0.75
Manipur 86.00 5.33 7.30 1.18 0.10Meghalaya 71.75 7.43 18.96 1.86 0.19Mizoram 83.26 15.38 0.45 0.45 0.14
Nagaland 88.50 3.00 7.25 1.00 0.25
Orissa 52.59 28.52 10.27 8.33 0.29Punjab 70.35 24.45 1.68 3.16 0.33
Rajasthan 46.33 40.01 4.49 8.95 0.21
Sikkim 65.63 7.03 24.22 1.56 0.08Tamil Nadu 67.59 13.70 8.91 9.37 0.43Tripura 77.82 12.81 8.07 1.30 0.07
37.12 53.82 3.56 5.29 0.2263.90 24.09 6.26 5.51 0.25
West Bengal 54.08 33.24 6.86 5.54 0.28
A & N Islands 83.87 3.23 10.75 1.08 1.07Chandigarh 73.19 22.98 0.43 2.13 0.85D & N. Haveli 83.56 13.70 1.37 1.37 1.37Daman & Diu 63.33 31.67 3.33 1.00 1.67NCT of Delhi 78.81 19.49 0.30 1.11 0.30Lakshadweep 63.64 0.91 27.27 0.91 2.73Puducherry 72.76 16.61 4.98 5.32 0.66
INDIA 55.78 31.54 5.51 6.84 0.32Source:
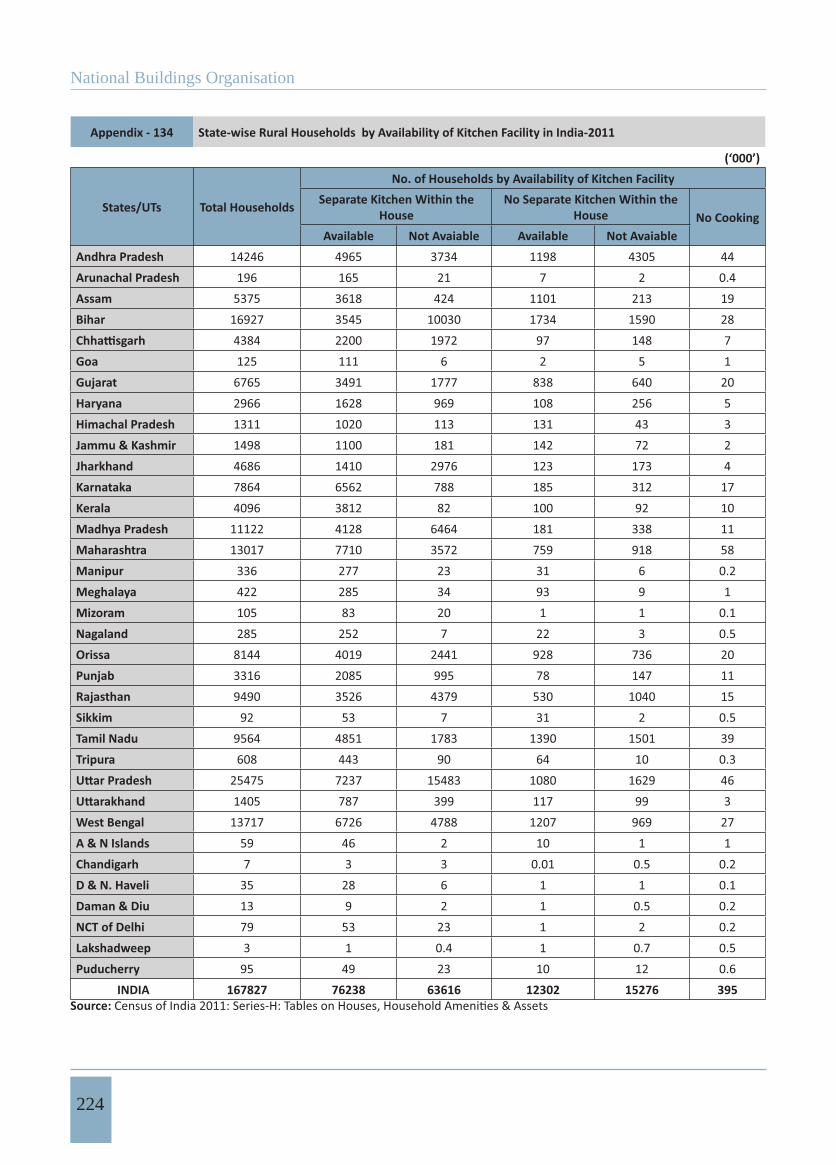
National Buildings Organisation
224
Appendix - 134 State-wise Rural Households by Availability of Kitchen Facility in India-2011
(‘000’)
States/UTs Total Households
No. of Households by Availability of Kitchen Facility Separate Kitchen Within the
HouseNo Separate Kitchen Within the
House No Cooking Available Not Avaiable Available Not Avaiable
Andhra Pradesh 14246 4965 3734 1198 4305 44Arunachal Pradesh 196 165 21 7 2 0.4Assam 5375 3618 424 1101 213 19Bihar 16927 3545 10030 1734 1590 28
4384 2200 1972 97 148 7Goa 125 111 6 2 5 1Gujarat 6765 3491 1777 838 640 20Haryana 2966 1628 969 108 256 5Himachal Pradesh 1311 1020 113 131 43 3Jammu & Kashmir 1498 1100 181 142 72 2Jharkhand 4686 1410 2976 123 173 4Karnataka 7864 6562 788 185 312 17Kerala 4096 3812 82 100 92 10Madhya Pradesh 11122 4128 6464 181 338 11Maharashtra 13017 7710 3572 759 918 58Manipur 336 277 23 31 6 0.2Meghalaya 422 285 34 93 9 1Mizoram 105 83 20 1 1 0.1Nagaland 285 252 7 22 3 0.5Orissa 8144 4019 2441 928 736 20Punjab 3316 2085 995 78 147 11Rajasthan 9490 3526 4379 530 1040 15Sikkim 92 53 7 31 2 0.5Tamil Nadu 9564 4851 1783 1390 1501 39Tripura 608 443 90 64 10 0.3
25475 7237 15483 1080 1629 461405 787 399 117 99 3
West Bengal 13717 6726 4788 1207 969 27A & N Islands 59 46 2 10 1 1Chandigarh 7 3 3 0.01 0.5 0.2D & N. Haveli 35 28 6 1 1 0.1Daman & Diu 13 9 2 1 0.5 0.2NCT of Delhi 79 53 23 1 2 0.2Lakshadweep 3 1 0.4 1 0.7 0.5Puducherry 95 49 23 10 12 0.6
INDIA 167827 76238 63616 12302 15276 395Source:
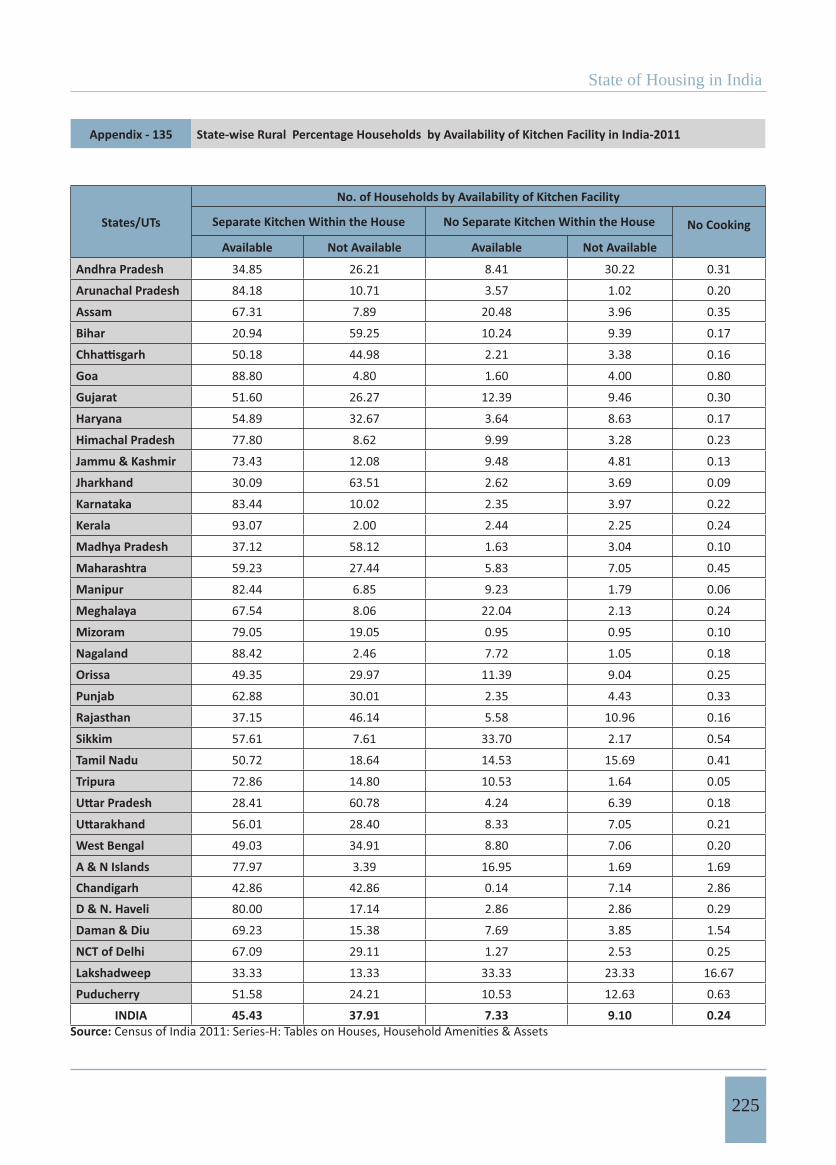
State of Housing in India
225
Appendix - 135 State-wise Rural Percentage Households by Availability of Kitchen Facility in India-2011
States/UTs
No. of Households by Availability of Kitchen Facility
Separate Kitchen Within the House No Separate Kitchen Within the House No Cooking
Available Not Available Available Not Available
Andhra Pradesh 34.85 26.21 8.41 30.22 0.31
Arunachal Pradesh 84.18 10.71 3.57 1.02 0.20
Assam 67.31 7.89 20.48 3.96 0.35
Bihar 20.94 59.25 10.24 9.39 0.17
50.18 44.98 2.21 3.38 0.16
Goa 88.80 4.80 1.60 4.00 0.80
Gujarat 51.60 26.27 12.39 9.46 0.30
Haryana 54.89 32.67 3.64 8.63 0.17
Himachal Pradesh 77.80 8.62 9.99 3.28 0.23
Jammu & Kashmir 73.43 12.08 9.48 4.81 0.13
Jharkhand 30.09 63.51 2.62 3.69 0.09
Karnataka 83.44 10.02 2.35 3.97 0.22
Kerala 93.07 2.00 2.44 2.25 0.24
Madhya Pradesh 37.12 58.12 1.63 3.04 0.10
Maharashtra 59.23 27.44 5.83 7.05 0.45
Manipur 82.44 6.85 9.23 1.79 0.06
Meghalaya 67.54 8.06 22.04 2.13 0.24
Mizoram 79.05 19.05 0.95 0.95 0.10
Nagaland 88.42 2.46 7.72 1.05 0.18
Orissa 49.35 29.97 11.39 9.04 0.25
Punjab 62.88 30.01 2.35 4.43 0.33
Rajasthan 37.15 46.14 5.58 10.96 0.16
Sikkim 57.61 7.61 33.70 2.17 0.54
Tamil Nadu 50.72 18.64 14.53 15.69 0.41
Tripura 72.86 14.80 10.53 1.64 0.05
28.41 60.78 4.24 6.39 0.18
56.01 28.40 8.33 7.05 0.21
West Bengal 49.03 34.91 8.80 7.06 0.20
A & N Islands 77.97 3.39 16.95 1.69 1.69Chandigarh 42.86 42.86 0.14 7.14 2.86D & N. Haveli 80.00 17.14 2.86 2.86 0.29
Daman & Diu 69.23 15.38 7.69 3.85 1.54
NCT of Delhi 67.09 29.11 1.27 2.53 0.25
Lakshadweep 33.33 13.33 33.33 23.33 16.67
Puducherry 51.58 24.21 10.53 12.63 0.63
INDIA 45.43 37.91 7.33 9.10 0.24Source:
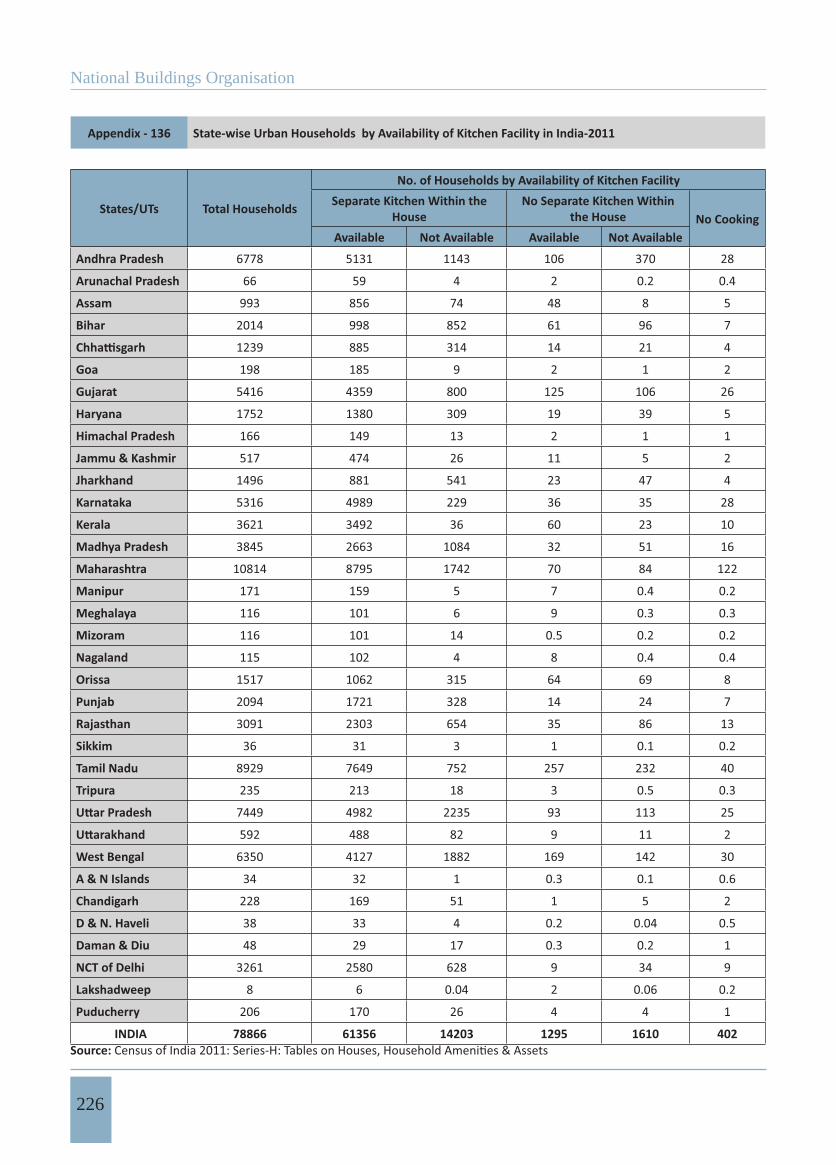
National Buildings Organisation
226
Appendix - 136 State-wise Urban Households by Availability of Kitchen Facility in India-2011
States/UTs Total Households
No. of Households by Availability of Kitchen Facility Separate Kitchen Within the
HouseNo Separate Kitchen Within
the House No Cooking Available Not Available Available Not Available
Andhra Pradesh 6778 5131 1143 106 370 28
Arunachal Pradesh 66 59 4 2 0.2 0.4
Assam 993 856 74 48 8 5
Bihar 2014 998 852 61 96 7
1239 885 314 14 21 4
Goa 198 185 9 2 1 2
Gujarat 5416 4359 800 125 106 26
Haryana 1752 1380 309 19 39 5
Himachal Pradesh 166 149 13 2 1 1
Jammu & Kashmir 517 474 26 11 5 2
Jharkhand 1496 881 541 23 47 4
Karnataka 5316 4989 229 36 35 28
Kerala 3621 3492 36 60 23 10
Madhya Pradesh 3845 2663 1084 32 51 16
Maharashtra 10814 8795 1742 70 84 122
Manipur 171 159 5 7 0.4 0.2
Meghalaya 116 101 6 9 0.3 0.3
Mizoram 116 101 14 0.5 0.2 0.2
Nagaland 115 102 4 8 0.4 0.4
Orissa 1517 1062 315 64 69 8
Punjab 2094 1721 328 14 24 7
Rajasthan 3091 2303 654 35 86 13
Sikkim 36 31 3 1 0.1 0.2
Tamil Nadu 8929 7649 752 257 232 40
Tripura 235 213 18 3 0.5 0.3
7449 4982 2235 93 113 25
592 488 82 9 11 2
West Bengal 6350 4127 1882 169 142 30
A & N Islands 34 32 1 0.3 0.1 0.6
Chandigarh 228 169 51 1 5 2
D & N. Haveli 38 33 4 0.2 0.04 0.5
Daman & Diu 48 29 17 0.3 0.2 1
NCT of Delhi 3261 2580 628 9 34 9
Lakshadweep 8 6 0.04 2 0.06 0.2
Puducherry 206 170 26 4 4 1
INDIA 78866 61356 14203 1295 1610 402Source:
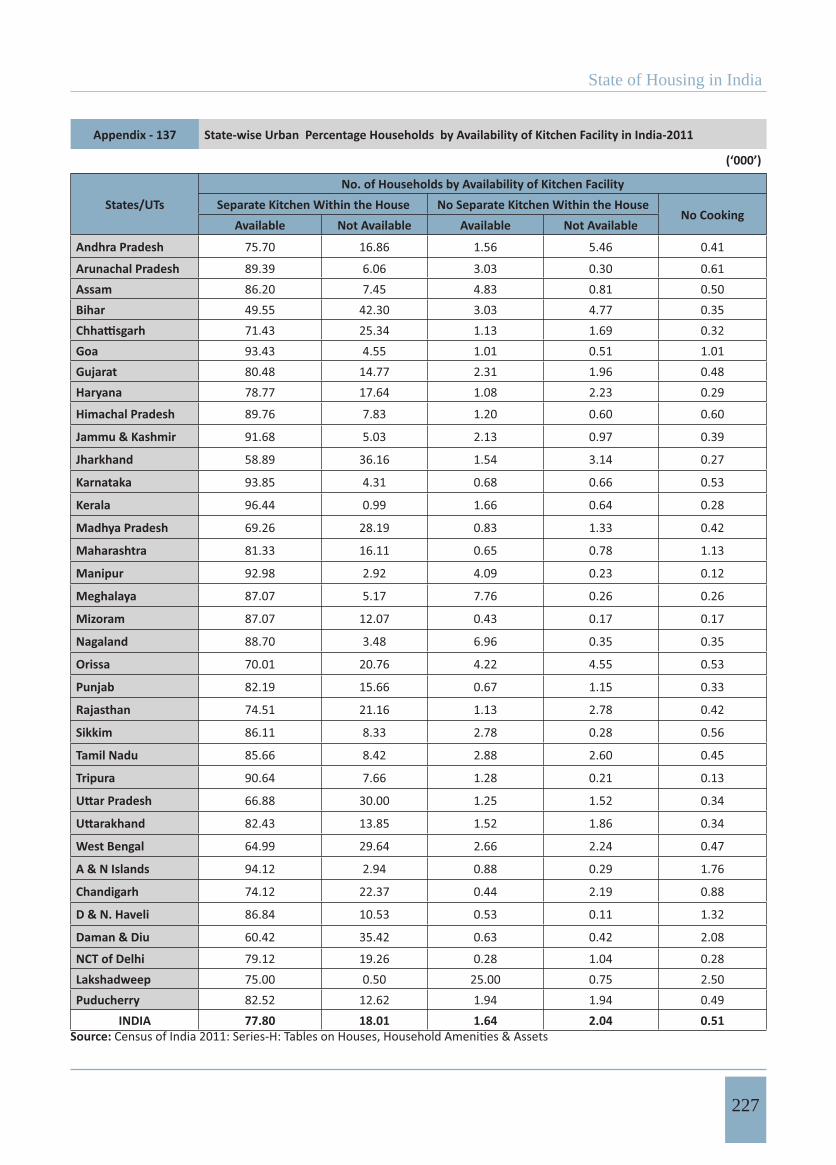
State of Housing in India
227
Appendix - 137 State-wise Urban Percentage Households by Availability of Kitchen Facility in India-2011
(‘000’)
States/UTsNo. of Households by Availability of Kitchen Facility
Separate Kitchen Within the House No Separate Kitchen Within the HouseNo Cooking
Available Not Available Available Not Available
Andhra Pradesh 75.70 16.86 1.56 5.46 0.41
Arunachal Pradesh 89.39 6.06 3.03 0.30 0.61Assam 86.20 7.45 4.83 0.81 0.50Bihar 49.55 42.30 3.03 4.77 0.35
71.43 25.34 1.13 1.69 0.32Goa 93.43 4.55 1.01 0.51 1.01Gujarat 80.48 14.77 2.31 1.96 0.48Haryana 78.77 17.64 1.08 2.23 0.29
Himachal Pradesh 89.76 7.83 1.20 0.60 0.60
Jammu & Kashmir 91.68 5.03 2.13 0.97 0.39
Jharkhand 58.89 36.16 1.54 3.14 0.27
Karnataka 93.85 4.31 0.68 0.66 0.53
Kerala 96.44 0.99 1.66 0.64 0.28
Madhya Pradesh 69.26 28.19 0.83 1.33 0.42
Maharashtra 81.33 16.11 0.65 0.78 1.13
Manipur 92.98 2.92 4.09 0.23 0.12
Meghalaya 87.07 5.17 7.76 0.26 0.26
Mizoram 87.07 12.07 0.43 0.17 0.17
Nagaland 88.70 3.48 6.96 0.35 0.35
Orissa 70.01 20.76 4.22 4.55 0.53
Punjab 82.19 15.66 0.67 1.15 0.33
Rajasthan 74.51 21.16 1.13 2.78 0.42
Sikkim 86.11 8.33 2.78 0.28 0.56
Tamil Nadu 85.66 8.42 2.88 2.60 0.45
Tripura 90.64 7.66 1.28 0.21 0.13
66.88 30.00 1.25 1.52 0.34
82.43 13.85 1.52 1.86 0.34
West Bengal 64.99 29.64 2.66 2.24 0.47
A & N Islands 94.12 2.94 0.88 0.29 1.76
Chandigarh 74.12 22.37 0.44 2.19 0.88
D & N. Haveli 86.84 10.53 0.53 0.11 1.32
Daman & Diu 60.42 35.42 0.63 0.42 2.08
NCT of Delhi 79.12 19.26 0.28 1.04 0.28Lakshadweep 75.00 0.50 25.00 0.75 2.50Puducherry 82.52 12.62 1.94 1.94 0.49
INDIA 77.80 18.01 1.64 2.04 0.51Source:
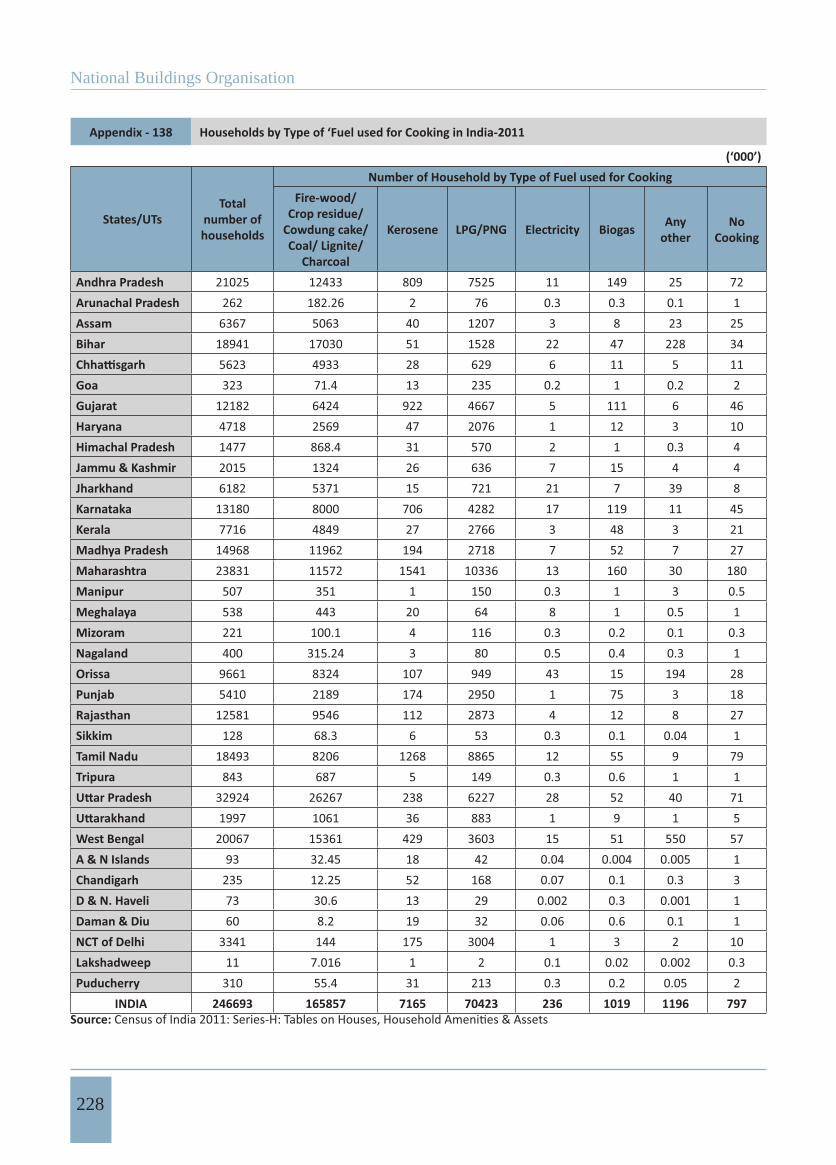
National Buildings Organisation
228
Appendix - 138 Households by Type of ‘Fuel used for Cooking in India-2011
(‘000’)
States/UTsTotal
number of households
Number of Household by Type of Fuel used for CookingFire-wood/
Crop residue/ Cowdung cake/ Coal/ Lignite/
Charcoal
Kerosene LPG/PNG Electricity Biogas Any other
NoCooking
Andhra Pradesh 21025 12433 809 7525 11 149 25 72Arunachal Pradesh 262 182.26 2 76 0.3 0.3 0.1 1Assam 6367 5063 40 1207 3 8 23 25Bihar 18941 17030 51 1528 22 47 228 34
5623 4933 28 629 6 11 5 11Goa 323 71.4 13 235 0.2 1 0.2 2Gujarat 12182 6424 922 4667 5 111 6 46Haryana 4718 2569 47 2076 1 12 3 10Himachal Pradesh 1477 868.4 31 570 2 1 0.3 4Jammu & Kashmir 2015 1324 26 636 7 15 4 4Jharkhand 6182 5371 15 721 21 7 39 8Karnataka 13180 8000 706 4282 17 119 11 45Kerala 7716 4849 27 2766 3 48 3 21Madhya Pradesh 14968 11962 194 2718 7 52 7 27Maharashtra 23831 11572 1541 10336 13 160 30 180Manipur 507 351 1 150 0.3 1 3 0.5Meghalaya 538 443 20 64 8 1 0.5 1Mizoram 221 100.1 4 116 0.3 0.2 0.1 0.3Nagaland 400 315.24 3 80 0.5 0.4 0.3 1Orissa 9661 8324 107 949 43 15 194 28Punjab 5410 2189 174 2950 1 75 3 18Rajasthan 12581 9546 112 2873 4 12 8 27Sikkim 128 68.3 6 53 0.3 0.1 0.04 1Tamil Nadu 18493 8206 1268 8865 12 55 9 79Tripura 843 687 5 149 0.3 0.6 1 1
32924 26267 238 6227 28 52 40 711997 1061 36 883 1 9 1 5
West Bengal 20067 15361 429 3603 15 51 550 57A & N Islands 93 32.45 18 42 0.04 0.004 0.005 1Chandigarh 235 12.25 52 168 0.07 0.1 0.3 3D & N. Haveli 73 30.6 13 29 0.002 0.3 0.001 1Daman & Diu 60 8.2 19 32 0.06 0.6 0.1 1NCT of Delhi 3341 144 175 3004 1 3 2 10Lakshadweep 11 7.016 1 2 0.1 0.02 0.002 0.3Puducherry 310 55.4 31 213 0.3 0.2 0.05 2
INDIA 246693 165857 7165 70423 236 1019 1196 797Source:
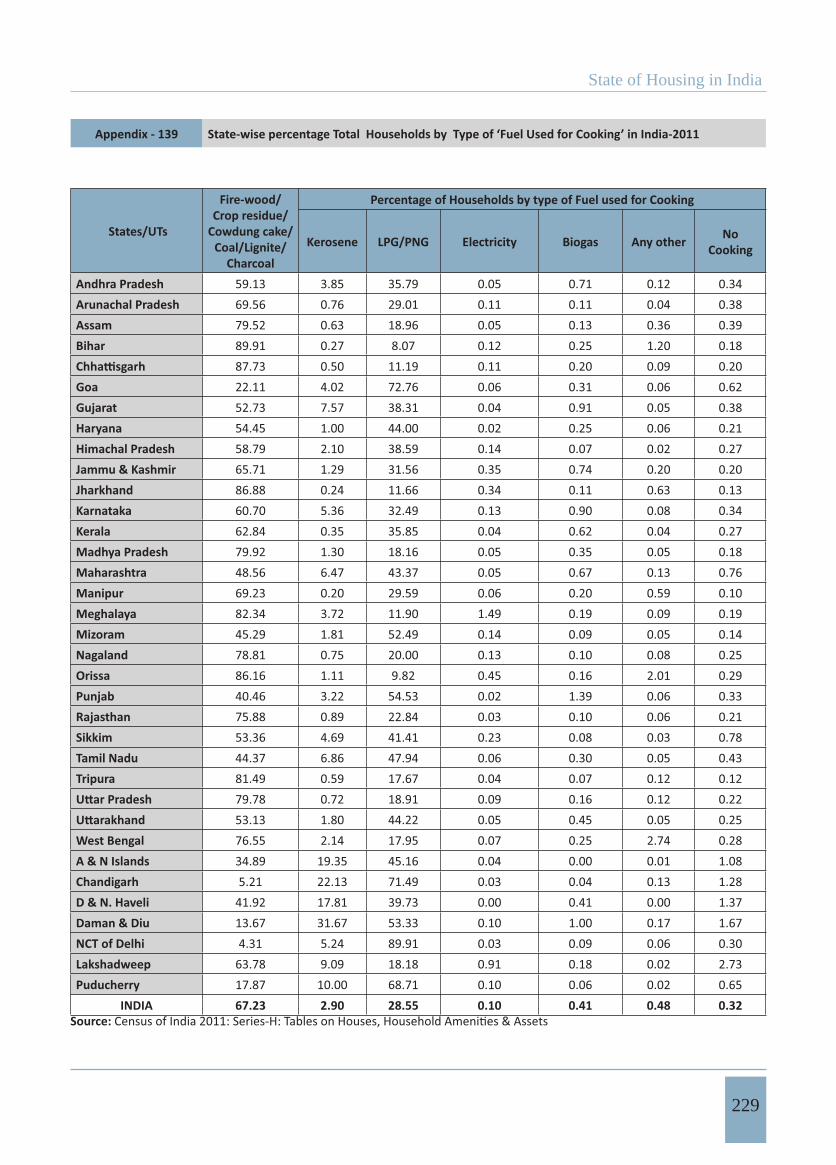
State of Housing in India
229
Appendix - 139 State-wise percentage Total Households by Type of ‘Fuel Used for Cooking’ in India-2011
States/UTs
Fire-wood/ Crop residue/
Cowdung cake/ Coal/Lignite/
Charcoal
Percentage of Households by type of Fuel used for Cooking
Kerosene LPG/PNG Electricity Biogas Any other NoCooking
Andhra Pradesh 59.13 3.85 35.79 0.05 0.71 0.12 0.34Arunachal Pradesh 69.56 0.76 29.01 0.11 0.11 0.04 0.38Assam 79.52 0.63 18.96 0.05 0.13 0.36 0.39Bihar 89.91 0.27 8.07 0.12 0.25 1.20 0.18
87.73 0.50 11.19 0.11 0.20 0.09 0.20Goa 22.11 4.02 72.76 0.06 0.31 0.06 0.62Gujarat 52.73 7.57 38.31 0.04 0.91 0.05 0.38Haryana 54.45 1.00 44.00 0.02 0.25 0.06 0.21Himachal Pradesh 58.79 2.10 38.59 0.14 0.07 0.02 0.27Jammu & Kashmir 65.71 1.29 31.56 0.35 0.74 0.20 0.20Jharkhand 86.88 0.24 11.66 0.34 0.11 0.63 0.13Karnataka 60.70 5.36 32.49 0.13 0.90 0.08 0.34Kerala 62.84 0.35 35.85 0.04 0.62 0.04 0.27Madhya Pradesh 79.92 1.30 18.16 0.05 0.35 0.05 0.18Maharashtra 48.56 6.47 43.37 0.05 0.67 0.13 0.76Manipur 69.23 0.20 29.59 0.06 0.20 0.59 0.10Meghalaya 82.34 3.72 11.90 1.49 0.19 0.09 0.19Mizoram 45.29 1.81 52.49 0.14 0.09 0.05 0.14Nagaland 78.81 0.75 20.00 0.13 0.10 0.08 0.25Orissa 86.16 1.11 9.82 0.45 0.16 2.01 0.29Punjab 40.46 3.22 54.53 0.02 1.39 0.06 0.33Rajasthan 75.88 0.89 22.84 0.03 0.10 0.06 0.21Sikkim 53.36 4.69 41.41 0.23 0.08 0.03 0.78Tamil Nadu 44.37 6.86 47.94 0.06 0.30 0.05 0.43Tripura 81.49 0.59 17.67 0.04 0.07 0.12 0.12
79.78 0.72 18.91 0.09 0.16 0.12 0.2253.13 1.80 44.22 0.05 0.45 0.05 0.25
West Bengal 76.55 2.14 17.95 0.07 0.25 2.74 0.28A & N Islands 34.89 19.35 45.16 0.04 0.00 0.01 1.08Chandigarh 5.21 22.13 71.49 0.03 0.04 0.13 1.28D & N. Haveli 41.92 17.81 39.73 0.00 0.41 0.00 1.37Daman & Diu 13.67 31.67 53.33 0.10 1.00 0.17 1.67NCT of Delhi 4.31 5.24 89.91 0.03 0.09 0.06 0.30Lakshadweep 63.78 9.09 18.18 0.91 0.18 0.02 2.73Puducherry 17.87 10.00 68.71 0.10 0.06 0.02 0.65
INDIA 67.23 2.90 28.55 0.10 0.41 0.48 0.32Source:
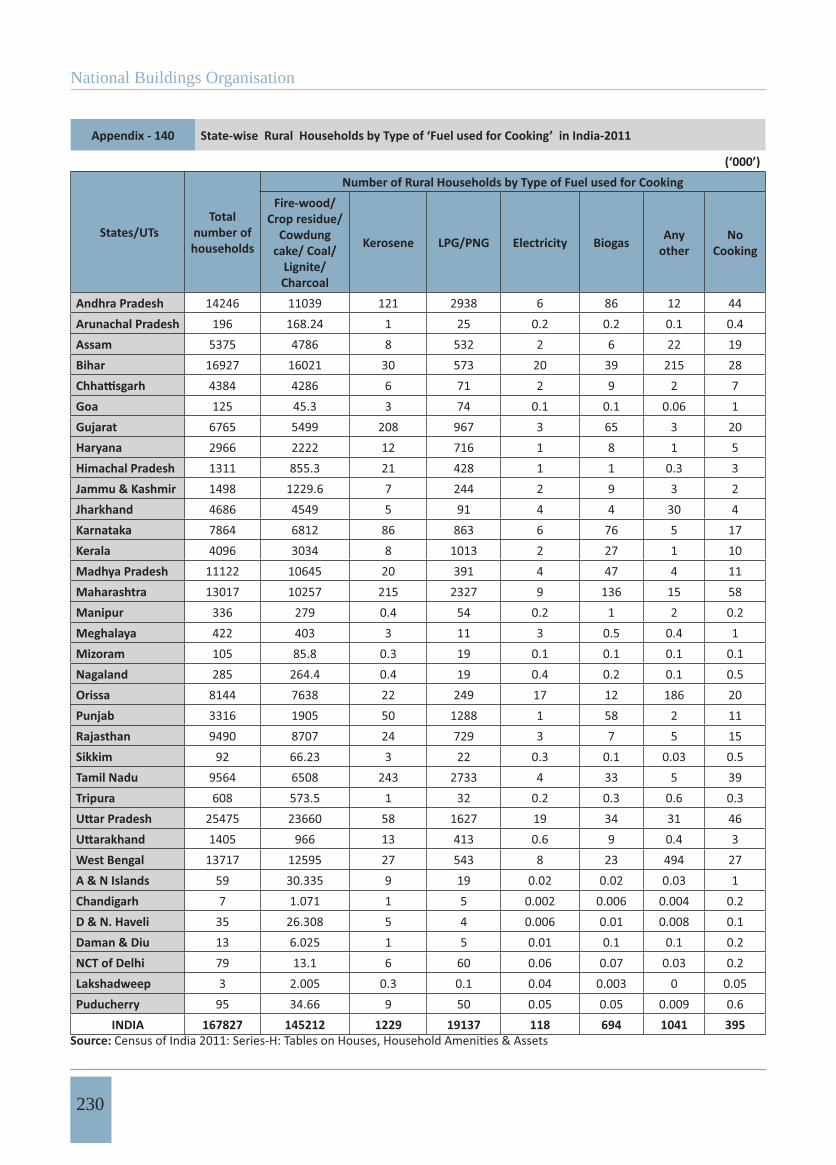
National Buildings Organisation
230
Appendix - 140 State-wise Rural Households by Type of ‘Fuel used for Cooking’ in India-2011
(‘000’)
States/UTsTotal
number of households
Number of Rural Households by Type of Fuel used for CookingFire-wood/
Crop residue/Cowdung
cake/ Coal/Lignite/Charcoal
Kerosene LPG/PNG Electricity Biogas Any other
NoCooking
Andhra Pradesh 14246 11039 121 2938 6 86 12 44Arunachal Pradesh 196 168.24 1 25 0.2 0.2 0.1 0.4Assam 5375 4786 8 532 2 6 22 19Bihar 16927 16021 30 573 20 39 215 28
4384 4286 6 71 2 9 2 7Goa 125 45.3 3 74 0.1 0.1 0.06 1Gujarat 6765 5499 208 967 3 65 3 20Haryana 2966 2222 12 716 1 8 1 5Himachal Pradesh 1311 855.3 21 428 1 1 0.3 3Jammu & Kashmir 1498 1229.6 7 244 2 9 3 2Jharkhand 4686 4549 5 91 4 4 30 4Karnataka 7864 6812 86 863 6 76 5 17Kerala 4096 3034 8 1013 2 27 1 10Madhya Pradesh 11122 10645 20 391 4 47 4 11Maharashtra 13017 10257 215 2327 9 136 15 58Manipur 336 279 0.4 54 0.2 1 2 0.2Meghalaya 422 403 3 11 3 0.5 0.4 1Mizoram 105 85.8 0.3 19 0.1 0.1 0.1 0.1Nagaland 285 264.4 0.4 19 0.4 0.2 0.1 0.5Orissa 8144 7638 22 249 17 12 186 20Punjab 3316 1905 50 1288 1 58 2 11Rajasthan 9490 8707 24 729 3 7 5 15Sikkim 92 66.23 3 22 0.3 0.1 0.03 0.5Tamil Nadu 9564 6508 243 2733 4 33 5 39Tripura 608 573.5 1 32 0.2 0.3 0.6 0.3
25475 23660 58 1627 19 34 31 461405 966 13 413 0.6 9 0.4 3
West Bengal 13717 12595 27 543 8 23 494 27A & N Islands 59 30.335 9 19 0.02 0.02 0.03 1Chandigarh 7 1.071 1 5 0.002 0.006 0.004 0.2D & N. Haveli 35 26.308 5 4 0.006 0.01 0.008 0.1Daman & Diu 13 6.025 1 5 0.01 0.1 0.1 0.2NCT of Delhi 79 13.1 6 60 0.06 0.07 0.03 0.2Lakshadweep 3 2.005 0.3 0.1 0.04 0.003 0 0.05Puducherry 95 34.66 9 50 0.05 0.05 0.009 0.6
INDIA 167827 145212 1229 19137 118 694 1041 395Source:
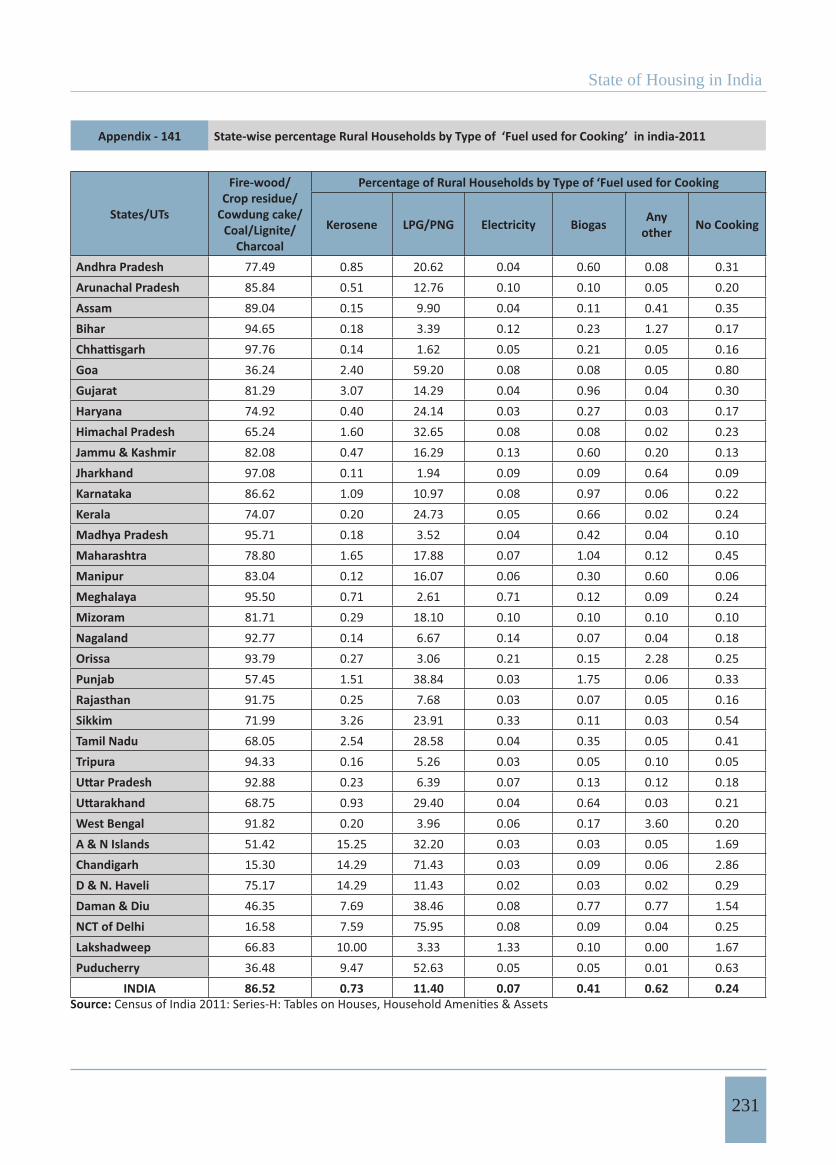
State of Housing in India
231
Appendix - 141 State-wise percentage Rural Households by Type of ‘Fuel used for Cooking’ in india-2011
States/UTs
Fire-wood/ Crop residue/
Cowdung cake/ Coal/Lignite/
Charcoal
Percentage of Rural Households by Type of ‘Fuel used for Cooking
Kerosene LPG/PNG Electricity Biogas Any other No Cooking
Andhra Pradesh 77.49 0.85 20.62 0.04 0.60 0.08 0.31Arunachal Pradesh 85.84 0.51 12.76 0.10 0.10 0.05 0.20Assam 89.04 0.15 9.90 0.04 0.11 0.41 0.35Bihar 94.65 0.18 3.39 0.12 0.23 1.27 0.17
97.76 0.14 1.62 0.05 0.21 0.05 0.16Goa 36.24 2.40 59.20 0.08 0.08 0.05 0.80Gujarat 81.29 3.07 14.29 0.04 0.96 0.04 0.30Haryana 74.92 0.40 24.14 0.03 0.27 0.03 0.17Himachal Pradesh 65.24 1.60 32.65 0.08 0.08 0.02 0.23Jammu & Kashmir 82.08 0.47 16.29 0.13 0.60 0.20 0.13Jharkhand 97.08 0.11 1.94 0.09 0.09 0.64 0.09Karnataka 86.62 1.09 10.97 0.08 0.97 0.06 0.22Kerala 74.07 0.20 24.73 0.05 0.66 0.02 0.24Madhya Pradesh 95.71 0.18 3.52 0.04 0.42 0.04 0.10Maharashtra 78.80 1.65 17.88 0.07 1.04 0.12 0.45Manipur 83.04 0.12 16.07 0.06 0.30 0.60 0.06Meghalaya 95.50 0.71 2.61 0.71 0.12 0.09 0.24Mizoram 81.71 0.29 18.10 0.10 0.10 0.10 0.10Nagaland 92.77 0.14 6.67 0.14 0.07 0.04 0.18Orissa 93.79 0.27 3.06 0.21 0.15 2.28 0.25Punjab 57.45 1.51 38.84 0.03 1.75 0.06 0.33Rajasthan 91.75 0.25 7.68 0.03 0.07 0.05 0.16Sikkim 71.99 3.26 23.91 0.33 0.11 0.03 0.54Tamil Nadu 68.05 2.54 28.58 0.04 0.35 0.05 0.41Tripura 94.33 0.16 5.26 0.03 0.05 0.10 0.05
92.88 0.23 6.39 0.07 0.13 0.12 0.1868.75 0.93 29.40 0.04 0.64 0.03 0.21
West Bengal 91.82 0.20 3.96 0.06 0.17 3.60 0.20A & N Islands 51.42 15.25 32.20 0.03 0.03 0.05 1.69Chandigarh 15.30 14.29 71.43 0.03 0.09 0.06 2.86D & N. Haveli 75.17 14.29 11.43 0.02 0.03 0.02 0.29Daman & Diu 46.35 7.69 38.46 0.08 0.77 0.77 1.54NCT of Delhi 16.58 7.59 75.95 0.08 0.09 0.04 0.25Lakshadweep 66.83 10.00 3.33 1.33 0.10 0.00 1.67Puducherry 36.48 9.47 52.63 0.05 0.05 0.01 0.63
INDIA 86.52 0.73 11.40 0.07 0.41 0.62 0.24Source:

National Buildings Organisation
232
Appendix - 142 State-wise Urban Households by Type of ‘Fuel Used for Cooking’ in India -2011
(‘000’)
States/UTsTotal
number of households
Number of Urban Households by Type of Fuel used for CookingFire-wood/
Crop residue/Cowdung
cake/ Coal/Lignite/Charcoal
Kerosene LPG/PNG Electricity Biogas Any other
NoCooking
Andhra Pradesh 6778 1393 689 4587 5 63 13 28ArunachalPradesh 66 13.37 1 51 0.1 0.2 0.05 0.4
Assam 993 277 31 675 1 2 1 5Bihar 2014 1008 21 955 3 8 13 7
1239 647 22 557 4 1 3 4Goa 198 24.8 10 161 0.1 1 0.1 2Gujarat 5416 926 714 3700 2 45 3 26Haryana 1752 346 36 1360 0.5 3 2 5Himachal Pradesh 166 12.14 10 141 1 0.2 0.1 1Jammu & Kashmir 517 93.2 18 391 5 6 0.2 2Jharkhand 1496 823 10 630 17 2 9 4Karnataka 5316 1189 620 3419 11 43 6 28Kerala 3621 1815 19 1753 2 21 2 10Madhya Pradesh 3845 1318 174 2326 3 5 3 16Maharashtra 10814 1315 1325 8009 5 24 14 122Manipur 171 72.3 0.4 97 0.1 0.5 2 0.2Meghalaya 116 39.6 17 53 5 0.4 0.1 0.3Mizoram 116 15.23 4 97 0.2 0.1 0.03 0.2Nagaland 115 51.16 2 61 0.1 0.2 0.2 0.4Orissa 1517 689 85 700 26 3 8 8Punjab 2094 285 123 1662 0.4 17 1 7Rajasthan 3091 838 89 2144 1 5 2 13Sikkim 36 2.82 3 30 0.03 0.03 0.009 0.2Tamil Nadu 8929 1699 1024 6132 8 23 5 40Tripura 235 112.6 4 117 0.1 0.3 0.1 0.3
7449 2607 181 500 9 18 9 25592 95.4 23 470 0.2 0.6 0.3 2
West Bengal 6350 2768 402 3060 7 28 56 30A & N Islands 34 1.071 9 23 0.02 0.01 0.02 0.6Chandigarh 228 11.5 50 164 0.06 0.1 0.3 2D & N. Haveli 38 4.24 8 25 0.01 0.2 0.003 0.5Daman & Diu 48 2.3 17 27 0.05 0.5 0.006 1NCT of Delhi 3261 132 169 2944 1 3 2 9Lakshadweep 8 5.044 1 2 0.1 0.02 0.002 0.2Puducherry 206 20.21 22 162 0.2 0.1 0.04 1
INDIA 78866 20645 5935 51286 117 325 156 402Source:
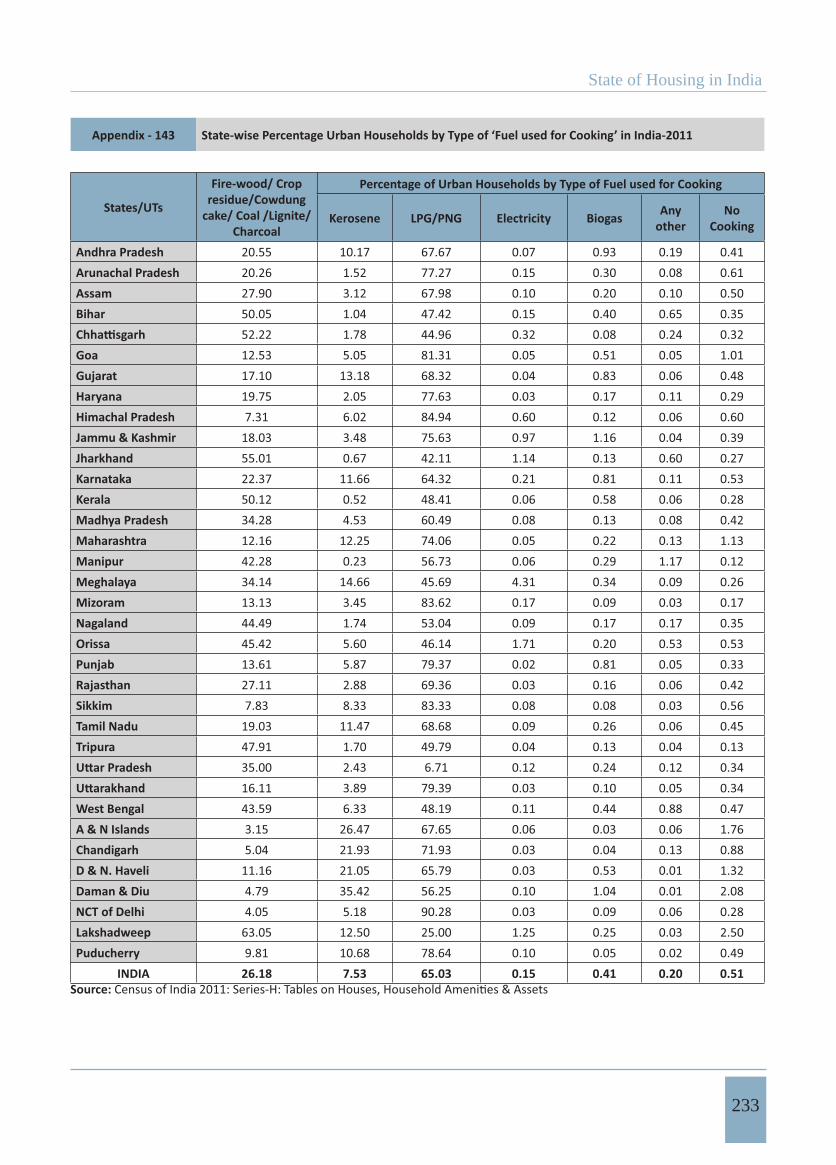
State of Housing in India
233
Appendix - 143 State-wise Percentage Urban Households by Type of ‘Fuel used for Cooking’ in India-2011
States/UTs
Fire-wood/ Crop residue/Cowdung
cake/ Coal /Lignite/Charcoal
Percentage of Urban Households by Type of Fuel used for Cooking
Kerosene LPG/PNG Electricity Biogas Any other
NoCooking
Andhra Pradesh 20.55 10.17 67.67 0.07 0.93 0.19 0.41Arunachal Pradesh 20.26 1.52 77.27 0.15 0.30 0.08 0.61Assam 27.90 3.12 67.98 0.10 0.20 0.10 0.50Bihar 50.05 1.04 47.42 0.15 0.40 0.65 0.35
52.22 1.78 44.96 0.32 0.08 0.24 0.32Goa 12.53 5.05 81.31 0.05 0.51 0.05 1.01Gujarat 17.10 13.18 68.32 0.04 0.83 0.06 0.48Haryana 19.75 2.05 77.63 0.03 0.17 0.11 0.29Himachal Pradesh 7.31 6.02 84.94 0.60 0.12 0.06 0.60Jammu & Kashmir 18.03 3.48 75.63 0.97 1.16 0.04 0.39Jharkhand 55.01 0.67 42.11 1.14 0.13 0.60 0.27Karnataka 22.37 11.66 64.32 0.21 0.81 0.11 0.53Kerala 50.12 0.52 48.41 0.06 0.58 0.06 0.28Madhya Pradesh 34.28 4.53 60.49 0.08 0.13 0.08 0.42Maharashtra 12.16 12.25 74.06 0.05 0.22 0.13 1.13Manipur 42.28 0.23 56.73 0.06 0.29 1.17 0.12Meghalaya 34.14 14.66 45.69 4.31 0.34 0.09 0.26Mizoram 13.13 3.45 83.62 0.17 0.09 0.03 0.17Nagaland 44.49 1.74 53.04 0.09 0.17 0.17 0.35Orissa 45.42 5.60 46.14 1.71 0.20 0.53 0.53Punjab 13.61 5.87 79.37 0.02 0.81 0.05 0.33Rajasthan 27.11 2.88 69.36 0.03 0.16 0.06 0.42Sikkim 7.83 8.33 83.33 0.08 0.08 0.03 0.56Tamil Nadu 19.03 11.47 68.68 0.09 0.26 0.06 0.45Tripura 47.91 1.70 49.79 0.04 0.13 0.04 0.13
35.00 2.43 6.71 0.12 0.24 0.12 0.3416.11 3.89 79.39 0.03 0.10 0.05 0.34
West Bengal 43.59 6.33 48.19 0.11 0.44 0.88 0.47A & N Islands 3.15 26.47 67.65 0.06 0.03 0.06 1.76Chandigarh 5.04 21.93 71.93 0.03 0.04 0.13 0.88D & N. Haveli 11.16 21.05 65.79 0.03 0.53 0.01 1.32Daman & Diu 4.79 35.42 56.25 0.10 1.04 0.01 2.08NCT of Delhi 4.05 5.18 90.28 0.03 0.09 0.06 0.28Lakshadweep 63.05 12.50 25.00 1.25 0.25 0.03 2.50Puducherry 9.81 10.68 78.64 0.10 0.05 0.02 0.49
INDIA 26.18 7.53 65.03 0.15 0.41 0.20 0.51Source:
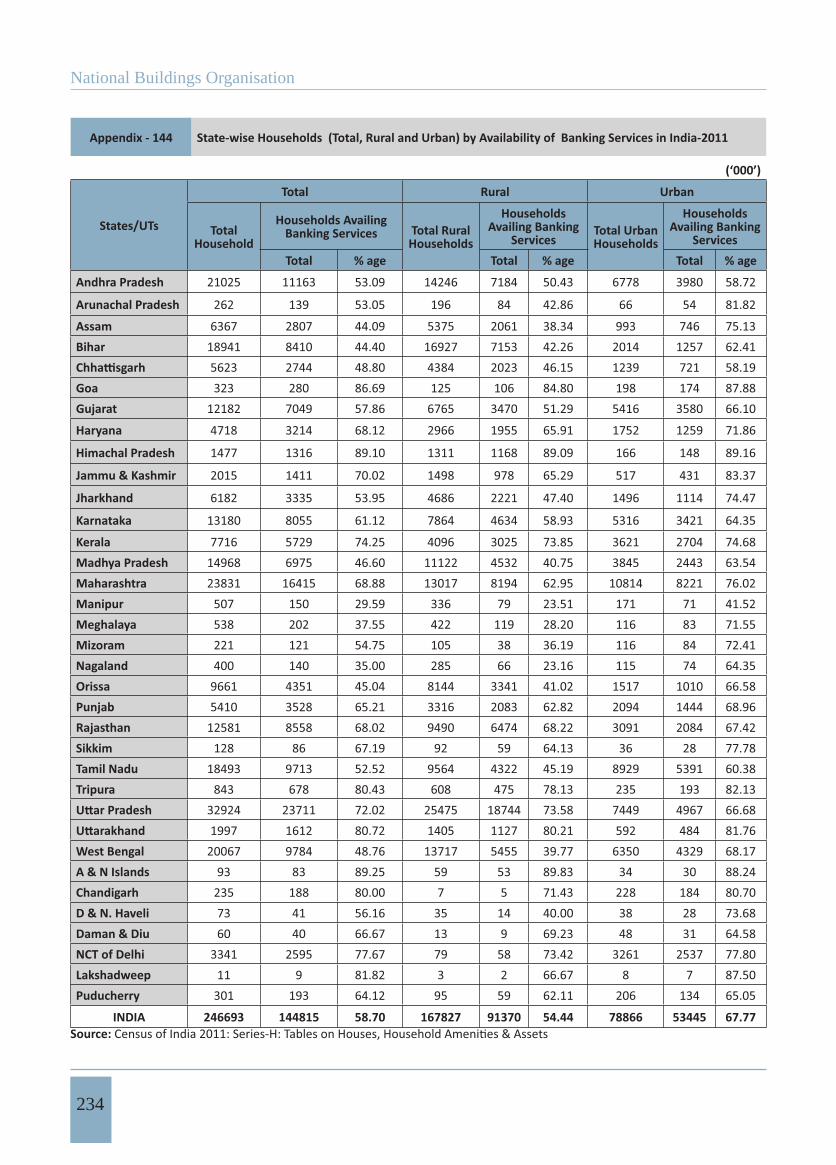
National Buildings Organisation
234
Appendix - 144 State-wise Households (Total, Rural and Urban) by Availability of Banking Services in India-2011
(‘000’)
States/UTs
Total Rural Urban
Total Household
Households Availing Banking Services Total Rural
Households
HouseholdsAvailing Banking
ServicesTotal Urban Households
HouseholdsAvailing Banking
ServicesTotal % age Total % age Total % age
Andhra Pradesh 21025 11163 53.09 14246 7184 50.43 6778 3980 58.72
Arunachal Pradesh 262 139 53.05 196 84 42.86 66 54 81.82
Assam 6367 2807 44.09 5375 2061 38.34 993 746 75.13Bihar 18941 8410 44.40 16927 7153 42.26 2014 1257 62.41
5623 2744 48.80 4384 2023 46.15 1239 721 58.19Goa 323 280 86.69 125 106 84.80 198 174 87.88Gujarat 12182 7049 57.86 6765 3470 51.29 5416 3580 66.10
Haryana 4718 3214 68.12 2966 1955 65.91 1752 1259 71.86
Himachal Pradesh 1477 1316 89.10 1311 1168 89.09 166 148 89.16
Jammu & Kashmir 2015 1411 70.02 1498 978 65.29 517 431 83.37
Jharkhand 6182 3335 53.95 4686 2221 47.40 1496 1114 74.47
Karnataka 13180 8055 61.12 7864 4634 58.93 5316 3421 64.35
Kerala 7716 5729 74.25 4096 3025 73.85 3621 2704 74.68Madhya Pradesh 14968 6975 46.60 11122 4532 40.75 3845 2443 63.54Maharashtra 23831 16415 68.88 13017 8194 62.95 10814 8221 76.02Manipur 507 150 29.59 336 79 23.51 171 71 41.52Meghalaya 538 202 37.55 422 119 28.20 116 83 71.55Mizoram 221 121 54.75 105 38 36.19 116 84 72.41Nagaland 400 140 35.00 285 66 23.16 115 74 64.35Orissa 9661 4351 45.04 8144 3341 41.02 1517 1010 66.58Punjab 5410 3528 65.21 3316 2083 62.82 2094 1444 68.96Rajasthan 12581 8558 68.02 9490 6474 68.22 3091 2084 67.42Sikkim 128 86 67.19 92 59 64.13 36 28 77.78Tamil Nadu 18493 9713 52.52 9564 4322 45.19 8929 5391 60.38Tripura 843 678 80.43 608 475 78.13 235 193 82.13
32924 23711 72.02 25475 18744 73.58 7449 4967 66.681997 1612 80.72 1405 1127 80.21 592 484 81.76
West Bengal 20067 9784 48.76 13717 5455 39.77 6350 4329 68.17A & N Islands 93 83 89.25 59 53 89.83 34 30 88.24Chandigarh 235 188 80.00 7 5 71.43 228 184 80.70D & N. Haveli 73 41 56.16 35 14 40.00 38 28 73.68Daman & Diu 60 40 66.67 13 9 69.23 48 31 64.58NCT of Delhi 3341 2595 77.67 79 58 73.42 3261 2537 77.80Lakshadweep 11 9 81.82 3 2 66.67 8 7 87.50Puducherry 301 193 64.12 95 59 62.11 206 134 65.05
INDIA 246693 144815 58.70 167827 91370 54.44 78866 53445 67.77Source:
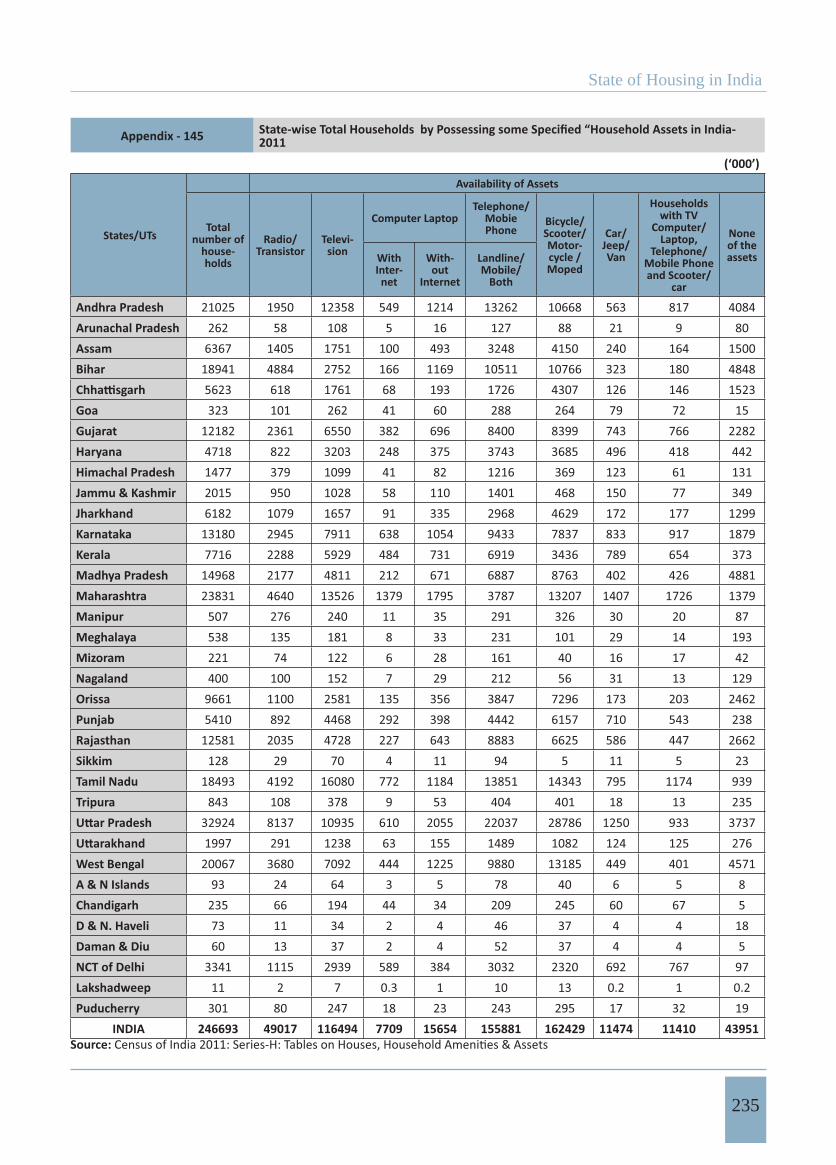
State of Housing in India
235
Appendix - 145 2011
(‘000’)
States/UTs
Availability of Assets
Total number of
house-holds
Radio/Transistor
Televi-sion
Computer LaptopTelephone/
MobiePhone
Bicycle/ Scooter/Motor-cycle /Moped
Car/Jeep/ Van
Householdswith TV
Computer/ Laptop,
Telephone/ Mobile Phone and Scooter/
car
Noneof the assetsWith
Inter-net
With-out
Internet
Landline/Mobile/
Both
Andhra Pradesh 21025 1950 12358 549 1214 13262 10668 563 817 4084Arunachal Pradesh 262 58 108 5 16 127 88 21 9 80Assam 6367 1405 1751 100 493 3248 4150 240 164 1500Bihar 18941 4884 2752 166 1169 10511 10766 323 180 4848
5623 618 1761 68 193 1726 4307 126 146 1523Goa 323 101 262 41 60 288 264 79 72 15Gujarat 12182 2361 6550 382 696 8400 8399 743 766 2282Haryana 4718 822 3203 248 375 3743 3685 496 418 442Himachal Pradesh 1477 379 1099 41 82 1216 369 123 61 131Jammu & Kashmir 2015 950 1028 58 110 1401 468 150 77 349Jharkhand 6182 1079 1657 91 335 2968 4629 172 177 1299Karnataka 13180 2945 7911 638 1054 9433 7837 833 917 1879Kerala 7716 2288 5929 484 731 6919 3436 789 654 373Madhya Pradesh 14968 2177 4811 212 671 6887 8763 402 426 4881Maharashtra 23831 4640 13526 1379 1795 3787 13207 1407 1726 1379Manipur 507 276 240 11 35 291 326 30 20 87Meghalaya 538 135 181 8 33 231 101 29 14 193Mizoram 221 74 122 6 28 161 40 16 17 42Nagaland 400 100 152 7 29 212 56 31 13 129Orissa 9661 1100 2581 135 356 3847 7296 173 203 2462Punjab 5410 892 4468 292 398 4442 6157 710 543 238Rajasthan 12581 2035 4728 227 643 8883 6625 586 447 2662Sikkim 128 29 70 4 11 94 5 11 5 23Tamil Nadu 18493 4192 16080 772 1184 13851 14343 795 1174 939Tripura 843 108 378 9 53 404 401 18 13 235
32924 8137 10935 610 2055 22037 28786 1250 933 37371997 291 1238 63 155 1489 1082 124 125 276
West Bengal 20067 3680 7092 444 1225 9880 13185 449 401 4571A & N Islands 93 24 64 3 5 78 40 6 5 8Chandigarh 235 66 194 44 34 209 245 60 67 5D & N. Haveli 73 11 34 2 4 46 37 4 4 18Daman & Diu 60 13 37 2 4 52 37 4 4 5NCT of Delhi 3341 1115 2939 589 384 3032 2320 692 767 97Lakshadweep 11 2 7 0.3 1 10 13 0.2 1 0.2Puducherry 301 80 247 18 23 243 295 17 32 19
INDIA 246693 49017 116494 7709 15654 155881 162429 11474 11410 43951Source:
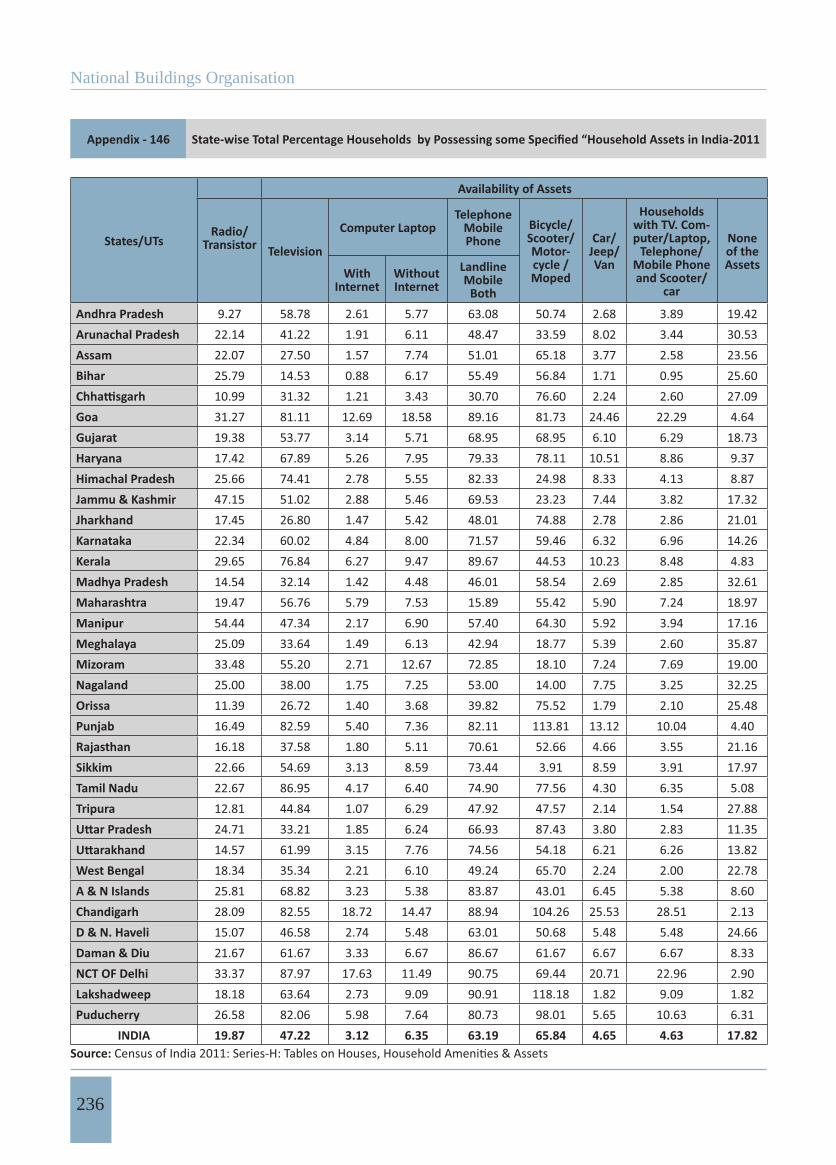
National Buildings Organisation
236
Appendix - 146
States/UTs
Availability of Assets
Radio/Transistor Television
Computer LaptopTelephone
MobilePhone
Bicycle/ Scooter/Motor-cycle /Moped
Car/Jeep/Van
Householdswith TV. Com-puter/Laptop,
Telephone/Mobile Phone and Scooter/
car
Noneof the Assets
WithInternet
WithoutInternet
LandlineMobile
BothAndhra Pradesh 9.27 58.78 2.61 5.77 63.08 50.74 2.68 3.89 19.42Arunachal Pradesh 22.14 41.22 1.91 6.11 48.47 33.59 8.02 3.44 30.53Assam 22.07 27.50 1.57 7.74 51.01 65.18 3.77 2.58 23.56Bihar 25.79 14.53 0.88 6.17 55.49 56.84 1.71 0.95 25.60
10.99 31.32 1.21 3.43 30.70 76.60 2.24 2.60 27.09Goa 31.27 81.11 12.69 18.58 89.16 81.73 24.46 22.29 4.64Gujarat 19.38 53.77 3.14 5.71 68.95 68.95 6.10 6.29 18.73Haryana 17.42 67.89 5.26 7.95 79.33 78.11 10.51 8.86 9.37Himachal Pradesh 25.66 74.41 2.78 5.55 82.33 24.98 8.33 4.13 8.87Jammu & Kashmir 47.15 51.02 2.88 5.46 69.53 23.23 7.44 3.82 17.32Jharkhand 17.45 26.80 1.47 5.42 48.01 74.88 2.78 2.86 21.01Karnataka 22.34 60.02 4.84 8.00 71.57 59.46 6.32 6.96 14.26Kerala 29.65 76.84 6.27 9.47 89.67 44.53 10.23 8.48 4.83Madhya Pradesh 14.54 32.14 1.42 4.48 46.01 58.54 2.69 2.85 32.61Maharashtra 19.47 56.76 5.79 7.53 15.89 55.42 5.90 7.24 18.97Manipur 54.44 47.34 2.17 6.90 57.40 64.30 5.92 3.94 17.16Meghalaya 25.09 33.64 1.49 6.13 42.94 18.77 5.39 2.60 35.87Mizoram 33.48 55.20 2.71 12.67 72.85 18.10 7.24 7.69 19.00Nagaland 25.00 38.00 1.75 7.25 53.00 14.00 7.75 3.25 32.25Orissa 11.39 26.72 1.40 3.68 39.82 75.52 1.79 2.10 25.48Punjab 16.49 82.59 5.40 7.36 82.11 113.81 13.12 10.04 4.40Rajasthan 16.18 37.58 1.80 5.11 70.61 52.66 4.66 3.55 21.16Sikkim 22.66 54.69 3.13 8.59 73.44 3.91 8.59 3.91 17.97Tamil Nadu 22.67 86.95 4.17 6.40 74.90 77.56 4.30 6.35 5.08Tripura 12.81 44.84 1.07 6.29 47.92 47.57 2.14 1.54 27.88
24.71 33.21 1.85 6.24 66.93 87.43 3.80 2.83 11.3514.57 61.99 3.15 7.76 74.56 54.18 6.21 6.26 13.82
West Bengal 18.34 35.34 2.21 6.10 49.24 65.70 2.24 2.00 22.78A & N Islands 25.81 68.82 3.23 5.38 83.87 43.01 6.45 5.38 8.60Chandigarh 28.09 82.55 18.72 14.47 88.94 104.26 25.53 28.51 2.13D & N. Haveli 15.07 46.58 2.74 5.48 63.01 50.68 5.48 5.48 24.66Daman & Diu 21.67 61.67 3.33 6.67 86.67 61.67 6.67 6.67 8.33NCT OF Delhi 33.37 87.97 17.63 11.49 90.75 69.44 20.71 22.96 2.90Lakshadweep 18.18 63.64 2.73 9.09 90.91 118.18 1.82 9.09 1.82Puducherry 26.58 82.06 5.98 7.64 80.73 98.01 5.65 10.63 6.31
INDIA 19.87 47.22 3.12 6.35 63.19 65.84 4.65 4.63 17.82Source:
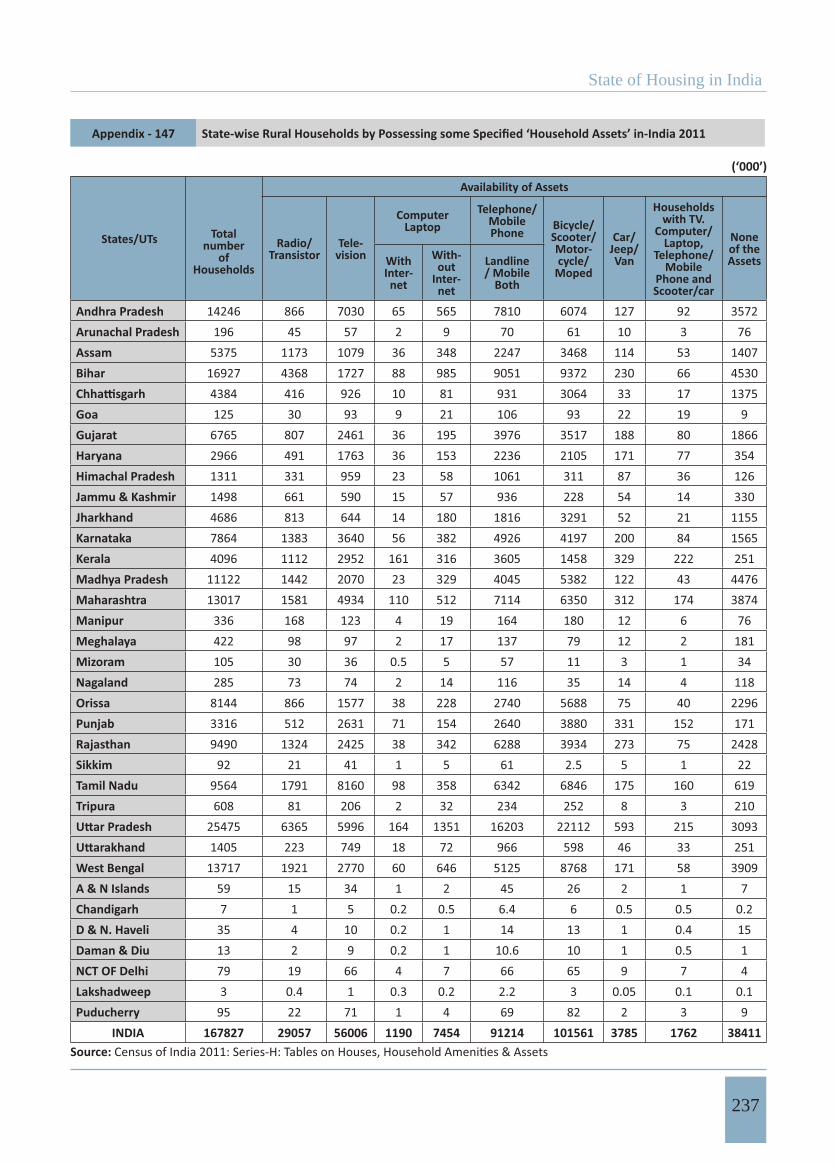
State of Housing in India
237
Appendix - 147
(‘000’)
States/UTs Total number
ofHouseholds
Availability of Assets
Radio/Transistor
Tele-vision
Computer Laptop
Telephone/MobilePhone Bicycle/
Scooter/Motor-cycle/
Moped
Car/Jeep/Van
Householdswith TV.
Computer/Laptop,
Telephone/Mobile
Phone and Scooter/car
Noneof the AssetsWith
Inter-net
With-out
Inter-net
Landline/ Mobile
Both
Andhra Pradesh 14246 866 7030 65 565 7810 6074 127 92 3572Arunachal Pradesh 196 45 57 2 9 70 61 10 3 76Assam 5375 1173 1079 36 348 2247 3468 114 53 1407Bihar 16927 4368 1727 88 985 9051 9372 230 66 4530
4384 416 926 10 81 931 3064 33 17 1375Goa 125 30 93 9 21 106 93 22 19 9Gujarat 6765 807 2461 36 195 3976 3517 188 80 1866Haryana 2966 491 1763 36 153 2236 2105 171 77 354Himachal Pradesh 1311 331 959 23 58 1061 311 87 36 126Jammu & Kashmir 1498 661 590 15 57 936 228 54 14 330Jharkhand 4686 813 644 14 180 1816 3291 52 21 1155Karnataka 7864 1383 3640 56 382 4926 4197 200 84 1565Kerala 4096 1112 2952 161 316 3605 1458 329 222 251Madhya Pradesh 11122 1442 2070 23 329 4045 5382 122 43 4476Maharashtra 13017 1581 4934 110 512 7114 6350 312 174 3874Manipur 336 168 123 4 19 164 180 12 6 76Meghalaya 422 98 97 2 17 137 79 12 2 181Mizoram 105 30 36 0.5 5 57 11 3 1 34Nagaland 285 73 74 2 14 116 35 14 4 118Orissa 8144 866 1577 38 228 2740 5688 75 40 2296Punjab 3316 512 2631 71 154 2640 3880 331 152 171Rajasthan 9490 1324 2425 38 342 6288 3934 273 75 2428Sikkim 92 21 41 1 5 61 2.5 5 1 22Tamil Nadu 9564 1791 8160 98 358 6342 6846 175 160 619Tripura 608 81 206 2 32 234 252 8 3 210
25475 6365 5996 164 1351 16203 22112 593 215 30931405 223 749 18 72 966 598 46 33 251
West Bengal 13717 1921 2770 60 646 5125 8768 171 58 3909A & N Islands 59 15 34 1 2 45 26 2 1 7Chandigarh 7 1 5 0.2 0.5 6.4 6 0.5 0.5 0.2D & N. Haveli 35 4 10 0.2 1 14 13 1 0.4 15Daman & Diu 13 2 9 0.2 1 10.6 10 1 0.5 1NCT OF Delhi 79 19 66 4 7 66 65 9 7 4Lakshadweep 3 0.4 1 0.3 0.2 2.2 3 0.05 0.1 0.1Puducherry 95 22 71 1 4 69 82 2 3 9
INDIA 167827 29057 56006 1190 7454 91214 101561 3785 1762 38411Source:
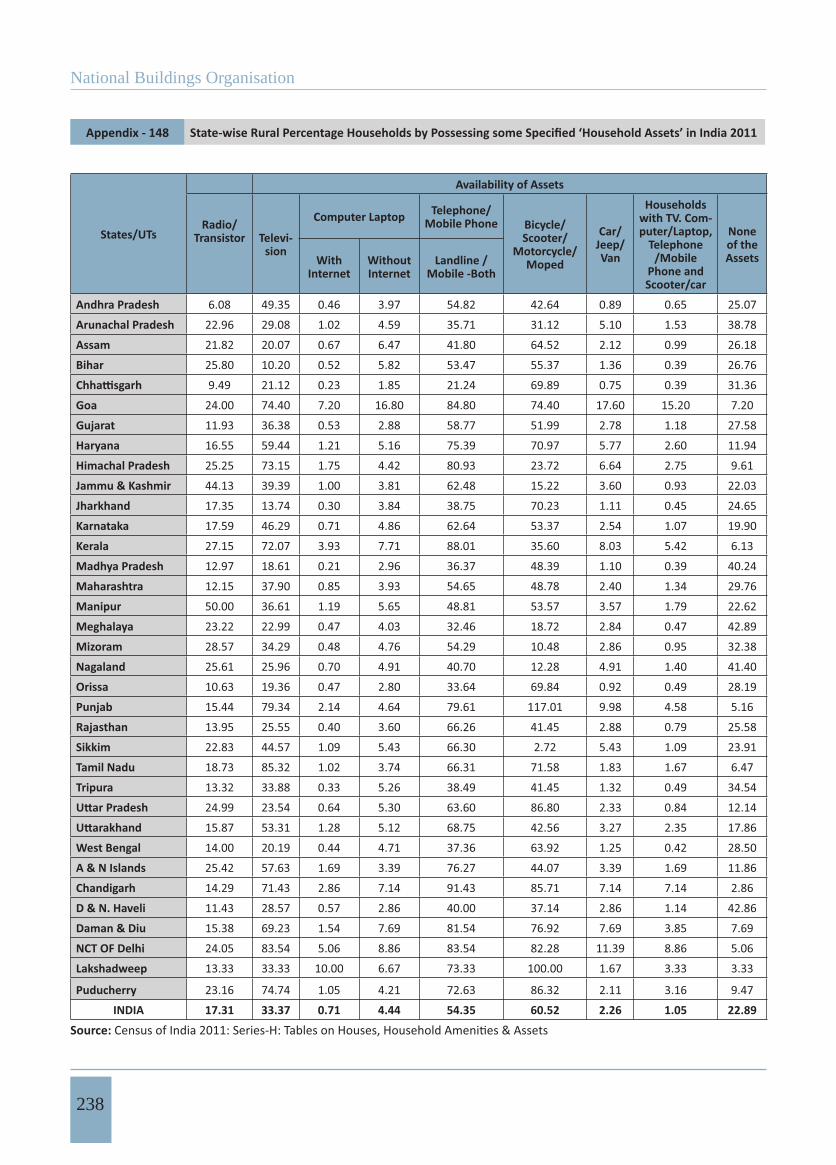
National Buildings Organisation
238
Appendix - 148
States/UTs
Availability of Assets
Radio/Transistor Televi-
sion
Computer Laptop Telephone/Mobile Phone Bicycle/
Scooter/Motorcycle/
Moped
Car/Jeep/Van
Householdswith TV. Com-puter/Laptop,
Telephone/Mobile
Phone and Scooter/car
Noneof the AssetsWith
InternetWithoutInternet
Landline /Mobile -Both
Andhra Pradesh 6.08 49.35 0.46 3.97 54.82 42.64 0.89 0.65 25.07
Arunachal Pradesh 22.96 29.08 1.02 4.59 35.71 31.12 5.10 1.53 38.78
Assam 21.82 20.07 0.67 6.47 41.80 64.52 2.12 0.99 26.18
Bihar 25.80 10.20 0.52 5.82 53.47 55.37 1.36 0.39 26.76
9.49 21.12 0.23 1.85 21.24 69.89 0.75 0.39 31.36
Goa 24.00 74.40 7.20 16.80 84.80 74.40 17.60 15.20 7.20
Gujarat 11.93 36.38 0.53 2.88 58.77 51.99 2.78 1.18 27.58
Haryana 16.55 59.44 1.21 5.16 75.39 70.97 5.77 2.60 11.94
Himachal Pradesh 25.25 73.15 1.75 4.42 80.93 23.72 6.64 2.75 9.61
Jammu & Kashmir 44.13 39.39 1.00 3.81 62.48 15.22 3.60 0.93 22.03
Jharkhand 17.35 13.74 0.30 3.84 38.75 70.23 1.11 0.45 24.65
Karnataka 17.59 46.29 0.71 4.86 62.64 53.37 2.54 1.07 19.90
Kerala 27.15 72.07 3.93 7.71 88.01 35.60 8.03 5.42 6.13
Madhya Pradesh 12.97 18.61 0.21 2.96 36.37 48.39 1.10 0.39 40.24
Maharashtra 12.15 37.90 0.85 3.93 54.65 48.78 2.40 1.34 29.76
Manipur 50.00 36.61 1.19 5.65 48.81 53.57 3.57 1.79 22.62
Meghalaya 23.22 22.99 0.47 4.03 32.46 18.72 2.84 0.47 42.89
Mizoram 28.57 34.29 0.48 4.76 54.29 10.48 2.86 0.95 32.38
Nagaland 25.61 25.96 0.70 4.91 40.70 12.28 4.91 1.40 41.40
Orissa 10.63 19.36 0.47 2.80 33.64 69.84 0.92 0.49 28.19
Punjab 15.44 79.34 2.14 4.64 79.61 117.01 9.98 4.58 5.16
Rajasthan 13.95 25.55 0.40 3.60 66.26 41.45 2.88 0.79 25.58
Sikkim 22.83 44.57 1.09 5.43 66.30 2.72 5.43 1.09 23.91
Tamil Nadu 18.73 85.32 1.02 3.74 66.31 71.58 1.83 1.67 6.47
Tripura 13.32 33.88 0.33 5.26 38.49 41.45 1.32 0.49 34.54
24.99 23.54 0.64 5.30 63.60 86.80 2.33 0.84 12.14
15.87 53.31 1.28 5.12 68.75 42.56 3.27 2.35 17.86
West Bengal 14.00 20.19 0.44 4.71 37.36 63.92 1.25 0.42 28.50
A & N Islands 25.42 57.63 1.69 3.39 76.27 44.07 3.39 1.69 11.86
Chandigarh 14.29 71.43 2.86 7.14 91.43 85.71 7.14 7.14 2.86
D & N. Haveli 11.43 28.57 0.57 2.86 40.00 37.14 2.86 1.14 42.86
Daman & Diu 15.38 69.23 1.54 7.69 81.54 76.92 7.69 3.85 7.69
NCT OF Delhi 24.05 83.54 5.06 8.86 83.54 82.28 11.39 8.86 5.06
Lakshadweep 13.33 33.33 10.00 6.67 73.33 100.00 1.67 3.33 3.33
Puducherry 23.16 74.74 1.05 4.21 72.63 86.32 2.11 3.16 9.47INDIA 17.31 33.37 0.71 4.44 54.35 60.52 2.26 1.05 22.89
Source:
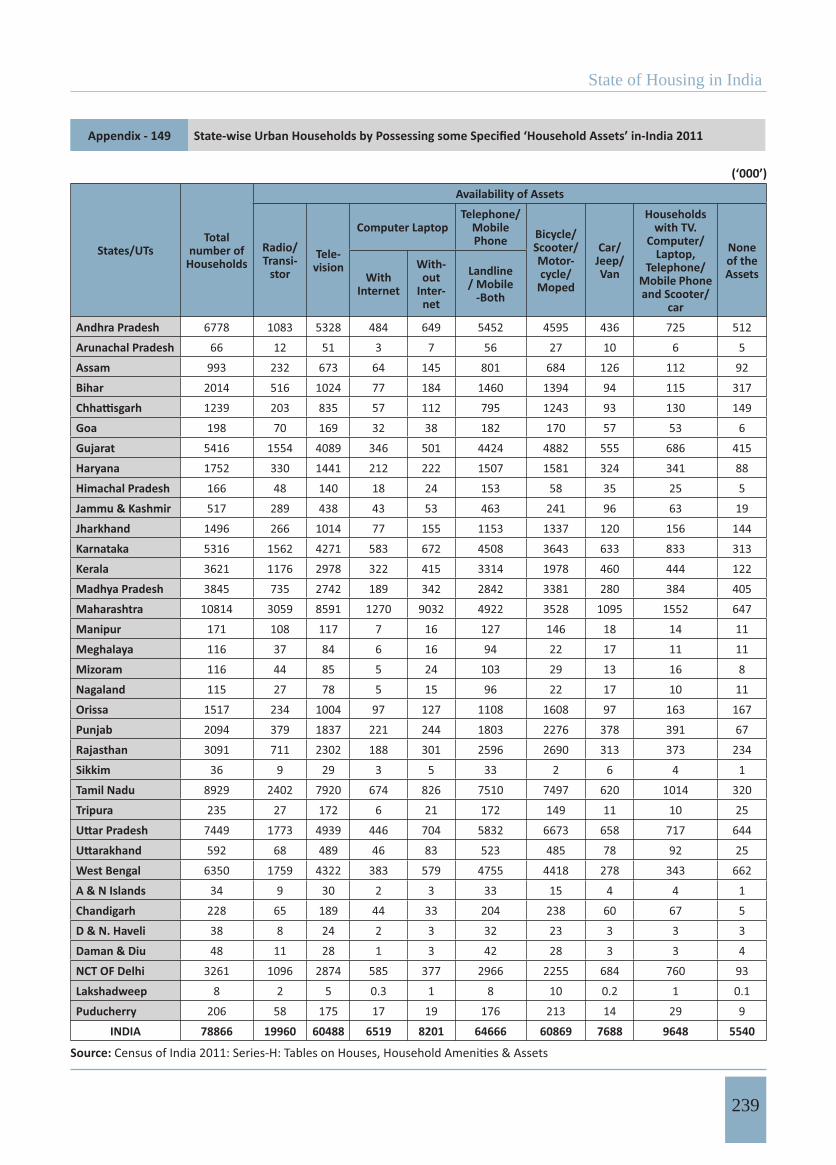
State of Housing in India
239
Appendix - 149
(‘000’)
States/UTsTotal
number of Households
Availability of Assets
Radio/Transi-
storTele-
vision
Computer LaptopTelephone/
MobilePhone Bicycle/
Scooter/ Motor-cycle/
Moped
Car/Jeep/Van
Householdswith TV.
Computer/ Laptop,
Telephone/ Mobile Phone and Scooter/
car
Noneof the AssetsWith
Internet
With-out
Inter-net
Landline/ Mobile
-Both
Andhra Pradesh 6778 1083 5328 484 649 5452 4595 436 725 512
Arunachal Pradesh 66 12 51 3 7 56 27 10 6 5
Assam 993 232 673 64 145 801 684 126 112 92
Bihar 2014 516 1024 77 184 1460 1394 94 115 317
1239 203 835 57 112 795 1243 93 130 149
Goa 198 70 169 32 38 182 170 57 53 6
Gujarat 5416 1554 4089 346 501 4424 4882 555 686 415
Haryana 1752 330 1441 212 222 1507 1581 324 341 88
Himachal Pradesh 166 48 140 18 24 153 58 35 25 5
Jammu & Kashmir 517 289 438 43 53 463 241 96 63 19
Jharkhand 1496 266 1014 77 155 1153 1337 120 156 144
Karnataka 5316 1562 4271 583 672 4508 3643 633 833 313
Kerala 3621 1176 2978 322 415 3314 1978 460 444 122
Madhya Pradesh 3845 735 2742 189 342 2842 3381 280 384 405
Maharashtra 10814 3059 8591 1270 9032 4922 3528 1095 1552 647
Manipur 171 108 117 7 16 127 146 18 14 11
Meghalaya 116 37 84 6 16 94 22 17 11 11
Mizoram 116 44 85 5 24 103 29 13 16 8
Nagaland 115 27 78 5 15 96 22 17 10 11
Orissa 1517 234 1004 97 127 1108 1608 97 163 167
Punjab 2094 379 1837 221 244 1803 2276 378 391 67
Rajasthan 3091 711 2302 188 301 2596 2690 313 373 234
Sikkim 36 9 29 3 5 33 2 6 4 1
Tamil Nadu 8929 2402 7920 674 826 7510 7497 620 1014 320
Tripura 235 27 172 6 21 172 149 11 10 25
7449 1773 4939 446 704 5832 6673 658 717 644
592 68 489 46 83 523 485 78 92 25
West Bengal 6350 1759 4322 383 579 4755 4418 278 343 662
A & N Islands 34 9 30 2 3 33 15 4 4 1
Chandigarh 228 65 189 44 33 204 238 60 67 5
D & N. Haveli 38 8 24 2 3 32 23 3 3 3
Daman & Diu 48 11 28 1 3 42 28 3 3 4
NCT OF Delhi 3261 1096 2874 585 377 2966 2255 684 760 93
Lakshadweep 8 2 5 0.3 1 8 10 0.2 1 0.1
Puducherry 206 58 175 17 19 176 213 14 29 9
INDIA 78866 19960 60488 6519 8201 64666 60869 7688 9648 5540
Source:
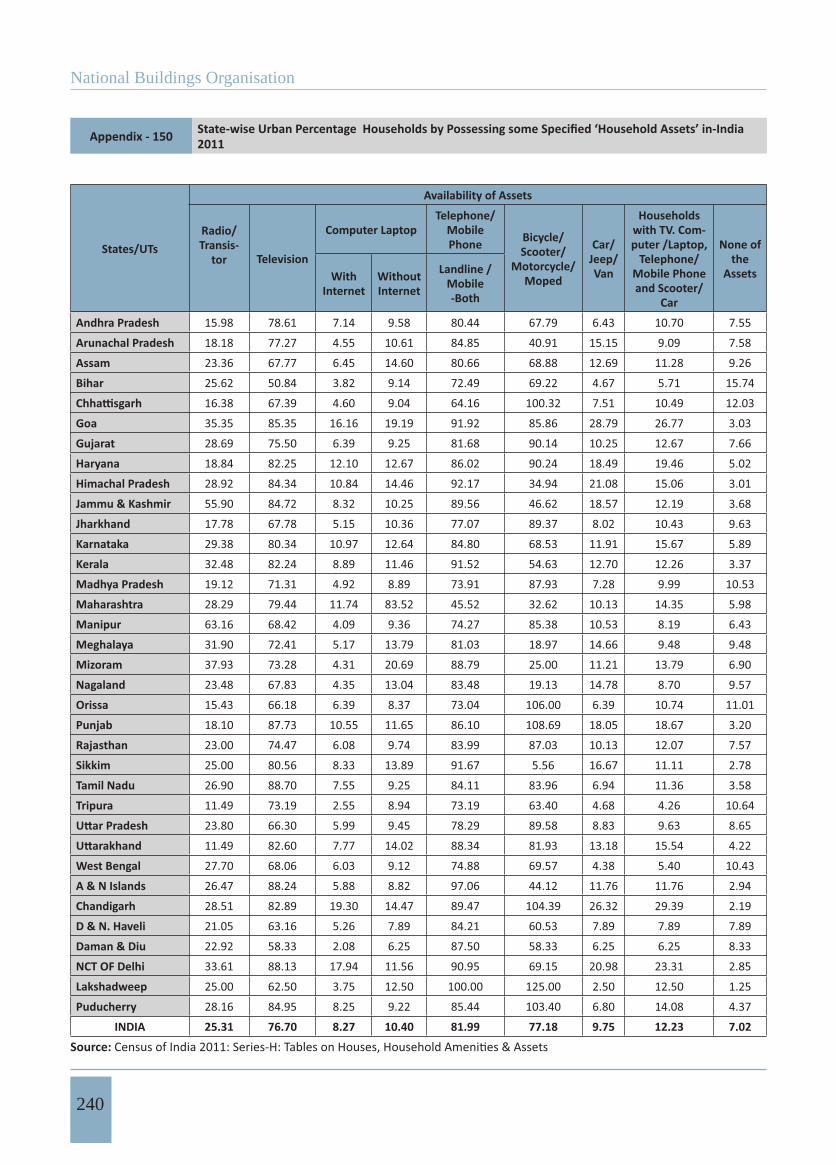
National Buildings Organisation
240
Appendix - 150 2011
States/UTs
Availability of Assets
Radio/Transis-
tor Television
Computer LaptopTelephone/
MobilePhone Bicycle/
Scooter/ Motorcycle/
Moped
Car/Jeep/Van
Householdswith TV. Com-puter /Laptop,
Telephone/ Mobile Phone and Scooter/
Car
None of the
AssetsWithInternet
WithoutInternet
Landline /Mobile-Both
Andhra Pradesh 15.98 78.61 7.14 9.58 80.44 67.79 6.43 10.70 7.55
Arunachal Pradesh 18.18 77.27 4.55 10.61 84.85 40.91 15.15 9.09 7.58
Assam 23.36 67.77 6.45 14.60 80.66 68.88 12.69 11.28 9.26
Bihar 25.62 50.84 3.82 9.14 72.49 69.22 4.67 5.71 15.74
16.38 67.39 4.60 9.04 64.16 100.32 7.51 10.49 12.03
Goa 35.35 85.35 16.16 19.19 91.92 85.86 28.79 26.77 3.03
Gujarat 28.69 75.50 6.39 9.25 81.68 90.14 10.25 12.67 7.66
Haryana 18.84 82.25 12.10 12.67 86.02 90.24 18.49 19.46 5.02
Himachal Pradesh 28.92 84.34 10.84 14.46 92.17 34.94 21.08 15.06 3.01
Jammu & Kashmir 55.90 84.72 8.32 10.25 89.56 46.62 18.57 12.19 3.68
Jharkhand 17.78 67.78 5.15 10.36 77.07 89.37 8.02 10.43 9.63
Karnataka 29.38 80.34 10.97 12.64 84.80 68.53 11.91 15.67 5.89
Kerala 32.48 82.24 8.89 11.46 91.52 54.63 12.70 12.26 3.37
Madhya Pradesh 19.12 71.31 4.92 8.89 73.91 87.93 7.28 9.99 10.53
Maharashtra 28.29 79.44 11.74 83.52 45.52 32.62 10.13 14.35 5.98
Manipur 63.16 68.42 4.09 9.36 74.27 85.38 10.53 8.19 6.43
Meghalaya 31.90 72.41 5.17 13.79 81.03 18.97 14.66 9.48 9.48
Mizoram 37.93 73.28 4.31 20.69 88.79 25.00 11.21 13.79 6.90
Nagaland 23.48 67.83 4.35 13.04 83.48 19.13 14.78 8.70 9.57
Orissa 15.43 66.18 6.39 8.37 73.04 106.00 6.39 10.74 11.01
Punjab 18.10 87.73 10.55 11.65 86.10 108.69 18.05 18.67 3.20
Rajasthan 23.00 74.47 6.08 9.74 83.99 87.03 10.13 12.07 7.57
Sikkim 25.00 80.56 8.33 13.89 91.67 5.56 16.67 11.11 2.78
Tamil Nadu 26.90 88.70 7.55 9.25 84.11 83.96 6.94 11.36 3.58
Tripura 11.49 73.19 2.55 8.94 73.19 63.40 4.68 4.26 10.64
23.80 66.30 5.99 9.45 78.29 89.58 8.83 9.63 8.65
11.49 82.60 7.77 14.02 88.34 81.93 13.18 15.54 4.22
West Bengal 27.70 68.06 6.03 9.12 74.88 69.57 4.38 5.40 10.43
A & N Islands 26.47 88.24 5.88 8.82 97.06 44.12 11.76 11.76 2.94
Chandigarh 28.51 82.89 19.30 14.47 89.47 104.39 26.32 29.39 2.19
D & N. Haveli 21.05 63.16 5.26 7.89 84.21 60.53 7.89 7.89 7.89
Daman & Diu 22.92 58.33 2.08 6.25 87.50 58.33 6.25 6.25 8.33
NCT OF Delhi 33.61 88.13 17.94 11.56 90.95 69.15 20.98 23.31 2.85
Lakshadweep 25.00 62.50 3.75 12.50 100.00 125.00 2.50 12.50 1.25
Puducherry 28.16 84.95 8.25 9.22 85.44 103.40 6.80 14.08 4.37
INDIA 25.31 76.70 8.27 10.40 81.99 77.18 9.75 12.23 7.02
Source:
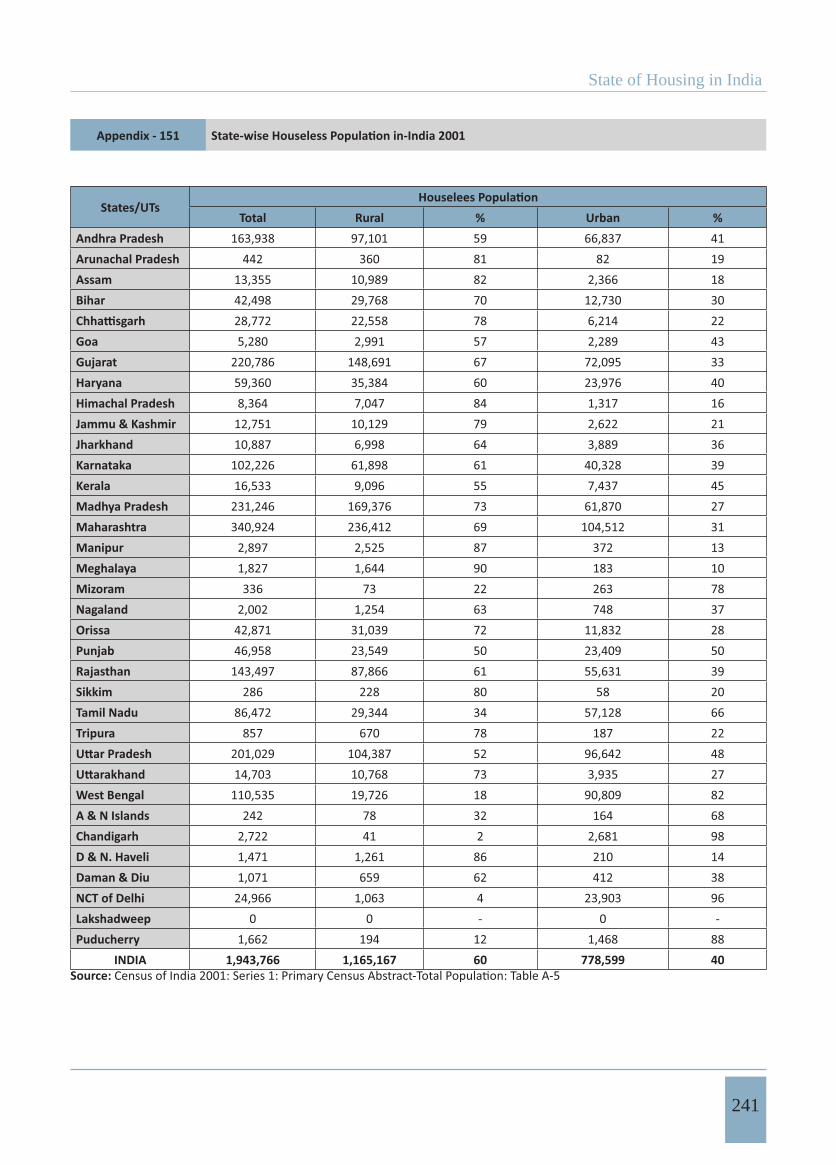
State of Housing in India
241
Appendix - 151
States/UTsTotal Rural % Urban %
Andhra Pradesh 163,938 97,101 59 66,837 41Arunachal Pradesh 442 360 81 82 19Assam 13,355 10,989 82 2,366 18Bihar 42,498 29,768 70 12,730 30
28,772 22,558 78 6,214 22Goa 5,280 2,991 57 2,289 43Gujarat 220,786 148,691 67 72,095 33Haryana 59,360 35,384 60 23,976 40Himachal Pradesh 8,364 7,047 84 1,317 16Jammu & Kashmir 12,751 10,129 79 2,622 21Jharkhand 10,887 6,998 64 3,889 36Karnataka 102,226 61,898 61 40,328 39Kerala 16,533 9,096 55 7,437 45Madhya Pradesh 231,246 169,376 73 61,870 27Maharashtra 340,924 236,412 69 104,512 31Manipur 2,897 2,525 87 372 13Meghalaya 1,827 1,644 90 183 10Mizoram 336 73 22 263 78Nagaland 2,002 1,254 63 748 37Orissa 42,871 31,039 72 11,832 28Punjab 46,958 23,549 50 23,409 50Rajasthan 143,497 87,866 61 55,631 39Sikkim 286 228 80 58 20Tamil Nadu 86,472 29,344 34 57,128 66Tripura 857 670 78 187 22
201,029 104,387 52 96,642 4814,703 10,768 73 3,935 27
West Bengal 110,535 19,726 18 90,809 82A & N Islands 242 78 32 164 68Chandigarh 2,722 41 2 2,681 98D & N. Haveli 1,471 1,261 86 210 14Daman & Diu 1,071 659 62 412 38NCT of Delhi 24,966 1,063 4 23,903 96Lakshadweep 0 0 - 0 -Puducherry 1,662 194 12 1,468 88
INDIA 1,943,766 1,165,167 60 778,599 40Source:
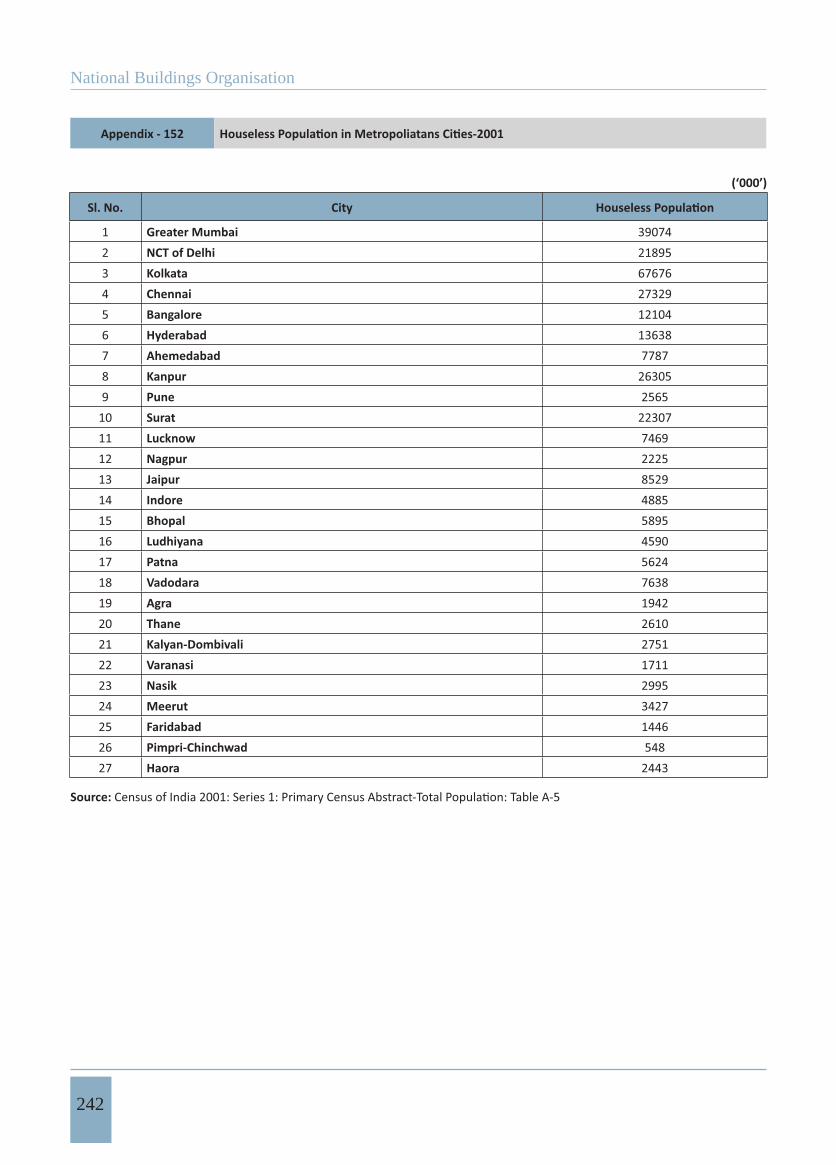
National Buildings Organisation
242
Appendix - 152
(‘000’)
Sl. No. City
1 Greater Mumbai 390742 NCT of Delhi 218953 Kolkata 676764 Chennai 273295 Bangalore 121046 Hyderabad 136387 Ahemedabad 77878 Kanpur 263059 Pune 2565
10 Surat 2230711 Lucknow 746912 Nagpur 222513 Jaipur 852914 Indore 488515 Bhopal 589516 Ludhiyana 459017 Patna 562418 Vadodara 763819 Agra 194220 Thane 261021 Kalyan-Dombivali 275122 Varanasi 171123 Nasik 299524 Meerut 342725 Faridabad 144626 Pimpri-Chinchwad 54827 Haora 2443
Source:
Data Appendices (153-223)

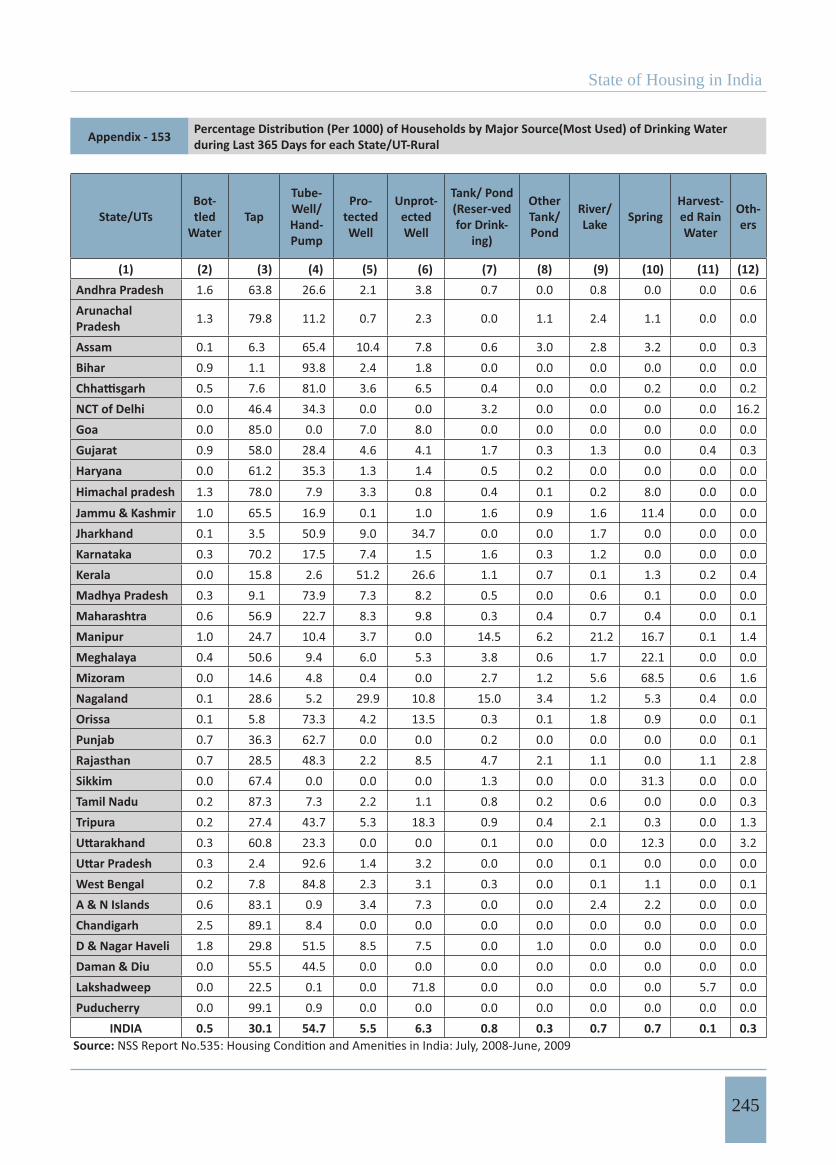
State of Housing in India
245
Appendix - 153 during Last 365 Days for each State/UT-Rural
State/UTsBot-tled
WaterTap
Tube-Well/ Hand-Pump
Pro-tected Well
Unprot-ected Well
Tank/ Pond (Reser-ved for Drink-
ing)
OtherTank/Pond
River/Lake Spring
Harvest-ed Rain Water
Oth-ers
(1) (2) (3) (4) (5) (6) (7) (8) (9) (10) (11) (12)Andhra Pradesh 1.6 63.8 26.6 2.1 3.8 0.7 0.0 0.8 0.0 0.0 0.6ArunachalPradesh 1.3 79.8 11.2 0.7 2.3 0.0 1.1 2.4 1.1 0.0 0.0
Assam 0.1 6.3 65.4 10.4 7.8 0.6 3.0 2.8 3.2 0.0 0.3Bihar 0.9 1.1 93.8 2.4 1.8 0.0 0.0 0.0 0.0 0.0 0.0
0.5 7.6 81.0 3.6 6.5 0.4 0.0 0.0 0.2 0.0 0.2NCT of Delhi 0.0 46.4 34.3 0.0 0.0 3.2 0.0 0.0 0.0 0.0 16.2Goa 0.0 85.0 0.0 7.0 8.0 0.0 0.0 0.0 0.0 0.0 0.0Gujarat 0.9 58.0 28.4 4.6 4.1 1.7 0.3 1.3 0.0 0.4 0.3Haryana 0.0 61.2 35.3 1.3 1.4 0.5 0.2 0.0 0.0 0.0 0.0Himachal pradesh 1.3 78.0 7.9 3.3 0.8 0.4 0.1 0.2 8.0 0.0 0.0Jammu & Kashmir 1.0 65.5 16.9 0.1 1.0 1.6 0.9 1.6 11.4 0.0 0.0Jharkhand 0.1 3.5 50.9 9.0 34.7 0.0 0.0 1.7 0.0 0.0 0.0Karnataka 0.3 70.2 17.5 7.4 1.5 1.6 0.3 1.2 0.0 0.0 0.0Kerala 0.0 15.8 2.6 51.2 26.6 1.1 0.7 0.1 1.3 0.2 0.4Madhya Pradesh 0.3 9.1 73.9 7.3 8.2 0.5 0.0 0.6 0.1 0.0 0.0Maharashtra 0.6 56.9 22.7 8.3 9.8 0.3 0.4 0.7 0.4 0.0 0.1Manipur 1.0 24.7 10.4 3.7 0.0 14.5 6.2 21.2 16.7 0.1 1.4Meghalaya 0.4 50.6 9.4 6.0 5.3 3.8 0.6 1.7 22.1 0.0 0.0Mizoram 0.0 14.6 4.8 0.4 0.0 2.7 1.2 5.6 68.5 0.6 1.6Nagaland 0.1 28.6 5.2 29.9 10.8 15.0 3.4 1.2 5.3 0.4 0.0Orissa 0.1 5.8 73.3 4.2 13.5 0.3 0.1 1.8 0.9 0.0 0.1Punjab 0.7 36.3 62.7 0.0 0.0 0.2 0.0 0.0 0.0 0.0 0.1Rajasthan 0.7 28.5 48.3 2.2 8.5 4.7 2.1 1.1 0.0 1.1 2.8Sikkim 0.0 67.4 0.0 0.0 0.0 1.3 0.0 0.0 31.3 0.0 0.0Tamil Nadu 0.2 87.3 7.3 2.2 1.1 0.8 0.2 0.6 0.0 0.0 0.3Tripura 0.2 27.4 43.7 5.3 18.3 0.9 0.4 2.1 0.3 0.0 1.3
0.3 60.8 23.3 0.0 0.0 0.1 0.0 0.0 12.3 0.0 3.20.3 2.4 92.6 1.4 3.2 0.0 0.0 0.1 0.0 0.0 0.0
West Bengal 0.2 7.8 84.8 2.3 3.1 0.3 0.0 0.1 1.1 0.0 0.1A & N Islands 0.6 83.1 0.9 3.4 7.3 0.0 0.0 2.4 2.2 0.0 0.0Chandigarh 2.5 89.1 8.4 0.0 0.0 0.0 0.0 0.0 0.0 0.0 0.0D & Nagar Haveli 1.8 29.8 51.5 8.5 7.5 0.0 1.0 0.0 0.0 0.0 0.0Daman & Diu 0.0 55.5 44.5 0.0 0.0 0.0 0.0 0.0 0.0 0.0 0.0Lakshadweep 0.0 22.5 0.1 0.0 71.8 0.0 0.0 0.0 0.0 5.7 0.0Puducherry 0.0 99.1 0.9 0.0 0.0 0.0 0.0 0.0 0.0 0.0 0.0
INDIA 0.5 30.1 54.7 5.5 6.3 0.8 0.3 0.7 0.7 0.1 0.3 Source:
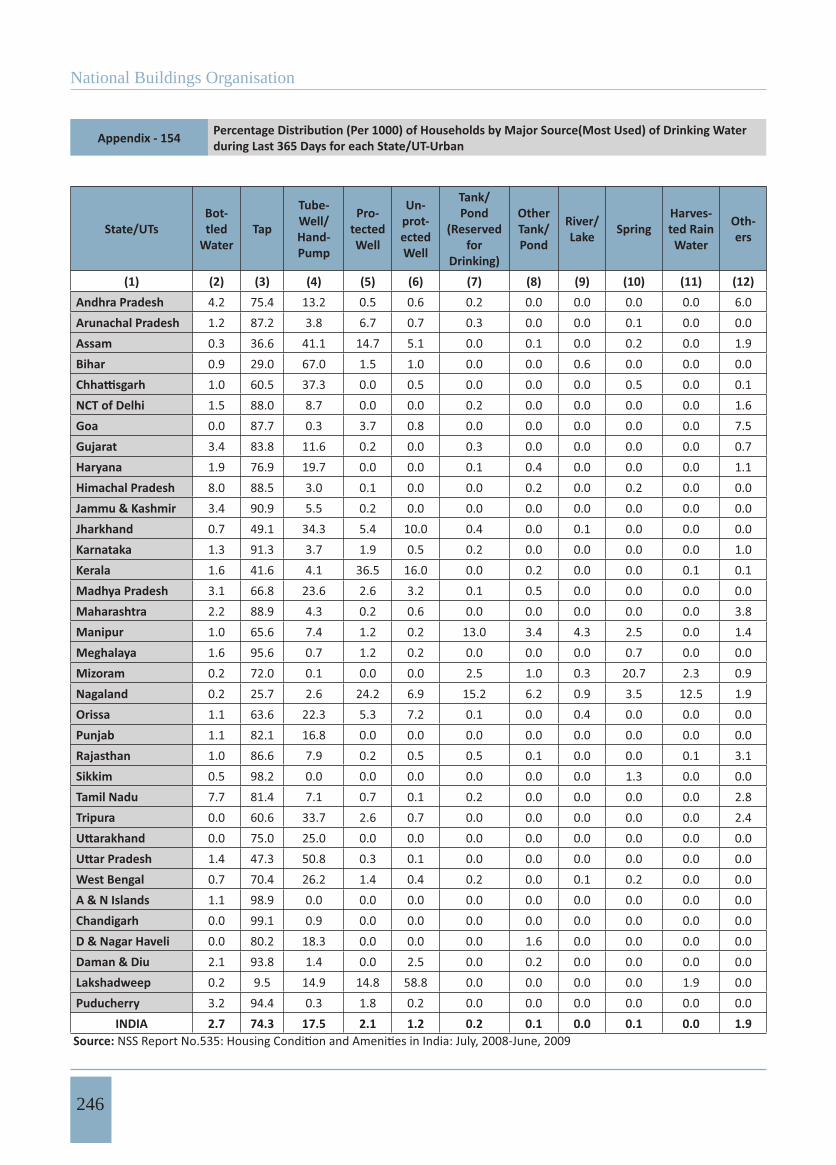
National Buildings Organisation
246
Appendix - 154 during Last 365 Days for each State/UT-Urban
State/UTsBot-tled
WaterTap
Tube-Well/ Hand-Pump
Pro-tected Well
Un-prot-ected Well
Tank/Pond
(Reserved for
Drinking)
OtherTank/Pond
River/Lake Spring
Harves-ted Rain Water
Oth-ers
(1) (2) (3) (4) (5) (6) (7) (8) (9) (10) (11) (12)Andhra Pradesh 4.2 75.4 13.2 0.5 0.6 0.2 0.0 0.0 0.0 0.0 6.0Arunachal Pradesh 1.2 87.2 3.8 6.7 0.7 0.3 0.0 0.0 0.1 0.0 0.0Assam 0.3 36.6 41.1 14.7 5.1 0.0 0.1 0.0 0.2 0.0 1.9Bihar 0.9 29.0 67.0 1.5 1.0 0.0 0.0 0.6 0.0 0.0 0.0
1.0 60.5 37.3 0.0 0.5 0.0 0.0 0.0 0.5 0.0 0.1NCT of Delhi 1.5 88.0 8.7 0.0 0.0 0.2 0.0 0.0 0.0 0.0 1.6Goa 0.0 87.7 0.3 3.7 0.8 0.0 0.0 0.0 0.0 0.0 7.5Gujarat 3.4 83.8 11.6 0.2 0.0 0.3 0.0 0.0 0.0 0.0 0.7Haryana 1.9 76.9 19.7 0.0 0.0 0.1 0.4 0.0 0.0 0.0 1.1Himachal Pradesh 8.0 88.5 3.0 0.1 0.0 0.0 0.2 0.0 0.2 0.0 0.0Jammu & Kashmir 3.4 90.9 5.5 0.2 0.0 0.0 0.0 0.0 0.0 0.0 0.0Jharkhand 0.7 49.1 34.3 5.4 10.0 0.4 0.0 0.1 0.0 0.0 0.0Karnataka 1.3 91.3 3.7 1.9 0.5 0.2 0.0 0.0 0.0 0.0 1.0Kerala 1.6 41.6 4.1 36.5 16.0 0.0 0.2 0.0 0.0 0.1 0.1Madhya Pradesh 3.1 66.8 23.6 2.6 3.2 0.1 0.5 0.0 0.0 0.0 0.0Maharashtra 2.2 88.9 4.3 0.2 0.6 0.0 0.0 0.0 0.0 0.0 3.8Manipur 1.0 65.6 7.4 1.2 0.2 13.0 3.4 4.3 2.5 0.0 1.4Meghalaya 1.6 95.6 0.7 1.2 0.2 0.0 0.0 0.0 0.7 0.0 0.0Mizoram 0.2 72.0 0.1 0.0 0.0 2.5 1.0 0.3 20.7 2.3 0.9Nagaland 0.2 25.7 2.6 24.2 6.9 15.2 6.2 0.9 3.5 12.5 1.9Orissa 1.1 63.6 22.3 5.3 7.2 0.1 0.0 0.4 0.0 0.0 0.0Punjab 1.1 82.1 16.8 0.0 0.0 0.0 0.0 0.0 0.0 0.0 0.0Rajasthan 1.0 86.6 7.9 0.2 0.5 0.5 0.1 0.0 0.0 0.1 3.1Sikkim 0.5 98.2 0.0 0.0 0.0 0.0 0.0 0.0 1.3 0.0 0.0Tamil Nadu 7.7 81.4 7.1 0.7 0.1 0.2 0.0 0.0 0.0 0.0 2.8Tripura 0.0 60.6 33.7 2.6 0.7 0.0 0.0 0.0 0.0 0.0 2.4
0.0 75.0 25.0 0.0 0.0 0.0 0.0 0.0 0.0 0.0 0.01.4 47.3 50.8 0.3 0.1 0.0 0.0 0.0 0.0 0.0 0.0
West Bengal 0.7 70.4 26.2 1.4 0.4 0.2 0.0 0.1 0.2 0.0 0.0A & N Islands 1.1 98.9 0.0 0.0 0.0 0.0 0.0 0.0 0.0 0.0 0.0Chandigarh 0.0 99.1 0.9 0.0 0.0 0.0 0.0 0.0 0.0 0.0 0.0D & Nagar Haveli 0.0 80.2 18.3 0.0 0.0 0.0 1.6 0.0 0.0 0.0 0.0Daman & Diu 2.1 93.8 1.4 0.0 2.5 0.0 0.2 0.0 0.0 0.0 0.0Lakshadweep 0.2 9.5 14.9 14.8 58.8 0.0 0.0 0.0 0.0 1.9 0.0Puducherry 3.2 94.4 0.3 1.8 0.2 0.0 0.0 0.0 0.0 0.0 0.0
INDIA 2.7 74.3 17.5 2.1 1.2 0.2 0.1 0.0 0.1 0.0 1.9Source:
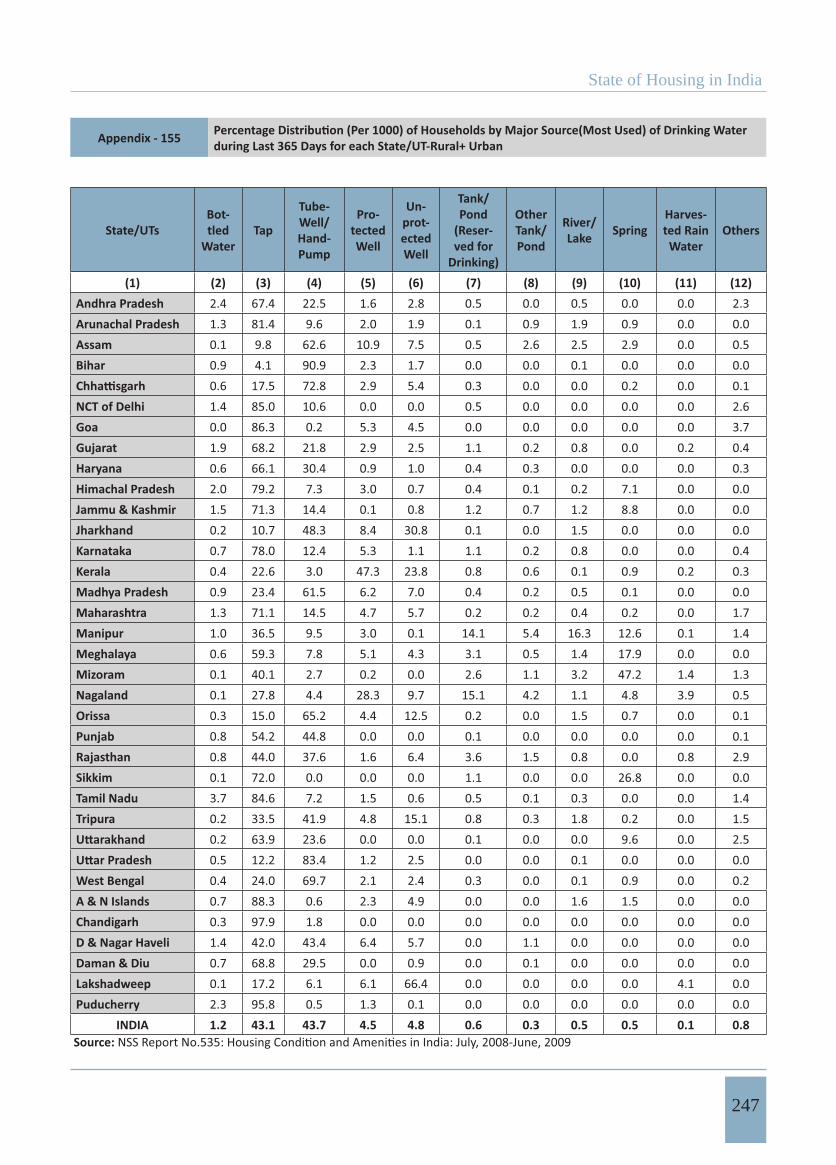
State of Housing in India
247
Appendix - 155 during Last 365 Days for each State/UT-Rural+ Urban
State/UTsBot-tled
WaterTap
Tube-Well/ Hand-Pump
Pro-tected Well
Un-prot-ected Well
Tank/Pond
(Reser-ved for
Drinking)
OtherTank/Pond
River/Lake Spring
Harves-ted Rain Water
Others
(1) (2) (3) (4) (5) (6) (7) (8) (9) (10) (11) (12)Andhra Pradesh 2.4 67.4 22.5 1.6 2.8 0.5 0.0 0.5 0.0 0.0 2.3Arunachal Pradesh 1.3 81.4 9.6 2.0 1.9 0.1 0.9 1.9 0.9 0.0 0.0Assam 0.1 9.8 62.6 10.9 7.5 0.5 2.6 2.5 2.9 0.0 0.5Bihar 0.9 4.1 90.9 2.3 1.7 0.0 0.0 0.1 0.0 0.0 0.0
0.6 17.5 72.8 2.9 5.4 0.3 0.0 0.0 0.2 0.0 0.1NCT of Delhi 1.4 85.0 10.6 0.0 0.0 0.5 0.0 0.0 0.0 0.0 2.6Goa 0.0 86.3 0.2 5.3 4.5 0.0 0.0 0.0 0.0 0.0 3.7Gujarat 1.9 68.2 21.8 2.9 2.5 1.1 0.2 0.8 0.0 0.2 0.4Haryana 0.6 66.1 30.4 0.9 1.0 0.4 0.3 0.0 0.0 0.0 0.3Himachal Pradesh 2.0 79.2 7.3 3.0 0.7 0.4 0.1 0.2 7.1 0.0 0.0Jammu & Kashmir 1.5 71.3 14.4 0.1 0.8 1.2 0.7 1.2 8.8 0.0 0.0Jharkhand 0.2 10.7 48.3 8.4 30.8 0.1 0.0 1.5 0.0 0.0 0.0Karnataka 0.7 78.0 12.4 5.3 1.1 1.1 0.2 0.8 0.0 0.0 0.4Kerala 0.4 22.6 3.0 47.3 23.8 0.8 0.6 0.1 0.9 0.2 0.3Madhya Pradesh 0.9 23.4 61.5 6.2 7.0 0.4 0.2 0.5 0.1 0.0 0.0Maharashtra 1.3 71.1 14.5 4.7 5.7 0.2 0.2 0.4 0.2 0.0 1.7Manipur 1.0 36.5 9.5 3.0 0.1 14.1 5.4 16.3 12.6 0.1 1.4Meghalaya 0.6 59.3 7.8 5.1 4.3 3.1 0.5 1.4 17.9 0.0 0.0Mizoram 0.1 40.1 2.7 0.2 0.0 2.6 1.1 3.2 47.2 1.4 1.3Nagaland 0.1 27.8 4.4 28.3 9.7 15.1 4.2 1.1 4.8 3.9 0.5Orissa 0.3 15.0 65.2 4.4 12.5 0.2 0.0 1.5 0.7 0.0 0.1Punjab 0.8 54.2 44.8 0.0 0.0 0.1 0.0 0.0 0.0 0.0 0.1Rajasthan 0.8 44.0 37.6 1.6 6.4 3.6 1.5 0.8 0.0 0.8 2.9Sikkim 0.1 72.0 0.0 0.0 0.0 1.1 0.0 0.0 26.8 0.0 0.0Tamil Nadu 3.7 84.6 7.2 1.5 0.6 0.5 0.1 0.3 0.0 0.0 1.4Tripura 0.2 33.5 41.9 4.8 15.1 0.8 0.3 1.8 0.2 0.0 1.5
0.2 63.9 23.6 0.0 0.0 0.1 0.0 0.0 9.6 0.0 2.50.5 12.2 83.4 1.2 2.5 0.0 0.0 0.1 0.0 0.0 0.0
West Bengal 0.4 24.0 69.7 2.1 2.4 0.3 0.0 0.1 0.9 0.0 0.2A & N Islands 0.7 88.3 0.6 2.3 4.9 0.0 0.0 1.6 1.5 0.0 0.0Chandigarh 0.3 97.9 1.8 0.0 0.0 0.0 0.0 0.0 0.0 0.0 0.0D & Nagar Haveli 1.4 42.0 43.4 6.4 5.7 0.0 1.1 0.0 0.0 0.0 0.0Daman & Diu 0.7 68.8 29.5 0.0 0.9 0.0 0.1 0.0 0.0 0.0 0.0Lakshadweep 0.1 17.2 6.1 6.1 66.4 0.0 0.0 0.0 0.0 4.1 0.0Puducherry 2.3 95.8 0.5 1.3 0.1 0.0 0.0 0.0 0.0 0.0 0.0
INDIA 1.2 43.1 43.7 4.5 4.8 0.6 0.3 0.5 0.5 0.1 0.8Source:
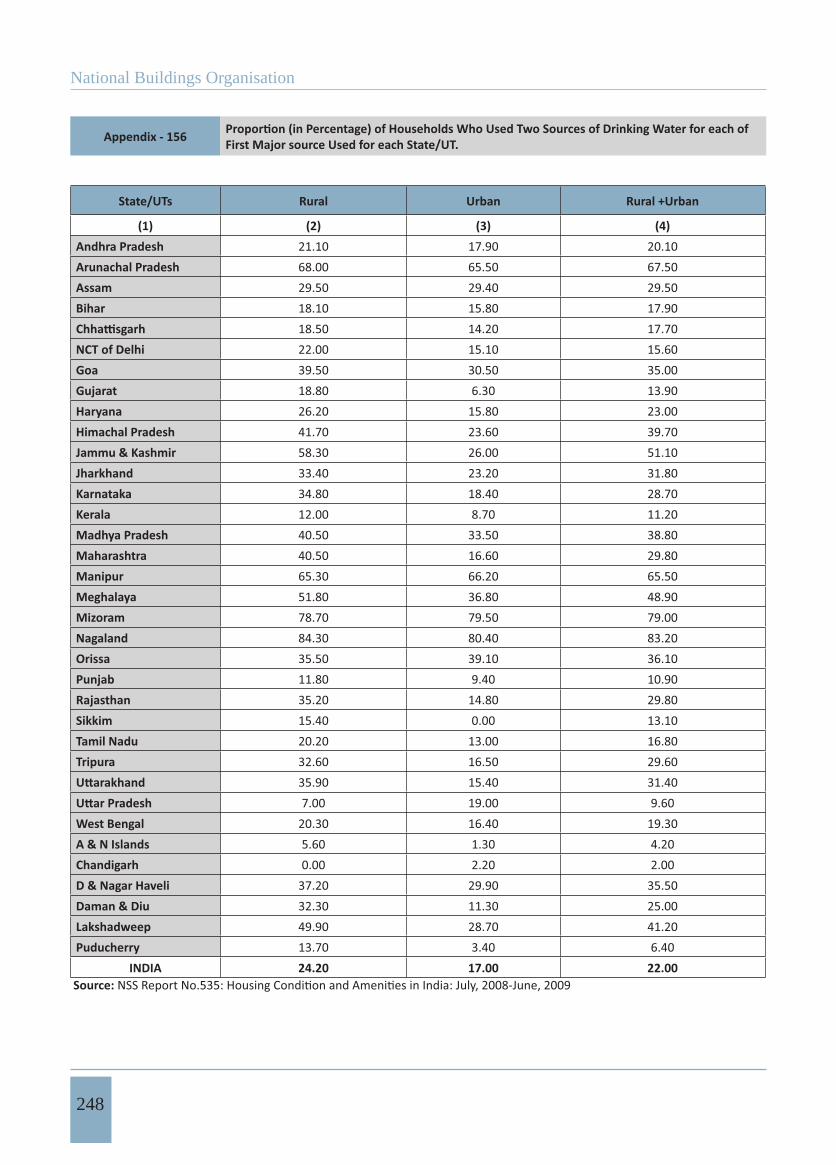
National Buildings Organisation
248
Appendix - 156 First Major source Used for each State/UT.
State/UTs Rural Urban Rural +Urban
(1) (2) (3) (4)Andhra Pradesh 21.10 17.90 20.10Arunachal Pradesh 68.00 65.50 67.50Assam 29.50 29.40 29.50Bihar 18.10 15.80 17.90
18.50 14.20 17.70NCT of Delhi 22.00 15.10 15.60Goa 39.50 30.50 35.00Gujarat 18.80 6.30 13.90Haryana 26.20 15.80 23.00Himachal Pradesh 41.70 23.60 39.70Jammu & Kashmir 58.30 26.00 51.10Jharkhand 33.40 23.20 31.80Karnataka 34.80 18.40 28.70Kerala 12.00 8.70 11.20Madhya Pradesh 40.50 33.50 38.80Maharashtra 40.50 16.60 29.80Manipur 65.30 66.20 65.50Meghalaya 51.80 36.80 48.90Mizoram 78.70 79.50 79.00Nagaland 84.30 80.40 83.20Orissa 35.50 39.10 36.10Punjab 11.80 9.40 10.90Rajasthan 35.20 14.80 29.80Sikkim 15.40 0.00 13.10Tamil Nadu 20.20 13.00 16.80Tripura 32.60 16.50 29.60
35.90 15.40 31.407.00 19.00 9.60
West Bengal 20.30 16.40 19.30A & N Islands 5.60 1.30 4.20Chandigarh 0.00 2.20 2.00D & Nagar Haveli 37.20 29.90 35.50Daman & Diu 32.30 11.30 25.00Lakshadweep 49.90 28.70 41.20Puducherry 13.70 3.40 6.40
INDIA 24.20 17.00 22.00 Source:
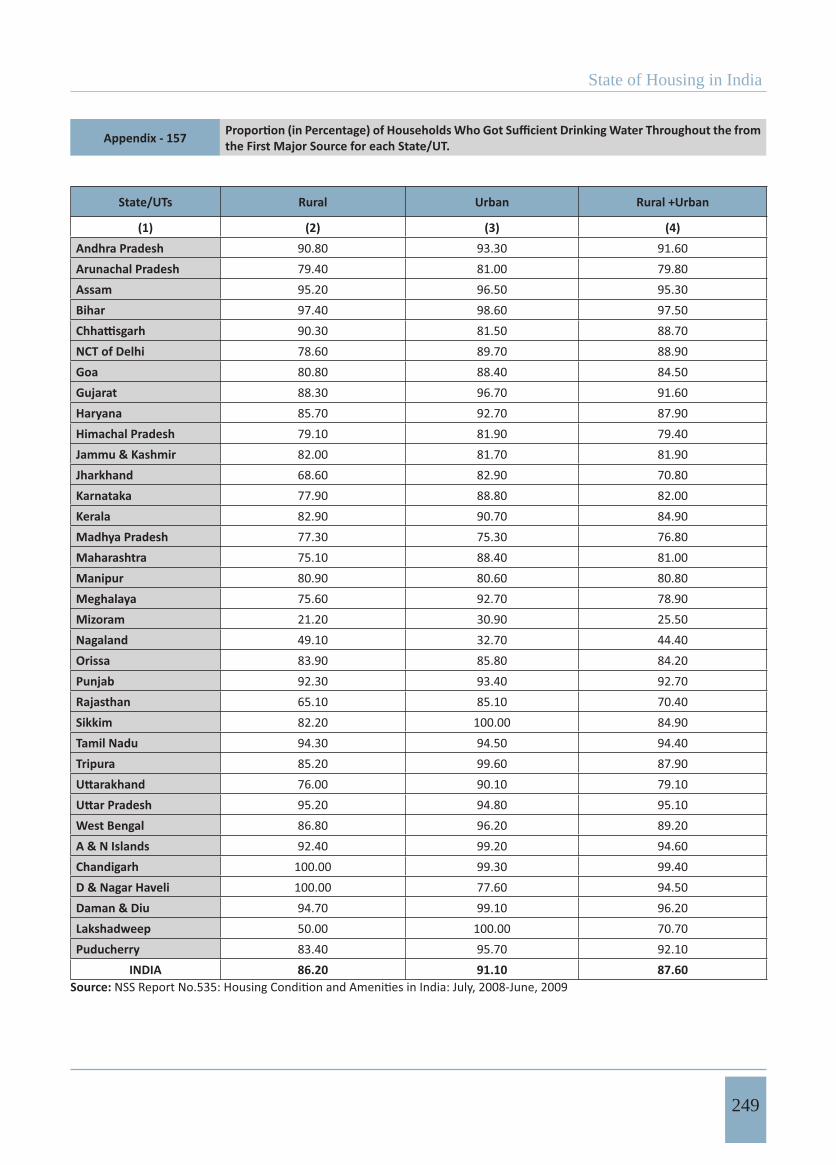
State of Housing in India
249
Appendix - 157 the First Major Source for each State/UT.
State/UTs Rural Urban Rural +Urban
(1) (2) (3) (4)Andhra Pradesh 90.80 93.30 91.60Arunachal Pradesh 79.40 81.00 79.80Assam 95.20 96.50 95.30Bihar 97.40 98.60 97.50
90.30 81.50 88.70NCT of Delhi 78.60 89.70 88.90Goa 80.80 88.40 84.50Gujarat 88.30 96.70 91.60Haryana 85.70 92.70 87.90Himachal Pradesh 79.10 81.90 79.40Jammu & Kashmir 82.00 81.70 81.90Jharkhand 68.60 82.90 70.80Karnataka 77.90 88.80 82.00Kerala 82.90 90.70 84.90Madhya Pradesh 77.30 75.30 76.80Maharashtra 75.10 88.40 81.00Manipur 80.90 80.60 80.80Meghalaya 75.60 92.70 78.90Mizoram 21.20 30.90 25.50Nagaland 49.10 32.70 44.40Orissa 83.90 85.80 84.20Punjab 92.30 93.40 92.70Rajasthan 65.10 85.10 70.40Sikkim 82.20 100.00 84.90Tamil Nadu 94.30 94.50 94.40Tripura 85.20 99.60 87.90
76.00 90.10 79.1095.20 94.80 95.10
West Bengal 86.80 96.20 89.20A & N Islands 92.40 99.20 94.60Chandigarh 100.00 99.30 99.40D & Nagar Haveli 100.00 77.60 94.50Daman & Diu 94.70 99.10 96.20Lakshadweep 50.00 100.00 70.70Puducherry 83.40 95.70 92.10
INDIA 86.20 91.10 87.60Source:
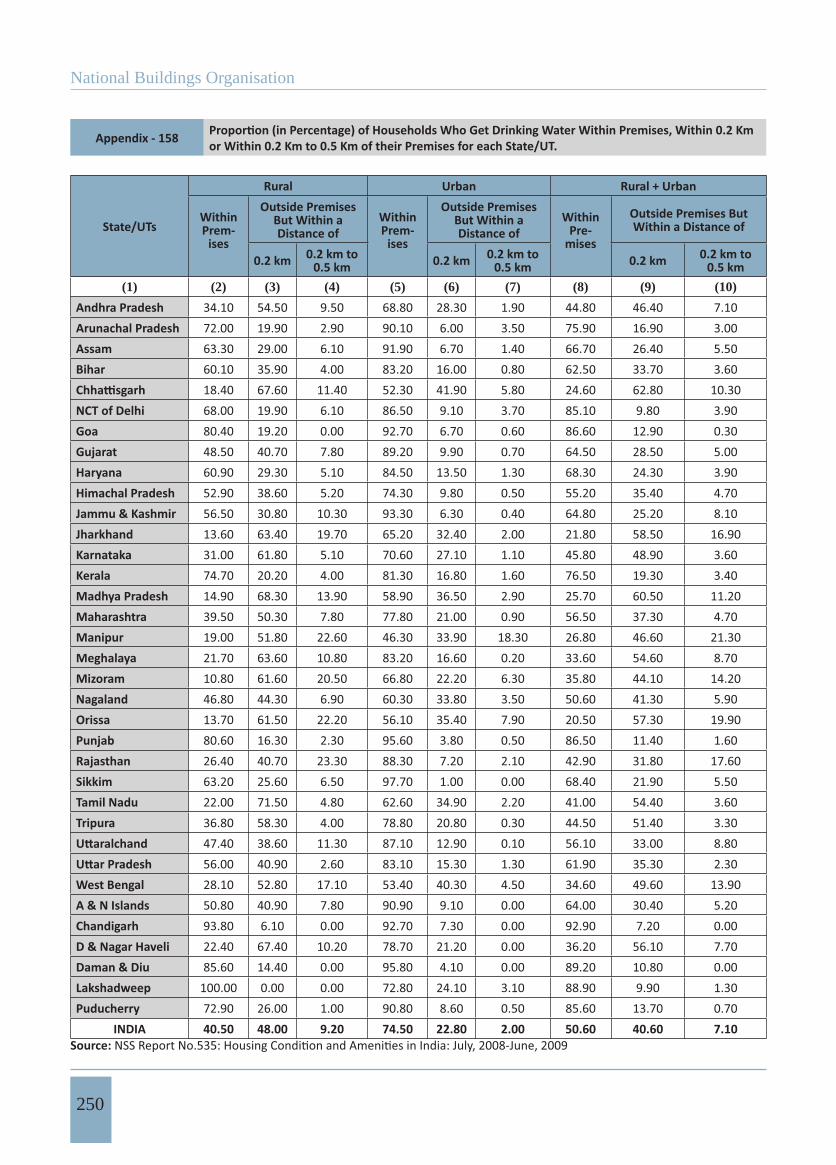
National Buildings Organisation
250
Appendix - 158 or Within 0.2 Km to 0.5 Km of their Premises for each State/UT.
State/UTs
Rural Urban Rural + Urban
WithinPrem-
ises
Outside Premises But Within a Distance of
WithinPrem-
ises
Outside Premises But Within a Distance of
WithinPre-
mises
Outside Premises But Within a Distance of
0.2 km 0.2 km to 0.5 km 0.2 km 0.2 km to
0.5 km 0.2 km 0.2 km to 0.5 km
(1) (2) (3) (4) (5) (6) (7) (8) (9) (10)
Andhra Pradesh 34.10 54.50 9.50 68.80 28.30 1.90 44.80 46.40 7.10Arunachal Pradesh 72.00 19.90 2.90 90.10 6.00 3.50 75.90 16.90 3.00Assam 63.30 29.00 6.10 91.90 6.70 1.40 66.70 26.40 5.50Bihar 60.10 35.90 4.00 83.20 16.00 0.80 62.50 33.70 3.60
18.40 67.60 11.40 52.30 41.90 5.80 24.60 62.80 10.30NCT of Delhi 68.00 19.90 6.10 86.50 9.10 3.70 85.10 9.80 3.90Goa 80.40 19.20 0.00 92.70 6.70 0.60 86.60 12.90 0.30Gujarat 48.50 40.70 7.80 89.20 9.90 0.70 64.50 28.50 5.00Haryana 60.90 29.30 5.10 84.50 13.50 1.30 68.30 24.30 3.90Himachal Pradesh 52.90 38.60 5.20 74.30 9.80 0.50 55.20 35.40 4.70Jammu & Kashmir 56.50 30.80 10.30 93.30 6.30 0.40 64.80 25.20 8.10Jharkhand 13.60 63.40 19.70 65.20 32.40 2.00 21.80 58.50 16.90Karnataka 31.00 61.80 5.10 70.60 27.10 1.10 45.80 48.90 3.60Kerala 74.70 20.20 4.00 81.30 16.80 1.60 76.50 19.30 3.40Madhya Pradesh 14.90 68.30 13.90 58.90 36.50 2.90 25.70 60.50 11.20Maharashtra 39.50 50.30 7.80 77.80 21.00 0.90 56.50 37.30 4.70Manipur 19.00 51.80 22.60 46.30 33.90 18.30 26.80 46.60 21.30Meghalaya 21.70 63.60 10.80 83.20 16.60 0.20 33.60 54.60 8.70Mizoram 10.80 61.60 20.50 66.80 22.20 6.30 35.80 44.10 14.20Nagaland 46.80 44.30 6.90 60.30 33.80 3.50 50.60 41.30 5.90Orissa 13.70 61.50 22.20 56.10 35.40 7.90 20.50 57.30 19.90Punjab 80.60 16.30 2.30 95.60 3.80 0.50 86.50 11.40 1.60Rajasthan 26.40 40.70 23.30 88.30 7.20 2.10 42.90 31.80 17.60Sikkim 63.20 25.60 6.50 97.70 1.00 0.00 68.40 21.90 5.50Tamil Nadu 22.00 71.50 4.80 62.60 34.90 2.20 41.00 54.40 3.60Tripura 36.80 58.30 4.00 78.80 20.80 0.30 44.50 51.40 3.30
47.40 38.60 11.30 87.10 12.90 0.10 56.10 33.00 8.8056.00 40.90 2.60 83.10 15.30 1.30 61.90 35.30 2.30
West Bengal 28.10 52.80 17.10 53.40 40.30 4.50 34.60 49.60 13.90A & N Islands 50.80 40.90 7.80 90.90 9.10 0.00 64.00 30.40 5.20Chandigarh 93.80 6.10 0.00 92.70 7.30 0.00 92.90 7.20 0.00D & Nagar Haveli 22.40 67.40 10.20 78.70 21.20 0.00 36.20 56.10 7.70Daman & Diu 85.60 14.40 0.00 95.80 4.10 0.00 89.20 10.80 0.00Lakshadweep 100.00 0.00 0.00 72.80 24.10 3.10 88.90 9.90 1.30Puducherry 72.90 26.00 1.00 90.80 8.60 0.50 85.60 13.70 0.70
INDIA 40.50 48.00 9.20 74.50 22.80 2.00 50.60 40.60 7.10Source:
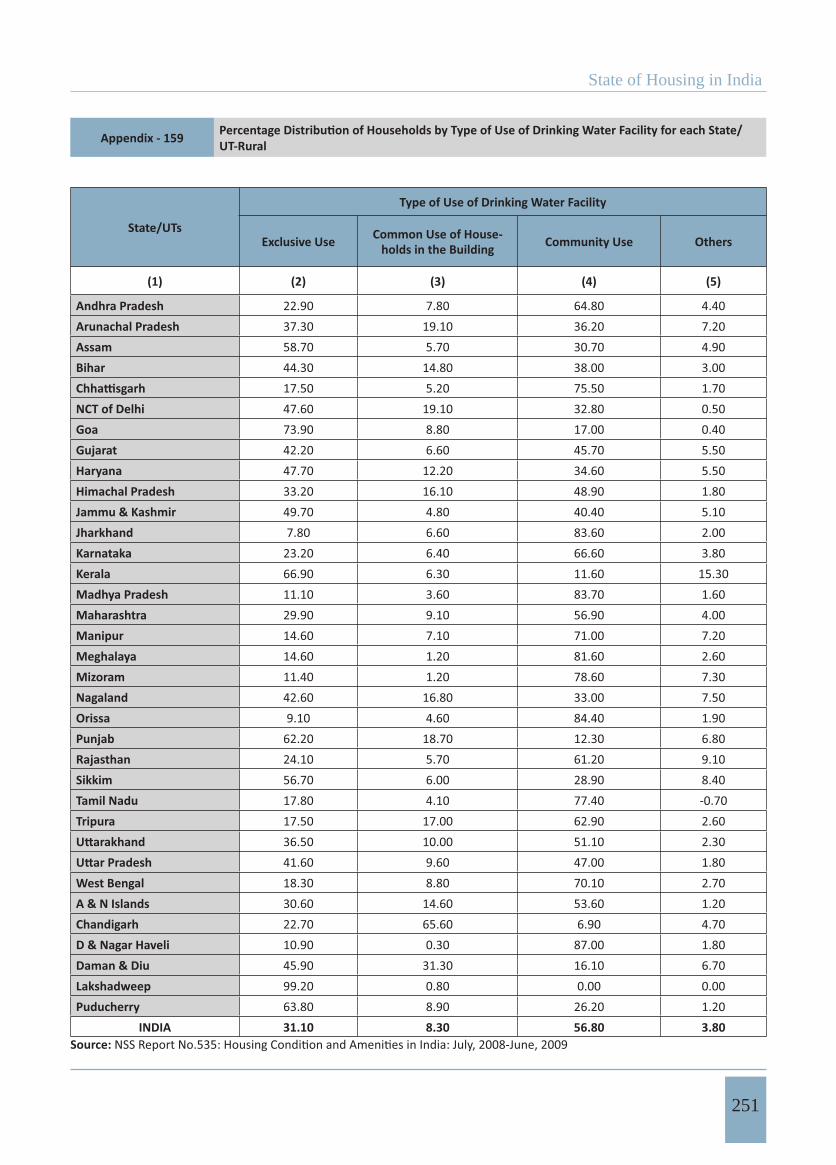
State of Housing in India
251
Appendix - 159 UT-Rural
State/UTs
Type of Use of Drinking Water Facility
Exclusive Use Common Use of House-holds in the Building Community Use Others
(1) (2) (3) (4) (5)
Andhra Pradesh 22.90 7.80 64.80 4.40Arunachal Pradesh 37.30 19.10 36.20 7.20Assam 58.70 5.70 30.70 4.90Bihar 44.30 14.80 38.00 3.00
17.50 5.20 75.50 1.70NCT of Delhi 47.60 19.10 32.80 0.50Goa 73.90 8.80 17.00 0.40Gujarat 42.20 6.60 45.70 5.50Haryana 47.70 12.20 34.60 5.50Himachal Pradesh 33.20 16.10 48.90 1.80Jammu & Kashmir 49.70 4.80 40.40 5.10Jharkhand 7.80 6.60 83.60 2.00Karnataka 23.20 6.40 66.60 3.80Kerala 66.90 6.30 11.60 15.30Madhya Pradesh 11.10 3.60 83.70 1.60Maharashtra 29.90 9.10 56.90 4.00Manipur 14.60 7.10 71.00 7.20Meghalaya 14.60 1.20 81.60 2.60Mizoram 11.40 1.20 78.60 7.30Nagaland 42.60 16.80 33.00 7.50Orissa 9.10 4.60 84.40 1.90Punjab 62.20 18.70 12.30 6.80Rajasthan 24.10 5.70 61.20 9.10Sikkim 56.70 6.00 28.90 8.40Tamil Nadu 17.80 4.10 77.40 -0.70Tripura 17.50 17.00 62.90 2.60
36.50 10.00 51.10 2.3041.60 9.60 47.00 1.80
West Bengal 18.30 8.80 70.10 2.70A & N Islands 30.60 14.60 53.60 1.20Chandigarh 22.70 65.60 6.90 4.70D & Nagar Haveli 10.90 0.30 87.00 1.80Daman & Diu 45.90 31.30 16.10 6.70Lakshadweep 99.20 0.80 0.00 0.00Puducherry 63.80 8.90 26.20 1.20
INDIA 31.10 8.30 56.80 3.80Source:
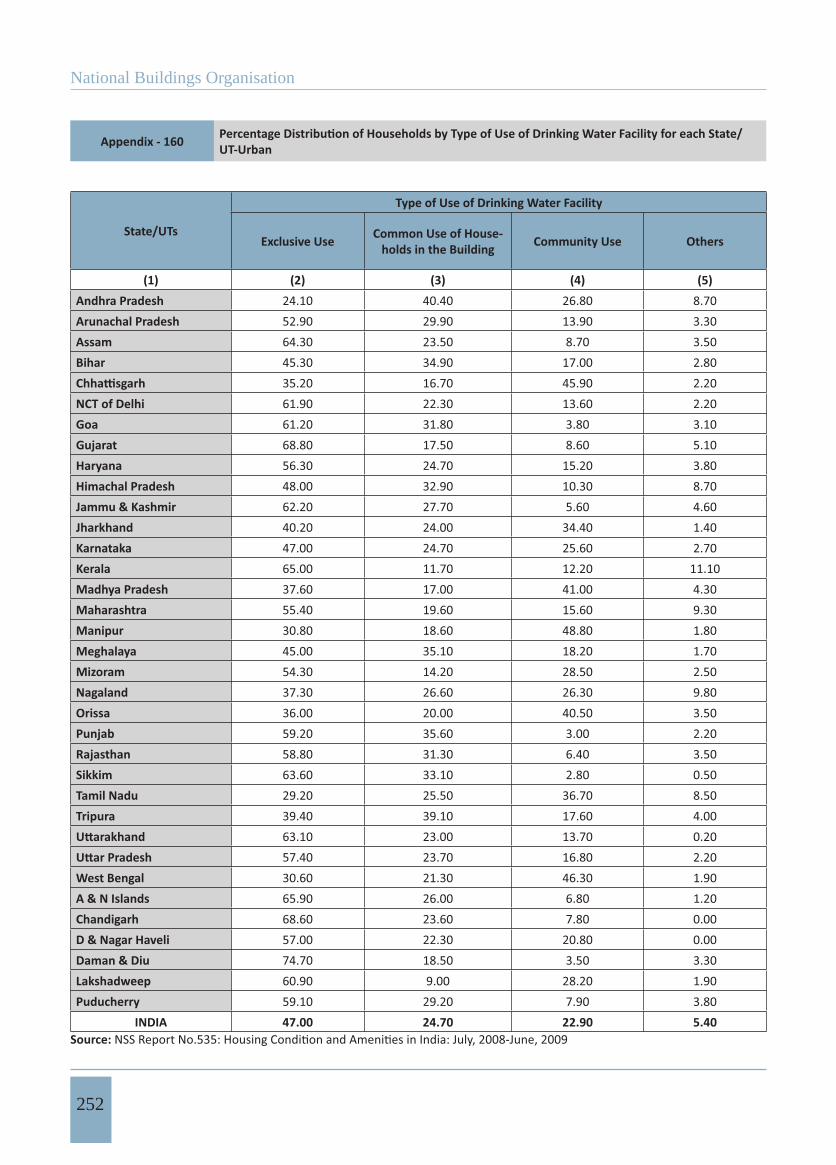
National Buildings Organisation
252
Appendix - 160 UT-Urban
State/UTs
Type of Use of Drinking Water Facility
Exclusive Use Common Use of House-holds in the Building Community Use Others
(1) (2) (3) (4) (5)Andhra Pradesh 24.10 40.40 26.80 8.70Arunachal Pradesh 52.90 29.90 13.90 3.30Assam 64.30 23.50 8.70 3.50Bihar 45.30 34.90 17.00 2.80
35.20 16.70 45.90 2.20NCT of Delhi 61.90 22.30 13.60 2.20Goa 61.20 31.80 3.80 3.10Gujarat 68.80 17.50 8.60 5.10Haryana 56.30 24.70 15.20 3.80Himachal Pradesh 48.00 32.90 10.30 8.70Jammu & Kashmir 62.20 27.70 5.60 4.60Jharkhand 40.20 24.00 34.40 1.40Karnataka 47.00 24.70 25.60 2.70Kerala 65.00 11.70 12.20 11.10Madhya Pradesh 37.60 17.00 41.00 4.30Maharashtra 55.40 19.60 15.60 9.30Manipur 30.80 18.60 48.80 1.80Meghalaya 45.00 35.10 18.20 1.70Mizoram 54.30 14.20 28.50 2.50Nagaland 37.30 26.60 26.30 9.80Orissa 36.00 20.00 40.50 3.50Punjab 59.20 35.60 3.00 2.20Rajasthan 58.80 31.30 6.40 3.50Sikkim 63.60 33.10 2.80 0.50Tamil Nadu 29.20 25.50 36.70 8.50Tripura 39.40 39.10 17.60 4.00
63.10 23.00 13.70 0.2057.40 23.70 16.80 2.20
West Bengal 30.60 21.30 46.30 1.90A & N Islands 65.90 26.00 6.80 1.20Chandigarh 68.60 23.60 7.80 0.00D & Nagar Haveli 57.00 22.30 20.80 0.00Daman & Diu 74.70 18.50 3.50 3.30Lakshadweep 60.90 9.00 28.20 1.90Puducherry 59.10 29.20 7.90 3.80
INDIA 47.00 24.70 22.90 5.40Source:
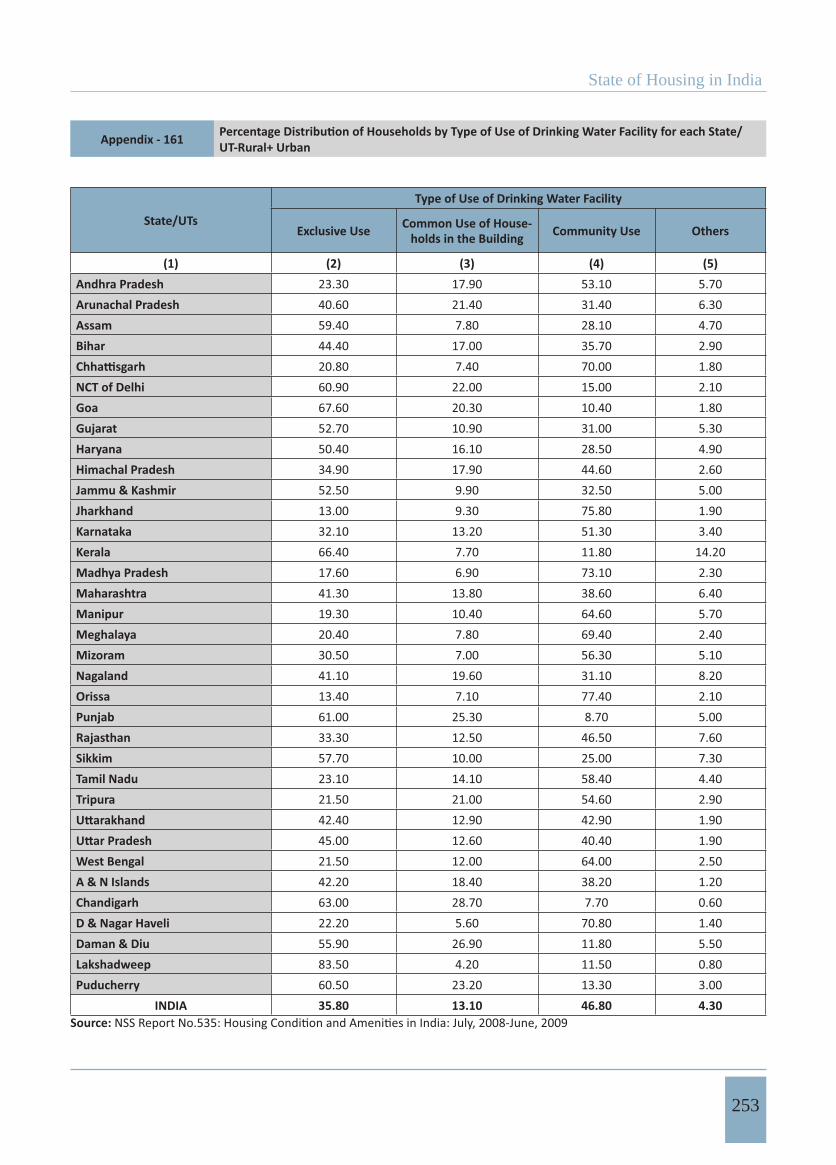
State of Housing in India
253
Appendix - 161 UT-Rural+ Urban
State/UTs
Type of Use of Drinking Water Facility
Exclusive Use Common Use of House-holds in the Building Community Use Others
(1) (2) (3) (4) (5)Andhra Pradesh 23.30 17.90 53.10 5.70Arunachal Pradesh 40.60 21.40 31.40 6.30Assam 59.40 7.80 28.10 4.70Bihar 44.40 17.00 35.70 2.90
20.80 7.40 70.00 1.80NCT of Delhi 60.90 22.00 15.00 2.10Goa 67.60 20.30 10.40 1.80Gujarat 52.70 10.90 31.00 5.30Haryana 50.40 16.10 28.50 4.90Himachal Pradesh 34.90 17.90 44.60 2.60Jammu & Kashmir 52.50 9.90 32.50 5.00Jharkhand 13.00 9.30 75.80 1.90Karnataka 32.10 13.20 51.30 3.40Kerala 66.40 7.70 11.80 14.20Madhya Pradesh 17.60 6.90 73.10 2.30Maharashtra 41.30 13.80 38.60 6.40Manipur 19.30 10.40 64.60 5.70Meghalaya 20.40 7.80 69.40 2.40Mizoram 30.50 7.00 56.30 5.10Nagaland 41.10 19.60 31.10 8.20Orissa 13.40 7.10 77.40 2.10Punjab 61.00 25.30 8.70 5.00Rajasthan 33.30 12.50 46.50 7.60Sikkim 57.70 10.00 25.00 7.30Tamil Nadu 23.10 14.10 58.40 4.40Tripura 21.50 21.00 54.60 2.90
42.40 12.90 42.90 1.9045.00 12.60 40.40 1.90
West Bengal 21.50 12.00 64.00 2.50A & N Islands 42.20 18.40 38.20 1.20Chandigarh 63.00 28.70 7.70 0.60D & Nagar Haveli 22.20 5.60 70.80 1.40Daman & Diu 55.90 26.90 11.80 5.50Lakshadweep 83.50 4.20 11.50 0.80Puducherry 60.50 23.20 13.30 3.00
INDIA 35.80 13.10 46.80 4.30Source:
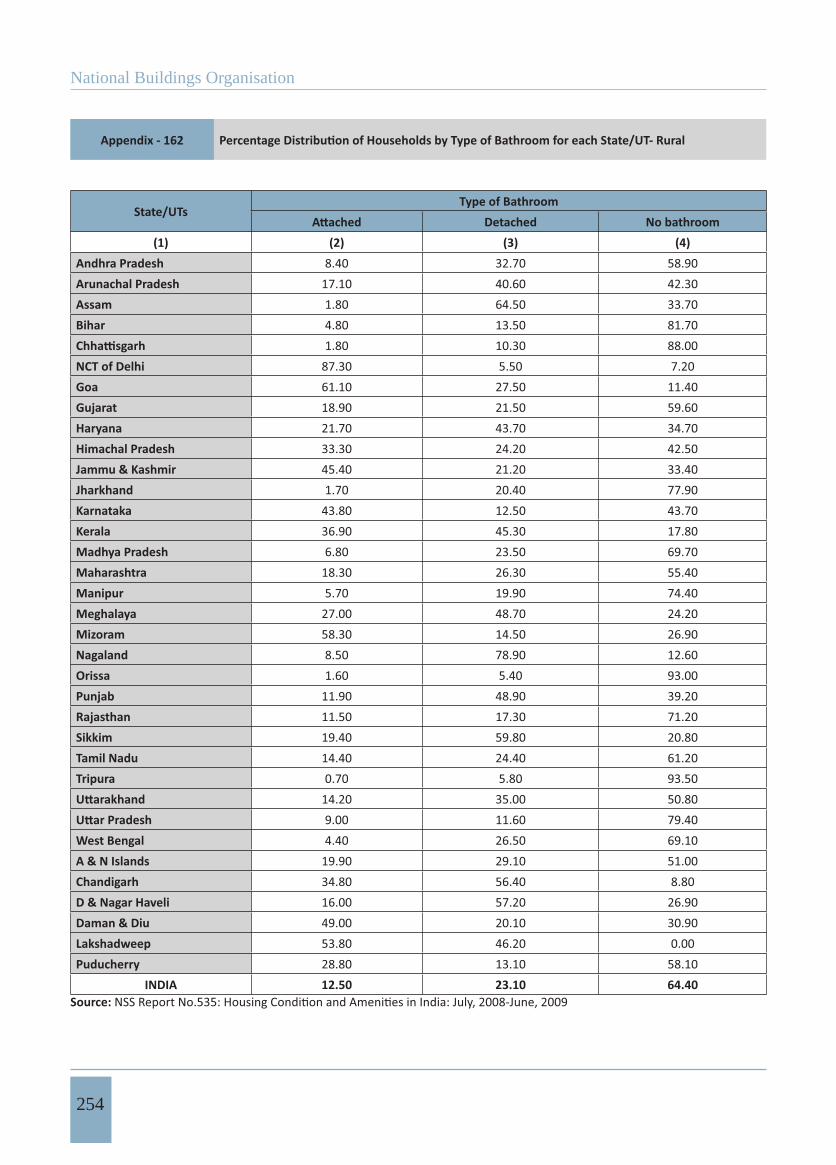
National Buildings Organisation
254
Appendix - 162
State/UTsType of Bathroom
Detached No bathroom(1) (2) (3) (4)
Andhra Pradesh 8.40 32.70 58.90Arunachal Pradesh 17.10 40.60 42.30Assam 1.80 64.50 33.70Bihar 4.80 13.50 81.70
1.80 10.30 88.00NCT of Delhi 87.30 5.50 7.20Goa 61.10 27.50 11.40Gujarat 18.90 21.50 59.60Haryana 21.70 43.70 34.70Himachal Pradesh 33.30 24.20 42.50Jammu & Kashmir 45.40 21.20 33.40Jharkhand 1.70 20.40 77.90Karnataka 43.80 12.50 43.70Kerala 36.90 45.30 17.80Madhya Pradesh 6.80 23.50 69.70Maharashtra 18.30 26.30 55.40Manipur 5.70 19.90 74.40Meghalaya 27.00 48.70 24.20Mizoram 58.30 14.50 26.90Nagaland 8.50 78.90 12.60Orissa 1.60 5.40 93.00Punjab 11.90 48.90 39.20Rajasthan 11.50 17.30 71.20Sikkim 19.40 59.80 20.80Tamil Nadu 14.40 24.40 61.20Tripura 0.70 5.80 93.50
14.20 35.00 50.809.00 11.60 79.40
West Bengal 4.40 26.50 69.10A & N Islands 19.90 29.10 51.00Chandigarh 34.80 56.40 8.80D & Nagar Haveli 16.00 57.20 26.90Daman & Diu 49.00 20.10 30.90Lakshadweep 53.80 46.20 0.00Puducherry 28.80 13.10 58.10
INDIA 12.50 23.10 64.40Source:
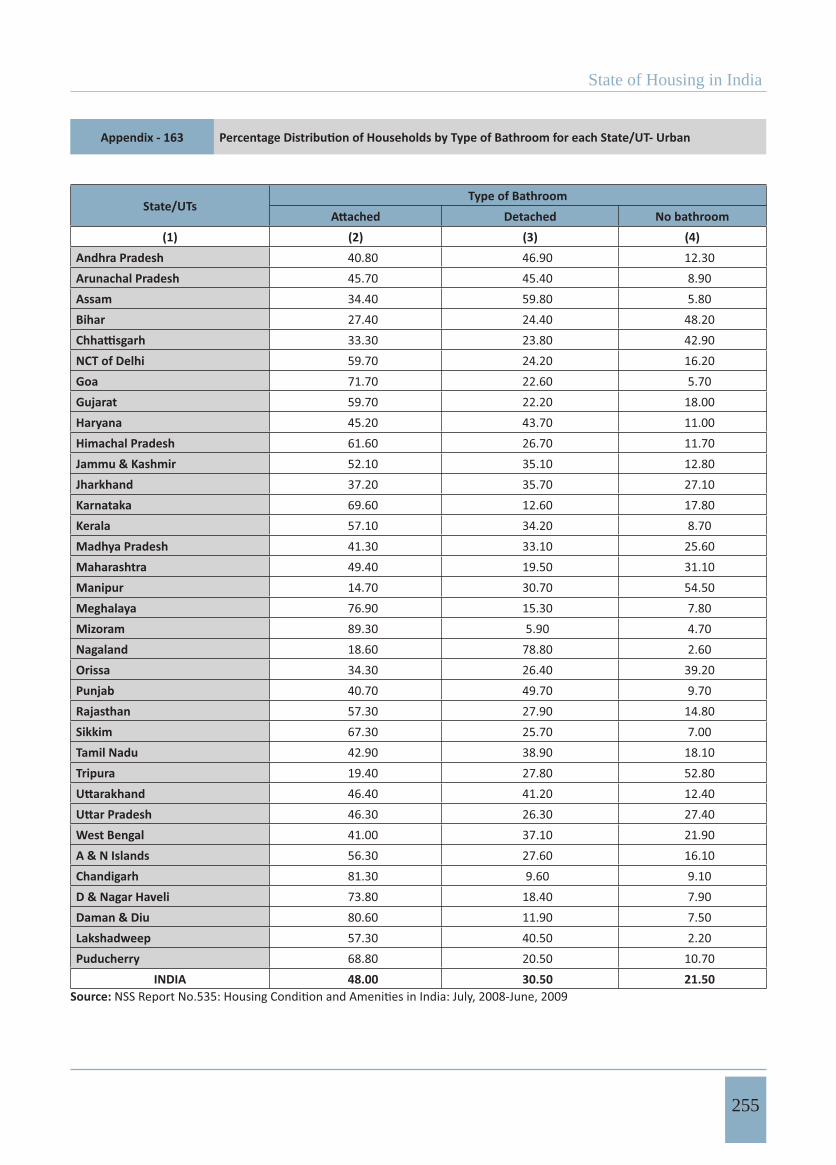
State of Housing in India
255
Appendix - 163
State/UTsType of Bathroom
Detached No bathroom(1) (2) (3) (4)
Andhra Pradesh 40.80 46.90 12.30Arunachal Pradesh 45.70 45.40 8.90Assam 34.40 59.80 5.80Bihar 27.40 24.40 48.20
33.30 23.80 42.90NCT of Delhi 59.70 24.20 16.20Goa 71.70 22.60 5.70Gujarat 59.70 22.20 18.00Haryana 45.20 43.70 11.00Himachal Pradesh 61.60 26.70 11.70Jammu & Kashmir 52.10 35.10 12.80Jharkhand 37.20 35.70 27.10Karnataka 69.60 12.60 17.80Kerala 57.10 34.20 8.70Madhya Pradesh 41.30 33.10 25.60Maharashtra 49.40 19.50 31.10Manipur 14.70 30.70 54.50Meghalaya 76.90 15.30 7.80Mizoram 89.30 5.90 4.70Nagaland 18.60 78.80 2.60Orissa 34.30 26.40 39.20Punjab 40.70 49.70 9.70Rajasthan 57.30 27.90 14.80Sikkim 67.30 25.70 7.00Tamil Nadu 42.90 38.90 18.10Tripura 19.40 27.80 52.80
46.40 41.20 12.4046.30 26.30 27.40
West Bengal 41.00 37.10 21.90A & N Islands 56.30 27.60 16.10Chandigarh 81.30 9.60 9.10D & Nagar Haveli 73.80 18.40 7.90Daman & Diu 80.60 11.90 7.50Lakshadweep 57.30 40.50 2.20Puducherry 68.80 20.50 10.70
INDIA 48.00 30.50 21.50Source:
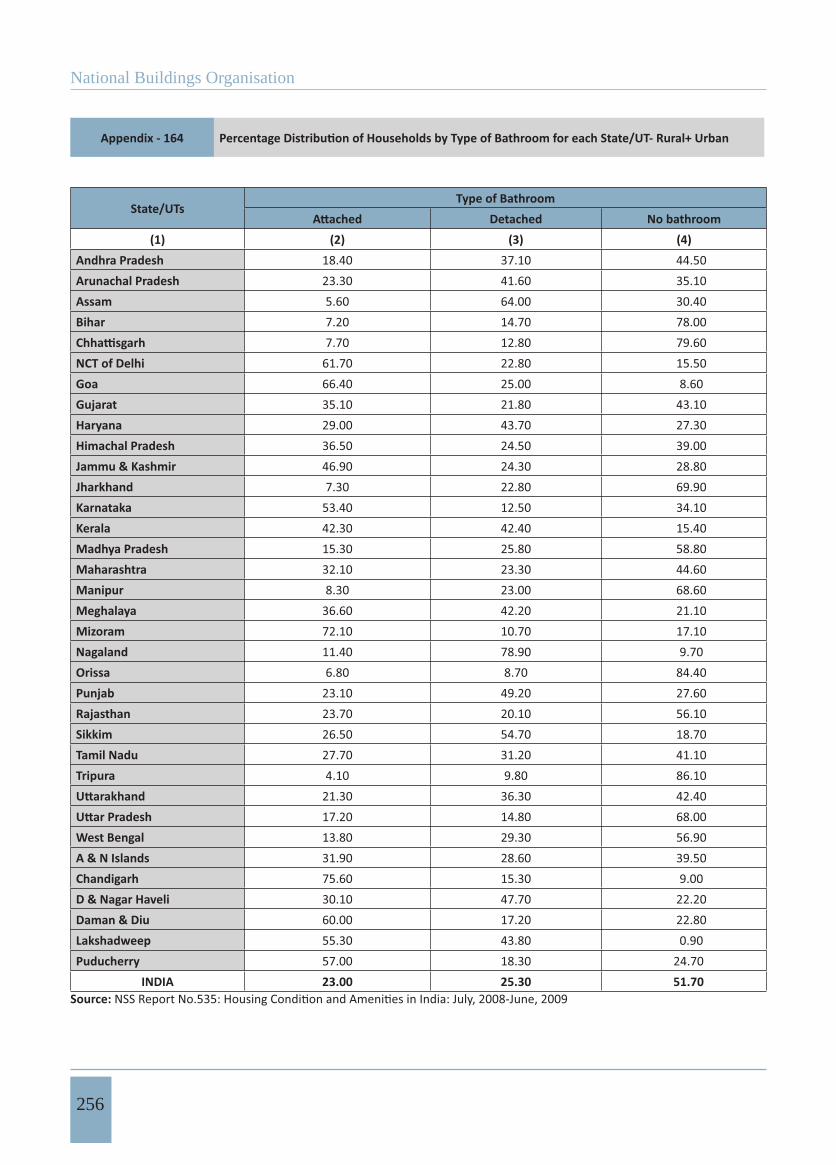
National Buildings Organisation
256
Appendix - 164
State/UTsType of Bathroom
Detached No bathroom(1) (2) (3) (4)
Andhra Pradesh 18.40 37.10 44.50Arunachal Pradesh 23.30 41.60 35.10Assam 5.60 64.00 30.40Bihar 7.20 14.70 78.00
7.70 12.80 79.60NCT of Delhi 61.70 22.80 15.50Goa 66.40 25.00 8.60Gujarat 35.10 21.80 43.10Haryana 29.00 43.70 27.30Himachal Pradesh 36.50 24.50 39.00Jammu & Kashmir 46.90 24.30 28.80Jharkhand 7.30 22.80 69.90Karnataka 53.40 12.50 34.10Kerala 42.30 42.40 15.40Madhya Pradesh 15.30 25.80 58.80Maharashtra 32.10 23.30 44.60Manipur 8.30 23.00 68.60Meghalaya 36.60 42.20 21.10Mizoram 72.10 10.70 17.10Nagaland 11.40 78.90 9.70Orissa 6.80 8.70 84.40Punjab 23.10 49.20 27.60Rajasthan 23.70 20.10 56.10Sikkim 26.50 54.70 18.70Tamil Nadu 27.70 31.20 41.10Tripura 4.10 9.80 86.10
21.30 36.30 42.4017.20 14.80 68.00
West Bengal 13.80 29.30 56.90A & N Islands 31.90 28.60 39.50Chandigarh 75.60 15.30 9.00D & Nagar Haveli 30.10 47.70 22.20Daman & Diu 60.00 17.20 22.80Lakshadweep 55.30 43.80 0.90Puducherry 57.00 18.30 24.70
INDIA 23.00 25.30 51.70Source:
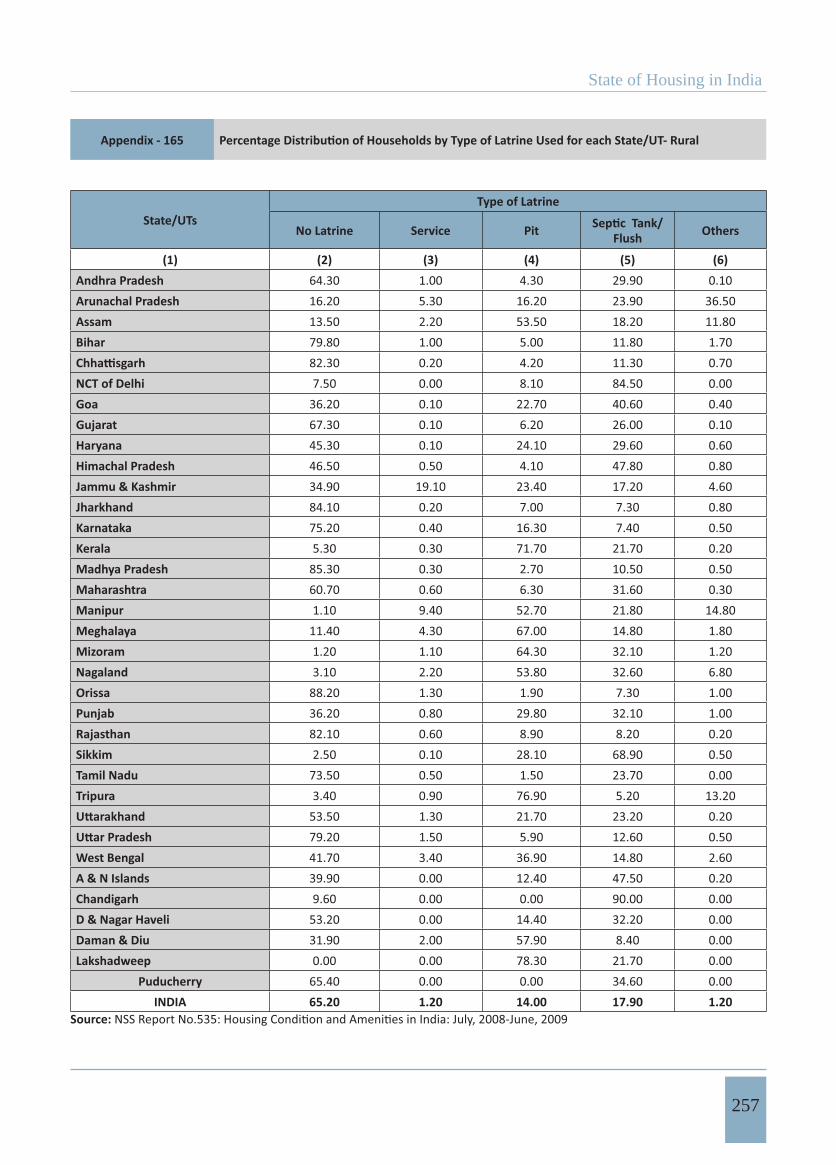
State of Housing in India
257
Appendix - 165
State/UTsType of Latrine
No Latrine Service Pit Flush Others
(1) (2) (3) (4) (5) (6)Andhra Pradesh 64.30 1.00 4.30 29.90 0.10Arunachal Pradesh 16.20 5.30 16.20 23.90 36.50Assam 13.50 2.20 53.50 18.20 11.80Bihar 79.80 1.00 5.00 11.80 1.70
82.30 0.20 4.20 11.30 0.70NCT of Delhi 7.50 0.00 8.10 84.50 0.00Goa 36.20 0.10 22.70 40.60 0.40Gujarat 67.30 0.10 6.20 26.00 0.10Haryana 45.30 0.10 24.10 29.60 0.60Himachal Pradesh 46.50 0.50 4.10 47.80 0.80Jammu & Kashmir 34.90 19.10 23.40 17.20 4.60Jharkhand 84.10 0.20 7.00 7.30 0.80Karnataka 75.20 0.40 16.30 7.40 0.50Kerala 5.30 0.30 71.70 21.70 0.20Madhya Pradesh 85.30 0.30 2.70 10.50 0.50Maharashtra 60.70 0.60 6.30 31.60 0.30Manipur 1.10 9.40 52.70 21.80 14.80Meghalaya 11.40 4.30 67.00 14.80 1.80Mizoram 1.20 1.10 64.30 32.10 1.20Nagaland 3.10 2.20 53.80 32.60 6.80Orissa 88.20 1.30 1.90 7.30 1.00Punjab 36.20 0.80 29.80 32.10 1.00Rajasthan 82.10 0.60 8.90 8.20 0.20Sikkim 2.50 0.10 28.10 68.90 0.50Tamil Nadu 73.50 0.50 1.50 23.70 0.00Tripura 3.40 0.90 76.90 5.20 13.20
53.50 1.30 21.70 23.20 0.2079.20 1.50 5.90 12.60 0.50
West Bengal 41.70 3.40 36.90 14.80 2.60A & N Islands 39.90 0.00 12.40 47.50 0.20Chandigarh 9.60 0.00 0.00 90.00 0.00D & Nagar Haveli 53.20 0.00 14.40 32.20 0.00Daman & Diu 31.90 2.00 57.90 8.40 0.00Lakshadweep 0.00 0.00 78.30 21.70 0.00
Puducherry 65.40 0.00 0.00 34.60 0.00INDIA 65.20 1.20 14.00 17.90 1.20
Source:
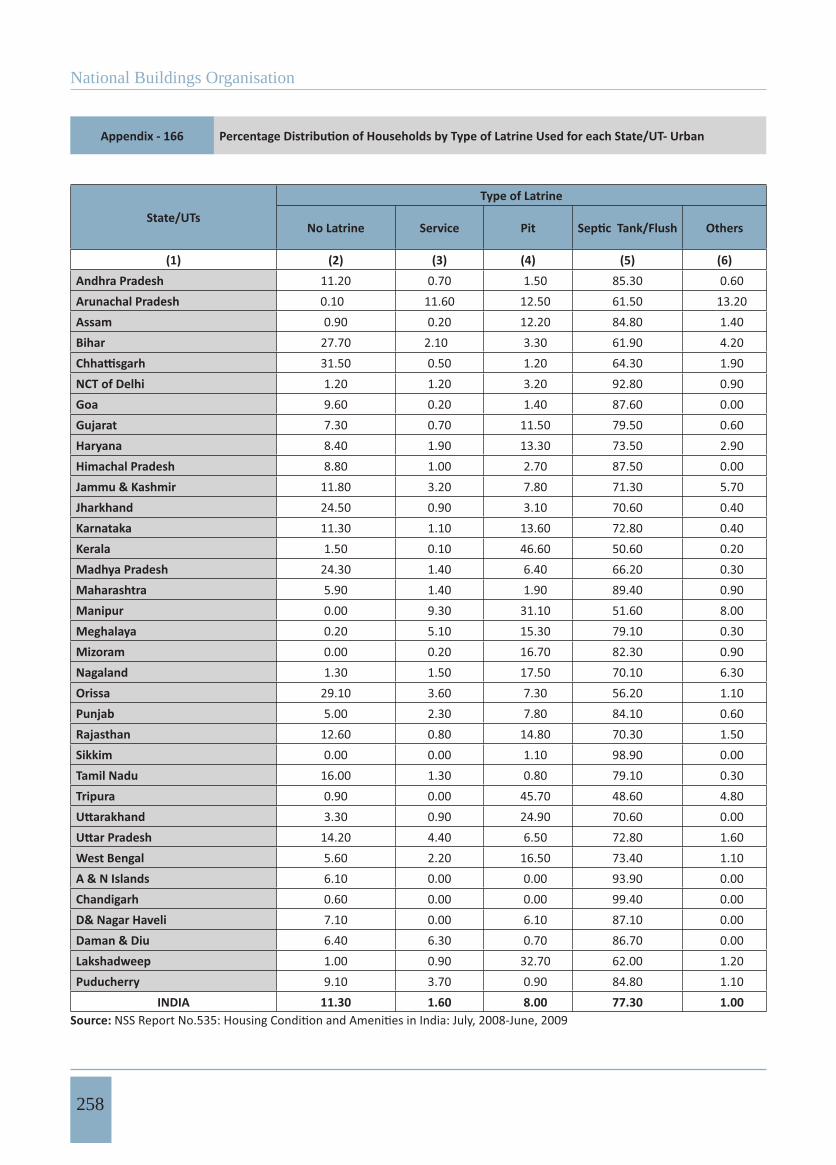
National Buildings Organisation
258
Appendix - 166
State/UTs
Type of Latrine
No Latrine Service Pit Others
(1) (2) (3) (4) (5) (6)Andhra Pradesh 11.20 0.70 1.50 85.30 0.60Arunachal Pradesh 0.10 11.60 12.50 61.50 13.20Assam 0.90 0.20 12.20 84.80 1.40Bihar 27.70 2.10 3.30 61.90 4.20
31.50 0.50 1.20 64.30 1.90NCT of Delhi 1.20 1.20 3.20 92.80 0.90Goa 9.60 0.20 1.40 87.60 0.00Gujarat 7.30 0.70 11.50 79.50 0.60Haryana 8.40 1.90 13.30 73.50 2.90Himachal Pradesh 8.80 1.00 2.70 87.50 0.00Jammu & Kashmir 11.80 3.20 7.80 71.30 5.70Jharkhand 24.50 0.90 3.10 70.60 0.40Karnataka 11.30 1.10 13.60 72.80 0.40Kerala 1.50 0.10 46.60 50.60 0.20Madhya Pradesh 24.30 1.40 6.40 66.20 0.30Maharashtra 5.90 1.40 1.90 89.40 0.90Manipur 0.00 9.30 31.10 51.60 8.00Meghalaya 0.20 5.10 15.30 79.10 0.30Mizoram 0.00 0.20 16.70 82.30 0.90Nagaland 1.30 1.50 17.50 70.10 6.30Orissa 29.10 3.60 7.30 56.20 1.10Punjab 5.00 2.30 7.80 84.10 0.60Rajasthan 12.60 0.80 14.80 70.30 1.50Sikkim 0.00 0.00 1.10 98.90 0.00Tamil Nadu 16.00 1.30 0.80 79.10 0.30Tripura 0.90 0.00 45.70 48.60 4.80
3.30 0.90 24.90 70.60 0.0014.20 4.40 6.50 72.80 1.60
West Bengal 5.60 2.20 16.50 73.40 1.10A & N Islands 6.10 0.00 0.00 93.90 0.00Chandigarh 0.60 0.00 0.00 99.40 0.00D& Nagar Haveli 7.10 0.00 6.10 87.10 0.00Daman & Diu 6.40 6.30 0.70 86.70 0.00Lakshadweep 1.00 0.90 32.70 62.00 1.20Puducherry 9.10 3.70 0.90 84.80 1.10
INDIA 11.30 1.60 8.00 77.30 1.00Source:
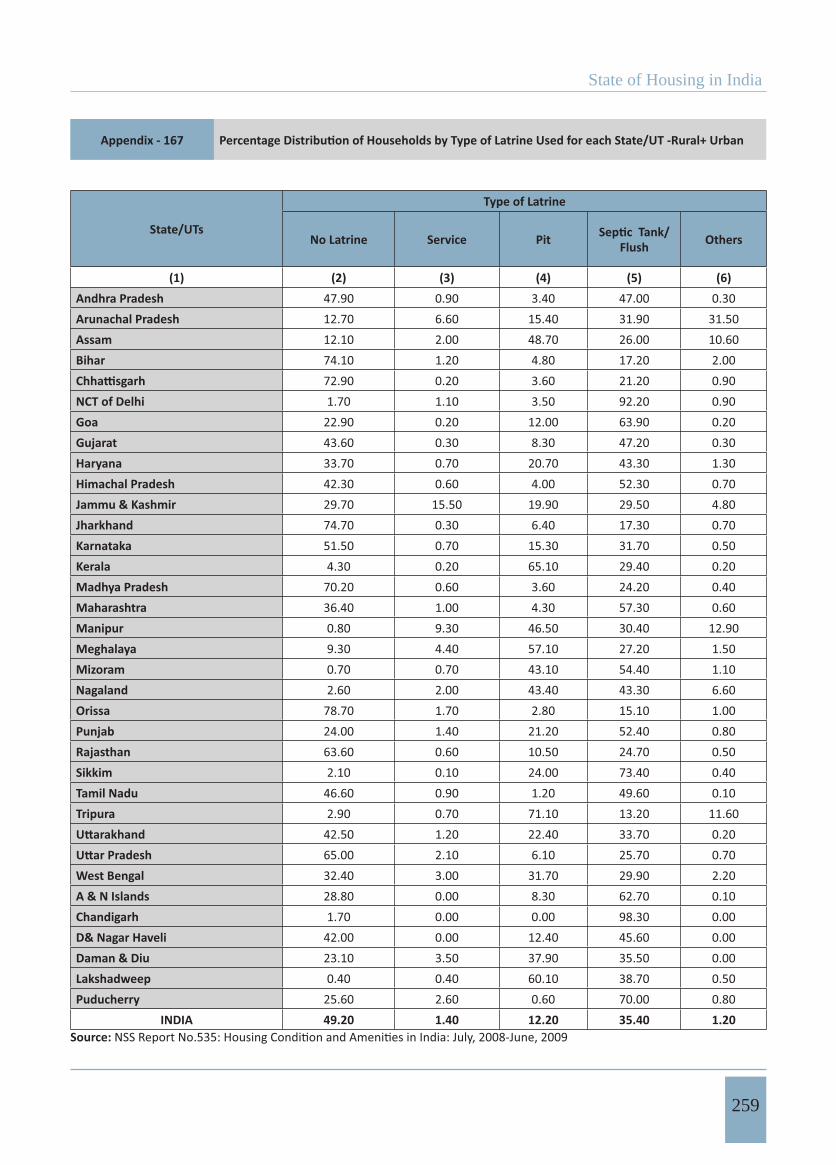
State of Housing in India
259
Appendix - 167
State/UTs
Type of Latrine
No Latrine Service Pit Flush Others
(1) (2) (3) (4) (5) (6)Andhra Pradesh 47.90 0.90 3.40 47.00 0.30Arunachal Pradesh 12.70 6.60 15.40 31.90 31.50Assam 12.10 2.00 48.70 26.00 10.60Bihar 74.10 1.20 4.80 17.20 2.00
72.90 0.20 3.60 21.20 0.90NCT of Delhi 1.70 1.10 3.50 92.20 0.90Goa 22.90 0.20 12.00 63.90 0.20Gujarat 43.60 0.30 8.30 47.20 0.30Haryana 33.70 0.70 20.70 43.30 1.30Himachal Pradesh 42.30 0.60 4.00 52.30 0.70Jammu & Kashmir 29.70 15.50 19.90 29.50 4.80Jharkhand 74.70 0.30 6.40 17.30 0.70Karnataka 51.50 0.70 15.30 31.70 0.50Kerala 4.30 0.20 65.10 29.40 0.20Madhya Pradesh 70.20 0.60 3.60 24.20 0.40Maharashtra 36.40 1.00 4.30 57.30 0.60Manipur 0.80 9.30 46.50 30.40 12.90Meghalaya 9.30 4.40 57.10 27.20 1.50Mizoram 0.70 0.70 43.10 54.40 1.10Nagaland 2.60 2.00 43.40 43.30 6.60Orissa 78.70 1.70 2.80 15.10 1.00Punjab 24.00 1.40 21.20 52.40 0.80Rajasthan 63.60 0.60 10.50 24.70 0.50Sikkim 2.10 0.10 24.00 73.40 0.40Tamil Nadu 46.60 0.90 1.20 49.60 0.10Tripura 2.90 0.70 71.10 13.20 11.60
42.50 1.20 22.40 33.70 0.2065.00 2.10 6.10 25.70 0.70
West Bengal 32.40 3.00 31.70 29.90 2.20A & N Islands 28.80 0.00 8.30 62.70 0.10Chandigarh 1.70 0.00 0.00 98.30 0.00D& Nagar Haveli 42.00 0.00 12.40 45.60 0.00Daman & Diu 23.10 3.50 37.90 35.50 0.00Lakshadweep 0.40 0.40 60.10 38.70 0.50Puducherry 25.60 2.60 0.60 70.00 0.80
INDIA 49.20 1.40 12.20 35.40 1.20Source:
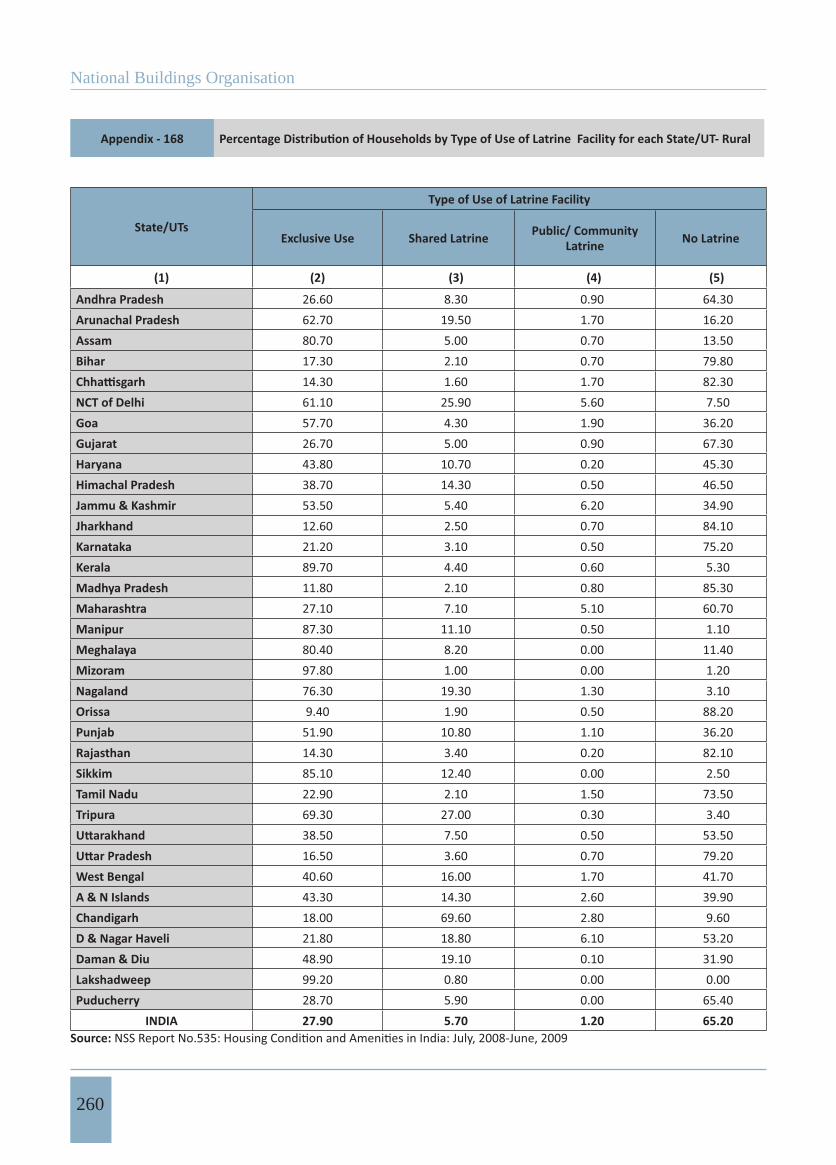
National Buildings Organisation
260
Appendix - 168
State/UTs
Type of Use of Latrine Facility
Exclusive Use Shared Latrine Public/ Community Latrine No Latrine
(1) (2) (3) (4) (5)
Andhra Pradesh 26.60 8.30 0.90 64.30Arunachal Pradesh 62.70 19.50 1.70 16.20Assam 80.70 5.00 0.70 13.50Bihar 17.30 2.10 0.70 79.80
14.30 1.60 1.70 82.30NCT of Delhi 61.10 25.90 5.60 7.50Goa 57.70 4.30 1.90 36.20Gujarat 26.70 5.00 0.90 67.30Haryana 43.80 10.70 0.20 45.30Himachal Pradesh 38.70 14.30 0.50 46.50Jammu & Kashmir 53.50 5.40 6.20 34.90Jharkhand 12.60 2.50 0.70 84.10Karnataka 21.20 3.10 0.50 75.20Kerala 89.70 4.40 0.60 5.30Madhya Pradesh 11.80 2.10 0.80 85.30Maharashtra 27.10 7.10 5.10 60.70Manipur 87.30 11.10 0.50 1.10Meghalaya 80.40 8.20 0.00 11.40Mizoram 97.80 1.00 0.00 1.20Nagaland 76.30 19.30 1.30 3.10Orissa 9.40 1.90 0.50 88.20Punjab 51.90 10.80 1.10 36.20Rajasthan 14.30 3.40 0.20 82.10Sikkim 85.10 12.40 0.00 2.50Tamil Nadu 22.90 2.10 1.50 73.50Tripura 69.30 27.00 0.30 3.40
38.50 7.50 0.50 53.5016.50 3.60 0.70 79.20
West Bengal 40.60 16.00 1.70 41.70A & N Islands 43.30 14.30 2.60 39.90Chandigarh 18.00 69.60 2.80 9.60D & Nagar Haveli 21.80 18.80 6.10 53.20Daman & Diu 48.90 19.10 0.10 31.90Lakshadweep 99.20 0.80 0.00 0.00Puducherry 28.70 5.90 0.00 65.40
INDIA 27.90 5.70 1.20 65.20Source:
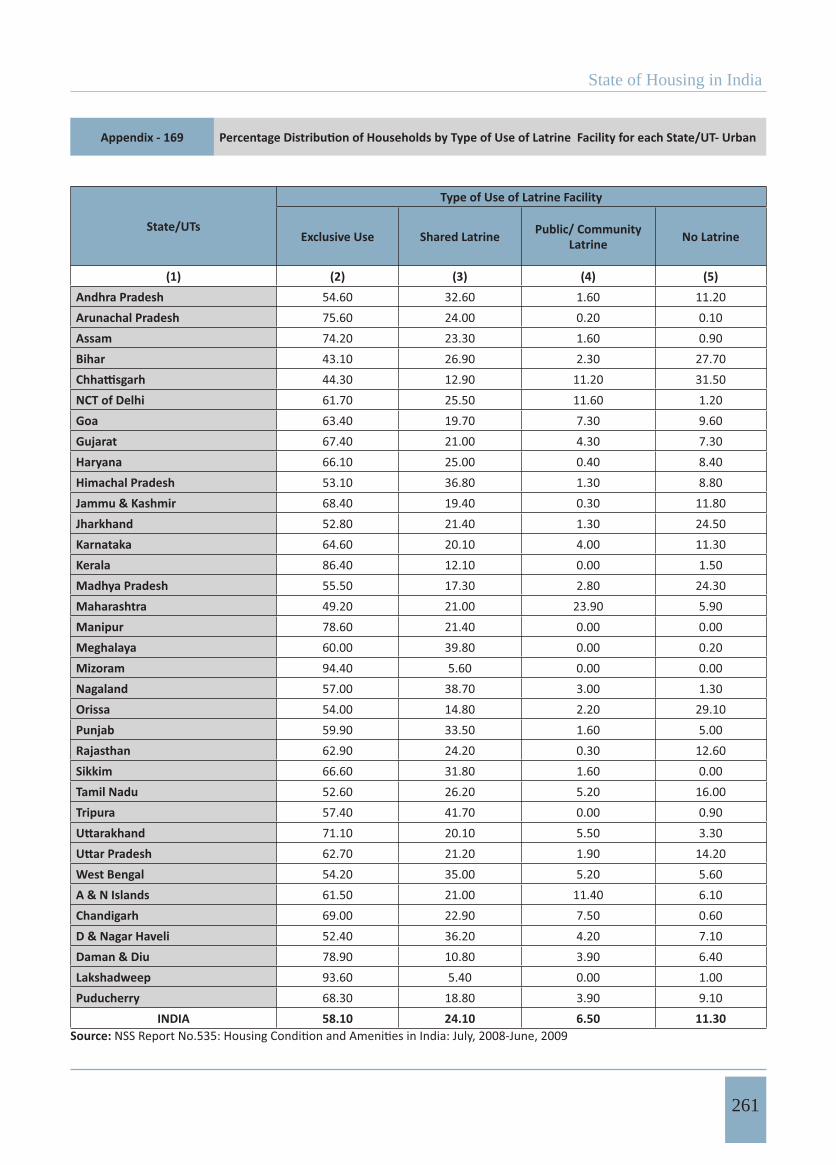
State of Housing in India
261
Appendix - 169
State/UTs
Type of Use of Latrine Facility
Exclusive Use Shared Latrine Public/ Community Latrine No Latrine
(1) (2) (3) (4) (5)Andhra Pradesh 54.60 32.60 1.60 11.20Arunachal Pradesh 75.60 24.00 0.20 0.10Assam 74.20 23.30 1.60 0.90Bihar 43.10 26.90 2.30 27.70
44.30 12.90 11.20 31.50NCT of Delhi 61.70 25.50 11.60 1.20Goa 63.40 19.70 7.30 9.60Gujarat 67.40 21.00 4.30 7.30Haryana 66.10 25.00 0.40 8.40Himachal Pradesh 53.10 36.80 1.30 8.80Jammu & Kashmir 68.40 19.40 0.30 11.80Jharkhand 52.80 21.40 1.30 24.50Karnataka 64.60 20.10 4.00 11.30Kerala 86.40 12.10 0.00 1.50Madhya Pradesh 55.50 17.30 2.80 24.30Maharashtra 49.20 21.00 23.90 5.90Manipur 78.60 21.40 0.00 0.00Meghalaya 60.00 39.80 0.00 0.20Mizoram 94.40 5.60 0.00 0.00Nagaland 57.00 38.70 3.00 1.30Orissa 54.00 14.80 2.20 29.10Punjab 59.90 33.50 1.60 5.00Rajasthan 62.90 24.20 0.30 12.60Sikkim 66.60 31.80 1.60 0.00Tamil Nadu 52.60 26.20 5.20 16.00Tripura 57.40 41.70 0.00 0.90
71.10 20.10 5.50 3.3062.70 21.20 1.90 14.20
West Bengal 54.20 35.00 5.20 5.60A & N Islands 61.50 21.00 11.40 6.10Chandigarh 69.00 22.90 7.50 0.60D & Nagar Haveli 52.40 36.20 4.20 7.10Daman & Diu 78.90 10.80 3.90 6.40Lakshadweep 93.60 5.40 0.00 1.00Puducherry 68.30 18.80 3.90 9.10
INDIA 58.10 24.10 6.50 11.30Source:
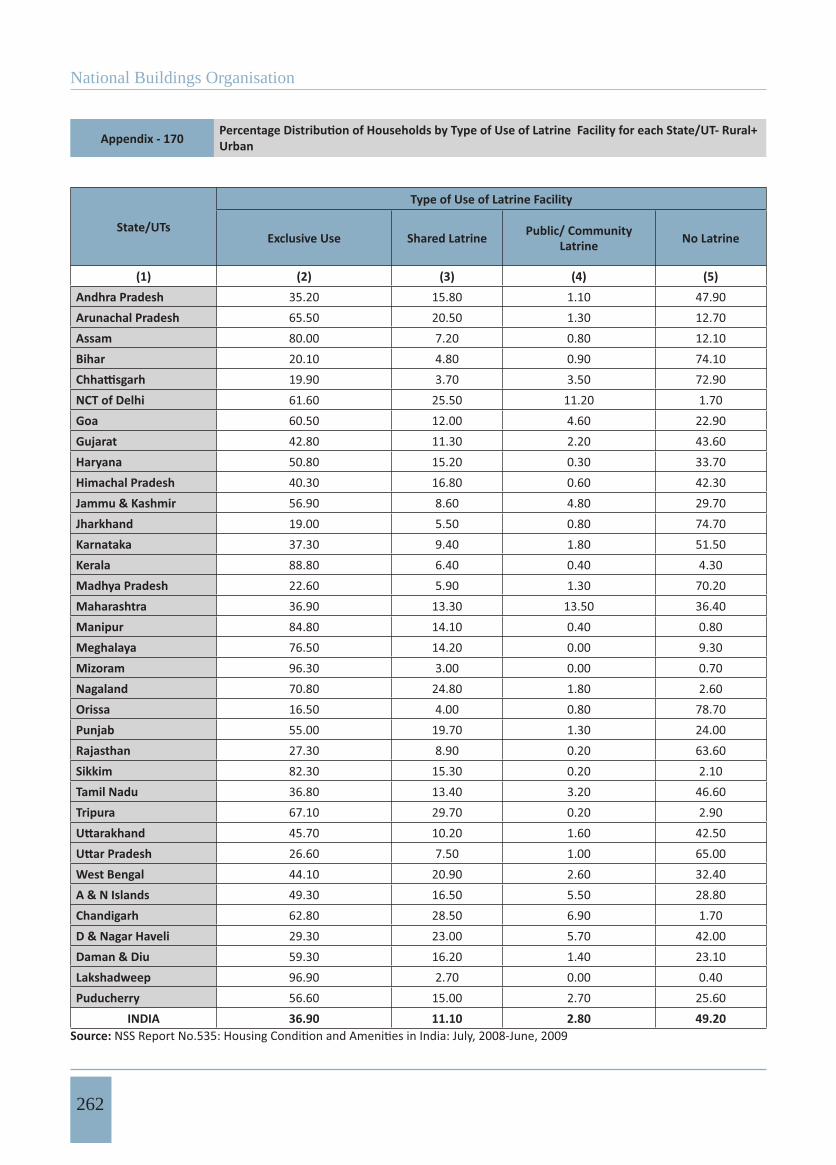
National Buildings Organisation
262
Appendix - 170 Urban
State/UTs
Type of Use of Latrine Facility
Exclusive Use Shared Latrine Public/ Community Latrine No Latrine
(1) (2) (3) (4) (5)Andhra Pradesh 35.20 15.80 1.10 47.90Arunachal Pradesh 65.50 20.50 1.30 12.70Assam 80.00 7.20 0.80 12.10Bihar 20.10 4.80 0.90 74.10
19.90 3.70 3.50 72.90NCT of Delhi 61.60 25.50 11.20 1.70Goa 60.50 12.00 4.60 22.90Gujarat 42.80 11.30 2.20 43.60Haryana 50.80 15.20 0.30 33.70Himachal Pradesh 40.30 16.80 0.60 42.30Jammu & Kashmir 56.90 8.60 4.80 29.70Jharkhand 19.00 5.50 0.80 74.70Karnataka 37.30 9.40 1.80 51.50Kerala 88.80 6.40 0.40 4.30Madhya Pradesh 22.60 5.90 1.30 70.20Maharashtra 36.90 13.30 13.50 36.40Manipur 84.80 14.10 0.40 0.80Meghalaya 76.50 14.20 0.00 9.30Mizoram 96.30 3.00 0.00 0.70Nagaland 70.80 24.80 1.80 2.60Orissa 16.50 4.00 0.80 78.70Punjab 55.00 19.70 1.30 24.00Rajasthan 27.30 8.90 0.20 63.60Sikkim 82.30 15.30 0.20 2.10Tamil Nadu 36.80 13.40 3.20 46.60Tripura 67.10 29.70 0.20 2.90
45.70 10.20 1.60 42.5026.60 7.50 1.00 65.00
West Bengal 44.10 20.90 2.60 32.40A & N Islands 49.30 16.50 5.50 28.80Chandigarh 62.80 28.50 6.90 1.70D & Nagar Haveli 29.30 23.00 5.70 42.00Daman & Diu 59.30 16.20 1.40 23.10Lakshadweep 96.90 2.70 0.00 0.40Puducherry 56.60 15.00 2.70 25.60
INDIA 36.90 11.10 2.80 49.20Source:
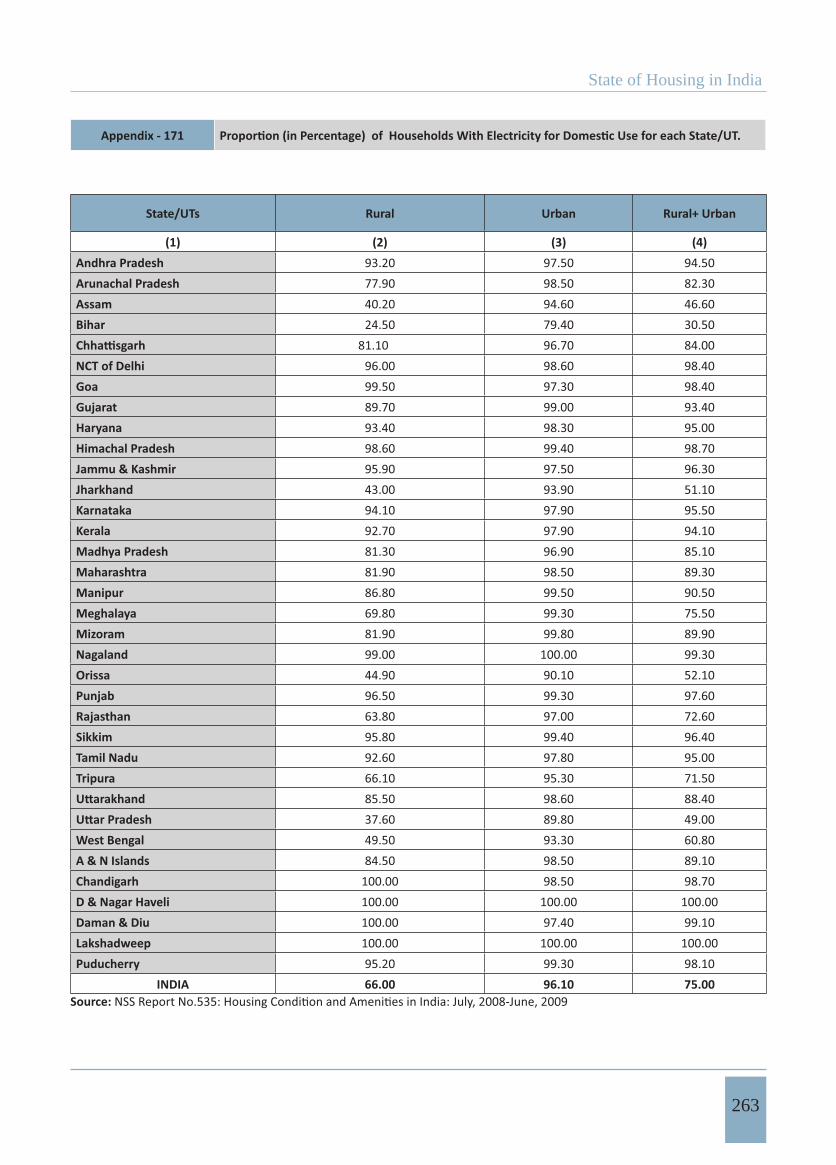
State of Housing in India
263
Appendix - 171
State/UTs Rural Urban Rural+ Urban
(1) (2) (3) (4)Andhra Pradesh 93.20 97.50 94.50Arunachal Pradesh 77.90 98.50 82.30Assam 40.20 94.60 46.60Bihar 24.50 79.40 30.50
81.10 96.70 84.00NCT of Delhi 96.00 98.60 98.40Goa 99.50 97.30 98.40Gujarat 89.70 99.00 93.40Haryana 93.40 98.30 95.00Himachal Pradesh 98.60 99.40 98.70Jammu & Kashmir 95.90 97.50 96.30Jharkhand 43.00 93.90 51.10Karnataka 94.10 97.90 95.50Kerala 92.70 97.90 94.10Madhya Pradesh 81.30 96.90 85.10Maharashtra 81.90 98.50 89.30Manipur 86.80 99.50 90.50Meghalaya 69.80 99.30 75.50Mizoram 81.90 99.80 89.90Nagaland 99.00 100.00 99.30Orissa 44.90 90.10 52.10Punjab 96.50 99.30 97.60Rajasthan 63.80 97.00 72.60Sikkim 95.80 99.40 96.40Tamil Nadu 92.60 97.80 95.00Tripura 66.10 95.30 71.50
85.50 98.60 88.4037.60 89.80 49.00
West Bengal 49.50 93.30 60.80A & N Islands 84.50 98.50 89.10Chandigarh 100.00 98.50 98.70D & Nagar Haveli 100.00 100.00 100.00Daman & Diu 100.00 97.40 99.10Lakshadweep 100.00 100.00 100.00Puducherry 95.20 99.30 98.10
INDIA 66.00 96.10 75.00Source:
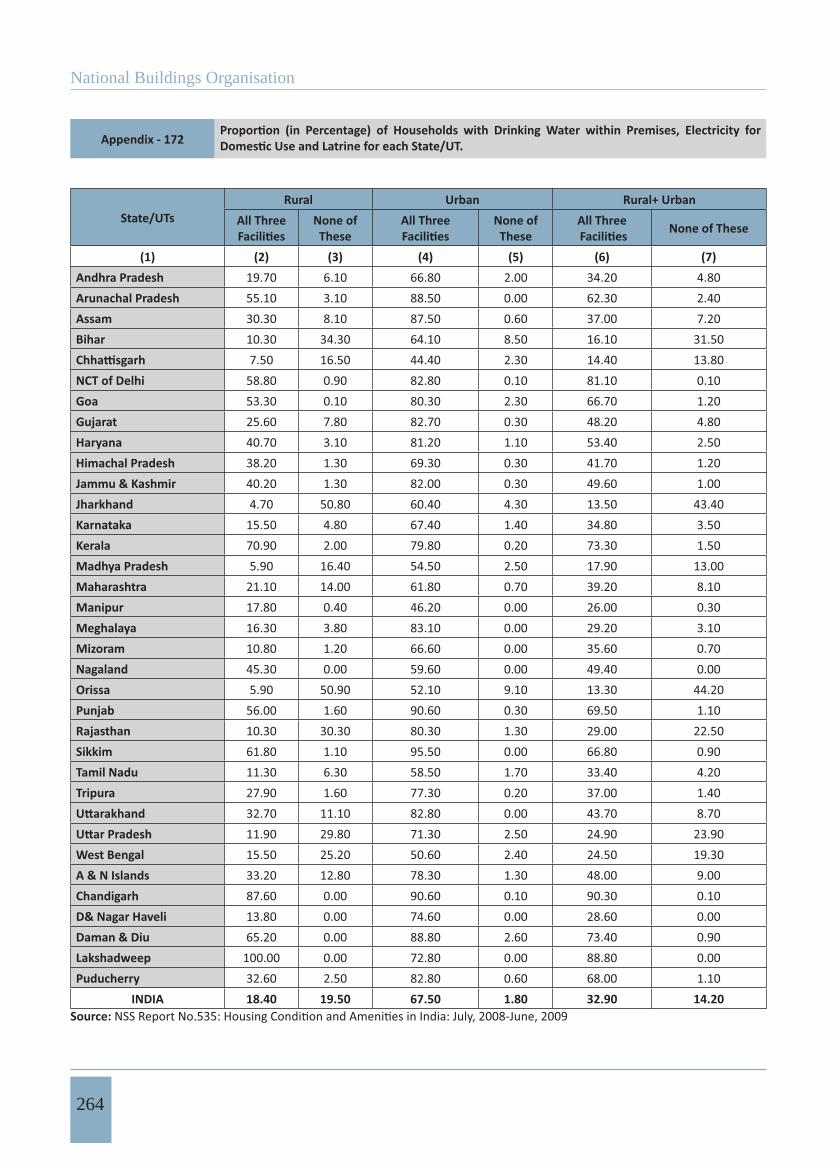
National Buildings Organisation
264
Appendix - 172
State/UTsRural Urban Rural+ Urban
All Three None of These
All Three None of These
All Three None of These
(1) (2) (3) (4) (5) (6) (7)Andhra Pradesh 19.70 6.10 66.80 2.00 34.20 4.80Arunachal Pradesh 55.10 3.10 88.50 0.00 62.30 2.40Assam 30.30 8.10 87.50 0.60 37.00 7.20Bihar 10.30 34.30 64.10 8.50 16.10 31.50
7.50 16.50 44.40 2.30 14.40 13.80NCT of Delhi 58.80 0.90 82.80 0.10 81.10 0.10Goa 53.30 0.10 80.30 2.30 66.70 1.20Gujarat 25.60 7.80 82.70 0.30 48.20 4.80Haryana 40.70 3.10 81.20 1.10 53.40 2.50Himachal Pradesh 38.20 1.30 69.30 0.30 41.70 1.20Jammu & Kashmir 40.20 1.30 82.00 0.30 49.60 1.00Jharkhand 4.70 50.80 60.40 4.30 13.50 43.40Karnataka 15.50 4.80 67.40 1.40 34.80 3.50Kerala 70.90 2.00 79.80 0.20 73.30 1.50Madhya Pradesh 5.90 16.40 54.50 2.50 17.90 13.00Maharashtra 21.10 14.00 61.80 0.70 39.20 8.10Manipur 17.80 0.40 46.20 0.00 26.00 0.30Meghalaya 16.30 3.80 83.10 0.00 29.20 3.10Mizoram 10.80 1.20 66.60 0.00 35.60 0.70Nagaland 45.30 0.00 59.60 0.00 49.40 0.00Orissa 5.90 50.90 52.10 9.10 13.30 44.20Punjab 56.00 1.60 90.60 0.30 69.50 1.10Rajasthan 10.30 30.30 80.30 1.30 29.00 22.50Sikkim 61.80 1.10 95.50 0.00 66.80 0.90Tamil Nadu 11.30 6.30 58.50 1.70 33.40 4.20Tripura 27.90 1.60 77.30 0.20 37.00 1.40
32.70 11.10 82.80 0.00 43.70 8.7011.90 29.80 71.30 2.50 24.90 23.90
West Bengal 15.50 25.20 50.60 2.40 24.50 19.30A & N Islands 33.20 12.80 78.30 1.30 48.00 9.00Chandigarh 87.60 0.00 90.60 0.10 90.30 0.10D& Nagar Haveli 13.80 0.00 74.60 0.00 28.60 0.00Daman & Diu 65.20 0.00 88.80 2.60 73.40 0.90Lakshadweep 100.00 0.00 72.80 0.00 88.80 0.00Puducherry 32.60 2.50 82.80 0.60 68.00 1.10
INDIA 18.40 19.50 67.50 1.80 32.90 14.20Source:
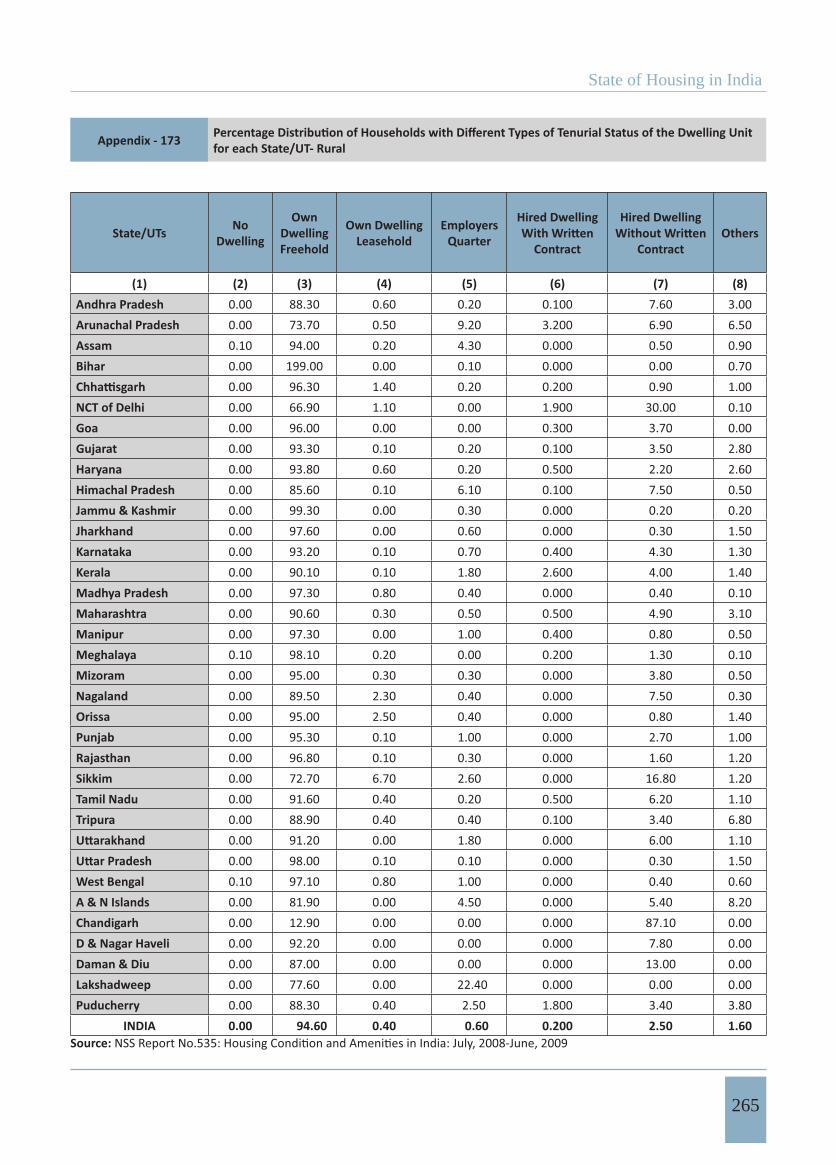
State of Housing in India
265
Appendix - 173 for each State/UT- Rural
State/UTs NoDwelling
OwnDwelling Freehold
Own Dwelling Leasehold
Employers Quarter
Hired Dwelling
Contract
Hired Dwelling
ContractOthers
(1) (2) (3) (4) (5) (6) (7) (8)Andhra Pradesh 0.00 88.30 0.60 0.20 0.100 7.60 3.00Arunachal Pradesh 0.00 73.70 0.50 9.20 3.200 6.90 6.50Assam 0.10 94.00 0.20 4.30 0.000 0.50 0.90Bihar 0.00 199.00 0.00 0.10 0.000 0.00 0.70
0.00 96.30 1.40 0.20 0.200 0.90 1.00NCT of Delhi 0.00 66.90 1.10 0.00 1.900 30.00 0.10Goa 0.00 96.00 0.00 0.00 0.300 3.70 0.00Gujarat 0.00 93.30 0.10 0.20 0.100 3.50 2.80Haryana 0.00 93.80 0.60 0.20 0.500 2.20 2.60Himachal Pradesh 0.00 85.60 0.10 6.10 0.100 7.50 0.50Jammu & Kashmir 0.00 99.30 0.00 0.30 0.000 0.20 0.20Jharkhand 0.00 97.60 0.00 0.60 0.000 0.30 1.50Karnataka 0.00 93.20 0.10 0.70 0.400 4.30 1.30Kerala 0.00 90.10 0.10 1.80 2.600 4.00 1.40Madhya Pradesh 0.00 97.30 0.80 0.40 0.000 0.40 0.10Maharashtra 0.00 90.60 0.30 0.50 0.500 4.90 3.10Manipur 0.00 97.30 0.00 1.00 0.400 0.80 0.50Meghalaya 0.10 98.10 0.20 0.00 0.200 1.30 0.10Mizoram 0.00 95.00 0.30 0.30 0.000 3.80 0.50Nagaland 0.00 89.50 2.30 0.40 0.000 7.50 0.30Orissa 0.00 95.00 2.50 0.40 0.000 0.80 1.40Punjab 0.00 95.30 0.10 1.00 0.000 2.70 1.00Rajasthan 0.00 96.80 0.10 0.30 0.000 1.60 1.20Sikkim 0.00 72.70 6.70 2.60 0.000 16.80 1.20Tamil Nadu 0.00 91.60 0.40 0.20 0.500 6.20 1.10Tripura 0.00 88.90 0.40 0.40 0.100 3.40 6.80
0.00 91.20 0.00 1.80 0.000 6.00 1.100.00 98.00 0.10 0.10 0.000 0.30 1.50
West Bengal 0.10 97.10 0.80 1.00 0.000 0.40 0.60A & N Islands 0.00 81.90 0.00 4.50 0.000 5.40 8.20Chandigarh 0.00 12.90 0.00 0.00 0.000 87.10 0.00D & Nagar Haveli 0.00 92.20 0.00 0.00 0.000 7.80 0.00Daman & Diu 0.00 87.00 0.00 0.00 0.000 13.00 0.00Lakshadweep 0.00 77.60 0.00 22.40 0.000 0.00 0.00Puducherry 0.00 88.30 0.40 2.50 1.800 3.40 3.80
INDIA 0.00 94.60 0.40 0.60 0.200 2.50 1.60Source:
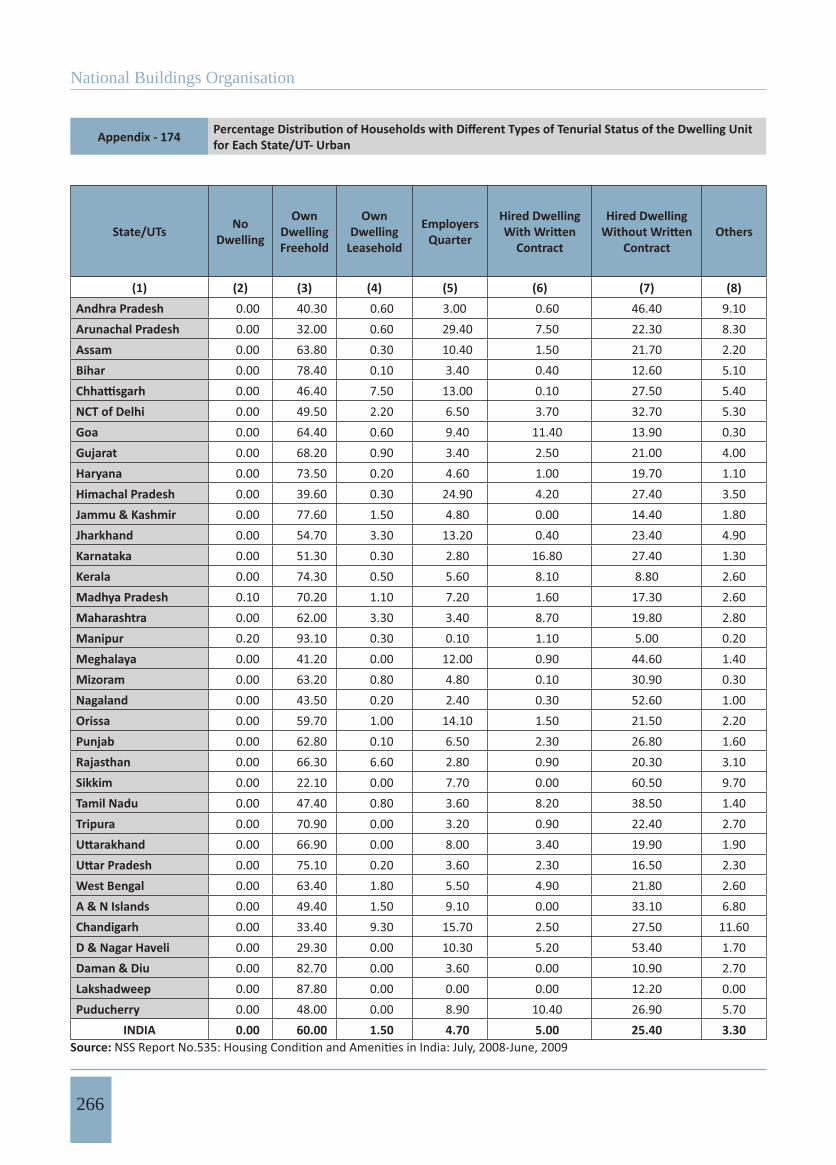
National Buildings Organisation
266
Appendix - 174 for Each State/UT- Urban
State/UTs NoDwelling
OwnDwelling Freehold
OwnDwelling
Leasehold
Employers Quarter
Hired Dwelling
Contract
Hired Dwelling
ContractOthers
(1) (2) (3) (4) (5) (6) (7) (8)Andhra Pradesh 0.00 40.30 0.60 3.00 0.60 46.40 9.10Arunachal Pradesh 0.00 32.00 0.60 29.40 7.50 22.30 8.30Assam 0.00 63.80 0.30 10.40 1.50 21.70 2.20Bihar 0.00 78.40 0.10 3.40 0.40 12.60 5.10
0.00 46.40 7.50 13.00 0.10 27.50 5.40NCT of Delhi 0.00 49.50 2.20 6.50 3.70 32.70 5.30Goa 0.00 64.40 0.60 9.40 11.40 13.90 0.30Gujarat 0.00 68.20 0.90 3.40 2.50 21.00 4.00Haryana 0.00 73.50 0.20 4.60 1.00 19.70 1.10Himachal Pradesh 0.00 39.60 0.30 24.90 4.20 27.40 3.50Jammu & Kashmir 0.00 77.60 1.50 4.80 0.00 14.40 1.80Jharkhand 0.00 54.70 3.30 13.20 0.40 23.40 4.90Karnataka 0.00 51.30 0.30 2.80 16.80 27.40 1.30Kerala 0.00 74.30 0.50 5.60 8.10 8.80 2.60Madhya Pradesh 0.10 70.20 1.10 7.20 1.60 17.30 2.60Maharashtra 0.00 62.00 3.30 3.40 8.70 19.80 2.80Manipur 0.20 93.10 0.30 0.10 1.10 5.00 0.20Meghalaya 0.00 41.20 0.00 12.00 0.90 44.60 1.40Mizoram 0.00 63.20 0.80 4.80 0.10 30.90 0.30Nagaland 0.00 43.50 0.20 2.40 0.30 52.60 1.00Orissa 0.00 59.70 1.00 14.10 1.50 21.50 2.20Punjab 0.00 62.80 0.10 6.50 2.30 26.80 1.60Rajasthan 0.00 66.30 6.60 2.80 0.90 20.30 3.10Sikkim 0.00 22.10 0.00 7.70 0.00 60.50 9.70Tamil Nadu 0.00 47.40 0.80 3.60 8.20 38.50 1.40Tripura 0.00 70.90 0.00 3.20 0.90 22.40 2.70
0.00 66.90 0.00 8.00 3.40 19.90 1.900.00 75.10 0.20 3.60 2.30 16.50 2.30
West Bengal 0.00 63.40 1.80 5.50 4.90 21.80 2.60A & N Islands 0.00 49.40 1.50 9.10 0.00 33.10 6.80Chandigarh 0.00 33.40 9.30 15.70 2.50 27.50 11.60D & Nagar Haveli 0.00 29.30 0.00 10.30 5.20 53.40 1.70Daman & Diu 0.00 82.70 0.00 3.60 0.00 10.90 2.70Lakshadweep 0.00 87.80 0.00 0.00 0.00 12.20 0.00Puducherry 0.00 48.00 0.00 8.90 10.40 26.90 5.70
INDIA 0.00 60.00 1.50 4.70 5.00 25.40 3.30Source:
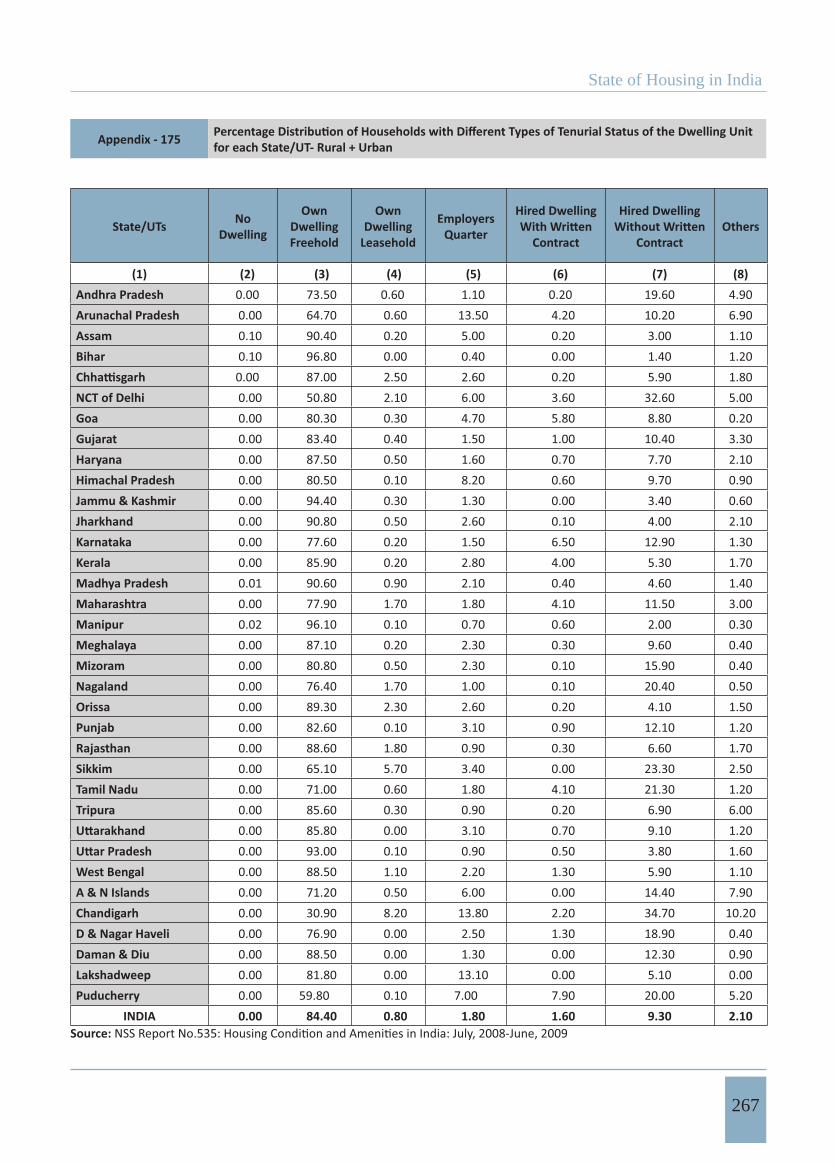
State of Housing in India
267
Appendix - 175 for each State/UT- Rural + Urban
State/UTs NoDwelling
OwnDwelling Freehold
OwnDwelling
Leasehold
Employers Quarter
Hired Dwelling
Contract
Hired Dwelling
ContractOthers
(1) (2) (3) (4) (5) (6) (7) (8)Andhra Pradesh 0.00 73.50 0.60 1.10 0.20 19.60 4.90Arunachal Pradesh 0.00 64.70 0.60 13.50 4.20 10.20 6.90Assam 0.10 90.40 0.20 5.00 0.20 3.00 1.10Bihar 0.10 96.80 0.00 0.40 0.00 1.40 1.20
0.00 87.00 2.50 2.60 0.20 5.90 1.80NCT of Delhi 0.00 50.80 2.10 6.00 3.60 32.60 5.00Goa 0.00 80.30 0.30 4.70 5.80 8.80 0.20Gujarat 0.00 83.40 0.40 1.50 1.00 10.40 3.30Haryana 0.00 87.50 0.50 1.60 0.70 7.70 2.10Himachal Pradesh 0.00 80.50 0.10 8.20 0.60 9.70 0.90Jammu & Kashmir 0.00 94.40 0.30 1.30 0.00 3.40 0.60Jharkhand 0.00 90.80 0.50 2.60 0.10 4.00 2.10Karnataka 0.00 77.60 0.20 1.50 6.50 12.90 1.30Kerala 0.00 85.90 0.20 2.80 4.00 5.30 1.70Madhya Pradesh 0.01 90.60 0.90 2.10 0.40 4.60 1.40Maharashtra 0.00 77.90 1.70 1.80 4.10 11.50 3.00Manipur 0.02 96.10 0.10 0.70 0.60 2.00 0.30Meghalaya 0.00 87.10 0.20 2.30 0.30 9.60 0.40Mizoram 0.00 80.80 0.50 2.30 0.10 15.90 0.40Nagaland 0.00 76.40 1.70 1.00 0.10 20.40 0.50Orissa 0.00 89.30 2.30 2.60 0.20 4.10 1.50Punjab 0.00 82.60 0.10 3.10 0.90 12.10 1.20Rajasthan 0.00 88.60 1.80 0.90 0.30 6.60 1.70Sikkim 0.00 65.10 5.70 3.40 0.00 23.30 2.50Tamil Nadu 0.00 71.00 0.60 1.80 4.10 21.30 1.20Tripura 0.00 85.60 0.30 0.90 0.20 6.90 6.00
0.00 85.80 0.00 3.10 0.70 9.10 1.200.00 93.00 0.10 0.90 0.50 3.80 1.60
West Bengal 0.00 88.50 1.10 2.20 1.30 5.90 1.10A & N Islands 0.00 71.20 0.50 6.00 0.00 14.40 7.90Chandigarh 0.00 30.90 8.20 13.80 2.20 34.70 10.20D & Nagar Haveli 0.00 76.90 0.00 2.50 1.30 18.90 0.40Daman & Diu 0.00 88.50 0.00 1.30 0.00 12.30 0.90Lakshadweep 0.00 81.80 0.00 13.10 0.00 5.10 0.00Puducherry 0.00 59.80 0.10 7.00 7.90 20.00 5.20
INDIA 0.00 84.40 0.80 1.80 1.60 9.30 2.10Source:
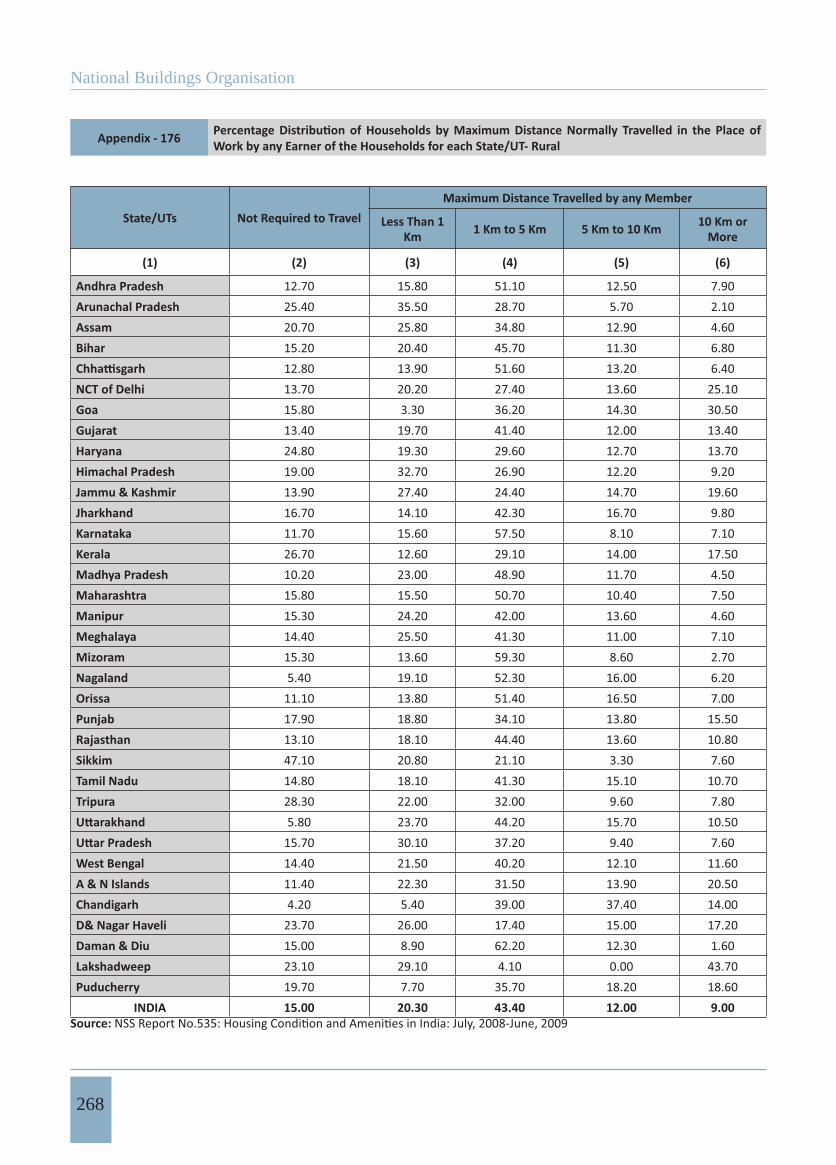
National Buildings Organisation
268
Appendix - 176 Work by any Earner of the Households for each State/UT- Rural
State/UTs Not Required to TravelMaximum Distance Travelled by any Member
Less Than 1 Km 1 Km to 5 Km 5 Km to 10 Km 10 Km or
More
(1) (2) (3) (4) (5) (6)
Andhra Pradesh 12.70 15.80 51.10 12.50 7.90Arunachal Pradesh 25.40 35.50 28.70 5.70 2.10Assam 20.70 25.80 34.80 12.90 4.60Bihar 15.20 20.40 45.70 11.30 6.80
12.80 13.90 51.60 13.20 6.40NCT of Delhi 13.70 20.20 27.40 13.60 25.10Goa 15.80 3.30 36.20 14.30 30.50Gujarat 13.40 19.70 41.40 12.00 13.40Haryana 24.80 19.30 29.60 12.70 13.70Himachal Pradesh 19.00 32.70 26.90 12.20 9.20Jammu & Kashmir 13.90 27.40 24.40 14.70 19.60Jharkhand 16.70 14.10 42.30 16.70 9.80Karnataka 11.70 15.60 57.50 8.10 7.10Kerala 26.70 12.60 29.10 14.00 17.50Madhya Pradesh 10.20 23.00 48.90 11.70 4.50Maharashtra 15.80 15.50 50.70 10.40 7.50Manipur 15.30 24.20 42.00 13.60 4.60Meghalaya 14.40 25.50 41.30 11.00 7.10Mizoram 15.30 13.60 59.30 8.60 2.70Nagaland 5.40 19.10 52.30 16.00 6.20Orissa 11.10 13.80 51.40 16.50 7.00Punjab 17.90 18.80 34.10 13.80 15.50Rajasthan 13.10 18.10 44.40 13.60 10.80Sikkim 47.10 20.80 21.10 3.30 7.60Tamil Nadu 14.80 18.10 41.30 15.10 10.70Tripura 28.30 22.00 32.00 9.60 7.80
5.80 23.70 44.20 15.70 10.5015.70 30.10 37.20 9.40 7.60
West Bengal 14.40 21.50 40.20 12.10 11.60A & N Islands 11.40 22.30 31.50 13.90 20.50Chandigarh 4.20 5.40 39.00 37.40 14.00D& Nagar Haveli 23.70 26.00 17.40 15.00 17.20Daman & Diu 15.00 8.90 62.20 12.30 1.60Lakshadweep 23.10 29.10 4.10 0.00 43.70Puducherry 19.70 7.70 35.70 18.20 18.60
INDIA 15.00 20.30 43.40 12.00 9.00Source:
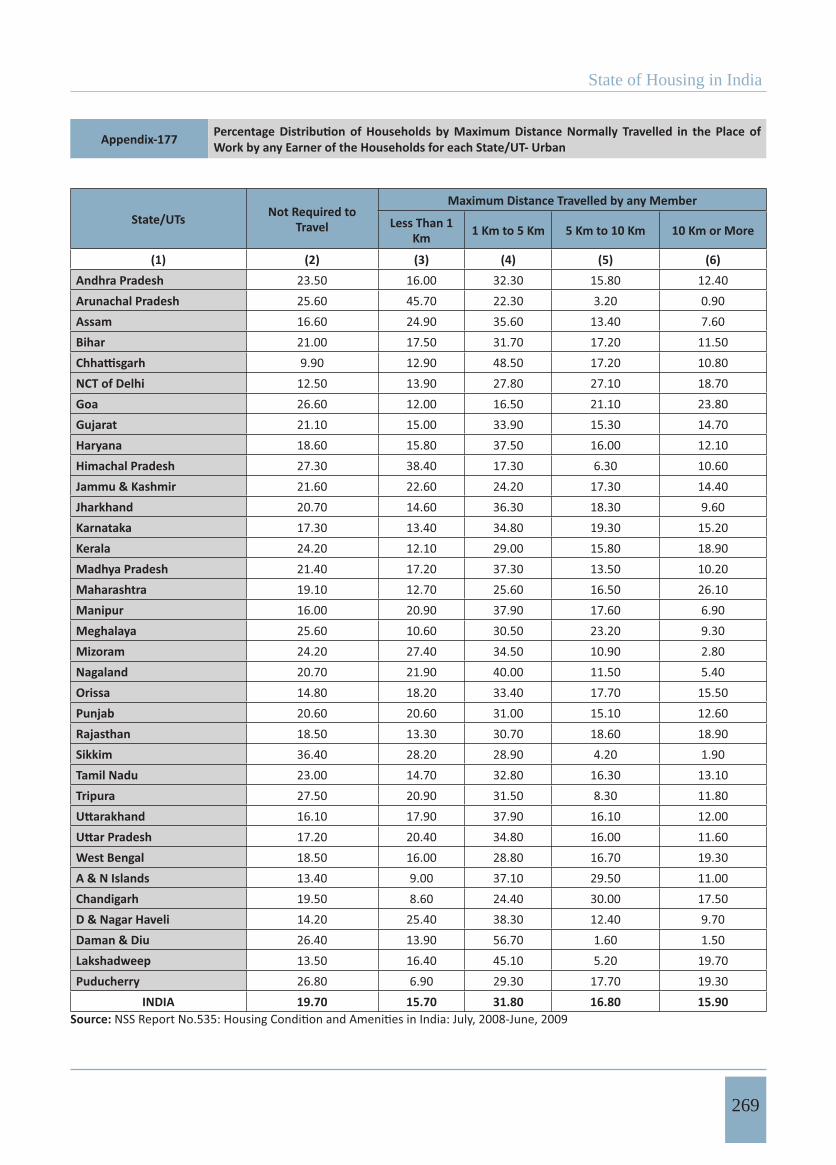
State of Housing in India
269
Appendix-177 Work by any Earner of the Households for each State/UT- Urban
State/UTs Not Required to Travel
Maximum Distance Travelled by any Member
Less Than 1 Km 1 Km to 5 Km 5 Km to 10 Km 10 Km or More
(1) (2) (3) (4) (5) (6)Andhra Pradesh 23.50 16.00 32.30 15.80 12.40Arunachal Pradesh 25.60 45.70 22.30 3.20 0.90Assam 16.60 24.90 35.60 13.40 7.60Bihar 21.00 17.50 31.70 17.20 11.50
9.90 12.90 48.50 17.20 10.80NCT of Delhi 12.50 13.90 27.80 27.10 18.70Goa 26.60 12.00 16.50 21.10 23.80Gujarat 21.10 15.00 33.90 15.30 14.70Haryana 18.60 15.80 37.50 16.00 12.10Himachal Pradesh 27.30 38.40 17.30 6.30 10.60Jammu & Kashmir 21.60 22.60 24.20 17.30 14.40Jharkhand 20.70 14.60 36.30 18.30 9.60Karnataka 17.30 13.40 34.80 19.30 15.20Kerala 24.20 12.10 29.00 15.80 18.90Madhya Pradesh 21.40 17.20 37.30 13.50 10.20Maharashtra 19.10 12.70 25.60 16.50 26.10Manipur 16.00 20.90 37.90 17.60 6.90Meghalaya 25.60 10.60 30.50 23.20 9.30Mizoram 24.20 27.40 34.50 10.90 2.80Nagaland 20.70 21.90 40.00 11.50 5.40Orissa 14.80 18.20 33.40 17.70 15.50Punjab 20.60 20.60 31.00 15.10 12.60Rajasthan 18.50 13.30 30.70 18.60 18.90Sikkim 36.40 28.20 28.90 4.20 1.90Tamil Nadu 23.00 14.70 32.80 16.30 13.10Tripura 27.50 20.90 31.50 8.30 11.80
16.10 17.90 37.90 16.10 12.0017.20 20.40 34.80 16.00 11.60
West Bengal 18.50 16.00 28.80 16.70 19.30A & N Islands 13.40 9.00 37.10 29.50 11.00Chandigarh 19.50 8.60 24.40 30.00 17.50D & Nagar Haveli 14.20 25.40 38.30 12.40 9.70Daman & Diu 26.40 13.90 56.70 1.60 1.50Lakshadweep 13.50 16.40 45.10 5.20 19.70Puducherry 26.80 6.90 29.30 17.70 19.30
INDIA 19.70 15.70 31.80 16.80 15.90Source:
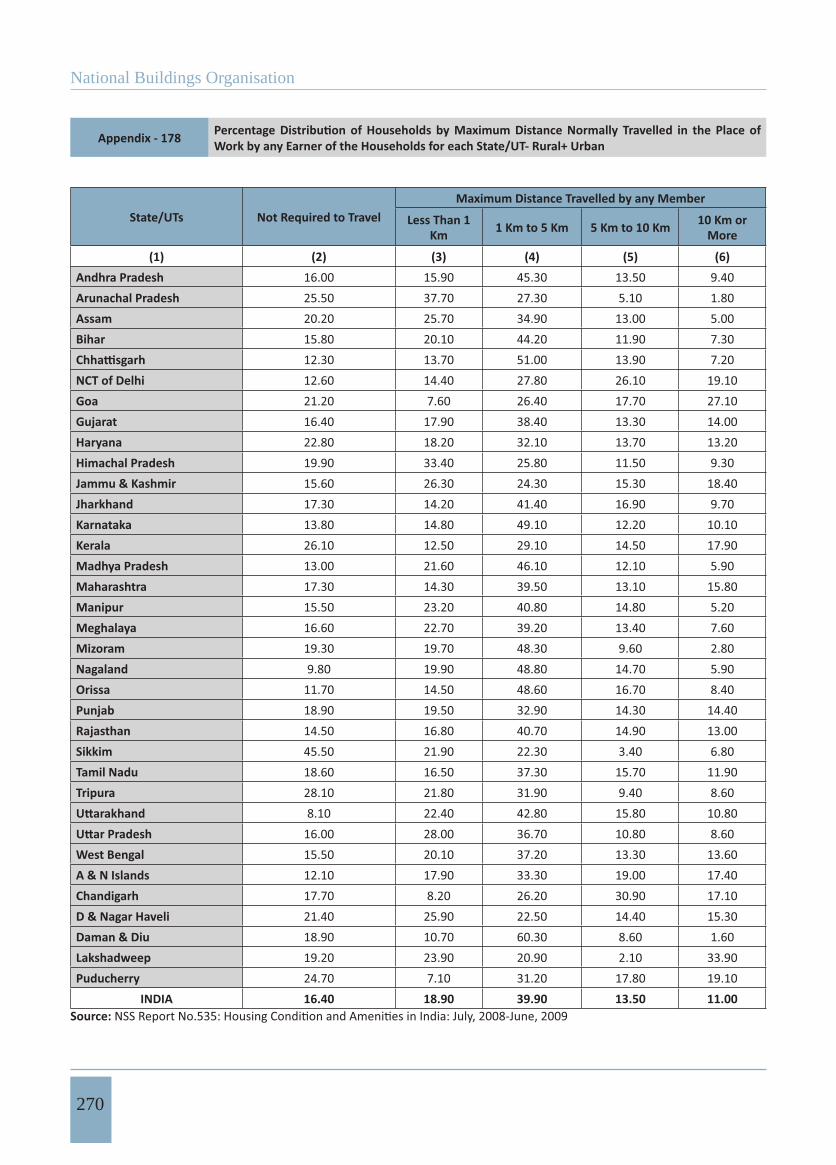
National Buildings Organisation
270
Appendix - 178 Work by any Earner of the Households for each State/UT- Rural+ Urban
State/UTs Not Required to TravelMaximum Distance Travelled by any Member
Less Than 1 Km 1 Km to 5 Km 5 Km to 10 Km 10 Km or
More
(1) (2) (3) (4) (5) (6)Andhra Pradesh 16.00 15.90 45.30 13.50 9.40Arunachal Pradesh 25.50 37.70 27.30 5.10 1.80Assam 20.20 25.70 34.90 13.00 5.00Bihar 15.80 20.10 44.20 11.90 7.30
12.30 13.70 51.00 13.90 7.20NCT of Delhi 12.60 14.40 27.80 26.10 19.10Goa 21.20 7.60 26.40 17.70 27.10Gujarat 16.40 17.90 38.40 13.30 14.00Haryana 22.80 18.20 32.10 13.70 13.20Himachal Pradesh 19.90 33.40 25.80 11.50 9.30Jammu & Kashmir 15.60 26.30 24.30 15.30 18.40Jharkhand 17.30 14.20 41.40 16.90 9.70Karnataka 13.80 14.80 49.10 12.20 10.10Kerala 26.10 12.50 29.10 14.50 17.90Madhya Pradesh 13.00 21.60 46.10 12.10 5.90Maharashtra 17.30 14.30 39.50 13.10 15.80Manipur 15.50 23.20 40.80 14.80 5.20Meghalaya 16.60 22.70 39.20 13.40 7.60Mizoram 19.30 19.70 48.30 9.60 2.80Nagaland 9.80 19.90 48.80 14.70 5.90Orissa 11.70 14.50 48.60 16.70 8.40Punjab 18.90 19.50 32.90 14.30 14.40Rajasthan 14.50 16.80 40.70 14.90 13.00Sikkim 45.50 21.90 22.30 3.40 6.80Tamil Nadu 18.60 16.50 37.30 15.70 11.90Tripura 28.10 21.80 31.90 9.40 8.60
8.10 22.40 42.80 15.80 10.8016.00 28.00 36.70 10.80 8.60
West Bengal 15.50 20.10 37.20 13.30 13.60A & N Islands 12.10 17.90 33.30 19.00 17.40Chandigarh 17.70 8.20 26.20 30.90 17.10D & Nagar Haveli 21.40 25.90 22.50 14.40 15.30Daman & Diu 18.90 10.70 60.30 8.60 1.60Lakshadweep 19.20 23.90 20.90 2.10 33.90Puducherry 24.70 7.10 31.20 17.80 19.10
INDIA 16.40 18.90 39.90 13.50 11.00Source:
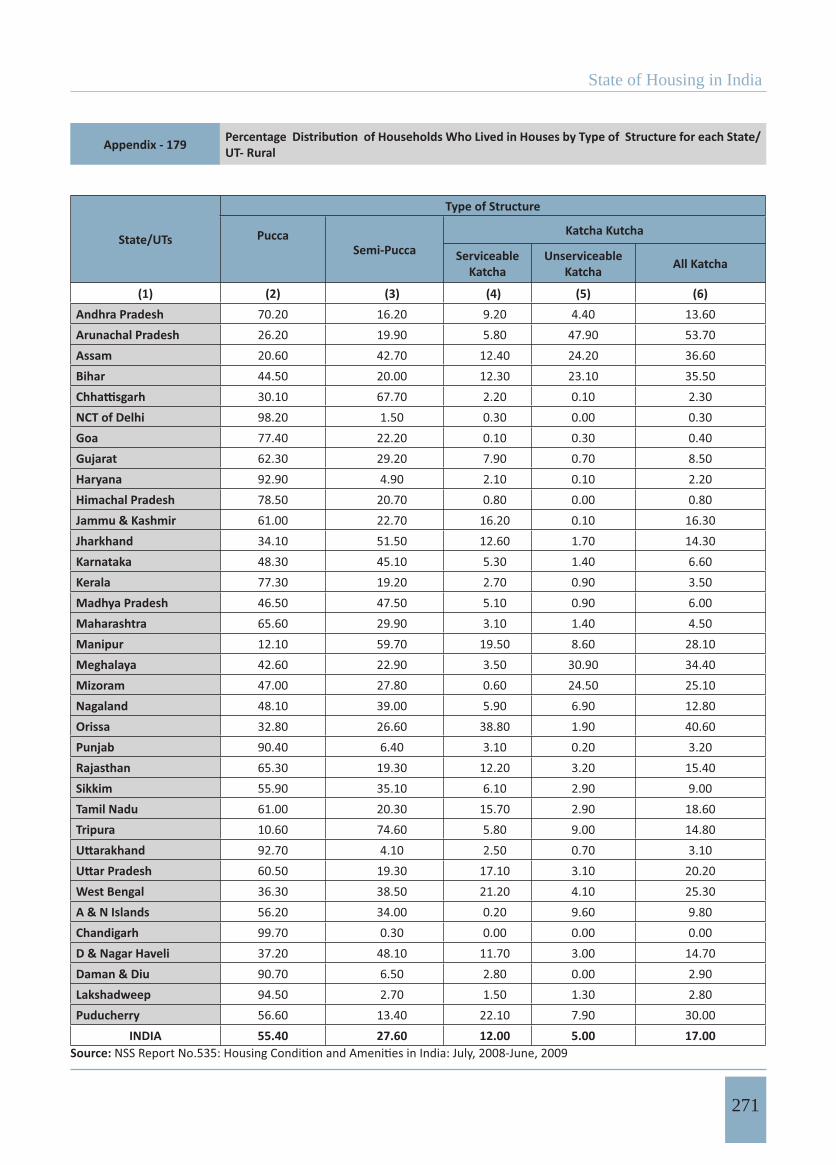
State of Housing in India
271
Appendix - 179 UT- Rural
State/UTs
Type of Structure
PuccaSemi-Pucca
Katcha Kutcha
Serviceable Katcha
Unserviceable Katcha All Katcha
(1) (2) (3) (4) (5) (6)Andhra Pradesh 70.20 16.20 9.20 4.40 13.60Arunachal Pradesh 26.20 19.90 5.80 47.90 53.70Assam 20.60 42.70 12.40 24.20 36.60Bihar 44.50 20.00 12.30 23.10 35.50
30.10 67.70 2.20 0.10 2.30NCT of Delhi 98.20 1.50 0.30 0.00 0.30Goa 77.40 22.20 0.10 0.30 0.40Gujarat 62.30 29.20 7.90 0.70 8.50Haryana 92.90 4.90 2.10 0.10 2.20Himachal Pradesh 78.50 20.70 0.80 0.00 0.80Jammu & Kashmir 61.00 22.70 16.20 0.10 16.30Jharkhand 34.10 51.50 12.60 1.70 14.30Karnataka 48.30 45.10 5.30 1.40 6.60Kerala 77.30 19.20 2.70 0.90 3.50Madhya Pradesh 46.50 47.50 5.10 0.90 6.00Maharashtra 65.60 29.90 3.10 1.40 4.50Manipur 12.10 59.70 19.50 8.60 28.10Meghalaya 42.60 22.90 3.50 30.90 34.40Mizoram 47.00 27.80 0.60 24.50 25.10Nagaland 48.10 39.00 5.90 6.90 12.80Orissa 32.80 26.60 38.80 1.90 40.60Punjab 90.40 6.40 3.10 0.20 3.20Rajasthan 65.30 19.30 12.20 3.20 15.40Sikkim 55.90 35.10 6.10 2.90 9.00Tamil Nadu 61.00 20.30 15.70 2.90 18.60Tripura 10.60 74.60 5.80 9.00 14.80
92.70 4.10 2.50 0.70 3.1060.50 19.30 17.10 3.10 20.20
West Bengal 36.30 38.50 21.20 4.10 25.30A & N Islands 56.20 34.00 0.20 9.60 9.80Chandigarh 99.70 0.30 0.00 0.00 0.00D & Nagar Haveli 37.20 48.10 11.70 3.00 14.70Daman & Diu 90.70 6.50 2.80 0.00 2.90Lakshadweep 94.50 2.70 1.50 1.30 2.80Puducherry 56.60 13.40 22.10 7.90 30.00
INDIA 55.40 27.60 12.00 5.00 17.00Source:
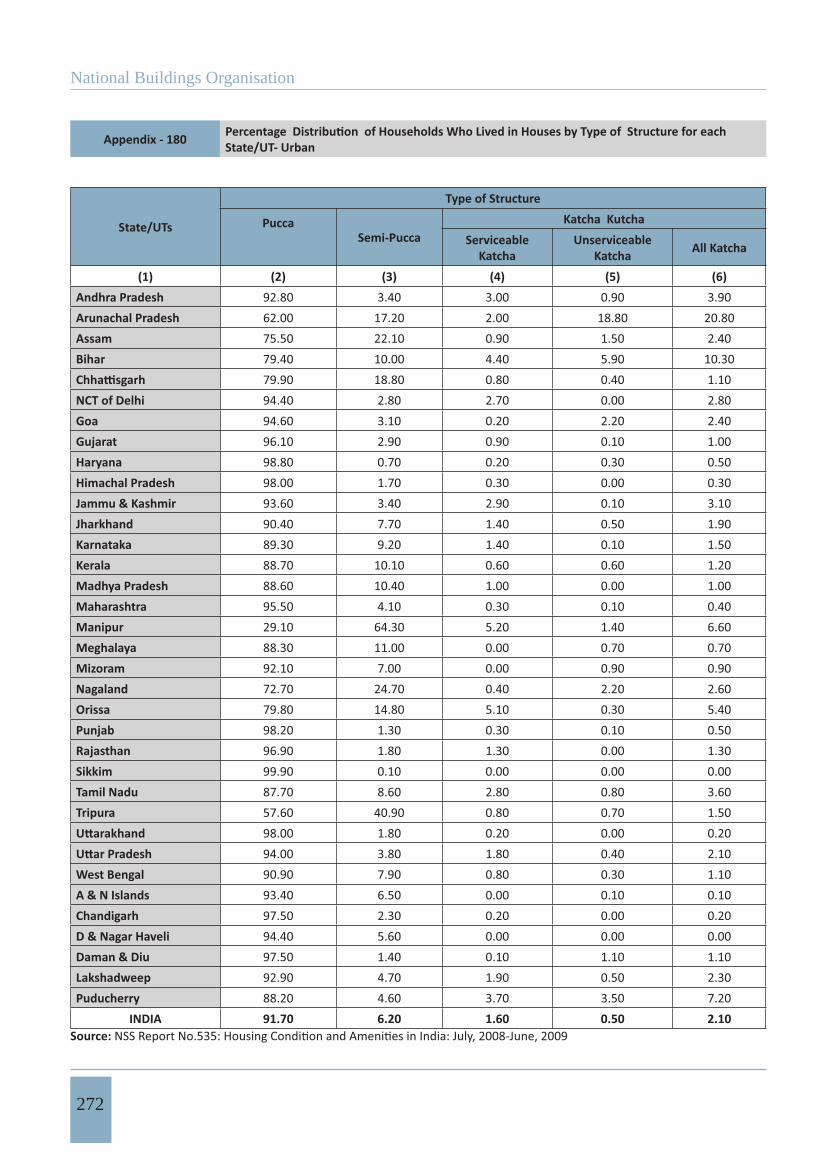
National Buildings Organisation
272
Appendix - 180 State/UT- Urban
State/UTs
Type of Structure
PuccaSemi-Pucca
Katcha KutchaServiceable
KatchaUnserviceable
Katcha All Katcha
(1) (2) (3) (4) (5) (6)Andhra Pradesh 92.80 3.40 3.00 0.90 3.90Arunachal Pradesh 62.00 17.20 2.00 18.80 20.80Assam 75.50 22.10 0.90 1.50 2.40Bihar 79.40 10.00 4.40 5.90 10.30
79.90 18.80 0.80 0.40 1.10NCT of Delhi 94.40 2.80 2.70 0.00 2.80Goa 94.60 3.10 0.20 2.20 2.40Gujarat 96.10 2.90 0.90 0.10 1.00Haryana 98.80 0.70 0.20 0.30 0.50Himachal Pradesh 98.00 1.70 0.30 0.00 0.30Jammu & Kashmir 93.60 3.40 2.90 0.10 3.10Jharkhand 90.40 7.70 1.40 0.50 1.90Karnataka 89.30 9.20 1.40 0.10 1.50Kerala 88.70 10.10 0.60 0.60 1.20Madhya Pradesh 88.60 10.40 1.00 0.00 1.00Maharashtra 95.50 4.10 0.30 0.10 0.40Manipur 29.10 64.30 5.20 1.40 6.60Meghalaya 88.30 11.00 0.00 0.70 0.70Mizoram 92.10 7.00 0.00 0.90 0.90Nagaland 72.70 24.70 0.40 2.20 2.60Orissa 79.80 14.80 5.10 0.30 5.40Punjab 98.20 1.30 0.30 0.10 0.50Rajasthan 96.90 1.80 1.30 0.00 1.30Sikkim 99.90 0.10 0.00 0.00 0.00Tamil Nadu 87.70 8.60 2.80 0.80 3.60Tripura 57.60 40.90 0.80 0.70 1.50
98.00 1.80 0.20 0.00 0.2094.00 3.80 1.80 0.40 2.10
West Bengal 90.90 7.90 0.80 0.30 1.10A & N Islands 93.40 6.50 0.00 0.10 0.10Chandigarh 97.50 2.30 0.20 0.00 0.20D & Nagar Haveli 94.40 5.60 0.00 0.00 0.00Daman & Diu 97.50 1.40 0.10 1.10 1.10Lakshadweep 92.90 4.70 1.90 0.50 2.30Puducherry 88.20 4.60 3.70 3.50 7.20
INDIA 91.70 6.20 1.60 0.50 2.10Source:
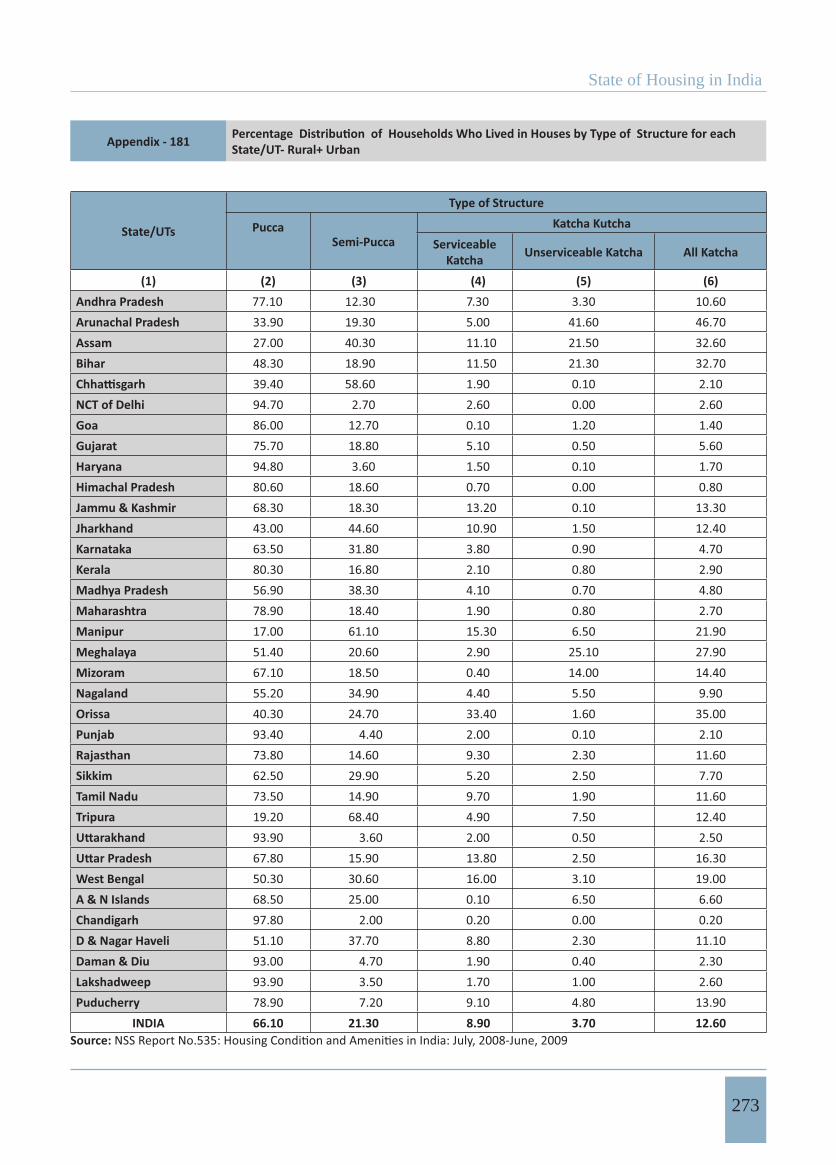
State of Housing in India
273
Appendix - 181 State/UT- Rural+ Urban
State/UTs
Type of Structure
PuccaSemi-Pucca
Katcha KutchaServiceable
Katcha Unserviceable Katcha All Katcha
(1) (2) (3) (4) (5) (6)Andhra Pradesh 77.10 12.30 7.30 3.30 10.60Arunachal Pradesh 33.90 19.30 5.00 41.60 46.70Assam 27.00 40.30 11.10 21.50 32.60Bihar 48.30 18.90 11.50 21.30 32.70
39.40 58.60 1.90 0.10 2.10NCT of Delhi 94.70 2.70 2.60 0.00 2.60Goa 86.00 12.70 0.10 1.20 1.40Gujarat 75.70 18.80 5.10 0.50 5.60Haryana 94.80 3.60 1.50 0.10 1.70Himachal Pradesh 80.60 18.60 0.70 0.00 0.80Jammu & Kashmir 68.30 18.30 13.20 0.10 13.30Jharkhand 43.00 44.60 10.90 1.50 12.40Karnataka 63.50 31.80 3.80 0.90 4.70Kerala 80.30 16.80 2.10 0.80 2.90Madhya Pradesh 56.90 38.30 4.10 0.70 4.80Maharashtra 78.90 18.40 1.90 0.80 2.70Manipur 17.00 61.10 15.30 6.50 21.90Meghalaya 51.40 20.60 2.90 25.10 27.90Mizoram 67.10 18.50 0.40 14.00 14.40Nagaland 55.20 34.90 4.40 5.50 9.90Orissa 40.30 24.70 33.40 1.60 35.00Punjab 93.40 4.40 2.00 0.10 2.10Rajasthan 73.80 14.60 9.30 2.30 11.60Sikkim 62.50 29.90 5.20 2.50 7.70Tamil Nadu 73.50 14.90 9.70 1.90 11.60Tripura 19.20 68.40 4.90 7.50 12.40
93.90 3.60 2.00 0.50 2.5067.80 15.90 13.80 2.50 16.30
West Bengal 50.30 30.60 16.00 3.10 19.00A & N Islands 68.50 25.00 0.10 6.50 6.60Chandigarh 97.80 2.00 0.20 0.00 0.20D & Nagar Haveli 51.10 37.70 8.80 2.30 11.10Daman & Diu 93.00 4.70 1.90 0.40 2.30Lakshadweep 93.90 3.50 1.70 1.00 2.60Puducherry 78.90 7.20 9.10 4.80 13.90
INDIA 66.10 21.30 8.90 3.70 12.60Source:

National Buildings Organisation
274
Appendix - 182
State/UTs Rural Urban Rural +Urban
(1) (2) (3) (4)Andhra Pradesh 270 242 261Arunachal Pradesh 332 318 329Assam 82 71 81Bihar 295 282 293
502 436 490NCT of Delhi 480 451 453Goa 162 256 209Gujarat 417 294 368Haryana 537 511 529Himachal Pradesh 343 560 367Jammu & Kashmir 191 212 196Jharkhand 547 317 511Karnataka 413 446 425Kerala 41 48 43Madhya Pradesh 349 238 322Maharashtra 308 355 329Manipur 95 7 70Meghalaya 214 341 239Mizoram 454 668 549Nagaland 382 261 347Orissa 205 167 199Punjab 552 519 539Rajasthan 376 248 342Sikkim 27 1 23Tamil Nadu 326 298 313Tripura 372 88 320
242 263 247440 330 416
West Bengal 138 177 148A & N Islands 306 430 347Chandigarh 942 533 583Dadra & Nagar Haveli 356 155 307Daman & Diu 230 182 213Lakshadweep 7 132 58Puducherry 325 175 219
INDIA 324 307 319Source:
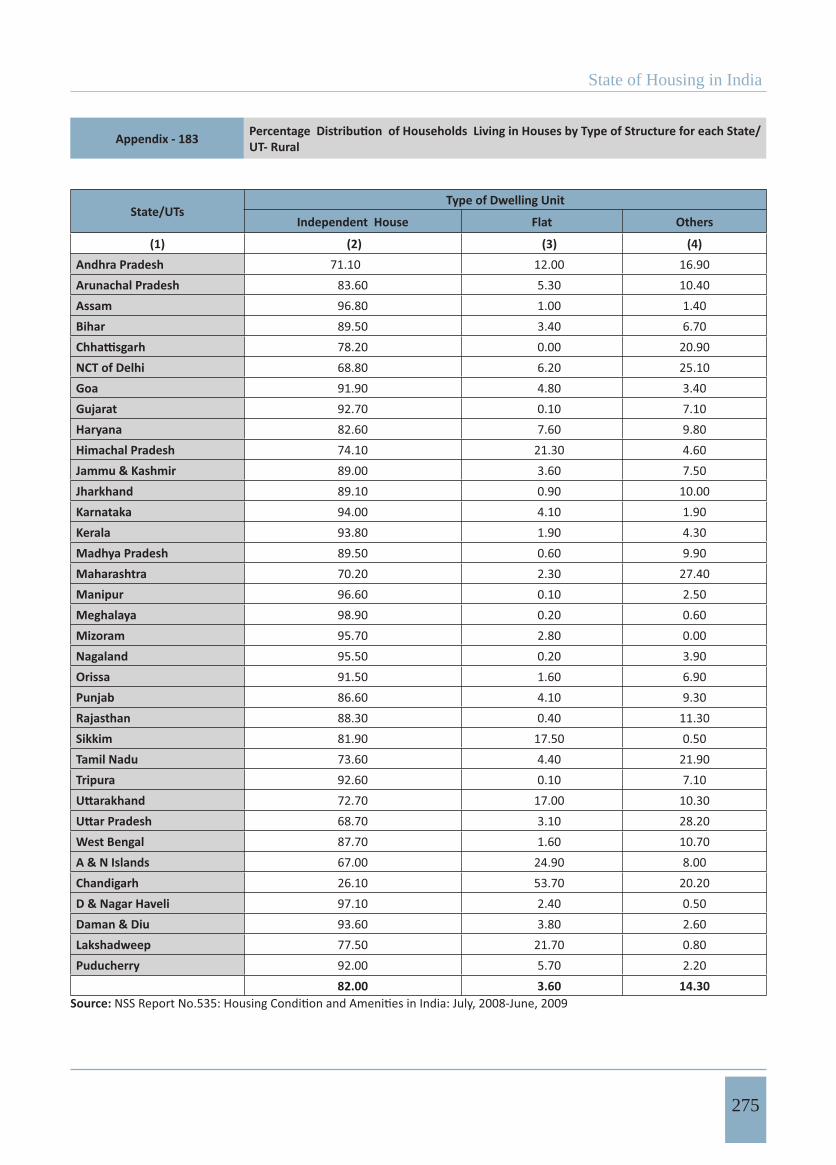
State of Housing in India
275
Appendix - 183 UT- Rural
State/UTsType of Dwelling Unit
Independent House Flat Others
(1) (2) (3) (4)Andhra Pradesh 71.10 12.00 16.90Arunachal Pradesh 83.60 5.30 10.40Assam 96.80 1.00 1.40Bihar 89.50 3.40 6.70
78.20 0.00 20.90NCT of Delhi 68.80 6.20 25.10Goa 91.90 4.80 3.40Gujarat 92.70 0.10 7.10Haryana 82.60 7.60 9.80Himachal Pradesh 74.10 21.30 4.60Jammu & Kashmir 89.00 3.60 7.50Jharkhand 89.10 0.90 10.00Karnataka 94.00 4.10 1.90Kerala 93.80 1.90 4.30Madhya Pradesh 89.50 0.60 9.90Maharashtra 70.20 2.30 27.40Manipur 96.60 0.10 2.50Meghalaya 98.90 0.20 0.60Mizoram 95.70 2.80 0.00Nagaland 95.50 0.20 3.90Orissa 91.50 1.60 6.90Punjab 86.60 4.10 9.30Rajasthan 88.30 0.40 11.30Sikkim 81.90 17.50 0.50Tamil Nadu 73.60 4.40 21.90Tripura 92.60 0.10 7.10
72.70 17.00 10.3068.70 3.10 28.20
West Bengal 87.70 1.60 10.70A & N Islands 67.00 24.90 8.00Chandigarh 26.10 53.70 20.20D & Nagar Haveli 97.10 2.40 0.50Daman & Diu 93.60 3.80 2.60Lakshadweep 77.50 21.70 0.80Puducherry 92.00 5.70 2.20
INDIA 82.00 3.60 14.30Source:
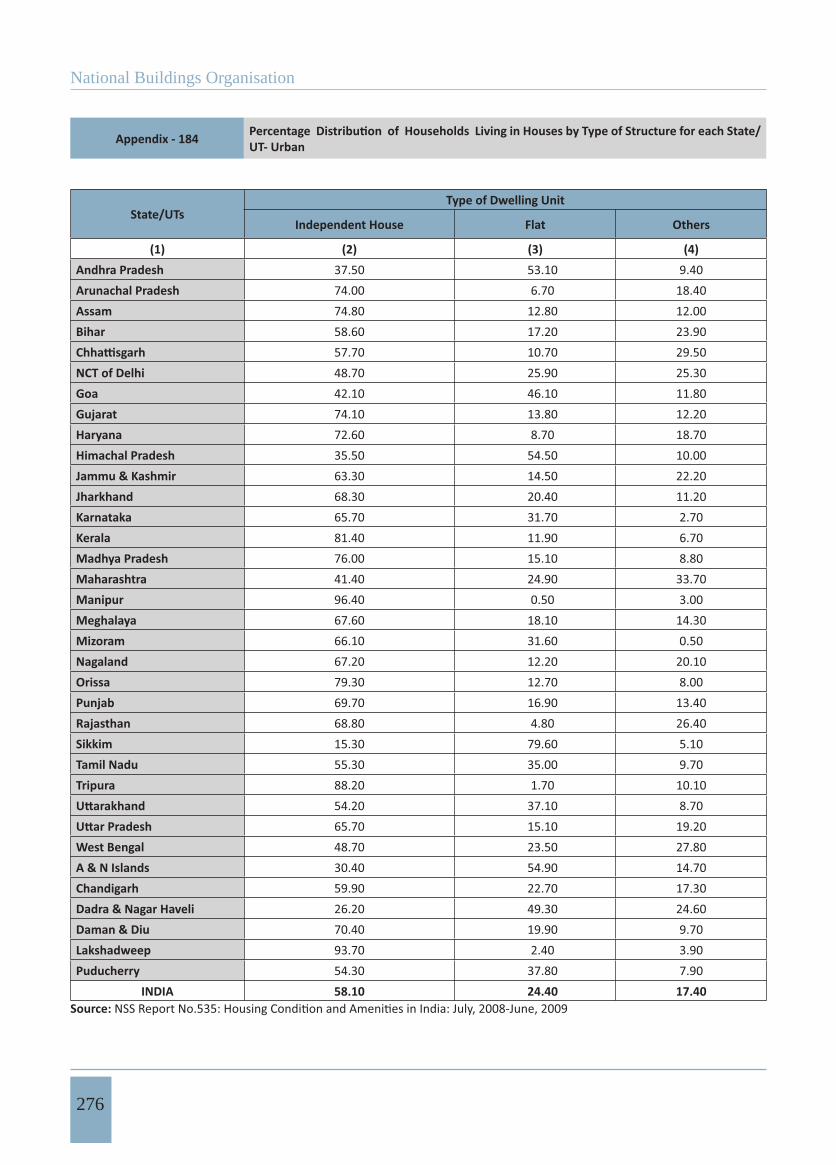
National Buildings Organisation
276
Appendix - 184 UT- Urban
State/UTsType of Dwelling Unit
Independent House Flat Others
(1) (2) (3) (4)Andhra Pradesh 37.50 53.10 9.40Arunachal Pradesh 74.00 6.70 18.40Assam 74.80 12.80 12.00Bihar 58.60 17.20 23.90
57.70 10.70 29.50NCT of Delhi 48.70 25.90 25.30Goa 42.10 46.10 11.80Gujarat 74.10 13.80 12.20Haryana 72.60 8.70 18.70Himachal Pradesh 35.50 54.50 10.00Jammu & Kashmir 63.30 14.50 22.20Jharkhand 68.30 20.40 11.20Karnataka 65.70 31.70 2.70Kerala 81.40 11.90 6.70Madhya Pradesh 76.00 15.10 8.80Maharashtra 41.40 24.90 33.70Manipur 96.40 0.50 3.00Meghalaya 67.60 18.10 14.30Mizoram 66.10 31.60 0.50Nagaland 67.20 12.20 20.10Orissa 79.30 12.70 8.00Punjab 69.70 16.90 13.40Rajasthan 68.80 4.80 26.40Sikkim 15.30 79.60 5.10Tamil Nadu 55.30 35.00 9.70Tripura 88.20 1.70 10.10
54.20 37.10 8.7065.70 15.10 19.20
West Bengal 48.70 23.50 27.80A & N Islands 30.40 54.90 14.70Chandigarh 59.90 22.70 17.30Dadra & Nagar Haveli 26.20 49.30 24.60Daman & Diu 70.40 19.90 9.70Lakshadweep 93.70 2.40 3.90Puducherry 54.30 37.80 7.90
INDIA 58.10 24.40 17.40Source:
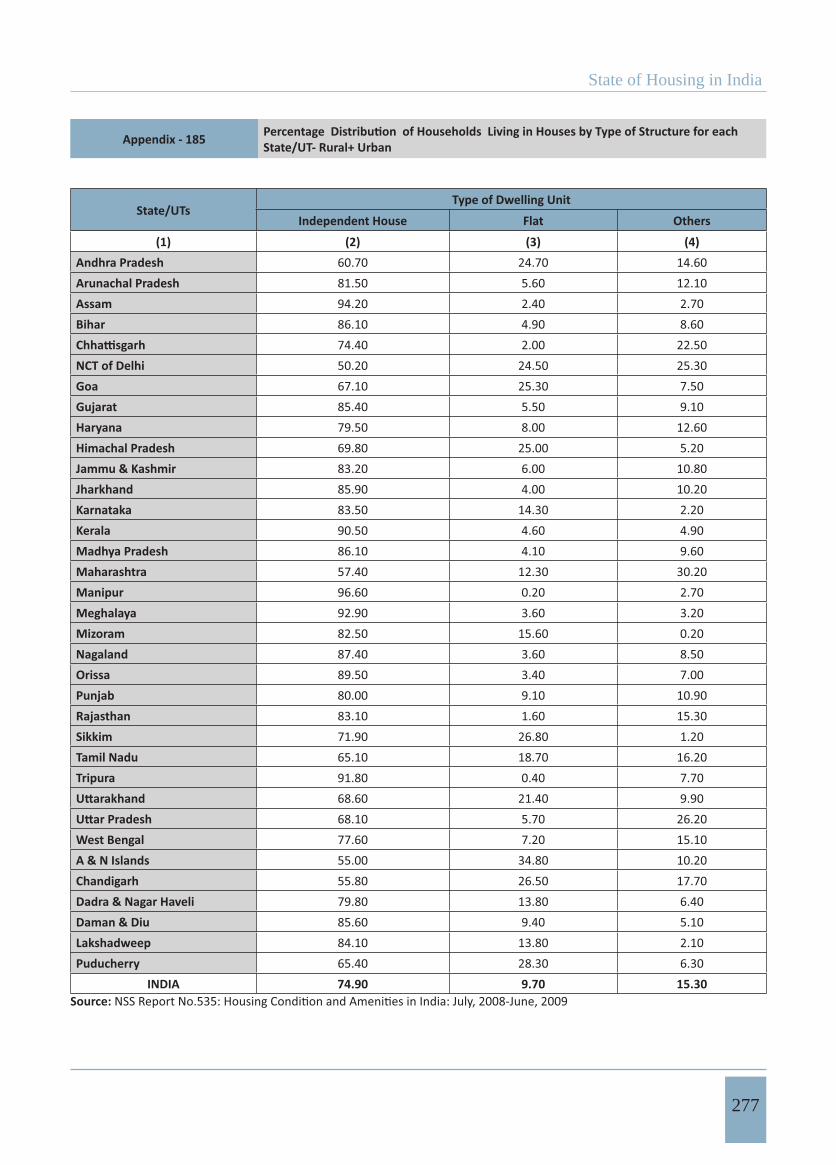
State of Housing in India
277
Appendix - 185 State/UT- Rural+ Urban
State/UTsType of Dwelling Unit
Independent House Flat Others
(1) (2) (3) (4)Andhra Pradesh 60.70 24.70 14.60Arunachal Pradesh 81.50 5.60 12.10Assam 94.20 2.40 2.70Bihar 86.10 4.90 8.60
74.40 2.00 22.50NCT of Delhi 50.20 24.50 25.30Goa 67.10 25.30 7.50Gujarat 85.40 5.50 9.10Haryana 79.50 8.00 12.60Himachal Pradesh 69.80 25.00 5.20Jammu & Kashmir 83.20 6.00 10.80Jharkhand 85.90 4.00 10.20Karnataka 83.50 14.30 2.20Kerala 90.50 4.60 4.90Madhya Pradesh 86.10 4.10 9.60Maharashtra 57.40 12.30 30.20Manipur 96.60 0.20 2.70Meghalaya 92.90 3.60 3.20Mizoram 82.50 15.60 0.20Nagaland 87.40 3.60 8.50Orissa 89.50 3.40 7.00Punjab 80.00 9.10 10.90Rajasthan 83.10 1.60 15.30Sikkim 71.90 26.80 1.20Tamil Nadu 65.10 18.70 16.20Tripura 91.80 0.40 7.70
68.60 21.40 9.9068.10 5.70 26.20
West Bengal 77.60 7.20 15.10A & N Islands 55.00 34.80 10.20Chandigarh 55.80 26.50 17.70Dadra & Nagar Haveli 79.80 13.80 6.40Daman & Diu 85.60 9.40 5.10Lakshadweep 84.10 13.80 2.10Puducherry 65.40 28.30 6.30
INDIA 74.90 9.70 15.30Source:
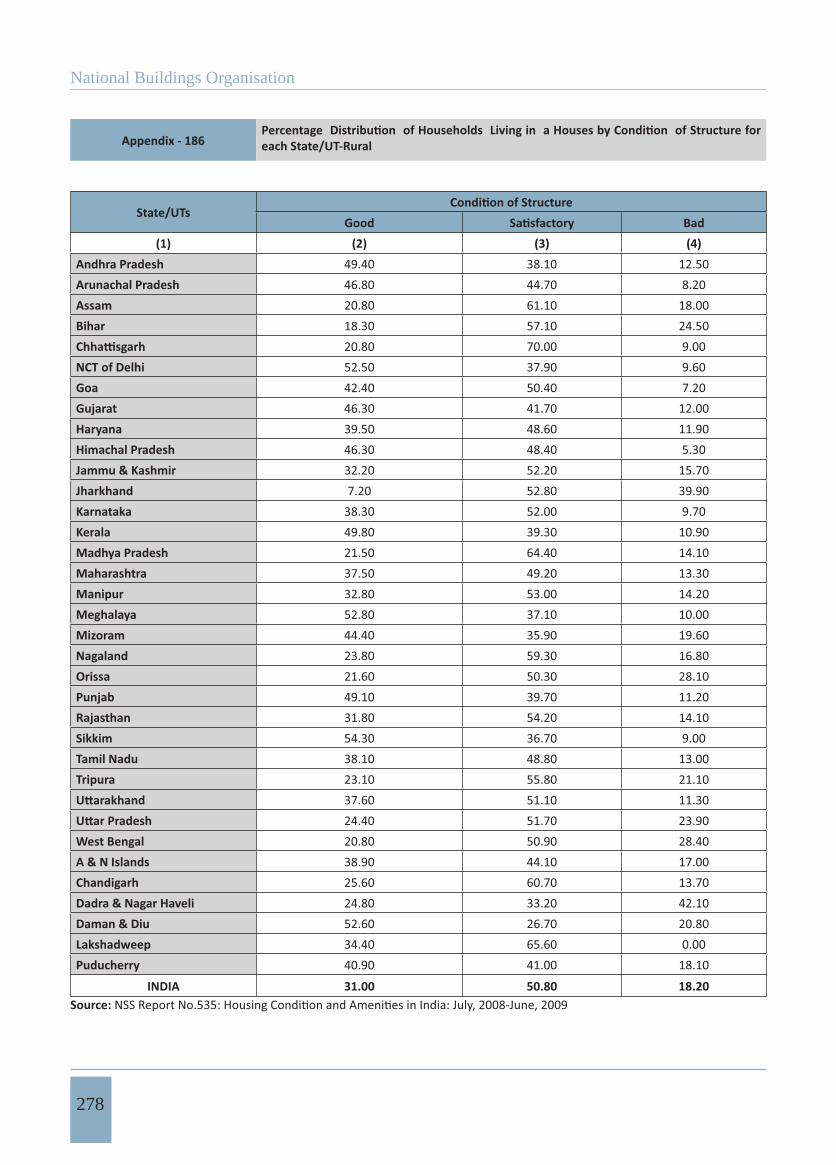
National Buildings Organisation
278
Appendix - 186 each State/UT-Rural
State/UTsGood Bad
(1) (2) (3) (4)Andhra Pradesh 49.40 38.10 12.50Arunachal Pradesh 46.80 44.70 8.20Assam 20.80 61.10 18.00Bihar 18.30 57.10 24.50
20.80 70.00 9.00NCT of Delhi 52.50 37.90 9.60Goa 42.40 50.40 7.20Gujarat 46.30 41.70 12.00Haryana 39.50 48.60 11.90Himachal Pradesh 46.30 48.40 5.30Jammu & Kashmir 32.20 52.20 15.70Jharkhand 7.20 52.80 39.90Karnataka 38.30 52.00 9.70Kerala 49.80 39.30 10.90Madhya Pradesh 21.50 64.40 14.10Maharashtra 37.50 49.20 13.30Manipur 32.80 53.00 14.20Meghalaya 52.80 37.10 10.00Mizoram 44.40 35.90 19.60Nagaland 23.80 59.30 16.80Orissa 21.60 50.30 28.10Punjab 49.10 39.70 11.20Rajasthan 31.80 54.20 14.10Sikkim 54.30 36.70 9.00Tamil Nadu 38.10 48.80 13.00Tripura 23.10 55.80 21.10
37.60 51.10 11.3024.40 51.70 23.90
West Bengal 20.80 50.90 28.40A & N Islands 38.90 44.10 17.00Chandigarh 25.60 60.70 13.70Dadra & Nagar Haveli 24.80 33.20 42.10Daman & Diu 52.60 26.70 20.80Lakshadweep 34.40 65.60 0.00Puducherry 40.90 41.00 18.10
INDIA 31.00 50.80 18.20Source:
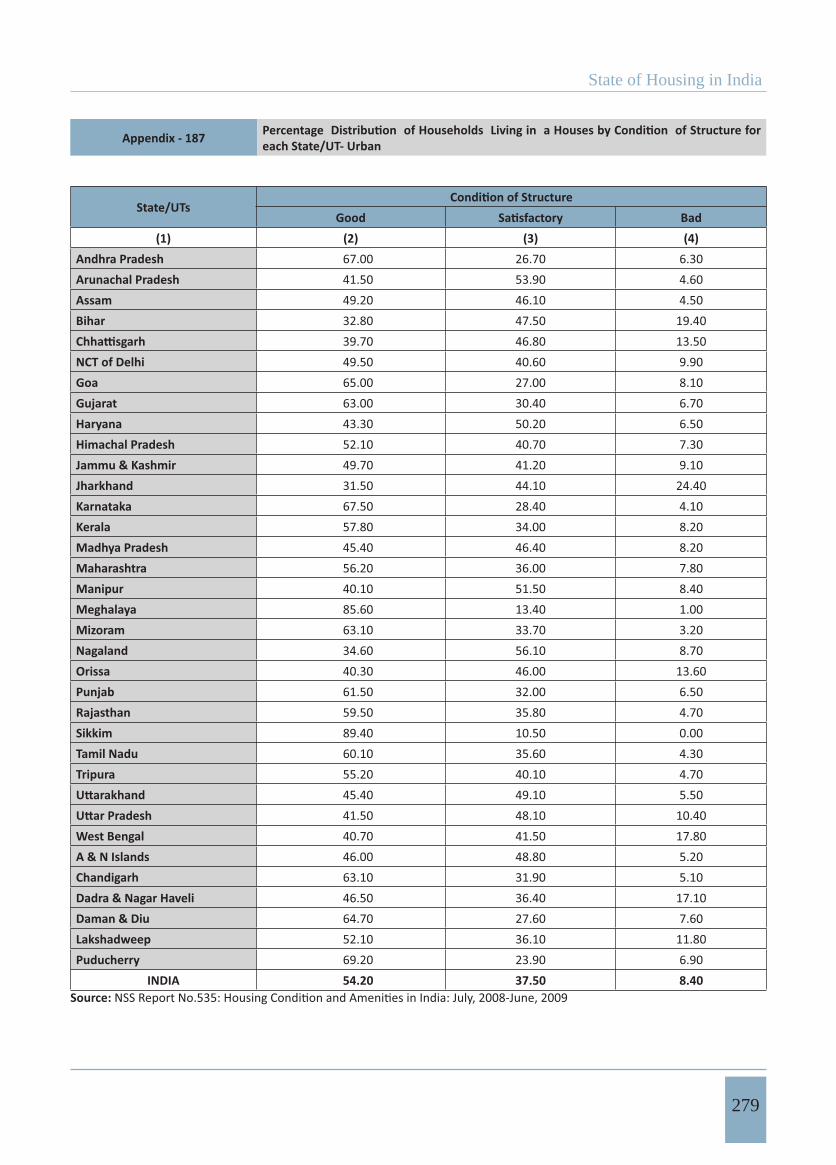
State of Housing in India
279
Appendix - 187 each State/UT- Urban
State/UTsGood Bad
(1) (2) (3) (4)Andhra Pradesh 67.00 26.70 6.30Arunachal Pradesh 41.50 53.90 4.60Assam 49.20 46.10 4.50Bihar 32.80 47.50 19.40
39.70 46.80 13.50NCT of Delhi 49.50 40.60 9.90Goa 65.00 27.00 8.10Gujarat 63.00 30.40 6.70Haryana 43.30 50.20 6.50Himachal Pradesh 52.10 40.70 7.30Jammu & Kashmir 49.70 41.20 9.10Jharkhand 31.50 44.10 24.40Karnataka 67.50 28.40 4.10Kerala 57.80 34.00 8.20Madhya Pradesh 45.40 46.40 8.20Maharashtra 56.20 36.00 7.80Manipur 40.10 51.50 8.40Meghalaya 85.60 13.40 1.00Mizoram 63.10 33.70 3.20Nagaland 34.60 56.10 8.70Orissa 40.30 46.00 13.60Punjab 61.50 32.00 6.50Rajasthan 59.50 35.80 4.70Sikkim 89.40 10.50 0.00Tamil Nadu 60.10 35.60 4.30Tripura 55.20 40.10 4.70
45.40 49.10 5.5041.50 48.10 10.40
West Bengal 40.70 41.50 17.80A & N Islands 46.00 48.80 5.20Chandigarh 63.10 31.90 5.10Dadra & Nagar Haveli 46.50 36.40 17.10Daman & Diu 64.70 27.60 7.60Lakshadweep 52.10 36.10 11.80Puducherry 69.20 23.90 6.90
INDIA 54.20 37.50 8.40Source:
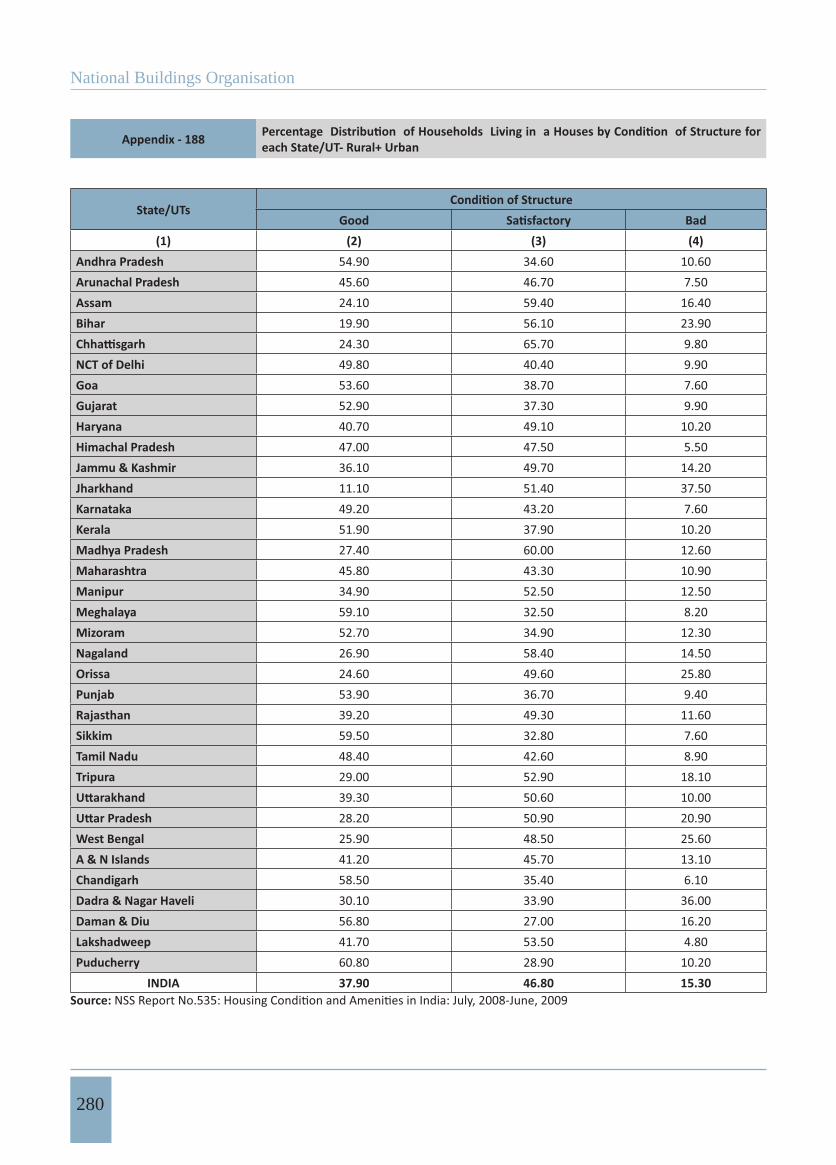
National Buildings Organisation
280
Appendix - 188 each State/UT- Rural+ Urban
State/UTsGood Bad
(1) (2) (3) (4)Andhra Pradesh 54.90 34.60 10.60Arunachal Pradesh 45.60 46.70 7.50Assam 24.10 59.40 16.40Bihar 19.90 56.10 23.90
24.30 65.70 9.80NCT of Delhi 49.80 40.40 9.90Goa 53.60 38.70 7.60Gujarat 52.90 37.30 9.90Haryana 40.70 49.10 10.20Himachal Pradesh 47.00 47.50 5.50Jammu & Kashmir 36.10 49.70 14.20Jharkhand 11.10 51.40 37.50Karnataka 49.20 43.20 7.60Kerala 51.90 37.90 10.20Madhya Pradesh 27.40 60.00 12.60Maharashtra 45.80 43.30 10.90Manipur 34.90 52.50 12.50Meghalaya 59.10 32.50 8.20Mizoram 52.70 34.90 12.30Nagaland 26.90 58.40 14.50Orissa 24.60 49.60 25.80Punjab 53.90 36.70 9.40Rajasthan 39.20 49.30 11.60Sikkim 59.50 32.80 7.60Tamil Nadu 48.40 42.60 8.90Tripura 29.00 52.90 18.10
39.30 50.60 10.0028.20 50.90 20.90
West Bengal 25.90 48.50 25.60A & N Islands 41.20 45.70 13.10Chandigarh 58.50 35.40 6.10Dadra & Nagar Haveli 30.10 33.90 36.00Daman & Diu 56.80 27.00 16.20Lakshadweep 41.70 53.50 4.80Puducherry 60.80 28.90 10.20
INDIA 37.90 46.80 15.30Source:
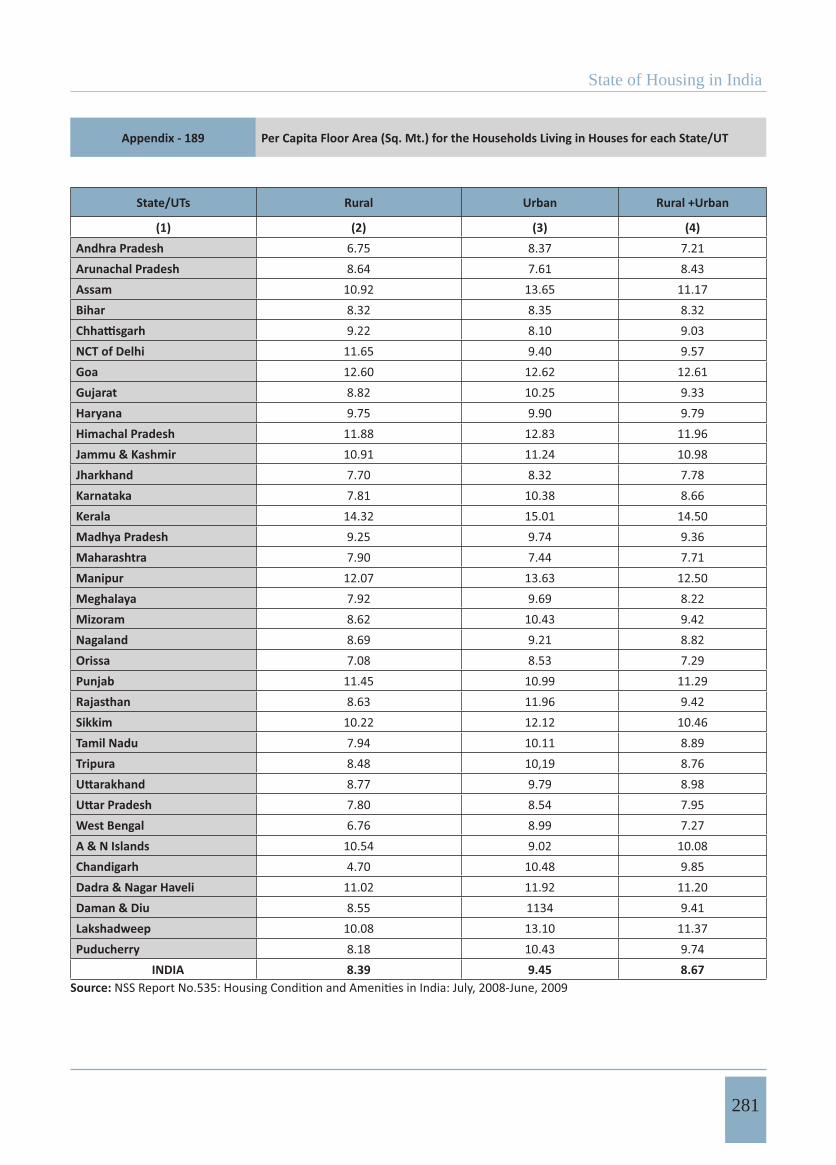
State of Housing in India
281
Appendix - 189 Per Capita Floor Area (Sq. Mt.) for the Households Living in Houses for each State/UT
State/UTs Rural Urban Rural +Urban
(1) (2) (3) (4)Andhra Pradesh 6.75 8.37 7.21Arunachal Pradesh 8.64 7.61 8.43Assam 10.92 13.65 11.17Bihar 8.32 8.35 8.32
9.22 8.10 9.03NCT of Delhi 11.65 9.40 9.57Goa 12.60 12.62 12.61Gujarat 8.82 10.25 9.33Haryana 9.75 9.90 9.79Himachal Pradesh 11.88 12.83 11.96Jammu & Kashmir 10.91 11.24 10.98Jharkhand 7.70 8.32 7.78Karnataka 7.81 10.38 8.66Kerala 14.32 15.01 14.50Madhya Pradesh 9.25 9.74 9.36Maharashtra 7.90 7.44 7.71Manipur 12.07 13.63 12.50Meghalaya 7.92 9.69 8.22Mizoram 8.62 10.43 9.42Nagaland 8.69 9.21 8.82Orissa 7.08 8.53 7.29Punjab 11.45 10.99 11.29Rajasthan 8.63 11.96 9.42Sikkim 10.22 12.12 10.46Tamil Nadu 7.94 10.11 8.89Tripura 8.48 10,19 8.76
8.77 9.79 8.987.80 8.54 7.95
West Bengal 6.76 8.99 7.27A & N Islands 10.54 9.02 10.08Chandigarh 4.70 10.48 9.85Dadra & Nagar Haveli 11.02 11.92 11.20Daman & Diu 8.55 1134 9.41Lakshadweep 10.08 13.10 11.37Puducherry 8.18 10.43 9.74
IND INDIA IA 8.39 9.45 8.67Source:
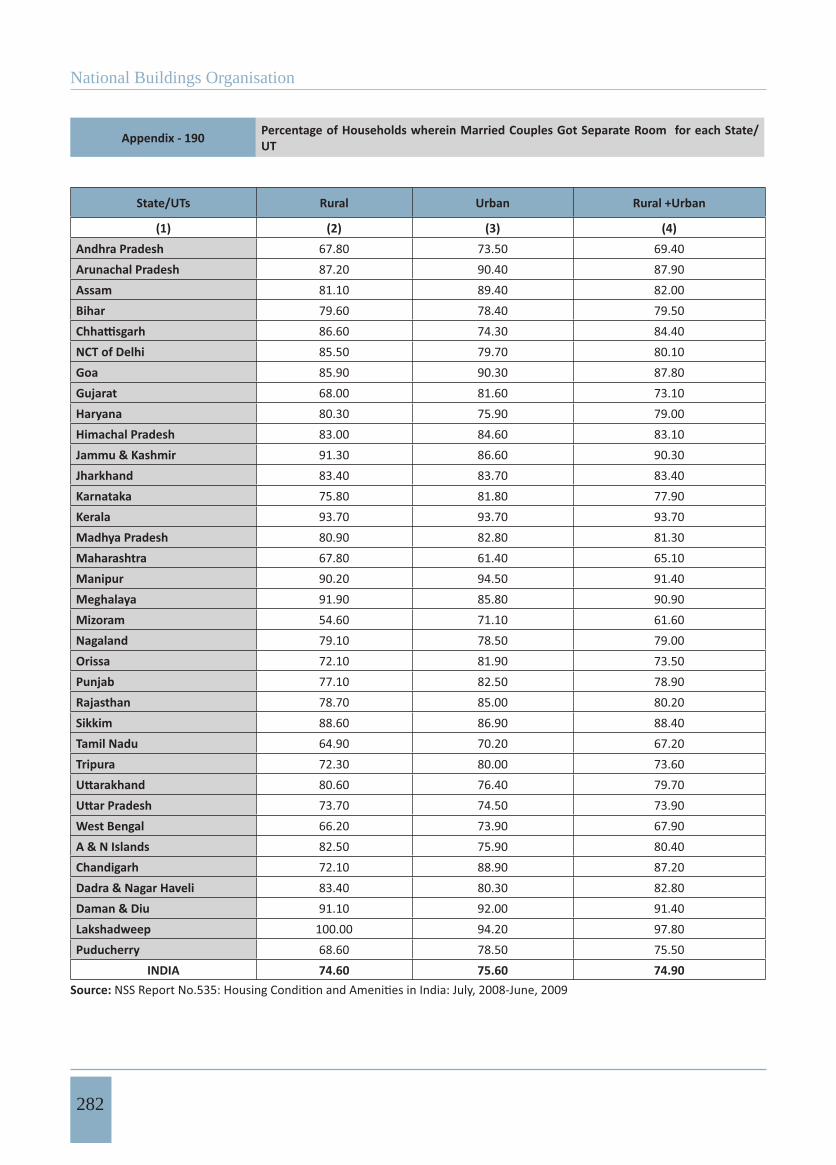
National Buildings Organisation
282
Appendix - 190 Percentage of Households wherein Married Couples Got Separate Room for each State/UT
State/UTs Rural Urban Rural +Urban
(1) (2) (3) (4)Andhra Pradesh 67.80 73.50 69.40Arunachal Pradesh 87.20 90.40 87.90Assam 81.10 89.40 82.00Bihar 79.60 78.40 79.50
86.60 74.30 84.40NCT of Delhi 85.50 79.70 80.10Goa 85.90 90.30 87.80Gujarat 68.00 81.60 73.10Haryana 80.30 75.90 79.00Himachal Pradesh 83.00 84.60 83.10Jammu & Kashmir 91.30 86.60 90.30Jharkhand 83.40 83.70 83.40Karnataka 75.80 81.80 77.90Kerala 93.70 93.70 93.70Madhya Pradesh 80.90 82.80 81.30Maharashtra 67.80 61.40 65.10Manipur 90.20 94.50 91.40Meghalaya 91.90 85.80 90.90Mizoram 54.60 71.10 61.60Nagaland 79.10 78.50 79.00Orissa 72.10 81.90 73.50Punjab 77.10 82.50 78.90Rajasthan 78.70 85.00 80.20Sikkim 88.60 86.90 88.40Tamil Nadu 64.90 70.20 67.20Tripura 72.30 80.00 73.60
80.60 76.40 79.7073.70 74.50 73.90
West Bengal 66.20 73.90 67.90A & N Islands 82.50 75.90 80.40Chandigarh 72.10 88.90 87.20Dadra & Nagar Haveli 83.40 80.30 82.80Daman & Diu 91.10 92.00 91.40Lakshadweep 100.00 94.20 97.80Puducherry 68.60 78.50 75.50
INDIA 74.60 75.60 74.90Source:
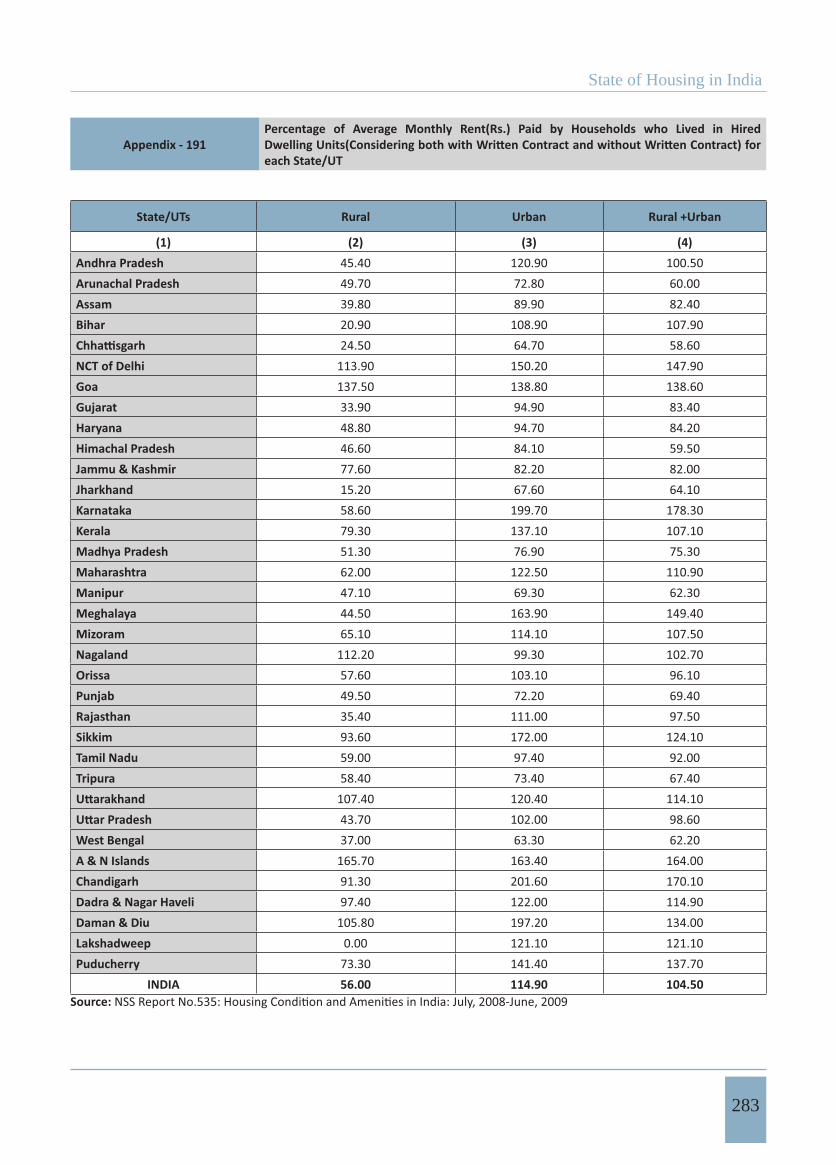
State of Housing in India
283
Appendix - 191Percentage of Average Monthly Rent(Rs.) Paid by Households who Lived in Hired
each State/UT
State/UTs Rural Urban Rural +Urban
(1) (2) (3) (4)Andhra Pradesh 45.40 120.90 100.50Arunachal Pradesh 49.70 72.80 60.00Assam 39.80 89.90 82.40Bihar 20.90 108.90 107.90
24.50 64.70 58.60NCT of Delhi 113.90 150.20 147.90Goa 137.50 138.80 138.60Gujarat 33.90 94.90 83.40Haryana 48.80 94.70 84.20Himachal Pradesh 46.60 84.10 59.50Jammu & Kashmir 77.60 82.20 82.00Jharkhand 15.20 67.60 64.10Karnataka 58.60 199.70 178.30Kerala 79.30 137.10 107.10Madhya Pradesh 51.30 76.90 75.30Maharashtra 62.00 122.50 110.90Manipur 47.10 69.30 62.30Meghalaya 44.50 163.90 149.40Mizoram 65.10 114.10 107.50Nagaland 112.20 99.30 102.70Orissa 57.60 103.10 96.10Punjab 49.50 72.20 69.40Rajasthan 35.40 111.00 97.50Sikkim 93.60 172.00 124.10Tamil Nadu 59.00 97.40 92.00Tripura 58.40 73.40 67.40
107.40 120.40 114.1043.70 102.00 98.60
West Bengal 37.00 63.30 62.20A & N Islands 165.70 163.40 164.00Chandigarh 91.30 201.60 170.10Dadra & Nagar Haveli 97.40 122.00 114.90Daman & Diu 105.80 197.20 134.00Lakshadweep 0.00 121.10 121.10Puducherry 73.30 141.40 137.70
INDIA 56.00 114.90 104.50Source:
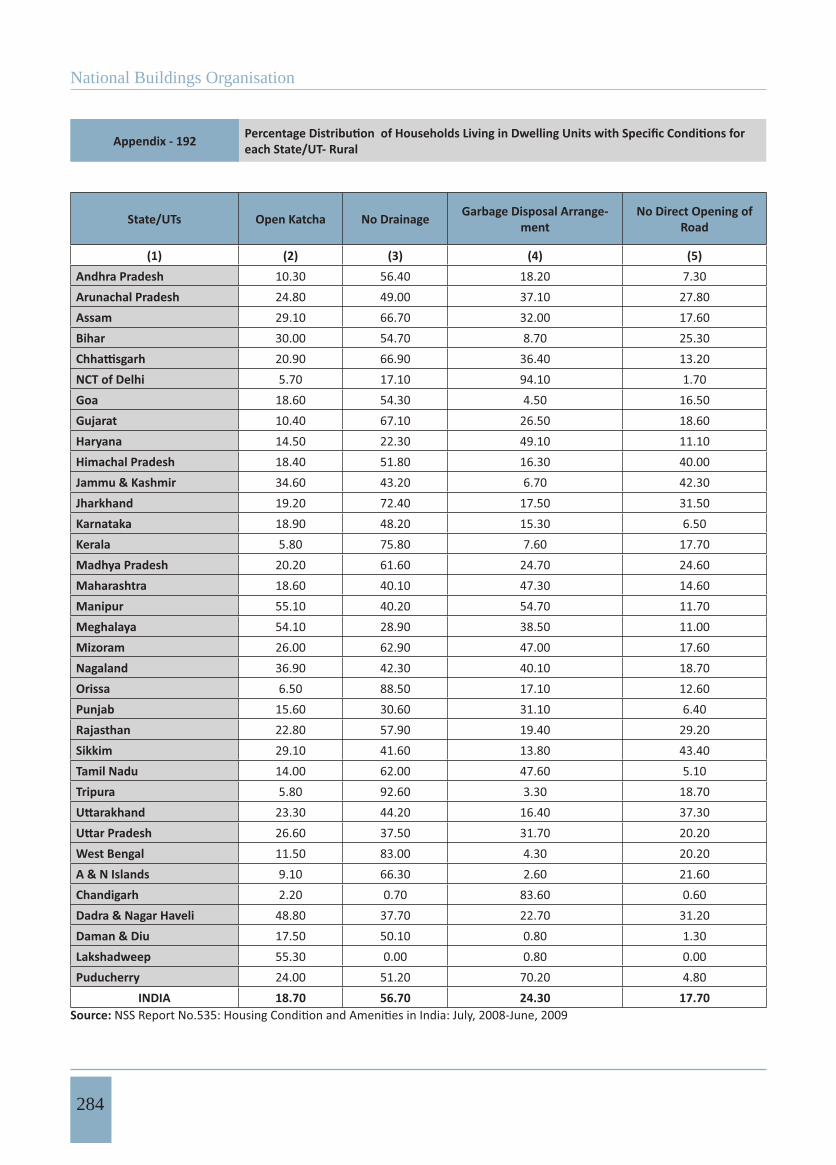
National Buildings Organisation
284
Appendix - 192 each State/UT- Rural
State/UTs Open Katcha No Drainage Garbage Disposal Arrange-ment
No Direct Opening of Road
(1) (2) (3) (4) (5)Andhra Pradesh 10.30 56.40 18.20 7.30Arunachal Pradesh 24.80 49.00 37.10 27.80Assam 29.10 66.70 32.00 17.60Bihar 30.00 54.70 8.70 25.30
20.90 66.90 36.40 13.20NCT of Delhi 5.70 17.10 94.10 1.70Goa 18.60 54.30 4.50 16.50Gujarat 10.40 67.10 26.50 18.60Haryana 14.50 22.30 49.10 11.10Himachal Pradesh 18.40 51.80 16.30 40.00Jammu & Kashmir 34.60 43.20 6.70 42.30Jharkhand 19.20 72.40 17.50 31.50Karnataka 18.90 48.20 15.30 6.50Kerala 5.80 75.80 7.60 17.70Madhya Pradesh 20.20 61.60 24.70 24.60Maharashtra 18.60 40.10 47.30 14.60Manipur 55.10 40.20 54.70 11.70Meghalaya 54.10 28.90 38.50 11.00Mizoram 26.00 62.90 47.00 17.60Nagaland 36.90 42.30 40.10 18.70Orissa 6.50 88.50 17.10 12.60Punjab 15.60 30.60 31.10 6.40Rajasthan 22.80 57.90 19.40 29.20Sikkim 29.10 41.60 13.80 43.40Tamil Nadu 14.00 62.00 47.60 5.10Tripura 5.80 92.60 3.30 18.70
23.30 44.20 16.40 37.3026.60 37.50 31.70 20.20
West Bengal 11.50 83.00 4.30 20.20A & N Islands 9.10 66.30 2.60 21.60Chandigarh 2.20 0.70 83.60 0.60Dadra & Nagar Haveli 48.80 37.70 22.70 31.20Daman & Diu 17.50 50.10 0.80 1.30Lakshadweep 55.30 0.00 0.80 0.00Puducherry 24.00 51.20 70.20 4.80
INDIA 18.70 56.70 24.30 17.70Source:
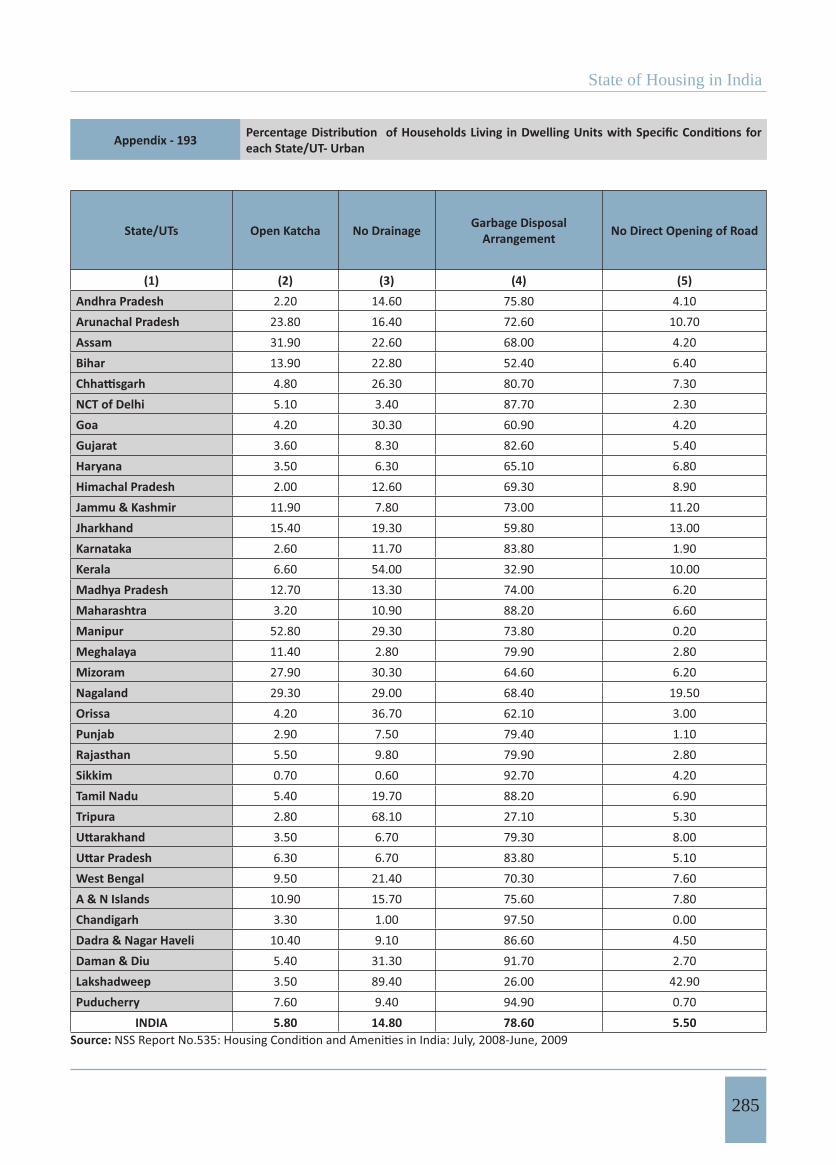
State of Housing in India
285
Appendix - 193 each State/UT- Urban
State/UTs Open Katcha No Drainage Garbage Disposal Arrangement No Direct Opening of Road
(1) (2) (3) (4) (5)Andhra Pradesh 2.20 14.60 75.80 4.10Arunachal Pradesh 23.80 16.40 72.60 10.70Assam 31.90 22.60 68.00 4.20Bihar 13.90 22.80 52.40 6.40
4.80 26.30 80.70 7.30NCT of Delhi 5.10 3.40 87.70 2.30Goa 4.20 30.30 60.90 4.20Gujarat 3.60 8.30 82.60 5.40Haryana 3.50 6.30 65.10 6.80Himachal Pradesh 2.00 12.60 69.30 8.90Jammu & Kashmir 11.90 7.80 73.00 11.20Jharkhand 15.40 19.30 59.80 13.00Karnataka 2.60 11.70 83.80 1.90Kerala 6.60 54.00 32.90 10.00Madhya Pradesh 12.70 13.30 74.00 6.20Maharashtra 3.20 10.90 88.20 6.60Manipur 52.80 29.30 73.80 0.20Meghalaya 11.40 2.80 79.90 2.80Mizoram 27.90 30.30 64.60 6.20Nagaland 29.30 29.00 68.40 19.50Orissa 4.20 36.70 62.10 3.00Punjab 2.90 7.50 79.40 1.10Rajasthan 5.50 9.80 79.90 2.80Sikkim 0.70 0.60 92.70 4.20Tamil Nadu 5.40 19.70 88.20 6.90Tripura 2.80 68.10 27.10 5.30
3.50 6.70 79.30 8.006.30 6.70 83.80 5.10
West Bengal 9.50 21.40 70.30 7.60A & N Islands 10.90 15.70 75.60 7.80Chandigarh 3.30 1.00 97.50 0.00Dadra & Nagar Haveli 10.40 9.10 86.60 4.50Daman & Diu 5.40 31.30 91.70 2.70Lakshadweep 3.50 89.40 26.00 42.90Puducherry 7.60 9.40 94.90 0.70
INDIA 5.80 14.80 78.60 5.50Source:
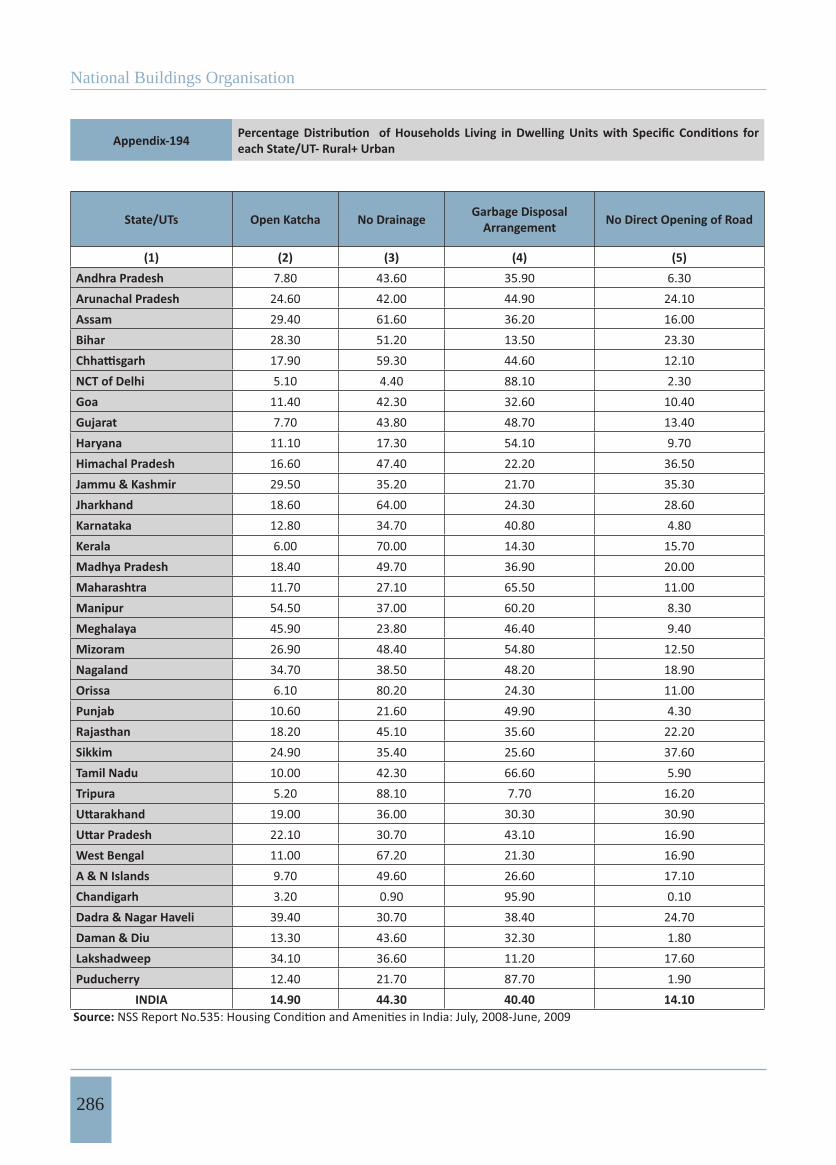
National Buildings Organisation
286
Appendix-194 each State/UT- Rural+ Urban
State/UTs Open Katcha No Drainage Garbage Disposal Arrangement No Direct Opening of Road
(1) (2) (3) (4) (5)Andhra Pradesh 7.80 43.60 35.90 6.30Arunachal Pradesh 24.60 42.00 44.90 24.10Assam 29.40 61.60 36.20 16.00Bihar 28.30 51.20 13.50 23.30
17.90 59.30 44.60 12.10NCT of Delhi 5.10 4.40 88.10 2.30Goa 11.40 42.30 32.60 10.40Gujarat 7.70 43.80 48.70 13.40Haryana 11.10 17.30 54.10 9.70Himachal Pradesh 16.60 47.40 22.20 36.50Jammu & Kashmir 29.50 35.20 21.70 35.30Jharkhand 18.60 64.00 24.30 28.60Karnataka 12.80 34.70 40.80 4.80Kerala 6.00 70.00 14.30 15.70Madhya Pradesh 18.40 49.70 36.90 20.00Maharashtra 11.70 27.10 65.50 11.00Manipur 54.50 37.00 60.20 8.30Meghalaya 45.90 23.80 46.40 9.40Mizoram 26.90 48.40 54.80 12.50Nagaland 34.70 38.50 48.20 18.90Orissa 6.10 80.20 24.30 11.00Punjab 10.60 21.60 49.90 4.30Rajasthan 18.20 45.10 35.60 22.20Sikkim 24.90 35.40 25.60 37.60Tamil Nadu 10.00 42.30 66.60 5.90Tripura 5.20 88.10 7.70 16.20
19.00 36.00 30.30 30.9022.10 30.70 43.10 16.90
West Bengal 11.00 67.20 21.30 16.90A & N Islands 9.70 49.60 26.60 17.10Chandigarh 3.20 0.90 95.90 0.10Dadra & Nagar Haveli 39.40 30.70 38.40 24.70Daman & Diu 13.30 43.60 32.30 1.80Lakshadweep 34.10 36.60 11.20 17.60Puducherry 12.40 21.70 87.70 1.90
INDIA 14.90 44.30 40.40 14.10 Source:
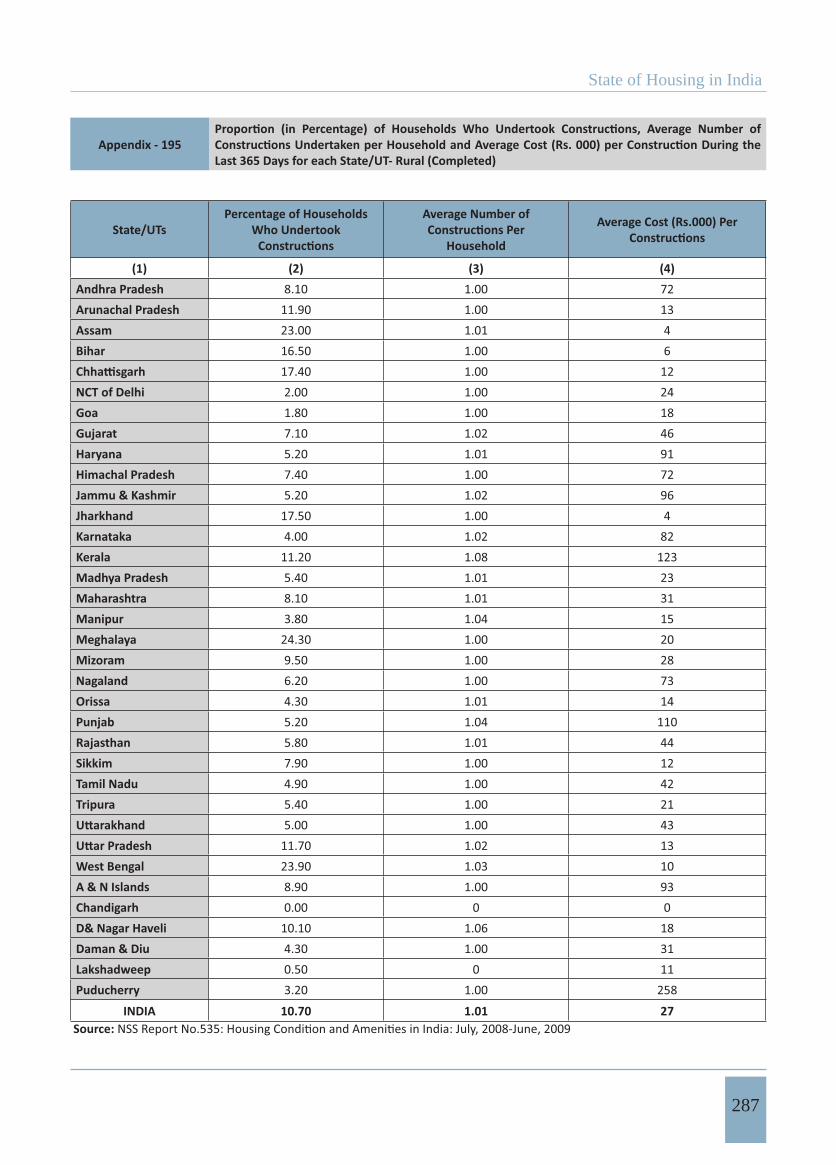
State of Housing in India
287
Appendix - 195Last 365 Days for each State/UT- Rural (Completed)
State/UTsPercentage of Households
Who Undertook Average Number of
Household
Average Cost (Rs.000) Per
(1) (2) (3) (4)Andhra Pradesh 8.10 1.00 72Arunachal Pradesh 11.90 1.00 13Assam 23.00 1.01 4Bihar 16.50 1.00 6
17.40 1.00 12NCT of Delhi 2.00 1.00 24Goa 1.80 1.00 18Gujarat 7.10 1.02 46Haryana 5.20 1.01 91Himachal Pradesh 7.40 1.00 72Jammu & Kashmir 5.20 1.02 96Jharkhand 17.50 1.00 4Karnataka 4.00 1.02 82Kerala 11.20 1.08 123Madhya Pradesh 5.40 1.01 23Maharashtra 8.10 1.01 31Manipur 3.80 1.04 15Meghalaya 24.30 1.00 20Mizoram 9.50 1.00 28Nagaland 6.20 1.00 73Orissa 4.30 1.01 14Punjab 5.20 1.04 110Rajasthan 5.80 1.01 44Sikkim 7.90 1.00 12Tamil Nadu 4.90 1.00 42Tripura 5.40 1.00 21
5.00 1.00 4311.70 1.02 13
West Bengal 23.90 1.03 10A & N Islands 8.90 1.00 93Chandigarh 0.00 0 0D& Nagar Haveli 10.10 1.06 18Daman & Diu 4.30 1.00 31Lakshadweep 0.50 0 11Puducherry 3.20 1.00 258
INDIA 10.70 1.01 27 Source:
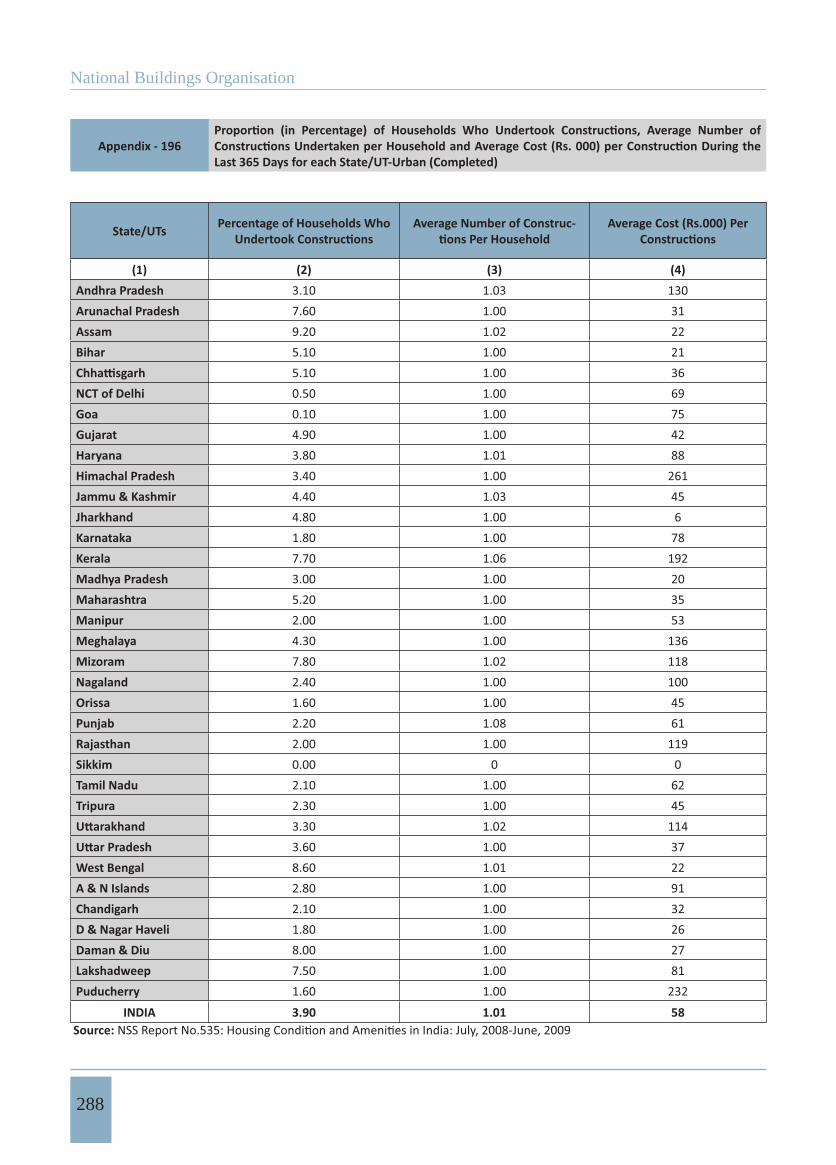
National Buildings Organisation
288
Appendix - 196Last 365 Days for each State/UT-Urban (Completed)
State/UTs Percentage of Households Who Average Number of Construc- Average Cost (Rs.000) Per
(1) (2) (3) (4)Andhra Pradesh 3.10 1.03 130Arunachal Pradesh 7.60 1.00 31Assam 9.20 1.02 22Bihar 5.10 1.00 21
5.10 1.00 36NCT of Delhi 0.50 1.00 69Goa 0.10 1.00 75Gujarat 4.90 1.00 42Haryana 3.80 1.01 88Himachal Pradesh 3.40 1.00 261Jammu & Kashmir 4.40 1.03 45Jharkhand 4.80 1.00 6Karnataka 1.80 1.00 78Kerala 7.70 1.06 192Madhya Pradesh 3.00 1.00 20Maharashtra 5.20 1.00 35Manipur 2.00 1.00 53Meghalaya 4.30 1.00 136Mizoram 7.80 1.02 118Nagaland 2.40 1.00 100Orissa 1.60 1.00 45Punjab 2.20 1.08 61Rajasthan 2.00 1.00 119Sikkim 0.00 0 0Tamil Nadu 2.10 1.00 62Tripura 2.30 1.00 45
3.30 1.02 1143.60 1.00 37
West Bengal 8.60 1.01 22A & N Islands 2.80 1.00 91Chandigarh 2.10 1.00 32D & Nagar Haveli 1.80 1.00 26Daman & Diu 8.00 1.00 27Lakshadweep 7.50 1.00 81Puducherry 1.60 1.00 232
INDIA 3.90 1.01 58 Source:
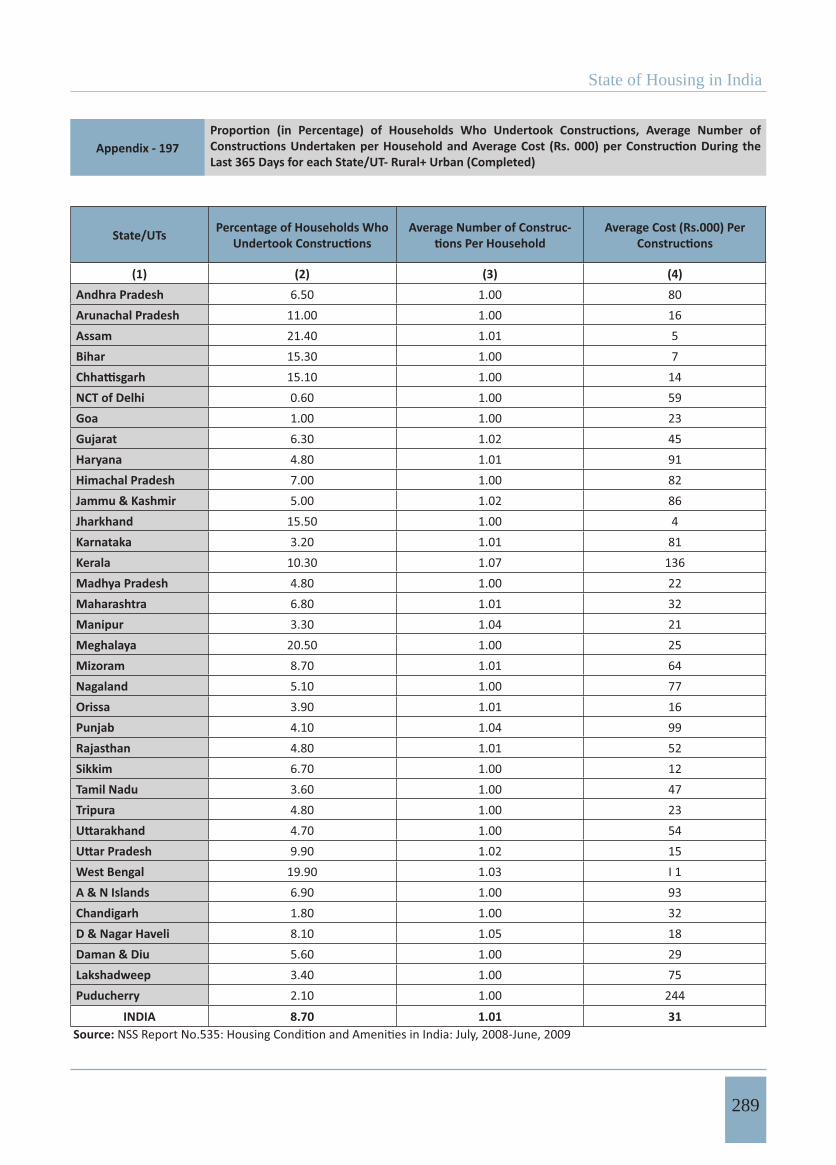
State of Housing in India
289
Appendix - 197Last 365 Days for each State/UT- Rural+ Urban (Completed)
State/UTs Percentage of Households Who Average Number of Construc- Average Cost (Rs.000) Per
(1) (2) (3) (4)Andhra Pradesh 6.50 1.00 80Arunachal Pradesh 11.00 1.00 16Assam 21.40 1.01 5Bihar 15.30 1.00 7
15.10 1.00 14NCT of Delhi 0.60 1.00 59Goa 1.00 1.00 23Gujarat 6.30 1.02 45Haryana 4.80 1.01 91Himachal Pradesh 7.00 1.00 82Jammu & Kashmir 5.00 1.02 86Jharkhand 15.50 1.00 4Karnataka 3.20 1.01 81Kerala 10.30 1.07 136Madhya Pradesh 4.80 1.00 22Maharashtra 6.80 1.01 32Manipur 3.30 1.04 21Meghalaya 20.50 1.00 25Mizoram 8.70 1.01 64Nagaland 5.10 1.00 77Orissa 3.90 1.01 16Punjab 4.10 1.04 99Rajasthan 4.80 1.01 52Sikkim 6.70 1.00 12Tamil Nadu 3.60 1.00 47Tripura 4.80 1.00 23
4.70 1.00 549.90 1.02 15
West Bengal 19.90 1.03 I 1A & N Islands 6.90 1.00 93Chandigarh 1.80 1.00 32D & Nagar Haveli 8.10 1.05 18Daman & Diu 5.60 1.00 29Lakshadweep 3.40 1.00 75Puducherry 2.10 1.00 244
INDIA 8.70 1.01 31 Source:
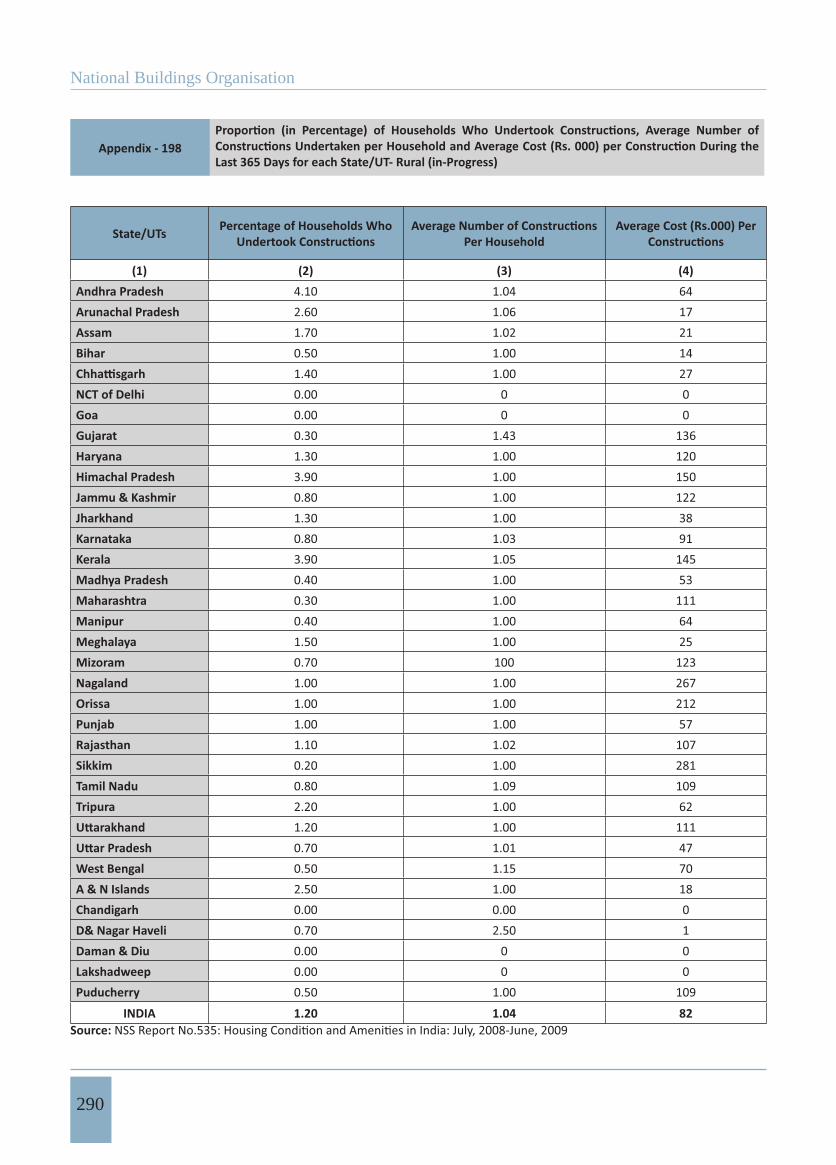
National Buildings Organisation
290
Appendix - 198Last 365 Days for each State/UT- Rural (in-Progress)
State/UTs Percentage of Households Who Per Household
Average Cost (Rs.000) Per
(1) (2) (3) (4)Andhra Pradesh 4.10 1.04 64Arunachal Pradesh 2.60 1.06 17Assam 1.70 1.02 21Bihar 0.50 1.00 14
1.40 1.00 27NCT of Delhi 0.00 0 0Goa 0.00 0 0Gujarat 0.30 1.43 136Haryana 1.30 1.00 120Himachal Pradesh 3.90 1.00 150Jammu & Kashmir 0.80 1.00 122Jharkhand 1.30 1.00 38Karnataka 0.80 1.03 91Kerala 3.90 1.05 145Madhya Pradesh 0.40 1.00 53Maharashtra 0.30 1.00 111Manipur 0.40 1.00 64Meghalaya 1.50 1.00 25Mizoram 0.70 100 123Nagaland 1.00 1.00 267Orissa 1.00 1.00 212Punjab 1.00 1.00 57Rajasthan 1.10 1.02 107Sikkim 0.20 1.00 281Tamil Nadu 0.80 1.09 109Tripura 2.20 1.00 62
1.20 1.00 1110.70 1.01 47
West Bengal 0.50 1.15 70A & N Islands 2.50 1.00 18Chandigarh 0.00 0.00 0D& Nagar Haveli 0.70 2.50 1Daman & Diu 0.00 0 0Lakshadweep 0.00 0 0Puducherry 0.50 1.00 109
INDIA 1.20 1.04 82Source:
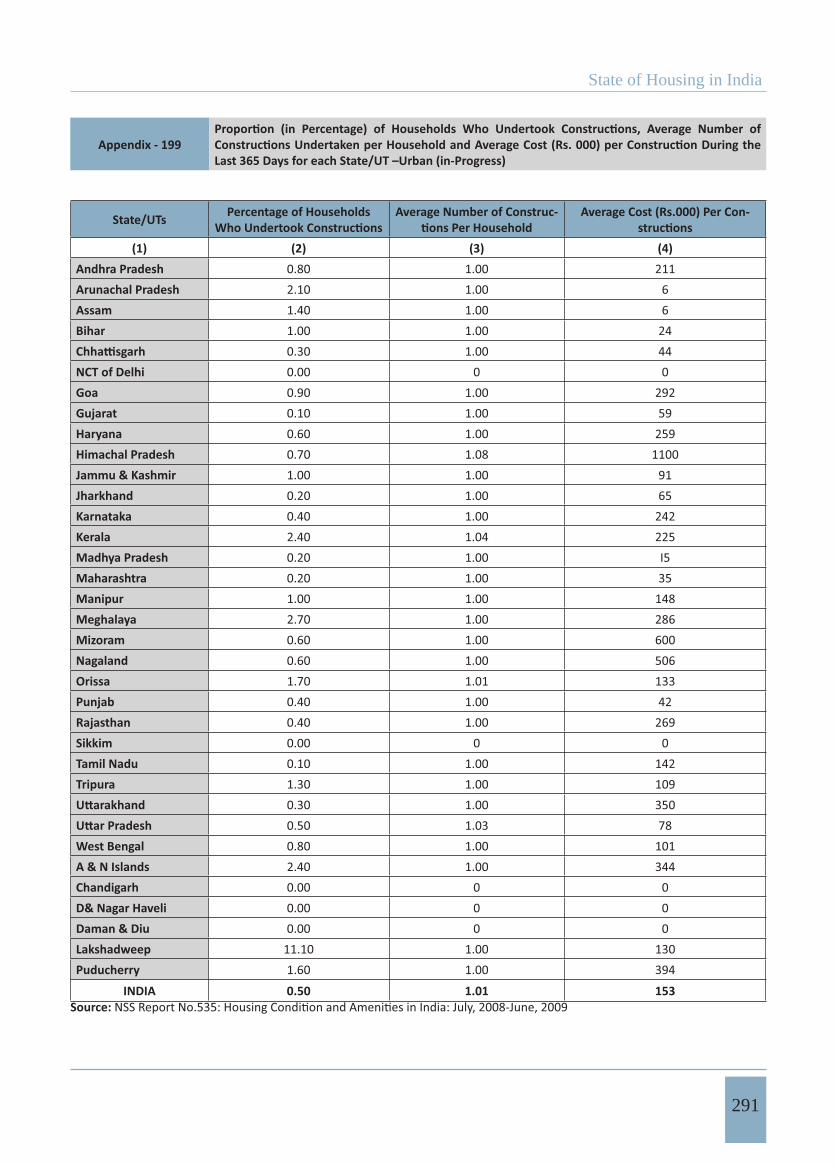
State of Housing in India
291
Appendix - 199Last 365 Days for each State/UT –Urban (in-Progress)
State/UTs Percentage of Households Average Number of Construc- Average Cost (Rs.000) Per Con-
(1) (2) (3) (4)Andhra Pradesh 0.80 1.00 211Arunachal Pradesh 2.10 1.00 6Assam 1.40 1.00 6Bihar 1.00 1.00 24
0.30 1.00 44NCT of Delhi 0.00 0 0Goa 0.90 1.00 292Gujarat 0.10 1.00 59Haryana 0.60 1.00 259Himachal Pradesh 0.70 1.08 1100Jammu & Kashmir 1.00 1.00 91Jharkhand 0.20 1.00 65Karnataka 0.40 1.00 242Kerala 2.40 1.04 225Madhya Pradesh 0.20 1.00 I5Maharashtra 0.20 1.00 35Manipur 1.00 1.00 148Meghalaya 2.70 1.00 286Mizoram 0.60 1.00 600Nagaland 0.60 1.00 506Orissa 1.70 1.01 133Punjab 0.40 1.00 42Rajasthan 0.40 1.00 269Sikkim 0.00 0 0Tamil Nadu 0.10 1.00 142Tripura 1.30 1.00 109
0.30 1.00 3500.50 1.03 78
West Bengal 0.80 1.00 101A & N Islands 2.40 1.00 344Chandigarh 0.00 0 0D& Nagar Haveli 0.00 0 0Daman & Diu 0.00 0 0Lakshadweep 11.10 1.00 130Puducherry 1.60 1.00 394
INDIA 0.50 1.01 153Source:
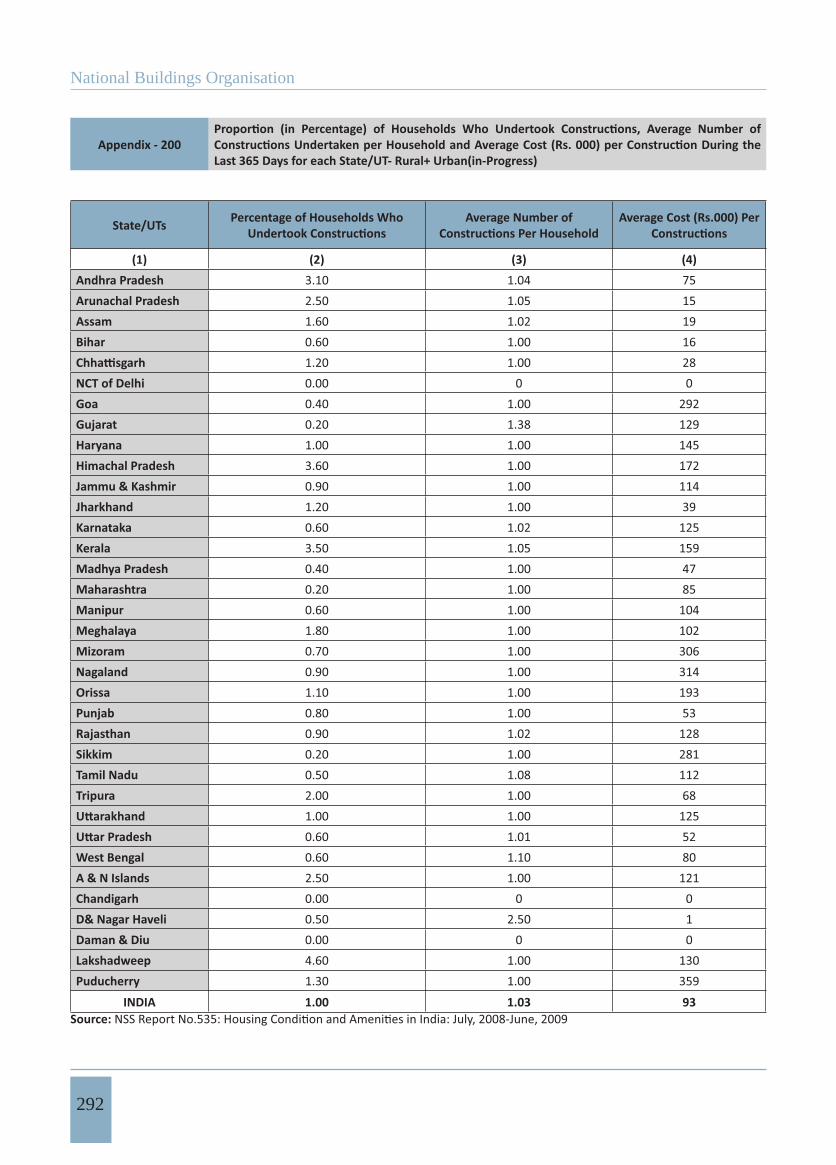
National Buildings Organisation
292
Appendix - 200Last 365 Days for each State/UT- Rural+ Urban(in-Progress)
State/UTs Percentage of Households Who Average Number of Average Cost (Rs.000) Per
(1) (2) (3) (4)Andhra Pradesh 3.10 1.04 75Arunachal Pradesh 2.50 1.05 15Assam 1.60 1.02 19Bihar 0.60 1.00 16
1.20 1.00 28NCT of Delhi 0.00 0 0Goa 0.40 1.00 292Gujarat 0.20 1.38 129Haryana 1.00 1.00 145Himachal Pradesh 3.60 1.00 172Jammu & Kashmir 0.90 1.00 114Jharkhand 1.20 1.00 39Karnataka 0.60 1.02 125Kerala 3.50 1.05 159Madhya Pradesh 0.40 1.00 47Maharashtra 0.20 1.00 85Manipur 0.60 1.00 104Meghalaya 1.80 1.00 102Mizoram 0.70 1.00 306Nagaland 0.90 1.00 314Orissa 1.10 1.00 193Punjab 0.80 1.00 53Rajasthan 0.90 1.02 128Sikkim 0.20 1.00 281Tamil Nadu 0.50 1.08 112Tripura 2.00 1.00 68
1.00 1.00 1250.60 1.01 52
West Bengal 0.60 1.10 80A & N Islands 2.50 1.00 121Chandigarh 0.00 0 0D& Nagar Haveli 0.50 2.50 1Daman & Diu 0.00 0 0Lakshadweep 4.60 1.00 130Puducherry 1.30 1.00 359
INDIA 1.00 1.03 93Source:

State of Housing in India
293
Appendix - 201Last 365 Days for each State/UT-Rural (All)
State/UTs Percentage of Households Who Average Number of Construc- Average Cost (Rs.000) Per
(1) (2) (3) (4)Andhra Pradesh 12.20 1.01 69Arunachal Pradesh 14.70 1.01 13Assam 24.70 1.01 5Bihar 17.20 1.00 7
19.50 1.00 13NCT of Delhi 2.00 1.00 24Goa 1.80 1.00 18Gujarat 7.40 1.04 51Haryana 6.50 1.00 97Himachal Pradesh 11.30 1.00 99Jammu & Kashmir 6.00 1.01 100Jharkhand 19.00 1.00 7Karnataka 4.70 1.02 84Kerala 15.10 1.07 128Madhya Pradesh 5.80 1.01 25Maharashtra 8.40 1.01 34Manipur 4.30 1.04 20Meghalaya 26.00 1.00 20Mizoram 10.20 1.00 35Nagaland 7.20 1.00 100Orissa 5.30 1.01 51Punjab 6.20 1.03 102Rajasthan 6.90 1.01 54Sikkim 8.20 1.00 18Tamil Nadu 5.70 1.01 51Tripura 7.50 1.00 33
6.30 1.00 5612.40 1.02 15
West Bengal 24.40 1.03 11A & N Islands 11.40 1.00 77Chandigarh - - -D& Nagar Haveli 10.80 1.10 16Daman & Diu 4.30 1.00 31Lakshadweep 0.50 - IIPuducherry 3.80 1.00 236
INDIA 12.00 1.02 32Source:
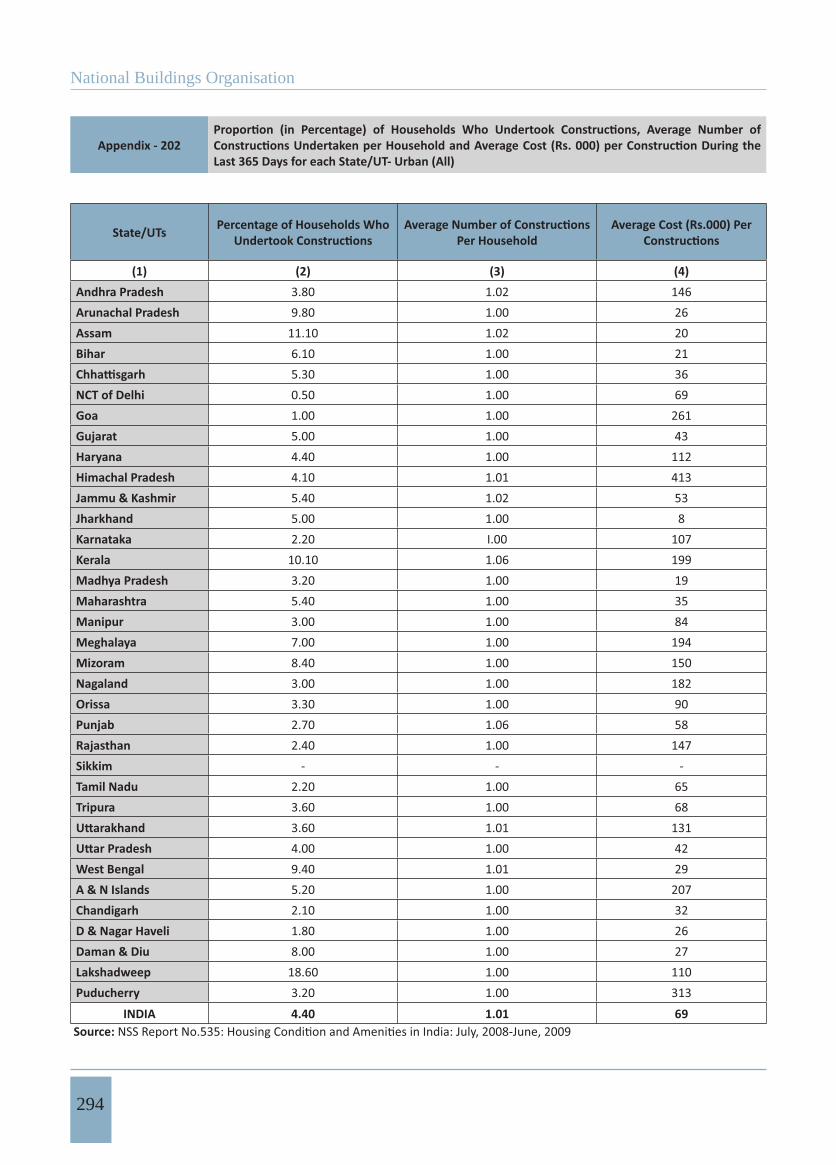
National Buildings Organisation
294
Appendix - 202Last 365 Days for each State/UT- Urban (All)
State/UTs Percentage of Households Who Per Household
Average Cost (Rs.000) Per
(1) (2) (3) (4)Andhra Pradesh 3.80 1.02 146Arunachal Pradesh 9.80 1.00 26Assam 11.10 1.02 20Bihar 6.10 1.00 21
5.30 1.00 36NCT of Delhi 0.50 1.00 69Goa 1.00 1.00 261Gujarat 5.00 1.00 43Haryana 4.40 1.00 112Himachal Pradesh 4.10 1.01 413Jammu & Kashmir 5.40 1.02 53Jharkhand 5.00 1.00 8Karnataka 2.20 I.00 107Kerala 10.10 1.06 199Madhya Pradesh 3.20 1.00 19Maharashtra 5.40 1.00 35Manipur 3.00 1.00 84Meghalaya 7.00 1.00 194Mizoram 8.40 1.00 150Nagaland 3.00 1.00 182Orissa 3.30 1.00 90Punjab 2.70 1.06 58Rajasthan 2.40 1.00 147Sikkim - - -Tamil Nadu 2.20 1.00 65Tripura 3.60 1.00 68
3.60 1.01 1314.00 1.00 42
West Bengal 9.40 1.01 29A & N Islands 5.20 1.00 207Chandigarh 2.10 1.00 32D & Nagar Haveli 1.80 1.00 26Daman & Diu 8.00 1.00 27Lakshadweep 18.60 1.00 110Puducherry 3.20 1.00 313
INDIA 4.40 1.01 69Source:
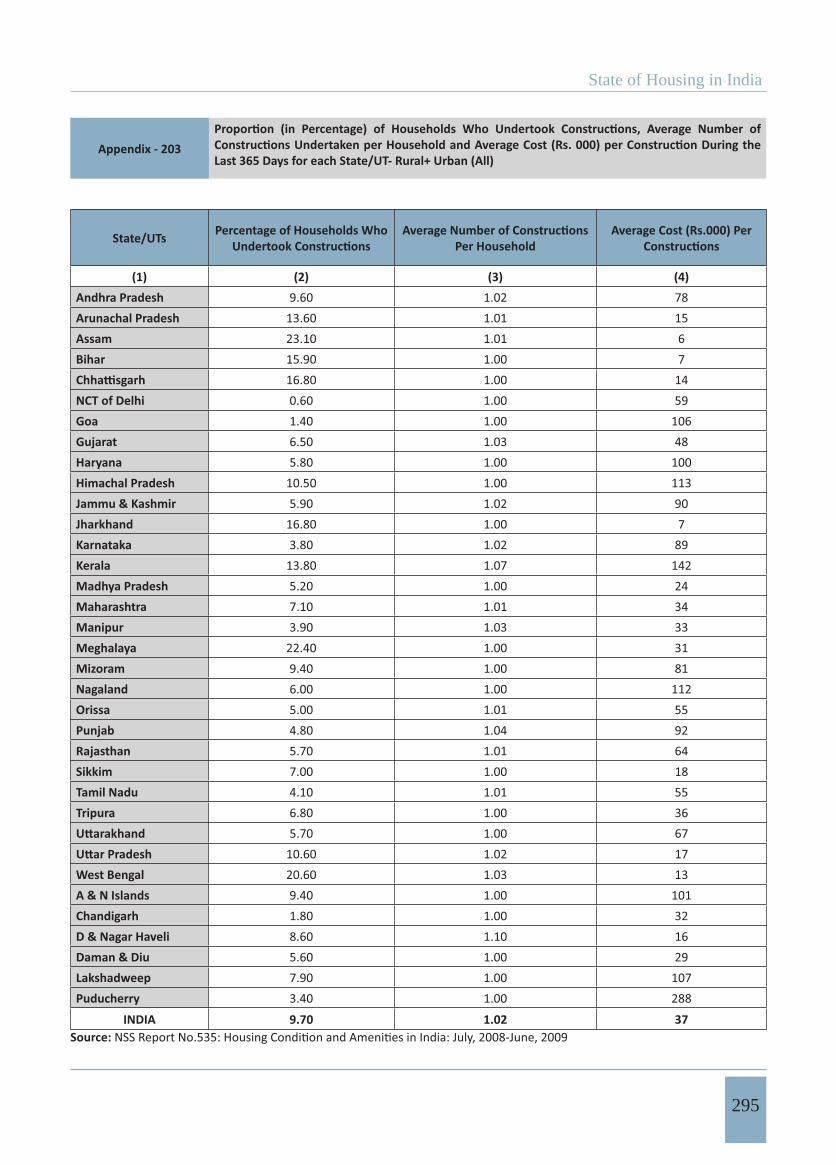
State of Housing in India
295
Appendix - 203Last 365 Days for each State/UT- Rural+ Urban (All)
State/UTs Percentage of Households Who Per Household
Average Cost (Rs.000) Per
(1) (2) (3) (4)Andhra Pradesh 9.60 1.02 78Arunachal Pradesh 13.60 1.01 15Assam 23.10 1.01 6Bihar 15.90 1.00 7
16.80 1.00 14NCT of Delhi 0.60 1.00 59Goa 1.40 1.00 106Gujarat 6.50 1.03 48Haryana 5.80 1.00 100Himachal Pradesh 10.50 1.00 113Jammu & Kashmir 5.90 1.02 90Jharkhand 16.80 1.00 7Karnataka 3.80 1.02 89Kerala 13.80 1.07 142Madhya Pradesh 5.20 1.00 24Maharashtra 7.10 1.01 34Manipur 3.90 1.03 33Meghalaya 22.40 1.00 31Mizoram 9.40 1.00 81Nagaland 6.00 1.00 112Orissa 5.00 1.01 55Punjab 4.80 1.04 92Rajasthan 5.70 1.01 64Sikkim 7.00 1.00 18Tamil Nadu 4.10 1.01 55Tripura 6.80 1.00 36
5.70 1.00 6710.60 1.02 17
West Bengal 20.60 1.03 13A & N Islands 9.40 1.00 101Chandigarh 1.80 1.00 32D & Nagar Haveli 8.60 1.10 16Daman & Diu 5.60 1.00 29Lakshadweep 7.90 1.00 107Puducherry 3.40 1.00 288
INDIA 9.70 1.02 37Source:
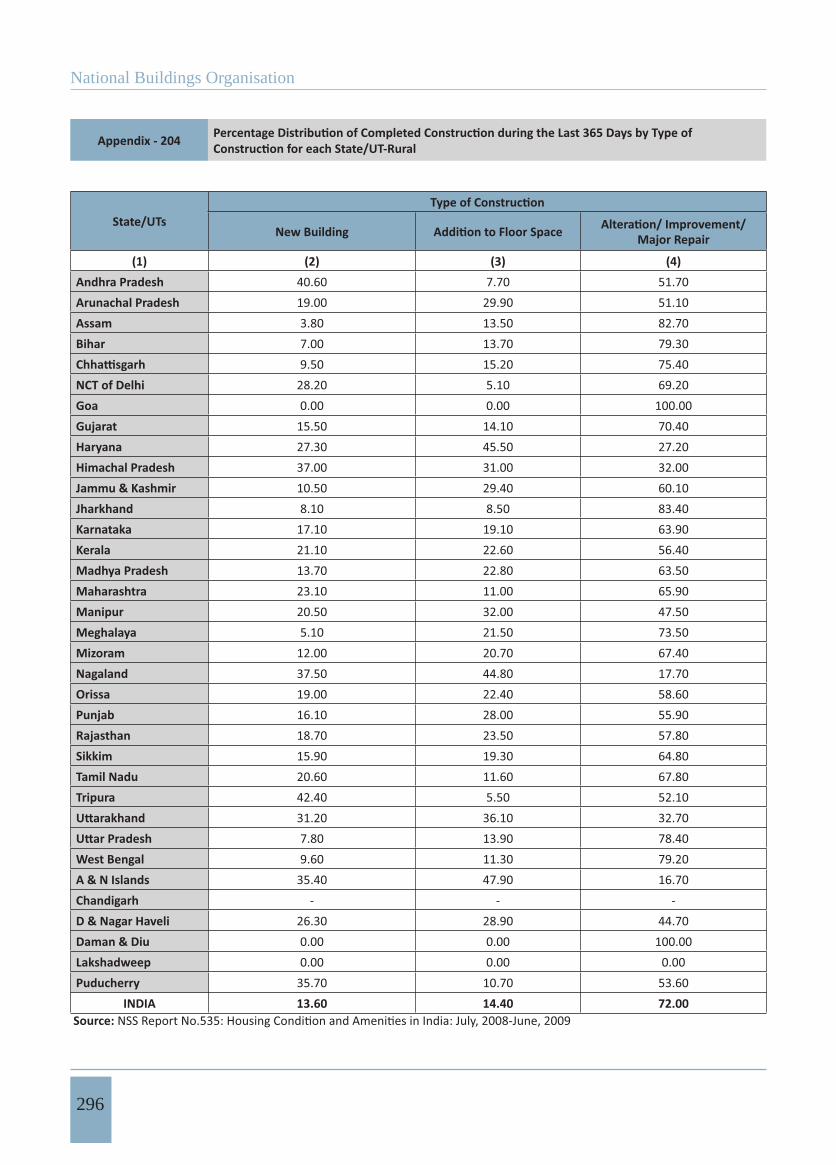
National Buildings Organisation
296
Appendix - 204
State/UTsNew Building Major Repair
(1) (2) (3) (4)Andhra Pradesh 40.60 7.70 51.70Arunachal Pradesh 19.00 29.90 51.10Assam 3.80 13.50 82.70Bihar 7.00 13.70 79.30
9.50 15.20 75.40NCT of Delhi 28.20 5.10 69.20Goa 0.00 0.00 100.00Gujarat 15.50 14.10 70.40Haryana 27.30 45.50 27.20Himachal Pradesh 37.00 31.00 32.00Jammu & Kashmir 10.50 29.40 60.10Jharkhand 8.10 8.50 83.40Karnataka 17.10 19.10 63.90Kerala 21.10 22.60 56.40Madhya Pradesh 13.70 22.80 63.50Maharashtra 23.10 11.00 65.90Manipur 20.50 32.00 47.50Meghalaya 5.10 21.50 73.50Mizoram 12.00 20.70 67.40Nagaland 37.50 44.80 17.70Orissa 19.00 22.40 58.60Punjab 16.10 28.00 55.90Rajasthan 18.70 23.50 57.80Sikkim 15.90 19.30 64.80Tamil Nadu 20.60 11.60 67.80Tripura 42.40 5.50 52.10
31.20 36.10 32.707.80 13.90 78.40
West Bengal 9.60 11.30 79.20A & N Islands 35.40 47.90 16.70Chandigarh - - -D & Nagar Haveli 26.30 28.90 44.70Daman & Diu 0.00 0.00 100.00Lakshadweep 0.00 0.00 0.00Puducherry 35.70 10.70 53.60
INDIA 13.60 14.40 72.00 Source:
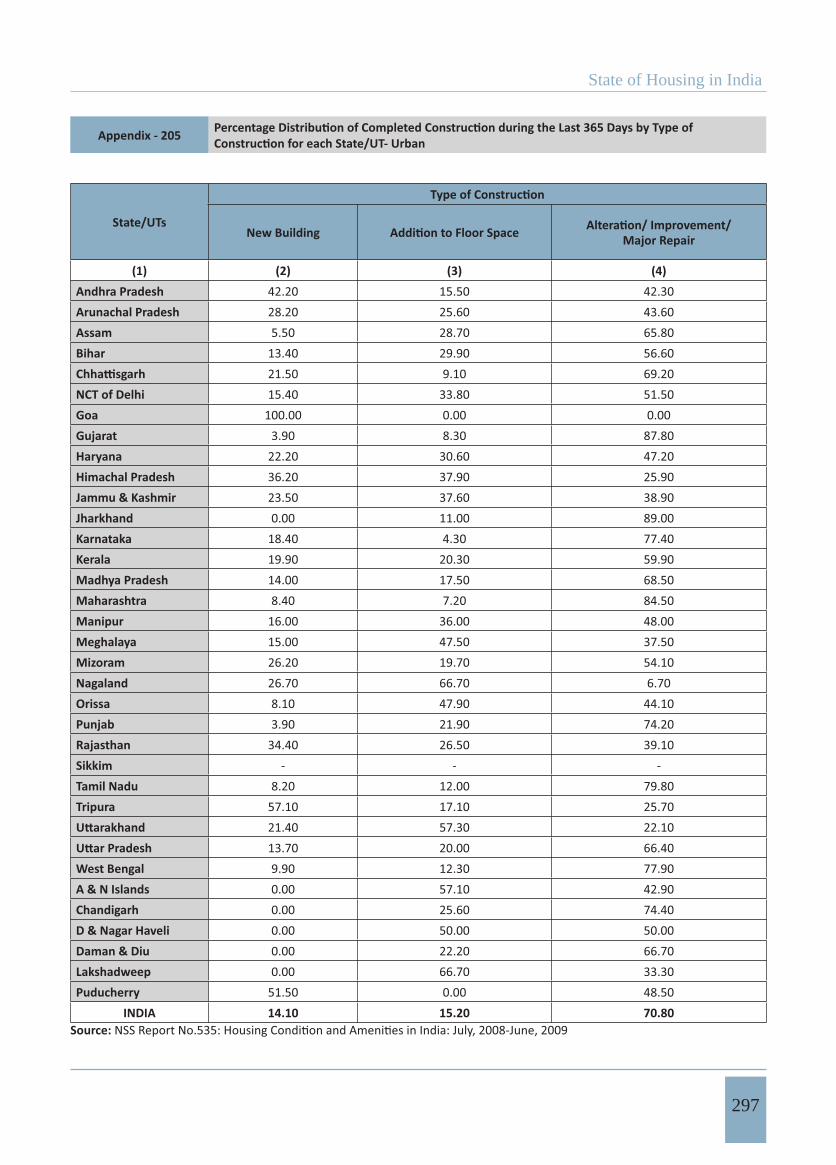
State of Housing in India
297
Appendix - 205
State/UTsNew Building Major Repair
(1) (2) (3) (4)Andhra Pradesh 42.20 15.50 42.30Arunachal Pradesh 28.20 25.60 43.60Assam 5.50 28.70 65.80Bihar 13.40 29.90 56.60
21.50 9.10 69.20NCT of Delhi 15.40 33.80 51.50Goa 100.00 0.00 0.00Gujarat 3.90 8.30 87.80Haryana 22.20 30.60 47.20Himachal Pradesh 36.20 37.90 25.90Jammu & Kashmir 23.50 37.60 38.90Jharkhand 0.00 11.00 89.00Karnataka 18.40 4.30 77.40Kerala 19.90 20.30 59.90Madhya Pradesh 14.00 17.50 68.50Maharashtra 8.40 7.20 84.50Manipur 16.00 36.00 48.00Meghalaya 15.00 47.50 37.50Mizoram 26.20 19.70 54.10Nagaland 26.70 66.70 6.70Orissa 8.10 47.90 44.10Punjab 3.90 21.90 74.20Rajasthan 34.40 26.50 39.10Sikkim - - -Tamil Nadu 8.20 12.00 79.80Tripura 57.10 17.10 25.70
21.40 57.30 22.1013.70 20.00 66.40
West Bengal 9.90 12.30 77.90A & N Islands 0.00 57.10 42.90Chandigarh 0.00 25.60 74.40D & Nagar Haveli 0.00 50.00 50.00Daman & Diu 0.00 22.20 66.70Lakshadweep 0.00 66.70 33.30Puducherry 51.50 0.00 48.50
INDIA 14.10 15.20 70.80Source:
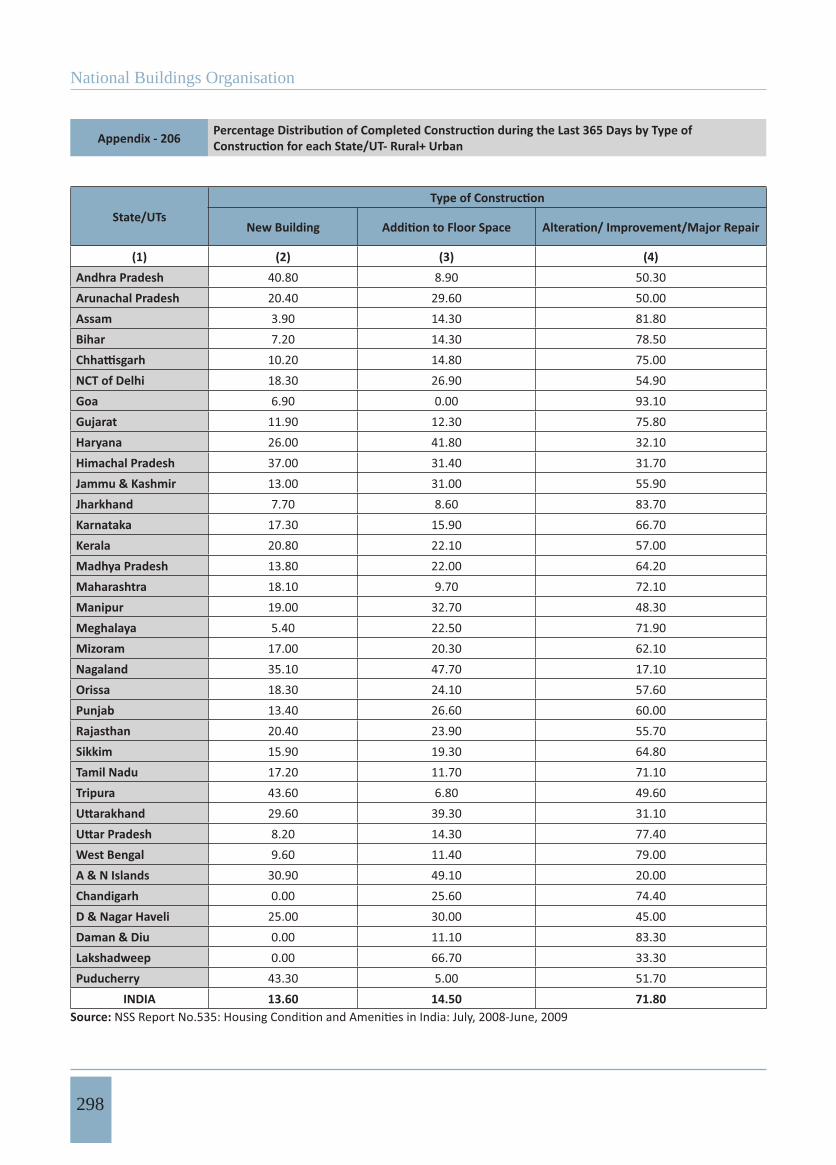
National Buildings Organisation
298
Appendix - 206
State/UTsNew Building
(1) (2) (3) (4)Andhra Pradesh 40.80 8.90 50.30Arunachal Pradesh 20.40 29.60 50.00Assam 3.90 14.30 81.80Bihar 7.20 14.30 78.50
10.20 14.80 75.00NCT of Delhi 18.30 26.90 54.90Goa 6.90 0.00 93.10Gujarat 11.90 12.30 75.80Haryana 26.00 41.80 32.10Himachal Pradesh 37.00 31.40 31.70Jammu & Kashmir 13.00 31.00 55.90Jharkhand 7.70 8.60 83.70Karnataka 17.30 15.90 66.70Kerala 20.80 22.10 57.00Madhya Pradesh 13.80 22.00 64.20Maharashtra 18.10 9.70 72.10Manipur 19.00 32.70 48.30Meghalaya 5.40 22.50 71.90Mizoram 17.00 20.30 62.10Nagaland 35.10 47.70 17.10Orissa 18.30 24.10 57.60Punjab 13.40 26.60 60.00Rajasthan 20.40 23.90 55.70Sikkim 15.90 19.30 64.80Tamil Nadu 17.20 11.70 71.10Tripura 43.60 6.80 49.60
29.60 39.30 31.108.20 14.30 77.40
West Bengal 9.60 11.40 79.00A & N Islands 30.90 49.10 20.00Chandigarh 0.00 25.60 74.40D & Nagar Haveli 25.00 30.00 45.00Daman & Diu 0.00 11.10 83.30Lakshadweep 0.00 66.70 33.30Puducherry 43.30 5.00 51.70
INDIA 13.60 14.50 71.80Source:
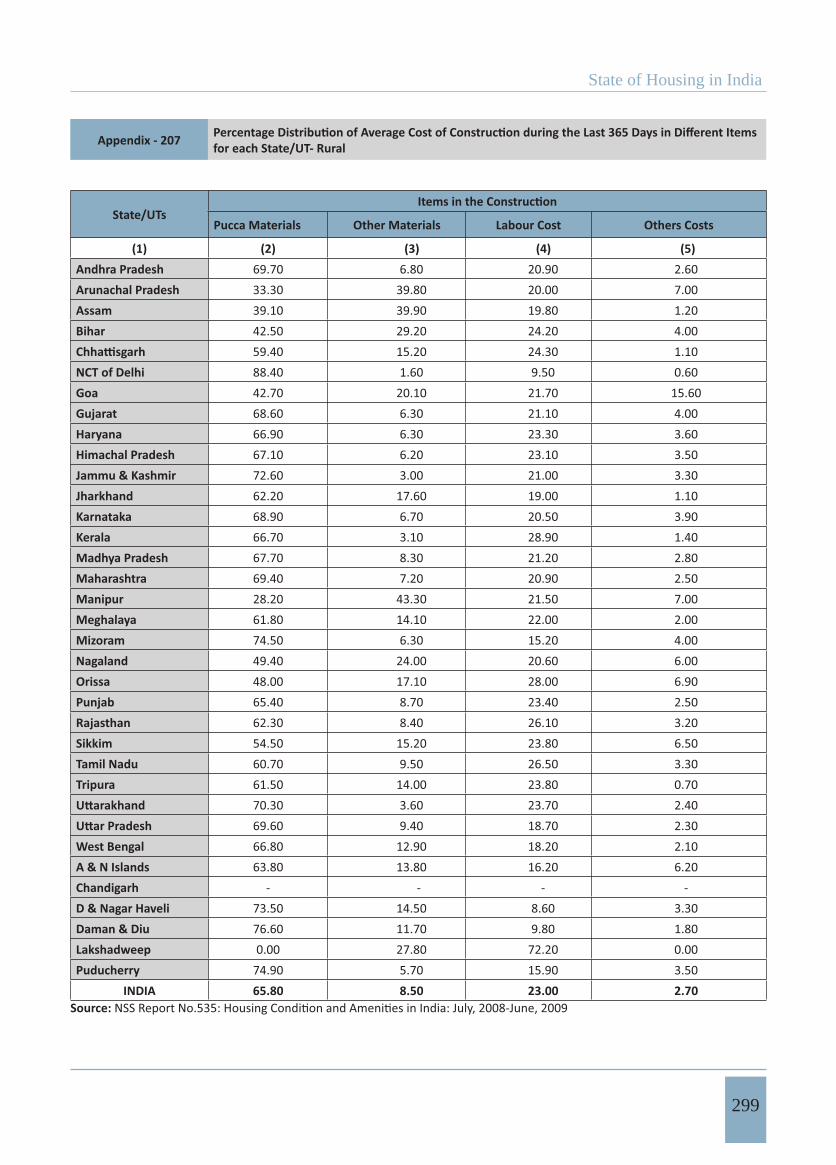
State of Housing in India
299
Appendix - 207 for each State/UT- Rural
State/UTsPucca Materials Other Materials Labour Cost Others Costs
(1) (2) (3) (4) (5)Andhra Pradesh 69.70 6.80 20.90 2.60Arunachal Pradesh 33.30 39.80 20.00 7.00Assam 39.10 39.90 19.80 1.20Bihar 42.50 29.20 24.20 4.00
59.40 15.20 24.30 1.10NCT of Delhi 88.40 1.60 9.50 0.60Goa 42.70 20.10 21.70 15.60Gujarat 68.60 6.30 21.10 4.00Haryana 66.90 6.30 23.30 3.60Himachal Pradesh 67.10 6.20 23.10 3.50Jammu & Kashmir 72.60 3.00 21.00 3.30Jharkhand 62.20 17.60 19.00 1.10Karnataka 68.90 6.70 20.50 3.90Kerala 66.70 3.10 28.90 1.40Madhya Pradesh 67.70 8.30 21.20 2.80Maharashtra 69.40 7.20 20.90 2.50Manipur 28.20 43.30 21.50 7.00Meghalaya 61.80 14.10 22.00 2.00Mizoram 74.50 6.30 15.20 4.00Nagaland 49.40 24.00 20.60 6.00Orissa 48.00 17.10 28.00 6.90Punjab 65.40 8.70 23.40 2.50Rajasthan 62.30 8.40 26.10 3.20Sikkim 54.50 15.20 23.80 6.50Tamil Nadu 60.70 9.50 26.50 3.30Tripura 61.50 14.00 23.80 0.70
70.30 3.60 23.70 2.4069.60 9.40 18.70 2.30
West Bengal 66.80 12.90 18.20 2.10A & N Islands 63.80 13.80 16.20 6.20Chandigarh - - - -D & Nagar Haveli 73.50 14.50 8.60 3.30Daman & Diu 76.60 11.70 9.80 1.80Lakshadweep 0.00 27.80 72.20 0.00Puducherry 74.90 5.70 15.90 3.50
INDIA 65.80 8.50 23.00 2.70Source:
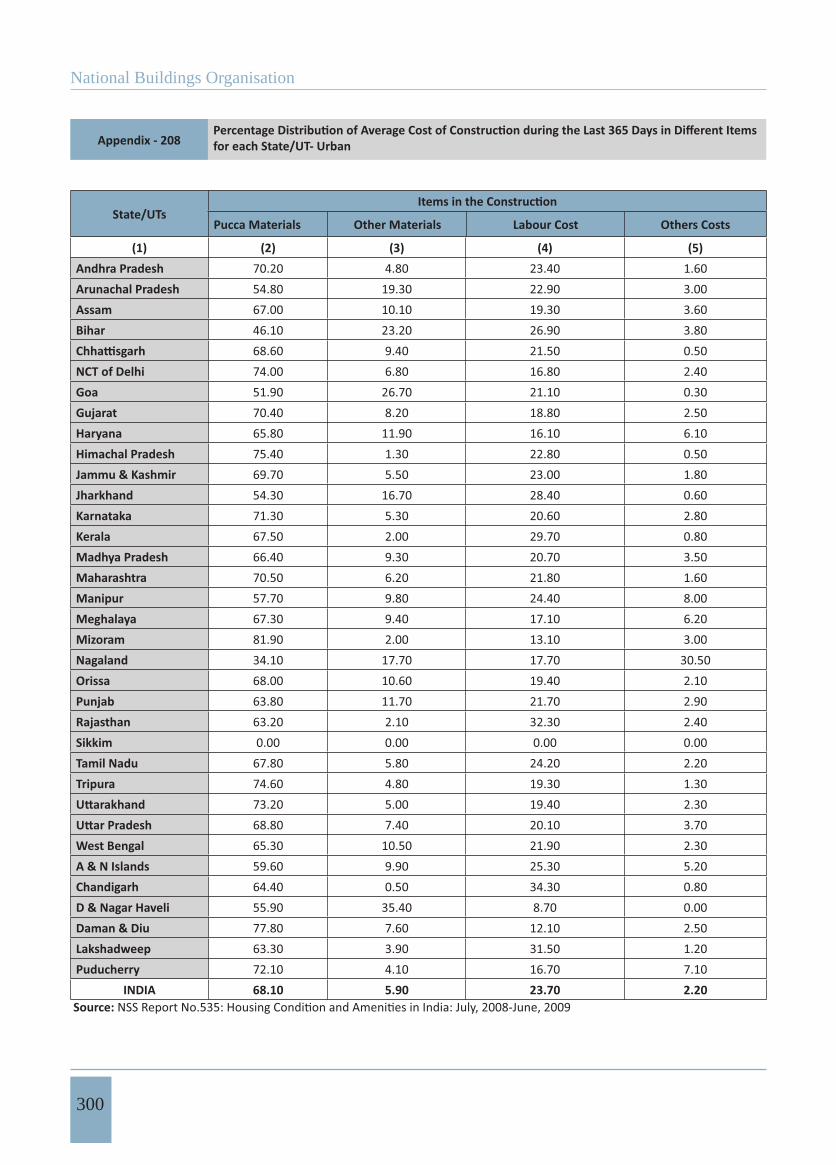
National Buildings Organisation
300
Appendix - 208 for each State/UT- Urban
State/UTsPucca Materials Other Materials Labour Cost Others Costs
(1) (2) (3) (4) (5)Andhra Pradesh 70.20 4.80 23.40 1.60Arunachal Pradesh 54.80 19.30 22.90 3.00Assam 67.00 10.10 19.30 3.60Bihar 46.10 23.20 26.90 3.80
68.60 9.40 21.50 0.50NCT of Delhi 74.00 6.80 16.80 2.40Goa 51.90 26.70 21.10 0.30Gujarat 70.40 8.20 18.80 2.50Haryana 65.80 11.90 16.10 6.10Himachal Pradesh 75.40 1.30 22.80 0.50Jammu & Kashmir 69.70 5.50 23.00 1.80Jharkhand 54.30 16.70 28.40 0.60Karnataka 71.30 5.30 20.60 2.80Kerala 67.50 2.00 29.70 0.80Madhya Pradesh 66.40 9.30 20.70 3.50Maharashtra 70.50 6.20 21.80 1.60Manipur 57.70 9.80 24.40 8.00Meghalaya 67.30 9.40 17.10 6.20Mizoram 81.90 2.00 13.10 3.00Nagaland 34.10 17.70 17.70 30.50Orissa 68.00 10.60 19.40 2.10Punjab 63.80 11.70 21.70 2.90Rajasthan 63.20 2.10 32.30 2.40Sikkim 0.00 0.00 0.00 0.00Tamil Nadu 67.80 5.80 24.20 2.20Tripura 74.60 4.80 19.30 1.30
73.20 5.00 19.40 2.3068.80 7.40 20.10 3.70
West Bengal 65.30 10.50 21.90 2.30A & N Islands 59.60 9.90 25.30 5.20Chandigarh 64.40 0.50 34.30 0.80D & Nagar Haveli 55.90 35.40 8.70 0.00Daman & Diu 77.80 7.60 12.10 2.50Lakshadweep 63.30 3.90 31.50 1.20Puducherry 72.10 4.10 16.70 7.10
INDIA 68.10 5.90 23.70 2.20 Source:
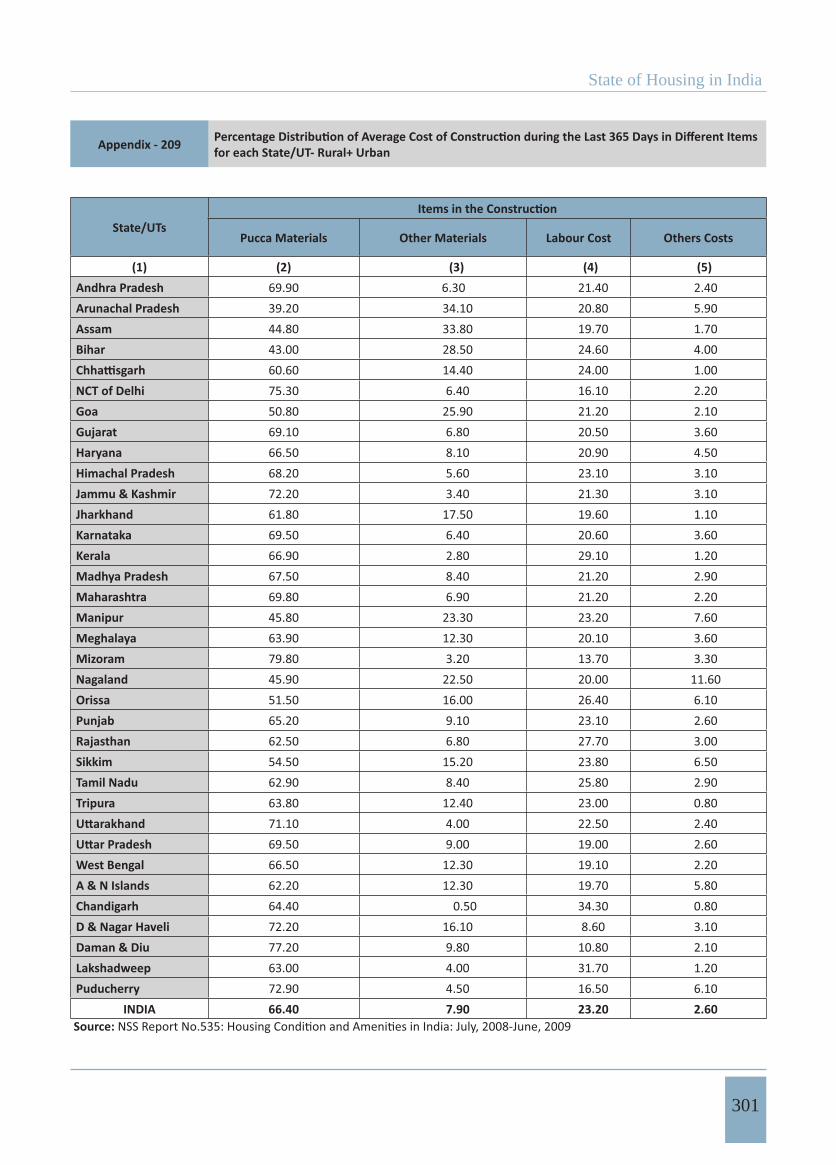
State of Housing in India
301
Appendix - 209 for each State/UT- Rural+ Urban
State/UTsPucca Materials Other Materials Labour Cost Others Costs
(1) (2) (3) (4) (5)Andhra Pradesh 69.90 6.30 21.40 2.40Arunachal Pradesh 39.20 34.10 20.80 5.90Assam 44.80 33.80 19.70 1.70Bihar 43.00 28.50 24.60 4.00
60.60 14.40 24.00 1.00NCT of Delhi 75.30 6.40 16.10 2.20Goa 50.80 25.90 21.20 2.10Gujarat 69.10 6.80 20.50 3.60Haryana 66.50 8.10 20.90 4.50Himachal Pradesh 68.20 5.60 23.10 3.10Jammu & Kashmir 72.20 3.40 21.30 3.10Jharkhand 61.80 17.50 19.60 1.10Karnataka 69.50 6.40 20.60 3.60Kerala 66.90 2.80 29.10 1.20Madhya Pradesh 67.50 8.40 21.20 2.90Maharashtra 69.80 6.90 21.20 2.20Manipur 45.80 23.30 23.20 7.60Meghalaya 63.90 12.30 20.10 3.60Mizoram 79.80 3.20 13.70 3.30Nagaland 45.90 22.50 20.00 11.60Orissa 51.50 16.00 26.40 6.10Punjab 65.20 9.10 23.10 2.60Rajasthan 62.50 6.80 27.70 3.00Sikkim 54.50 15.20 23.80 6.50Tamil Nadu 62.90 8.40 25.80 2.90Tripura 63.80 12.40 23.00 0.80
71.10 4.00 22.50 2.4069.50 9.00 19.00 2.60
West Bengal 66.50 12.30 19.10 2.20A & N Islands 62.20 12.30 19.70 5.80Chandigarh 64.40 0.50 34.30 0.80D & Nagar Haveli 72.20 16.10 8.60 3.10Daman & Diu 77.20 9.80 10.80 2.10Lakshadweep 63.00 4.00 31.70 1.20Puducherry 72.90 4.50 16.50 6.10
INDIA 66.40 7.90 23.20 2.60Source:
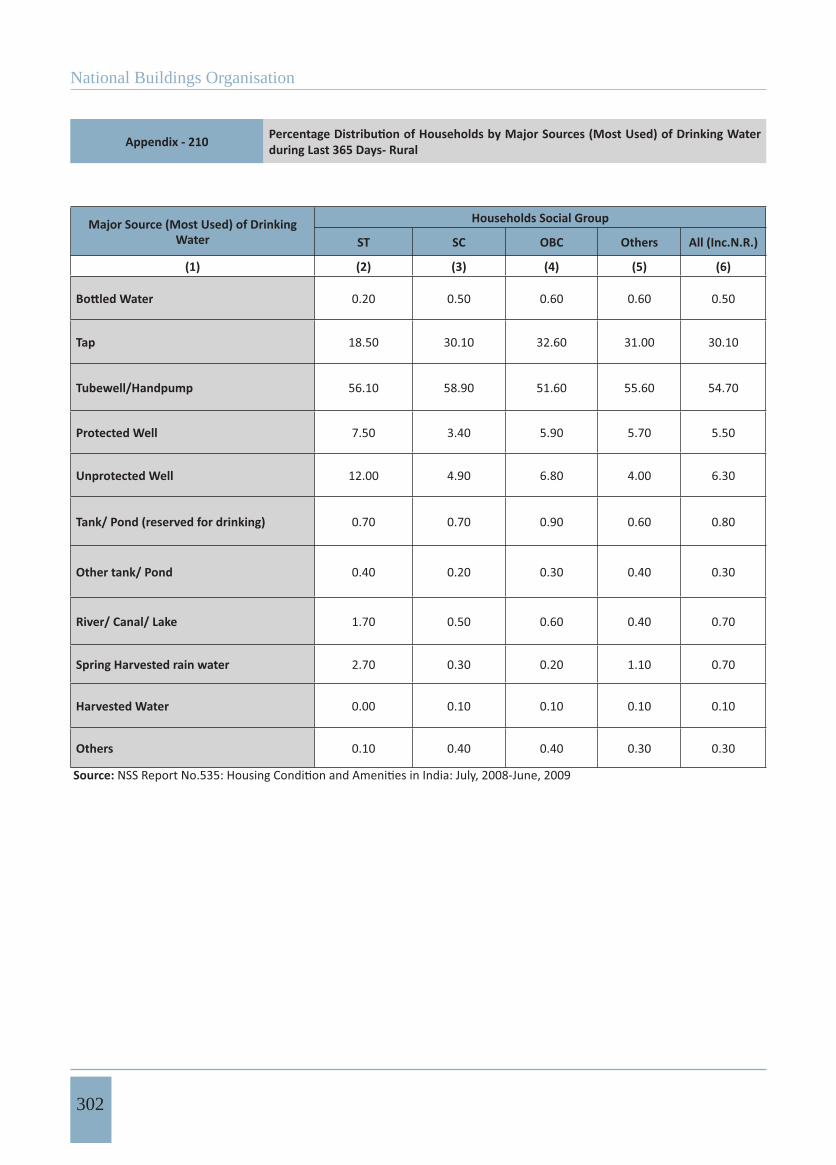
National Buildings Organisation
302
Appendix - 210 during Last 365 Days- Rural
Major Source (Most Used) of Drinking Water
Households Social Group
ST SC OBC Others All (Inc.N.R.)
(1) (2) (3) (4) (5) (6)
0.20 0.50 0.60 0.60 0.50
Tap 18.50 30.10 32.60 31.00 30.10
Tubewell/Handpump 56.10 58.90 51.60 55.60 54.70
Protected Well 7.50 3.40 5.90 5.70 5.50
Unprotected Well 12.00 4.90 6.80 4.00 6.30
Tank/ Pond (reserved for drinking) 0.70 0.70 0.90 0.60 0.80
Other tank/ Pond 0.40 0.20 0.30 0.40 0.30
River/ Canal/ Lake 1.70 0.50 0.60 0.40 0.70
Spring Harvested rain water 2.70 0.30 0.20 1.10 0.70
Harvested Water 0.00 0.10 0.10 0.10 0.10
Others 0.10 0.40 0.40 0.30 0.30
Source:
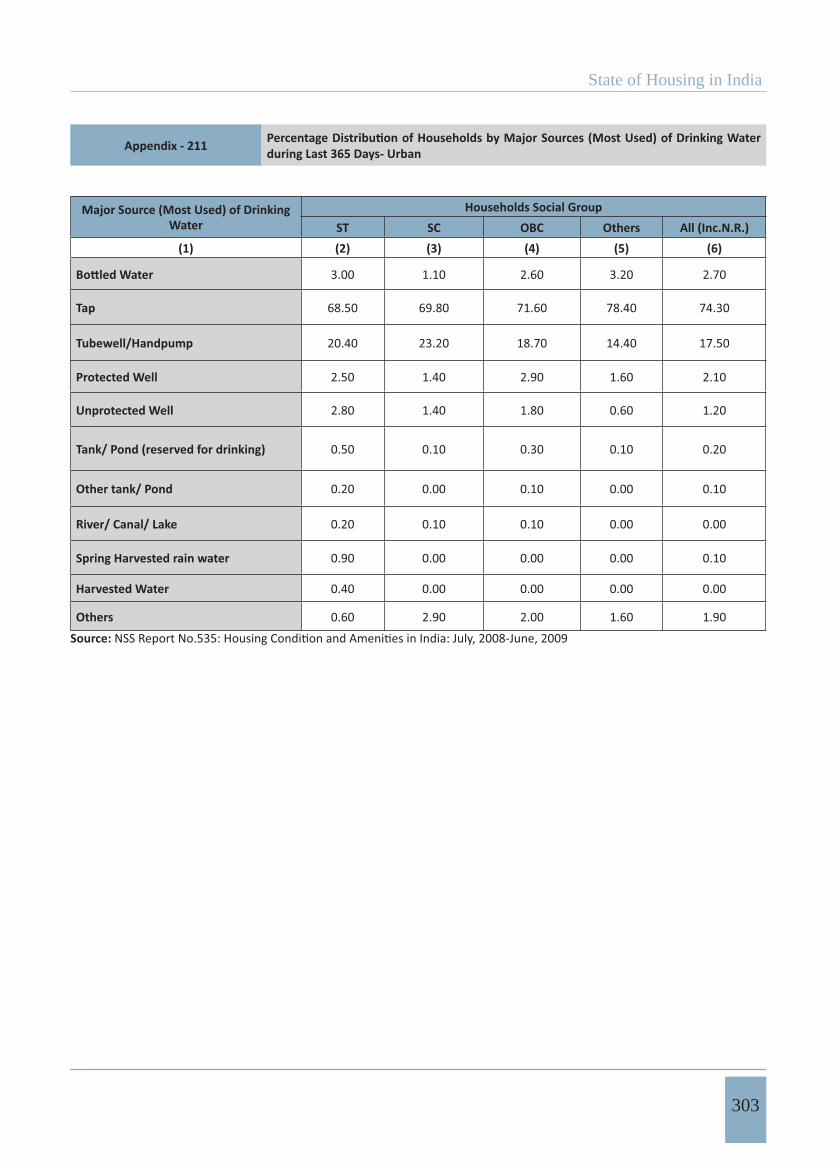
State of Housing in India
303
Appendix - 211 during Last 365 Days- Urban
Major Source (Most Used) of Drinking Water
Households Social GroupST SC OBC Others All (Inc.N.R.)
(1) (2) (3) (4) (5) (6)
3.00 1.10 2.60 3.20 2.70
Tap 68.50 69.80 71.60 78.40 74.30
Tubewell/Handpump 20.40 23.20 18.70 14.40 17.50
Protected Well 2.50 1.40 2.90 1.60 2.10
Unprotected Well 2.80 1.40 1.80 0.60 1.20
Tank/ Pond (reserved for drinking) 0.50 0.10 0.30 0.10 0.20
Other tank/ Pond 0.20 0.00 0.10 0.00 0.10
River/ Canal/ Lake 0.20 0.10 0.10 0.00 0.00
Spring Harvested rain water 0.90 0.00 0.00 0.00 0.10
Harvested Water 0.40 0.00 0.00 0.00 0.00
Others 0.60 2.90 2.00 1.60 1.90
Source:
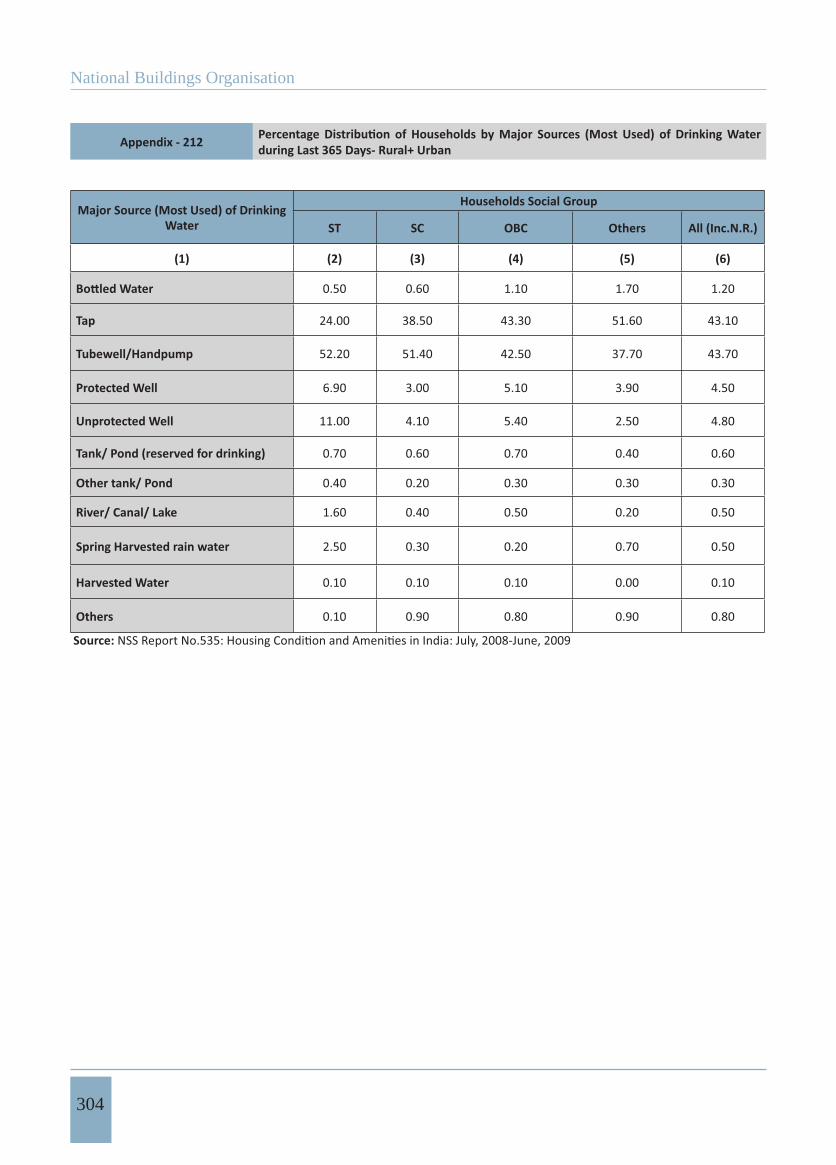
National Buildings Organisation
304
Appendix - 212 during Last 365 Days- Rural+ Urban
Major Source (Most Used) of Drinking Water
Households Social Group
ST SC OBC Others All (Inc.N.R.)
(1) (2) (3) (4) (5) (6)
0.50 0.60 1.10 1.70 1.20
Tap 24.00 38.50 43.30 51.60 43.10
Tubewell/Handpump 52.20 51.40 42.50 37.70 43.70
Protected Well 6.90 3.00 5.10 3.90 4.50
Unprotected Well 11.00 4.10 5.40 2.50 4.80
Tank/ Pond (reserved for drinking) 0.70 0.60 0.70 0.40 0.60
Other tank/ Pond 0.40 0.20 0.30 0.30 0.30
River/ Canal/ Lake 1.60 0.40 0.50 0.20 0.50
Spring Harvested rain water 2.50 0.30 0.20 0.70 0.50
Harvested Water 0.10 0.10 0.10 0.00 0.10
Others 0.10 0.90 0.80 0.90 0.80
Source:
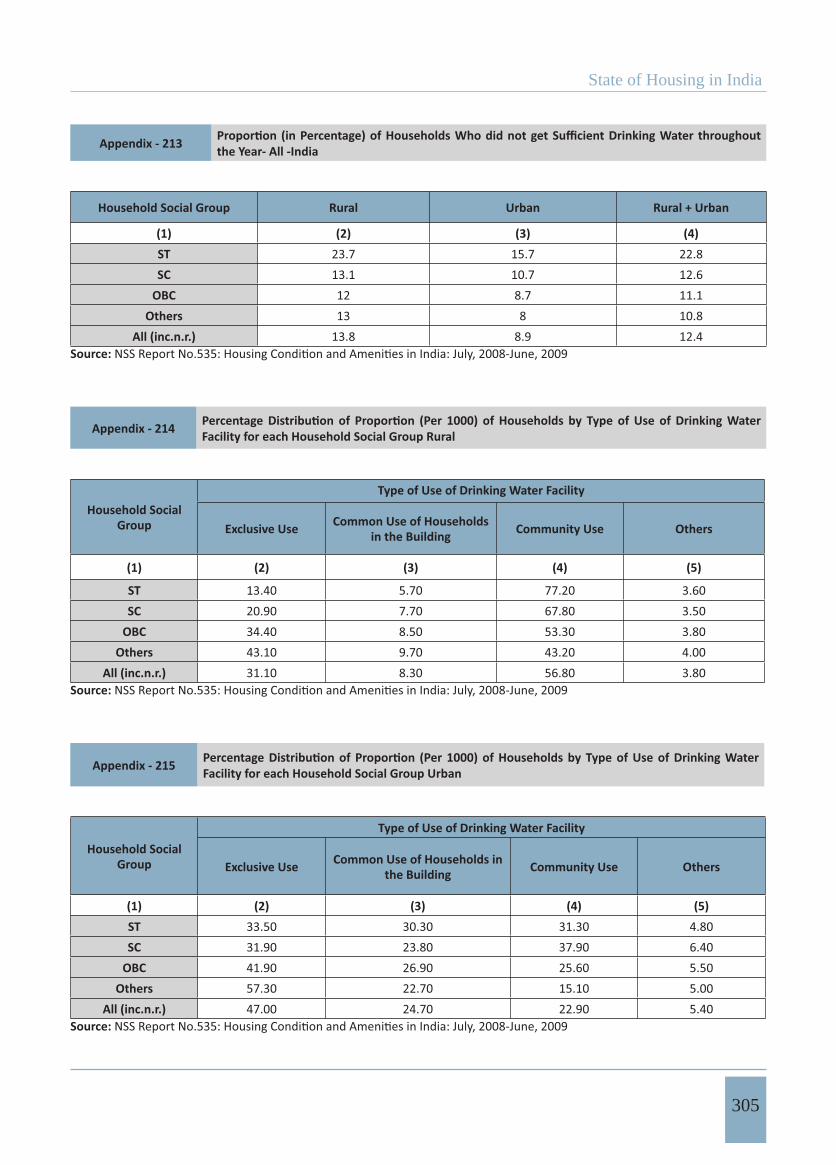
State of Housing in India
305
Appendix - 213 the Year- All -India
Household Social Group Rural Urban Rural + Urban
(1) (2) (3) (4)ST 23.7 15.7 22.8SC 13.1 10.7 12.6
OBC 12 8.7 11.1Others 13 8 10.8
All (inc.n.r.) 13.8 8.9 12.4Source:
Appendix - 214 Facility for each Household Social Group Rural
Household Social Group
Type of Use of Drinking Water Facility
Exclusive Use Common Use of Households in the Building Community Use Others
(1) (2) (3) (4) (5)
ST 13.40 5.70 77.20 3.60SC 20.90 7.70 67.80 3.50
OBC 34.40 8.50 53.30 3.80Others 43.10 9.70 43.20 4.00
All (inc.n.r.) 31.10 8.30 56.80 3.80Source:
Appendix - 215 Facility for each Household Social Group Urban
Household Social Group
Type of Use of Drinking Water Facility
Exclusive Use Common Use of Households in the Building Community Use Others
(1) (2) (3) (4) (5)ST 33.50 30.30 31.30 4.80SC 31.90 23.80 37.90 6.40
OBC 41.90 26.90 25.60 5.50Others 57.30 22.70 15.10 5.00
All (inc.n.r.) 47.00 24.70 22.90 5.40Source:
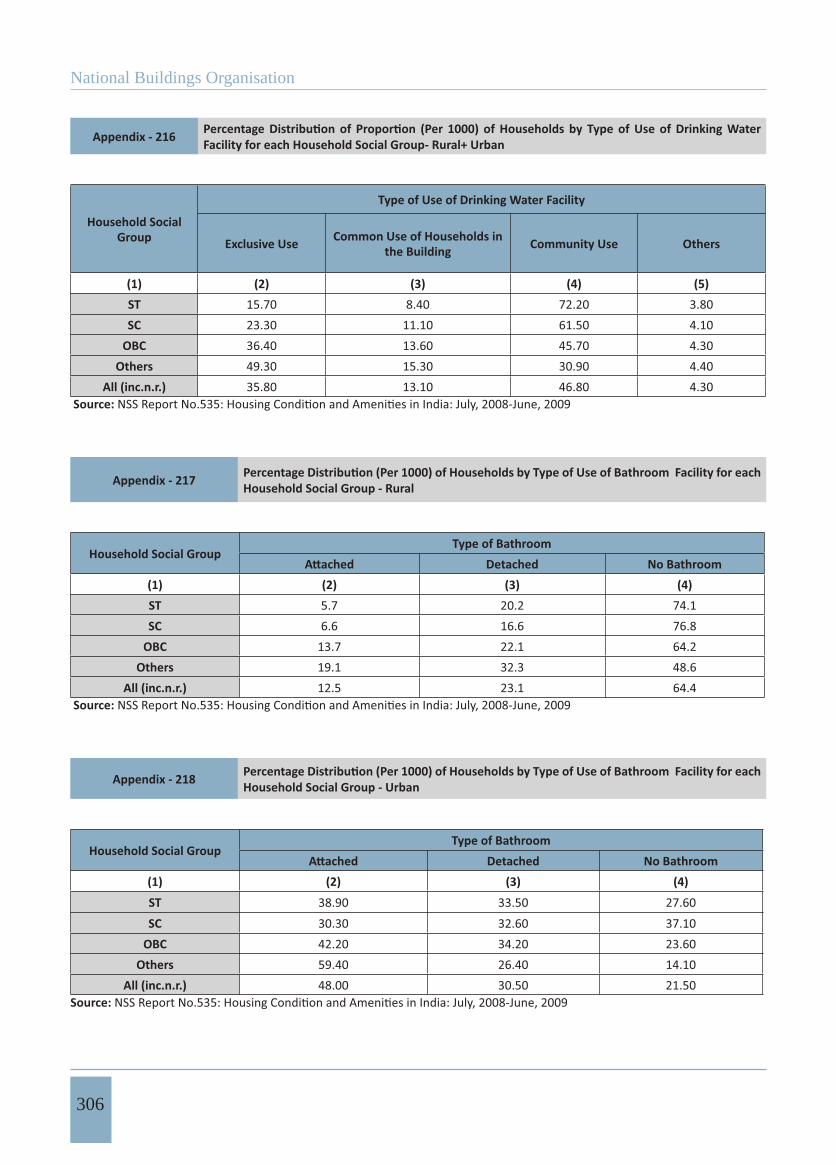
National Buildings Organisation
306
Appendix - 216 Facility for each Household Social Group- Rural+ Urban
Household Social Group
Type of Use of Drinking Water Facility
Exclusive Use Common Use of Households in the Building Community Use Others
(1) (2) (3) (4) (5)ST 15.70 8.40 72.20 3.80SC 23.30 11.10 61.50 4.10
OBC 36.40 13.60 45.70 4.30Others 49.30 15.30 30.90 4.40
All (inc.n.r.) 35.80 13.10 46.80 4.30 Source:
Appendix - 217 Household Social Group - Rural
Household Social GroupType of Bathroom
Detached No Bathroom(1) (2) (3) (4)ST 5.7 20.2 74.1SC 6.6 16.6 76.8
OBC 13.7 22.1 64.2Others 19.1 32.3 48.6
All (inc.n.r.) 12.5 23.1 64.4 Source:
Appendix - 218 Household Social Group - Urban
Household Social GroupType of Bathroom
Detached No Bathroom(1) (2) (3) (4)ST 38.90 33.50 27.60SC 30.30 32.60 37.10
OBC 42.20 34.20 23.60Others 59.40 26.40 14.10
All (inc.n.r.) 48.00 30.50 21.50Source:
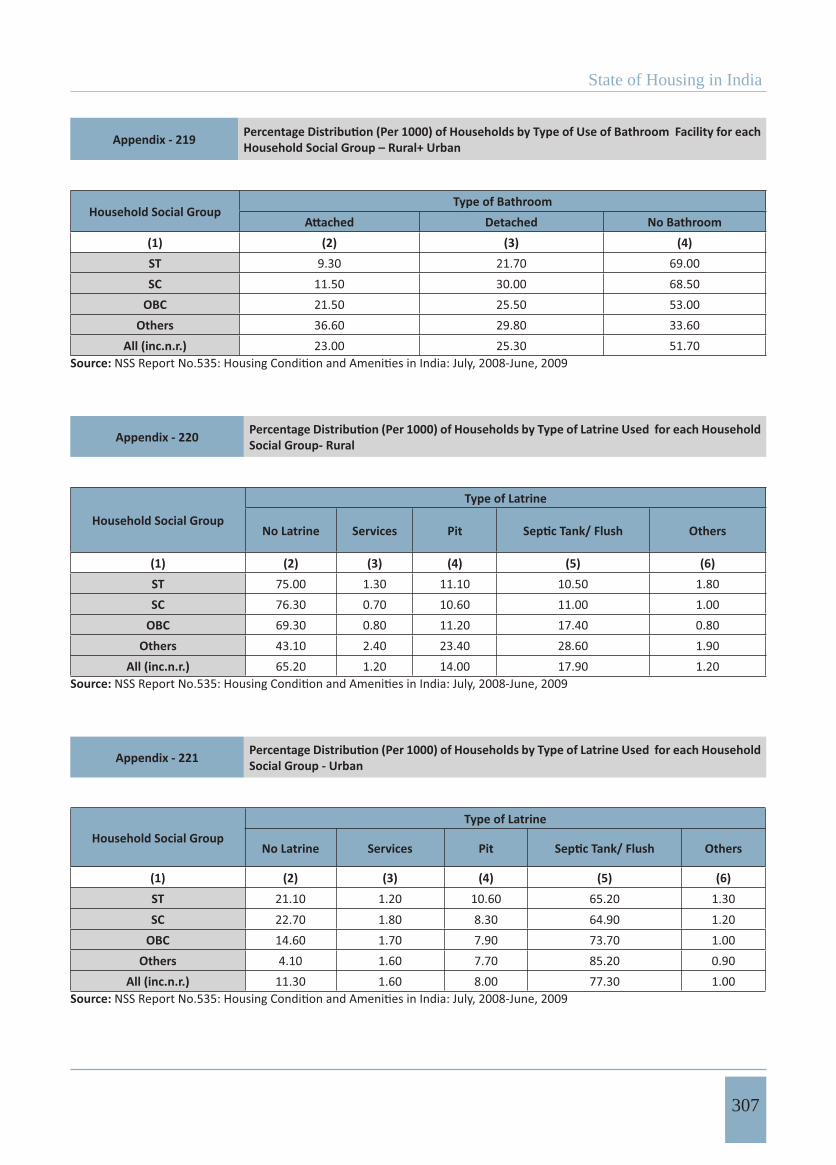
State of Housing in India
307
Appendix - 219 Household Social Group – Rural+ Urban
Household Social GroupType of Bathroom
Detached No Bathroom(1) (2) (3) (4)ST 9.30 21.70 69.00SC 11.50 30.00 68.50
OBC 21.50 25.50 53.00Others 36.60 29.80 33.60
All (inc.n.r.) 23.00 25.30 51.70Source:
Appendix - 220 Social Group- Rural
Household Social Group
Type of Latrine
No Latrine Services Pit Others
(1) (2) (3) (4) (5) (6)ST 75.00 1.30 11.10 10.50 1.80SC 76.30 0.70 10.60 11.00 1.00
OBC 69.30 0.80 11.20 17.40 0.80Others 43.10 2.40 23.40 28.60 1.90
All (inc.n.r.) 65.20 1.20 14.00 17.90 1.20Source:
Appendix - 221 Social Group - Urban
Household Social GroupType of Latrine
No Latrine Services Pit Others
(1) (2) (3) (4) (5) (6)ST 21.10 1.20 10.60 65.20 1.30SC 22.70 1.80 8.30 64.90 1.20
OBC 14.60 1.70 7.90 73.70 1.00Others 4.10 1.60 7.70 85.20 0.90
All (inc.n.r.) 11.30 1.60 8.00 77.30 1.00Source:
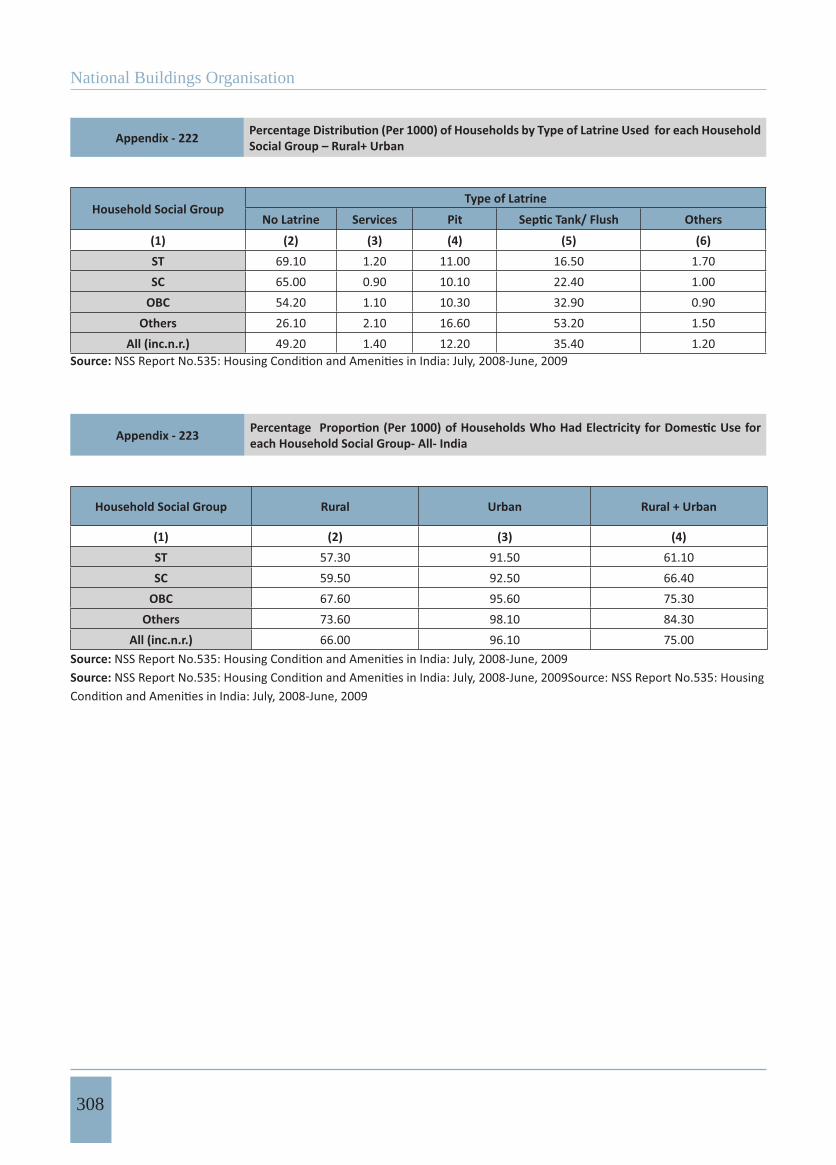
National Buildings Organisation
308
Appendix - 222 Social Group – Rural+ Urban
Household Social GroupType of Latrine
No Latrine Services Pit Others
(1) (2) (3) (4) (5) (6)ST 69.10 1.20 11.00 16.50 1.70SC 65.00 0.90 10.10 22.40 1.00
OBC 54.20 1.10 10.30 32.90 0.90Others 26.10 2.10 16.60 53.20 1.50
All (inc.n.r.) 49.20 1.40 12.20 35.40 1.20Source:
Appendix - 223 each Household Social Group- All- India
Household Social Group Rural Urban Rural + Urban
(1) (2) (3) (4)ST 57.30 91.50 61.10SC 59.50 92.50 66.40
OBC 67.60 95.60 75.30Others 73.60 98.10 84.30
All (inc.n.r.) 66.00 96.10 75.00Source:Source:
Data Appendices (224-231)Slums in India

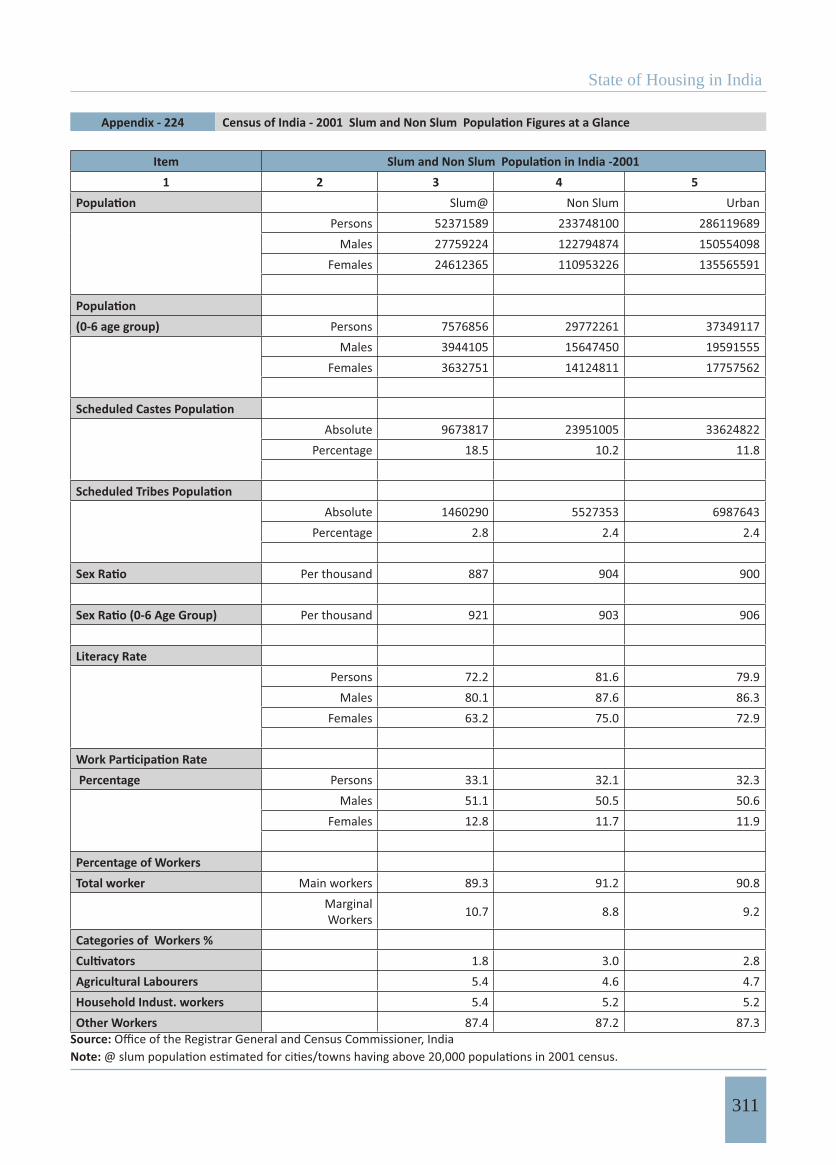
State of Housing in India
311
Appendix - 224
Item1 2 3 4 5
Slum@ Non Slum Urban Persons 52371589 233748100 286119689
Males 27759224 122794874 150554098 Females 24612365 110953226 135565591
(0-6 age group) Persons 7576856 29772261 37349117 Males 3944105 15647450 19591555
Females 3632751 14124811 17757562
9673817 23951005 3362482218.5 10.2 11.8
1460290 5527353 69876432.8 2.4 2.4
887 904 900
921 903 906
Literacy Rate Persons 72.2 81.6 79.9
Males 80.1 87.6 86.3 Females 63.2 75.0 72.9
Percentage Persons 33.1 32.1 32.3 Males 51.1 50.5 50.6
Females 12.8 11.7 11.9
Percentage of WorkersTotal worker Main workers 89.3 91.2 90.8
Workers 10.7 8.8 9.2
Categories of Workers %1.8 3.0 2.8
Agricultural Labourers 5.4 4.6 4.7Household Indust. workers 5.4 5.2 5.2Other Workers 87.4 87.2 87.3
Source:Note:
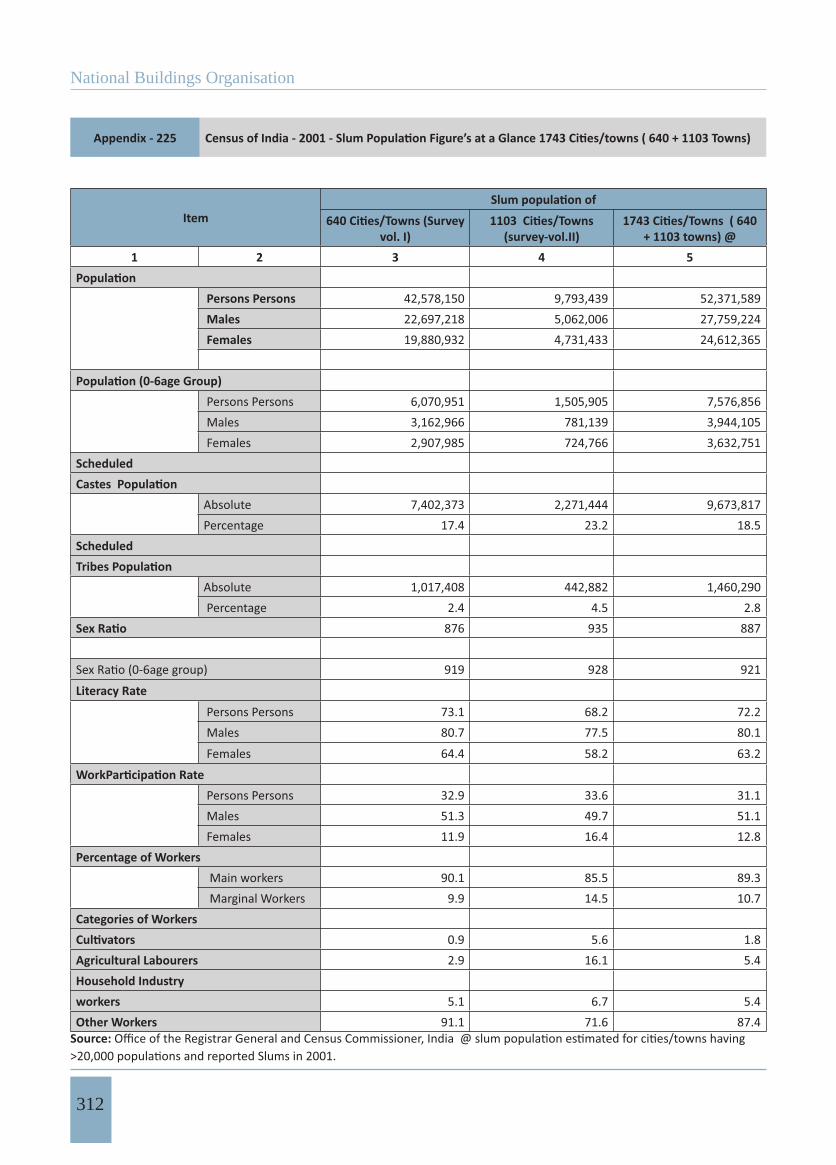
National Buildings Organisation
312
Appendix - 225
Itemvol. I) (survey-vol.II) + 1103 towns) @
1 2 3 4 5
Persons Persons 42,578,150 9,793,439 52,371,589 Males 22,697,218 5,062,006 27,759,224 Females 19,880,932 4,731,433 24,612,365
Persons Persons 6,070,951 1,505,905 7,576,856 Males 3,162,966 781,139 3,944,105 Females 2,907,985 724,766 3,632,751
Scheduled
7,402,373 2,271,444 9,673,817 17.4 23.2 18.5
Scheduled
1,017,408 442,882 1,460,290 2.4 4.5 2.8
876 935 887
919 928 921
Literacy Rate
Persons Persons 73.1 68.2 72.2Males 80.7 77.5 80.1Females 64.4 58.2 63.2
Persons Persons 32.9 33.6 31.1 Males 51.3 49.7 51.1 Females 11.9 16.4 12.8
Percentage of Workers Main workers 90.1 85.5 89.3
9.9 14.5 10.7Categories of Workers
0.9 5.6 1.8 Agricultural Labourers 2.9 16.1 5.4 Household Industry workers 5.1 6.7 5.4 Other Workers 91.1 71.6 87.4
Source:
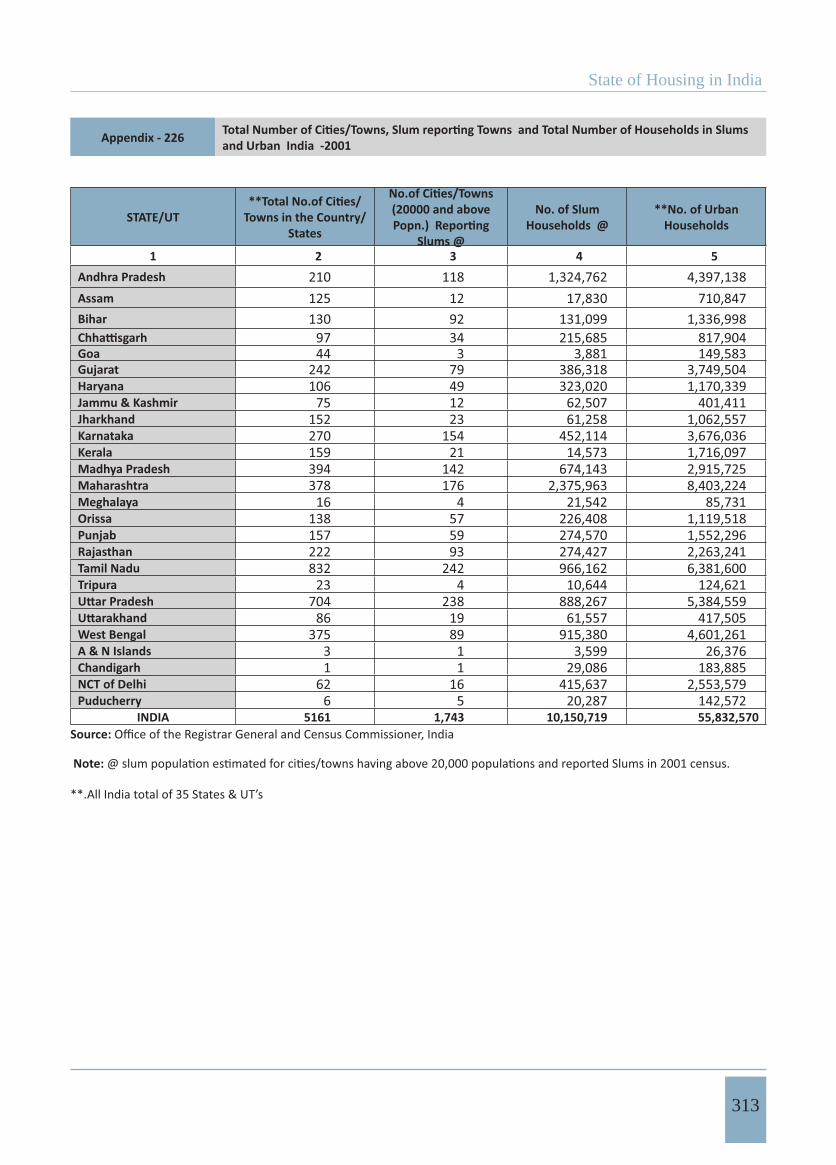
State of Housing in India
313
Appendix - 226 and Urban India -2001
STATE/UT Towns in the Country/States
(20000 and above
Slums @
No. of Slum Households @
**No. of Urban Households
1 2 3 4 5Andhra Pradesh 210 118 1,324,762 4,397,138Assam 125 12 17,830 710,847Bihar 130 92 131,099 1,336,998
97 34 215,685 817,904Goa 44 3 3,881 149,583Gujarat 242 79 386,318 3,749,504Haryana 106 49 323,020 1,170,339Jammu & Kashmir 75 12 62,507 401,411Jharkhand 152 23 61,258 1,062,557Karnataka 270 154 452,114 3,676,036Kerala 159 21 14,573 1,716,097Madhya Pradesh 394 142 674,143 2,915,725Maharashtra 378 176 2,375,963 8,403,224Meghalaya 16 4 21,542 85,731Orissa 138 57 226,408 1,119,518Punjab 157 59 274,570 1,552,296Rajasthan 222 93 274,427 2,263,241Tamil Nadu 832 242 966,162 6,381,600Tripura 23 4 10,644 124,621
704 238 888,267 5,384,55986 19 61,557 417,505
West Bengal 375 89 915,380 4,601,261A & N Islands 3 1 3,599 26,376Chandigarh 1 1 29,086 183,885NCT of Delhi 62 16 415,637 2,553,579Puducherry 6 5 20,287 142,572
INDIA 5161 1,743 10,150,719 55,832,570Source:
Note:
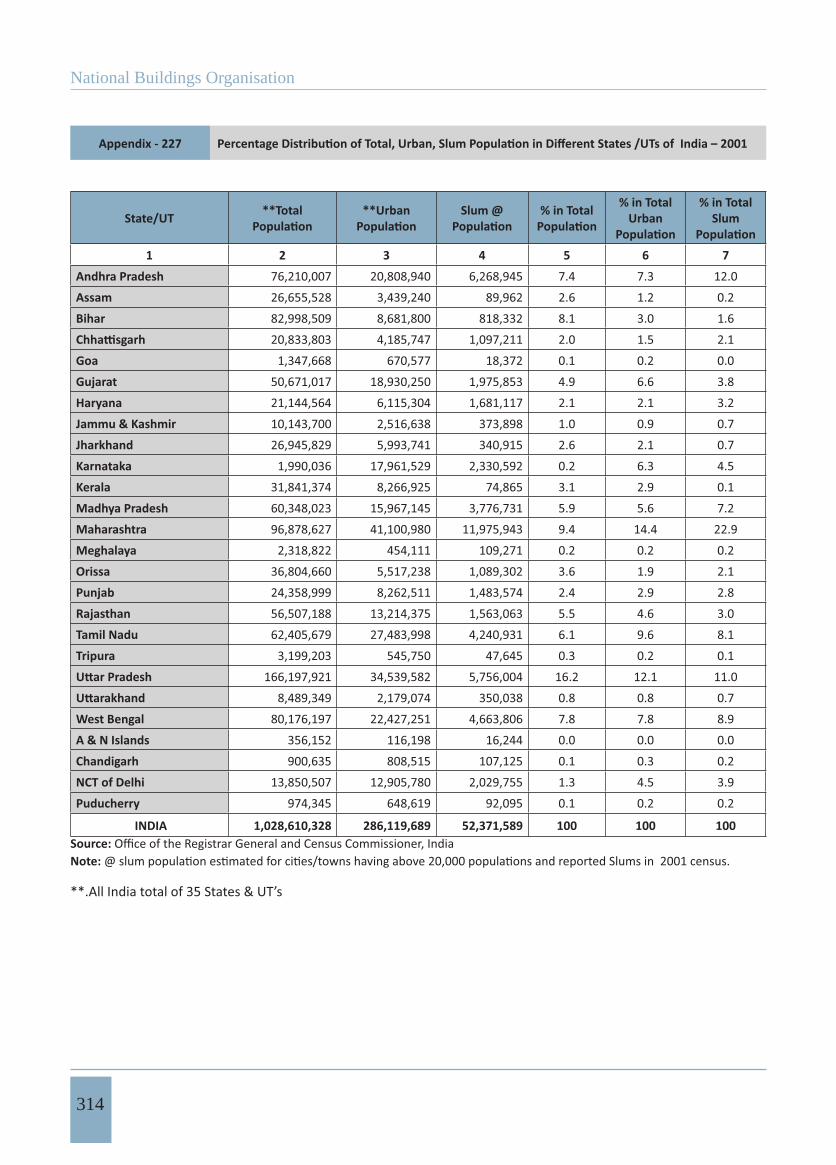
National Buildings Organisation
314
Appendix - 227
State/UT **Total **Urban Slum @ % in Total % in Total Urban
% in Total Slum
1 2 3 4 5 6 7
Andhra Pradesh 76,210,007 20,808,940 6,268,945 7.4 7.3 12.0Assam 26,655,528 3,439,240 89,962 2.6 1.2 0.2Bihar 82,998,509 8,681,800 818,332 8.1 3.0 1.6
20,833,803 4,185,747 1,097,211 2.0 1.5 2.1Goa 1,347,668 670,577 18,372 0.1 0.2 0.0Gujarat 50,671,017 18,930,250 1,975,853 4.9 6.6 3.8Haryana 21,144,564 6,115,304 1,681,117 2.1 2.1 3.2Jammu & Kashmir 10,143,700 2,516,638 373,898 1.0 0.9 0.7Jharkhand 26,945,829 5,993,741 340,915 2.6 2.1 0.7Karnataka 1,990,036 17,961,529 2,330,592 0.2 6.3 4.5Kerala 31,841,374 8,266,925 74,865 3.1 2.9 0.1Madhya Pradesh 60,348,023 15,967,145 3,776,731 5.9 5.6 7.2Maharashtra 96,878,627 41,100,980 11,975,943 9.4 14.4 22.9Meghalaya 2,318,822 454,111 109,271 0.2 0.2 0.2Orissa 36,804,660 5,517,238 1,089,302 3.6 1.9 2.1Punjab 24,358,999 8,262,511 1,483,574 2.4 2.9 2.8Rajasthan 56,507,188 13,214,375 1,563,063 5.5 4.6 3.0Tamil Nadu 62,405,679 27,483,998 4,240,931 6.1 9.6 8.1Tripura 3,199,203 545,750 47,645 0.3 0.2 0.1
166,197,921 34,539,582 5,756,004 16.2 12.1 11.08,489,349 2,179,074 350,038 0.8 0.8 0.7
West Bengal 80,176,197 22,427,251 4,663,806 7.8 7.8 8.9A & N Islands 356,152 116,198 16,244 0.0 0.0 0.0Chandigarh 900,635 808,515 107,125 0.1 0.3 0.2NCT of Delhi 13,850,507 12,905,780 2,029,755 1.3 4.5 3.9Puducherry 974,345 648,619 92,095 0.1 0.2 0.2
INDIA 1,028,610,328 286,119,689 52,371,589 100 100 100Source:Note:
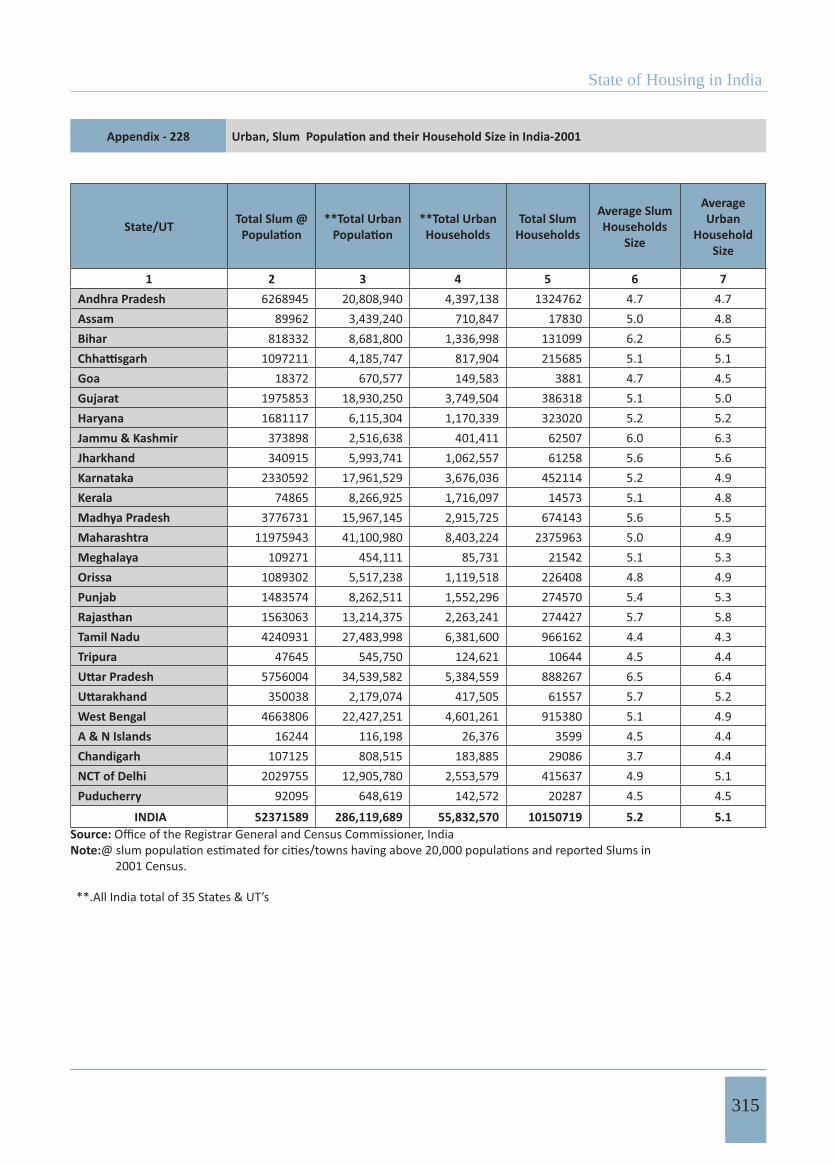
State of Housing in India
315
Appendix - 228
State/UT Total Slum @ **Total Urban **Total Urban Households
Total Slum Households
Average Slum Households
Size
Average Urban
HouseholdSize
1 2 3 4 5 6 7Andhra Pradesh 6268945 20,808,940 4,397,138 1324762 4.7 4.7Assam 89962 3,439,240 710,847 17830 5.0 4.8Bihar 818332 8,681,800 1,336,998 131099 6.2 6.5
1097211 4,185,747 817,904 215685 5.1 5.1Goa 18372 670,577 149,583 3881 4.7 4.5Gujarat 1975853 18,930,250 3,749,504 386318 5.1 5.0Haryana 1681117 6,115,304 1,170,339 323020 5.2 5.2Jammu & Kashmir 373898 2,516,638 401,411 62507 6.0 6.3Jharkhand 340915 5,993,741 1,062,557 61258 5.6 5.6Karnataka 2330592 17,961,529 3,676,036 452114 5.2 4.9Kerala 74865 8,266,925 1,716,097 14573 5.1 4.8Madhya Pradesh 3776731 15,967,145 2,915,725 674143 5.6 5.5Maharashtra 11975943 41,100,980 8,403,224 2375963 5.0 4.9Meghalaya 109271 454,111 85,731 21542 5.1 5.3Orissa 1089302 5,517,238 1,119,518 226408 4.8 4.9Punjab 1483574 8,262,511 1,552,296 274570 5.4 5.3Rajasthan 1563063 13,214,375 2,263,241 274427 5.7 5.8Tamil Nadu 4240931 27,483,998 6,381,600 966162 4.4 4.3Tripura 47645 545,750 124,621 10644 4.5 4.4
5756004 34,539,582 5,384,559 888267 6.5 6.4350038 2,179,074 417,505 61557 5.7 5.2
West Bengal 4663806 22,427,251 4,601,261 915380 5.1 4.9A & N Islands 16244 116,198 26,376 3599 4.5 4.4Chandigarh 107125 808,515 183,885 29086 3.7 4.4NCT of Delhi 2029755 12,905,780 2,553,579 415637 4.9 5.1Puducherry 92095 648,619 142,572 20287 4.5 4.5
INDIA 52371589 286,119,689 55,832,570 10150719 5.2 5.1Source: Note:
2001 Census.
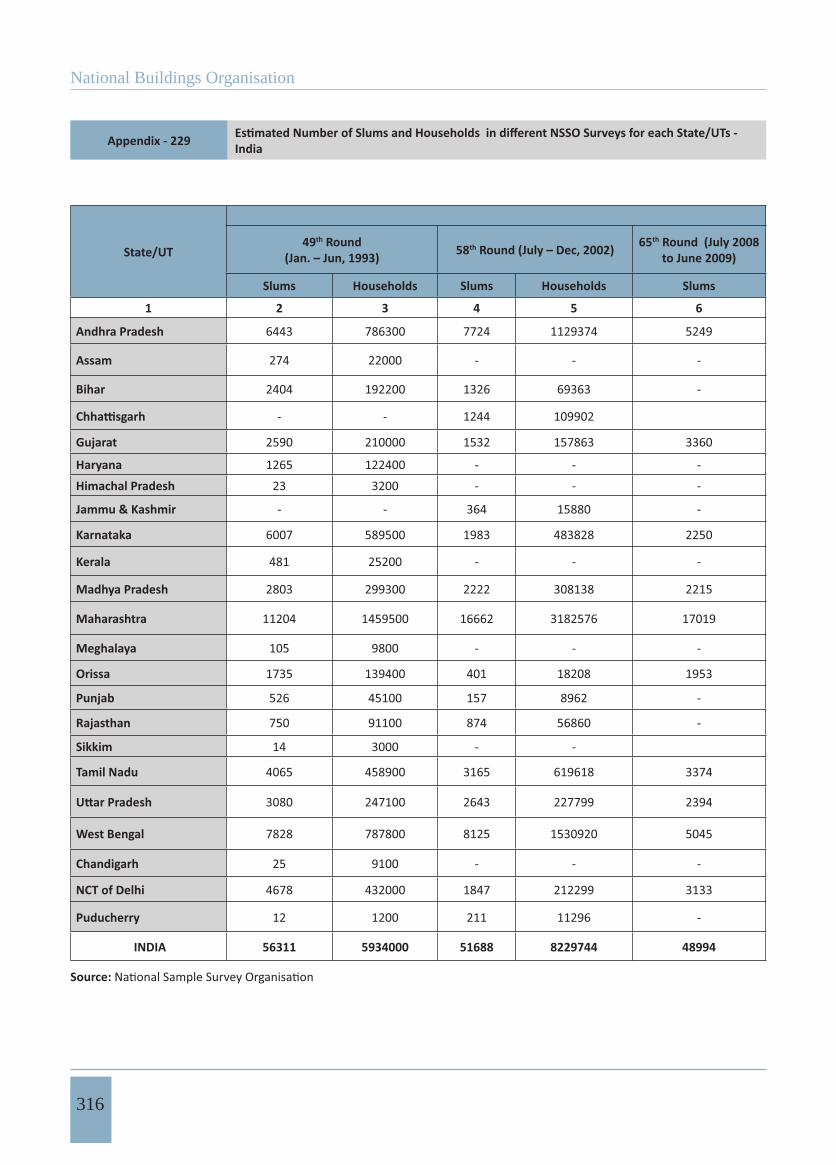
National Buildings Organisation
316
Appendix - 229 India
State/UT49th Round
(Jan. – Jun, 1993) 58th Round (July – Dec, 2002) 65th Round (July 2008 to June 2009)
Slums Households Slums Households Slums
1 2 3 4 5 6
Andhra Pradesh 6443 786300 7724 1129374 5249
Assam 274 22000 - - -
Bihar 2404 192200 1326 69363 -
- - 1244 109902
Gujarat 2590 210000 1532 157863 3360
Haryana 1265 122400 - - -Himachal Pradesh 23 3200 - - -
Jammu & Kashmir - - 364 15880 -
Karnataka 6007 589500 1983 483828 2250
Kerala 481 25200 - - -
Madhya Pradesh 2803 299300 2222 308138 2215
Maharashtra 11204 1459500 16662 3182576 17019
Meghalaya 105 9800 - - -
Orissa 1735 139400 401 18208 1953
Punjab 526 45100 157 8962 -
Rajasthan 750 91100 874 56860 -
Sikkim 14 3000 - -
Tamil Nadu 4065 458900 3165 619618 3374
3080 247100 2643 227799 2394
West Bengal 7828 787800 8125 1530920 5045
Chandigarh 25 9100 - - -
NCT of Delhi 4678 432000 1847 212299 3133
Puducherry 12 1200 211 11296 -
INDIA 56311 5934000 51688 8229744 48994
Source:
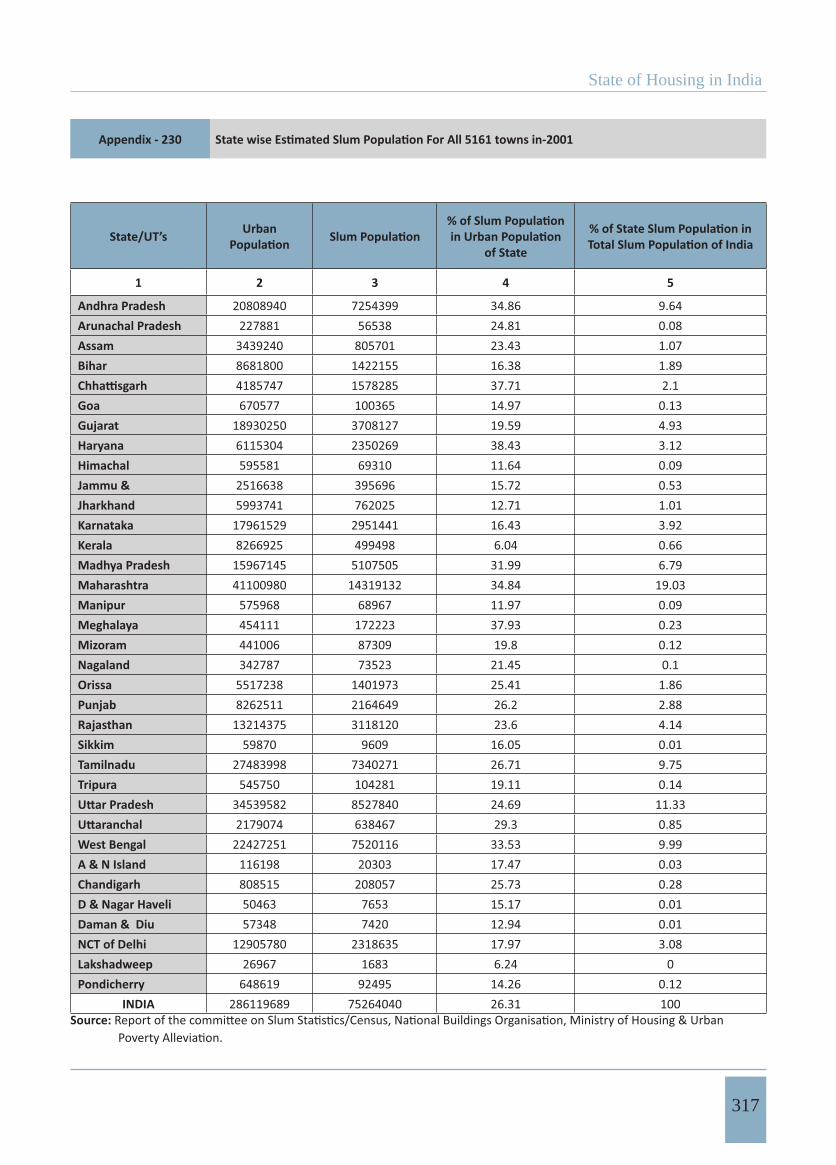
State of Housing in India
317
Appendix - 230
State/UT’s Urban
of State
1 2 3 4 5
Andhra Pradesh 20808940 7254399 34.86 9.64Arunachal Pradesh 227881 56538 24.81 0.08Assam 3439240 805701 23.43 1.07Bihar 8681800 1422155 16.38 1.89
4185747 1578285 37.71 2.1Goa 670577 100365 14.97 0.13Gujarat 18930250 3708127 19.59 4.93Haryana 6115304 2350269 38.43 3.12Himachal 595581 69310 11.64 0.09Jammu & 2516638 395696 15.72 0.53Jharkhand 5993741 762025 12.71 1.01Karnataka 17961529 2951441 16.43 3.92Kerala 8266925 499498 6.04 0.66Madhya Pradesh 15967145 5107505 31.99 6.79Maharashtra 41100980 14319132 34.84 19.03Manipur 575968 68967 11.97 0.09Meghalaya 454111 172223 37.93 0.23Mizoram 441006 87309 19.8 0.12Nagaland 342787 73523 21.45 0.1Orissa 5517238 1401973 25.41 1.86Punjab 8262511 2164649 26.2 2.88Rajasthan 13214375 3118120 23.6 4.14Sikkim 59870 9609 16.05 0.01Tamilnadu 27483998 7340271 26.71 9.75Tripura 545750 104281 19.11 0.14
34539582 8527840 24.69 11.332179074 638467 29.3 0.85
West Bengal 22427251 7520116 33.53 9.99A & N Island 116198 20303 17.47 0.03Chandigarh 808515 208057 25.73 0.28D & Nagar Haveli 50463 7653 15.17 0.01Daman & Diu 57348 7420 12.94 0.01NCT of Delhi 12905780 2318635 17.97 3.08Lakshadweep 26967 1683 6.24 0Pondicherry 648619 92495 14.26 0.12
INDIA 286119689 75264040 26.31 100Source:
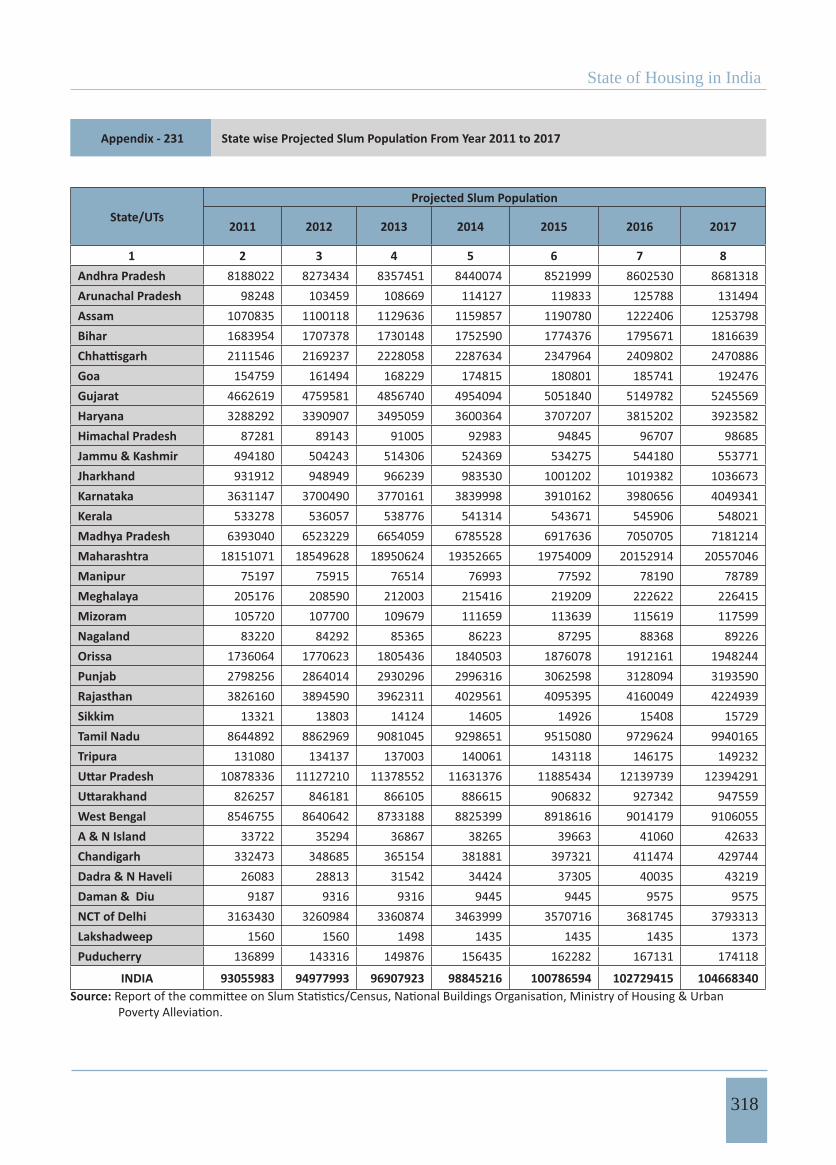
State of Housing in India
318
Appendix - 231
State/UTs2011 2012 2013 2014 2015 2016 2017
11( 2 3 4 5 6 7 8Andhra Pradesh 8188022 8273434 8357451 8440074 8521999 8602530 8681318Arunachal Pradesh 98248 103459 108669 114127 119833 125788 131494Assam 1070835 1100118 1129636 1159857 1190780 1222406 1253798Bihar 1683954 1707378 1730148 1752590 1774376 1795671 1816639
2111546 2169237 2228058 2287634 2347964 2409802 2470886Goa 154759 161494 168229 174815 180801 185741 192476Gujarat 4662619 4759581 4856740 4954094 5051840 5149782 5245569Haryana 3288292 3390907 3495059 3600364 3707207 3815202 3923582Himachal Pradesh 87281 89143 91005 92983 94845 96707 98685Jammu & Kashmir 494180 504243 514306 524369 534275 544180 553771Jharkhand 931912 948949 966239 983530 1001202 1019382 1036673Karnataka 3631147 3700490 3770161 3839998 3910162 3980656 4049341Kerala 533278 536057 538776 541314 543671 545906 548021Madhya Pradesh 6393040 6523229 6654059 6785528 6917636 7050705 7181214Maharashtra 18151071 18549628 18950624 19352665 19754009 20152914 20557046Manipur 75197 75915 76514 76993 77592 78190 78789Meghalaya 205176 208590 212003 215416 219209 222622 226415Mizoram 105720 107700 109679 111659 113639 115619 117599Nagaland 83220 84292 85365 86223 87295 88368 89226Orissa 1736064 1770623 1805436 1840503 1876078 1912161 1948244Punjab 2798256 2864014 2930296 2996316 3062598 3128094 3193590Rajasthan 3826160 3894590 3962311 4029561 4095395 4160049 4224939Sikkim 13321 13803 14124 14605 14926 15408 15729Tamil Nadu 8644892 8862969 9081045 9298651 9515080 9729624 9940165Tripura 131080 134137 137003 140061 143118 146175 149232
10878336 11127210 11378552 11631376 11885434 12139739 12394291826257 846181 866105 886615 906832 927342 947559
West Bengal 8546755 8640642 8733188 8825399 8918616 9014179 9106055A & N Island 33722 35294 36867 38265 39663 41060 42633Chandigarh 332473 348685 365154 381881 397321 411474 429744Dadra & N Haveli 26083 28813 31542 34424 37305 40035 43219Daman & Diu 9187 9316 9316 9445 9445 9575 9575NCT of Delhi 3163430 3260984 3360874 3463999 3570716 3681745 3793313Lakshadweep 1560 1560 1498 1435 1435 1435 1373Puducherry 136899 143316 149876 156435 162282 167131 174118
INDIA 93055983 94977993 96907923 98845216 100786594 102729415 104668340Source:

STATE OFHOUSING IN INDIA
A STATISTICAL COMPENDIUM
2013
STATE OFHOUSING IN INDIA
A STATISTICAL COMPENDIUM
2013
STATE OFHOUSING IN INDIA
A STATISTICAL COMPENDIUM
2013
Government of IndiaMinistry of Housing and Urban Poverty Alleviation
National Buildings Organisation
lR;eso t;rslR;eso t;rs
STAT
E O
F HO
USIN
G IN
IND
IA A
STAT
ISTIC
AL
CO
MPE
ND
IUM
2013
lR;eso t;rslR;eso t;rs
Director (NBO) & OSD (JNNURM & RAY)Ministry of Housing & Urban Poverty Alleviation
Room No. – 210, G-Wing, NBO Building,Nirman Bhawan, New Delhi – 110108
Tel:- +91-11-23061692, Fax : +-91-11-23061542E-mail:- [email protected]
lR;eso t;rs