Embed Size (px)
Citation preview
1
Housing Revenue Account (HRA) Statistics:
Scottish Local Authority Housing Income and
Expenditure 1997- 98 to 2017-18 (actuals)
2018-19 (estimates)
Overview
This annual publication provides information on recent trends in:
The balance of HRA housing income and expenditure - the amountcouncils earned from housing and other council stock, how they spent thisincome and whether there was a surplus or deficit at year end.
Council housing stock and rents - the number of council homes and theaverage weekly rent.
HRA expenditure on management and maintenance of stock - theamount councils spent on housing maintenance, repairs and management.
Lost income due to empty properties and rent arrears - including thenumber of current and former tenants in arrears and the amount of arrears.
Housing debt - the amount spent on loan charges, interest, capitalrepayment and loan fund expenses.
Additional Capital Expenditure - on new build council housing andenhancements to existing council stock.
These data are used by councils to monitor, manage and plan housing finances. The data are checked by the Chartered Institute of Public Finance and Accountancy. 2017-18 data are actuals (unaudited) whilst 2018-19 are estimates. The bulletin is accompanied by tables, charts, the survey form and guidance. Historical data are available at http://www.gov.scot/Topics/Statistics/Browse/Housing-Regeneration/HSfS/HRAmainpage/HRAStatistics2017
2
Key Points
Balance of HRA housing income and expenditure
Total HRA housing income was £1.1bn in 2017-18, of which around £625mwas spent on the day-to-day management and maintenance of housing andaround £275m on loan charges.
This left a surplus of around £236m, of which around £228m was transferredto the council’s housing capital expenditure account and then invested in newbuild council houses and improvement to existing houses.
In 2017-18, rent rebate subsidy for council house tenants from HousingBenefit was around £562m or 50% of total income from standard rents. Thishas decreased each year since 2014-15 when it was 57%.
Scottish council housing stock and rents
There were 310,150 council houses in Scotland as at March 2018. This is adecrease of around 2,000 houses since March 2017. However, the number isforecast to rise to 311,320 (up 1,200) by March 2019.
Average rent per house was £69 per week in 2017-18, up by just under £1.50on 2016-17. In 2017-18 average rents ranged from £57 per week in Moray to£94 in the City of Edinburgh.
Council rents have increased by around 13% (£8) since 2007-08 in realterms i.e. over and above general inflation.
Management and maintenance of stock
Average expenditure on management and maintenance was £1,990 perhouse in 2017-18. Within this supervision and management costs were £790per house, whilst repairs & maintenance costs were £1,200 per house.
Empty properties and rent arrears
Councils lost almost £18.5m due to empty properties (void losses) on allproperties in 2017-18 or 1.6% of the Standard Rental Income on theseproperties, about the same in the last two years but below the peak of 3.7%in 2002-03.
As at March 2017, rent arrears on all council dwellings was £66m, up £2.4m(3.8%) on last year, representing 5.7% of Standard Rental Income from thesedwellings. These arrears have been rising steadily year on year since March2013.
During the same period, the number of council tenants in arrears hasincreased by around 3,130 tenants to 99,760 and the number of formertenants in arrears also increase by 440 to 32,580 as at March 2018.
3
Housing Debt
In 2017-18 councils spent around £275m on loan charges to the HRA (which includes interest, capital repayment and loan fund expenses), the same as in the previous year.
Total estimated council housing debt stood at £3.6bn in 2017-18 a decrease of around £5m (0.1%) on the previous year. The debt decreased for fourteen councils and increase for twelve councils. Councils borrowed this money to improve and build council houses.
4
Contents
Housing Revenue Account (HRA) Statistics: Scottish Local Authority Housing Income and Expenditure 1997-98 to 2017-18 (actuals) 2018-19 (estimates) ...... 1
Overview ................................................................................................................ 1
Key Points .............................................................................................................. 2
Contents ................................................................................................................ 4
Introduction ............................................................................................................ 5
Local Authority housing stock (chart 1) ................................................................. 6
Housing revenue income and expenditure (charts 2a & 2b) ................................. 7
Rent levels and income from rents (charts 3 & 4) ................................................. 9
Expenditure on housing management and on repairs and maintenance (charts 5,6 & 7) ................................................................................................................ 12
Expenditure on loan charges ............................................................................... 15
Rents lost due to empty properties (void losses) (charts 8 & 9) .......................... 15
Movement in the HRA reserves (chart 12) .......................................................... 19
Capital debt .......................................................................................................... 20
Capital investment (charts 13 & 14) .................................................................... 20
Funding of capital expenditure (chart 15) ............................................................ 23
Tenant Consultation by Councils about HRAs .................................................... 24
5
Introduction
1. This bulletin presents statistics on Local Authority housing income and expenditure in Scotland from their Housing Revenue Accounts (HRAs). It also includes some related information on capital housing investment.
2. The bulletin covers the period 1997-98 to 2017-18 (near actuals)1 up to budgeted estimates for 2018-19 which may be revised next year.
3. Six councils transferred their housing stock to the housing association sector, the largest of these being Glasgow from 20032, which affect comparisons over time.
4. Most figures presented in this bulletin have been rounded for ease of presentation. The requirement to separately account for the income and expenditure associated with council-owned stock in Scotland is laid out in sections 203(1) and 204(4) of the Housing (Scotland) Act 1987.
5. This bulletin (and the tables and charts) include two data sources. Most data are based on HRA survey returns and some data are based on Local Government Capital Returns. The HRA records mainly income from, and expenditure on, council housing.
6. If there is a surplus in the HRA i.e. HRA income exceeds HRA expenditure, this may be transferred into the councils’ housing capital expenditure accounts to be spent on a range of housing capital investment projects.
7. As authorities can borrow to fund capital expenditure, there is a clear separation between the revenue and capital accounts, and tight restrictions on how capital resources can be used. In general, this means that revenue resources can be used for both revenue and capital projects, but capital resources can only be used to fund capital projects. As such capital expenditure is separate to, and in addition to, any HRA expenditure on housing.
1Near actual figures refer to un-audited figures. The auditing of these figures is overseen by Audit Scotland who finish
the auditing process in September of each year. The figures in this bulletin are collected before that time.
2The transfers were: from 2003 - Glasgow, Dumfries & Galloway, Scottish Borders – just over 100,000 houses
transferred, from 2006 - Argyll & Bute, Eilean Siar – just over 7,000 houses transferred, from 2007 - Inverclyde – just
under 8,000 houses transferred.
6
Local Authority housing stock (chart 1)
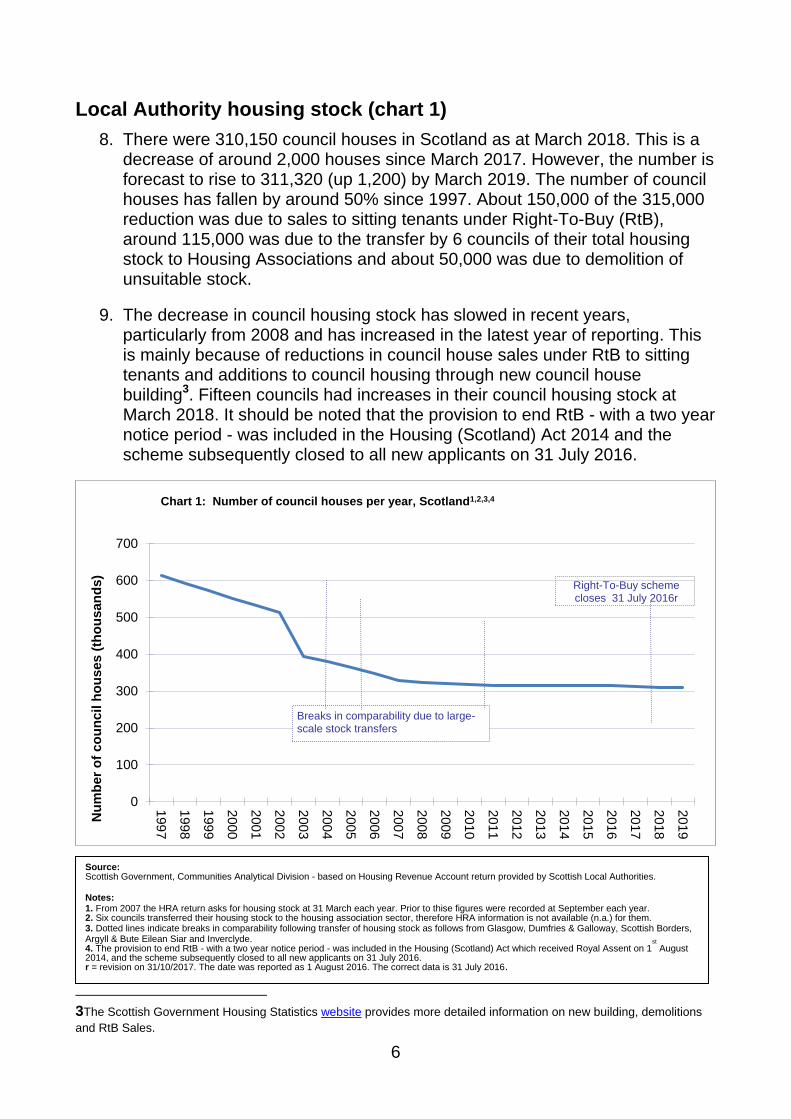
8. There were 310,150 council houses in Scotland as at March 2018. This is a decrease of around 2,000 houses since March 2017. However, the number is forecast to rise to 311,320 (up 1,200) by March 2019. The number of council houses has fallen by around 50% since 1997. About 150,000 of the 315,000 reduction was due to sales to sitting tenants under Right-To-Buy (RtB), around 115,000 was due to the transfer by 6 councils of their total housing stock to Housing Associations and about 50,000 was due to demolition of unsuitable stock.
9. The decrease in council housing stock has slowed in recent years, particularly from 2008 and has increased in the latest year of reporting. This is mainly because of reductions in council house sales under RtB to sitting tenants and additions to council housing through new council house building3. Fifteen councils had increases in their council housing stock at March 2018. It should be noted that the provision to end RtB - with a two year notice period - was included in the Housing (Scotland) Act 2014 and the scheme subsequently closed to all new applicants on 31 July 2016.
3The Scottish Government Housing Statistics website provides more detailed information on new building, demolitions
and RtB Sales.
0
100
200
300
400
500
600
700
199
7
199
8
199
9
200
0
200
1
200
2
200
3
200
4
200
5
200
6
200
7
200
8
200
9
201
0
201
1
201
2
201
3
201
4
201
5
201
6
201
7
201
8
201
9N
um
be
r o
f c
ou
nc
il h
ou
se
s (
tho
us
an
ds
)
Chart 1: Number of council houses per year, Scotland1,2,3,4
Breaks in comparability due to large-scale stock transfers
Right-To-Buy scheme closes 31 July 2016r
Source: Scottish Government, Communities Analytical Division - based on Housing Revenue Account return provided by Scottish Local Authorities. Notes: 1. From 2007 the HRA return asks for housing stock at 31 March each year. Prior to thise figures were recorded at September each year. 2. Six councils transferred their housing stock to the housing association sector, therefore HRA information is not available (n.a.) for them. 3. Dotted lines indicate breaks in comparability following transfer of housing stock as follows from Glasgow, Dumfries & Galloway, Scottish Borders, Argyll & Bute Eilean Siar and Inverclyde. 4. The provision to end RtB - with a two year notice period - was included in the Housing (Scotland) Act which received Royal Assent on 1
st
August 2014, and the scheme subsequently closed to all new applicants on 31 July 2016. r = revision on 31/10/2017. The date was reported as 1 August 2016. The correct data is 31 July 2016.
7
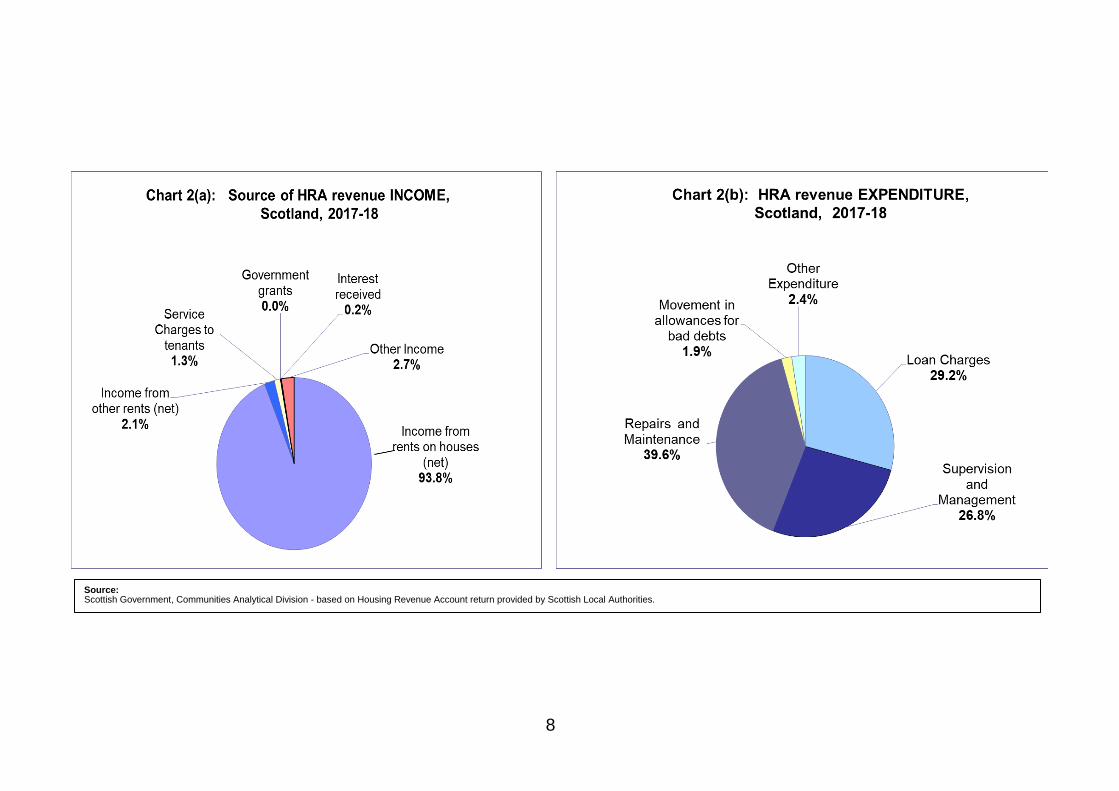
Housing revenue income and expenditure (charts 2a & 2b)
10. In 2017-18, rents from council houses account for around 94% of revenue income to the HRAs. Managing and maintaining the houses accounts for nearly 67% of the expenditure, while loan charges (i.e. the cost of servicing housing debt) account for just under 30%.
11. Other sources of income for Local Authorities include rents on hostels and other properties such as garages or lock-ups and also interest and other charges to tenants for special services. Money is also spent on things such as, upkeep of hostels (in some council areas) and other properties, writing-off rent arrears and paying council tax on void properties.
12. The cost of maintaining and managing housing stock is usually less than the income received i.e. council housing makes a revenue surplus at the Scottish level. This remaining income (the surplus) is used to fund capital investment in the council housing stock as part of the Capital Programme. The use of income in this way is known as Capital Funded from Current Revenue (CFCR).
13. In 2017-18 total HRA income (net) totalled £1.18bn across Scotland and total expenditure was just over £940m. Further details of expenditure and income are set out in Chart 2(a) and 2(b) below. At year end, when income is compared to expenditure there was a surplus of £236m, £228m was transferred to councils’ housing capital expenditure accounts and then invested on housing capital projects including new build council houses and enhancements to existing council stock (in addition to any day-to-day maintenance).
8
Source: Scottish Government, Communities Analytical Division - based on Housing Revenue Account return provided by Scottish Local Authorities.
9
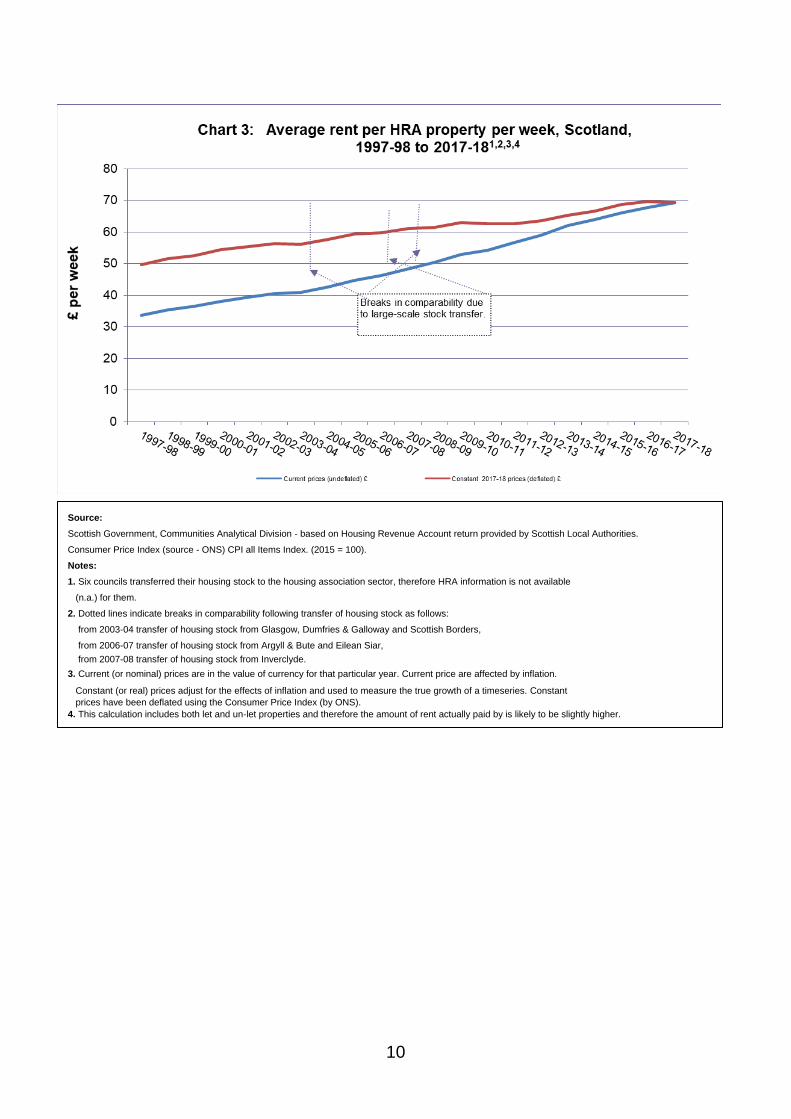
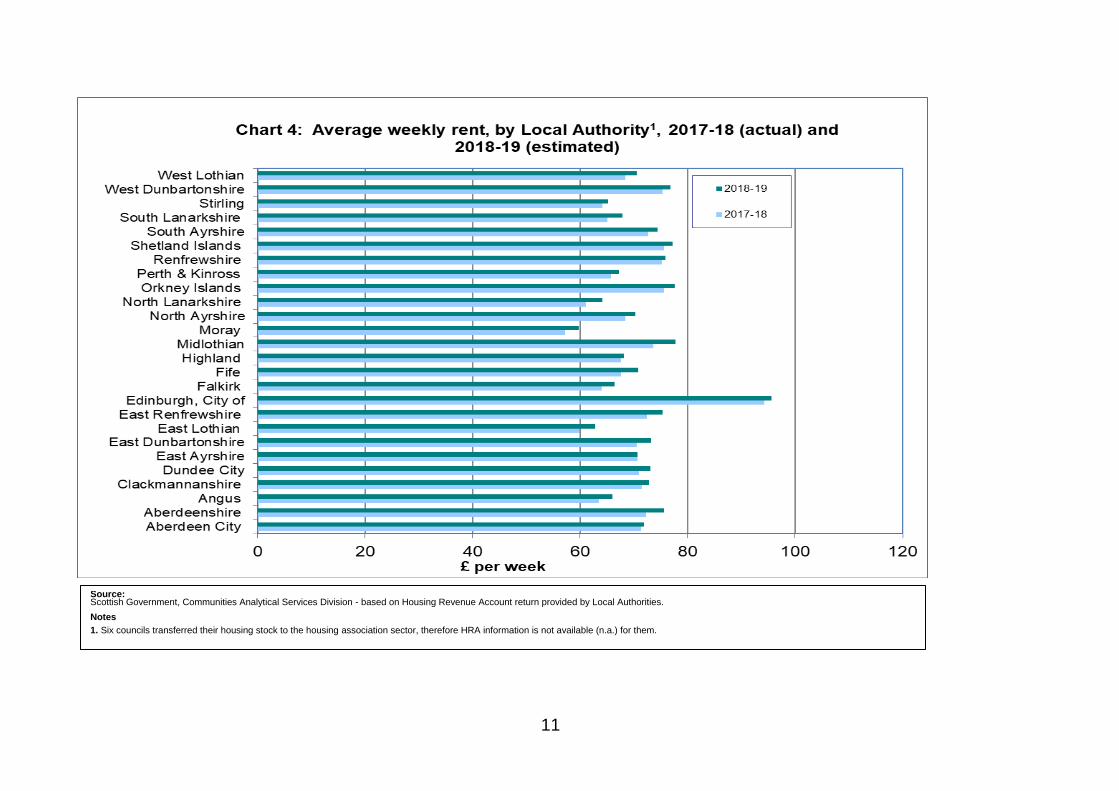
Rent levels and income from rents (charts 3 & 4)
14. In 2017-18 of the 26 Local Authorities with their own housing stock raised a total of just over £1.1bn in income (net of losses from empty properties) from standard rents on dwellings and a further £25m in rent from other HRA properties such as garages.
15. The average rent per dwelling (including both let and un-let properties) was £69 per week in 2017-184 an increase of just under £1.50 since 2016-17. In the decade since 2007-08 average rents have increased by £8 or 13% in real terms i.e. over and above general inflation. In 2017-18 there is variation between councils in average rents, from £57 per week in Moray to £94 per week in the City of Edinburgh.
16. These figures may be lower than rents reported in other publications5 as, rather than taking a weighted average of set rents charged to tenants, they instead reflect the amount earned by the council in respect of each property owned (calculated by dividing the Council's Standard Rental Income on houses by the total letting stock). This method takes into account the proportion of housing which spends some time un-let and those for which rent is not successfully collected.
17. Housing Benefit accounted for a high proportion of council rental income. In 2017-18, rent rebate subsidy for council house tenants was around £562m, representing 50% of total income from standard rents. In 2017-18, rent rebate subsidy as a proportion of standard rents varied from 30% in the Shetland Islands to 67% in Dundee City.
4As this includes un-let house the actual amount of rent paid by tenants is likely to be slightly higher.
5For example the rent figures produced by the Scottish Housing Regulator.
10
Source:
Scottish Government, Communities Analytical Division - based on Housing Revenue Account return provided by Scottish Local Authorities.
Consumer Price Index (source - ONS) CPI all Items Index. (2015 = 100).
Notes:
1. Six councils transferred their housing stock to the housing association sector, therefore HRA information is not available
(n.a.) for them.
2. Dotted lines indicate breaks in comparability following transfer of housing stock as follows:
from 2003-04 transfer of housing stock from Glasgow, Dumfries & Galloway and Scottish Borders,
from 2006-07 transfer of housing stock from Argyll & Bute and Eilean Siar,
from 2007-08 transfer of housing stock from Inverclyde.
3. Current (or nominal) prices are in the value of currency for that particular year. Current price are affected by inflation.
Constant (or real) prices adjust for the effects of inflation and used to measure the true growth of a timeseries. Constant
prices have been deflated using the Consumer Price Index (by ONS).
4. This calculation includes both let and un-let properties and therefore the amount of rent actually paid by is likely to be slightly higher.
11
Source: Scottish Government, Communities Analytical Services Division - based on Housing Revenue Account return provided by Local Authorities. Notes 1. Six councils transferred their housing stock to the housing association sector, therefore HRA information is not available (n.a.) for them.
12
Expenditure on housing management and on repairs and
maintenance (charts 5,6 & 7)
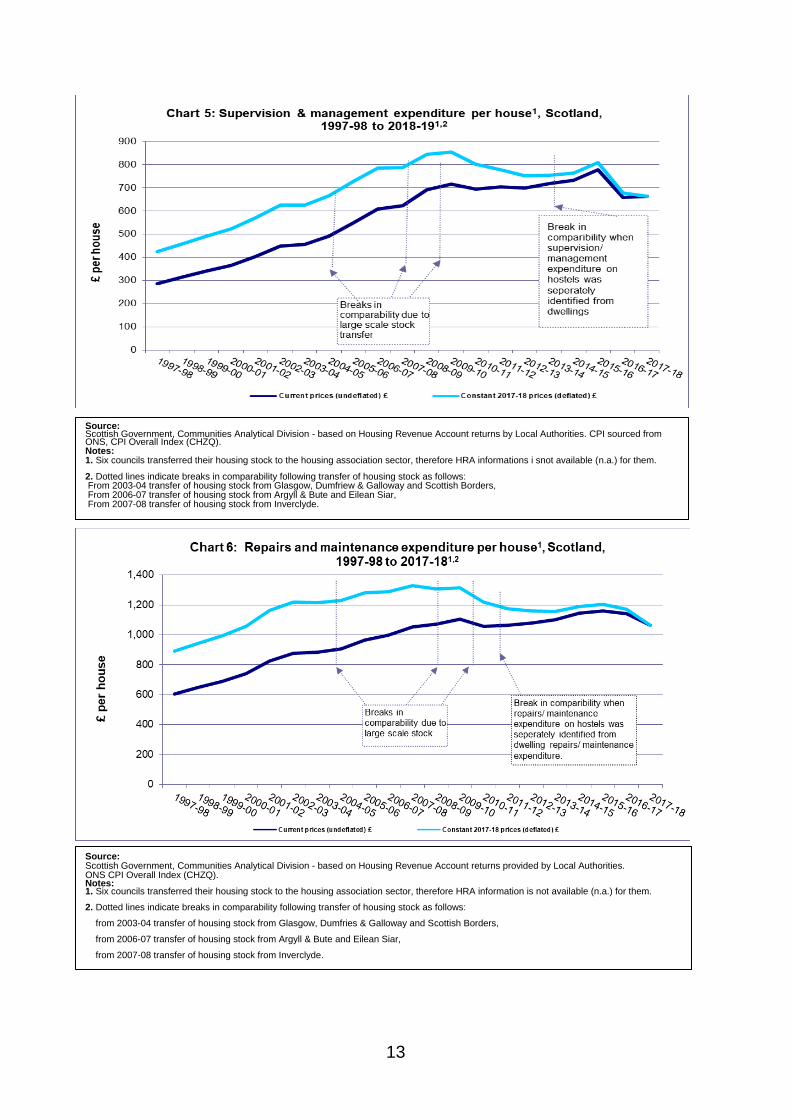
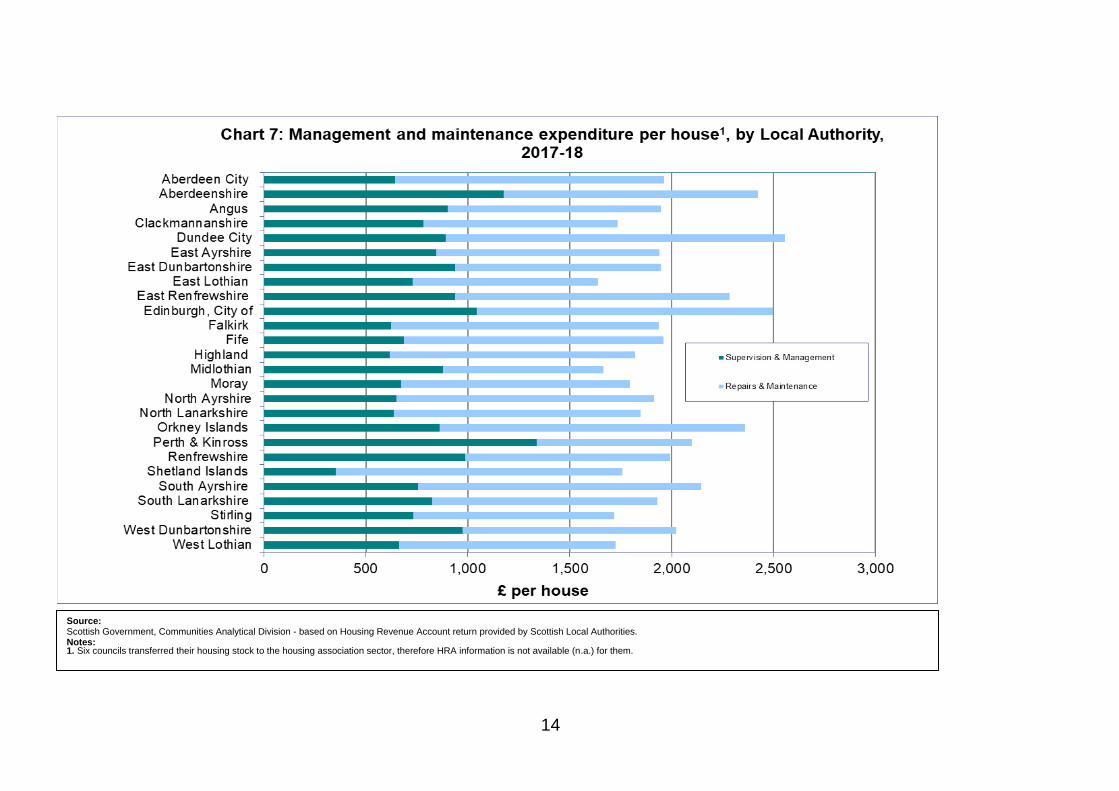
18. In 2017-18, the 26 Local Authorities with council dwellings spent around £1,990 per house on management and maintenance, which is forecast to rise by 3.5% to around £2,060 in 2018-19.
19. Spending for 2017-18 ranges from £1,640 per house in East Lothian to £2,556 in Dundee City. Differing accounting practices and differing service provision amongst councils mean that the figures for individual councils may not always be directly comparable and the estimates for management and maintenance expenditure should be treated with caution.
20. Supervision and management costs in 2017-18 were around £790 per house and a forecast to increase to £850 per house in 2018-19. As Local Authorities differ in the extent to which central administration and related service costs are included, individual figures may not always be directly comparable.
21. Average annual expenditure on repairs and maintenance was around £1,200 per house in 2017-18 and is forecast to increase to £1,205 or 0.7% in 2018-19. Spending on repairs and maintenance in 2017-18 ranges from £760 per house in Perth and Kinross to £1,499 per house in the Orkney Islands.
22. Please note that the HRA repairs and maintenance expenditure referred to in the above paragraphs is separate, and in additional to, the capital investment in council housing stock enhancements referred to elsewhere in this bulletin
13
Source: Scottish Government, Communities Analytical Division - based on Housing Revenue Account returns by Local Authorities. CPI sourced from ONS, CPI Overall Index (CHZQ). Notes: 1. Six councils transferred their housing stock to the housing association sector, therefore HRA informations i snot available (n.a.) for them. 2. Dotted lines indicate breaks in comparability following transfer of housing stock as follows: From 2003-04 transfer of housing stock from Glasgow, Dumfriew & Galloway and Scottish Borders, From 2006-07 transfer of housing stock from Argyll & Bute and Eilean Siar, From 2007-08 transfer of housing stock from Inverclyde.
Source: Scottish Government, Communities Analytical Division - based on Housing Revenue Account returns provided by Local Authorities. ONS CPI Overall Index (CHZQ). Notes: 1. Six councils transferred their housing stock to the housing association sector, therefore HRA information is not available (n.a.) for them. 2. Dotted lines indicate breaks in comparability following transfer of housing stock as follows: from 2003-04 transfer of housing stock from Glasgow, Dumfries & Galloway and Scottish Borders, from 2006-07 transfer of housing stock from Argyll & Bute and Eilean Siar, from 2007-08 transfer of housing stock from Inverclyde.
14
Source: Scottish Government, Communities Analytical Division - based on Housing Revenue Account return provided by Scottish Local Authorities. Notes: 1. Six councils transferred their housing stock to the housing association sector, therefore HRA information is not available (n.a.) for them.
15
Expenditure on loan charges
23. Loan charges are the repayment of principal and interest on outstanding debt on council houses. Local Authorities spent £275m on loan charges to the HRA in 2017-18 which is approximately £5m more than in 2016-17. Loan charges represent around 30% of all Local Authority housing expenditure (excluding capital spend) in 2017-18.
Rents lost due to empty properties (void losses) (charts 8 & 9)
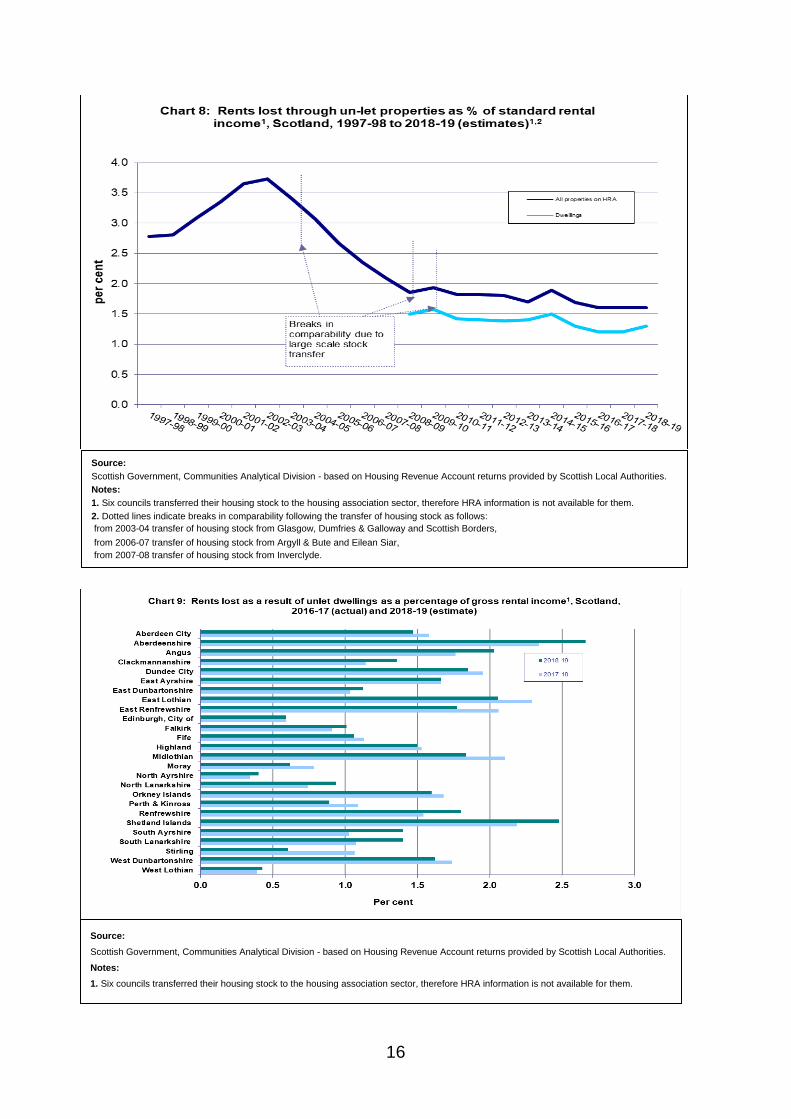
24. Councils lost around £18.5m due to un-let properties held on their HRAs in 2017-18. This represents 1.6% of Standard Rental Income and is at about the same level as the two previous years, well below the peak of 3.7% in 2002-03.
25. From 2008-09 the statistics collected from Local Authorities have separately identified rents lost from un-let dwellings. For Scotland as a whole rents lost amounted to around £14m in 2017-18 representing around 1.2% of total rent income on these dwellings.
26. The percentage of rent on dwellings lost through voids in 2017-18 was highest in Aberdeenshire and East Lothian (2.3%) and lowest in North Ayrshire (0.3%). Levels of rent lost may be strongly influenced by factors such as different levels of demand for properties, different void management practices and targets, decanting for improvement or investment programmes or the inclusion of properties awaiting demolition.
16
Source: Scottish Government, Communities Analytical Division - based on Housing Revenue Account returns provided by Scottish Local Authorities. Notes: 1. Six councils transferred their housing stock to the housing association sector, therefore HRA information is not available for them. 2. Dotted lines indicate breaks in comparability following the transfer of housing stock as follows: from 2003-04 transfer of housing stock from Glasgow, Dumfries & Galloway and Scottish Borders, from 2006-07 transfer of housing stock from Argyll & Bute and Eilean Siar, from 2007-08 transfer of housing stock from Inverclyde.
Source: Scottish Government, Communities Analytical Division - based on Housing Revenue Account returns provided by Scottish Local Authorities. Notes: 1. Six councils transferred their housing stock to the housing association sector, therefore HRA information is not available for them.
17
Rent arrears and the rents written-off (charts 10 & 11)
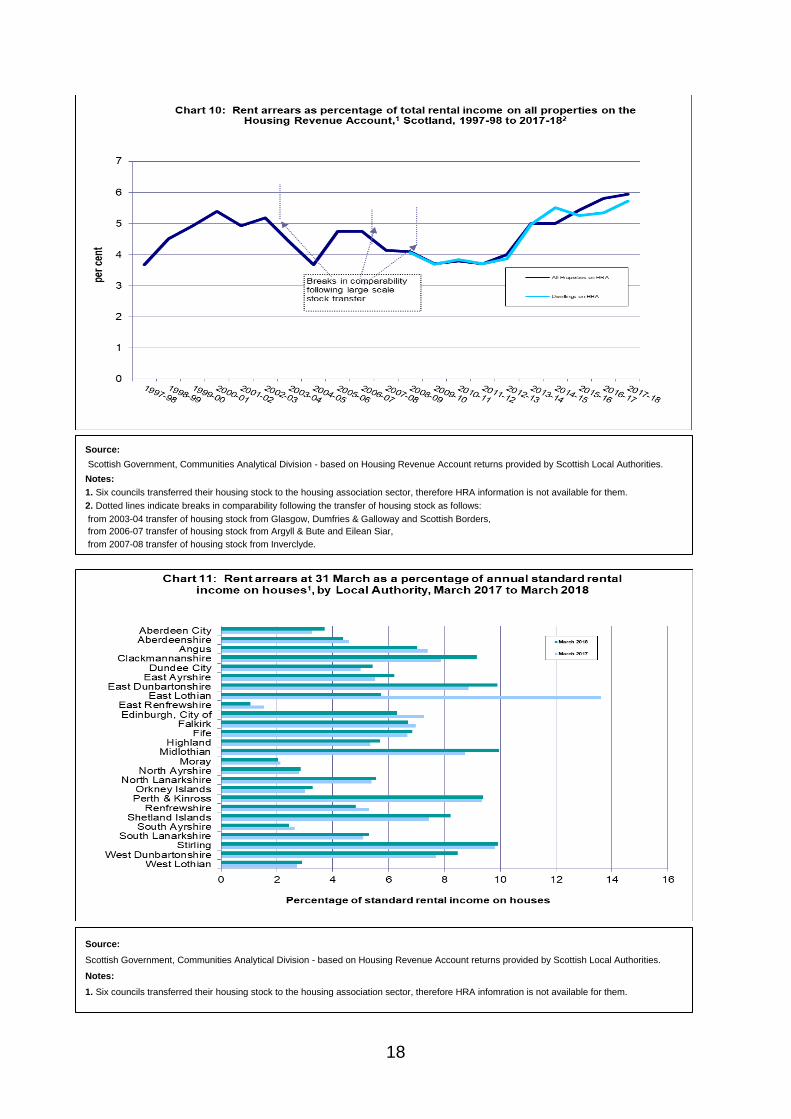
27. Total rent arrears on all properties on HRAs at 31 March 2018 were estimated at £68m, a rise of around £2.6m (3.9%) since 31 March 2017. Nationally, rent arrears at 31 March 2018 represent 5.9% of Standard Rental Income on all properties on the HRA compared with 5.8% as at 31 March 2017 and is the highest value recorded since this series started in 1997/98.
28. From 2008-09 the statistics collected from Local Authorities have separately identified rent arrears on dwellings from rent arrears in other properties held on councils’ HRAs.
29. As at March 2018, rent arrears on council dwellings was £66m, up £2.4m (3.8%) on last year, representing 5.7% of Standard Rental Income from these dwellings. Rent arrears on dwellings varied from 10% of Standard Rental Income from dwellings in Midlothian to 1.1% in East Renfrewshire.
30. As at 31 March 2018 there were around 99,760 council tenants in arrears, an increase of around 3,130 tenants compared to 31 March 2017. The number of former tenants in arrears increased by 440 to around 32,580 as at 31 March 2018.
31. In 2017-18 budgets, councils wrote-off nearly £10.1m of outstanding rent as unrecoverable (this represents 1.0% of Standard Rental Income) compared to £10.4m in the previous year. Write-offs for 2017-18 varied from around £0.2m in the Perth & Kinross to £1.7m in Highland. Amounts of arrears written-off by councils can be influenced by councils’ accounting policies and judgements on whether arrears are recoverable.
18
Source: Scottish Government, Communities Analytical Division - based on Housing Revenue Account returns provided by Scottish Local Authorities. Notes: 1. Six councils transferred their housing stock to the housing association sector, therefore HRA information is not available for them. 2. Dotted lines indicate breaks in comparability following the transfer of housing stock as follows: from 2003-04 transfer of housing stock from Glasgow, Dumfries & Galloway and Scottish Borders, from 2006-07 transfer of housing stock from Argyll & Bute and Eilean Siar, from 2007-08 transfer of housing stock from Inverclyde.
Source: Scottish Government, Communities Analytical Division - based on Housing Revenue Account returns provided by Scottish Local Authorities. Notes: 1. Six councils transferred their housing stock to the housing association sector, therefore HRA infomration is not available for them.
19
Movement in the HRA reserves (chart 12)
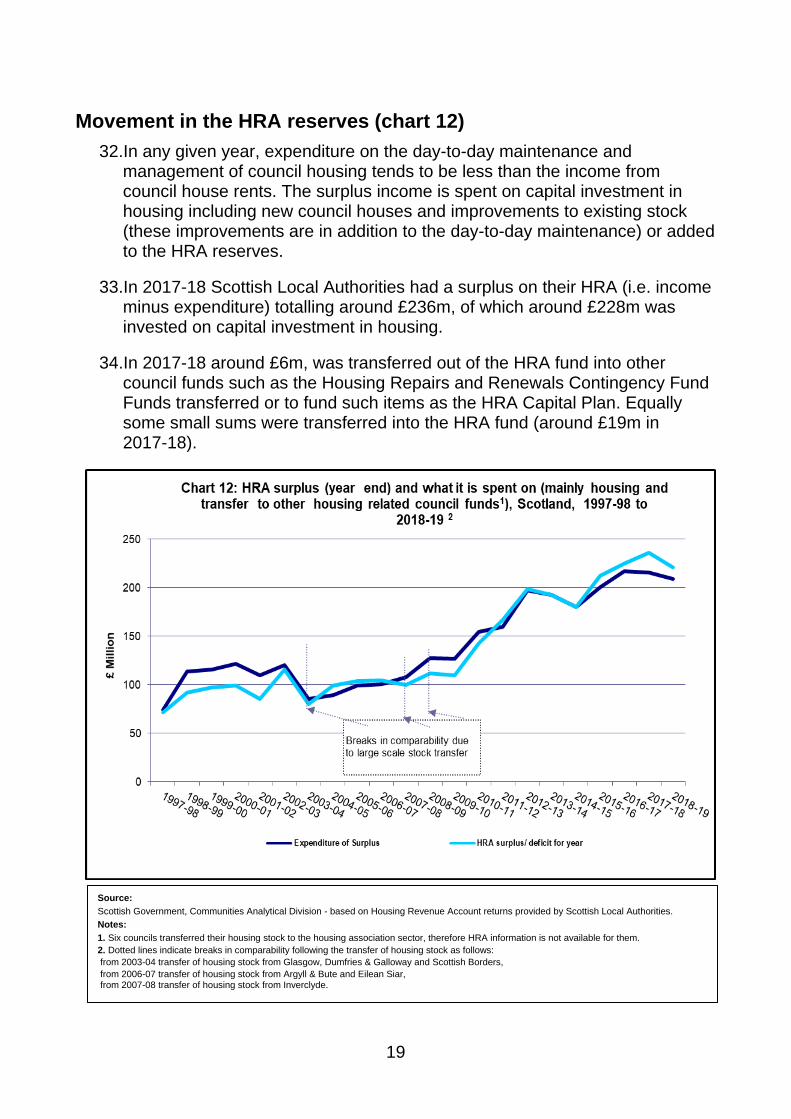
32. In any given year, expenditure on the day-to-day maintenance and management of council housing tends to be less than the income from council house rents. The surplus income is spent on capital investment in housing including new council houses and improvements to existing stock (these improvements are in addition to the day-to-day maintenance) or added to the HRA reserves.
33. In 2017-18 Scottish Local Authorities had a surplus on their HRA (i.e. income minus expenditure) totalling around £236m, of which around £228m was invested on capital investment in housing.
34. In 2017-18 around £6m, was transferred out of the HRA fund into other council funds such as the Housing Repairs and Renewals Contingency Fund Funds transferred or to fund such items as the HRA Capital Plan. Equally some small sums were transferred into the HRA fund (around £19m in 2017-18).
Source: Scottish Government, Communities Analytical Division - based on Housing Revenue Account returns provided by Scottish Local Authorities. Notes: 1. Six councils transferred their housing stock to the housing association sector, therefore HRA information is not available for them. 2. Dotted lines indicate breaks in comparability following the transfer of housing stock as follows: from 2003-04 transfer of housing stock from Glasgow, Dumfries & Galloway and Scottish Borders, from 2006-07 transfer of housing stock from Argyll & Bute and Eilean Siar, from 2007-08 transfer of housing stock from Inverclyde.
20
Capital debt
35. A Local Authority may borrow to fund capital expenditure. Local Authorities may borrow from a number of sources including banks and other financial institutions. Most Local Authorities borrow from the UK Government's Public Works Loan Board (PWLB). In addition to borrowing Local Authorities may finance capital investment through other credit arrangements such as finance leases and Public Finance Initiatives (PFI) including the Non Profit Distribution model (NPD). The NPD model was developed and introduced as an alternative to, and has since superseded, the traditional PFI model in Scotland. The sum of borrowing and any credit arrangement to finance capital investment is termed Capital Debt.
36. Councils estimated that total HRA debt was nearly £3.6bn as at 31 March 2018, a decrease of around £5m (0.1%) since 31 March 2017. The debt decreased for fourteen councils and increased for twelve councils. Part of the increase in debt since 2007 is a consequence of increased borrowing by councils to meet the capital costs of new build housing and improvements to existing houses (see section 12 below) and reductions in receipts from the sale of council houses under RtB scheme (see section 13 below) which closed on 31 July 2016. Council housing debt is forecast to rise to £3.9bn by 2018-19.
Capital investment (charts 13 & 14)
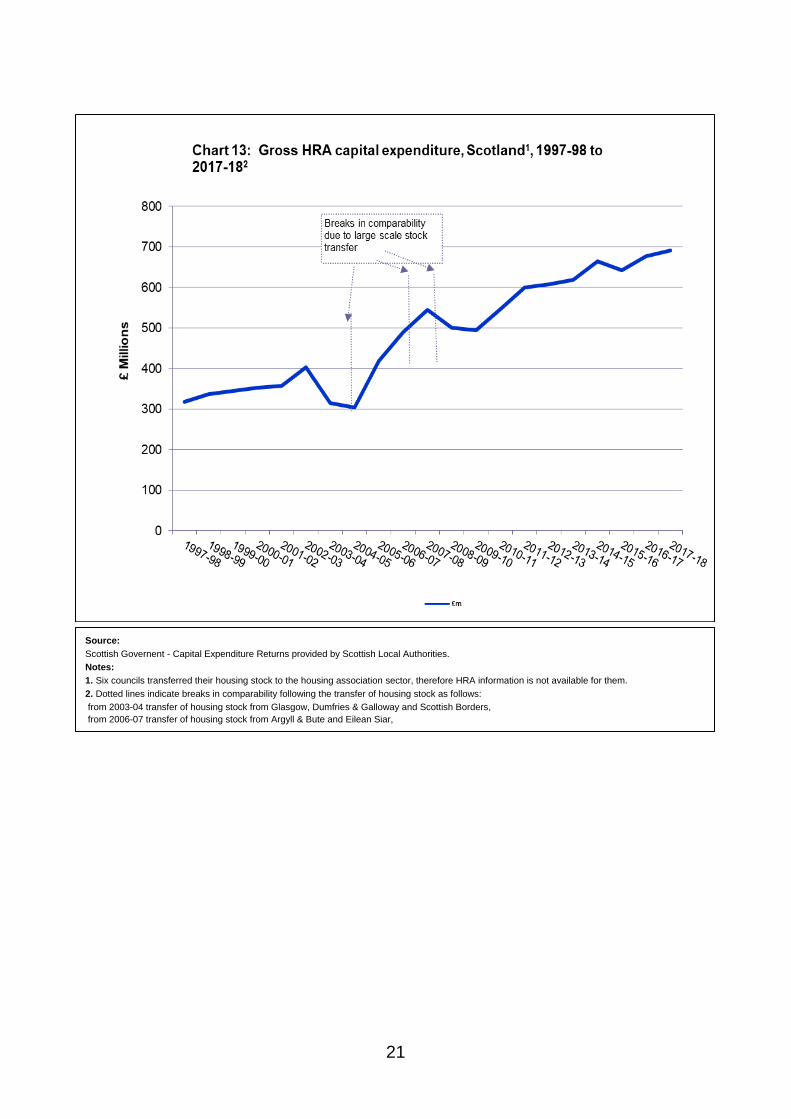
37. Local Authorities’ total HRA capital investment on housing, financed from all sources (including new borrowing, useable receipts and financed from the CFCR from the HRA surplus), totalled around £690m in 2017-18, an increase of over £14m since 2016-17.
38. This housing capital investment also varies between areas, for example in 2017-18 Fife council invested around £68m on housing capital projects whilst the Orkney Islands invested around £0.1m.
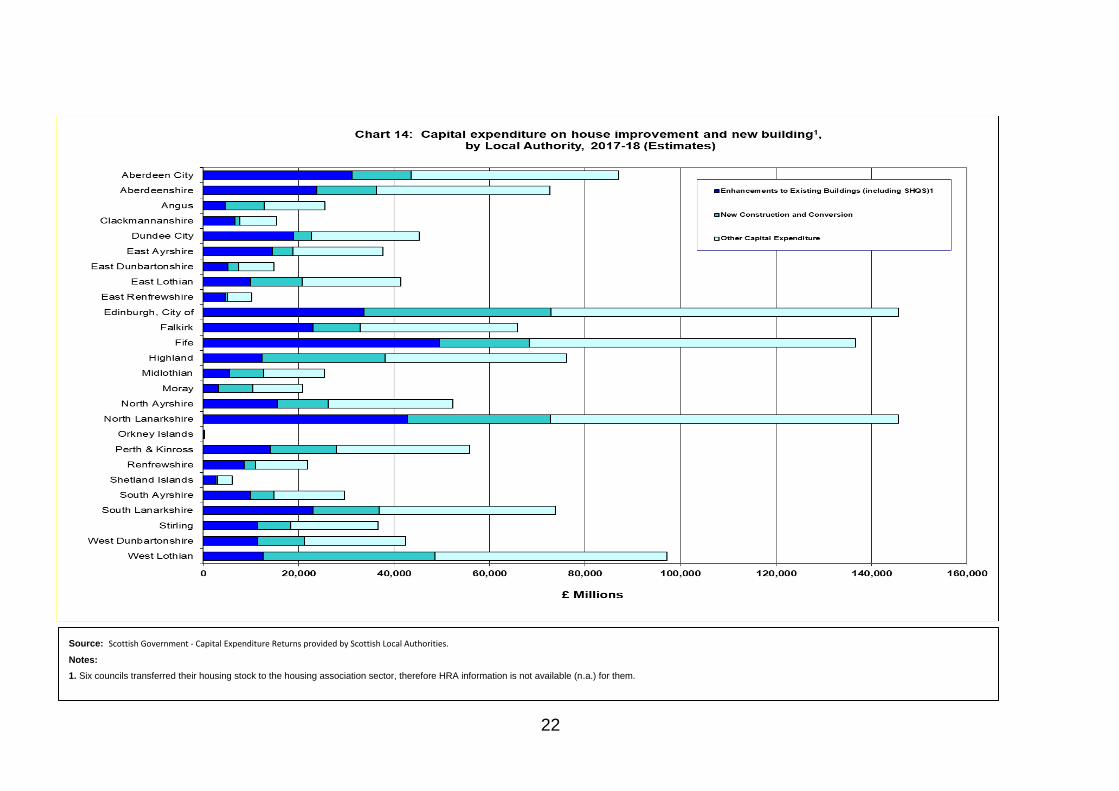
39. In 2017-18 councils invested over £399m on improvements to existing council houses and £293m on new council houses. This expenditure is in addition to the day-to-day maintenance referred to above. In 2017-18 the councils with the greatest capital investment in new council housing were the City of Edinburgh (around £39m) followed by West Lothian (around £36m).
21
Source: Scottish Governent - Capital Expenditure Returns provided by Scottish Local Authorities. Notes: 1. Six councils transferred their housing stock to the housing association sector, therefore HRA information is not available for them. 2. Dotted lines indicate breaks in comparability following the transfer of housing stock as follows: from 2003-04 transfer of housing stock from Glasgow, Dumfries & Galloway and Scottish Borders, from 2006-07 transfer of housing stock from Argyll & Bute and Eilean Siar, from 2007-08 transfer of housing stock from Inverclyde.
22
Source: Scottish Government - Capital Expenditure Returns provided by Scottish Local Authorities. Notes: 1. Six councils transferred their housing stock to the housing association sector, therefore HRA information is not available (n.a.) for them.
23
Funding of capital expenditure (chart 15)
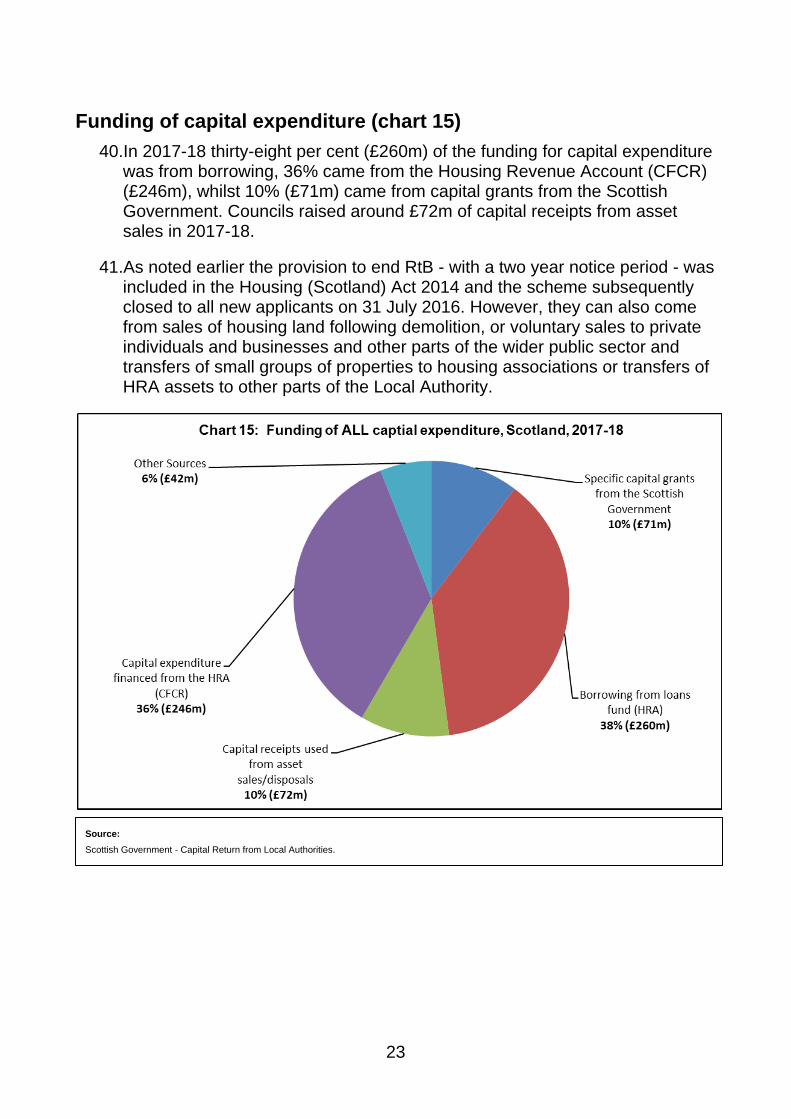
40. In 2017-18 thirty-eight per cent (£260m) of the funding for capital expenditurewas from borrowing, 36% came from the Housing Revenue Account (CFCR)(£246m), whilst 10% (£71m) came from capital grants from the ScottishGovernment. Councils raised around £72m of capital receipts from assetsales in 2017-18.
41. As noted earlier the provision to end RtB - with a two year notice period - wasincluded in the Housing (Scotland) Act 2014 and the scheme subsequentlyclosed to all new applicants on 31 July 2016. However, they can also comefrom sales of housing land following demolition, or voluntary sales to privateindividuals and businesses and other parts of the wider public sector andtransfers of small groups of properties to housing associations or transfers ofHRA assets to other parts of the Local Authority.
Source:
Scottish Government - Capital Return from Local Authorities.
24
Tenant Consultation by Councils about HRAs6,r
42. In the 2017-18 HRA survey councils were asked about the extent and nature of any consultation they had undertaken with tenants in the previous year, for example, in terms of how the HRA budget had been spent or plans for future HRA expenditure. This follows the publication of ‘Guidance on the Operation of the Local Authority Housing Revenue Accounts in Scotland’ (2014)https://indd.adobe.com/view/b5bb0a29-9cd7-4b3d-a596-f21c5dcfc19f https://indd.adobe.com/view/358417f4-e346-4442-b5df-9d801bf4589f which sets out a framework for the involvement of landlords and tenants regarding HRAs.
43. Twenty of the twenty-six councils reported that they had undertaken tenant consultation about the HRA in 2017-18, one reported plans to consult next year, two reported no consultation undertaken, and three didn’t provide a response to this question. The most frequently reported consultation topic was about rent rise proposals and HRA spending plans. Other topics included:
> sale of council land parcels> council housing stock improvements> service delivery> value for money> new housing building programs> voids> affordability> new build programs
44. Council reported a variety of methods used to consult tenants about the HRA,the most frequent of which were tenant surveys (postal, online and telephone) andtenant meetings, panels or forums. Other consultation methods included:
> tenant working groups> newsletters> tenant conferences> public meetings> report cards> housing magazines> tenant newsletters seeking feedback.> homelessness and Gypsy/ Traveller groups
45. Councils were also asked if they had done an audit of compliance with the ‘Guidance on the Operation of Local Authority HRAs in Scotland’http://www.gov.scot/Publications/2014/03/1837. In 2017-18 eleven councils reported that they had, seven said no, four gave no response and four said they planned to undertake an audit.
46. Twelve councils reported they had used the HRA self-assessment framework, seven said no, five had plans to use it, and two gave no response.
6 The text on page 24 was revised on 11 October 2019
25
An Official Statistics publication for Scotland
Official and National Statistics are produced to high professional standards set out in the Code of Practice for Official Statistics. Both undergo regular quality assurance reviews to ensure that they meet customer needs and are produced free from any political interference.
Correspondence and enquiries For enquiries about this publication please contact: Mr Charles Brown, Communities Analysis Division, Scottish Government, Victoria Quay, Edinburgh, EH6 6QQ. Telephone: 0131 244 0870 e-mail: [email protected]
For general enquiries about Scottish Government statistics please contact: Office of the Chief Statistician, Telephone: 0131 244 0442, e-mail: [email protected]
How to access background or source data
The data collected for this <statistical bulletin / social research publication>:
☐ are available in more detail through Scottish Neighbourhood Statistics
☐ are available via an alternative route <specify or delete this text>
☒ may be made available on request, subject to consideration of legal and ethical
factors. Please contact <email address> for further information.
☐ cannot be made available by Scottish Government for further analysis as
Scottish Government is not the data controller.
Complaints and suggestions If you are not satisfied with our service or have any comments or suggestions, please write to the Chief Statistician, 3WR, St Andrew’s House, Edinburgh, EH1 3DG, Telephone: (0131) 244 0302, e-mail [email protected].
If you would like to be consulted about statistical collections or receive notification of publications, please register your interest at www.gov.scot/scotstat Details of forthcoming publications can be found at www.gov.scot/statistics
Crown Copyright You may use or re-use this information (not including logos) free of charge in any format or medium, under the terms of the Open Government Licence. See: www.nationalarchives.gov.uk/doc/open-government-licence/
w w w . g o v . s c o t
© Crown copyright 2018
This publication is licensed under the terms of the Open Government Licence v3.0 except where otherwise stated. To view this licence, visit nationalarchives.gov.uk/doc/open-government-licence/version/3 or write to the Information Policy Team, The National Archives, Kew, London TW9 4DU, or email: [email protected]
Where we have identified any third party copyright information you will need to obtain permission from the copyright holders concerned.
This publication is available at www.gov.scot
Any enquiries regarding this publication should be sent to us at The Scottish GovernmentSt Andrew’s HouseEdinburghEH1 3DG
ISBN: 978-1-78781-297-0 (web only)
Published by The Scottish Government, October 2018
Produced for The Scottish Government by APS Group Scotland, 21 Tennant Street, Edinburgh EH6 5NAPPDAS481486 (10/18)