Embed Size (px)
Citation preview

Comprehensive Annual FinancialReport for the Year Ended June 30, 2003
Houston Municipal Employees Pension System
60Years ofService to
City of Houston
MunicipalEmployees
A Component Unit of the City of Houston, Texas
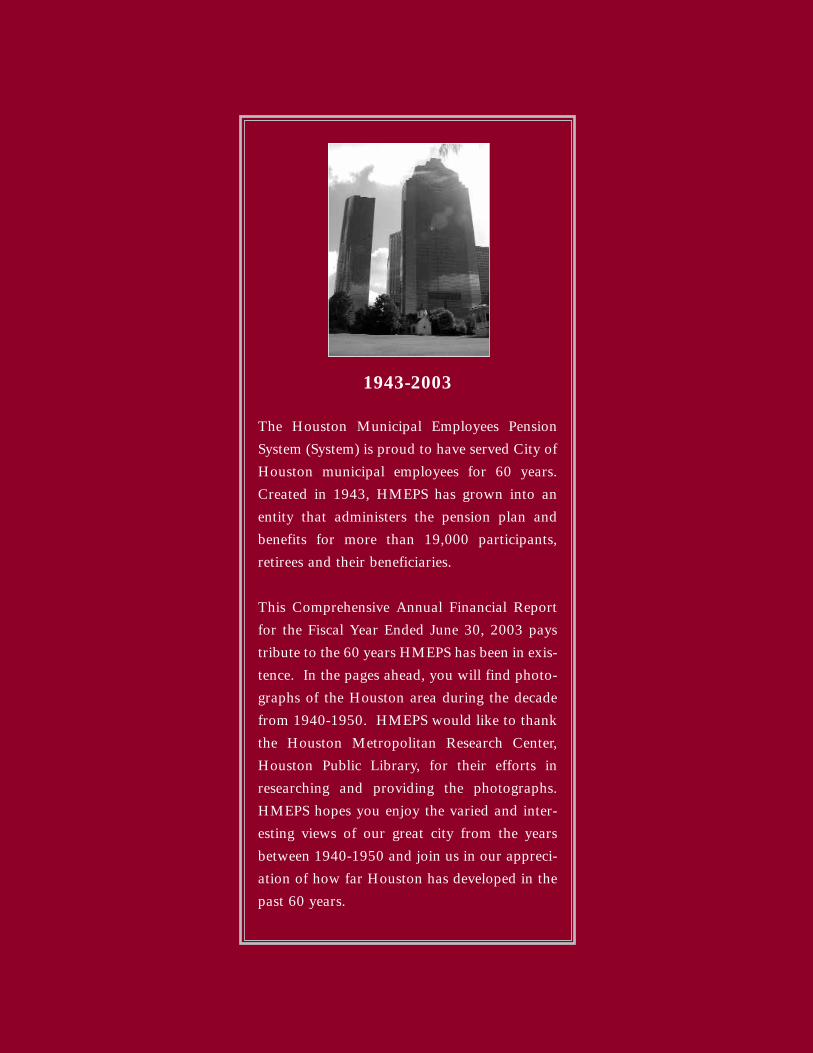
1943-2003
The Houston Municipal Employees Pension
System (System) is proud to have served City of
Houston municipal employees for 60 years.
Created in 1943, HMEPS has grown into an
entity that administers the pension plan and
benefits for more than 19,000 participants,
retirees and their beneficiaries.
This Comprehensive Annual Financial Report
for the Fiscal Year Ended June 30, 2003 pays
tribute to the 60 years HMEPS has been in exis-
tence. In the pages ahead, you will find photo-
graphs of the Houston area during the decade
from 1940-1950. HMEPS would like to thank
the Houston Metropolitan Research Center,
Houston Public Library, for their efforts in
researching and providing the photographs.
HMEPS hopes you enjoy the varied and inter-
esting views of our great city from the years
between 1940-1950 and join us in our appreci-
ation of how far Houston has developed in the
past 60 years.
HOUSTONMUNICIPALEMPLOYEES
PENSION SYSTEM
HOUSTON MUNICIPAL EMPLOYEES PENSION SYSTEM
COMPREHENSIVE ANNUAL FINANCIAL REPORTFOR THE FISCAL YEAR ENDED JUNE 30, 2003
PREPARED BY THE PENSION ADMINISTRATION STAFFDAVID L. LONG, EXECUTIVE DIRECTOR
HOUSTON MUNICIPAL EMPLOYEES PENSION SYSTEM1111 BAGBY, SUITE 2450, HOUSTON, TEXAS 77002-2555
(713) 759-9275www.hmeps.org
TABLE OF CONTENTS
Introductory SectionLetter of Transmittal . . . . . . . . . . . . . . . . . . . . . . . . . . . . . . . . . . . . . . . . . . . . . . . . . . . . . . .2GFOA Certificate of Achievement . . . . . . . . . . . . . . . . . . . . . . . . . . . . . . . . . . . . . . . . . . . . . .6Professional Consultants and Investment Managers . . . . . . . . . . . . . . . . . . . . . . . . . . . . . . . . .7
Financial SectionIntroduction to Financial Statements . . . . . . . . . . . . . . . . . . . . . . . . . . . . . . . . . . . . . . . . . . .10Independent Auditors’ Report . . . . . . . . . . . . . . . . . . . . . . . . . . . . . . . . . . . . . . . . . . . . . . . .11Management’s Discussion and Analysis . . . . . . . . . . . . . . . . . . . . . . . . . . . . . . . . . . . . . . . . .12
Financial StatementsStatements of Plan Net Assets June 30, 2003 and 2002 . . . . . . . . . . . . . . . . . . . . . . . . . . . . .16Statements of Changes in Plan Net Assets Years Ended June 30, 2003 and 2002 . . . . . . . . . . .17Notes to Basic Financial Statements June 30, 2003 and 2002 . . . . . . . . . . . . . . . . . . . . . . . . .18
Supplemental InformationSchedule of Funding Progress (Unaudited) (in Millions of Dollars) . . . . . . . . . . . . . . . . . . . . .26Schedule of Employer Contributions (Unaudited) . . . . . . . . . . . . . . . . . . . . . . . . . . . . . . . . .26Notes to Required Supplemental Schedules 1 and 2 (Unaudited) . . . . . . . . . . . . . . . . . . . . . .27Investment Summary June 30, 2003 and 2002 . . . . . . . . . . . . . . . . . . . . . . . . . . . . . . . . . . . .27Investment Services, Professional Services, and Administration
Expenses Years Ended June 30, 2003 and 2002 . . . . . . . . . . . . . . . . . . . . . . . . . . . . . . . . .28Summary of Costs of Investment and Professional Services
Years Ended June 30, 2003 and 2002 . . . . . . . . . . . . . . . . . . . . . . . . . . . . . . . . . . . . . . . .29
Investment SectionDiscussion of Investment Policies and Activities . . . . . . . . . . . . . . . . . . . . . . . . . . . . . . . . . . .32Schedule of Top Investments ($000) as of June 30, 2003 . . . . . . . . . . . . . . . . . . . . . . . . . . . .34Comparison of Investment Returns - Years Ended June 30 . . . . . . . . . . . . . . . . . . . . . . . . . . .34 Performance by Fiscal Year Last Ten Years . . . . . . . . . . . . . . . . . . . . . . . . . . . . . . . . . . . . . .35Schedule of Fees and Commissions . . . . . . . . . . . . . . . . . . . . . . . . . . . . . . . . . . . . . . . . . . . .36
Events in Houston, 1940 through 1950
Houston ranked twenty-first in the nation with a population of 384,514 -a 31.5 percent increase over 1930. Houston also had registered 170,000motor vehicles.
World War II affected the Houston economy as ship arrivals fell to 2,809,but freight tonnage remained near the 1939 level with 27,385,589 tons.Five steamship lines discontinued service to Houston, as the war disruptedshipping.
The city possessed a $22,000,000 public school system with 2,250 teachers,74,000 students, and 115 buildings.
The city manager form of government wasinstituted with eight council members, apart-time mayor, and the first city manager,John North Edy.
Working on war contracts, the HoustonShipbuilding Corporation expanded its pay-roll from 6,000 to 20,000. During the war,the company turned out 208 cargo vesselsand 14 tankers.
19421940
Actuarial SectionActuary’s Letter to the Board of Trustees . . . . . . . . . . . . . . . . . . . . . . . . . . . . . . . . . . . . . . .40Actuarial Certification . . . . . . . . . . . . . . . . . . . . . . . . . . . . . . . . . . . . . . . . . . . . . . . . . . . . .41Summary of Key Results ($000) . . . . . . . . . . . . . . . . . . . . . . . . . . . . . . . . . . . . . . . . . . . . . .42Summary of Assets as of July 1, 2002 ($000) . . . . . . . . . . . . . . . . . . . . . . . . . . . . . . . . . . . .42Asset Information . . . . . . . . . . . . . . . . . . . . . . . . . . . . . . . . . . . . . . . . . . . . . . . . . . . . . . . . .43Funding Information . . . . . . . . . . . . . . . . . . . . . . . . . . . . . . . . . . . . . . . . . . . . . . . . . . . . . .45Contribution Information . . . . . . . . . . . . . . . . . . . . . . . . . . . . . . . . . . . . . . . . . . . . . . . . . . .46Cash Flow Projection . . . . . . . . . . . . . . . . . . . . . . . . . . . . . . . . . . . . . . . . . . . . . . . . . . . . . .47Participant Information . . . . . . . . . . . . . . . . . . . . . . . . . . . . . . . . . . . . . . . . . . . . . . . . . . . .51Summary of Actuarial Methods and Assumptions . . . . . . . . . . . . . . . . . . . . . . . . . . . . . . . . .52Changes in Methods and Assumptions Since the Prior Valuation . . . . . . . . . . . . . . . . . . . . . .53Changes in Plan Provisions Since the Prior Year . . . . . . . . . . . . . . . . . . . . . . . . . . . . . . . . . . .57
Statistical SectionSchedule of Average Benefit Payments for the Six Years Ended June 30, 2002 . . . . . . . . . . . .60Schedule of Benefits by Type ($000) for the Six Years Ended June 30, 2002 . . . . . . . . . . . . . .60Schedule of Annuitants by Type . . . . . . . . . . . . . . . . . . . . . . . . . . . . . . . . . . . . . . . . . . . . . .60Historical Active Participant Data . . . . . . . . . . . . . . . . . . . . . . . . . . . . . . . . . . . . . . . . . . . . .61Schedule of Revenues by Source ($000) for the Six Years Ended June 30, 2003 . . . . . . . . . . .61Schedule of Expenses by Type ($000) for the Six Years Ended June 30, 2003 . . . . . . . . . . . . .61
Acknowledgments . . . . . . . . . . . . . . . . . . . . . . . . . . . . . . . . . . . . . . . . . . . . . . . . . . . . . . . .62
The M.D. Anderson Foundationformed the Texas Medical CenterCorporation to oversee the MedicalCenter’s development.
1945 1947
Oscar Holcombe took office asmayor, and the city manager formof municipal government was aban-doned in favor of a strong mayorarrangement.
Alley Theatre of Houston gave itsfirst performance under the direc-tion of Nina Vance.
1950
The city's population was 596,163, ajump of 55.5 percent over 1940.
Rice Institute completed the 70,000seat Rice Stadium.
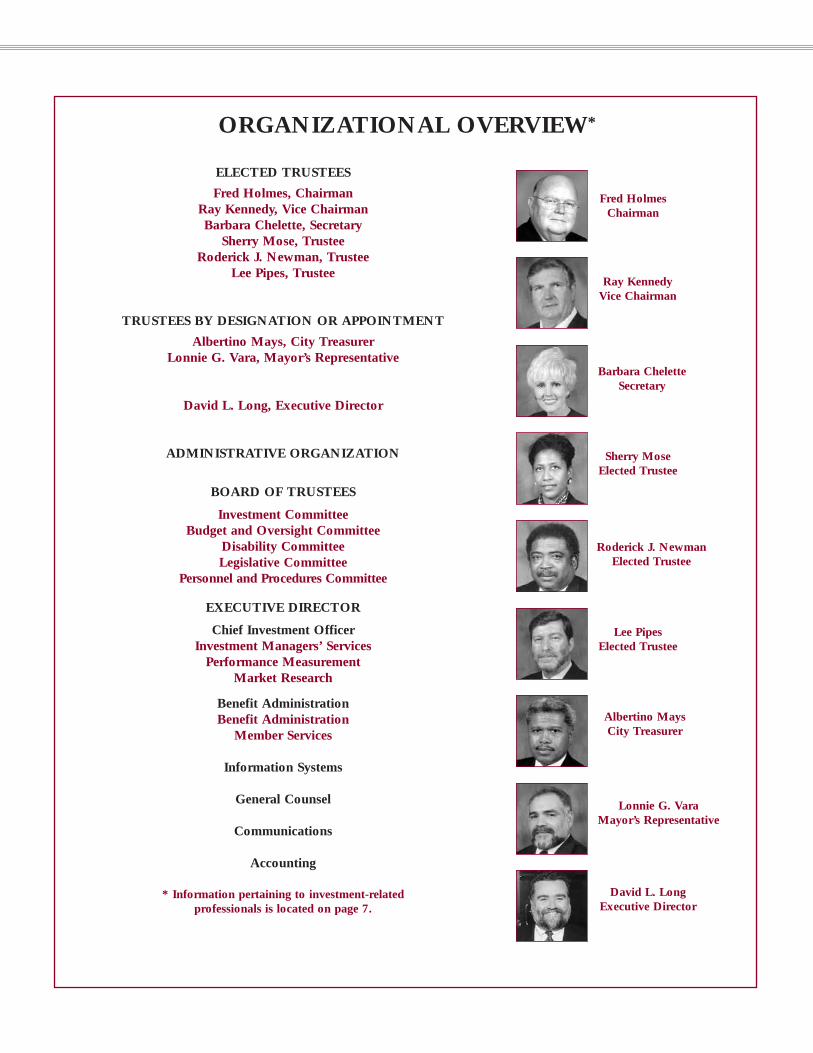
Fred HolmesChairman
Ray KennedyVice Chairman
Roderick J. NewmanElected Trustee
Barbara CheletteSecretary
Sherry MoseElected Trustee
Lee PipesElected Trustee
Lonnie G. VaraMayor’s Representative
ELECTED TRUSTEES
Fred Holmes, ChairmanRay Kennedy, Vice ChairmanBarbara Chelette, Secretary
Sherry Mose, TrusteeRoderick J. Newman, Trustee
Lee Pipes, Trustee
TRUSTEES BY DESIGNATION OR APPOINTMENT
Albertino Mays, City TreasurerLonnie G. Vara, Mayor’s Representative
David L. Long, Executive Director
ADMINISTRATIVE ORGANIZATION
BOARD OF TRUSTEES
Investment CommitteeBudget and Oversight Committee
Disability CommitteeLegislative Committee
Personnel and Procedures Committee
EXECUTIVE DIRECTOR
Chief Investment OfficerInvestment Managers’ Services
Performance MeasurementMarket Research
Benefit AdministrationBenefit Administration
Member Services
Information Systems
General Counsel
Communications
Accounting
* Information pertaining to investment-related professionals is located on page 7.
Albertino MaysCity Treasurer
David L. LongExecutive Director
ORGANIZATIONAL OVERVIEW*

INTRODUCTORY SECTION
LETTER OF TRANSMITTAL
GFOA CERTIFICATE OF ACHIEVEMENT
PROFESSIONAL CONSULTANTS AND INVESTMENT MANAGERS

December 1, 2003
Albertino Mays, TreasurerCity of Houston, TexasP.O. Box 1562Houston, Texas 77251-1562
Dear Mr. Mays:
The Comprehensive Annual Financial Report (CAFR) of the Houston MunicipalEmployees Pension System (the System), a Component Unit of the City of Houston,Texas (the City) for the fiscal year ended June 30, 2003 (2003), is submitted herewith.The accuracy and completeness of this report are the responsibility of the Board ofTrustees of the System. The information provided pertains to the records and accountsof the System and its operation.
The CAFR consists of five sections: (i) the introductory section, which contains thistransmittal letter and other general information about the structure and activities of theSystem; (ii) the financial section, which contains the independent auditors’ report andthe basic financial statements, including notes to the financial statements and supple-mental schedules; (iii) the investment section, which includes reports on the investmentobjectives and activities of the System during 2003; (iv) the actuarial section, which con-tains information about the actuarial evaluation of the System as of July 1, 2002, thefunding objectives of the System and the progress being made toward achieving thoseobjectives; and (v) the statistical section, which contains statistical and other significantdata intended to provide a user of this CAFR additional information about the System.
The System was created in 1943 under Chapter 358, Acts of the 48th TexasLegislature, Regular Session, Article 6243g, Vernon’s Annotated Revised Texas CivilStatutes, and reenacted and continued under HB1573, 77th Texas Legislature, as Art.6243h, Vernon’s Annotated Revised Texas Civil Statutes (the Statute). The System is amulti-employer defined benefit pension plan and includes contributory groups (GroupA and Group C) and a noncontributory group (Group B). The System provides serv-ice retirement, disability retirement and death benefits for eligible participants includ-ing the employees of the System and the officers and employees, except police officersand fire fighters, of municipalities in the State of Texas having population of more than1,500,000. System plan net assets are used to pay benefits for eligible participants ofGroup A, Group B and Group C. HMEPS is administered by a nine-member Board ofTrustees. The Trustees include the Mayor of the City or his designated representative,the City Treasurer, four elected trustees who are active members of HMEPS, two elect-ed trustees who are retirees of HMEPS, and one trustee who is appointed by the elect-ed trustees.
Significant Changes During the YearThere were no significant changes in the System or its operation that affected the yearincluded in this CAFR.
General Economic Conditions After experiencing one of the most significant and prolonged capital markets contrac-tions in post-Depression history, the U.S. economy showed signs of improvement in thelast year as the recovery started to gain sustainable momentum from a combination ofmassive fiscal, monetary and stimulative tax policy. Hampering the traditional strongrecoveries from recession were a number of factors including a reluctance by business-
2
HOUSTONMUNICIPALEMPLOYEES
PENSION SYSTEM
Board of Trustees
Elected Trustees
Fred Holmes, Chairman
Ray Kennedy, Vice Chairman
Roderick J. Newman, Secretary
Louis C. McKinney, Trustee
Sherry Mose, Trustee
Lee Pipes, Trustee
Barbara Chelette, AppointedTrustee
Trustees by Designation
Philip B. Scheps,Treasurer
Lonnie G.Vara, Mayor’sRepresentative
David L. Long,Executive Director
1111 BAGBYSUITE 2450
HOUSTON,TEXAS 77002-2555
(713) 759-9275FAX (713) 650-1961
LETTER OF TRANSMITTAL
es to hire new employees and hesitancy by corpora-tions to increase capital expenditures resulting fromextremely low capacity utilization. Other factorsincluded technological productivity improvementsand synchronized slow worldwide economic growth.
According to the Federal Reserve, householddemand has been the major source of real GDPgrowth since the end of the recession in November2001. It was driven by a record high of $1.16 tril-lion of mortgage refinancings this year precipitatedby the decline in mortgage rates to their lowest levelsin more than three decades. While this demand hashelped push the economy along, a lack of job growthwill no doubt weigh heavily on future growth.Manufacturing sectors, especially, accounted for 90percent of the eliminated jobs between February2001 and July 2003 (according to the FederalDeposit Insurance Corporation), as manufacturingjobs migrated to nations with substantially lowerproduction costs.
Monetary policy, also mentioned in last year’s reportas a positive influence, has helped consumer spend-ing through the post-recession period. The GrowthTax Relief Reconciliation Act will help to stimulategrowth into mid-2004. Lower short-term and mort-gage interest rates have also been the result of soundmonetary policy to stimulate an economic recovery.
Corporate profits have improved dramatically inmany sectors as the fiscal year progressed. Thebanking industry and residential housing industriesappear to be thriving, while outlays on commercialbuildings have continued to fall. The technology sec-tor is showing signs of significant improvement asbusinesses which were in the past reluctant to pur-chase new software and equipment are now planningon upgrading.
Overall, the US economy is beginning to show strongsigns of turning the corner and returning to nor-malcy. There will be, however, “growing pains”along the way. Optimism should replace pes-simism in the year ahead.
Investment ActivitiesAs discussed in more detail in theInvestment Section of the CAFR, investmentstrategies have been implemented by theSystem that are long-term in perspective anddesigned to meet the expectations of workingwithin predefined ranges among asset classes to
produce returns, over market cycles, that exceed theinvestment return assumption adopted by the Systemfor actuarial purposes. Diversification, professionalmanagement within stated guidelines, and periodicrebalancing from asset classes to capture gains andreduce risks associated with market movements, aremethods that have been adopted by the Board ofTrustees to safeguard against loss due to unantici-pated market declines. Returns from investing activ-ities for the year ended June 30, 2003 amounted to3.55% (see page 34 for more information).Annualized time weighted returns for the five fiscalyears and 10 fiscal years ended June 30, 2003 were3.27% and 7.82%, respectively.
The most recent five years have been an exceptionalperiod of volatility. The markets experienced a sig-nificant bubble in the late 1990’s and a collapse ofthe bubble from 2000 to 2002 in which the equitymarkets lost $9 trillion of wealth. This period ofextreme volatility provided the most significantstress test of the System’s resolve to prudently diver-sify between several major asset classes and to con-sistently rebalance where appropriate actions couldbe taken to enhance returns and reduce overall port-folio risk. The System recorded investment gains of$102 million and $255 million in fiscal years 1999and 2000, respectively, but recorded losses of $72million and $100 million in fiscal years 2001 and2002, respectively. The System began to rebound infiscal year 2003, gaining $41 million and is up over$100 million thus far in fiscal year 2004.
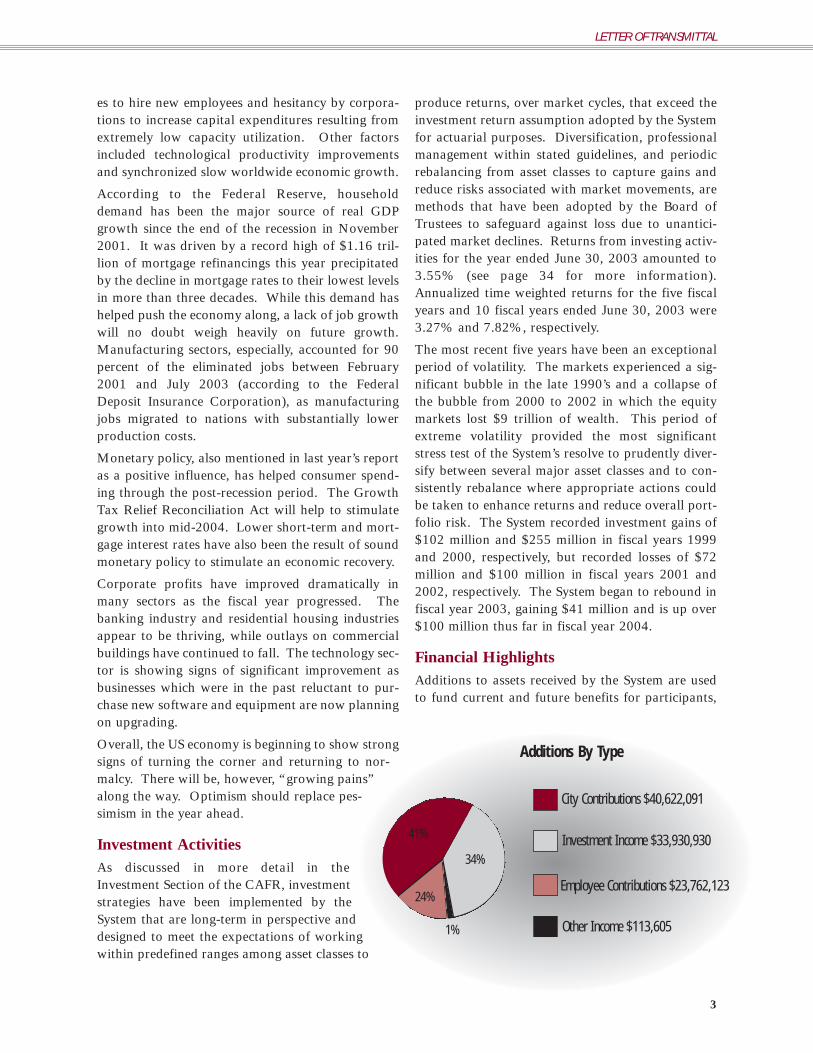
Financial HighlightsAdditions to assets received by the System are usedto fund current and future benefits for participants,
3
Employee Contributions $23,762,123
Additions By Type
Investment Income $33,930,930
City Contributions $40,622,091
LETTER OF TRANSMITTAL
Other Income $113,605
34%
41%
24%
1%
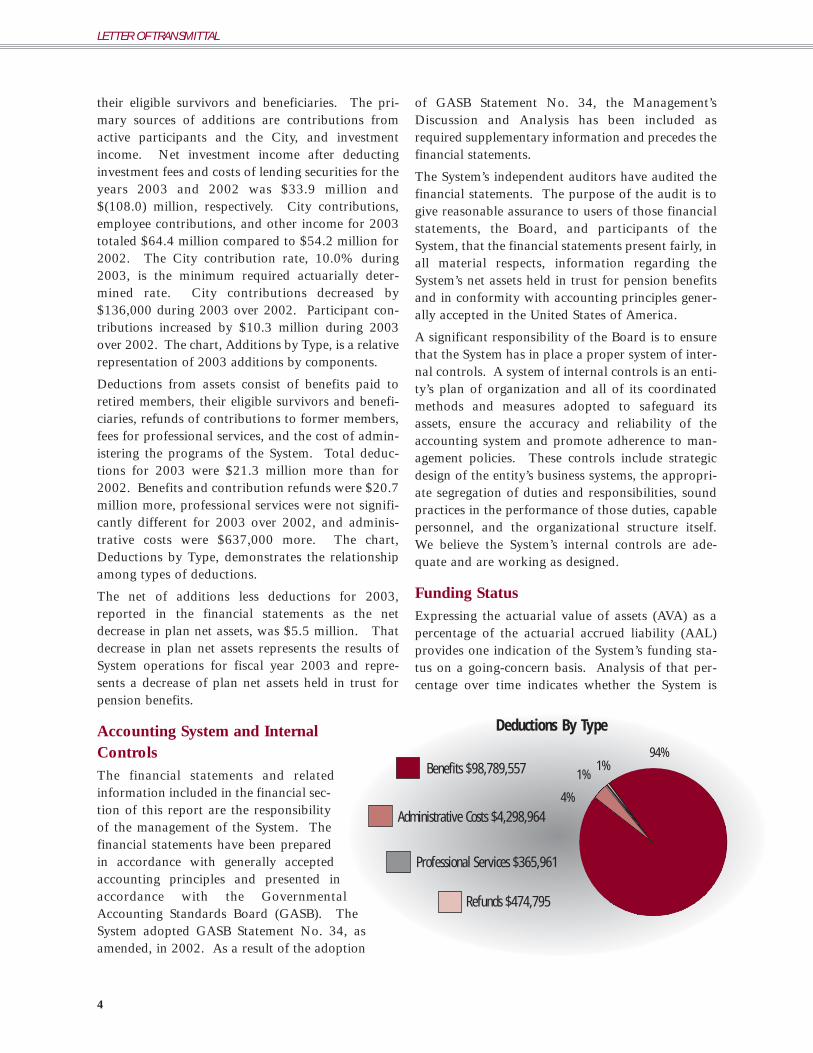
their eligible survivors and beneficiaries. The pri-mary sources of additions are contributions fromactive participants and the City, and investmentincome. Net investment income after deductinginvestment fees and costs of lending securities for theyears 2003 and 2002 was $33.9 million and$(108.0) million, respectively. City contributions,employee contributions, and other income for 2003totaled $64.4 million compared to $54.2 million for2002. The City contribution rate, 10.0% during2003, is the minimum required actuarially deter-mined rate. City contributions decreased by$136,000 during 2003 over 2002. Participant con-tributions increased by $10.3 million during 2003over 2002. The chart, Additions by Type, is a relativerepresentation of 2003 additions by components.
Deductions from assets consist of benefits paid toretired members, their eligible survivors and benefi-ciaries, refunds of contributions to former members,fees for professional services, and the cost of admin-istering the programs of the System. Total deduc-tions for 2003 were $21.3 million more than for2002. Benefits and contribution refunds were $20.7million more, professional services were not signifi-cantly different for 2003 over 2002, and adminis-trative costs were $637,000 more. The chart,Deductions by Type, demonstrates the relationshipamong types of deductions.
The net of additions less deductions for 2003,reported in the financial statements as the netdecrease in plan net assets, was $5.5 million. Thatdecrease in plan net assets represents the results ofSystem operations for fiscal year 2003 and repre-sents a decrease of plan net assets held in trust forpension benefits.
Accounting System and InternalControlsThe financial statements and relatedinformation included in the financial sec-tion of this report are the responsibilityof the management of the System. Thefinancial statements have been preparedin accordance with generally acceptedaccounting principles and presented inaccordance with the GovernmentalAccounting Standards Board (GASB). TheSystem adopted GASB Statement No. 34, asamended, in 2002. As a result of the adoption
of GASB Statement No. 34, the Management’sDiscussion and Analysis has been included asrequired supplementary information and precedes thefinancial statements.
The System’s independent auditors have audited thefinancial statements. The purpose of the audit is togive reasonable assurance to users of those financialstatements, the Board, and participants of theSystem, that the financial statements present fairly, inall material respects, information regarding theSystem’s net assets held in trust for pension benefitsand in conformity with accounting principles gener-ally accepted in the United States of America.
A significant responsibility of the Board is to ensurethat the System has in place a proper system of inter-nal controls. A system of internal controls is an enti-ty’s plan of organization and all of its coordinatedmethods and measures adopted to safeguard itsassets, ensure the accuracy and reliability of theaccounting system and promote adherence to man-agement policies. These controls include strategicdesign of the entity’s business systems, the appropri-ate segregation of duties and responsibilities, soundpractices in the performance of those duties, capablepersonnel, and the organizational structure itself.We believe the System’s internal controls are ade-quate and are working as designed.
Funding StatusExpressing the actuarial value of assets (AVA) as apercentage of the actuarial accrued liability (AAL)provides one indication of the System’s funding sta-tus on a going-concern basis. Analysis of that per-centage over time indicates whether the System is
4
Refunds $474,795
Deductions By Type
Professional Services $365,961
94%
4%
1%Benefits $98,789,557
Administrative Costs $4,298,964
1%
LETTER OF TRANSMITTAL
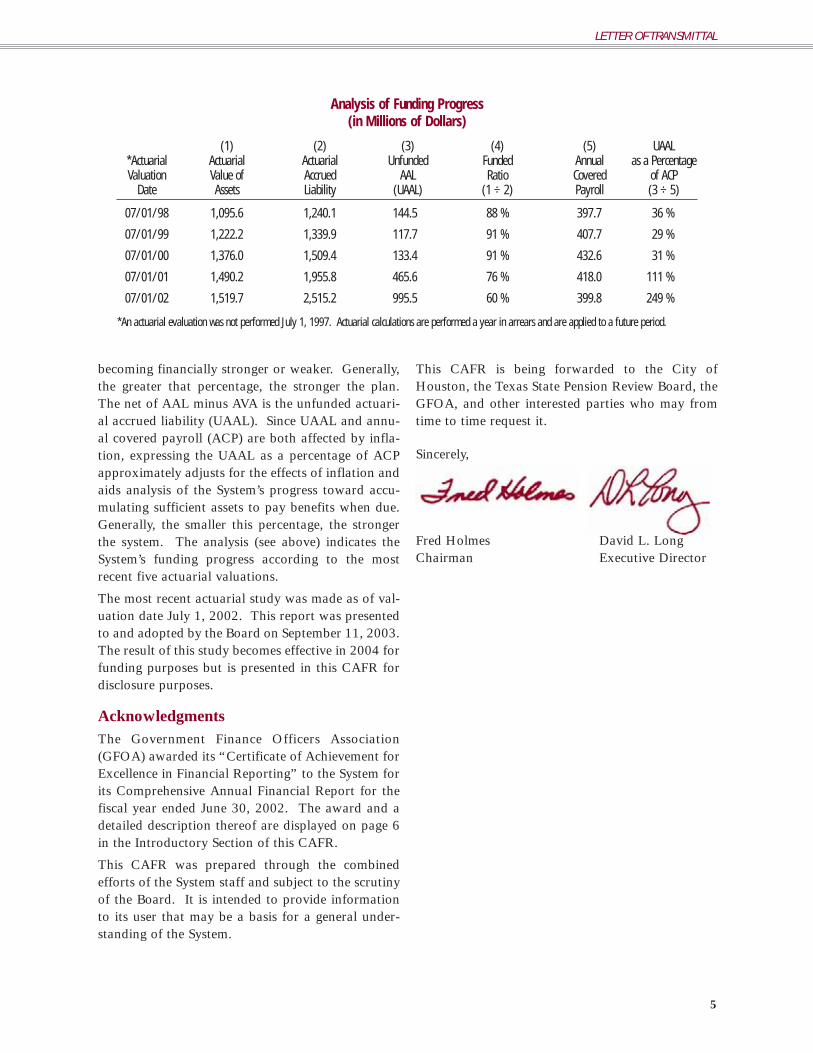
becoming financially stronger or weaker. Generally,the greater that percentage, the stronger the plan.The net of AAL minus AVA is the unfunded actuari-al accrued liability (UAAL). Since UAAL and annu-al covered payroll (ACP) are both affected by infla-tion, expressing the UAAL as a percentage of ACPapproximately adjusts for the effects of inflation andaids analysis of the System’s progress toward accu-mulating sufficient assets to pay benefits when due.Generally, the smaller this percentage, the strongerthe system. The analysis (see above) indicates theSystem’s funding progress according to the mostrecent five actuarial valuations.
The most recent actuarial study was made as of val-uation date July 1, 2002. This report was presentedto and adopted by the Board on September 11, 2003.The result of this study becomes effective in 2004 forfunding purposes but is presented in this CAFR fordisclosure purposes.
AcknowledgmentsThe Government Finance Officers Association(GFOA) awarded its “Certificate of Achievement forExcellence in Financial Reporting” to the System forits Comprehensive Annual Financial Report for thefiscal year ended June 30, 2002. The award and adetailed description thereof are displayed on page 6in the Introductory Section of this CAFR.
This CAFR was prepared through the combinedefforts of the System staff and subject to the scrutinyof the Board. It is intended to provide informationto its user that may be a basis for a general under-standing of the System.
This CAFR is being forwarded to the City ofHouston, the Texas State Pension Review Board, theGFOA, and other interested parties who may fromtime to time request it.
Sincerely,
Fred Holmes David L. LongChairman Executive Director
Analysis of Funding Progress(in Millions of Dollars)
(1) (2) (3) (4) (5) UAAL*Actuarial Actuarial Actuarial Unfunded Funded Annual as a PercentageValuation Value of Accrued AAL Ratio Covered of ACP
Date Assets Liability (UAAL) (1 ÷ 2) Payroll (3 ÷ 5)
07/01/98 1,095.6 1,240.1 144.5 88 % 397.7 36 %
07/01/99 1,222.2 1,339.9 117.7 91 % 407.7 29 %
07/01/00 1,376.0 1,509.4 133.4 91 % 432.6 31 %
07/01/01 1,490.2 1,955.8 465.6 76 % 418.0 111 %
07/01/02 1,519.7 2,515.2 995.5 60 % 399.8 249 %
*An actuarial evaluation was not performed July 1, 1997. Actuarial calculations are performed a year in arrears and are applied to a future period.
5
LETTER OF TRANSMITTAL
The Government Finance Officers Association of the United States and Canada (GFOA) awarded a“Certificate of Achievement for Excellence in Financial Reporting” to Houston Municipal EmployeesPension System for its comprehensive annual financial report for the fiscal year ended June 30, 2002. TheCertificate of Achievement is a prestigious national award recognizing conformance with the highest stan-dards for preparation of state and local government financial reports.
In order to be awarded a Certificate of Achievement, a government unit must publish an easily readableand efficiently organized comprehensive annual financial report, the contents of which conform to programstandards. Such CAFR must satisfy both generally accepted accounting principles and applicable legalrequirements.
A Certificate of Achievement is valid for a period of one year only. Houston Municipal Employees PensionSystem has received a Certificate of Achievement for the last 9 consecutive years (fiscal years ended June 30,1994 through 2002). We believe our current report continues to conform to the Certificate of Achievementprogram requirements, and we are submitting it to the GFOA for consideration.
6
GFOA CERTIFICATE OF ACHIEVEMENT

ConsultantsAuditorMir, Fox & Rodriguez, P.C., Certified Public
Accountants
Board Medical AdvisorCharles Schuhmacher, M.D.
Investment ConsultantsWilshire Associates, Inc.Pension Consulting Alliance
Investment Performance AnalysisWilshire Associates, Inc.
Legal CounselBaker Botts, L.L.P.Cohen, Milstein, Hausfeld & Toll, P.L.L.C.Lawson, Fields, McCue, Lee & Campbell, P.C.Locke, Liddell & Sapp, L.L.P.
Master Custodian/TrusteeState Street Bank and Trust Co.
ActuaryTowers Perrin
Investment ManagersDomestic Equities
Barclays Global Investors, N.A.Brown Capital ManagementDePrince, Race & Zollo, Inc.Legg Mason Capital ManagementNeumeier Investment CounselPacific Investment Management Co.Putnam Investments
International EquitiesAxiom InternationalBrandes InternationalOechsle InternationalTT International
Fixed IncomeBarclays Global Investors, N.A.GoldenTree Asset Management, L.P.Loomis, Sayles & Co.MDL Capital ManagementSmith Graham & Co.Western Asset Management
Real AssetsAlliance Bernstein Institutional Investment
ManagementCB Richard Ellis InvestorsCDK Realty AdvisorsCrow HoldingsGoldman, Sachs & Co.Heitman Capital ManagementL&B Realty Advisors, Inc.Lone Star U.S. Acquisitions, L.L.C.Morgan Stanley Asset Management, Inc.Olympus Real Estate Corp.Prudential InvestmentsRII World Timber FundSoros Private Funds Management, L.L.C.State Street Research & Management Co.
Alternative InvestmentsAdams Street PartnersBarclays Global Investors, N.A.Brera Capital Partners, L.L.C.Brockway Moran & Partners, Inc.Goldman, Sachs & Co.HarbourVest Partners, L.L.C.J.W. Childs Associates, L.P.Kopp Investment AdvisorsMatlin Patterson Global AdvisorsOaktree Capital ManagementPacven Walden Management Co., LTD.Pegasus Investors, L.P.Pharos Capital Partners, L.L.C.The Jordan CompanyTriad Ventures, LTD.TSG Capital Group, L.L.C.
7
PROFESSIONAL CONSULTANTS AND INVESTMENT MANAGERS

The Birth of a Thriving City, From a Humble Bayou
In the summer of 1836, shortly after the Battle of San Jacinto, the Allenbrothers offered Mrs. Elizabeth Parrott $5,000 for half a league of the JohnAustin stake along Buffalo Bayou. The widow of John Austin, who wasone of the “Old Three Hundred” colonists accompanying Stephen F.Austin, Mrs. Parrott readily accepted. Thus, on August 30, 1836, theAllens purchased some 6,000 acres of land on the southern bank of the tree-lined, murky Buffalo Bayou, naming the site “Houston, in honor of theman who had become the hero of the new republic.”

FINANCIAL SECTION
INTRODUCTION TO FINANCIAL STATEMENTS
INDEPENDENT AUDITORS’ REPORT
STATEMENTS OF PLAN NET ASSETS JUNE 30, 2003 AND 2002
STATEMENTS OF CHANGES IN PLAN NET ASSETS YEARS ENDED JUNE 30, 2003 AND 2002
NOTES TO FINANCIAL STATEMENTS JUNE 30, 2003 AND 2002
SUPPLEMENTAL INFORMATION
The Audited Financial Statements and the accompa-nying Independent Auditors’ Report included in thisCAFR were approved by the System’s Board ofTrustees (the Board) in its meeting of September 25,2003.
The audit of the System’s financial statements wasconducted in accordance with generally acceptedauditing standards (GAAS). The IndependentAuditors’ Report is based on that audit, and it isintended to give reasonable assurance to users of theSystem’s financial statements that those financialstatements are free of material misstatement whentaken as a whole and that they present fairly thefinancial position and results of operations of theSystem at the times and for the periods reported.The audit gives reasonable assurance to the Boardand members of the System that the System’s assetsare adequately safeguarded and that its financialtransactions are properly authorized and recorded.
The financial statements provide a comprehensiveoverview of the financial position of the System asof June 30, 2003 and June 30, 2002 and the resultsof its operation for the years then ended. The finan-cial statements are presented in conformity withaccounting and reporting standards of theGovernmental Accounting Standards Board(GASB).
The System is responsible for the accuracy of itsfinancial statements and the completeness and fair-ness of their presentation. The auditors are responsi-ble for issuing an opinion on those financial state-ments when taken as a whole.
The financial statements consist of Statements ofPlan Net Assets, Statements of Changes in Plan Net
Assets Held in Trust for Pension Benefits, Notes tothe Financial Statements, and SupplementalSchedules.
The Statements of Plan Net Assets present the finan-cial position of the System as of the end of the fiscalyears reported. They are statements of the System’sassets, liabilities, and net assets held in trust for pen-sion benefits.
The Statements of Changes in Plan Net Assets Heldin Trust for Pension Benefits include additions to theSystem’s assets and deductions from them and theincrease or decrease in plan net assets. Additionsconsist of contributions, investment income, andother income. Deductions are benefit payments,fees for professional services and costs of adminis-tering the programs of the System. The net of addi-tions and deductions represents the change, for theyears presented, in net assets held in trust for pensionbenefits.
Notes to the financial statements contain disclo-sures required by generally accepted accountingprinciples and GASB reporting standards.Required disclosures include a summary descrip-tion of the pension plan, significant accountingpolicies, information about the System’s fundingstatus and progress toward achieving its fundingobjectives, information about the System’s invest-ments and investing activities, and informationabout the System’s commitments.
Supplemental Schedules provide informationrequired by GASB and additional detailed analysesof certain amounts summarized in the financialstatements.
10
INTRODUCTION TO FINANCIAL STATEMENTS

Member of the American Institute of Certified Public Accountants
INDEPENDENT AUDITORS’ REPORT
Board of TrusteesHouston Municipal Employees Pension System:
We have audited the accompanying statements of plan net assets of the Houston Municipal Employees PensionSystem (the System) as of June 30, 2003 and 2002, and the related statements of changes in plan net assets forthe years then ended. These basic financial statements and the schedules referred to below are the responsi-bility of the System’s management. Our responsibility is to express an opinion on these basic financial state-ments based on our audits.
We conducted our audits in accordance with auditing standards generally accepted in the United States ofAmerica. Those standards require that we plan and perform the audit to obtain reasonable assurance aboutwhether the basic financial statements are free of material misstatement. An audit includes examining, on atest basis, evidence supporting the amounts and disclosures in the basic financial statements. An audit alsoincludes assessing the accounting principles used and significant estimates made by management, as well asevaluating the overall basic financial statement presentation. We believe that our audits provide a reason-able basis for our opinion.
In our opinion, the basic financial statements referred to above present fairly, in all material respects, infor-mation regarding the System’s net assets held in trust for pension benefits as of June 30, 2003 and 2002, andchanges therein for the years then ended, in conformity with accounting principles generally accepted in theUnited States of America.
Management’s discussion and analysis (MD&A) and the required supplemental information (schedules 1 and2) are not a required part of the basic financial statements but is supplementary information required by theGovernmental Accounting Standards Board (GASB). We have applied certain limited procedures, which con-sisted principally of inquiries of management regarding the methods of measurement and presentation of theMD&A and required supplemental information. However, we did not audit such information and do notexpress an opinion on it.
Our audit was made for the purpose of forming an opinion on the basic financial statements taken as a whole.The additional supplemental information (schedules 3, 4, and 5) are presented for the purpose of additionalanalysis and are not a required part of the System’s basic financial statements. This information has been sub-jected to the auditing procedures applied in our audit of the basic financial statements and, in our opinion, isfairly stated in all material respects in relation to the basic financial statements taken as a whole.
September 19, 2003
One Riverway, Suite 1900Houston,TX 77056Off. (713) 622-1120Fax (713) 961-0625
Mir • Fox
Rodriguez, P.C.Certified Public Accountants
&
11
INDEPENDENT AUDITORS’ REPORT
The Board of Trustees (the Board) of the HoustonMunicipal Employees Pension System (System) ispleased to provide this overview and analysis of thefinancial performance and activities of the Systemfor the fiscal year ended June 30, 2003. Weencourage the readers to consider the informationpresented here in conjunction with the basic finan-cial statements.
OVERVIEW OF THE FINANCIAL STATEMENTSThe discussion and analysis is intended to serve as anintroduction to the System’s financial statements.The financial section consists of (1) System’s BasicFinancial Statements, (2) Notes to Basic FinancialStatements, and (3) Supplemental Information.
System’s Basic Financial StatementsThere are two basic financial statements presentedherewith. The Statements of Plan Net Assets as ofJune 30, 2003 and 2002 indicate the net assets avail-able to pay future payments and gives a snapshot ata particular point in time. The Statements ofChanges in Plan Net Assets for the fiscal years ended June 30, 2003 and 2002 provide a view of the fiscalyear’s additions and deductions to the System.
Notes to Financial StatementsThe notes are an integral part of the basic financialstatements and provide additional background infor-mation that is essential for a complete understandingof the data provided in the System’s financial state-ments. The notes to the basic financial statementscan be found on pages 18 to 25 of this report.
Supplemental InformationThe required supplemental information consists of:
Schedule 1 – Schedule of Funding Progress - this pro-vides historical trend information that contributes tothe understanding of the changes in the funded sta-tus of the System over time. These are calculationsmade by the System’s actuary and they provide actu-arial information that contributes to the understand-ing of the changes in the actuarial funding of and thefunded status of the System over a number of years.It should be noted though that actuarial informationis based upon assumptions about future events, andtherefore, the figures presented are estimates.
Schedule 2 – Schedule of Employer Contributions - thisprovides historical trend information of required
employer contributions and the contributions actuallymade in relation to this requirement over time.
The additional supplemental information consists of:
Schedule 3 – Investment Summary - this lists theSystem’s investments by type presented both at costand fair market value.
Schedule 4 – Investment Services, ProfessionalServices, and Administration Expenses - this pro-vides more information for purposes of moredetailed analysis.
Schedule 5 – Summary of Costs of Investment andProfessional Services - this provides more informa-tion for purposes of more detailed analysis.
Comparative Financial StatementsOn the following page is a condensed and compara-tive summary of major classes of Plan Net Assets atfair value.
FINANCIAL HIGHLIGHTS (In Thousands ofDollars, Unless Otherwise Noted)
• The System received $23,762 and $13,476 dur-ing fiscal year 2003 and 2002, respectively, inemployee contributions from over 12,000 par-ticipants. During fiscal year 2003 and 2002, theSystem received $40,622 and $40,758, respec-tively, in employer contributions from the Cityof Houston (the City). The City’s contributionrepresents a contribution rate of 10%.
• Employee contributions increased by $10,286(or 76%) in fiscal year 2003 compared to fiscalyear 2002. Of this increase, $5,932 (or 58%)came from the participants’ direct rollovers fromtheir Section 457 deferred compensation plan.Employee contributions increased by $4,944 or58% in fiscal year 2002 compared to fiscal year2001, primarily due to an increased number ofparticipants in Group A (contributory group).
• The net investment income of the System was$33,930 during the fiscal year 2003 compared toa loss of $108,023 during the fiscal year 2002,which is an increase of $141,953. This increaseis a reflection of improved market conditionsduring fiscal year 2003. During fiscal year 2002,the net investment loss of the System increased66% from fiscal year 2001 as a result of adversemarket conditions.
• Benefit payments grew by 26% or $20,471 dur-ing the fiscal year 2003 compared to $78,318
12
MANAGEMENT’S DISCUSSION AND ANALYSIS
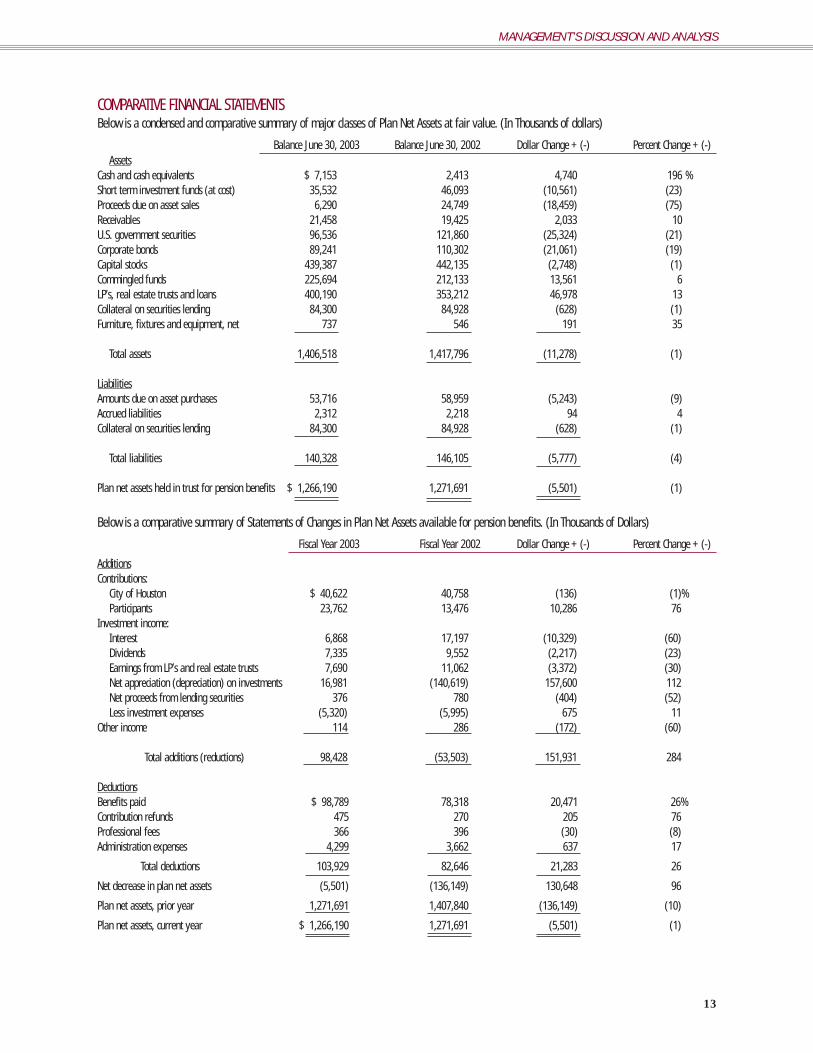
COMPARATIVE FINANCIAL STATEMENTSBelow is a condensed and comparative summary of major classes of Plan Net Assets at fair value. (In Thousands of dollars)
Balance June 30, 2003 Balance June 30, 2002 Dollar Change + (-) Percent Change + (-) Assets
Cash and cash equivalents $ 7,153 2,413 4,740 196 %Short term investment funds (at cost) 35,532 46,093 (10,561) (23)Proceeds due on asset sales 6,290 24,749 (18,459) (75)Receivables 21,458 19,425 2,033 10U.S. government securities 96,536 121,860 (25,324) (21)Corporate bonds 89,241 110,302 (21,061) (19)Capital stocks 439,387 442,135 (2,748) (1)Commingled funds 225,694 212,133 13,561 6LP’s, real estate trusts and loans 400,190 353,212 46,978 13Collateral on securities lending 84,300 84,928 (628) (1)Furniture, fixtures and equipment, net 737 546 191 35
Total assets 1,406,518 1,417,796 (11,278) (1)
LiabilitiesAmounts due on asset purchases 53,716 58,959 (5,243) (9)Accrued liabilities 2,312 2,218 94 4Collateral on securities lending 84,300 84,928 (628) (1)
Total liabilities 140,328 146,105 (5,777) (4)
Plan net assets held in trust for pension benefits $ 1,266,190 1,271,691 (5,501) (1)
Below is a comparative summary of Statements of Changes in Plan Net Assets available for pension benefits. (In Thousands of Dollars)
Fiscal Year 2003 Fiscal Year 2002 Dollar Change + (-) Percent Change + (-)
AdditionsContributions:
City of Houston $ 40,622 40,758 (136) (1)%Participants 23,762 13,476 10,286 76
Investment income:Interest 6,868 17,197 (10,329) (60)Dividends 7,335 9,552 (2,217) (23)Earnings from LP’s and real estate trusts 7,690 11,062 (3,372) (30)Net appreciation (depreciation) on investments 16,981 (140,619) 157,600 112Net proceeds from lending securities 376 780 (404) (52)Less investment expenses (5,320) (5,995) 675 11
Other income 114 286 (172) (60)
Total additions (reductions) 98,428 (53,503) 151,931 284
DeductionsBenefits paid $ 98,789 78,318 20,471 26%Contribution refunds 475 270 205 76Professional fees 366 396 (30) (8)Administration expenses 4,299 3,662 637 17
Total deductions 103,929 82,646 21,283 26
Net decrease in plan net assets (5,501) (136,149) 130,648 96
Plan net assets, prior year 1,271,691 1,407,840 (136,149) (10)
Plan net assets, current year $ 1,266,190 1,271,691 (5,501) (1)
13
MANAGEMENT’S DISCUSSION AND ANALYSIS
during the fiscal year 2002. Service retirementpension benefits amounted to $64,656 (22%increase from fiscal year 2002) which accountedfor 65% of the total benefit payments for fiscalyear 2003. There are 6,309 participants receiv-ing benefits for the fiscal year ended 2003 com-pared to 5,928 participants in 2002. Thesenumbers represent an increase of 6% and 10%for the fiscal years 2003 and 2002, respectively.Fiscal year 2002 benefit payments grew by 34%from fiscal year 2001.
• Benefit payments exceeded total employee plusemployer contributions by $34,405 during fiscalyear 2003 and by $24,084 during fiscal year2002.
• Costs of administering the benefit programs ofthe System were $4,299 and $3,662 for fiscalyear 2003 and 2002, respectively, for almost20,000 participants.
• Net assets decreased by $5,501 during fiscal year2003 compared to a decrease of $136,149 in2002. This is a 96% improvement, primarily dueto a slight recovery in the world capital market.
The System capitalizes expenditures for furniture,fixtures and equipment in accordance withGovernmental Accounting Standards Board
Statement No. 34, Basic Financial Statements - andManagement’s Discussion and Analysis - for Stateand Local Governments, as amended. Furniture, fix-tures and equipment, net of accumulated deprecia-tion, as of fiscal year end 2003 and 2002 is $737 and$546, respectively.
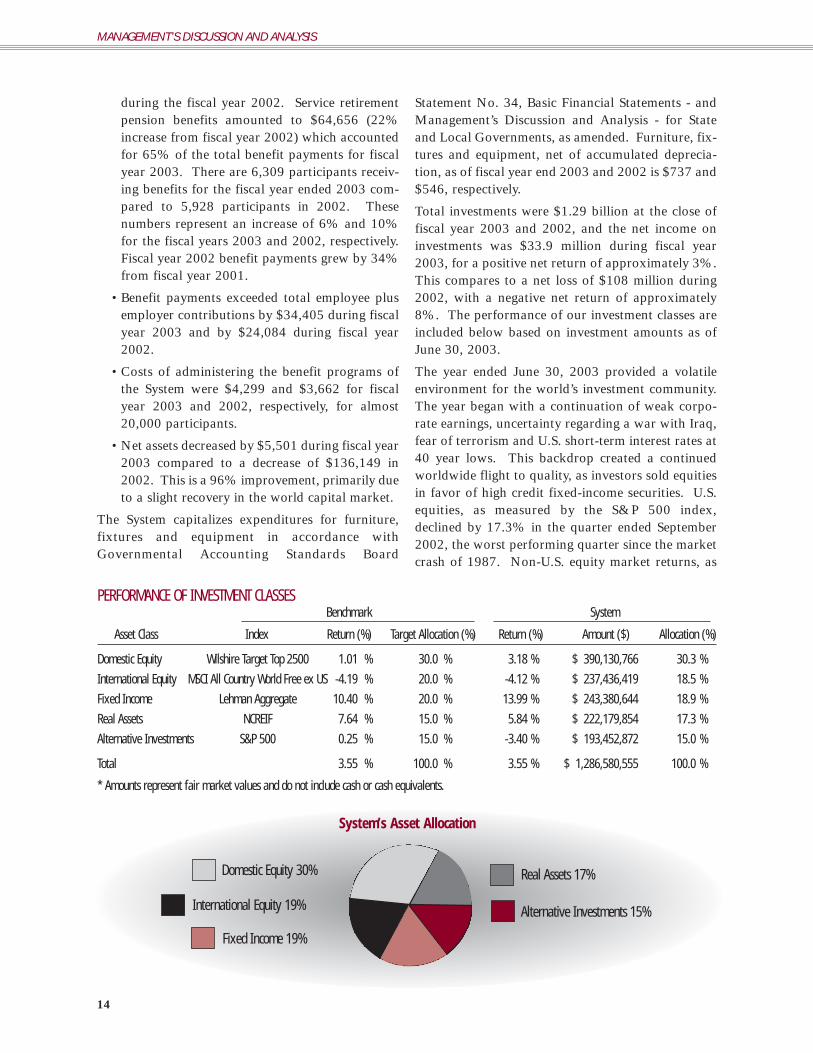
Total investments were $1.29 billion at the close offiscal year 2003 and 2002, and the net income oninvestments was $33.9 million during fiscal year2003, for a positive net return of approximately 3%.This compares to a net loss of $108 million during2002, with a negative net return of approximately8%. The performance of our investment classes areincluded below based on investment amounts as ofJune 30, 2003.
The year ended June 30, 2003 provided a volatileenvironment for the world’s investment community.The year began with a continuation of weak corpo-rate earnings, uncertainty regarding a war with Iraq,fear of terrorism and U.S. short-term interest rates at40 year lows. This backdrop created a continuedworldwide flight to quality, as investors sold equitiesin favor of high credit fixed-income securities. U.S.equities, as measured by the S&P 500 index,declined by 17.3% in the quarter ended September2002, the worst performing quarter since the marketcrash of 1987. Non-U.S. equity market returns, as
PERFORMANCE OF INVESTMENT CLASSESBenchmark System
Asset Class Index Return (%) Target Allocation (%) Return (%) Amount ($) Allocation (%)
Domestic Equity Wilshire Target Top 2500 1.01 % 30.0 % 3.18 % $ 390,130,766 30.3 %
International Equity MSCI All Country World Free ex US -4.19 % 20.0 % -4.12 % $ 237,436,419 18.5 %
Fixed Income Lehman Aggregate 10.40 % 20.0 % 13.99 % $ 243,380,644 18.9 %
Real Assets NCREIF 7.64 % 15.0 % 5.84 % $ 222,179,854 17.3 %
Alternative Investments S&P 500 0.25 % 15.0 % -3.40 % $ 193,452,872 15.0 %
Total 3.55 % 100.0 % 3.55 % $ 1,286,580,555 100.0 %
* Amounts represent fair market values and do not include cash or cash equivalents.
14
MANAGEMENT’S DISCUSSION AND ANALYSIS
Domestic Equity 30%
System’s Asset Allocation
Fixed Income 19%
Alternative Investments 15%
Real Assets 17%
International Equity 19%
measured by the MSCI All Country World Free ex-U.S. index, were even worse, with a decline of19.4%. Aggregate U.S. bonds, as measured by theLehman Aggregate index, returned 4.6%.
World equity markets began to rebound in October2002, due in part to improved corporate earnings,strength in retail sales, and an increase in investorconfidence. Equity markets strengthened further inMarch 2003, when U.S. led attacks on Iraq were ini-tiated and world energy prices declined, and again inJune 2003, when the Federal Reserve lowered theFed Funds target rate to 1.0%, its lowest rate in 45years. In addition, the second tax cut bill in twoyears lowered personal income tax rates and loweredcapital gains taxes to 15%. These changes produceda surge in investor confidence pushing the S&P 500index up 15.4% for the quarter ended June 30,2003, its best quarterly gain in nearly 5 years.
Fixed-income and real estate assets provided the onlysafe haven for the past one and three-year periods.The fixed-income market, as measured by theLehman Aggregate index, rose 10.4% and 10.1%during these periods, while real estate, as measuredby the NCREIF index, climbed 7.6% and 8.2%,respectively.
Throughout fiscal year 2003, the System maintainedits existing asset allocation mix of 30% domesticequities, 19% international equities, 19% fixedincome, 17% real assets and 15% alternative invest-ments. However, due to movements in the marketsand rebalancing activities directed by management,the System maintained a slight underweight to inter-national equities and a slight overweight to realassets.
The System’s investment performance was 3.6%,-2.6% and 3.3% for the past one, three and five yearperiods, respectively. These results are slightly belowmedian relative to a universe of the System’s publicfund peers, ranking in the 71st percentile for the oneyear period. The System’s results compared betterover longer periods ranking in the 50th and 36thpercentiles for the trailing three and five-year peri-ods. The System’s policy benchmark returned 3.6%and -3.9%, respectively, for the one and three-yearperiods. The best performing asset class for the pastyear was fixed income, providing 14.0% per annum,while real assets was the best performer for the pastthree years, providing 12.0% per annum.
The System’s securities lending program obtainsadditional income by lending securities to broker-
dealers and banks. During the years ended June 30,2003 and 2002, the System’s custodian lent, at thedirection of the Board, the System’s securities andreceived cash, securities issued or guaranteed by theUnited States government, and irrevocable bank let-ters of credit as collateral. The Board and the bor-rowers maintained the right to terminate all securi-ties lending transactions on demand. The cash col-lateral received on each loan was invested togetherwith the cash collateral of other qualified tax-exemptplan lenders, in a collective investment pool. OnJune 30, 2003, the System had no credit risk expo-sure to borrowers.
The System’s investments in limited partnerships areincluded in the tables appearing in note 5 underinvestments not categorized. In connection with thoseinvestments, the System had remaining commitmentsas of June 30, 2003 and 2002 of approximately $220million and $299 million, respectively, pursuant toterms of the respective limited partnerships.
CONTACTING THE SYSTEM’S FINANCIAL MANAGEMENTThis financial report is designed to provide our par-ticipants, employer, business partners, and taxpayerswith a general overview of the System’s financialactivities. If you have questions about this report orneed additional financial information, contact theAccounting Manager of the Houston MunicipalEmployees Pension System at 1111 Bagby, Suite2450, Houston, Texas 77002.
15
MANAGEMENT’S DISCUSSION AND ANALYSIS
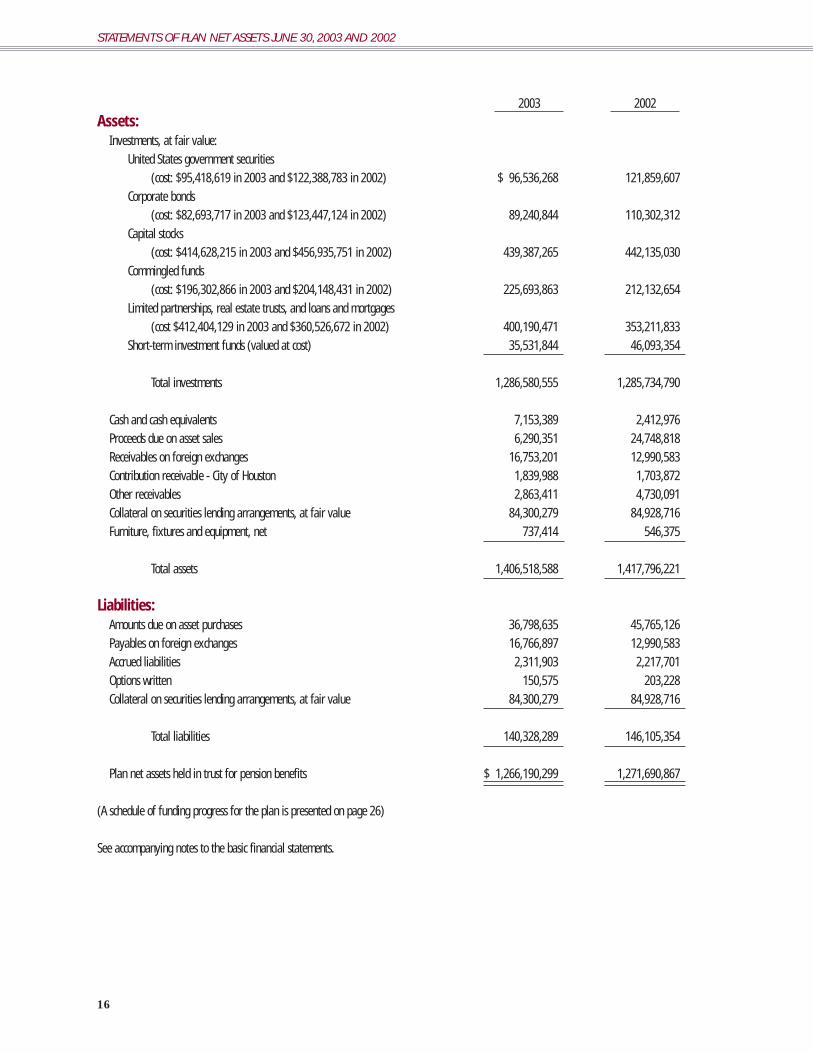
2003 2002Assets:
Investments, at fair value:United States government securities
(cost: $95,418,619 in 2003 and $122,388,783 in 2002) $ 96,536,268 121,859,607Corporate bonds
(cost: $82,693,717 in 2003 and $123,447,124 in 2002) 89,240,844 110,302,312Capital stocks
(cost: $414,628,215 in 2003 and $456,935,751 in 2002) 439,387,265 442,135,030Commingled funds
(cost: $196,302,866 in 2003 and $204,148,431 in 2002) 225,693,863 212,132,654Limited partnerships, real estate trusts, and loans and mortgages
(cost $412,404,129 in 2003 and $360,526,672 in 2002) 400,190,471 353,211,833Short-term investment funds (valued at cost) 35,531,844 46,093,354
Total investments 1,286,580,555 1,285,734,790
Cash and cash equivalents 7,153,389 2,412,976Proceeds due on asset sales 6,290,351 24,748,818Receivables on foreign exchanges 16,753,201 12,990,583Contribution receivable - City of Houston 1,839,988 1,703,872Other receivables 2,863,411 4,730,091Collateral on securities lending arrangements, at fair value 84,300,279 84,928,716Furniture, fixtures and equipment, net 737,414 546,375
Total assets 1,406,518,588 1,417,796,221
Liabilities:Amounts due on asset purchases 36,798,635 45,765,126Payables on foreign exchanges 16,766,897 12,990,583Accrued liabilities 2,311,903 2,217,701Options written 150,575 203,228Collateral on securities lending arrangements, at fair value 84,300,279 84,928,716
Total liabilities 140,328,289 146,105,354
Plan net assets held in trust for pension benefits $ 1,266,190,299 1,271,690,867
(A schedule of funding progress for the plan is presented on page 26)
See accompanying notes to the basic financial statements.
16
STATEMENTS OF PLAN NET ASSETS JUNE 30, 2003 AND 2002

2003 2002Additions to Plan Net Assets:
Contributions:City of Houston $ 40,622,051 40,757,900 Participants 23,762,123 13,475,642
Total contributions 64,384,174 54,233,542
Investment income:Interest on bonds and deposits 6,868,504 17,196,858 Dividends 7,335,018 9,552,358 Earnings from limited partnerships and real estate trusts 7,690,010 11,062,189 Net appreciation (depreciation) on investments 16,981,165 (140,618,885)
Total investment income (loss) 38,874,697 (102,807,480)
Proceeds from lending securities 1,501,543 3,545,117 Less costs of securities lending (1,124,872) (2,765,594)
Net proceeds from lending securities 376,671 779,523 Less costs of investment services (5,320,438) (5,995,628)
Total investment income (loss), net 33,930,930 (108,023,585)Other income 113,605 286,059
Total additions (reductions) to plan net assets 98,428,709 (53,503,984)
Deductions from Plan Net Assets:Benefits paid to participants 98,789,557 78,317,974 Contribution refunds to participants 474,795 269,692 Professional services 365,961 395,541 Administration expenses 4,298,964 3,662,432
Total deductions from plan net assets 103,929,277 82,645,639 Net decrease in plan net assets (5,500,568) (136,149,623)
Plan net assets held in trust for pension benefits:Beginning of year 1,271,690,867 1,407,840,490 End of year $ 1,266,190,299 1,271,690,867
See accompanying notes to the basic financial statements.
17
STATEMENTS OF CHANGES IN PLAN NET ASSETS YEARS ENDED JUNE 30, 2003 AND 2002
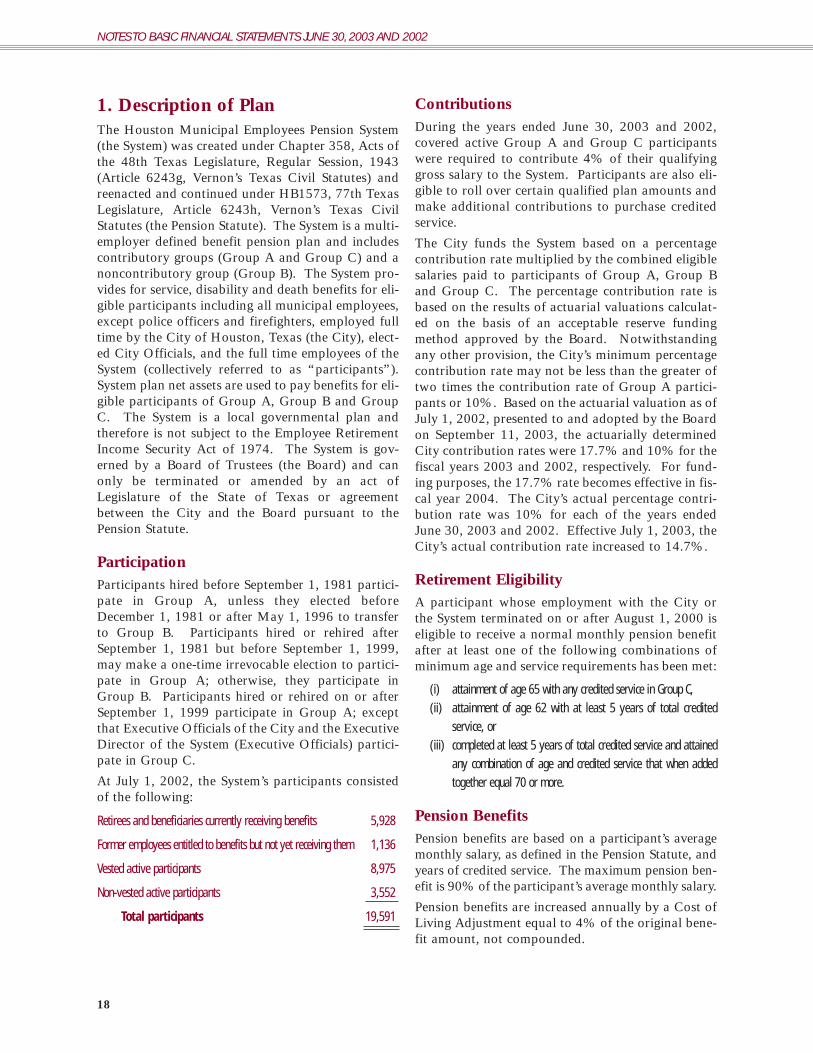
1. Description of Plan The Houston Municipal Employees Pension System(the System) was created under Chapter 358, Acts ofthe 48th Texas Legislature, Regular Session, 1943(Article 6243g, Vernon’s Texas Civil Statutes) andreenacted and continued under HB1573, 77th TexasLegislature, Article 6243h, Vernon’s Texas CivilStatutes (the Pension Statute). The System is a multi-employer defined benefit pension plan and includescontributory groups (Group A and Group C) and anoncontributory group (Group B). The System pro-vides for service, disability and death benefits for eli-gible participants including all municipal employees,except police officers and firefighters, employed fulltime by the City of Houston, Texas (the City), elect-ed City Officials, and the full time employees of theSystem (collectively referred to as “participants”).System plan net assets are used to pay benefits for eli-gible participants of Group A, Group B and GroupC. The System is a local governmental plan andtherefore is not subject to the Employee RetirementIncome Security Act of 1974. The System is gov-erned by a Board of Trustees (the Board) and canonly be terminated or amended by an act ofLegislature of the State of Texas or agreementbetween the City and the Board pursuant to thePension Statute.
ParticipationParticipants hired before September 1, 1981 partici-pate in Group A, unless they elected beforeDecember 1, 1981 or after May 1, 1996 to transferto Group B. Participants hired or rehired afterSeptember 1, 1981 but before September 1, 1999,may make a one-time irrevocable election to partici-pate in Group A; otherwise, they participate inGroup B. Participants hired or rehired on or afterSeptember 1, 1999 participate in Group A; exceptthat Executive Officials of the City and the ExecutiveDirector of the System (Executive Officials) partici-pate in Group C.
At July 1, 2002, the System’s participants consistedof the following:
Retirees and beneficiaries currently receiving benefits 5,928
Former employees entitled to benefits but not yet receiving them 1,136
Vested active participants 8,975
Non-vested active participants 3,552
Total participants 19,591
ContributionsDuring the years ended June 30, 2003 and 2002,covered active Group A and Group C participantswere required to contribute 4% of their qualifyinggross salary to the System. Participants are also eli-gible to roll over certain qualified plan amounts andmake additional contributions to purchase creditedservice.
The City funds the System based on a percentagecontribution rate multiplied by the combined eligiblesalaries paid to participants of Group A, Group Band Group C. The percentage contribution rate isbased on the results of actuarial valuations calculat-ed on the basis of an acceptable reserve fundingmethod approved by the Board. Notwithstandingany other provision, the City’s minimum percentagecontribution rate may not be less than the greater oftwo times the contribution rate of Group A partici-pants or 10%. Based on the actuarial valuation as ofJuly 1, 2002, presented to and adopted by the Boardon September 11, 2003, the actuarially determinedCity contribution rates were 17.7% and 10% for thefiscal years 2003 and 2002, respectively. For fund-ing purposes, the 17.7% rate becomes effective in fis-cal year 2004. The City’s actual percentage contri-bution rate was 10% for each of the years endedJune 30, 2003 and 2002. Effective July 1, 2003, theCity’s actual contribution rate increased to 14.7%.
Retirement EligibilityA participant whose employment with the City orthe System terminated on or after August 1, 2000 iseligible to receive a normal monthly pension benefitafter at least one of the following combinations ofminimum age and service requirements has been met:
(i) attainment of age 65 with any credited service in Group C,(ii) attainment of age 62 with at least 5 years of total credited
service, or(iii) completed at least 5 years of total credited service and attained
any combination of age and credited service that when addedtogether equal 70 or more.
Pension BenefitsPension benefits are based on a participant’s averagemonthly salary, as defined in the Pension Statute, andyears of credited service. The maximum pension ben-efit is 90% of the participant’s average monthly salary.
Pension benefits are increased annually by a Cost ofLiving Adjustment equal to 4% of the original bene-fit amount, not compounded.
18
NOTES TO BASIC FINANCIAL STATEMENTS JUNE 30, 2003 AND 2002
A participant who is eligible to receive a deferredbenefit may elect to receive his or her pension bene-fit in an early lump sum distribution if the actuarialpresent value of the participant’s benefit is less than$10,000 as of the later of September 1, 1995 or thedate of termination. Early lump-sum distributionsare subject to approval by the Board.
Disability BenefitsService-connected disability benefits for covered par-ticipants are based on the participant’s normalaccrued benefit, but are not less than 20% of the par-ticipant’s final monthly salary. There is no minimumcredited service requirement to qualify for service-connected disability benefits.
Participants with at least five years of credited serv-ice who become disabled may qualify for a non-serv-ice connected disability allowance equal to the par-ticipant’s normal accrued pension benefit.
Death BenefitsDeath benefits are provided for a participant’s sur-viving spouse and/or dependent children. Adeceased participant must have had at least five yearsof credited service at the time of his or her death toqualify for death benefits unless death was caused bya service-connected incident as defined by thePension Statute.
In order to qualify for death benefits, a survivingspouse must have been married to the deceased par-ticipant at the time the participant’s employmentwith the City or System was terminated and at thetime of the participant’s death. To qualify for bene-fits, a child must be the natural, or legally adopted,dependent child of the deceased participant at thetime of the participant’s death and (a) must be underage 21 and never have been married, or (b) have beentotally and permanently disabled before age 18 andat the time of the participant’s death and never havebeen married. Dependent benefits are payable to thelegal guardian of the dependent(s) unless the depend-ent is at least 18 years of age.
Deferred Retirement Option PlanA participant who is eligible to retire, except that heor she has not retired and remains a full-timeemployee of the City, or the System, or has been sep-arated from service for not more that thirty (30) cal-endar days, may elect to participate in the DeferredRetirement Option Plan (DROP). The DROP pro-vides that a monthly amount (monthly DROP cred-it) plus a participant’s employee contributions, if
any, attributable to the participant’s salary earnedduring the period of DROP participation will becredited to a notional account (DROP Account).Interest at a rate equal to the average of the annualpercent returns on the System’s investments for thethen most recent five complete fiscal years estab-lished effective January 1 each year will accrue, com-pounded daily, on the DROP account balance. Thefirst day of DROP participation is the DROP EntryDate. The day a participant’s fully executed DROPelection is accepted by the System is the DROPElection Date. Normal pension benefits cease toaccrue on DROP Entry Date.
Prior to September 1, 1999, the DROP Entry Datewas established as the date a participant applied tothe System for DROP election, and the monthlyDROP credit was based on a participant’s creditservice, average monthly salary, and the benefitaccrual rates in effect on DROP Entry Date. AfterSeptember 1, 1999, the DROP Entry Date may pre-cede DROP Election Date, and the monthly DROPcredit is based on the participant’s years of creditedservice and average monthly salary as of DROPEntry Date, and benefit accrual rates in effect onDROP Election Date.
DROP participation terminates when a DROP par-ticipant’s employment with the City, or the System,terminates. The balance of the participant’s notion-al DROP account (DROP Benefit) at the time of suchtermination is an amount equal to the sum of a par-ticipant’s monthly DROP credits, employee Group Aor Group C contributions, if applicable, and interestaccrued on such amount up to the time the partici-pant’s employment terminates. A DROP Benefit issubject to approval by the Board. A DROP partici-pant eligible to receive a DROP Benefit distributionmay elect to receive the distribution in a lump-sum,in equal periodic payments over a period of timeapproved by the Board, or in a combination of alump-sum followed by periodic payments over aperiod of time approved by the Board until the bal-ance of the DROP Benefit is depleted. The DROPBenefit is not available to a DROP participant untilsuch participant’s employment with the City or theSystem has terminated and the participant has made aDROP distribution election.
Refunds of Participant ContributionsGroup A or Group C participants who terminateemployment prior to retirement for reasons otherthan death, or disability, may request a refund oftheir accumulated employee contributions, withoutinterest, in lieu of a pension.
19
NOTES TO BASIC FINANCIAL STATEMENTS JUNE 30, 2003 AND 2002

2. Summary of SignificantAccounting Policies
Basis of PresentationThe accompanying basic financial statements arepresented in accordance with the generally acceptedaccounting principles established by theGovernmental Accounting Standards Board (GASB),which designates the accounting principles andfinancial reporting standards applicable to state andlocal governmental units. The accompanying basicfinancial statements include solely the accounts ofthe System, which include all programs, activitiesand functions relating to the accumulation andinvestment of the assets and related income necessaryto provide the pension benefits required by the gov-erning statutes and amendments thereto.
Basis of AccountingThe basis of accounting is the method by which rev-enues and expenses are recognized in the accountsand reported in the financial statements. The accom-panying basic financial statements are presented onthe accrual basis of accounting. Under the accrualbasis of accounting, revenues, which include invest-ment and other income, are recognized when theyare earned and collection is reasonably assured, andexpenses are recognized when the liability isincurred. Accrued income, when deemed not col-lectible, is charged to operations. Participant andemployer contributions are recognized as revenues inthe period in which the employer pays compensationto the participant. Benefits and refunds are recog-nized when due and payable in accordance with theterms of the Pension Statute.
Reporting EntityThe System is a component unit of the City and itsbasic financial statements and required supplementalinformation are included in the City’sComprehensive Annual Financial Report.
InvestmentsInvestments are reported at fair value. Securitiestraded on a national or international exchange arevalued at the last reported sales price at currentexchange rates. Mortgages are valued on the basis offuture principal and interest payments, and are dis-counted at prevailing interest rates for similar instru-ments. The fair value of limited partnerships andreal estate trusts is based on independent appraisalsor recent financial results. Short-term investments
are carried at cost, which approximates fair value.Investments that do not have an established marketare reported at estimated fair value.
Purchases and sales of investments and forward for-eign exchange contracts are recorded on the tradedate. Gains or losses on the forward foreignexchange contracts are recognized when the contractis complete.
Dividend income is recorded on the ex-dividenddate. Interest and income from other investmentsare recorded when earned.
Cash and Cash Equivalent SecuritiesThe System’s cash balances are classified in three cat-egories of credit risk:
(1) insured or collateralized with securities heldby the System or by its agent in the System’sname,
(2) collateralized with securities held by the pledg-ing financial institution’s trust department oragent in the System’s name,
(3) uncollateralized, including any bank balancethat is collateralized with securities held by thepledging institution or by its agent or trustdepartment but not in the System’s name.
As of June 30, 2003 and 2002, the System had bankbalances of $7,228,131 and $5,506,470, respective-ly, that meet the criteria of Category (1) held indemand deposits. The book balances, reflected inthe financial statements, of those deposits are$7,153,389 and $2,412,976, respectively.
Furniture, Fixtures and EquipmentFurniture, fixtures and equipment are recorded atcost less accumulated depreciation and amortization.Depreciation and amortization expense is computedusing the straight-line method over the estimateduseful lives of the related assets ranging from three toten years. Any gain or loss on the retirement ofassets is recognized currently. Maintenance andrepairs are charged to expense while expendituresfor improvements greater than or equal to $5,000are capitalized.
Use of EstimatesThe preparation of financial statements in conformi-ty with accounting principles generally accepted inthe United States of America requires management tomake estimates and assumptions that affect thereported amounts of assets and liabilities at the dateof the financial statements and the reported amounts
20
NOTES TO BASIC FINANCIAL STATEMENTS JUNE 30, 2003 AND 2002

of additions and deductions during the reporting peri-od. Actual results could differ from those estimates.
Income Tax StatusThe System obtained its latest determination letteron April 23, 2002, in which the Internal RevenueService stated that the System, as amended on May11, 2001, is in compliance with the applicablerequirements of the Internal Revenue Code. TheSystem’s management and Board believe that theSystem is currently designed and being operated incompliance with the applicable requirements of theInternal Revenue Code.
Costs of Administering the SystemThe costs of administering the System are paid by theSystem from current earnings pursuant to an annualfiscal budget adopted by the Board.
ReclassificationsCertain amounts in 2002 have been reclassified toconform to current year presentation.
3. Funding Status and Progress Participants of Group A and Group C are required tocontribute to the System amounts set forth in thePension Statute. In addition, the City is required tocontribute amounts to the System which providefunding, on an actuarial reserve basis, stated as apercentage of covered payroll, for normal cost plusthe level of percentages of payroll payments requiredto amortize the unfunded accrued liability over 40years from January 1, 1983. The City’s contributionrate is based on actuarial valuations of the System’sassets and liabilities, and shall be not less than thegreater of 10% of all member salaries or 2 times therate contributed by Group A participants.
The City’s percentage contribution rate for the yearended June 30, 2003 was based on the precedingactuarial report adopted by the Board as of the July1, 2000 actuarial valuation, which used the follow-ing significant assumptions:
Actuarial Assumptions
Investment yield rate 8.5%
Salary increases 5.5%
Payroll growth factor 5.0%
General inflation rate 4.5%
Funding method Entry age normal cost method
Life expectancy 1994 Group Annuity Mortality Table
The actuarially determined contribution require-ments as determined in the July 1, 2000 valuationand the contributions actually made for the yearended June 30, 2003 are as follows:
Contributions Required and Contributions Made
Percentage of (in millions) covered payroll
Actuarially determined normal cost $ 30.5 7.5 %
Amortization of unfunded actuarial accrued liability 8.1 2.0 %
Additional statutory requirement 2.0 .5%
Employer contributions actually made 40.6 10.0 %
Participant contributions made 23.8 4.0 %
The latest actuarial report on the System, which wasapproved and accepted by the Board on September11, 2003, is based on the market value of System netassets and participant data as of July 1, 2002. Thesignificant actuarial assumptions adopted as of July1, 2002, and used in that actuarial valuation are asfollows:
Actuarial Assumptions – July 1, 2002 Data
Investment yield rate 8.5%
Salary increases 4.5%
Payroll growth factor 4.5%
General inflation rate 4.0%
Funding method Entry age normal cost method
Life expectancy 1994 Group Annuity Mortality Table
DROP participation rate 100%
DROP entry date Upon eligibility
Historical trend information is provided as requiredsupplementary information on pages 26 to 27. Thishistorical information is intended to demonstrate theprogress the System has made in accumulating suffi-cient assets to pay benefits when due and the relatedactuarial assumptions used in determining the actu-arially determined amounts.
4. Deferred Compensation PlanThe System offers its employees a deferred compen-sation plan (the DCP) created in accordance withInternal Revenue Code Section 457. The DCP, avail-able to all employees of the System, permits employ-ees to defer a portion of their salary until futureyears. Distributions from the DCP are not availableto employees until termination, retirement, death orunforeseeable emergency. The DCP has a third party
21
NOTES TO BASIC FINANCIAL STATEMENTS JUNE 30, 2003 AND 2002
INVESTMENTS AS OF JUNE 30, 2003Category
1 3 Not Categorized Totals
U.S. government securities $ 96,536,268 96,536,268Corporate bonds 89,240,844 89,240,844Capital stocks 439,387,265 439,387,265Commingled funds 225,693,863 225,693,863Limited partnerships, real estate
trusts, and loans and mortgages 400,190,471 400,190,471Short-term investment funds 35,531,844 35,531,844
Total investments 185,777,112 439,387,265 661,416,178 1,286,580,555
Investments made with securitieslending cash collateral:
U.S. government securities 37,027,622 37,027,622Domestic equity 21,410,549 21,410,549Domestic fixed income 6,039,618 6,039,618International equity 19,822,490 19,822,490
Total investments made withsecurities lending cash collateral - 84,300,279 - 84,300,279
Total $ 185,777,112 523,687,544 661,416,178 1,370,880,834
administrator, Nationwide Retirement Solutions(Nationwide), and the cost of administration andfunding are borne by the DCP participants.Amounts deferred are held in trust by Nationwideand, since the System has no fiduciary responsibilityfor the DCP, these amounts are not reflected in theaccompanying financial statements in accordancewith GASB Statement No. 32.
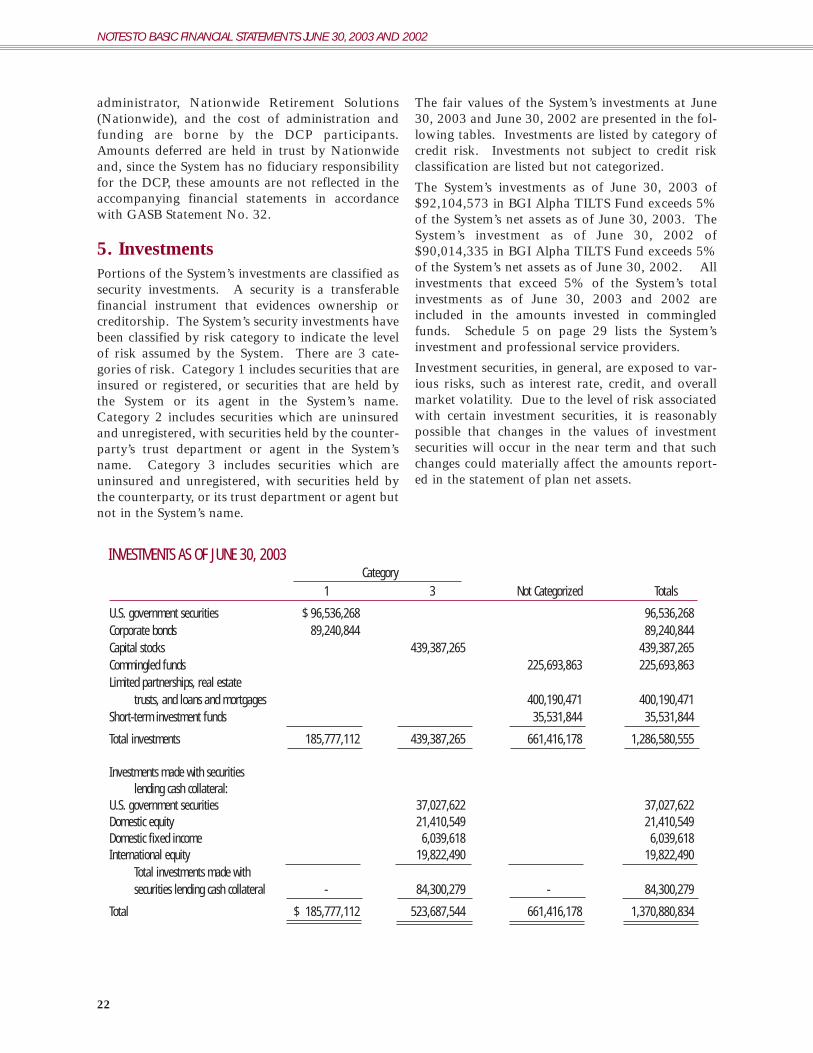
5. InvestmentsPortions of the System’s investments are classified assecurity investments. A security is a transferablefinancial instrument that evidences ownership orcreditorship. The System’s security investments havebeen classified by risk category to indicate the levelof risk assumed by the System. There are 3 cate-gories of risk. Category 1 includes securities that areinsured or registered, or securities that are held bythe System or its agent in the System’s name.Category 2 includes securities which are uninsuredand unregistered, with securities held by the counter-party’s trust department or agent in the System’sname. Category 3 includes securities which areuninsured and unregistered, with securities held bythe counterparty, or its trust department or agent butnot in the System’s name.
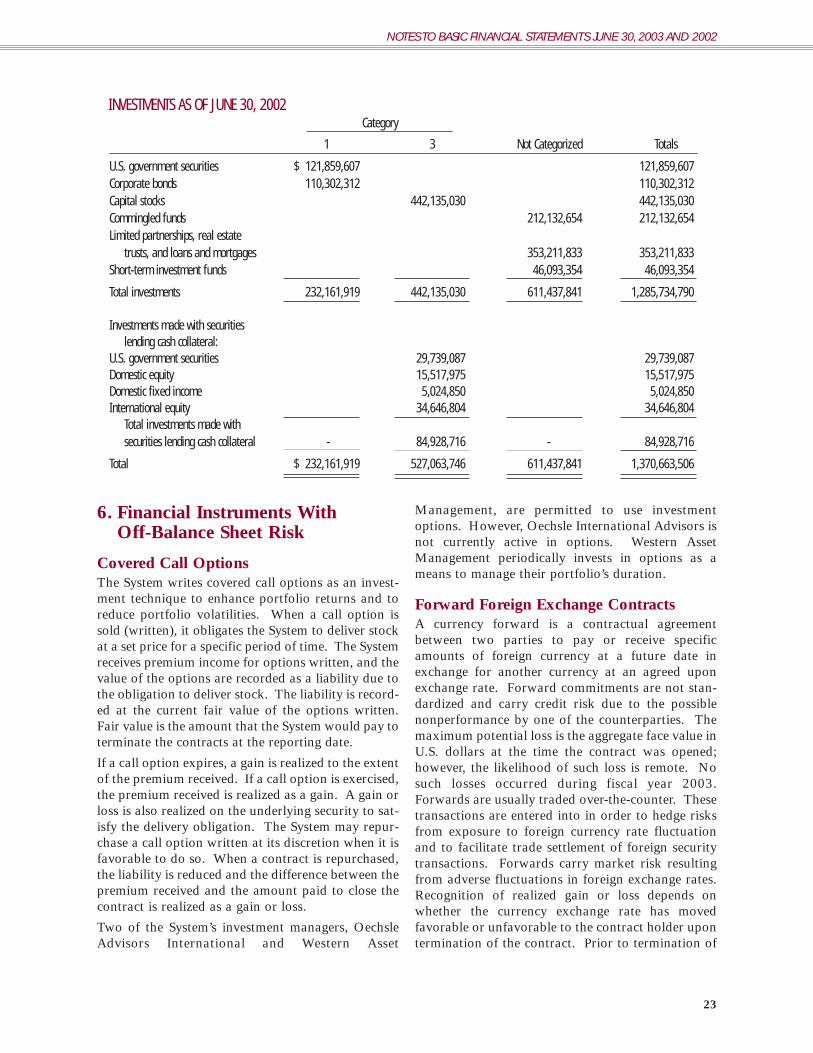
The fair values of the System’s investments at June30, 2003 and June 30, 2002 are presented in the fol-lowing tables. Investments are listed by category ofcredit risk. Investments not subject to credit riskclassification are listed but not categorized.
The System’s investments as of June 30, 2003 of$92,104,573 in BGI Alpha TILTS Fund exceeds 5%of the System’s net assets as of June 30, 2003. TheSystem’s investment as of June 30, 2002 of$90,014,335 in BGI Alpha TILTS Fund exceeds 5%of the System’s net assets as of June 30, 2002. Allinvestments that exceed 5% of the System’s totalinvestments as of June 30, 2003 and 2002 areincluded in the amounts invested in commingledfunds. Schedule 5 on page 29 lists the System’sinvestment and professional service providers.
Investment securities, in general, are exposed to var-ious risks, such as interest rate, credit, and overallmarket volatility. Due to the level of risk associatedwith certain investment securities, it is reasonablypossible that changes in the values of investmentsecurities will occur in the near term and that suchchanges could materially affect the amounts report-ed in the statement of plan net assets.
22
NOTES TO BASIC FINANCIAL STATEMENTS JUNE 30, 2003 AND 2002
23
INVESTMENTS AS OF JUNE 30, 2002Category
1 3 Not Categorized Totals
U.S. government securities $ 121,859,607 121,859,607Corporate bonds 110,302,312 110,302,312Capital stocks 442,135,030 442,135,030Commingled funds 212,132,654 212,132,654Limited partnerships, real estate
trusts, and loans and mortgages 353,211,833 353,211,833Short-term investment funds 46,093,354 46,093,354
Total investments 232,161,919 442,135,030 611,437,841 1,285,734,790
Investments made with securitieslending cash collateral:
U.S. government securities 29,739,087 29,739,087Domestic equity 15,517,975 15,517,975Domestic fixed income 5,024,850 5,024,850International equity 34,646,804 34,646,804
Total investments made withsecurities lending cash collateral - 84,928,716 - 84,928,716
Total $ 232,161,919 527,063,746 611,437,841 1,370,663,506
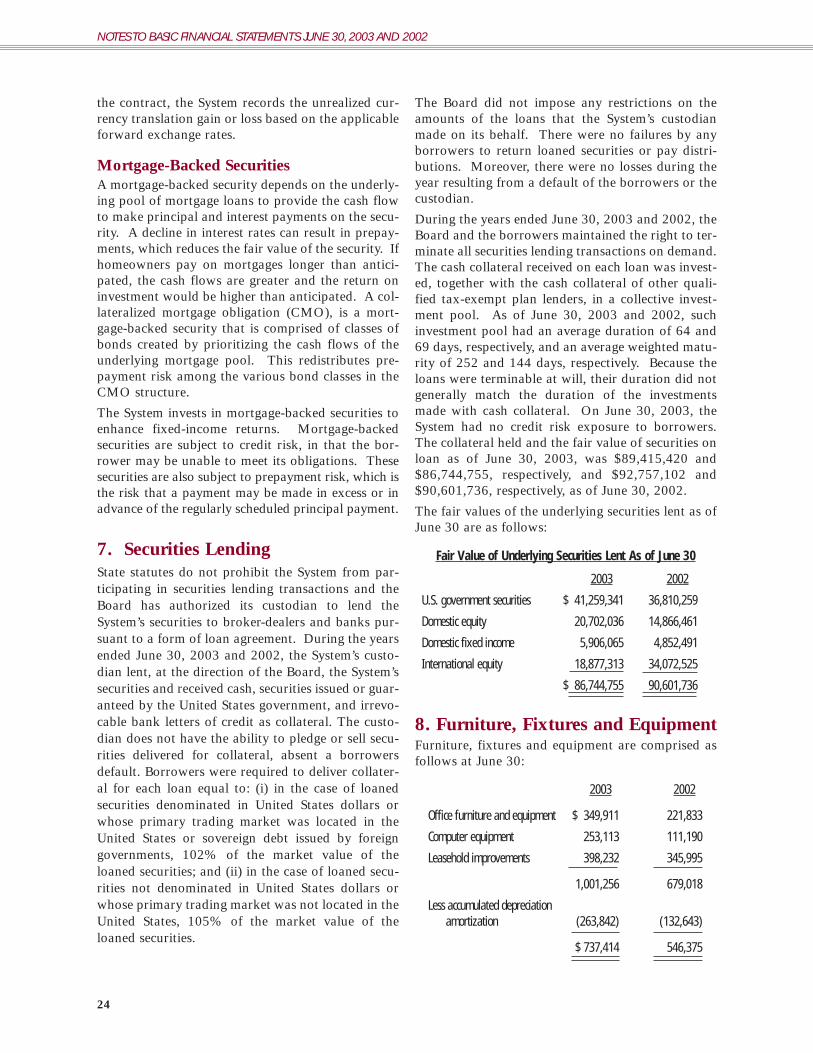
6. Financial Instruments With Off-Balance Sheet Risk
Covered Call OptionsThe System writes covered call options as an invest-ment technique to enhance portfolio returns and toreduce portfolio volatilities. When a call option issold (written), it obligates the System to deliver stockat a set price for a specific period of time. The Systemreceives premium income for options written, and thevalue of the options are recorded as a liability due tothe obligation to deliver stock. The liability is record-ed at the current fair value of the options written.Fair value is the amount that the System would pay toterminate the contracts at the reporting date.
If a call option expires, a gain is realized to the extentof the premium received. If a call option is exercised,the premium received is realized as a gain. A gain orloss is also realized on the underlying security to sat-isfy the delivery obligation. The System may repur-chase a call option written at its discretion when it isfavorable to do so. When a contract is repurchased,the liability is reduced and the difference between thepremium received and the amount paid to close thecontract is realized as a gain or loss.
Two of the System’s investment managers, OechsleAdvisors International and Western Asset
Management, are permitted to use investmentoptions. However, Oechsle International Advisors isnot currently active in options. Western AssetManagement periodically invests in options as ameans to manage their portfolio’s duration.
Forward Foreign Exchange ContractsA currency forward is a contractual agreementbetween two parties to pay or receive specificamounts of foreign currency at a future date inexchange for another currency at an agreed uponexchange rate. Forward commitments are not stan-dardized and carry credit risk due to the possiblenonperformance by one of the counterparties. Themaximum potential loss is the aggregate face value inU.S. dollars at the time the contract was opened;however, the likelihood of such loss is remote. Nosuch losses occurred during fiscal year 2003.Forwards are usually traded over-the-counter. Thesetransactions are entered into in order to hedge risksfrom exposure to foreign currency rate fluctuationand to facilitate trade settlement of foreign securitytransactions. Forwards carry market risk resultingfrom adverse fluctuations in foreign exchange rates.Recognition of realized gain or loss depends onwhether the currency exchange rate has movedfavorable or unfavorable to the contract holder upontermination of the contract. Prior to termination of
NOTES TO BASIC FINANCIAL STATEMENTS JUNE 30, 2003 AND 2002
the contract, the System records the unrealized cur-rency translation gain or loss based on the applicableforward exchange rates.
Mortgage-Backed SecuritiesA mortgage-backed security depends on the underly-ing pool of mortgage loans to provide the cash flowto make principal and interest payments on the secu-rity. A decline in interest rates can result in prepay-ments, which reduces the fair value of the security. Ifhomeowners pay on mortgages longer than antici-pated, the cash flows are greater and the return oninvestment would be higher than anticipated. A col-lateralized mortgage obligation (CMO), is a mort-gage-backed security that is comprised of classes ofbonds created by prioritizing the cash flows of theunderlying mortgage pool. This redistributes pre-payment risk among the various bond classes in theCMO structure.
The System invests in mortgage-backed securities toenhance fixed-income returns. Mortgage-backedsecurities are subject to credit risk, in that the bor-rower may be unable to meet its obligations. Thesesecurities are also subject to prepayment risk, which isthe risk that a payment may be made in excess or inadvance of the regularly scheduled principal payment.
7. Securities LendingState statutes do not prohibit the System from par-ticipating in securities lending transactions and theBoard has authorized its custodian to lend theSystem’s securities to broker-dealers and banks pur-suant to a form of loan agreement. During the yearsended June 30, 2003 and 2002, the System’s custo-dian lent, at the direction of the Board, the System’ssecurities and received cash, securities issued or guar-anteed by the United States government, and irrevo-cable bank letters of credit as collateral. The custo-dian does not have the ability to pledge or sell secu-rities delivered for collateral, absent a borrowersdefault. Borrowers were required to deliver collater-al for each loan equal to: (i) in the case of loanedsecurities denominated in United States dollars orwhose primary trading market was located in theUnited States or sovereign debt issued by foreigngovernments, 102% of the market value of theloaned securities; and (ii) in the case of loaned secu-rities not denominated in United States dollars orwhose primary trading market was not located in theUnited States, 105% of the market value of theloaned securities.
The Board did not impose any restrictions on theamounts of the loans that the System’s custodianmade on its behalf. There were no failures by anyborrowers to return loaned securities or pay distri-butions. Moreover, there were no losses during theyear resulting from a default of the borrowers or thecustodian.
During the years ended June 30, 2003 and 2002, theBoard and the borrowers maintained the right to ter-minate all securities lending transactions on demand.The cash collateral received on each loan was invest-ed, together with the cash collateral of other quali-fied tax-exempt plan lenders, in a collective invest-ment pool. As of June 30, 2003 and 2002, suchinvestment pool had an average duration of 64 and69 days, respectively, and an average weighted matu-rity of 252 and 144 days, respectively. Because theloans were terminable at will, their duration did notgenerally match the duration of the investmentsmade with cash collateral. On June 30, 2003, theSystem had no credit risk exposure to borrowers.The collateral held and the fair value of securities onloan as of June 30, 2003, was $89,415,420 and$86,744,755, respectively, and $92,757,102 and$90,601,736, respectively, as of June 30, 2002.
The fair values of the underlying securities lent as ofJune 30 are as follows:
Fair Value of Underlying Securities Lent As of June 30
2003 2002
U.S. government securities $ 41,259,341 36,810,259
Domestic equity 20,702,036 14,866,461
Domestic fixed income 5,906,065 4,852,491
International equity 18,877,313 34,072,525
$ 86,744,755 90,601,736
8. Furniture, Fixtures and EquipmentFurniture, fixtures and equipment are comprised asfollows at June 30:
2003 2002
Office furniture and equipment $ 349,911 221,833
Computer equipment 253,113 111,190
Leasehold improvements 398,232 345,995
1,001,256 679,018
Less accumulated depreciation amortization (263,842) (132,643)
$ 737,414 546,375
24
NOTES TO BASIC FINANCIAL STATEMENTS JUNE 30, 2003 AND 2002

9. CommitmentsAs described in note 1, certain participants of theSystem are eligible to receive, upon request, a refundof their accumulated Group A and/or Group C con-tributions, without interest, upon termination ofemployment with the City, or System, prior to beingeligible for pension benefits. At June 30, 2003 and2002, aggregate contributions from these eligibleparticipants of the System were approximately$59,175,000 and $46,893,000, respectively.
The System’s investments in limited partnerships areincluded in the tables appearing in note 5 underinvestments not categorized. In connection with thoseinvestments, the System has remaining commitmentsas of June 30, 2003 and 2002 of approximately$219,639,580 and $298,738,000, respectively, pur-suant to terms of the respective limited partnerships.
The System leases office facilities and parking spacesunder an operating lease expiring in 2011.
Future minimum lease obligations required undersuch lease are as follows:
Future Minimum Lease Obligations
Year Ending June 30
2004 $ 290,640
2005 329,700
2006 329,700
2007 455,400
2008 455,400
Thereafter 1,366,200
$ 3,227,040
Additional amounts are assessed for use of commonareas, utilities and maintenance. Total rentalexpense, including these assessments, amounted toapproximately $500,800 and $384,800 during theyears ended June 30, 2003 and 2002, respectively.
25
NOTES TO BASIC FINANCIAL STATEMENTS JUNE 30, 2003 AND 2002

SCHEDULE 2 - REQUIRED SUPPLEMENTAL INFORMATION
SCHEDULE OF EMPLOYER CONTRIBUTIONS (UNAUDITED)
Fiscal Actuarial Annual Required PercentageYear Valuation Date Contributions (in millions)* Contributed
06/30/97 07/01/95 $ 34.5 100.0%
06/30/98 07/01/96 35.3 100.0%
06/30/99 07/01/96 36.0 100.0%
06/30/00 07/01/98 38.3 100.0%
06/30/01 07/01/99 41.3 100.0%
06/30/02 07/01/00 40.8 100.0%
06/30/03 07/01/02 71.9 56.5%
* The required contributions are calculated based on actuarially determined contribution rates. Actuarial calculations are performed ayear in arrears and are applied to a future period. The actuarially determined rates used in this schedule for fiscal years 2002 and 2003are based on the actuarial valuation presented to and adopted by the Board on September 11, 2003, and become effective in 2004 forfunding purposes but are presented here for disclosure purposes.
See accompanying independent auditors’ report.See accompanying note to required supplemental schedules.
SCHEDULE 1 - REQUIRED SUPPLEMENTAL INFORMATION
SCHEDULE OF FUNDING PROGRESS (UNAUDITED) (IN MILLIONS OF DOLLARS)
(1) (2) (3) (4) (5) (6)Actuarial Actuarial UAAL as a
Actuarial Value of Accrued Funded PercentageValuation Assets Liability Unfunded Ratio Covered of Covered
Date (AVA) (AAL) (UAAL) (1):(2) Payroll Payroll
07/01/96 $ 857.3 1,042.5 185.2 82 % 367.6 50 % 07/01/98 1,095.6 1,240.1 144.5 88 % 397.7 36 % 07/01/99 1,222.2 1,339.9 117.7 91 % 407.7 29 % 07/01/00 1,376.0 1,509.4 133.4 91 % 432.6 31 %07/01/01 1,490.2 1,955.8 465.6 76 % 418.0 111 %07/01/02 1,519.7 2,515.2 995.5 60 % 399.8 249 %
Analysis of the dollar amounts of the actuarial value of assets, actuarial accrued liability, and unfunded actuarial accrued liability in isolation can be mis-leading. Expressing the actuarial value of assets as a percentage of the actuarial accrued liability provides one indication of the System’s funding status ona going-concern basis. Analysis of this percentage over time indicates whether the plan is becoming financially stronger or weaker. Generally, the greaterthis percentage, the stronger the plan. Trends in unfunded actuarial accrued liability and covered payroll are both affected by inflation. Expressing theunfunded actuarial accrued liability as a percentage of covered payroll approximately adjusts for the effects of inflation and aids analysis of the System’sprogress made in accumulating sufficient assets to pay benefits when due. Generally, the smaller this percentage, the stronger the plan.
See accompanying independent auditors’ report.See accompanying note to required supplemental schedules.
SUPPLEMENTAL INFORMATION
26

NOTE TO REQUIRED SUPPLEMENTAL SCHEDULES 1 and 2 (UNAUDITED)
This information presented in the required supplemental information was determined as part of the actuarial valuations at the dates indicated. Additionalinformation as of the latest actuarial valuation follows:
Valuation date July 1, 2002Actuarial cost method Entry ageAmortization method Level percentage, closedRemaining amortization period 20 yearsAsset valuation method 5-year smoothed marketActuarial assumptions:
Investment rate of return 8.5%, net of expensesSalary increases Constant annual rate of 4.5%Payroll growth factor 4.5% per yearGeneral inflation rate 4.0% per yearDROP participation rate 100%DROP entry date Upon eligibility
See accompanying independent auditors’ report.
SUPPLEMENTAL INFORMATION
27
SCHEDULE 3
INVESTMENT SUMMARY JUNE 30, 2003 and 2002
June 30, 2003 June 30, 2002
Unrealized UnrealizedAppreciation Appreciation
Type of Investment Cost Fair Value (Depreciation) Cost Fair Value (Depreciation)
Fixed income:U.S. government securities $ 95,418,619 96,536,268 1,117,649 122,388,783 121,859,607 (529,176)Corporate bonds 82,693,717 89,240,844 6,547,127 123,447,124 110,302,312 (13,144,812)
Total fixed income 178,112,336 185,777,112 7,664,776 245,835,907 232,161,919 (13,673,988)
Capital stocks 414,628,215 439,387,265 24,759,050 456,935,751 442,135,030 (14,800,721)Commingled funds 196,302,866 225,693,863 29,390,997 204,148,431 212,132,654 7,984,223
Limited partnerships, real estatetrusts and loans and mortgages 412,404,129 400,190,471 (12,213,658) 360,526,672 353,211,833 (7,314,839)
Short-term investment funds 35,531,844 35,531,844 46,093,354 46,093,354
Total investments $ 1,236,979,390 1,286,580,555 49,601,165 1,313,540,115 1,285,734,790 (27,805,325)
Space and cost restrictions make it impractical to print the entire investment portfolio in this report. A portfolio listing is available for review at the System’s office by appointment upon request.
See accompanying independent auditors’ report.
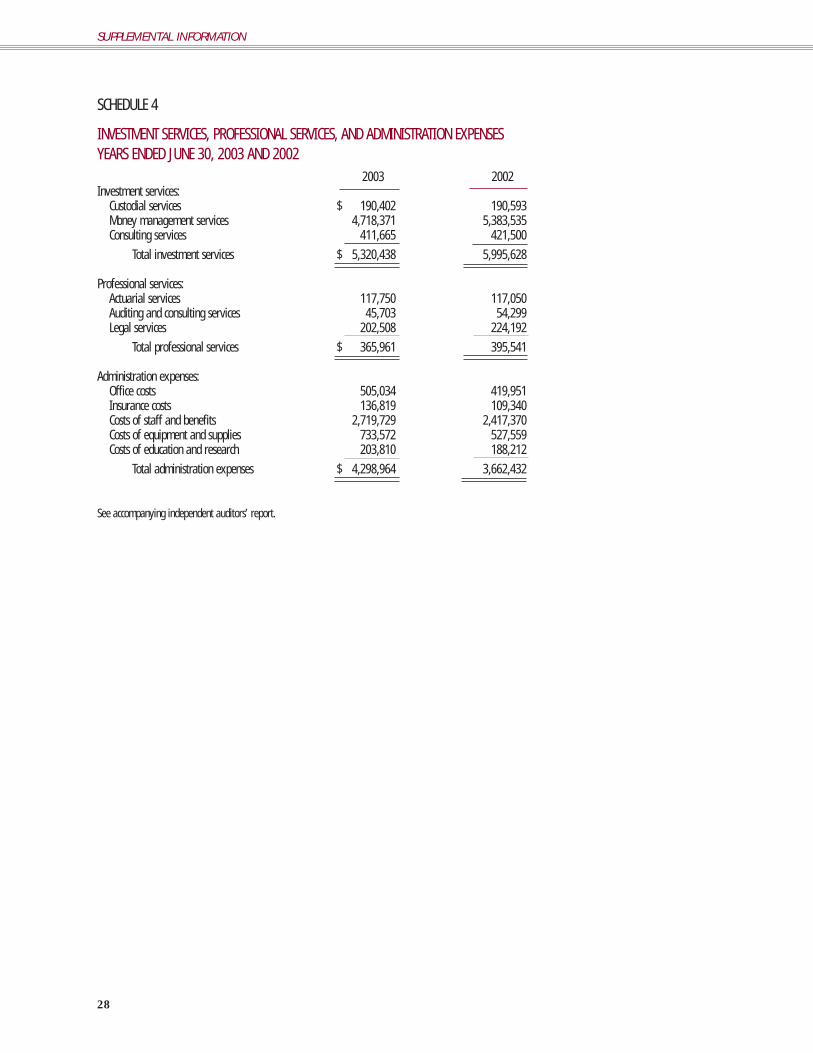
SCHEDULE 4
INVESTMENT SERVICES, PROFESSIONAL SERVICES, AND ADMINISTRATION EXPENSESYEARS ENDED JUNE 30, 2003 AND 2002
2003 2002Investment services:
Custodial services $ 190,402 190,593Money management services 4,718,371 5,383,535Consulting services 411,665 421,500
Total investment services $ 5,320,438 5,995,628
Professional services:Actuarial services 117,750 117,050Auditing and consulting services 45,703 54,299Legal services 202,508 224,192
Total professional services $ 365,961 395,541
Administration expenses:Office costs 505,034 419,951Insurance costs 136,819 109,340Costs of staff and benefits 2,719,729 2,417,370Costs of equipment and supplies 733,572 527,559Costs of education and research 203,810 188,212
Total administration expenses $ 4,298,964 3,662,432
See accompanying independent auditors’ report.
28
SUPPLEMENTAL INFORMATION

29
SCHEDULE 5
SUMMARY OF COSTS OF INVESTMENT AND PROFESSIONAL SERVICES YEARS ENDED JUNE 30, 2003 AND 2002
Service Provider Service Provided 2003 2002
DePrince, Race and Zollo, Inc. Money Management $ 442,726 511,168Bank of America Money Management 11,314 13,730Taplin, Canida and Habacht Money Management 61,576 148,785PM Realty Advisors Money Management 48,000 59,339Oechsle International Advisors Money Management 674,951 681,731Kopp Investment Advisors Money Management 147,814 199,023Barclays Global Investors, N.A. Money Management 288,361 312,223Loomis, Sayles and Company, L.P. Money Management 216,747 373,271Neumeier Investment Counsel, L.L.C. Money Management 303,664 364,632Putnam Investments Money Management 174,689 269,881UBS Timber Investors Money Management 76,984 41,622UBS Global Asset Management Money Management 519,378 344,689Alliance Capital Management, L.P. Money Management 147,222 256,995TT International Investment Management Money Management 335,818 447,804Brown Capital Management Money Management 179,484 218,536Legg Mason Capital Management, Inc. Money Management 266,633 276,526L&B Realty Advisors Money Management 93,934 76,468Smith Graham & Company Money Management 87,667 90,609Western Asset Management Money Management 116,376 255,456MDL Capital Management Money Management 103,377 98,977Axiom International Investors, L.L.C. Money Management 421,656 342,070State Street Bank and Trust Company Custodial Services 190,402 190,593Wilshire Associates, Inc. Consulting Services 254,000 244,000Pension Consulting Alliance Consulting Services 157,665 177,500
Total investment services 5,320,438 5,995,628
Baker and Botts, L.L.P. Legal Services 79,650 83,886Locke, Liddell and Sapp, L.L.P. Legal Services 116,474 123,398Lawson, Fields, McCue, Lee & Campbell, P.C. Legal Services 6,384 16,908Mir-Fox & Rodriguez, P.C. Auditing Services 44,098 28,550Pension Benefits Information Auditing Services 1,605 2,249Lloyd Brown Search Consultants Consulting Services 23,500Towers Perrin, Inc. Actuarial Services 117,750 117,050
Total professional services 365,961 395,541
Total costs of investment and professional services $ 5,686,399 6,391,169
See accompanying independent auditors’ report.
SUPPLEMENTAL INFORMATION

A Bustling Main Street For Over A Century
If you were to travel back in time to 1945, Main Street would appear as abustling, thriving thoroughfare. Dating back to its construction around1860, however, its first businesses were only two and three story buildings.Post-World War II Main Street was approximately 24 miles long and con-tained buildings such as the Rice Hotel, which boasted more than 16 floors.Recently, the addition of a rail system and numerous shops and restaurantshas helped infuse energy back into this main thoroughfare.

INVESTMENT SECTION
DISCUSSION OF INVESTMENT POLICIES AND ACTIVITIES
SCHEDULE OF TOP INVESTMENTS ($000) AS OF JUNE 30, 2002
COMPARISON OF INVESTMENT RETURNS – YEARS ENDED JUNE 30
PERFORMANCE BY FISCAL YEAR LAST TEN YEARS
SUMMARY OF INVESTMENTS BY TYPE AS OF JUNE 30, 2003
SCHEDULE OF FEES AND COMMISSIONS

The Board of Trustees (the Board) of the HoustonMunicipal Employees Pension System (System) hasadopted a Statement of Investment Policies andObjectives (Statement) as a framework for the invest-ment of the System’s assets. The authority to amendthe Statement rests solely with the Board. The Boardmay delegate to the Investment Committee(Committee) the authority to act on certain mattersrelating to the System’s investments. The Committeeis made up of the full Board of Trustees. The fol-lowing provides an outline of the Statement.
GeneralThe Board recognizes the following investmentresponsibilities: a) to establish investment policy,guidelines and objectives for the investment of Systemassets, b) to select independent investment managersto implement management strategies in conformitywith stated investment policies and guidelines, and c)to monitor investment activities and progress towardattaining investment objectives.
Investment PoliciesStrategic Asset AllocationPolicy and MaintenanceThe Board periodically undertakes strategic studiesto address the appropriateness of asset classes to beconsidered for inclusion in the allocation plan, andto define the targeted percentage to each asset classto achieve the desired level of diversification. If mar-ket conditions cause one or more asset levels to movesignificantly outside the targeted range for that class,the Board authorizes appropriate actions to re-bal-ance toward desired diversification levels.
Manager Structure ConsiderationsFor major asset classes (Alternative Investments,Fixed Income, International Equities, Real Assetsand U.S. Equities) the Board diversifies investmentsby engaging the services of professional investmentportfolio managers with demonstrated skills andexpertise in managing portfolios with characteristicscomparable to the desired asset class. The managersretained are expected to utilize varied investmentapproaches that, when combined, will exhibit char-acteristics that are similar to the asset class proxy uti-lized in the strategic asset allocation plan. Cashinflows and outflows are directed, within the target-ed asset class, to the various managers so that actualcharacteristics of the portfolio will be consistent with
the strategic plan. No investment manager is per-mitted to have more than 15% of the fair value ofthe fund’s assets in a single investment style.
Investment Manager Guidelines and EvaluationInvestment managers are subject to guidelines andobjectives incorporated in the investment manage-ment agreement entered into by the Board and therespective investment managers. Investment man-agers are expected to perform their fiduciary dutiesas prudent people skilled in such matters and, fur-ther, are expected to comply with all applicable Stateand Federal statutes governing the investment ofretirement funds. Within the context of the guide-lines, investment managers have full discretion withrespect to the purchase and sale of individual securi-ties and concentrations of similar securities.Portfolios are to be managed in a manner similar toother portfolios within an organization with similarguidelines and performance objectives.
The Board requires that all investment managersseek best execution for all trades ordered on behalfof the System. Equity managers are encouraged todirect a designated percentage of their brokerageactivity to an approved list of brokers. Fixed incomemanagers are encouraged to direct primary tradingactivity wherever there is an opportunity to recapturea portion of the syndication costs for the System.
Manager EvaluationManagers of portfolios are evaluated periodicallyagainst predetermined benchmarks such as an appro-priate market index or a comparable peer group. Allmanagers are required to make formal reports to theBoard of their activities and performance according tostandards set forth in the Statement. In addition,System personnel and professional consultantsengaged by the Board monitor, pursuant to instruc-tions by the Board, managers’ performance and con-formity with their guidelines and objectives.
Performance EvaluationThe Board reviews System investment performanceon a periodic basis to evaluate conformity to thegoals and objectives established in the strategic plan.The Board recognizes that financial markets fromtime to time may not support attainment of thosegoals and objectives. During such times, progresstoward conformity is evaluated by comparing per-formance to a percentage equal to the weighted aver-
32
DISCUSSION OF INVESTMENT POLICIES AND ACTIVITIES
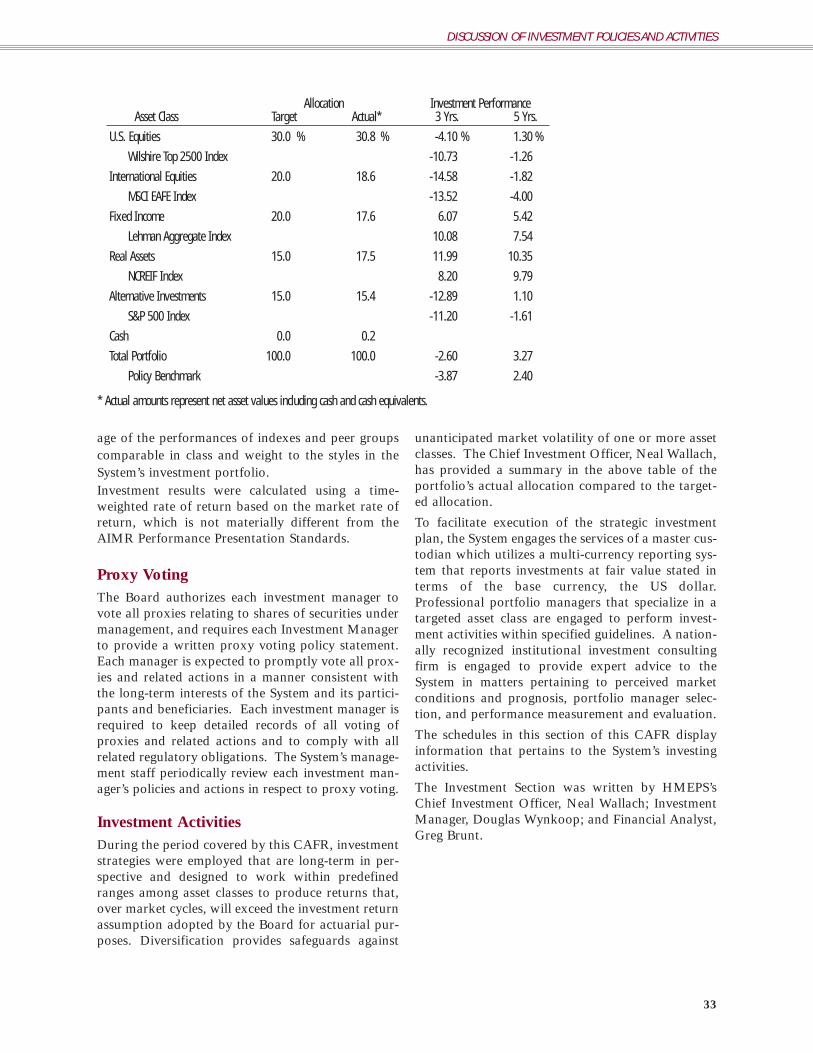
age of the performances of indexes and peer groupscomparable in class and weight to the styles in theSystem’s investment portfolio.Investment results were calculated using a time-weighted rate of return based on the market rate ofreturn, which is not materially different from theAIMR Performance Presentation Standards.
Proxy VotingThe Board authorizes each investment manager tovote all proxies relating to shares of securities undermanagement, and requires each Investment Managerto provide a written proxy voting policy statement.Each manager is expected to promptly vote all prox-ies and related actions in a manner consistent withthe long-term interests of the System and its partici-pants and beneficiaries. Each investment manager isrequired to keep detailed records of all voting ofproxies and related actions and to comply with allrelated regulatory obligations. The System’s manage-ment staff periodically review each investment man-ager’s policies and actions in respect to proxy voting.
Investment ActivitiesDuring the period covered by this CAFR, investmentstrategies were employed that are long-term in per-spective and designed to work within predefinedranges among asset classes to produce returns that,over market cycles, will exceed the investment returnassumption adopted by the Board for actuarial pur-poses. Diversification provides safeguards against
unanticipated market volatility of one or more assetclasses. The Chief Investment Officer, Neal Wallach,has provided a summary in the above table of theportfolio’s actual allocation compared to the target-ed allocation.
To facilitate execution of the strategic investmentplan, the System engages the services of a master cus-todian which utilizes a multi-currency reporting sys-tem that reports investments at fair value stated interms of the base currency, the US dollar.Professional portfolio managers that specialize in atargeted asset class are engaged to perform invest-ment activities within specified guidelines. A nation-ally recognized institutional investment consultingfirm is engaged to provide expert advice to theSystem in matters pertaining to perceived marketconditions and prognosis, portfolio manager selec-tion, and performance measurement and evaluation.
The schedules in this section of this CAFR displayinformation that pertains to the System’s investingactivities.
The Investment Section was written by HMEPS’sChief Investment Officer, Neal Wallach; InvestmentManager, Douglas Wynkoop; and Financial Analyst,Greg Brunt.
Allocation Investment PerformanceAsset Class Target Actual* 3 Yrs. 5 Yrs.
U.S. Equities 30.0 % 30.8 % -4.10 % 1.30 %
Wilshire Top 2500 Index -10.73 -1.26
International Equities 20.0 18.6 -14.58 -1.82
MSCI EAFE Index -13.52 -4.00
Fixed Income 20.0 17.6 6.07 5.42
Lehman Aggregate Index 10.08 7.54
Real Assets 15.0 17.5 11.99 10.35
NCREIF Index 8.20 9.79
Alternative Investments 15.0 15.4 -12.89 1.10
S&P 500 Index -11.20 -1.61
Cash 0.0 0.2
Total Portfolio 100.0 100.0 -2.60 3.27
Policy Benchmark -3.87 2.40
* Actual amounts represent net asset values including cash and cash equivalents.
DISCUSSION OF INVESTMENT POLICIES AND ACTIVITIES
33

SCHEDULE OF TOP INVESTMENTS ($000) AS OF JUNE 30, 2003
Fair Value of Percent ofName of Investment Investment Portfolio
Barclays Alpha Tilts (Enhanced S&P 500 Index) $ 92,105 7.3 %Brandes International Value Fund 60,865 4.8PIMCO Stocks Plus (Enhanced S&P 500 Index) 58,580 4.6Barclays US Equity Index (S&P 500 Index) 42,166 3.3Barclays US Bond Index (Lehman Aggregate Index) 32,843 2.6
COMPARISON OF INVESTMENT RETURNS - YEARS ENDED JUNE 30
Median of Wilshire MSCIPeriod Wilshire HMEPS Target HMEPS ACWI MSCI HMEPS LehmanEnding HMEPS Public Fund Domestic Top 2500 S&P 500 Int’l. Free ex EAFE Fixed Aggregate6-30 Total Fund Universe Equity Index Index Equity US Index Index Income Index
1994 2.04 % 1.91 % -1.55 % 1.18 % 1.41 % 17.65 % n/a 16.99 % -2.56 % -1.31 %
1995 14.47 16.30 25.59 25.03 26.07 3.87 n/a 1.66 12.78 12.55
1996 21.27 16.76 33.18 26.03 25.99 17.10 n/a 13.28 8.13 5.01
1997 16.91 20.38 17.22 30.10 34.70 18.39 n/a 12.84 12.31 8.16
1998 9.16 18.40 19.28 30.06 30.17 4.22 n/a 6.09 8.58 10.54
1999 3.42 12.10 7.87 20.22 22.74 1.60 n/a 7.59 0.52 3.13
2000 22.92 9.81 12.14 9.74 7.27 44.02 n/a 17.18 8.54 4.56
2001 -4.08 -5.15 -2.00 -14.95 -14.82 -26.31 n/a -23.61 2.30 11.23
2002 -6.97 -5.87 -12.79 -17.20 -17.99 -12.10 -8.45 % -9.49 2.34 8.63
2003 3.55 4.10 3.18 1.00 0.25 -3.76 -4.59 -6.46 13.98 10.40
3 Yrs. -2.60 -2.78 -4.10 -10.73 -11.20 -14.58 n/a -13.52 6.07 10.08
5 Yrs. 3.27 2.80 1.30 -1.26 -1.61 -1.82 n/a -4.00 5.42 7.54
10 Yrs. 7.82 8.53 9.40 9.74 10.04 4.88 n/a 2.78 6.55 7.21
34
SCHEDULE OF TOP INVESTMENTS
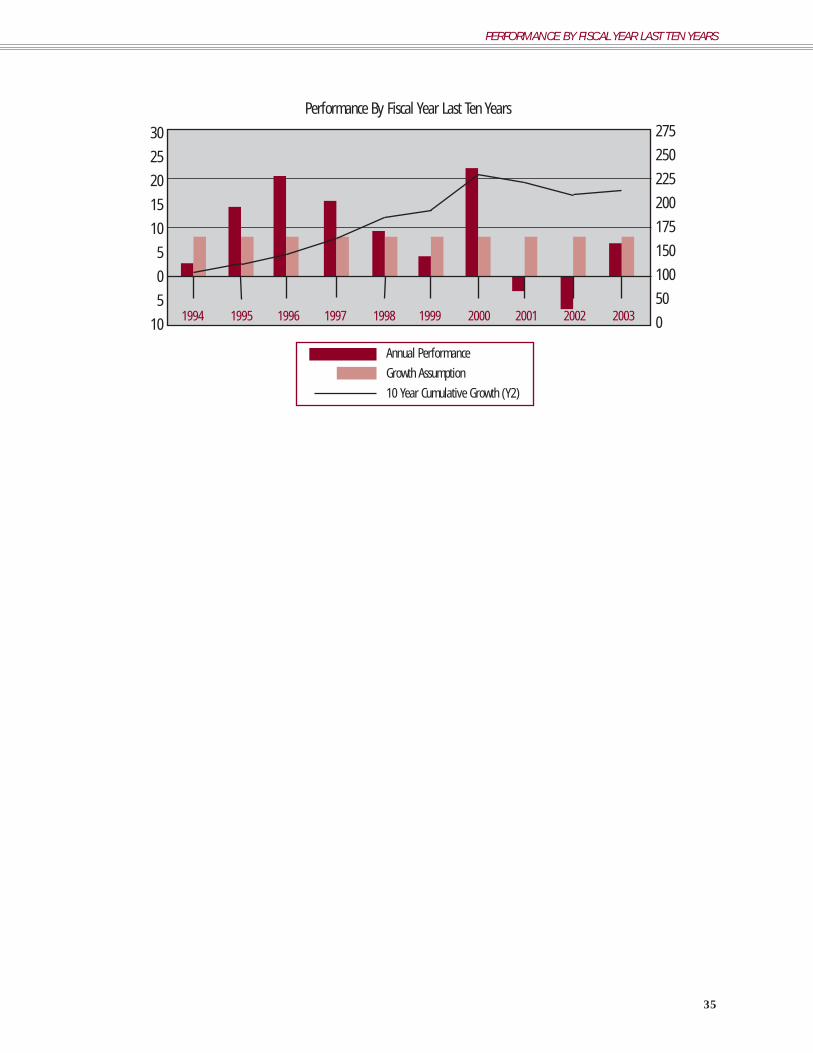
Performance By Fiscal Year Last Ten Years
30
25
20
15
10
5
0
5
10 1994 1995 1996 1997 1998 1999 2000 2001 2002 2003
Annual Performance
Growth Assumption
10 Year Cumulative Growth (Y2)
275
250
225
200
175
150
100
50
0
PERFORMANCE BY FISCAL YEAR LAST TEN YEARS
35
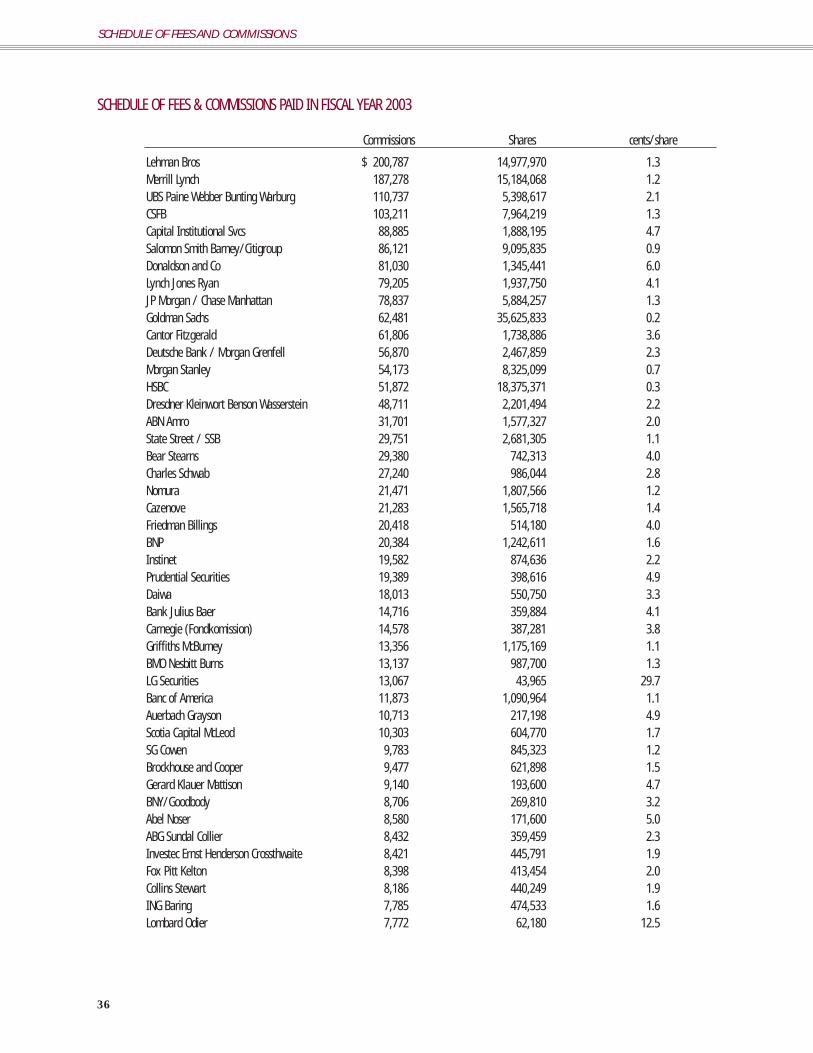
SCHEDULE OF FEES & COMMISSIONS PAID IN FISCAL YEAR 2003
Commissions Shares cents/share
Lehman Bros $ 200,787 14,977,970 1.3Merrill Lynch 187,278 15,184,068 1.2UBS Paine Webber Bunting Warburg 110,737 5,398,617 2.1CSFB 103,211 7,964,219 1.3Capital Institutional Svcs 88,885 1,888,195 4.7Salomon Smith Barney/Citigroup 86,121 9,095,835 0.9Donaldson and Co 81,030 1,345,441 6.0Lynch Jones Ryan 79,205 1,937,750 4.1JP Morgan / Chase Manhattan 78,837 5,884,257 1.3Goldman Sachs 62,481 35,625,833 0.2Cantor Fitzgerald 61,806 1,738,886 3.6Deutsche Bank / Morgan Grenfell 56,870 2,467,859 2.3Morgan Stanley 54,173 8,325,099 0.7HSBC 51,872 18,375,371 0.3Dresdner Kleinwort Benson Wasserstein 48,711 2,201,494 2.2ABN Amro 31,701 1,577,327 2.0State Street / SSB 29,751 2,681,305 1.1Bear Stearns 29,380 742,313 4.0Charles Schwab 27,240 986,044 2.8Nomura 21,471 1,807,566 1.2Cazenove 21,283 1,565,718 1.4Friedman Billings 20,418 514,180 4.0BNP 20,384 1,242,611 1.6Instinet 19,582 874,636 2.2Prudential Securities 19,389 398,616 4.9Daiwa 18,013 550,750 3.3Bank Julius Baer 14,716 359,884 4.1Carnegie (Fondkomission) 14,578 387,281 3.8Griffiths McBurney 13,356 1,175,169 1.1BMO Nesbitt Burns 13,137 987,700 1.3LG Securities 13,067 43,965 29.7Banc of America 11,873 1,090,964 1.1Auerbach Grayson 10,713 217,198 4.9Scotia Capital McLeod 10,303 604,770 1.7SG Cowen 9,783 845,323 1.2Brockhouse and Cooper 9,477 621,898 1.5Gerard Klauer Mattison 9,140 193,600 4.7BNY/Goodbody 8,706 269,810 3.2Abel Noser 8,580 171,600 5.0ABG Sundal Collier 8,432 359,459 2.3Investec Ernst Henderson Crossthwaite 8,421 445,791 1.9Fox Pitt Kelton 8,398 413,454 2.0Collins Stewart 8,186 440,249 1.9ING Baring 7,785 474,533 1.6Lombard Odier 7,772 62,180 12.5
36
SCHEDULE OF FEES AND COMMISSIONS
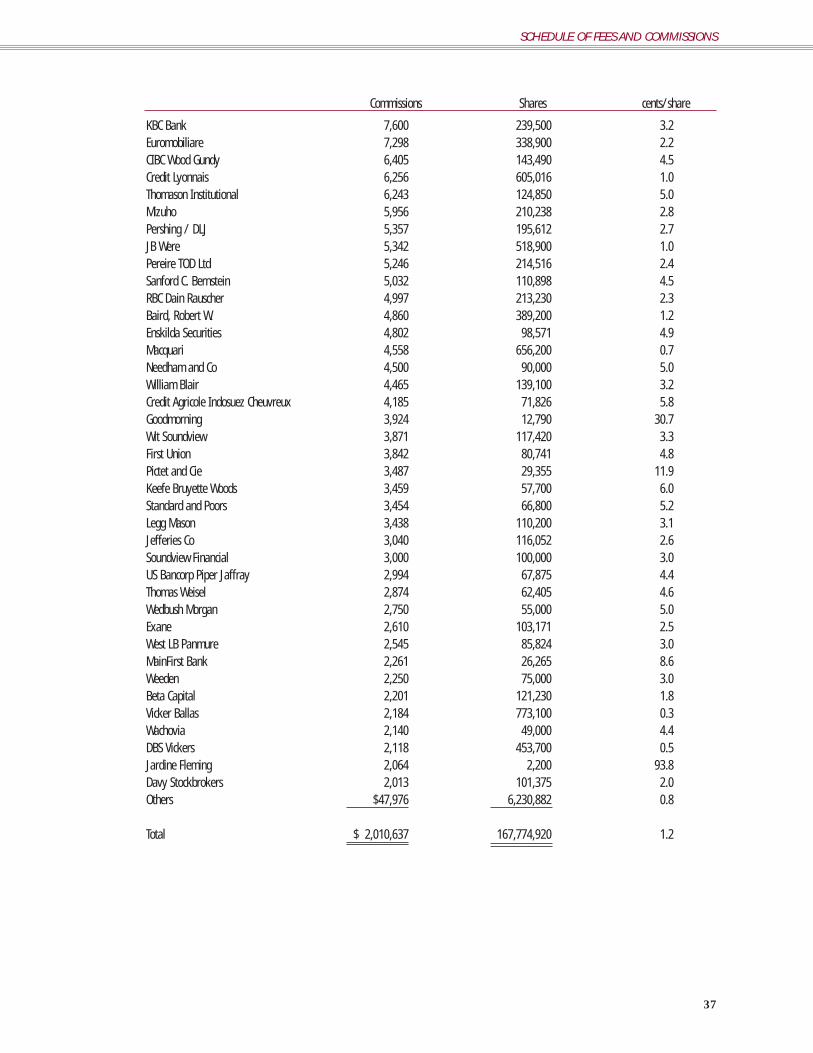
37
Commissions Shares cents/share
KBC Bank 7,600 239,500 3.2Euromobiliare 7,298 338,900 2.2CIBC Wood Gundy 6,405 143,490 4.5Credit Lyonnais 6,256 605,016 1.0Thomason Institutional 6,243 124,850 5.0Mizuho 5,956 210,238 2.8Pershing / DLJ 5,357 195,612 2.7JB Were 5,342 518,900 1.0Pereire TOD Ltd 5,246 214,516 2.4Sanford C. Bernstein 5,032 110,898 4.5RBC Dain Rauscher 4,997 213,230 2.3Baird, Robert W. 4,860 389,200 1.2Enskilda Securities 4,802 98,571 4.9Macquari 4,558 656,200 0.7Needham and Co 4,500 90,000 5.0William Blair 4,465 139,100 3.2Credit Agricole Indosuez Cheuvreux 4,185 71,826 5.8Goodmorning 3,924 12,790 30.7Wit Soundview 3,871 117,420 3.3First Union 3,842 80,741 4.8Pictet and Cie 3,487 29,355 11.9Keefe Bruyette Woods 3,459 57,700 6.0Standard and Poors 3,454 66,800 5.2Legg Mason 3,438 110,200 3.1Jefferies Co 3,040 116,052 2.6Soundview Financial 3,000 100,000 3.0US Bancorp Piper Jaffray 2,994 67,875 4.4Thomas Weisel 2,874 62,405 4.6Wedbush Morgan 2,750 55,000 5.0Exane 2,610 103,171 2.5West LB Panmure 2,545 85,824 3.0MainFirst Bank 2,261 26,265 8.6Weeden 2,250 75,000 3.0Beta Capital 2,201 121,230 1.8Vicker Ballas 2,184 773,100 0.3Wachovia 2,140 49,000 4.4DBS Vickers 2,118 453,700 0.5Jardine Fleming 2,064 2,200 93.8Davy Stockbrokers 2,013 101,375 2.0Others $47,976 6,230,882 0.8
Total $ 2,010,637 167,774,920 1.2
SCHEDULE OF FEES AND COMMISSIONS

The Coliseum, Predecessor to the Astrodome
In 1936 a small wooden hall called the Sam Houston Hall, originallybuilt for a Democratic National Convention, was razed to make way forthe Sam Houston Coliseum and Music Hall. The new arena was modern(by those days standards) and a crowd totalling 9,200 was considered a“sell out.” The Coliseum hosted such memorable events as the ShrineCircus, the Houston Fat Stock Show and Rodeo, and in later years, theBeatles and other rock’n’roll bands.
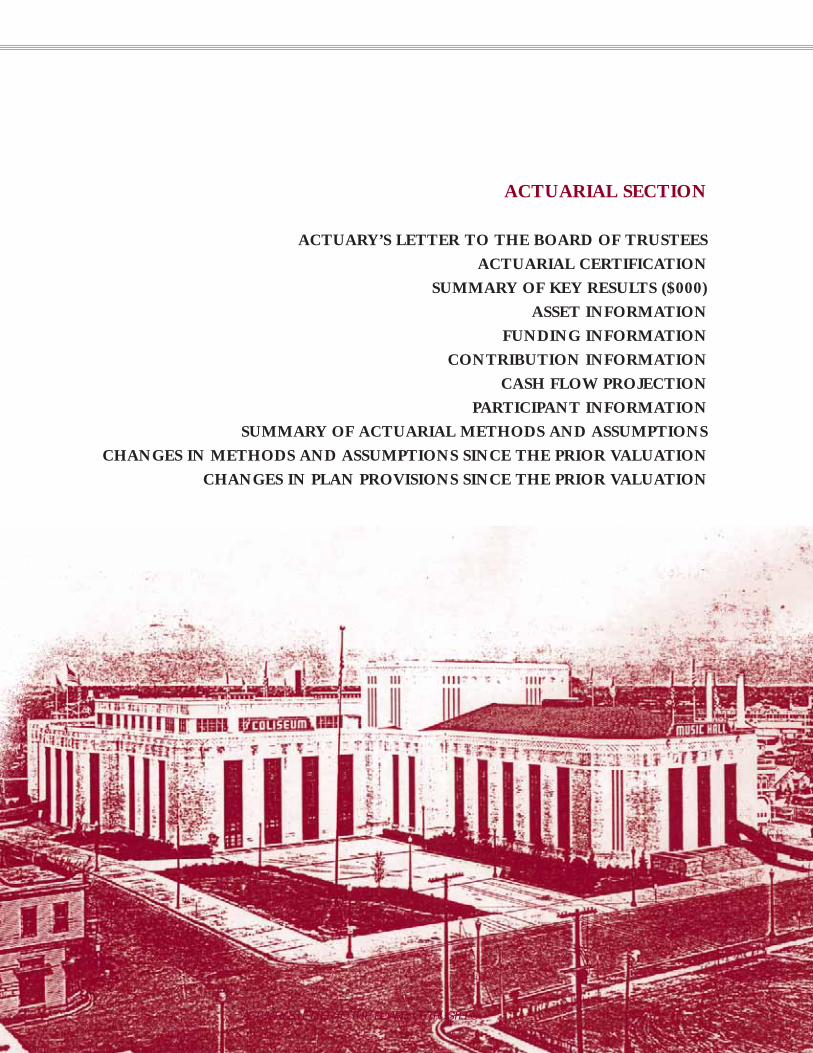
ACTUARIAL SECTION
ACTUARY’S LETTER TO THE BOARD OF TRUSTEES
ACTUARIAL CERTIFICATION
SUMMARY OF KEY RESULTS ($000)
ASSET INFORMATION
FUNDING INFORMATION
CONTRIBUTION INFORMATION
CASH FLOW PROJECTION
PARTICIPANT INFORMATION
SUMMARY OF ACTUARIAL METHODS AND ASSUMPTIONS
CHANGES IN METHODS AND ASSUMPTIONS SINCE THE PRIOR VALUATION
CHANGES IN PLAN PROVISIONS SINCE THE PRIOR VALUATION
ACTUARY’S LETTER TO THE BOARD OF TRUSTEES
Towers Perrin
November 4, 2003
Board of Trustees Houston Municipal Employees Pension System
Dear Board Members:
We certify that the information contained in this July 1, 2002 Actuarial Report for the Houston Municipal Employees PensionSystem (“the System”) has been prepared in accordance with generally accepted actuarial principles and practices. This reportdescribes the results of an actuarial valuation of the System. The System has retained Towers Perrin to perform this actuarial val-uation to determine the funding status as of July 1, 2002 and the associated actuarially determined employer contribution rate.To the best of our knowledge, the information is accurate and fairly presents the actuarial position of the System as of July 1,2002.
The consulting actuary for this report is a member of the Society of Actuaries and other professional actuarial organizationsand meets their “General Qualification Standard for Prescribed Statements of Actuarial Opinions” relating to pension plans.
In preparing the actuarial results, we have relied on information provided by the Board of Trustees regarding plan provisions,plan participants, plan assets and other matters. While the scope of our engagement did not call for us to perform an audit orindependent verification of this information, we have reviewed this information for reasonableness but we have not audited it.The accuracy of the results presented in this report depends on the accuracy and completeness of the underlying information.Historical information for the years prior to 1993 was prepared by the prior actuaries and was therefore not subject to our actu-arial review.
Considerations in Preparing Actuarial Valuations
Frequency
Actuarial valuations are prepared and adopted by the Board at least every three years. The most recent such prior actuarial val-uation adopted by the Board was prepared as of July 1, 2000.
Financing Objective of the System and Progress Toward its Realization
Contribution rates are established that, over time, are expected to remain level as a percentage of payroll. The contributionrate has been determined to provide for normal cost plus the level percentage of payroll required to amortize the unfunded actu-arial accrued liability (or surplus) over 40 years from January 1, 1983.
Note that the summary of accrued and unfunded accrued liabilities in Section II of the report illustrates the progress towardrealizing this financing objective.
Disclosure of Pension Information
Effective for fiscal years beginning July 1, 1996, the Board of Trustees has implemented the requirements of GovernmentalAccounting Standards Board (GASB) Statement No. 25. The information required to be disclosed by GASB No. 25 in the notesto the System’s financial statements is shown in Sections II and III of the report.
Data
In preparing the July 1, 2002, actuarial valuation, we relied on data provided by the Board. As part of this valuation, we test-ed the data for reasonableness. We did not, however, subject this data to any auditing procedures as indicated above.
Actuarial Methods and Assumptions
These methods and assumptions – described in Section VI of the report – were selected by the Board of Trustees. The Boardhas sole authority to determine the actuarial assumptions. Changes in actuarial methods and assumptions since the prior valua-tion are described also in Section VI. In our opinion, the actuarial assumptions used are appropriate for the purposes of the val-uation and, in the aggregate, are reasonably related to the experience of the System as of the valuation date.
The funding determination portion of the actuarial valuation has been conducted in accordance with principles of practice pre-scribed by the Actuarial Standards Board and the requirements of the Texas Government Code. Section 802.101 of the TexasGovernment Code requires the use of actuarial “assumptions and methods that are reasonable in the aggregate, considering theexperience of the program and reasonable expectations, and that, in combination, offer the actuary’s best estimate of anticipatedexperience under the program.”
We believe that the assumptions and methods used for funding purposes meet the parameters set for the disclosures presentedin the financial section by Government Accounting Standards Board (GASB) Statement No. 25.
Plan Provisions
The plan provisions used in the actuarial valuation are described in Section VI of the report. Changes in the plan provisionssince the prior valuation are described in Section VI.
ACTUARY’S LETTER TO THE BOARD OF TRUSTEES
40
Actuarial Certification
This report describes the results of an actuarial valuation of the Houston Municipal Employees Pension System. The Houston Municipal Employees Pension System retained TowersPerrin to perform this actuarial valuation for the purposes of determining the funding status and employer contributions for the plan year July 1, 2002 through June 30, 2003.
The consulting actuary is a member of the Society of Actuaries and other professional actuarial organizations and meets their "General Qualification Standard for PrescribedStatements of Actuarial Opinions" relating to pension plans.
In preparing the actuarial results, we have relied upon information provided by the Board of Trustees regarding plan provisions, plan participants, plan assets, and other matters.While the scope of our engagement did not call for us to perform an audit or independent verification of this information, we have reviewed this information for reasonablenessbut have not audited it. The accuracy of the results presented in this report is dependent upon the accuracy and completeness of the underlying information. Historical informa-tion for years prior to 1986 was prepared by the prior actuaries and was not subjected to our actuarial review.
The actuarial methods and assumptions used in this valuation were selected by the Board of Trustees. The Board has sole authority to determine the actuarial assumptions. Inour opinion, the actuarial assumptions used are appropriate for purposes of this valuation and, in the aggregate, are reasonably related to the experience of the Fund as of thevaluation date.
Towers Perrin understands that an experience study of the System is contemplated prior to completion of the July 1, 2003 actuarial valuation. An experience study will examineactual experience in relation to all of the actuarial assumptions for the purpose of assisting the Board in re-evaluating the reasonableness of the assumptions. In particular, a studywill examine the experience of members changing Service Group elections from Group B to Group A and retroactively changing service elections to Group A through a purchaseelection. Currently, members are assumed to remain in their current Group election. In the event an experience study and reasonable expectations indicate that future serviceelection changes are to be expected, we will recommend changes to the actuarial assumptions and, as appropriate, to the actuarially determined City contribution rate.
The funding determination portion of this actuarial valuation has been conducted in accordance with principles of practice prescribed by the Actuarial Standards Board and therequirements of the Texas Government Code. Section 802.101 of the Texas Government Code requires the use of actuarial "assumptions and methods that are reasonable in theaggregate, considering the experience of the program and reasonable expectations, and that, in combination, offer the actuary’s best estimate of anticipated experience under theprogram."
The results shown in this report are reasonable actuarial results. However, a different set of results could also be considered reasonable actuarial results, since the ActuarialStandards of Practice describe a "best-estimate range" for each assumption, rather than a single best-estimate value. Thus, reasonable results differing from those presented in thisreport could have been developed by selecting different points within the best-estimate ranges for various assumptions.
The information contained in this report was prepared for the internal use of the Houston Municipal Employees Pension System and its auditors in connection with our actuarial val-uation of the pension plan. It is not intended nor necessarily suitable for other purposes and may not be relied on by third parties.
Towers Perrin
Adam Berk, A.S.A., C.F.A., E. A., M.A.A.A.
September, 2003
41
Towers Perrin understands that an experience study of the System is contemplated prior to completion of the July 1, 2003 actu-arial valuation. The experience study would examine actual experience in relation to all of the actuarial assumptions for the pur-pose of assisting the Board in re-evaluating the reasonableness of the assumptions. In particular, the study would examine theexperience of members changing Service Group elections from Group B to Group A and retroactively changing service electionsto Group A through a purchase election. Currently, members are assumed to remain in their current Group election. In the eventthe experience study and reasonable expectations indicate that future service election changes are to be expected, we will recom-mend changes to the actuarial assumptions and, as appropriate, to the actuarially determined City contribution rate.
Results shown in this report are reasonable actuarial results. However, a different set of results could also be considered rea-sonable actuarial results, since the Actuarial Standards of Practice describe a "best-estimate range" for each assumption, ratherthan a single best-estimate value. Thus, reasonable results differing from those presented in this report could have been developedby selecting different points within the best-estimate ranges for various assumptions.
We are available to answer any questions on the information contained in the report, or to provide any additional informationyou may need.
Sincerely,
Adam Berk, A.S.A., C.F.A., E. A., M.A.A.A.
ACTUARIAL CERTIFICATION
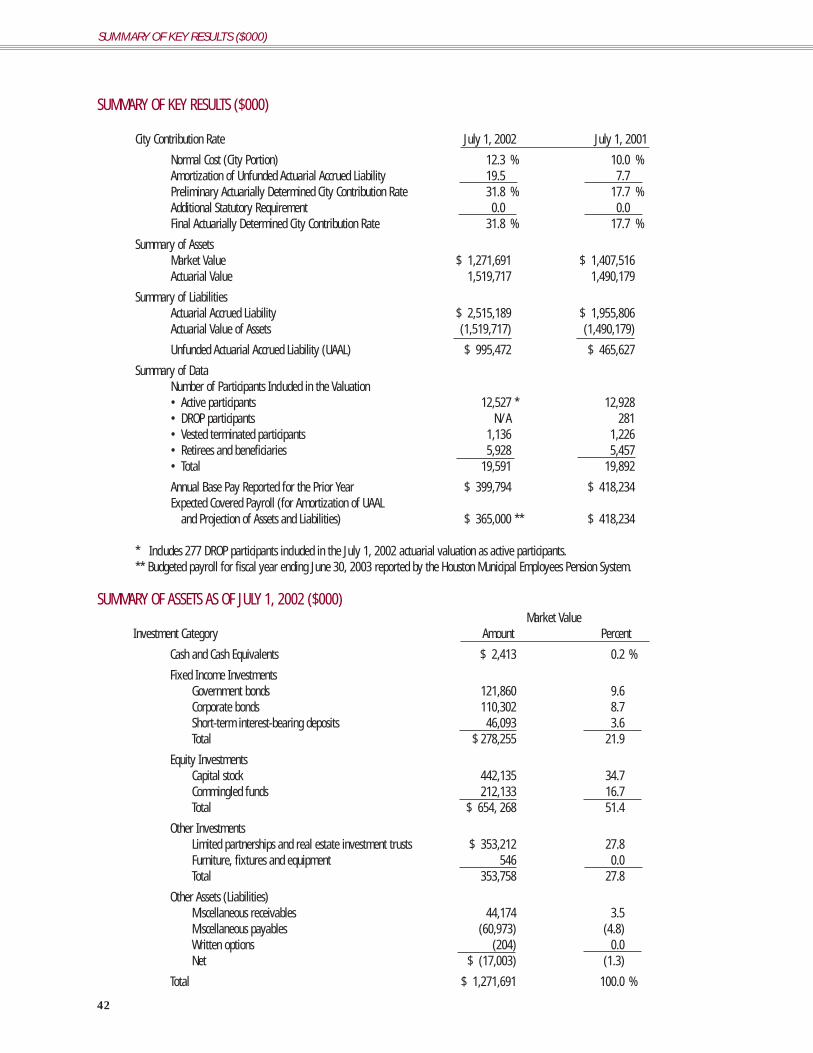
42
SUMMARY OF KEY RESULTS ($000)
City Contribution Rate July 1, 2002 July 1, 2001
Normal Cost (City Portion) 12.3 % 10.0 %Amortization of Unfunded Actuarial Accrued Liability 19.5 7.7Preliminary Actuarially Determined City Contribution Rate 31.8 % 17.7 %Additional Statutory Requirement 0.0 0.0Final Actuarially Determined City Contribution Rate 31.8 % 17.7 %
Summary of AssetsMarket Value $ 1,271,691 $ 1,407,516 Actuarial Value 1,519,717 1,490,179
Summary of LiabilitiesActuarial Accrued Liability $ 2,515,189 $ 1,955,806 Actuarial Value of Assets (1,519,717) (1,490,179)
Unfunded Actuarial Accrued Liability (UAAL) $ 995,472 $ 465,627
Summary of DataNumber of Participants Included in the Valuation• Active participants 12,527 * 12,928• DROP participants N/A 281• Vested terminated participants 1,136 1,226• Retirees and beneficiaries 5,928 5,457• Total 19,591 19,892
Annual Base Pay Reported for the Prior Year $ 399,794 $ 418,234Expected Covered Payroll (for Amortization of UAAL
and Projection of Assets and Liabilities) $ 365,000 ** $ 418,234
* Includes 277 DROP participants included in the July 1, 2002 actuarial valuation as active participants. ** Budgeted payroll for fiscal year ending June 30, 2003 reported by the Houston Municipal Employees Pension System.
SUMMARY OF ASSETS AS OF JULY 1, 2002 ($000)Market Value
Investment Category Amount Percent
Cash and Cash Equivalents $ 2,413 0.2 %
Fixed Income InvestmentsGovernment bonds 121,860 9.6 Corporate bonds 110,302 8.7 Short-term interest-bearing deposits 46,093 3.6 Total $ 278,255 21.9
Equity InvestmentsCapital stock 442,135 34.7 Commingled funds 212,133 16.7Total $ 654, 268 51.4
Other InvestmentsLimited partnerships and real estate investment trusts $ 353,212 27.8 Furniture, fixtures and equipment 546 0.0Total 353,758 27.8
Other Assets (Liabilities)Miscellaneous receivables 44,174 3.5Miscellaneous payables (60,973) (4.8)Written options (204) 0.0Net $ (17,003) (1.3)
Total $ 1,271,691 100.0 %
SUMMARY OF KEY RESULTS ($000)
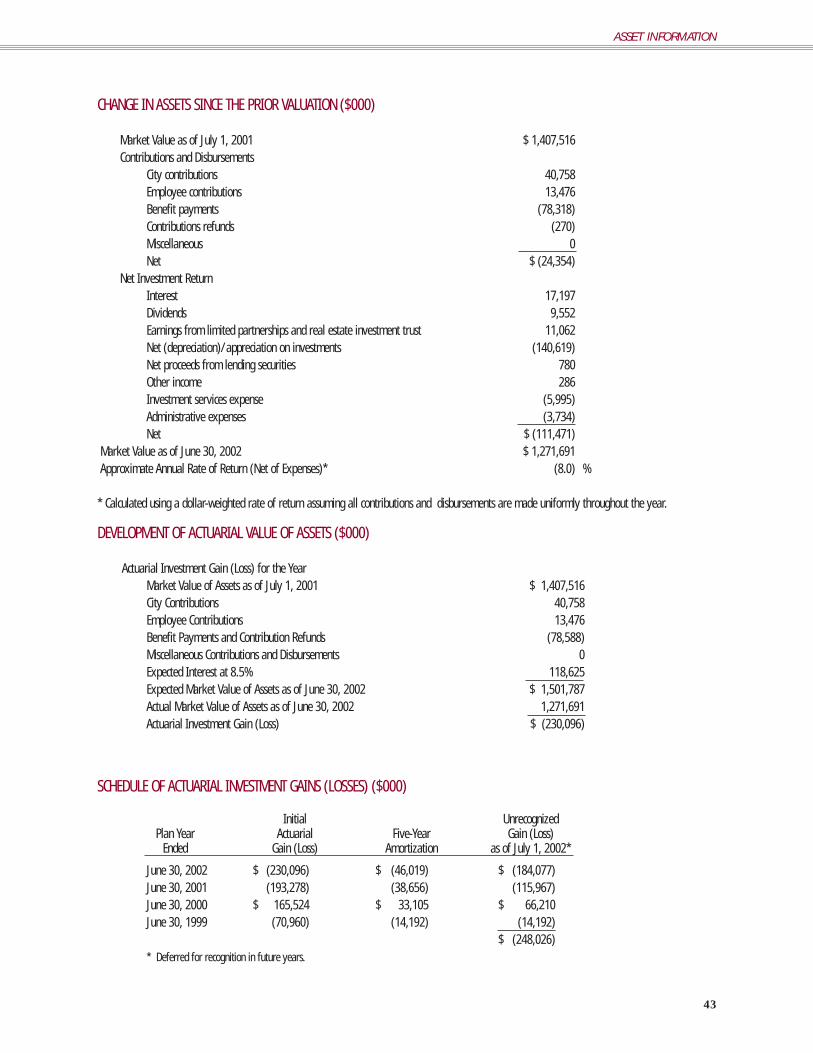
43
CHANGE IN ASSETS SINCE THE PRIOR VALUATION ($000)
Market Value as of July 1, 2001 $ 1,407,516 Contributions and Disbursements
City contributions 40,758 Employee contributions 13,476 Benefit payments (78,318) Contributions refunds (270) Miscellaneous 0 Net $ (24,354)
Net Investment Return Interest 17,197 Dividends 9,552 Earnings from limited partnerships and real estate investment trust 11,062 Net (depreciation)/appreciation on investments (140,619) Net proceeds from lending securities 780 Other income 286 Investment services expense (5,995) Administrative expenses (3,734) Net $ (111,471)
Market Value as of June 30, 2002 $ 1,271,691 Approximate Annual Rate of Return (Net of Expenses)* (8.0) %
* Calculated using a dollar-weighted rate of return assuming all contributions and disbursements are made uniformly throughout the year.
DEVELOPMENT OF ACTUARIAL VALUE OF ASSETS ($000)
Actuarial Investment Gain (Loss) for the Year Market Value of Assets as of July 1, 2001 $ 1,407,516 City Contributions 40,758 Employee Contributions 13,476 Benefit Payments and Contribution Refunds (78,588) Miscellaneous Contributions and Disbursements 0 Expected Interest at 8.5% 118,625 Expected Market Value of Assets as of June 30, 2002 $ 1,501,787 Actual Market Value of Assets as of June 30, 2002 1,271,691 Actuarial Investment Gain (Loss) $ (230,096)
SCHEDULE OF ACTUARIAL INVESTMENT GAINS (LOSSES) ($000)
Initial Unrecognized Plan Year Actuarial Five-Year Gain (Loss)
Ended Gain (Loss) Amortization as of July 1, 2002*
June 30, 2002 $ (230,096) $ (46,019) $ (184,077) June 30, 2001 (193,278) (38,656) (115,967) June 30, 2000 $ 165,524 $ 33,105 $ 66,210June 30, 1999 (70,960) (14,192) (14,192)
$ (248,026)* Deferred for recognition in future years.
ASSET INFORMATION
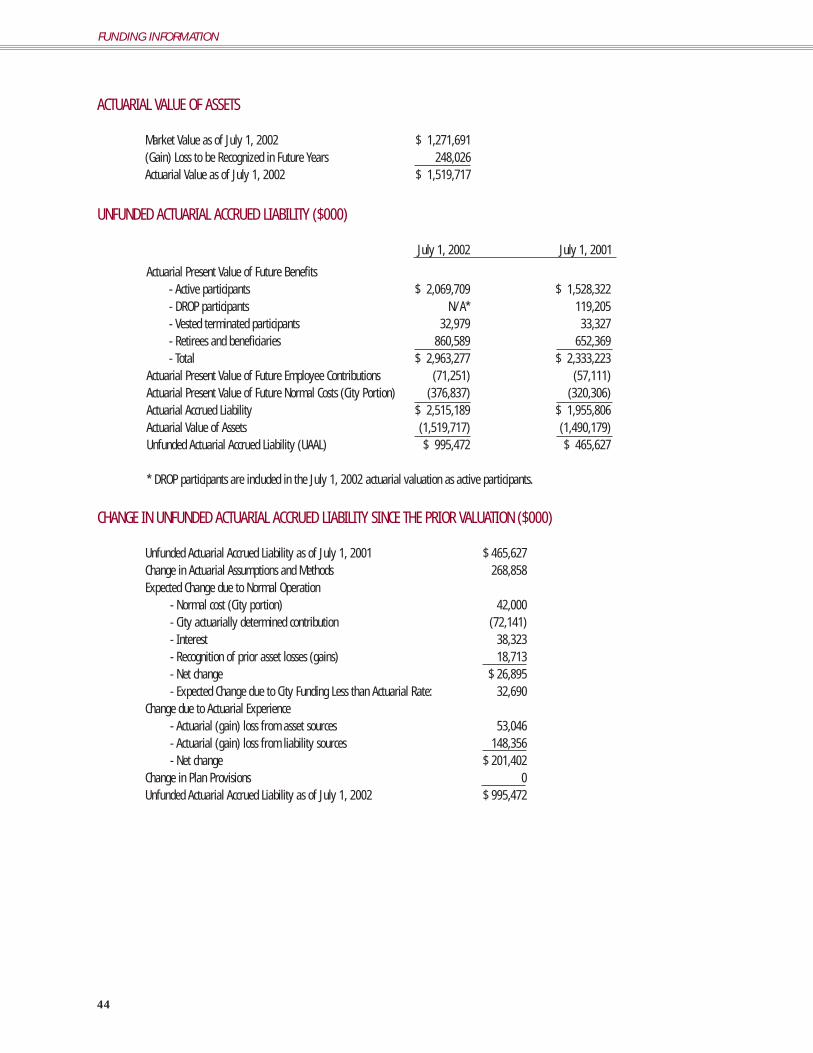
44
ACTUARIAL VALUE OF ASSETS
Market Value as of July 1, 2002 $ 1,271,691 (Gain) Loss to be Recognized in Future Years 248,026 Actuarial Value as of July 1, 2002 $ 1,519,717
UNFUNDED ACTUARIAL ACCRUED LIABILITY ($000)
July 1, 2002 July 1, 2001
Actuarial Present Value of Future Benefits - Active participants $ 2,069,709 $ 1,528,322 - DROP participants N/A* 119,205 - Vested terminated participants 32,979 33,327 - Retirees and beneficiaries 860,589 652,369 - Total $ 2,963,277 $ 2,333,223
Actuarial Present Value of Future Employee Contributions (71,251) (57,111) Actuarial Present Value of Future Normal Costs (City Portion) (376,837) (320,306) Actuarial Accrued Liability $ 2,515,189 $ 1,955,806 Actuarial Value of Assets (1,519,717) (1,490,179) Unfunded Actuarial Accrued Liability (UAAL) $ 995,472 $ 465,627
* DROP participants are included in the July 1, 2002 actuarial valuation as active participants.
CHANGE IN UNFUNDED ACTUARIAL ACCRUED LIABILITY SINCE THE PRIOR VALUATION ($000)
Unfunded Actuarial Accrued Liability as of July 1, 2001 $ 465,627 Change in Actuarial Assumptions and Methods 268,858 Expected Change due to Normal Operation
- Normal cost (City portion) 42,000 - City actuarially determined contribution (72,141) - Interest 38,323 - Recognition of prior asset losses (gains) 18,713 - Net change $ 26,895 - Expected Change due to City Funding Less than Actuarial Rate: 32,690
Change due to Actuarial Experience - Actuarial (gain) loss from asset sources 53,046 - Actuarial (gain) loss from liability sources 148,356 - Net change $ 201,402
Change in Plan Provisions 0 Unfunded Actuarial Accrued Liability as of July 1, 2002 $ 995,472
FUNDING INFORMATION
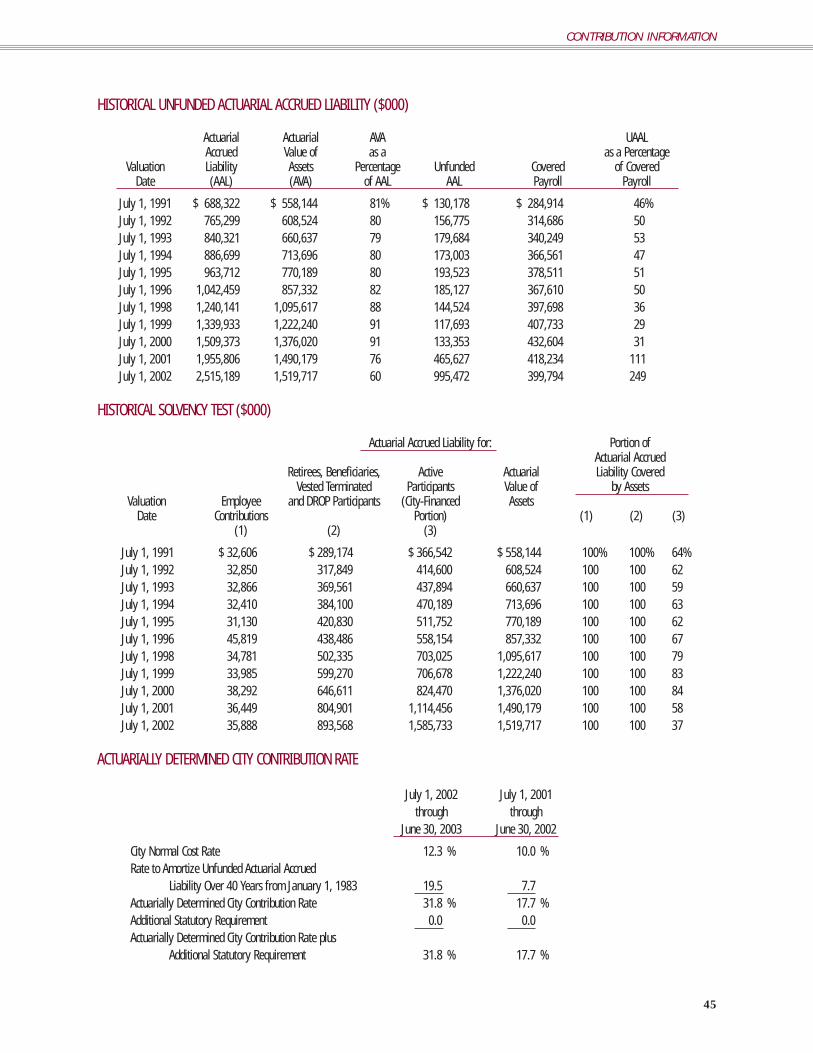
45
HISTORICAL UNFUNDED ACTUARIAL ACCRUED LIABILITY ($000)
Actuarial Actuarial AVA UAALAccrued Value of as a as a Percentage
Valuation Liability Assets Percentage Unfunded Covered of CoveredDate (AAL) (AVA) of AAL AAL Payroll Payroll
July 1, 1991 $ 688,322 $ 558,144 81% $ 130,178 $ 284,914 46%July 1, 1992 765,299 608,524 80 156,775 314,686 50July 1, 1993 840,321 660,637 79 179,684 340,249 53July 1, 1994 886,699 713,696 80 173,003 366,561 47July 1, 1995 963,712 770,189 80 193,523 378,511 51July 1, 1996 1,042,459 857,332 82 185,127 367,610 50July 1, 1998 1,240,141 1,095,617 88 144,524 397,698 36July 1, 1999 1,339,933 1,222,240 91 117,693 407,733 29July 1, 2000 1,509,373 1,376,020 91 133,353 432,604 31July 1, 2001 1,955,806 1,490,179 76 465,627 418,234 111July 1, 2002 2,515,189 1,519,717 60 995,472 399,794 249
HISTORICAL SOLVENCY TEST ($000)
Actuarial Accrued Liability for: Portion ofActuarial Accrued
Retirees, Beneficiaries, Active Actuarial Liability CoveredVested Terminated Participants Value of by Assets
Valuation Employee and DROP Participants (City-Financed AssetsDate Contributions Portion) (1) (2) (3)
(1) (2) (3)
July 1, 1991 $ 32,606 $ 289,174 $ 366,542 $ 558,144 100% 100% 64%July 1, 1992 32,850 317,849 414,600 608,524 100 100 62July 1, 1993 32,866 369,561 437,894 660,637 100 100 59July 1, 1994 32,410 384,100 470,189 713,696 100 100 63July 1, 1995 31,130 420,830 511,752 770,189 100 100 62July 1, 1996 45,819 438,486 558,154 857,332 100 100 67July 1, 1998 34,781 502,335 703,025 1,095,617 100 100 79July 1, 1999 33,985 599,270 706,678 1,222,240 100 100 83July 1, 2000 38,292 646,611 824,470 1,376,020 100 100 84July 1, 2001 36,449 804,901 1,114,456 1,490,179 100 100 58July 1, 2002 35,888 893,568 1,585,733 1,519,717 100 100 37
ACTUARIALLY DETERMINED CITY CONTRIBUTION RATE
July 1, 2002 July 1, 2001through through
June 30, 2003 June 30, 2002
City Normal Cost Rate 12.3 % 10.0 % Rate to Amortize Unfunded Actuarial Accrued
Liability Over 40 Years from January 1, 1983 19.5 7.7 Actuarially Determined City Contribution Rate 31.8 % 17.7 % Additional Statutory Requirement 0.0 0.0 Actuarially Determined City Contribution Rate plus
Additional Statutory Requirement 31.8 % 17.7 %
CONTRIBUTION INFORMATION
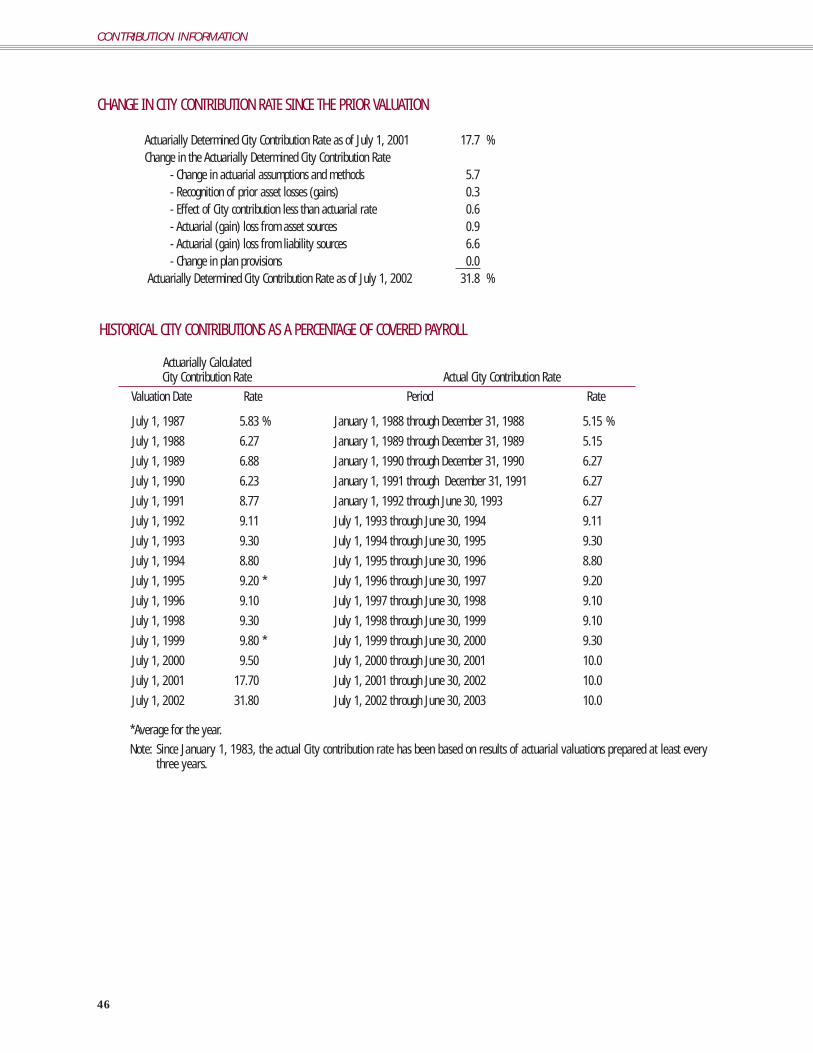
46
CONTRIBUTION INFORMATION
CHANGE IN CITY CONTRIBUTION RATE SINCE THE PRIOR VALUATION
Actuarially Determined City Contribution Rate as of July 1, 2001 17.7 % Change in the Actuarially Determined City Contribution Rate
- Change in actuarial assumptions and methods 5.7 - Recognition of prior asset losses (gains) 0.3 - Effect of City contribution less than actuarial rate 0.6 - Actuarial (gain) loss from asset sources 0.9 - Actuarial (gain) loss from liability sources 6.6 - Change in plan provisions 0.0
Actuarially Determined City Contribution Rate as of July 1, 2002 31.8 %
HISTORICAL CITY CONTRIBUTIONS AS A PERCENTAGE OF COVERED PAYROLL
Actuarially Calculated City Contribution Rate Actual City Contribution Rate
Valuation Date Rate Period Rate
July 1, 1987 5.83 % January 1, 1988 through December 31, 1988 5.15 %
July 1, 1988 6.27 January 1, 1989 through December 31, 1989 5.15
July 1, 1989 6.88 January 1, 1990 through December 31, 1990 6.27
July 1, 1990 6.23 January 1, 1991 through December 31, 1991 6.27
July 1, 1991 8.77 January 1, 1992 through June 30, 1993 6.27
July 1, 1992 9.11 July 1, 1993 through June 30, 1994 9.11
July 1, 1993 9.30 July 1, 1994 through June 30, 1995 9.30
July 1, 1994 8.80 July 1, 1995 through June 30, 1996 8.80
July 1, 1995 9.20 * July 1, 1996 through June 30, 1997 9.20
July 1, 1996 9.10 July 1, 1997 through June 30, 1998 9.10
July 1, 1998 9.30 July 1, 1998 through June 30, 1999 9.10
July 1, 1999 9.80 * July 1, 1999 through June 30, 2000 9.30
July 1, 2000 9.50 July 1, 2000 through June 30, 2001 10.0
July 1, 2001 17.70 July 1, 2001 through June 30, 2002 10.0
July 1, 2002 31.80 July 1, 2002 through June 30, 2003 10.0
*Average for the year. Note: Since January 1, 1983, the actual City contribution rate has been based on results of actuarial valuations prepared at least every
three years.

47
PROJECTION OF ESTIMATED ASSETS AND LIABILITIES ($000)
Market Value UnfundedYear Annual Actuarially City of Assets at Actuarial
Beginning Covered Determined Contribution City Employee Benefit Net Cash Beginning Liability atJuly1 Payroll Rate (1) Rate Contribution Contributions Payments Flow of Year Beginning of Year
2002 $ 365,000 17.7 % 10.0 % $ 36,500 $ 8,178 $ 95,856 $ (51,178) $ 1,271,691 $ 995,472
2003 375,000 31.8 14.7 55,125 8,402 103,266 (39,739) 1,326,475 1,175,680
2004 391,875 35.5 35.5 139,116 8,780 113,865 34,031 1,397,832 1,333,305
2005 409,509 38.3 38.3 156,842 9,175 127,018 38,999 1,552,094 1,447,724
2006 427,937 40.5 40.5 173,315 9,588 142,535 40,368 1,724,644 1,509,810
2007 447,194 41.7 41.7 186,480 10,019 151,494 45,005 1,913,287 1,512,446
2008 467,318 41.8 41.8 195,339 10,470 167,966 37,843 2,122,796 1,504,059
2009 488,348 41.8 41.8 204,129 10,941 186,026 29,044 2,342,652 1,488,311
2010 510,323 41.8 41.8 213,315 11,433 202,567 22,181 2,572,031 1,464,762
2011 533,288 41.7 41.7 222,381 11,948 226,120 8,209 2,813,758 1,432,460
(1) Based on actuarially determined rate from the prior year’s valuation.
The projection is based on the economic and demographic assumptions summarized in Section VI, including an 8.5% investment return beginning as of July 1,2002. The total covered payroll is assumed to be $365 million for fiscal year 2003 and $375 million for fiscal year 2004, increasing by 4.5% per year thereafter.As actual economic (such as the actual investment return from July 1, 2002 through June 30, 2003) and demographic experience vary, the results will change.
The projection assumes the Assumptions and Methods and the Plan Provisions as summarized in Section VI do not change throughout the projection period.
This projection is incomplete without the accompanying report.
CONTRIBUTION INFORMATION
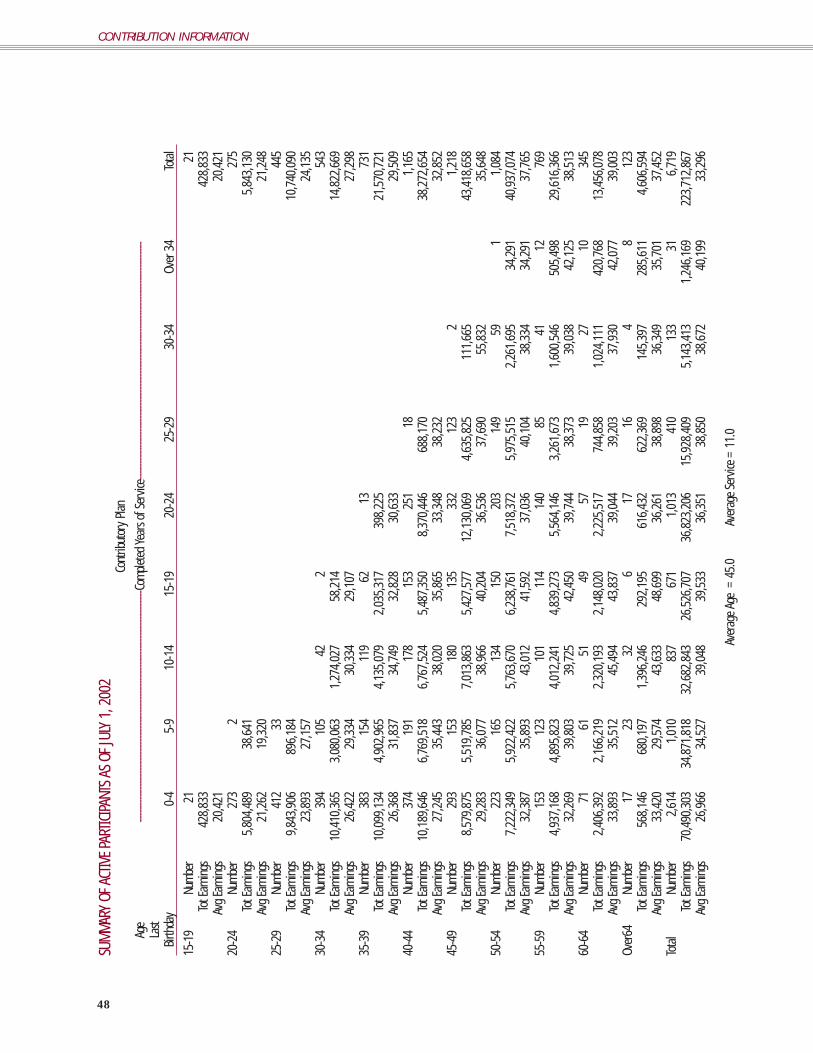
CONTRIBUTION INFORMATION
48
SUMM
ARY
OF A
CTIV
E PAR
TICIPA
NTS A
S OF J
ULY
1, 2
002
Cont
ribut
ory
Plan
Age
------
------
------
------
------
------
------
------
------
------
------
------
Comp
leted
Year
s of S
ervic
e----
------
------
------
------
------
------
------
------
------
------
------
----
Last
Birth
day
0-4
5-9
10-1
415
-19
20-2
425
-29
30-3
4Ov
er 3
4To
tal
15-1
9Nu
mber
2121
Tot E
arnin
gs42
8,83
342
8,83
3Av
g Ea
rning
s20
,421
20,4
2120
-24
Numb
er27
32
275
Tot E
arnin
gs5,
804,
489
38,6
415,
843,
130
Avg
Earn
ings
21,2
6219
,320
21,2
4825
-29
Numb
er41
233
445
Tot E
arnin
gs9,
843,
906
896,
184
10,7
40,0
90Av
g Ea
rning
s23
,893
27,1
5724
,135
30-3
4Nu
mber
394
105
422
543
Tot E
arnin
gs
10,4
10,3
65
3,08
0,06
3 1,
274,
027
58,2
14
14,8
22,6
69
Avg
Earn
ings
26,4
22
29,3
34
30,3
34
29,1
07
27,2
98
35-3
9Nu
mber
383
154
119
6213
731
Tot E
arnin
gs
10,0
99,1
34
4,90
2,96
5 4,
135,
079
2,03
5,31
7 39
8,22
5 21
,570
,721
Av
g Ea
rning
s 26
,368
31
,837
34
,749
32
,828
30
,633
29
,509
40
-44
Numb
er37
419
117
815
325
118
1,16
5To
t Ear
nings
10
,189
,646
6,
769,
518
6,76
7,52
4 5,
487,
350
8,37
0,44
6 68
8,17
0 38
,272
,654
Av
g Ea
rning
s 27
,245
35
,443
38
,020
35
,865
33
,348
38
,232
32
,852
45
-49
Numb
er29
315
318
013
533
212
32
1,21
8To
t Ear
nings
8,
579,
875
5,51
9,78
5 7,
013,
863
5,42
7,57
7 12
,130
,069
4,
635,
825
111,
665
43,4
18,6
58
Avg
Earn
ings
29,2
83
36,0
77
38,9
66
40,2
04
36,5
36
37,6
90
55,8
32
35,6
48
50-5
4Nu
mber
223
165
134
150
203
149
591
1,08
4To
t Ear
nings
7,
222,
349
5,92
2,42
2 5,
763,
670
6,23
8,76
17,
518,
372
5,97
5,51
5 2,
261,
695
34,2
91
40,9
37,0
74
Avg
Earn
ings
32,3
8735
,893
43,0
1241
,592
37,0
3640
,104
38,3
3434
,291
37,7
6555
-59
Numb
er15
312
310
111
414
085
4112
769
Tot E
arnin
gs
4,93
7,16
8 4,
895,
823
4,01
2,24
1 4,
839,
273
5,56
4,14
6 3,
261,
673
1,60
0,54
6 50
5,49
8 29
,616
,366
Av
g Ea
rning
s32
,269
39,8
0339
,725
42,4
5039
,744
38,3
7339
,038
42,1
2538
,513
60-6
4Nu
mber
7161
5149
5719
2710
345
Tot E
arnin
gs
2,40
6,39
2 2,
166,
219
2,32
0,19
3 2,
148,
020
2,22
5,51
7 74
4,85
8 1,
024,
111
420,
768
13,4
56,0
78
Avg
Earn
ings
33,8
9335
,512
45,4
9443
,837
39,0
4439
,203
37,9
3042
,077
39,0
03Ov
er64
Numb
er17
2332
617
164
812
3To
t Ear
nings
56
8,14
6 68
0,19
7 1,
396,
246
292,
195
616,
432
622,
369
145,
397
285,
611
4,60
6,59
4 Av
g Ea
rning
s33
,420
29,5
7443
,633
48,6
9936
,261
38,8
9836
,349
35,7
0137
,452
Tota
lNu
mber
2,61
41,
010
837
671
1,01
341
013
331
6,71
9To
t Ear
nings
70
,490
,303
34
,871
,818
32
,682
,843
26
,526
,707
36
,823
,206
15
,928
,409
5,
143,
413
1,24
6,16
9 22
3,71
2,86
7 Av
g Ea
rning
s26
,966
34,5
2739
,048
39,5
3336
,351
38,8
5038
,672
40,1
9933
,296
Aver
age A
ge =
45.
0
Ave
rage
Serv
ice =
11.
0

SUMM
ARY
OF A
CTIV
E PAR
TICIPA
NTS A
S OF J
ULY
1, 2
002
(cont
.)No
ncon
tribu
tory
Plan
Age
------
------
------
------
------
------
------
------
------
------
------
------
Comp
leted
Year
s of S
ervic
e----
------
------
------
------
------
------
------
------
------
------
------
----
Last
Birth
day
0-4
5-9
10-1
415
-19
20-2
425
-29
30-3
4Ov
er 3
4To
tal
15-1
9Nu
mber
To
t Ear
nings
Av
g Ea
rning
s 20
-24
Nu
mber
5313
66
Tot E
arnin
gs1,
107,
819
307,
751
1,41
5,57
1 Av
g Ea
rning
s20
,902
23,6
7321
,448
25
-29
Numb
er15
714
82
307
Tot E
arnin
gs3,
529,
462
3,72
0,84
957
,216
7,30
7,52
7 Av
g Ea
rning
s22
,481
25,1
4128
,608
23
,803
30
-34
Nu
mber
179
371
154
170
5 To
t Ear
nings
4,62
1,85
810
,003
,759
4,05
1,09
443
,708
18,7
20,4
20
Avg
Earn
ings
25,8
2026
,964
26,3
0643
,708
26,5
54
35-3
9
Numb
er
154
34
7
338
87
18
94
4 To
t Ear
nings
4,
000,
612
10
,079
,471
9,
790,
577
2,
466,
266
550,
475
26,8
87,4
00
Avg
Earn
ings
25,9
78
29
,047
28,9
66
28
,348
30,5
82
28,4
82
40-4
4
Numb
er
139
31
8
308
17
2
125
1,
062
Tot E
arnin
gs
3,85
9,61
2
9,43
5,19
4
9,84
1,24
6
5,24
3,76
8
3,92
3,87
0
32,3
03,6
92
Avg
Earn
ings
27,7
67
29
,670
31,9
52
30
,487
31,3
91
30,4
18
45-4
9
Numb
er
127
31
5
265
16
8
13
2
35
1,04
2 To
t Ear
nings
3,
750,
780
9,
634,
296
9,
017,
232
5,
582,
001
4,
333,
015
1,
271,
920
33
,589
,244
Av
g Ea
rning
s
29
,534
30,5
85
34
,027
33,2
26
32
,826
36,3
41
32,2
35
50-5
4
Numb
er
67
25
3
215
15
4
80
36
10
81
5 To
t Ear
nings
2,
037,
378
8,
144,
952
7,
154,
306
5,
428,
073
2,
716,
931
1,
227,
058
324,
845
27
,033
,542
Av
g Ea
rning
s
30
,409
32,1
93
33
,276
35,2
47
33
,962
34,0
85
32
,484
33
,170
55
-59
Nu
mber
45
16
5
160
10
3
50
26
8
2
559
Tot E
arnin
gs
1,36
3,97
9
5,29
9,20
9
5,18
1,69
6
3,73
7,14
9
1,80
4,36
7
96
7,65
0
22
1,19
1
57
,598
18
,632
,840
Av
g Ea
rning
s
30
,311
32,1
16
32
,386
36,2
83
36
,087
37,2
1727
,649
28
,799
33
,332
60
-64
Nu
mber
13
65
68
41
17
4
4
21
2 To
t Ear
nings
37
2,00
1
2,03
9,47
2
2,24
0,18
0
1,29
5,11
6
724,
762
14
4,57
8
132,
915
6,
949,
023
Avg
Earn
ings
28
,615
31
,376
32
,944
31,5
88
42,6
33
36,1
44
33,2
29
32,7
78
Over
64
Numb
er
4
28
27
19
10
6
2
96
To
t Ear
nings
13
8,85
0
855,
051
85
1,60
7
741,
848
362,
939
18
3,41
8
108,
078
3,
241,
792
Avg
Earn
ings
34
,713
30
,538
31
,541
39
,045
36
,294
30
,570
54,0
39
33
,769
To
tal
Numb
er
93
8
2,02
3
1,53
7
745
43
2
10
7
24
2
5,
808
Tot E
arnin
gs
24,7
82,3
52
59,5
20,0
04
48,1
85,1
55
24,5
37,9
28
14,4
16,3
603,
794,
624
78
7,02
9
57,5
98
176,
081,
051
Avg
Earn
ings
26
,420
29,4
22
31,3
50
32,9
37
33
,371
35
,464
32
,793
28
,799
30
,317
Aver
age A
ge =
44.
4
Ave
rage
Serv
ice =
11.
1
CONTRIBUTION INFORMATION
49

50
CONTRIBUTION INFORMATION
SUMM
ARY
OF A
CTIV
E PAR
TICIPA
NTS A
S OF J
ULY
1, 2
002
(cont
.)To
tal
Age
------
------
------
------
------
------
------
------
------
------
------
------
Comp
leted
Year
s of S
ervic
e----
------
------
------
------
------
------
------
------
------
------
------
----
Last
Birth
day
0-4
5-9
10-1
415
-19
20-2
425
-29
30-3
4Ov
er 3
4To
tal
15-1
9
Numb
er
21
21
To
t Ear
nings
428,
833
428,
833
Avg
Earn
ings
20
,421
20
,421
20
-24
Nu
mber
326
15
34
1 To
t Ear
nings
6,
912,
309
34
6,39
2
7,
258,
701
Avg
Earn
ings
21
,203
23,0
93
21
,287
25
-29
Nu
mber
56
9
18
1
2
752
Tot E
arnin
gs
13,3
73,3
68
4,61
7,03
3
57,2
16
18
,047
,617
Av
g Ea
rning
s
23,5
03
25,5
08
28,6
0823
,999
30
-34
Nu
mber
57
3
476
19
6
3
1,24
8 To
t Ear
nings
15
,032
,224
13
,083
,822
5,
325,
121
10
1,92
2
33,5
43,0
89
Avg
Earn
ings
26
,234
27
,487
27
,169
33
,974
26
,877
35
-39
Nu
mber
537
501
45
7
14
9
31
1,67
5 To
t Ear
nings
14
,099
,746
14
,982
,437
13
,925
,655
4,
501,
583
94
8,70
0
48,4
58,1
21
Avg
Earn
ings
26
,257
29
,905
30
,472
30
,212
30
,603
28,9
30
40-4
4
Numb
er
51
3
50
9
48
6
32
5
37
6
18
2,22
7 To
t Ear
nings
14
,049
,258
16
,204
,712
16
,608
,770
10
,731
,118
12
,294
,316
688,
170
70
,576
,346
Av
g Ea
rning
s 27
,386
31
,836
34,1
74
33,0
19
32
,698
38
,232
31,6
91
45-4
9
Numb
er
42
0
468
445
303
46
4
15
8
2
2,26
0 To
t Ear
nings
12
,330
,654
15
,154
,081
16
,031
,095
11
,009
,578
16
,463
,084
5,
907,
745
11
1,66
5
77,0
07,9
02
Avg
Earn
ings
29
,359
32
,381
36
,025
36
,335
35
,481
37
,391
55,8
32
34,0
74
50-5
4
Numb
er
29
0
418
349
30
4
283
18
5
69
1
1,
899
Tot E
arnin
gs
9,25
9,72
6 14
,067
,375
12
,917
,976
11
,666
,834
10
,235
,302
7,
202,
572
2,
586,
539
34,2
9167
,970
,616
Av
g Ea
rning
s
31
,930
33
,654
37
,014
38
,378
36,1
67
38
,933
37
,486
34,2
91
35
,793
55
-59
Nu
mber
19
8
28
8
261
21
7
19
0
11
1 49
14
1,
328
Tot E
arnin
gs
6,30
1,14
7 10
,195
,031
9,19
3,93
7 8,
576,
422
7,36
8,51
3
4,22
9,32
3
1,82
1,73
7
563,
096
48,2
49,2
06
Avg
Earn
ings
31
,824
35
,399
35
,226
39
,523
38,7
82
38
,102
37,1
78
40,2
21
36,3
32
60-6
4
Numb
er
84
12
6
11
9
90
74
23
31
10
557
Tot E
arnin
gs
2,77
8,39
3 4,
205,
691
4,
560,
374
3,44
3,13
5 2,
950,
279
889,
435
1,
157,
026
420,
768
20
,405
,101
Av
g Ea
rning
s
33,0
76
33,3
78
38
,322
38,2
57
39
,869
38
,671
37
,323
42,0
77
36
,634
Ov
er 6
4 Nu
mber
21
51
59
25
27
22
6
8
21
9 To
t Ear
nings
706,
996
1,
535,
249
2,
247,
853
1,
034,
042
97
9,37
1
805,
787
25
3,47
5
285,
611
7,
848,
386
Avg
Earn
ings
33
,666
30
,103
38,0
99
41,3
62
36
,273
36,6
27
42,2
46
35,7
01
35,8
37
Tota
l
Numb
er
3,55
2
3,03
3
2,
374
1,41
6
1,
445
517
157
33
12
,527
To
t Ear
nings
95
,272
,655
94
,391
,822
80
,867
,997
51
,064
,635
51
,239
,565
19
,723
,033
5,
930,
442
1,
303,
767
39
9,79
3,91
7 Av
g Ea
rning
s 26
,822
31
,122
34
,064
36,0
63
35
,460
38
,149
37
,774
39,5
08
31
,915
Aver
age A
ge =
44.
7
Ave
rage
Serv
ice =
11.
0
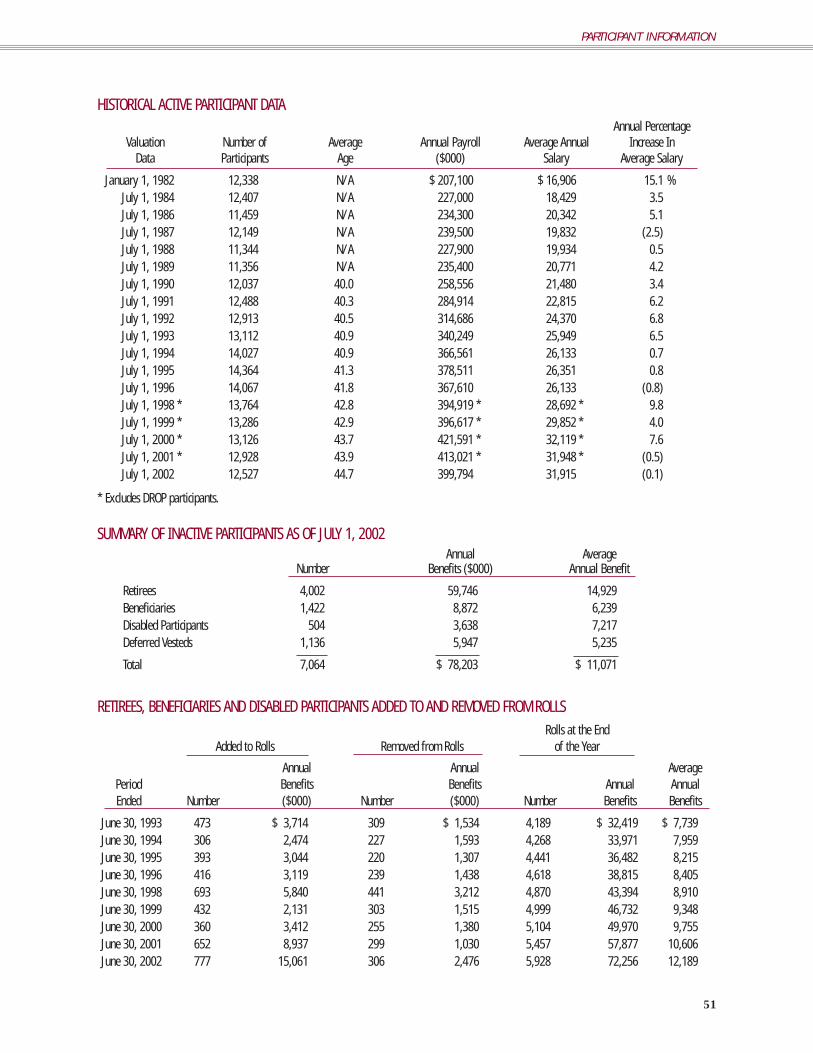
51
PARTICIPANT INFORMATION
HISTORICAL ACTIVE PARTICIPANT DATAAnnual Percentage
Valuation Number of Average Annual Payroll Average Annual Increase InData Participants Age ($000) Salary Average Salary
January 1, 1982 12,338 N/A $ 207,100 $ 16,906 15.1 % July 1, 1984 12,407 N/A 227,000 18,429 3.5 July 1, 1986 11,459 N/A 234,300 20,342 5.1 July 1, 1987 12,149 N/A 239,500 19,832 (2.5) July 1, 1988 11,344 N/A 227,900 19,934 0.5 July 1, 1989 11,356 N/A 235,400 20,771 4.2 July 1, 1990 12,037 40.0 258,556 21,480 3.4 July 1, 1991 12,488 40.3 284,914 22,815 6.2 July 1, 1992 12,913 40.5 314,686 24,370 6.8 July 1, 1993 13,112 40.9 340,249 25,949 6.5 July 1, 1994 14,027 40.9 366,561 26,133 0.7 July 1, 1995 14,364 41.3 378,511 26,351 0.8 July 1, 1996 14,067 41.8 367,610 26,133 (0.8) July 1, 1998 * 13,764 42.8 394,919 * 28,692 * 9.8 July 1, 1999 * 13,286 42.9 396,617 * 29,852 * 4.0 July 1, 2000 * 13,126 43.7 421,591 * 32,119 * 7.6 July 1, 2001 * 12,928 43.9 413,021 * 31,948 * (0.5) July 1, 2002 12,527 44.7 399,794 31,915 (0.1)
* Excludes DROP participants.
SUMMARY OF INACTIVE PARTICIPANTS AS OF JULY 1, 2002Annual Average
Number Benefits ($000) Annual Benefit
Retirees 4,002 59,746 14,929 Beneficiaries 1,422 8,872 6,239 Disabled Participants 504 3,638 7,217 Deferred Vesteds 1,136 5,947 5,235
Total 7,064 $ 78,203 $ 11,071
RETIREES, BENEFICIARIES AND DISABLED PARTICIPANTS ADDED TO AND REMOVED FROM ROLLSRolls at the End
Added to Rolls Removed from Rolls of the Year
Annual Annual AveragePeriod Benefits Benefits Annual AnnualEnded Number ($000) Number ($000) Number Benefits Benefits
June 30, 1993 473 $ 3,714 309 $ 1,534 4,189 $ 32,419 $ 7,739June 30, 1994 306 2,474 227 1,593 4,268 33,971 7,959 June 30, 1995 393 3,044 220 1,307 4,441 36,482 8,215 June 30, 1996 416 3,119 239 1,438 4,618 38,815 8,405 June 30, 1998 693 5,840 441 3,212 4,870 43,394 8,910 June 30, 1999 432 2,131 303 1,515 4,999 46,732 9,348 June 30, 2000 360 3,412 255 1,380 5,104 49,970 9,755 June 30, 2001 652 8,937 299 1,030 5,457 57,877 10,606 June 30, 2002 777 15,061 306 2,476 5,928 72,256 12,189
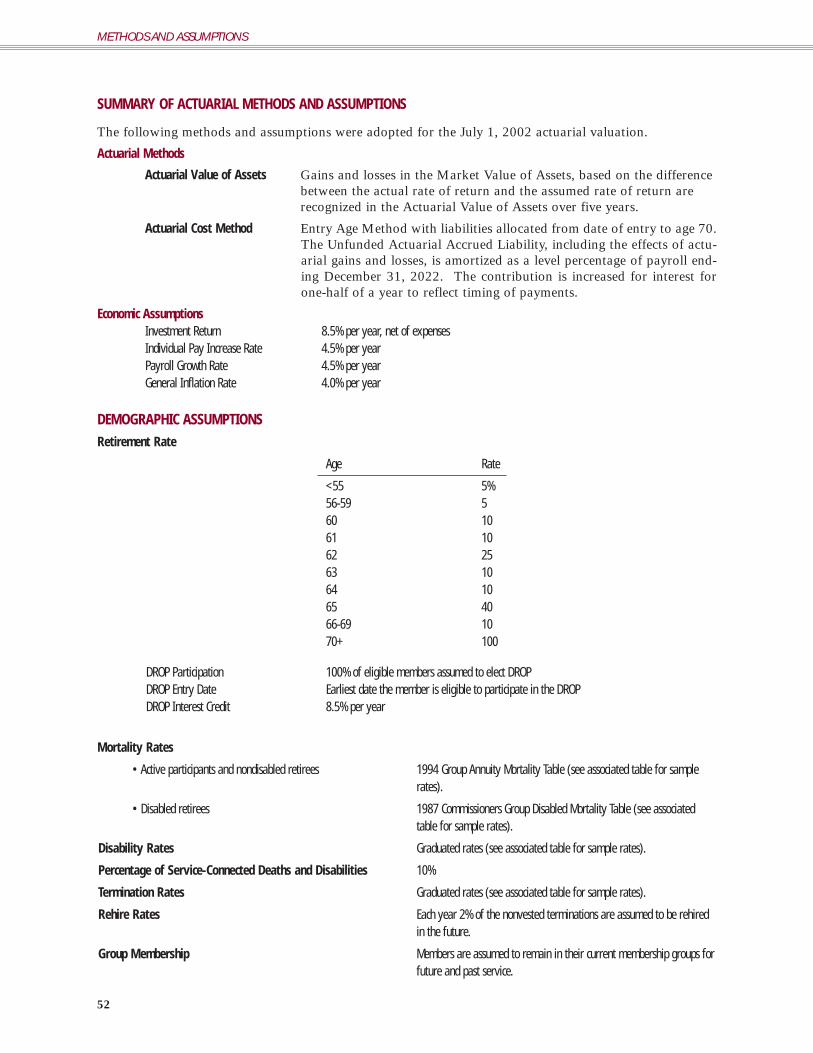
52
METHODS AND ASSUMPTIONS
SUMMARY OF ACTUARIAL METHODS AND ASSUMPTIONS
The following methods and assumptions were adopted for the July 1, 2002 actuarial valuation.
Actuarial Methods
Actuarial Value of Assets Gains and losses in the Market Value of Assets, based on the differencebetween the actual rate of return and the assumed rate of return arerecognized in the Actuarial Value of Assets over five years.
Actuarial Cost Method Entry Age Method with liabilities allocated from date of entry to age 70.The Unfunded Actuarial Accrued Liability, including the effects of actu-arial gains and losses, is amortized as a level percentage of payroll end-ing December 31, 2022. The contribution is increased for interest forone-half of a year to reflect timing of payments.
Economic AssumptionsInvestment Return 8.5% per year, net of expensesIndividual Pay Increase Rate 4.5% per yearPayroll Growth Rate 4.5% per yearGeneral Inflation Rate 4.0% per year
DEMOGRAPHIC ASSUMPTIONSRetirement Rate
Age Rate
<55 5%56-59 560 1061 1062 2563 1064 1065 4066-69 1070+ 100
DROP Participation 100% of eligible members assumed to elect DROP DROP Entry Date Earliest date the member is eligible to participate in the DROP DROP Interest Credit 8.5% per year
Mortality Rates
• Active participants and nondisabled retirees 1994 Group Annuity Mortality Table (see associated table for samplerates).
• Disabled retirees 1987 Commissioners Group Disabled Mortality Table (see associatedtable for sample rates).
Disability Rates Graduated rates (see associated table for sample rates).
Percentage of Service-Connected Deaths and Disabilities 10%
Termination Rates Graduated rates (see associated table for sample rates).
Rehire Rates Each year 2% of the nonvested terminations are assumed to be rehiredin the future.
Group Membership Members are assumed to remain in their current membership groups forfuture and past service.
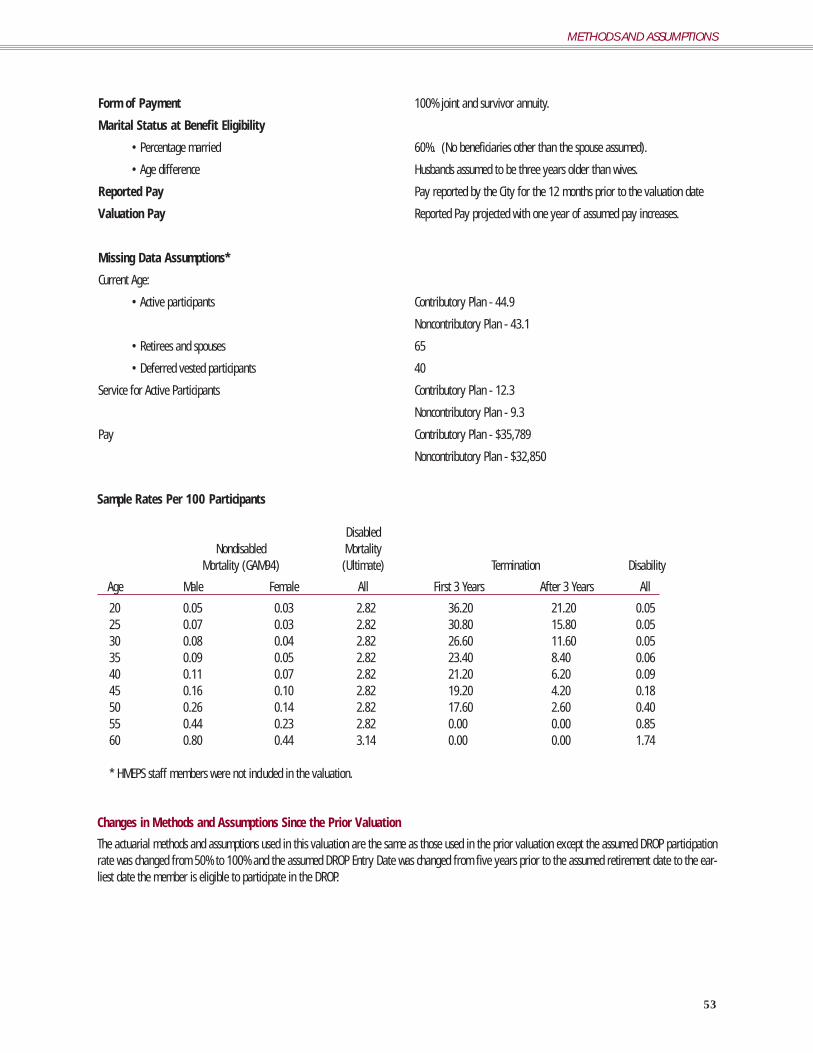
Form of Payment 100% joint and survivor annuity.
Marital Status at Benefit Eligibility
• Percentage married 60%. (No beneficiaries other than the spouse assumed).
• Age difference Husbands assumed to be three years older than wives.
Reported Pay Pay reported by the City for the 12 months prior to the valuation date
Valuation Pay Reported Pay projected with one year of assumed pay increases.
Missing Data Assumptions*
Current Age:
• Active participants Contributory Plan - 44.9
Noncontributory Plan - 43.1
• Retirees and spouses 65
• Deferred vested participants 40
Service for Active Participants Contributory Plan - 12.3
Noncontributory Plan - 9.3
Pay Contributory Plan - $35,789
Noncontributory Plan - $32,850
Sample Rates Per 100 Participants
DisabledNondisabled Mortality
Mortality (GAM94) (Ultimate) Termination Disability
Age Male Female All First 3 Years After 3 Years All
20 0.05 0.03 2.82 36.20 21.20 0.05 25 0.07 0.03 2.82 30.80 15.80 0.05 30 0.08 0.04 2.82 26.60 11.60 0.05 35 0.09 0.05 2.82 23.40 8.40 0.06 40 0.11 0.07 2.82 21.20 6.20 0.09 45 0.16 0.10 2.82 19.20 4.20 0.18 50 0.26 0.14 2.82 17.60 2.60 0.40 55 0.44 0.23 2.82 0.00 0.00 0.85 60 0.80 0.44 3.14 0.00 0.00 1.74
* HMEPS staff members were not included in the valuation.
Changes in Methods and Assumptions Since the Prior Valuation
The actuarial methods and assumptions used in this valuation are the same as those used in the prior valuation except the assumed DROP participationrate was changed from 50% to 100% and the assumed DROP Entry Date was changed from five years prior to the assumed retirement date to the ear-liest date the member is eligible to participate in the DROP.
53
METHODS AND ASSUMPTIONS

METHODS AND ASSUMPTIONS
54
Summary of Plan Provisions
Covered Members Any person who is a participant of Group A, under the original act.Persons who become employees of the City of Houston afterSeptember 1, 1981, and elected officials of the City of Houston whoassumed office after September 1, 1981, participate in Group B, butmay make an irrevocable election to participate in Group A instead.Persons who become employees of the City and persons who areelected as City officials after September 1, 1999 become members ofGroup A. Certain persons who are or become Director of a CityDepartment, Chief Financial Executive, or Executive Director of thePension System on or after September 1, 1999 may participate inGroup C.
Monthly Final Average Salary (FAS) The sum of the seventy-eight highest biweekly salaries paid to amember during his period of credited service, divided by thirty-six.Salary includes base pay, longevity pay, and any shift differentialpay.
Credited Service All services and work performed by an employee, including priorservice. For members of Group A and Group C, all services and workperformed after September 1, 1943 must have been accompaniedby corresponding contributions to the Pension System by the employ-ee or legally authorized repayments must have been made.
Credited service for participants in Group C means the number of eli-gible service after the executive official’s effective date of participa-tion in Group C. A Group C member receives two times the numberof actual Credited Service in Group C solely for the purpose of fulfill-ing the eligibility requirements in Group C.
Normal Retirement
• Eligibility On or after August 1, 2000:
The earliest of:
- age 62 and 5 years of Credited Service
- 5 years of Credited Service and age plus years of Credited Serviceequal 70 or more
- age 65 (Group C only)
• Benefit On or after May 11, 2001:
Group A: 3.25% of FAS for each of the first 10 years of CreditedService plus 3.50% for Credited Service greater than 10 years butless than 20 years plus 4.25% for FAS for each year of CreditedService greater than 20 years (excludes current DROP participants).Maximum benefit is 90% of FAS for all future retirees. Minimummonthly benefit is greater of $8 times years of Credited Service or$100.
Group B: 1.75% of FAS for each of the first 10 years of CreditedService plus 2.00% of FAS for each year of Credited Service from 10through 20, and 2.75% of FAS for each year of Credited Service over20. Maximum benefit is 90% of FAS for all future retirees.
Group C: Double the rate for Group A

Vested Pension
• Eligibility 5 years of Credited Service. Immediate for Group C.
• Benefit Group A and Group C: Either the accrued normal retirement benefitwith payments beginning at the normal retirement eligibility date ora refund of contributions, if any, without interest.
Group B: Accrued normal retirement benefit payable at the normalretirement eligibility date. If the actuarial present value of a pen-sion is less than $10,000, a terminated participant who is not eligibleto begin receiving a pension may request an early lump sum distri-bution of the pension. Such early lump sum distribution is irrevoca-ble. Credited Service associated therewith can be reinstated afterreemployment and pursuant to rules of the plan.
Withdrawal Benefit If a nonvested member withdraws from service with less than 5years, a refund of the member’s contributions is made without inter-est, upon request.
Service-Connected Disability Retirement
• Eligibility Any age or Credited Service.
• Benefit Group A: Accrued normal retirement benefit, but not less than 20%of final monthly salary at time of disability plus 1% of final monthlysalary per year of Credited Service, to a maximum of 40% of finalmonthly salary.
Group B: Accrued normal retirement benefit, but not less than 20%of final monthly salary at time of disability.
Group C: Double Group A benefit
Nonservice-Connected Disability Retirement
• Eligibility 5 years of Credited Service.
• Benefit Accrued normal retirement benefit payable immediately.
Preretirement Survivor Benefits
Service-connected
• Eligibility Any age or Credited Service.
• Benefit On or after September 1, 1999:
If there is a surviving spouse, 100% of FAS payable to the spouse.10% of FAS is payable to each qualifying dependent to a maximumof 20% for all dependents. Surviving spouses benefit will be reducedby the amount of dependent benefits. If no surviving spouse,dependent benefits are 50% of the amount a surviving spouse wouldhave received for each dependent to a maximum of 100% for alldependents in the aggregate.
Nonservice-connected
• Eligibility 5 years of Credited Service.
• Benefit On or after August 1, 2001:
If there is a surviving spouse, 100% of accrued normal retirementbenefit payable to the spouse and 10% of accrued normal retirementbenefit to each qualifying dependent to a maximum of 20% for alldependents in the aggregate. The surviving spouse’s benefit will bereduced by dependent benefits, if any. If there is no surviving
METHODS AND ASSUMPTIONS
55
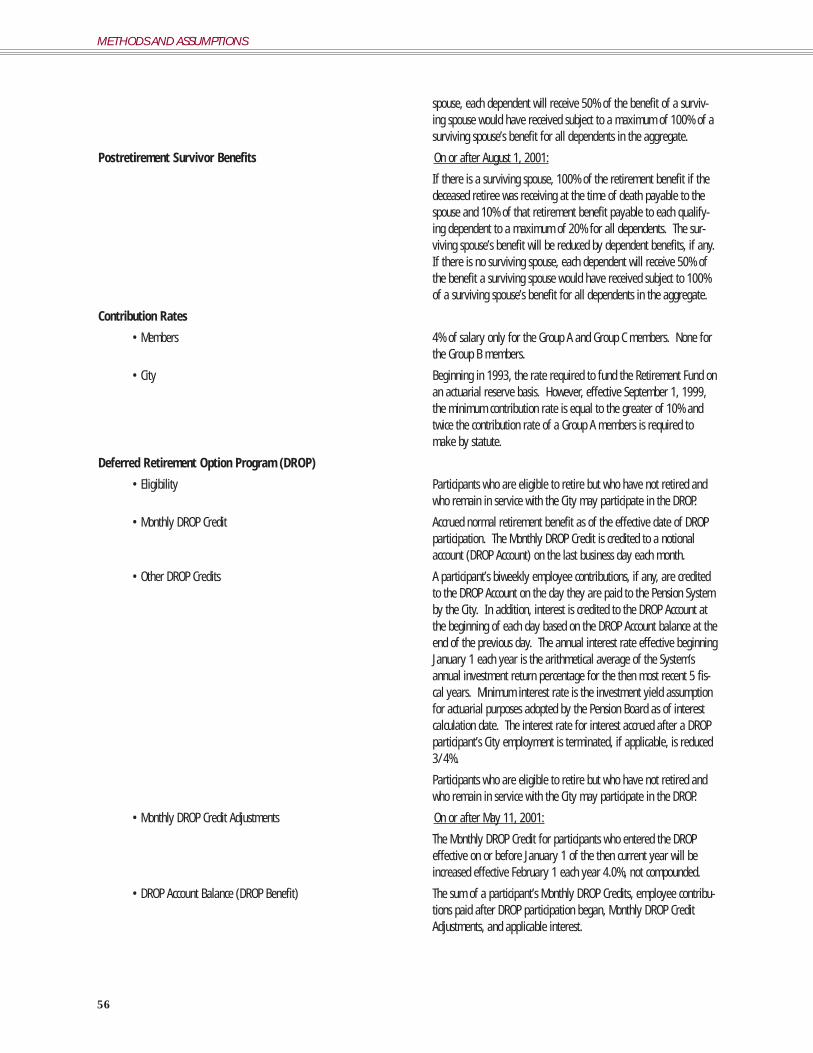
METHODS AND ASSUMPTIONS
56
spouse, each dependent will receive 50% of the benefit of a surviv-ing spouse would have received subject to a maximum of 100% of asurviving spouse’s benefit for all dependents in the aggregate.
Postretirement Survivor Benefits On or after August 1, 2001:
If there is a surviving spouse, 100% of the retirement benefit if thedeceased retiree was receiving at the time of death payable to thespouse and 10% of that retirement benefit payable to each qualify-ing dependent to a maximum of 20% for all dependents. The sur-viving spouse’s benefit will be reduced by dependent benefits, if any.If there is no surviving spouse, each dependent will receive 50% ofthe benefit a surviving spouse would have received subject to 100%of a surviving spouse’s benefit for all dependents in the aggregate.
Contribution Rates
• Members 4% of salary only for the Group A and Group C members. None forthe Group B members.
• City Beginning in 1993, the rate required to fund the Retirement Fund onan actuarial reserve basis. However, effective September 1, 1999,the minimum contribution rate is equal to the greater of 10% andtwice the contribution rate of a Group A members is required tomake by statute.
Deferred Retirement Option Program (DROP)
• Eligibility Participants who are eligible to retire but who have not retired andwho remain in service with the City may participate in the DROP.
• Monthly DROP Credit Accrued normal retirement benefit as of the effective date of DROPparticipation. The Monthly DROP Credit is credited to a notionalaccount (DROP Account) on the last business day each month.
• Other DROP Credits A participant’s biweekly employee contributions, if any, are creditedto the DROP Account on the day they are paid to the Pension Systemby the City. In addition, interest is credited to the DROP Account atthe beginning of each day based on the DROP Account balance at theend of the previous day. The annual interest rate effective beginningJanuary 1 each year is the arithmetical average of the System’sannual investment return percentage for the then most recent 5 fis-cal years. Minimum interest rate is the investment yield assumptionfor actuarial purposes adopted by the Pension Board as of interestcalculation date. The interest rate for interest accrued after a DROPparticipant’s City employment is terminated, if applicable, is reduced3/4%.
Participants who are eligible to retire but who have not retired andwho remain in service with the City may participate in the DROP.
• Monthly DROP Credit Adjustments On or after May 11, 2001:
The Monthly DROP Credit for participants who entered the DROPeffective on or before January 1 of the then current year will beincreased effective February 1 each year 4.0%, not compounded.
• DROP Account Balance (DROP Benefit) The sum of a participant’s Monthly DROP Credits, employee contribu-tions paid after DROP participation began, Monthly DROP CreditAdjustments, and applicable interest.
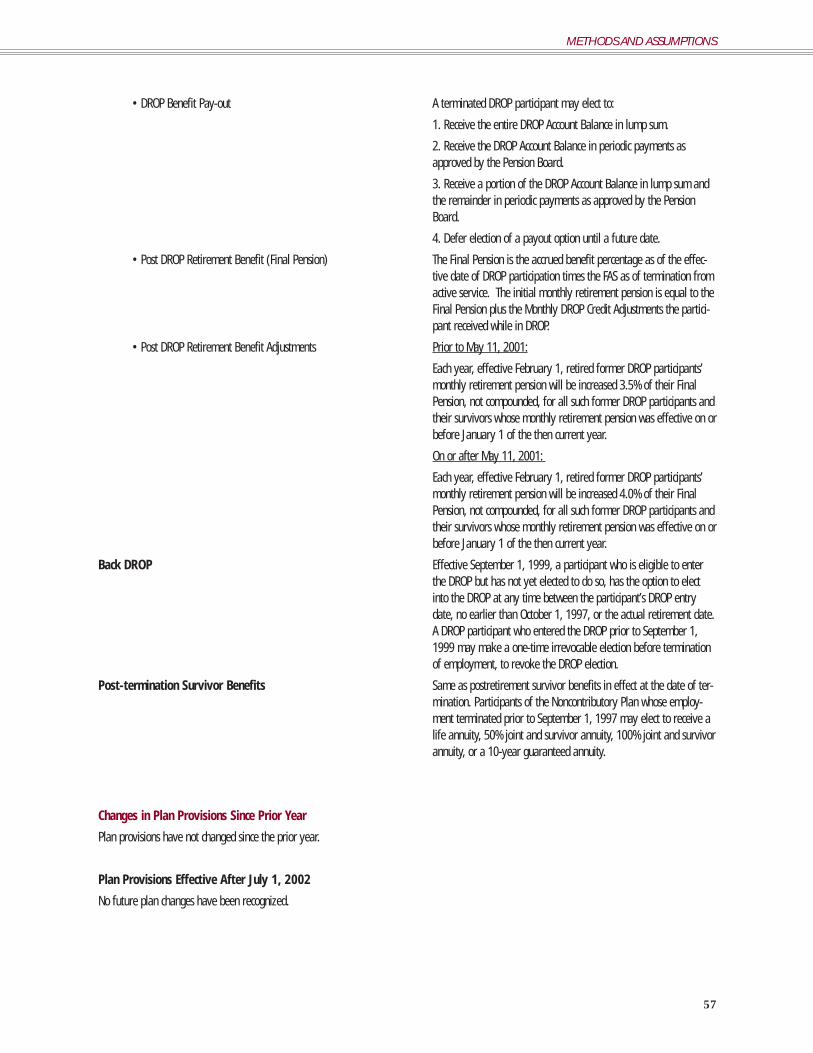
• DROP Benefit Pay-out A terminated DROP participant may elect to:
1. Receive the entire DROP Account Balance in lump sum.
2. Receive the DROP Account Balance in periodic payments asapproved by the Pension Board.
3. Receive a portion of the DROP Account Balance in lump sum andthe remainder in periodic payments as approved by the PensionBoard.
4. Defer election of a payout option until a future date.
• Post DROP Retirement Benefit (Final Pension) The Final Pension is the accrued benefit percentage as of the effec-tive date of DROP participation times the FAS as of termination fromactive service. The initial monthly retirement pension is equal to theFinal Pension plus the Monthly DROP Credit Adjustments the partici-pant received while in DROP.
• Post DROP Retirement Benefit Adjustments Prior to May 11, 2001:
Each year, effective February 1, retired former DROP participants’monthly retirement pension will be increased 3.5% of their FinalPension, not compounded, for all such former DROP participants andtheir survivors whose monthly retirement pension was effective on orbefore January 1 of the then current year.
On or after May 11, 2001:
Each year, effective February 1, retired former DROP participants’monthly retirement pension will be increased 4.0% of their FinalPension, not compounded, for all such former DROP participants andtheir survivors whose monthly retirement pension was effective on orbefore January 1 of the then current year.
Back DROP Effective September 1, 1999, a participant who is eligible to enterthe DROP but has not yet elected to do so, has the option to electinto the DROP at any time between the participant’s DROP entrydate, no earlier than October 1, 1997, or the actual retirement date.A DROP participant who entered the DROP prior to September 1,1999 may make a one-time irrevocable election before terminationof employment, to revoke the DROP election.
Post-termination Survivor Benefits Same as postretirement survivor benefits in effect at the date of ter-mination. Participants of the Noncontributory Plan whose employ-ment terminated prior to September 1, 1997 may elect to receive alife annuity, 50% joint and survivor annuity, 100% joint and survivorannuity, or a 10-year guaranteed annuity.
Changes in Plan Provisions Since Prior Year
Plan provisions have not changed since the prior year.
Plan Provisions Effective After July 1, 2002
No future plan changes have been recognized.
METHODS AND ASSUMPTIONS
57

Hermann Hospital and the Texas Medical Center
In 1942 voters authorized the sale of 131 acres of land adjacent toHermann Park to the M.D. Anderson Foundation for the Texas MedicalCenter. The foundation was established in 1936 by Monroe D. Andersonof Anderson, Clayton and Company, international cotton brokers.Anderson was the moving force behind the idea of a major health care cen-ter in Houston. The M.D. Anderson foundation is still a major Houstonphilanthropic force. In 1943, the foundation successfully wooed the BaylorCollege of Medicine to the city from Dallas, where the college was found-ed in 1900.
At the end of 1944, the M.D. Anderson Foundation started the constructionof the Texas Medical Center on the triangular site bounded by Fannin,Bellaire and the Hermann Hospital and Park. In 1945, it formed the TexasMedical Center Corporation to oversee development. In February 1946,the Texas Medical Center was formally dedicated.

STATISTICAL SECTION
SCHEDULE OF AVERAGE BENEFIT PAYMENTS FOR THE SIX YEARS ENDED JUNE 30, 2002
SCHEDULE OF BENEFITS BY TYPE ($000) FOR THE SIX YEARS ENDED JUNE 30, 2002
SCHEDULE OF ANNUITANTS BY TYPE
HISTORICAL ACTIVE PARTICIPANT DATA
SCHEDULE OF REVENUES BY SOURCE ($000) FOR THE SIX YEARS ENDED JUNE 30, 2003
SCHEDULE OF EXPENSES BY TYPE ($000) FOR THE SIX YEARS ENDED JUNE 30, 2003
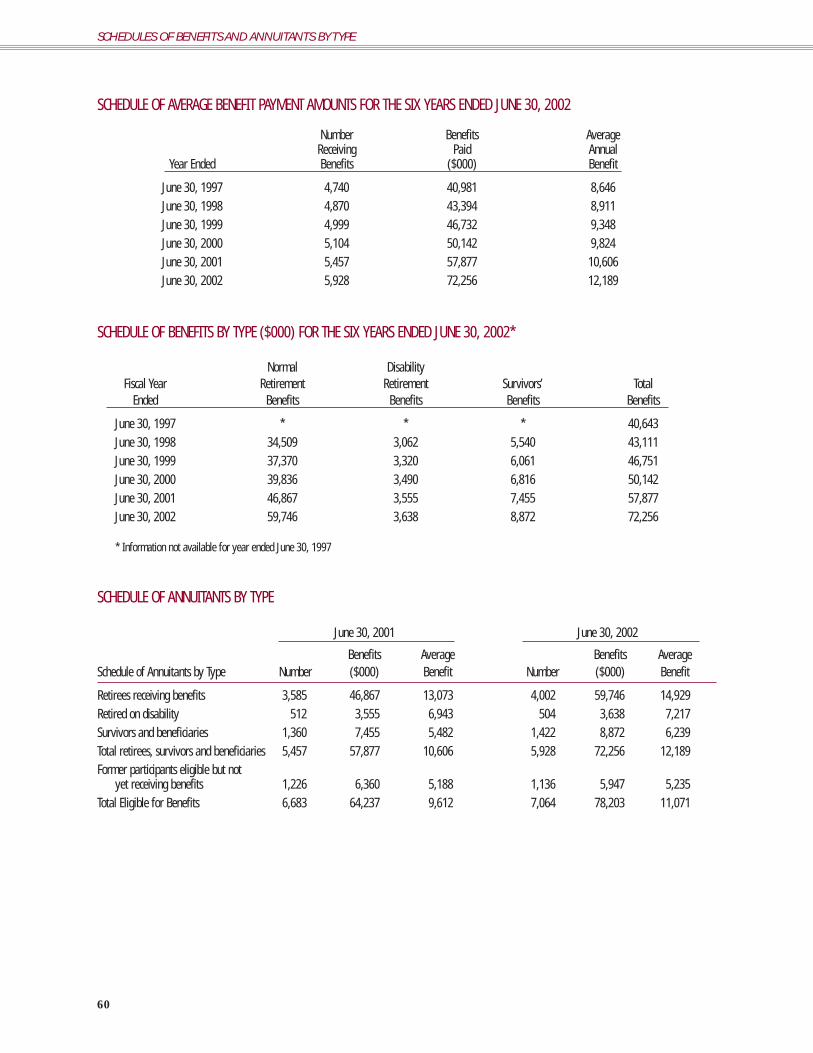
SCHEDULE OF AVERAGE BENEFIT PAYMENT AMOUNTS FOR THE SIX YEARS ENDED JUNE 30, 2002
Number Benefits AverageReceiving Paid Annual
Year Ended Benefits ($000) Benefit
June 30, 1997 4,740 40,981 8,646June 30, 1998 4,870 43,394 8,911June 30, 1999 4,999 46,732 9,348June 30, 2000 5,104 50,142 9,824June 30, 2001 5,457 57,877 10,606 June 30, 2002 5,928 72,256 12,189
SCHEDULE OF BENEFITS BY TYPE ($000) FOR THE SIX YEARS ENDED JUNE 30, 2002*
Normal DisabilityFiscal Year Retirement Retirement Survivors’ Total
Ended Benefits Benefits Benefits Benefits
June 30, 1997 * * * 40,643June 30, 1998 34,509 3,062 5,540 43,111June 30, 1999 37,370 3,320 6,061 46,751June 30, 2000 39,836 3,490 6,816 50,142June 30, 2001 46,867 3,555 7,455 57,877 June 30, 2002 59,746 3,638 8,872 72,256
* Information not available for year ended June 30, 1997
SCHEDULE OF ANNUITANTS BY TYPE
June 30, 2001 June 30, 2002
Benefits Average Benefits AverageSchedule of Annuitants by Type Number ($000) Benefit Number ($000) Benefit
Retirees receiving benefits 3,585 46,867 13,073 4,002 59,746 14,929 Retired on disability 512 3,555 6,943 504 3,638 7,217 Survivors and beneficiaries 1,360 7,455 5,482 1,422 8,872 6,239 Total retirees, survivors and beneficiaries 5,457 57,877 10,606 5,928 72,256 12,189 Former participants eligible but not
yet receiving benefits 1,226 6,360 5,188 1,136 5,947 5,235 Total Eligible for Benefits 6,683 64,237 9,612 7,064 78,203 11,071
SCHEDULES OF BENEFITS AND ANNUITANTS BY TYPE
60
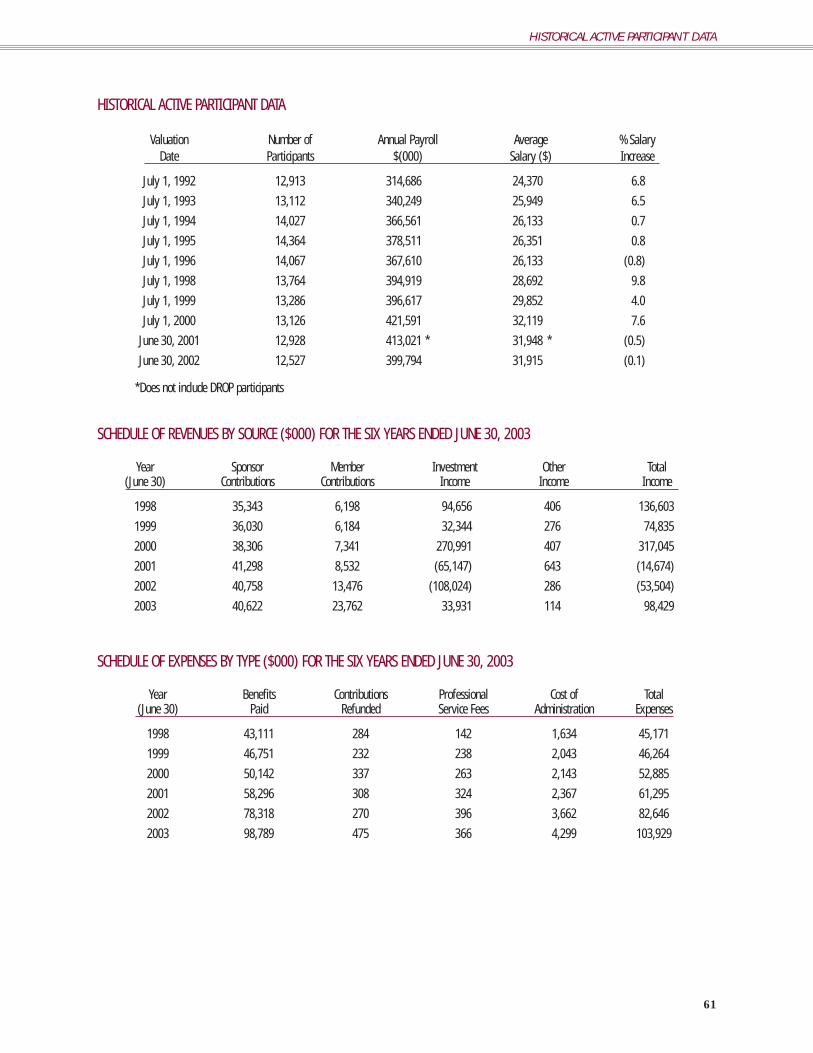
HISTORICAL ACTIVE PARTICIPANT DATA
Valuation Number of Annual Payroll Average % SalaryDate Participants $(000) Salary ($) Increase
July 1, 1992 12,913 314,686 24,370 6.8
July 1, 1993 13,112 340,249 25,949 6.5
July 1, 1994 14,027 366,561 26,133 0.7
July 1, 1995 14,364 378,511 26,351 0.8
July 1, 1996 14,067 367,610 26,133 (0.8)
July 1, 1998 13,764 394,919 28,692 9.8
July 1, 1999 13,286 396,617 29,852 4.0
July 1, 2000 13,126 421,591 32,119 7.6
June 30, 2001 12,928 413,021 * 31,948 * (0.5)
June 30, 2002 12,527 399,794 31,915 (0.1)
*Does not include DROP participants
SCHEDULE OF REVENUES BY SOURCE ($000) FOR THE SIX YEARS ENDED JUNE 30, 2003
Year Sponsor Member Investment Other Total(June 30) Contributions Contributions Income Income Income
1998 35,343 6,198 94,656 406 136,603
1999 36,030 6,184 32,344 276 74,835
2000 38,306 7,341 270,991 407 317,045
2001 41,298 8,532 (65,147) 643 (14,674)
2002 40,758 13,476 (108,024) 286 (53,504)
2003 40,622 23,762 33,931 114 98,429
SCHEDULE OF EXPENSES BY TYPE ($000) FOR THE SIX YEARS ENDED JUNE 30, 2003
Year Benefits Contributions Professional Cost of Total(June 30) Paid Refunded Service Fees Administration Expenses
1998 43,111 284 142 1,634 45,171
1999 46,751 232 238 2,043 46,264
2000 50,142 337 263 2,143 52,885
2001 58,296 308 324 2,367 61,295
2002 78,318 270 396 3,662 82,646
2003 98,789 475 366 4,299 103,929
HISTORICAL ACTIVE PARTICIPANT DATA
61

Acknowledgments
Houston Metropolitan Research Center, Houston Public Library
Houston Chronicle Publishing Company, www.chron.com.
Facts and figures were provided courtesy of www.houstonhistory.com.
62

HOUSTONMUNICIPALEMPLOYEES
PENSION SYSTEM