Embed Size (px)
Citation preview
May 2016 ©2016, Greater Houston Partnership Page 1
A Different Sort Glut — Houston’s multifamily market continues to soften. Total occu-
pancy stood at 90.1 percent in April. Conventional wisdom holds that once occupancy
falls below 90 percent, Houston becomes a renter’s market. Given the incentives now
available to renters at many Class A properties, Houston is already there.
Overall occupancy will continue falling, likely to the mid-80s, as developers deliver an-
other 21,000 apartments this year and 4,000 next. Even in a booming economy, 25,000
units would be difficult to absorb. Recent history helps one to understand why.
From January ’10 through December ’14, the region created an average of 95,000 jobs per
year. During the same period, the market absorbed an average of 15,000 apartment units
per year. Those facts suggest a multifamily rule of thumb—for every six jobs Houston
creates, one apartment unit is absorbed. Apply that 6:1 ratio to the number of units coming
online in ’16, and the region needs an additional 150,000 jobs over the next two years to
hold occupancy at its current level. Given the weak job growth expected in the near term,
Houston’s apartment market will likely be oversupplied well into the future.
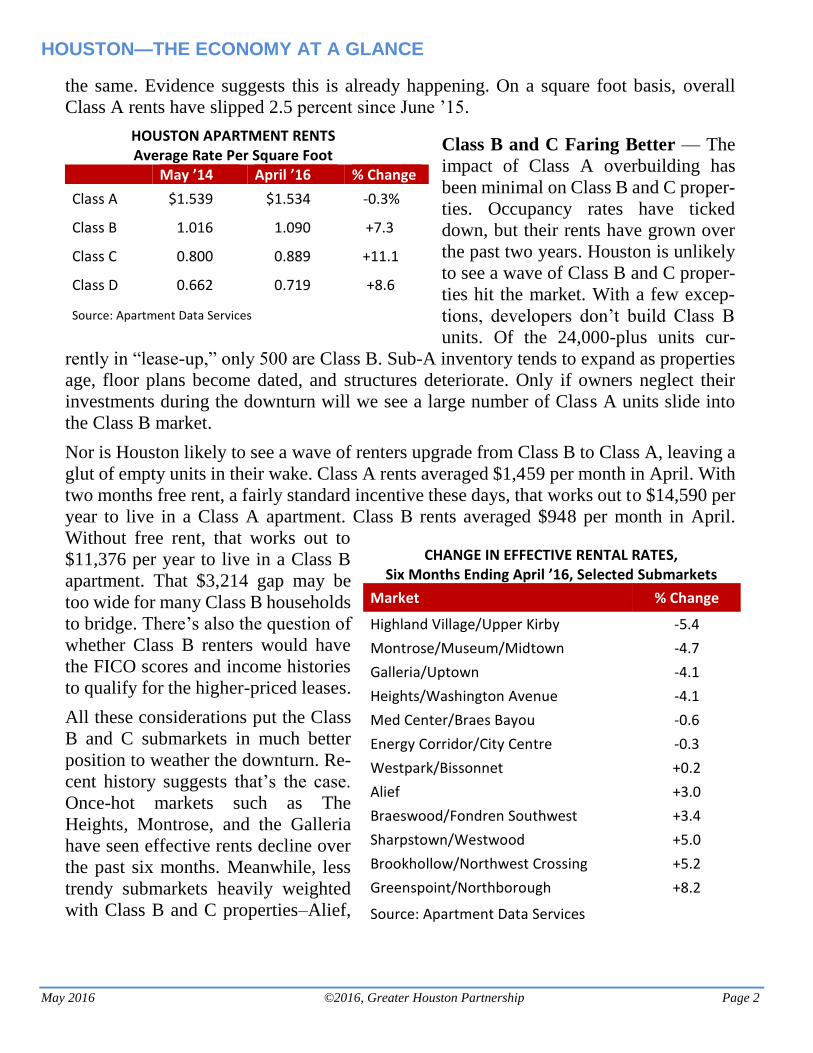
Challenges Ahead for Class A — Overbuilding is hitting the Class A apartment market
the hardest. “Stable” Class A, those properties in operation 13 months or more, enjoy a
90.8 percent occupancy rate. Class A in “lease-up,” however, those properties operating
less than 13 months, have a 23.2 percent occupancy rate. While it’s normal for lease-up
to fall well below the stable rate, the glut of units hitting the market has pulled overall
Class A occupancy down to 79.5 percent. In August ’14, the peak of the recent multifamily
cycle, the overall rate for Class A space was 84.0 percent.
To attract tenants, many
Class A properties in
“lease-up” now offer a
host of incentives—gift
cards, Apple watches, flat
screen televisions, seven-
day cruises, and move-in
allowances, in addition to
several months free rent.
To remain competitive,
Class A “stable” properties
may soon be forced to do
A publication of the Greater Houston Partnership Volume 25 Number 5 — May 2016
Class A Units142,42023.0%
Class B Units233,26038.1%
Class C Units180,02629.4%
Class D Units57,0339.3%
Houston Apartment Market Share by Class
Source: Apartment Data Services
HOUSTON—THE ECONOMY AT A GLANCE
May 2016 ©2016, Greater Houston Partnership Page 2
the same. Evidence suggests this is already happening. On a square foot basis, overall
Class A rents have slipped 2.5 percent since June ’15.
Class B and C Faring Better — The
impact of Class A overbuilding has
been minimal on Class B and C proper-
ties. Occupancy rates have ticked
down, but their rents have grown over
the past two years. Houston is unlikely
to see a wave of Class B and C proper-
ties hit the market. With a few excep-
tions, developers don’t build Class B
units. Of the 24,000-plus units cur-
rently in “lease-up,” only 500 are Class B. Sub-A inventory tends to expand as properties
age, floor plans become dated, and structures deteriorate. Only if owners neglect their
investments during the downturn will we see a large number of Class A units slide into
the Class B market.
Nor is Houston likely to see a wave of renters upgrade from Class B to Class A, leaving a
glut of empty units in their wake. Class A rents averaged $1,459 per month in April. With
two months free rent, a fairly standard incentive these days, that works out to $14,590 per
year to live in a Class A apartment. Class B rents averaged $948 per month in April.
Without free rent, that works out to
$11,376 per year to live in a Class B
apartment. That $3,214 gap may be
too wide for many Class B households
to bridge. There’s also the question of
whether Class B renters would have
the FICO scores and income histories
to qualify for the higher-priced leases.
All these considerations put the Class
B and C submarkets in much better
position to weather the downturn. Re-
cent history suggests that’s the case.
Once-hot markets such as The
Heights, Montrose, and the Galleria
have seen effective rents decline over
the past six months. Meanwhile, less
trendy submarkets heavily weighted
with Class B and C properties–Alief,
HOUSTON APARTMENT RENTS Average Rate Per Square Foot
May ’14 April ’16 % Change
Class A $1.539 $1.534 -0.3%
Class B 1.016 1.090 +7.3
Class C 0.800 0.889 +11.1
Class D 0.662 0.719 +8.6
Source: Apartment Data Services
CHANGE IN EFFECTIVE RENTAL RATES, Six Months Ending April ’16, Selected Submarkets
Market % Change
Highland Village/Upper Kirby -5.4
Montrose/Museum/Midtown -4.7
Galleria/Uptown -4.1
Heights/Washington Avenue -4.1
Med Center/Braes Bayou -0.6
Energy Corridor/City Centre -0.3
Westpark/Bissonnet +0.2
Alief +3.0
Braeswood/Fondren Southwest +3.4
Sharpstown/Westwood +5.0
Brookhollow/Northwest Crossing +5.2
Greenspoint/Northborough +8.2
Source: Apartment Data Services
HOUSTON—THE ECONOMY AT A GLANCE
May 2016 ©2016, Greater Houston Partnership Page 3
Sharpstown and Westwood, for example–have seen their rental rates grow over the same
period. The investment community has taken note of this trend, too. Of the 34 apartment
transactions Transwestern tracked in its Q1 market report, 26 involved properties 25 years
old and older, ages typical of Class B and C properties.
Signs of Hope — Deliveries should taper off to 4,000 units next year, notes CBRE, and
only 1,400 units were permitted in Q1. The concern remains, however, that developers
will believe their project is unique, convince lenders of the same, and break ground on
more high-rises inside the loop and garden-style apartments in the suburbs. The stark truth
is that Houston doesn’t need any more Class A apartment communities, not until the mar-
ket absorbs the 45,000 vacant Class A units on the ground and in the pipeline. Apartment
owners and developers are more likely to see crude oil hit $70 a barrel before Houston
returns to a landlord’s market.
Industrial’s Status Quo — Houston absorbed between 1.4 and 2.1 million square feet of
industrial space in the first quarter, up from the 0.3 to 1.4 million square feet absorbed in
the fourth quarter of ’15.1 Retail distributors and third-party logistics firms—sectors tied
to population growth and port activity—drove demand for industrial space. Only four of
Houston’s 14 submarkets reported negative absorption, and with one exception, the
amount of space thrown back on the market represents less than 0.1 percent of their re-
spective inventories.
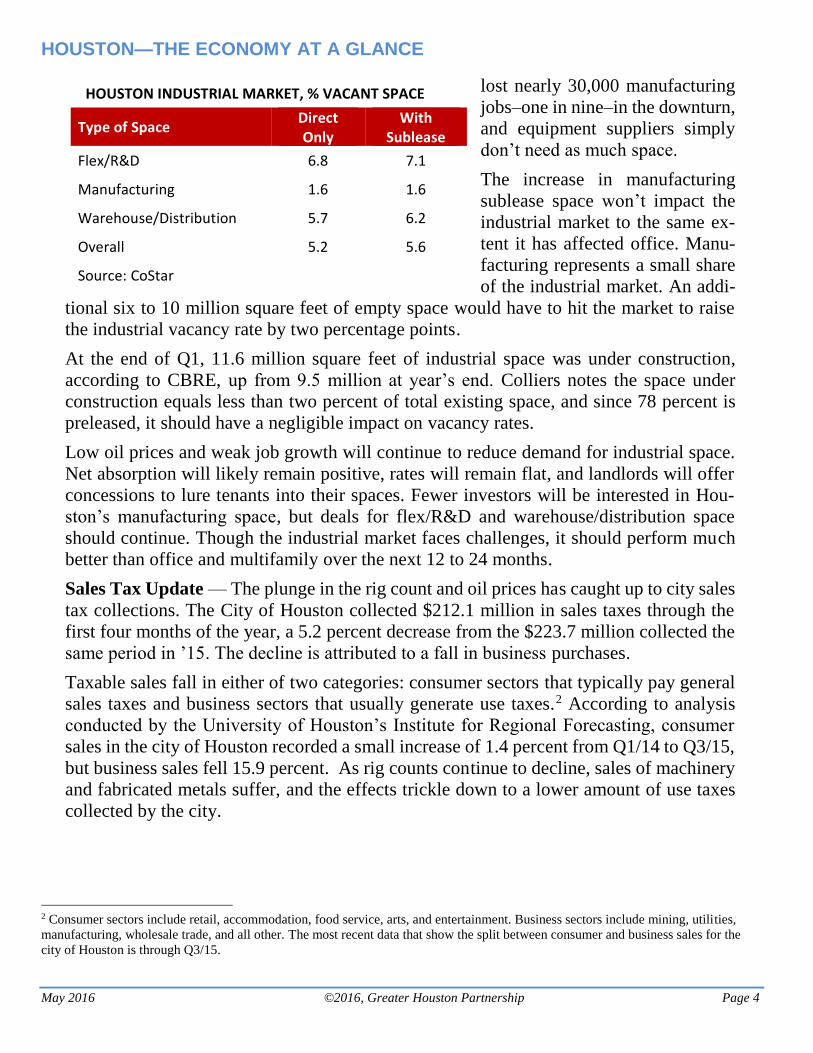
Sublease space has begun to creep into the industrial market, but not to the same extent it
has in office. Sublease inventory totaled 3.5 million square feet at the end of Q1, well
above the five-year average of 2.4 million square feet, according to CBRE. Industrial’s
direct vacancy rate is 4.9 to 5.6 per-
cent. Factor in sublease space and
the rate inches up to 5.6 to 5.8 per-
cent.
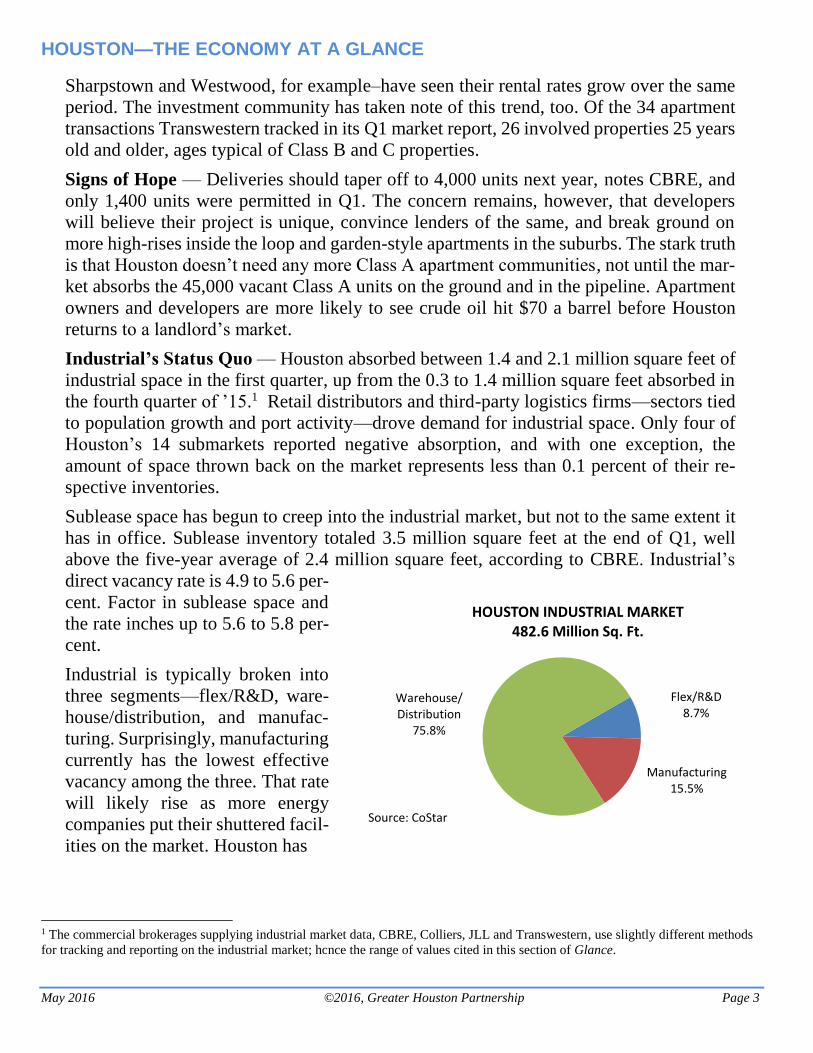
Industrial is typically broken into
three segments—flex/R&D, ware-
house/distribution, and manufac-
turing. Surprisingly, manufacturing
currently has the lowest effective
vacancy among the three. That rate
will likely rise as more energy
companies put their shuttered facil-
ities on the market. Houston has
1 The commercial brokerages supplying industrial market data, CBRE, Colliers, JLL and Transwestern, use slightly different methods
for tracking and reporting on the industrial market; hcnce the range of values cited in this section of Glance.
Flex/R&D 8.7%
Manufacturing 15.5%
Warehouse/Distribution
75.8%
HOUSTON INDUSTRIAL MARKET482.6 Million Sq. Ft.
Source: CoStar
HOUSTON—THE ECONOMY AT A GLANCE
May 2016 ©2016, Greater Houston Partnership Page 4
lost nearly 30,000 manufacturing
jobs–one in nine–in the downturn,
and equipment suppliers simply
don’t need as much space.
The increase in manufacturing
sublease space won’t impact the
industrial market to the same ex-
tent it has affected office. Manu-
facturing represents a small share
of the industrial market. An addi-
tional six to 10 million square feet of empty space would have to hit the market to raise
the industrial vacancy rate by two percentage points.
At the end of Q1, 11.6 million square feet of industrial space was under construction,
according to CBRE, up from 9.5 million at year’s end. Colliers notes the space under
construction equals less than two percent of total existing space, and since 78 percent is
preleased, it should have a negligible impact on vacancy rates.
Low oil prices and weak job growth will continue to reduce demand for industrial space.
Net absorption will likely remain positive, rates will remain flat, and landlords will offer
concessions to lure tenants into their spaces. Fewer investors will be interested in Hou-
ston’s manufacturing space, but deals for flex/R&D and warehouse/distribution space
should continue. Though the industrial market faces challenges, it should perform much
better than office and multifamily over the next 12 to 24 months.
Sales Tax Update — The plunge in the rig count and oil prices has caught up to city sales
tax collections. The City of Houston collected $212.1 million in sales taxes through the
first four months of the year, a 5.2 percent decrease from the $223.7 million collected the
same period in ’15. The decline is attributed to a fall in business purchases.
Taxable sales fall in either of two categories: consumer sectors that typically pay general
sales taxes and business sectors that usually generate use taxes.2 According to analysis
conducted by the University of Houston’s Institute for Regional Forecasting, consumer
sales in the city of Houston recorded a small increase of 1.4 percent from Q1/14 to Q3/15,
but business sales fell 15.9 percent. As rig counts continue to decline, sales of machinery
and fabricated metals suffer, and the effects trickle down to a lower amount of use taxes
collected by the city.
2 Consumer sectors include retail, accommodation, food service, arts, and entertainment. Business sectors include mining, utilities,
manufacturing, wholesale trade, and all other. The most recent data that show the split between consumer and business sales for the
city of Houston is through Q3/15.
HOUSTON INDUSTRIAL MARKET, % VACANT SPACE
Type of Space Direct Only
With Sublease
Flex/R&D 6.8 7.1
Manufacturing 1.6 1.6
Warehouse/Distribution 5.7 6.2
Overall 5.2 5.6
Source: CoStar
HOUSTON—THE ECONOMY AT A GLANCE
May 2016 ©2016, Greater Houston Partnership Page 5
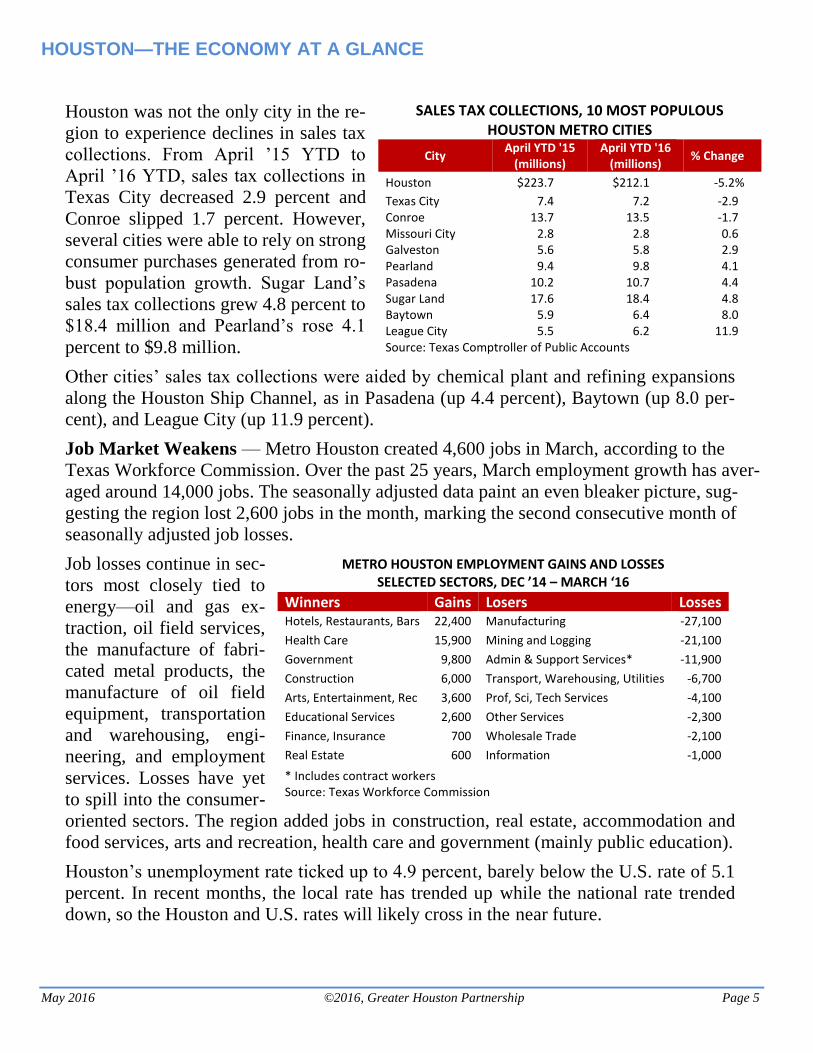
Houston was not the only city in the re-
gion to experience declines in sales tax
collections. From April ’15 YTD to
April ’16 YTD, sales tax collections in
Texas City decreased 2.9 percent and
Conroe slipped 1.7 percent. However,
several cities were able to rely on strong
consumer purchases generated from ro-
bust population growth. Sugar Land’s
sales tax collections grew 4.8 percent to
$18.4 million and Pearland’s rose 4.1
percent to $9.8 million.
Other cities’ sales tax collections were aided by chemical plant and refining expansions
along the Houston Ship Channel, as in Pasadena (up 4.4 percent), Baytown (up 8.0 per-
cent), and League City (up 11.9 percent).
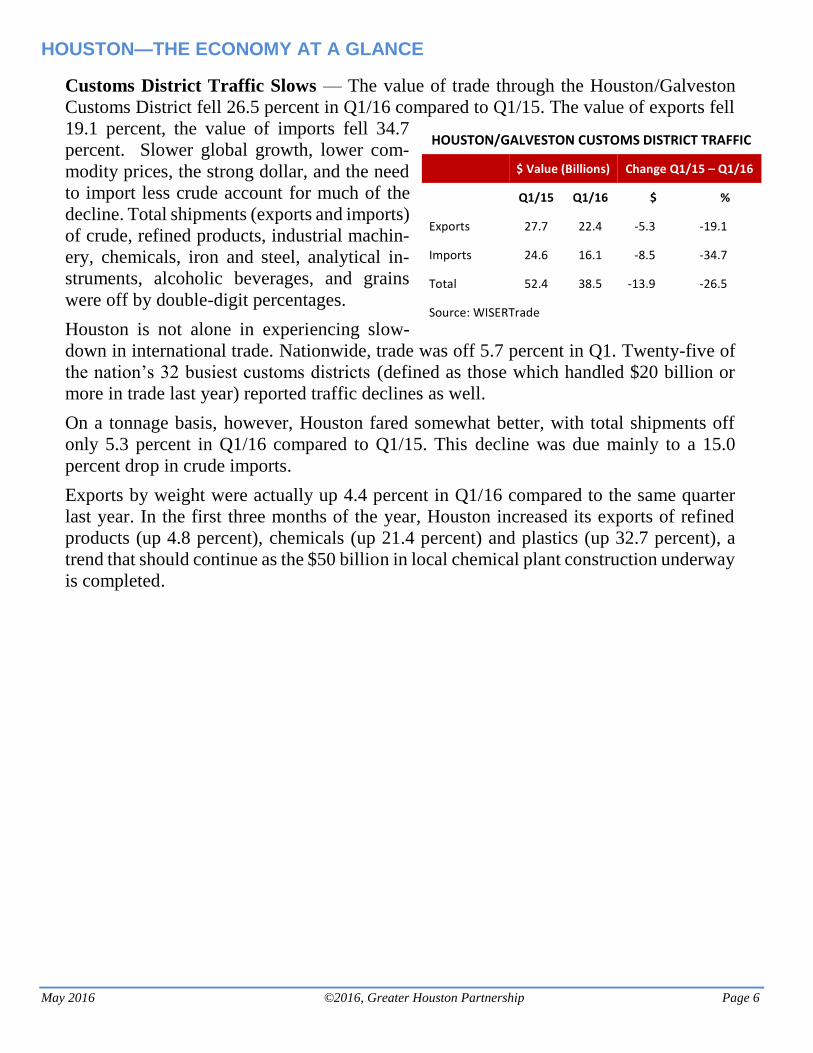
Job Market Weakens — Metro Houston created 4,600 jobs in March, according to the
Texas Workforce Commission. Over the past 25 years, March employment growth has aver-
aged around 14,000 jobs. The seasonally adjusted data paint an even bleaker picture, sug-
gesting the region lost 2,600 jobs in the month, marking the second consecutive month of
seasonally adjusted job losses.
Job losses continue in sec-
tors most closely tied to
energy—oil and gas ex-
traction, oil field services,
the manufacture of fabri-
cated metal products, the
manufacture of oil field
equipment, transportation
and warehousing, engi-
neering, and employment
services. Losses have yet
to spill into the consumer-
oriented sectors. The region added jobs in construction, real estate, accommodation and
food services, arts and recreation, health care and government (mainly public education).
Houston’s unemployment rate ticked up to 4.9 percent, barely below the U.S. rate of 5.1
percent. In recent months, the local rate has trended up while the national rate trended
down, so the Houston and U.S. rates will likely cross in the near future.
SALES TAX COLLECTIONS, 10 MOST POPULOUS HOUSTON METRO CITIES
City April YTD '15
(millions) April YTD '16
(millions) % Change
Houston $223.7 $212.1 -5.2%
Texas City 7.4 7.2 -2.9 Conroe 13.7 13.5 -1.7 Missouri City 2.8 2.8 0.6 Galveston 5.6 5.8 2.9 Pearland 9.4 9.8 4.1 Pasadena 10.2 10.7 4.4 Sugar Land 17.6 18.4 4.8 Baytown 5.9 6.4 8.0 League City 5.5 6.2 11.9 Source: Texas Comptroller of Public Accounts
METRO HOUSTON EMPLOYMENT GAINS AND LOSSES SELECTED SECTORS, DEC ’14 – MARCH ‘16
Winners Gains Losers Losses Hotels, Restaurants, Bars 22,400 Manufacturing -27,100
Health Care 15,900 Mining and Logging -21,100
Government 9,800 Admin & Support Services* -11,900
Construction 6,000 Transport, Warehousing, Utilities -6,700
Arts, Entertainment, Rec 3,600 Prof, Sci, Tech Services -4,100
Educational Services 2,600 Other Services -2,300
Finance, Insurance 700 Wholesale Trade -2,100
Real Estate 600 Information -1,000
* Includes contract workers Source: Texas Workforce Commission
HOUSTON—THE ECONOMY AT A GLANCE
May 2016 ©2016, Greater Houston Partnership Page 6
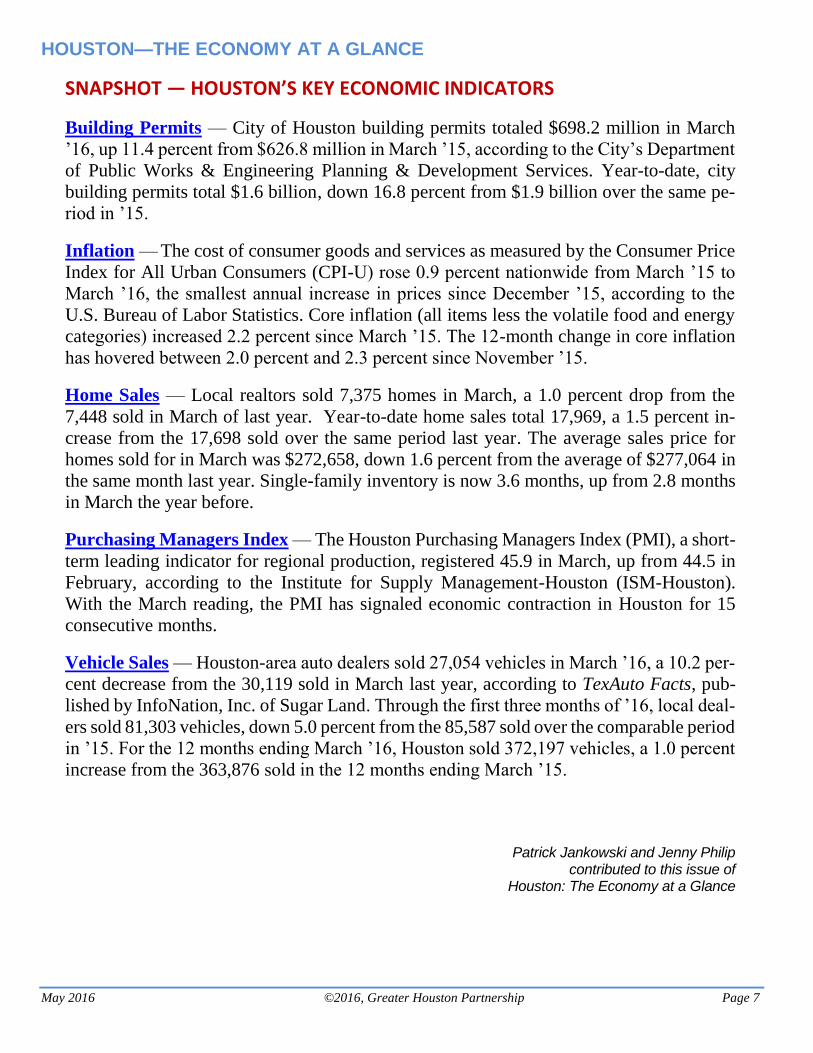
Customs District Traffic Slows — The value of trade through the Houston/Galveston
Customs District fell 26.5 percent in Q1/16 compared to Q1/15. The value of exports fell
19.1 percent, the value of imports fell 34.7
percent. Slower global growth, lower com-
modity prices, the strong dollar, and the need
to import less crude account for much of the
decline. Total shipments (exports and imports)
of crude, refined products, industrial machin-
ery, chemicals, iron and steel, analytical in-
struments, alcoholic beverages, and grains
were off by double-digit percentages.
Houston is not alone in experiencing slow-
down in international trade. Nationwide, trade was off 5.7 percent in Q1. Twenty-five of
the nation’s 32 busiest customs districts (defined as those which handled $20 billion or
more in trade last year) reported traffic declines as well.
On a tonnage basis, however, Houston fared somewhat better, with total shipments off
only 5.3 percent in Q1/16 compared to Q1/15. This decline was due mainly to a 15.0
percent drop in crude imports.
Exports by weight were actually up 4.4 percent in Q1/16 compared to the same quarter
last year. In the first three months of the year, Houston increased its exports of refined
products (up 4.8 percent), chemicals (up 21.4 percent) and plastics (up 32.7 percent), a
trend that should continue as the $50 billion in local chemical plant construction underway
is completed.
HOUSTON/GALVESTON CUSTOMS DISTRICT TRAFFIC
$ Value (Billions) Change Q1/15 – Q1/16
Q1/15 Q1/16 $ %
Exports 27.7 22.4 -5.3 -19.1
Imports 24.6 16.1 -8.5 -34.7
Total 52.4 38.5 -13.9 -26.5
Source: WISERTrade
HOUSTON—THE ECONOMY AT A GLANCE
May 2016 ©2016, Greater Houston Partnership Page 7
SNAPSHOT — HOUSTON’S KEY ECONOMIC INDICATORS
Building Permits — City of Houston building permits totaled $698.2 million in March
’16, up 11.4 percent from $626.8 million in March ’15, according to the City’s Department
of Public Works & Engineering Planning & Development Services. Year-to-date, city
building permits total $1.6 billion, down 16.8 percent from $1.9 billion over the same pe-
riod in ’15.
Inflation — The cost of consumer goods and services as measured by the Consumer Price
Index for All Urban Consumers (CPI-U) rose 0.9 percent nationwide from March ’15 to
March ’16, the smallest annual increase in prices since December ’15, according to the
U.S. Bureau of Labor Statistics. Core inflation (all items less the volatile food and energy
categories) increased 2.2 percent since March ’15. The 12-month change in core inflation
has hovered between 2.0 percent and 2.3 percent since November ’15.
Home Sales — Local realtors sold 7,375 homes in March, a 1.0 percent drop from the
7,448 sold in March of last year. Year-to-date home sales total 17,969, a 1.5 percent in-
crease from the 17,698 sold over the same period last year. The average sales price for
homes sold for in March was $272,658, down 1.6 percent from the average of $277,064 in
the same month last year. Single-family inventory is now 3.6 months, up from 2.8 months
in March the year before.
Purchasing Managers Index — The Houston Purchasing Managers Index (PMI), a short-
term leading indicator for regional production, registered 45.9 in March, up from 44.5 in
February, according to the Institute for Supply Management-Houston (ISM-Houston).
With the March reading, the PMI has signaled economic contraction in Houston for 15
consecutive months.
Vehicle Sales — Houston-area auto dealers sold 27,054 vehicles in March ’16, a 10.2 per-
cent decrease from the 30,119 sold in March last year, according to TexAuto Facts, pub-
lished by InfoNation, Inc. of Sugar Land. Through the first three months of ’16, local deal-
ers sold 81,303 vehicles, down 5.0 percent from the 85,587 sold over the comparable period
in ’15. For the 12 months ending March ’16, Houston sold 372,197 vehicles, a 1.0 percent
increase from the 363,876 sold in the 12 months ending March ’15.
Patrick Jankowski and Jenny Philip
contributed to this issue of Houston: The Economy at a Glance

HOUSTON—THE ECONOMY AT A GLANCE
May 2016 ©2016, Greater Houston Partnership Page 8
STAY UP TO DATE!
To access past issues of Economy at a Glance, please click here.
If you are a not a member of the Greater Houston Partnership and would like to subscribe to
Economy at a Glance, please click here and enter your email address. For information about
joining the Greater Houston Partnership, call Member Services at 713-844-3683.
The Key Economic Indicators table is updated whenever any data change — typically, 11 or so
times per month. If you would like to receive these updates by e-mail, usually accompanied by
commentary, please email your request for Key Economic Indicators to [email protected] with
your name, title and phone number and your company’s name and address.
HOUSTON—THE ECONOMY AT A GLANCE
May 2016 ©2016, Greater Houston Partnership Page 9
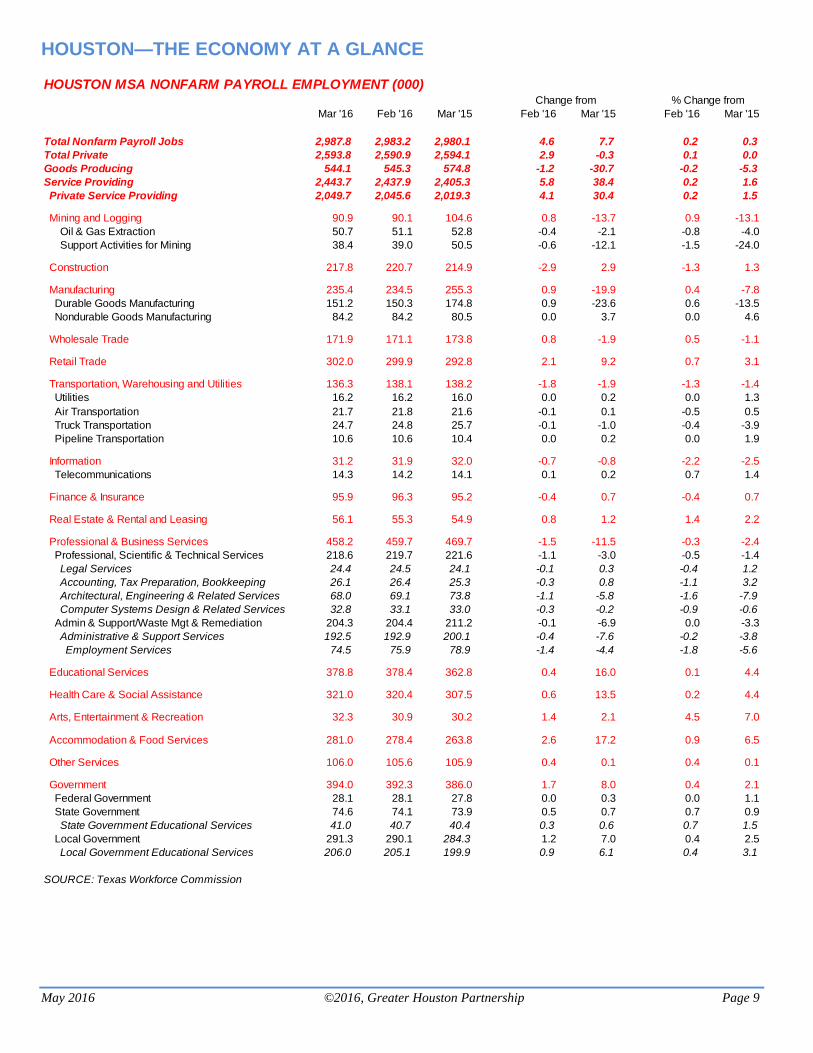
HOUSTON MSA NONFARM PAYROLL EMPLOYMENT (000) Change from % Change from
Mar '16 Feb '16 Mar '15 Feb '16 Mar '15 Feb '16 Mar '15
Total Nonfarm Payroll Jobs 2,987.8 2,983.2 2,980.1 4.6 7.7 0.2 0.3
Total Private 2,593.8 2,590.9 2,594.1 2.9 -0.3 0.1 0.0
Goods Producing 544.1 545.3 574.8 -1.2 -30.7 -0.2 -5.3
Service Providing 2,443.7 2,437.9 2,405.3 5.8 38.4 0.2 1.6
Private Service Providing 2,049.7 2,045.6 2,019.3 4.1 30.4 0.2 1.5
Mining and Logging 90.9 90.1 104.6 0.8 -13.7 0.9 -13.1
Oil & Gas Extraction 50.7 51.1 52.8 -0.4 -2.1 -0.8 -4.0
Support Activities for Mining 38.4 39.0 50.5 -0.6 -12.1 -1.5 -24.0
Construction 217.8 220.7 214.9 -2.9 2.9 -1.3 1.3
Manufacturing 235.4 234.5 255.3 0.9 -19.9 0.4 -7.8
Durable Goods Manufacturing 151.2 150.3 174.8 0.9 -23.6 0.6 -13.5
Nondurable Goods Manufacturing 84.2 84.2 80.5 0.0 3.7 0.0 4.6
Wholesale Trade 171.9 171.1 173.8 0.8 -1.9 0.5 -1.1
Retail Trade 302.0 299.9 292.8 2.1 9.2 0.7 3.1
Transportation, Warehousing and Utilities 136.3 138.1 138.2 -1.8 -1.9 -1.3 -1.4
Utilities 16.2 16.2 16.0 0.0 0.2 0.0 1.3
Air Transportation 21.7 21.8 21.6 -0.1 0.1 -0.5 0.5
Truck Transportation 24.7 24.8 25.7 -0.1 -1.0 -0.4 -3.9
Pipeline Transportation 10.6 10.6 10.4 0.0 0.2 0.0 1.9
Information 31.2 31.9 32.0 -0.7 -0.8 -2.2 -2.5
Telecommunications 14.3 14.2 14.1 0.1 0.2 0.7 1.4
Finance & Insurance 95.9 96.3 95.2 -0.4 0.7 -0.4 0.7
Real Estate & Rental and Leasing 56.1 55.3 54.9 0.8 1.2 1.4 2.2
Professional & Business Services 458.2 459.7 469.7 -1.5 -11.5 -0.3 -2.4
Professional, Scientific & Technical Services 218.6 219.7 221.6 -1.1 -3.0 -0.5 -1.4
Legal Services 24.4 24.5 24.1 -0.1 0.3 -0.4 1.2
Accounting, Tax Preparation, Bookkeeping 26.1 26.4 25.3 -0.3 0.8 -1.1 3.2
Architectural, Engineering & Related Services 68.0 69.1 73.8 -1.1 -5.8 -1.6 -7.9
Computer Systems Design & Related Services 32.8 33.1 33.0 -0.3 -0.2 -0.9 -0.6
Admin & Support/Waste Mgt & Remediation 204.3 204.4 211.2 -0.1 -6.9 0.0 -3.3
Administrative & Support Services 192.5 192.9 200.1 -0.4 -7.6 -0.2 -3.8
Employment Services 74.5 75.9 78.9 -1.4 -4.4 -1.8 -5.6
Educational Services 378.8 378.4 362.8 0.4 16.0 0.1 4.4
Health Care & Social Assistance 321.0 320.4 307.5 0.6 13.5 0.2 4.4
Arts, Entertainment & Recreation 32.3 30.9 30.2 1.4 2.1 4.5 7.0
Accommodation & Food Services 281.0 278.4 263.8 2.6 17.2 0.9 6.5
Other Services 106.0 105.6 105.9 0.4 0.1 0.4 0.1
Government 394.0 392.3 386.0 1.7 8.0 0.4 2.1
Federal Government 28.1 28.1 27.8 0.0 0.3 0.0 1.1
State Government 74.6 74.1 73.9 0.5 0.7 0.7 0.9
State Government Educational Services 41.0 40.7 40.4 0.3 0.6 0.7 1.5
Local Government 291.3 290.1 284.3 1.2 7.0 0.4 2.5
Local Government Educational Services 206.0 205.1 199.9 0.9 6.1 0.4 3.1
SOURCE: Texas Workforce Commission
HOUSTON—THE ECONOMY AT A GLANCE
May 2016 ©2016, Greater Houston Partnership Page 10
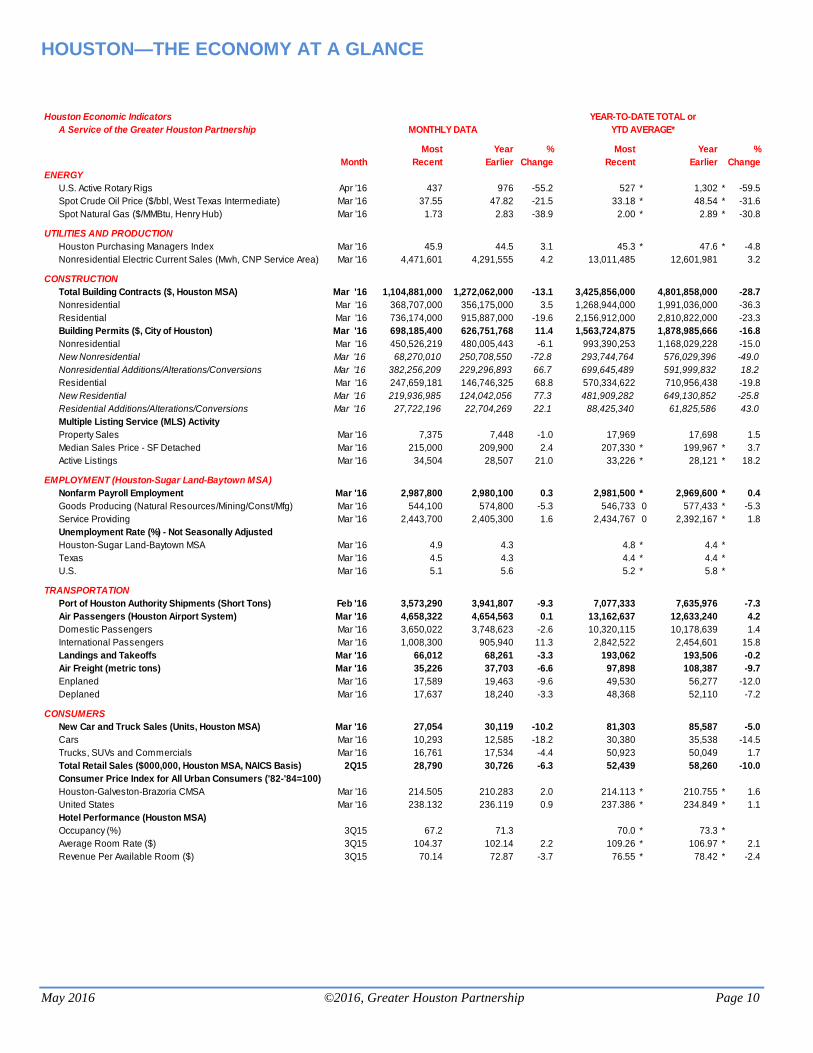
Houston Economic Indicators
A Service of the Greater Houston Partnership
Most Year % Most Year %
Month Recent Earlier Change Recent Earlier Change
ENERGY
U.S. Active Rotary Rigs Apr '16 437 976 -55.2 527 * 1,302 * -59.5
Spot Crude Oil Price ($/bbl, West Texas Intermediate) Mar '16 37.55 47.82 -21.5 33.18 * 48.54 * -31.6
Spot Natural Gas ($/MMBtu, Henry Hub) Mar '16 1.73 2.83 -38.9 2.00 * 2.89 * -30.8
UTILITIES AND PRODUCTION
Houston Purchasing Managers Index Mar '16 45.9 44.5 3.1 45.3 * 47.6 * -4.8
Nonresidential Electric Current Sales (Mwh, CNP Service Area) Mar '16 4,471,601 4,291,555 4.2 13,011,485 12,601,981 3.2
CONSTRUCTION
Total Building Contracts ($, Houston MSA) Mar '16 1,104,881,000 1,272,062,000 -13.1 3,425,856,000 4,801,858,000 -28.7
Nonresidential Mar '16 368,707,000 356,175,000 3.5 1,268,944,000 1,991,036,000 -36.3
Residential Mar '16 736,174,000 915,887,000 -19.6 2,156,912,000 2,810,822,000 -23.3
Building Permits ($, City of Houston) Mar '16 698,185,400 626,751,768 11.4 1,563,724,875 1,878,985,666 -16.8
Nonresidential Mar '16 450,526,219 480,005,443 -6.1 993,390,253 1,168,029,228 -15.0
New Nonresidential Mar '16 68,270,010 250,708,550 -72.8 293,744,764 576,029,396 -49.0
Nonresidential Additions/Alterations/Conversions Mar '16 382,256,209 229,296,893 66.7 699,645,489 591,999,832 18.2
Residential Mar '16 247,659,181 146,746,325 68.8 570,334,622 710,956,438 -19.8
New Residential Mar '16 219,936,985 124,042,056 77.3 481,909,282 649,130,852 -25.8
Residential Additions/Alterations/Conversions Mar '16 27,722,196 22,704,269 22.1 88,425,340 61,825,586 43.0
Multiple Listing Service (MLS) Activity
Property Sales Mar '16 7,375 7,448 -1.0 17,969 17,698 1.5
Median Sales Price - SF Detached Mar '16 215,000 209,900 2.4 207,330 * 199,967 * 3.7
Active Listings Mar '16 34,504 28,507 21.0 33,226 * 28,121 * 18.2
EMPLOYMENT (Houston-Sugar Land-Baytown MSA)
Nonfarm Payroll Employment Mar '16 2,987,800 2,980,100 0.3 2,981,500 * 2,969,600 * 0.4
Goods Producing (Natural Resources/Mining/Const/Mfg) Mar '16 544,100 574,800 -5.3 546,733 0 577,433 * -5.3
Service Providing Mar '16 2,443,700 2,405,300 1.6 2,434,767 0 2,392,167 * 1.8
Unemployment Rate (%) - Not Seasonally Adjusted
Houston-Sugar Land-Baytown MSA Mar '16 4.9 4.3 4.8 * 4.4 *
Texas Mar '16 4.5 4.3 4.4 * 4.4 *
U.S. Mar '16 5.1 5.6 5.2 * 5.8 *
TRANSPORTATION
Port of Houston Authority Shipments (Short Tons) Feb '16 3,573,290 3,941,807 -9.3 7,077,333 7,635,976 -7.3
Air Passengers (Houston Airport System) Mar '16 4,658,322 4,654,563 0.1 13,162,637 12,633,240 4.2
Domestic Passengers Mar '16 3,650,022 3,748,623 -2.6 10,320,115 10,178,639 1.4
International Passengers Mar '16 1,008,300 905,940 11.3 2,842,522 2,454,601 15.8
Landings and Takeoffs Mar '16 66,012 68,261 -3.3 193,062 193,506 -0.2
Air Freight (metric tons) Mar '16 35,226 37,703 -6.6 97,898 108,387 -9.7
Enplaned Mar '16 17,589 19,463 -9.6 49,530 56,277 -12.0
Deplaned Mar '16 17,637 18,240 -3.3 48,368 52,110 -7.2
CONSUMERS
New Car and Truck Sales (Units, Houston MSA) Mar '16 27,054 30,119 -10.2 81,303 85,587 -5.0
Cars Mar '16 10,293 12,585 -18.2 30,380 35,538 -14.5
Trucks, SUVs and Commercials Mar '16 16,761 17,534 -4.4 50,923 50,049 1.7
Total Retail Sales ($000,000, Houston MSA, NAICS Basis) 2Q15 28,790 30,726 -6.3 52,439 58,260 -10.0
Consumer Price Index for All Urban Consumers ('82-'84=100)
Houston-Galveston-Brazoria CMSA Mar '16 214.505 210.283 2.0 214.113 * 210.755 * 1.6
United States Mar '16 238.132 236.119 0.9 237.386 * 234.849 * 1.1
Hotel Performance (Houston MSA)
Occupancy (%) 3Q15 67.2 71.3 70.0 * 73.3 *
Average Room Rate ($) 3Q15 104.37 102.14 2.2 109.26 * 106.97 * 2.1
Revenue Per Available Room ($) 3Q15 70.14 72.87 -3.7 76.55 * 78.42 * -2.4
YEAR-TO-DATE TOTAL or
YTD AVERAGE*MONTHLY DATA
HOUSTON—THE ECONOMY AT A GLANCE
May 2016 ©2016, Greater Houston Partnership Page 11
Sources Rig Count Baker Hughes Incorporated Spot WTI, Spot Natural Gas U.S. Energy Information Admin. Houston Purchasing Managers National Association of Index Purchasing Management – Houston, Inc. Electricity CenterPoint Energy Building Construction Contracts McGraw-Hill Construction City of Houston Building Permits Building Permit Department, City of Houston
MLS Data Houston Association of Realtors Employment, Unemployment Texas Workforce Commission
Port Shipments Port of Houston Authority Aviation Aviation Department, City of Houston Car and Truck Sales TexAuto Facts Report, InfoNation, Inc.,
Sugar Land TX Retail Sales Texas Comptroller’s Office Consumer Price Index U.S. Bureau of Labor Statistics Hotels PKF Consulting/HospitalityAsset Advisors International Postings, Foreclosures Foreclosure Information &Listing Service
HOUSTON—THE ECONOMY AT A GLANCE
May 2016 ©2016, Greater Houston Partnership Page 12
-150
-120
-90
-60
-30
0
30
60
90
120
150
2,000
2,100
2,200
2,300
2,400
2,500
2,600
2,700
2,800
2,900
3,000
3,100
'06 '07 '08 '09 '10 '11 '12 '13 '14 '15 '16 '17
12
-Mo
nth
Ch
ange
(0
00
)
No
nfa
rm P
ayro
ll Em
plo
yme
nt
(00
0)
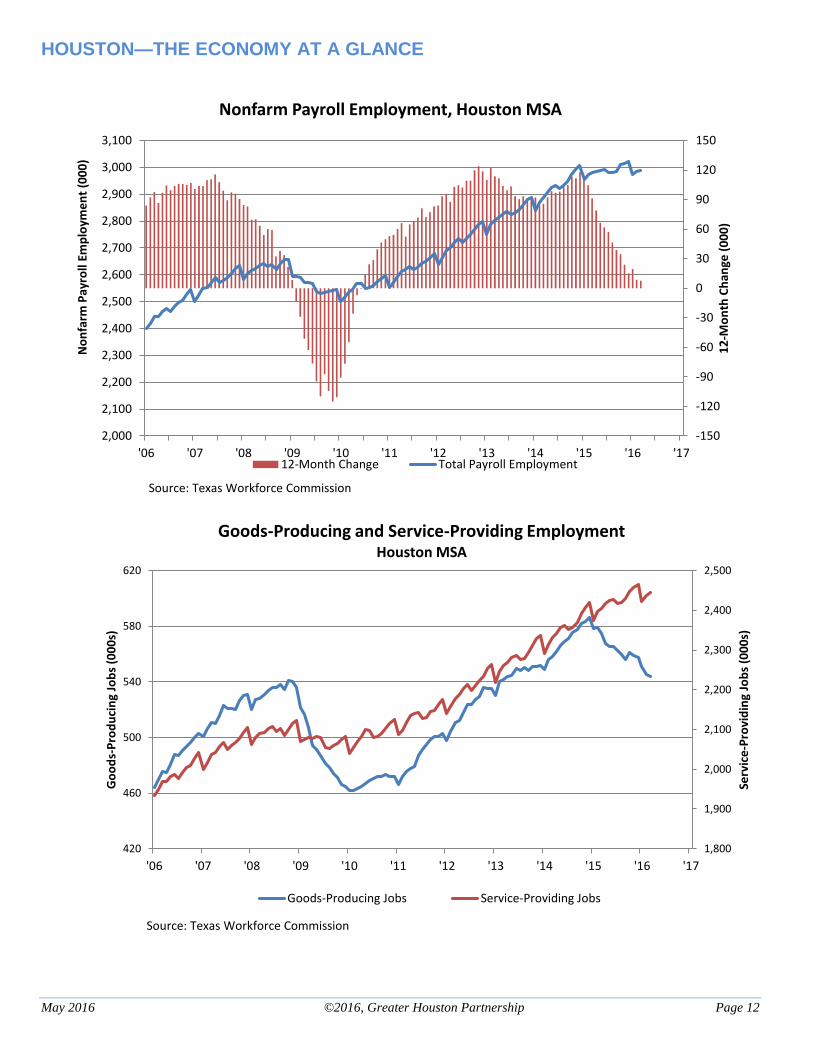
Source: Texas Workforce Commission
Nonfarm Payroll Employment, Houston MSA
12-Month Change Total Payroll Employment
1,800
1,900
2,000
2,100
2,200
2,300
2,400
2,500
420
460
500
540
580
620
'06 '07 '08 '09 '10 '11 '12 '13 '14 '15 '16 '17
Serv
ice
-Pro
vid
ing
Job
s (0
00
s)
Go
od
s-P
rod
uci
ng
Job
s (0
00
s)
Source: Texas Workforce Commission
Goods-Producing and Service-Providing EmploymentHouston MSA
Goods-Producing Jobs Service-Providing Jobs
HOUSTON—THE ECONOMY AT A GLANCE
May 2016 ©2016, Greater Houston Partnership Page 13
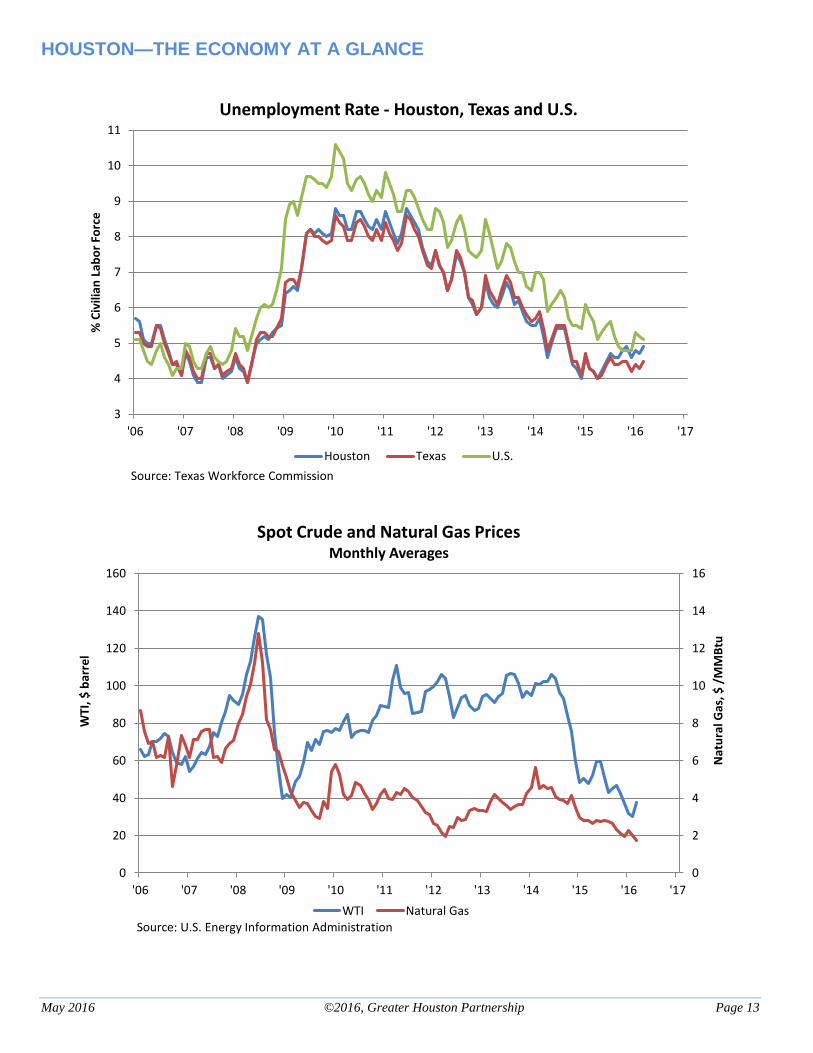
3
4
5
6
7
8
9
10
11
'06 '07 '08 '09 '10 '11 '12 '13 '14 '15 '16 '17
% C
ivili
an L
abo
r Fo
rce
Source: Texas Workforce Commission
Unemployment Rate - Houston, Texas and U.S.
Houston Texas U.S.
0
2
4
6
8
10
12
14
16
0
20
40
60
80
100
120
140
160
'06 '07 '08 '09 '10 '11 '12 '13 '14 '15 '16 '17
Nat
ura
l Gas
, $ /
MM
Btu
WTI
, $ b
arre
l
Source: U.S. Energy Information Administration
Spot Crude and Natural Gas PricesMonthly Averages
WTI Natural Gas