Embed Size (px)
DESCRIPTION
How 100 Institutions Managed Their Way to Enrollment Success in 2010. Richard Whiteside Dean, Strategic Enrollment Management Royall & Company. Presenter. Richard Whiteside, Ph.D. - PowerPoint PPT Presentation
Citation preview
www.royall.com© 2010 – Royall & Companywww.royall.com
How 100 Institutions Managed Their Way to
Enrollment Success in 2010
Richard WhitesideDean, Strategic Enrollment Management
Royall & Company
www.royall.com© 2010 – Royall & Companywww.royall.com
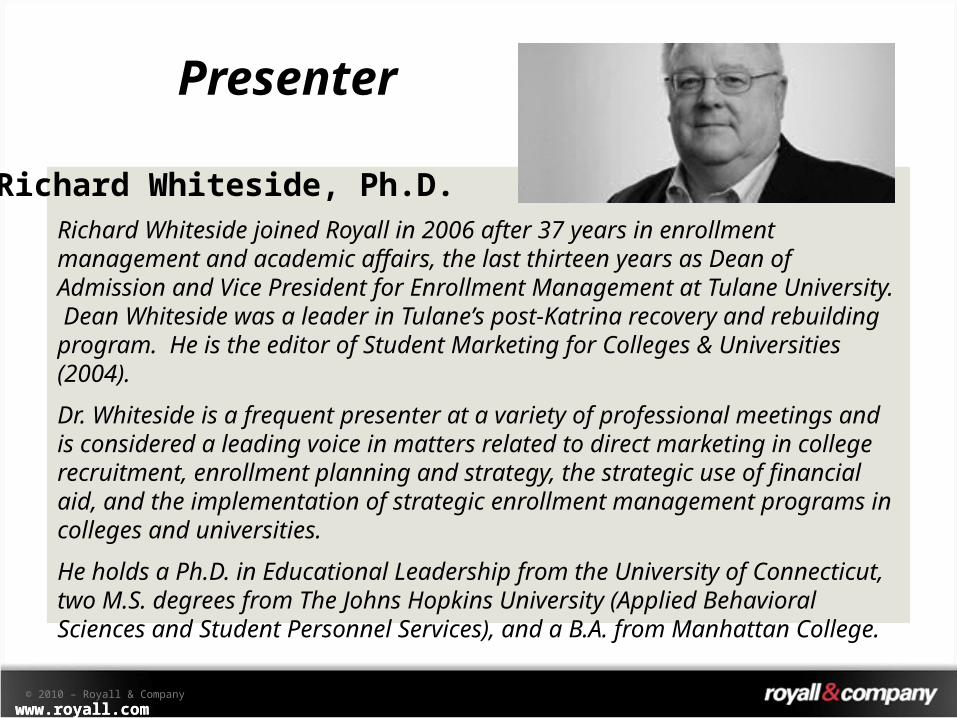
Presenter
Richard Whiteside joined Royall in 2006 after 37 years in enrollment management and academic affairs, the last thirteen years as Dean of Admission and Vice President for Enrollment Management at Tulane University. Dean Whiteside was a leader in Tulane’s post-Katrina recovery and rebuilding program. He is the editor of Student Marketing for Colleges & Universities (2004).
Dr. Whiteside is a frequent presenter at a variety of professional meetings and is considered a leading voice in matters related to direct marketing in college recruitment, enrollment planning and strategy, the strategic use of financial aid, and the implementation of strategic enrollment management programs in colleges and universities.
He holds a Ph.D. in Educational Leadership from the University of Connecticut, two M.S. degrees from The Johns Hopkins University (Applied Behavioral Sciences and Student Personnel Services), and a B.A. from Manhattan College.
Richard Whiteside, Ph.D.
www.royall.com© 2010 – Royall & Companywww.royall.com
Dedicated exclusively to helping colleges and universities achieve their enrollment and financial goals through the use of direct marketing recruitment.
www.royall.com© 2010 – Royall & Companywww.royall.com
• Full-service direct marketing agency
• Founded in 1983• Located in Richmond, Virginia• 220 full-time staff members• 200+ institutional partners• 94% year-to-year retention
www.royall.com© 2010 – Royall & Companywww.royall.com
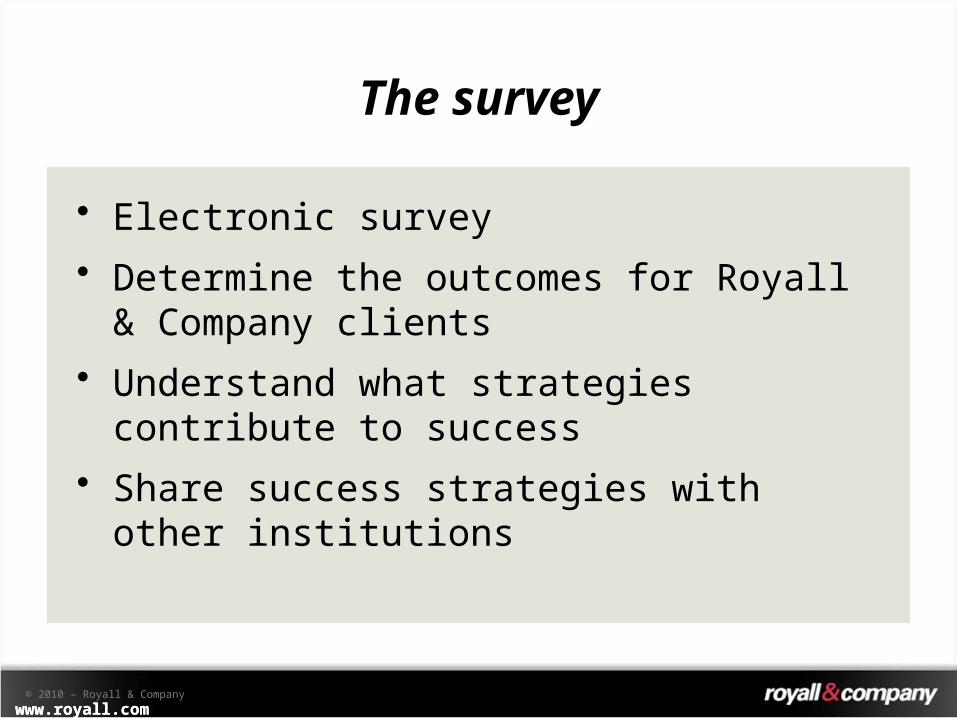
The survey
• Electronic survey• Determine the outcomes for Royall &
Company clients • Understand what strategies contribute
to success• Share success strategies with other
institutions
www.royall.com© 2010 – Royall & Companywww.royall.com
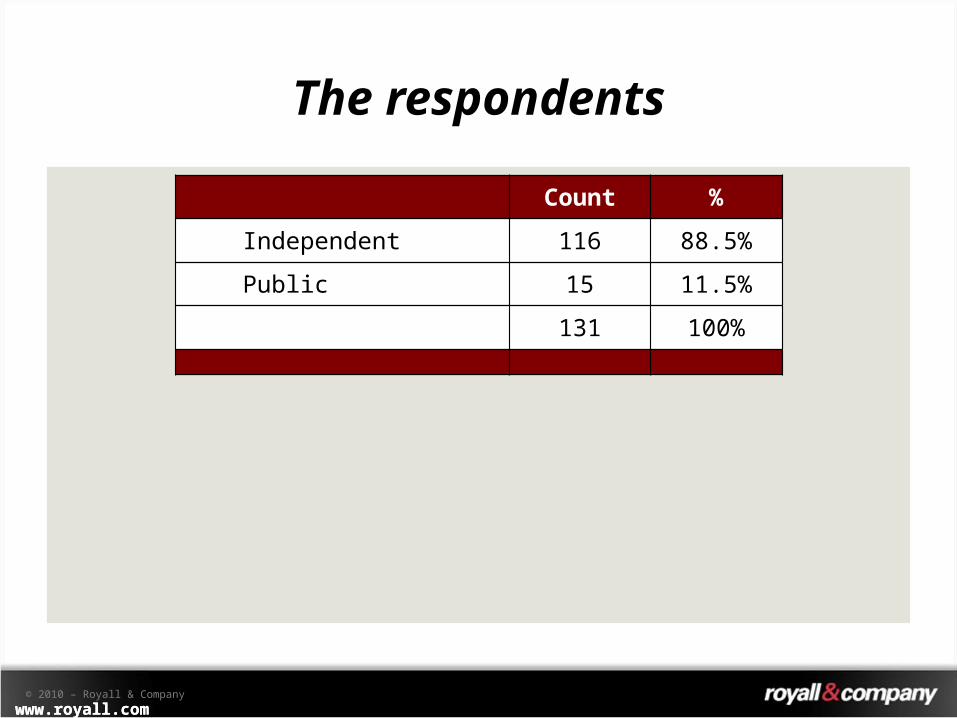
The respondentsCount %
Independent 116 88.5%
Public 15 11.5%
131 100%
www.royall.com© 2010 – Royall & Companywww.royall.com
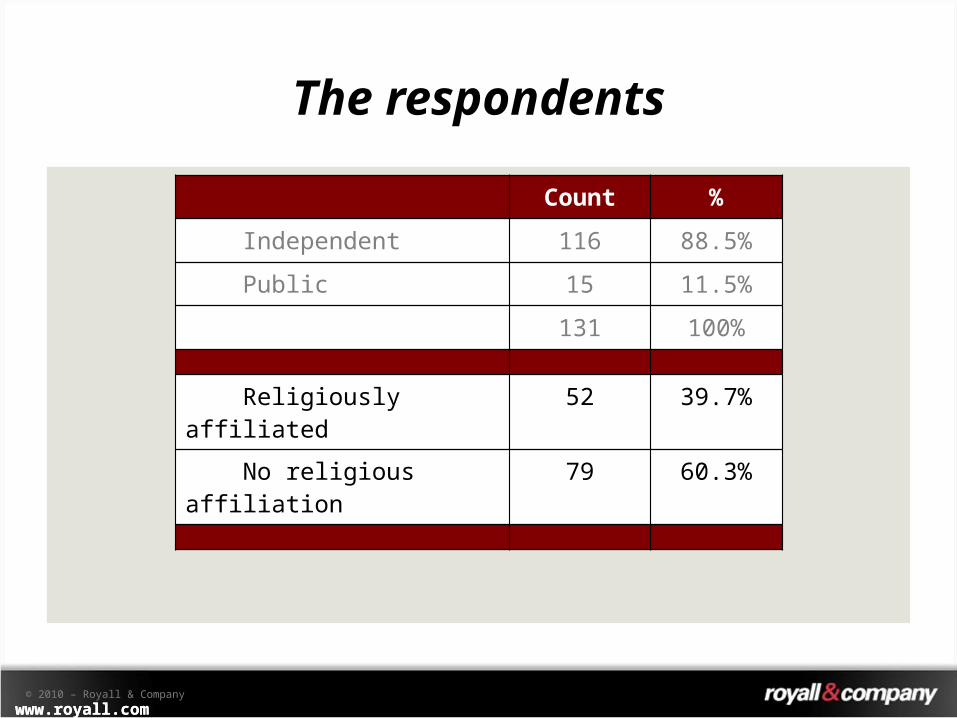
The respondentsCount %
Independent 116 88.5%
Public 15 11.5%
131 100%
Religiously affiliated 52 39.7%
No religious affiliation 79 60.3%
www.royall.com© 2010 – Royall & Companywww.royall.com
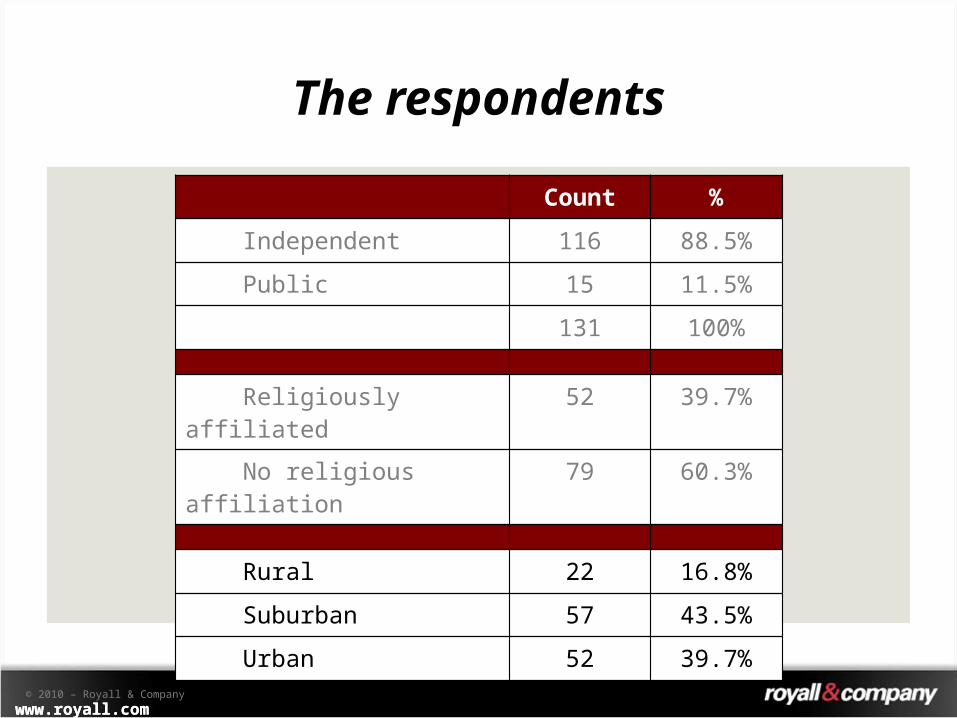
The respondentsCount %
Independent 116 88.5%
Public 15 11.5%
131 100%
Religiously affiliated 52 39.7%
No religious affiliation 79 60.3%
Rural 22 16.8%
Suburban 57 43.5%
Urban 52 39.7%
www.royall.com© 2010 – Royall & Companywww.royall.com
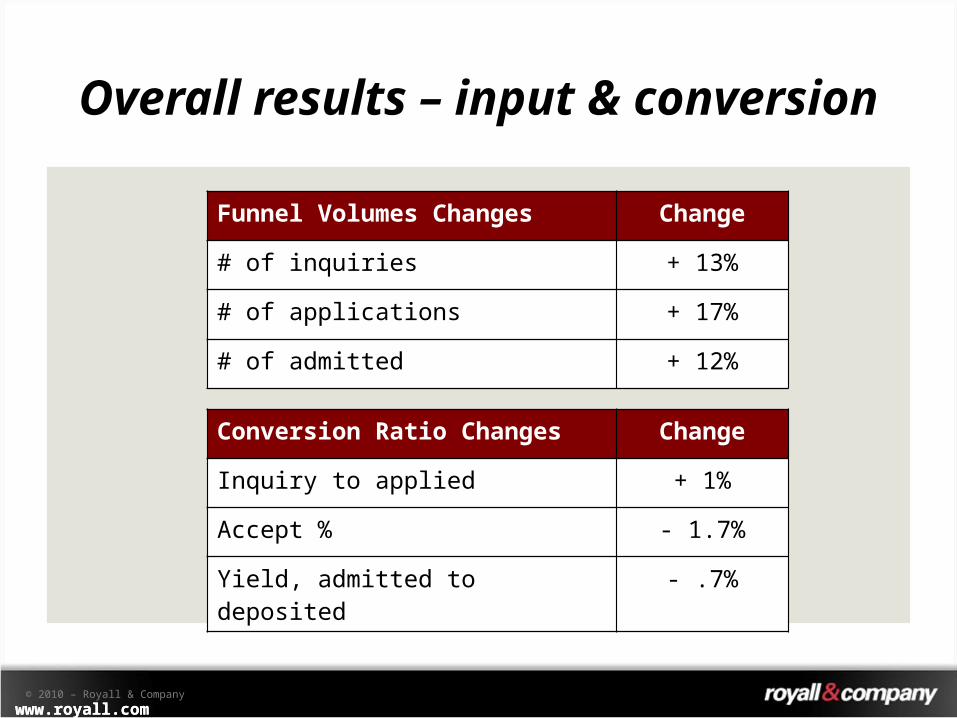
Overall results – input & conversion
Funnel Volumes Changes Change
# of inquiries + 13%
# of applications + 17%
# of admitted + 12%
Conversion Ratio Changes Change
Inquiry to applied + 1%
Accept % - 1.7%
Yield, admitted to deposited - .7%
www.royall.com© 2010 – Royall & Companywww.royall.com
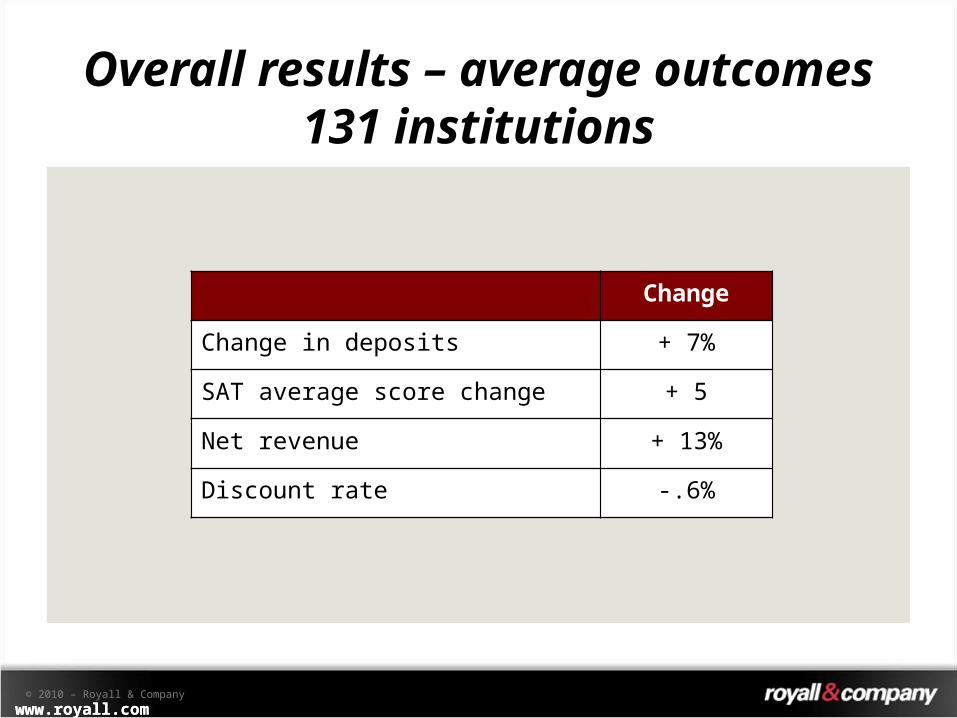
Overall results – average outcomes 131 institutions
Change
Change in deposits + 7%
SAT average score change + 5
Net revenue + 13%
Discount rate -.6%
www.royall.com© 2010 – Royall & Companywww.royall.com
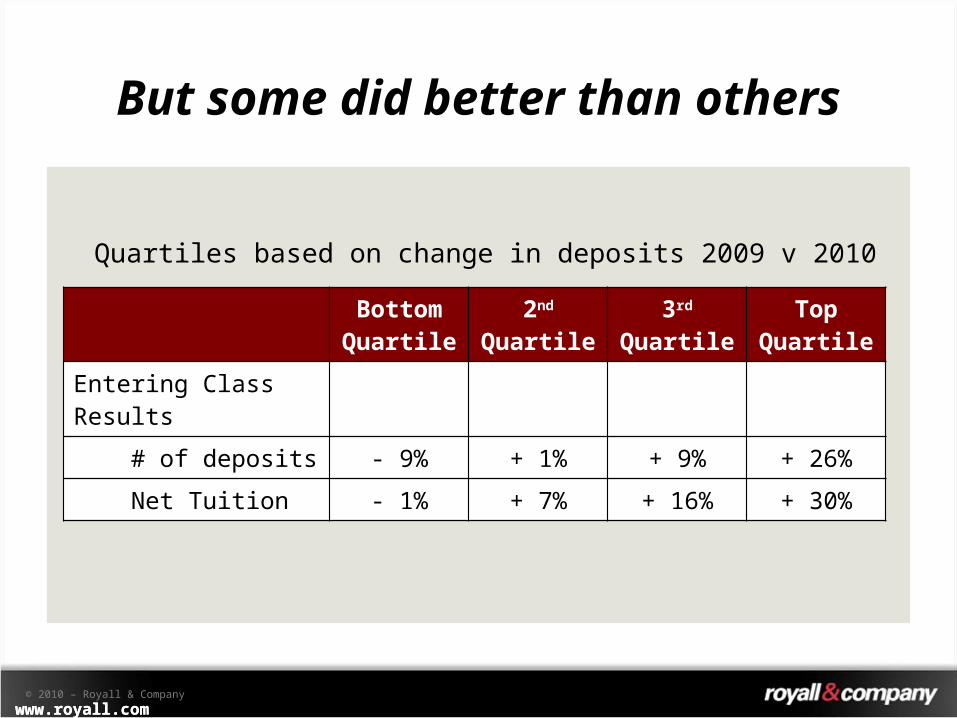
But some did better than others
Bottom Quartile
2nd Quartile
3rd Quartile
Top Quartile
Entering Class Results
# of deposits - 9% + 1% + 9% + 26%
Net Tuition - 1% + 7% + 16% + 30%
Quartiles based on change in deposits 2009 v 2010
www.royall.com© 2010 – Royall & Companywww.royall.com
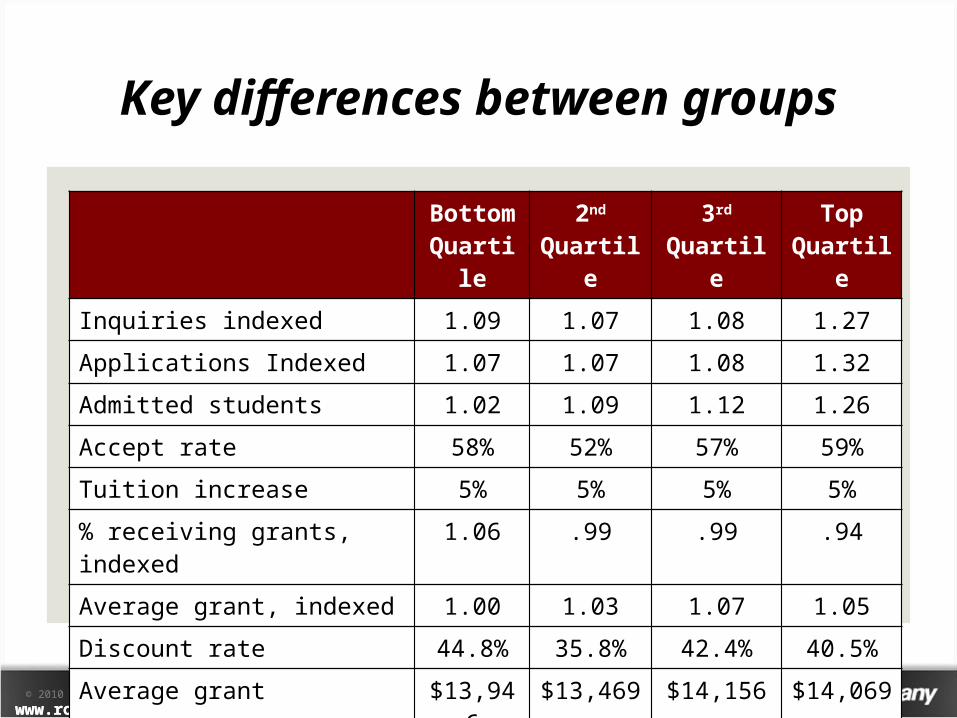
Key differences between groups
Bottom Quartile
2nd Quartile
3rd Quartile
Top Quartile
Inquiries indexed 1.09 1.07 1.08 1.27
Applications Indexed 1.07 1.07 1.08 1.32
Admitted students 1.02 1.09 1.12 1.26
Accept rate 58% 52% 57% 59%
Tuition increase 5% 5% 5% 5%
% receiving grants, indexed 1.06 .99 .99 .94
Average grant, indexed 1.00 1.03 1.07 1.05
Discount rate 44.8% 35.8% 42.4% 40.5%
Average grant $13,946 $13,469 $14,156 $14,069
www.royall.com© 2010 – Royall & Companywww.royall.com
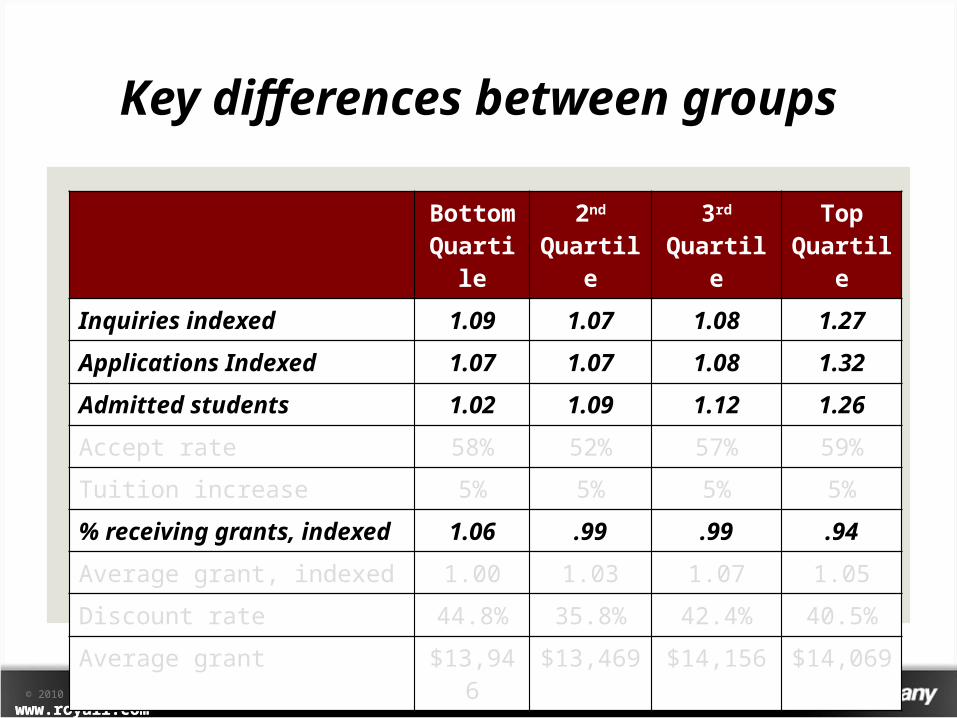
Key differences between groups
Bottom Quartile
2nd Quartile
3rd Quartile
Top Quartile
Inquiries indexed 1.09 1.07 1.08 1.27Applications Indexed 1.07 1.07 1.08 1.32Admitted students 1.02 1.09 1.12 1.26Accept rate 58% 52% 57% 59%
Tuition increase 5% 5% 5% 5%
% receiving grants, indexed 1.06 .99 .99 .94Average grant, indexed 1.00 1.03 1.07 1.05
Discount rate 44.8% 35.8% 42.4% 40.5%
Average grant $13,946 $13,469 $14,156 $14,069
www.royall.com© 2010 – Royall & Companywww.royall.com
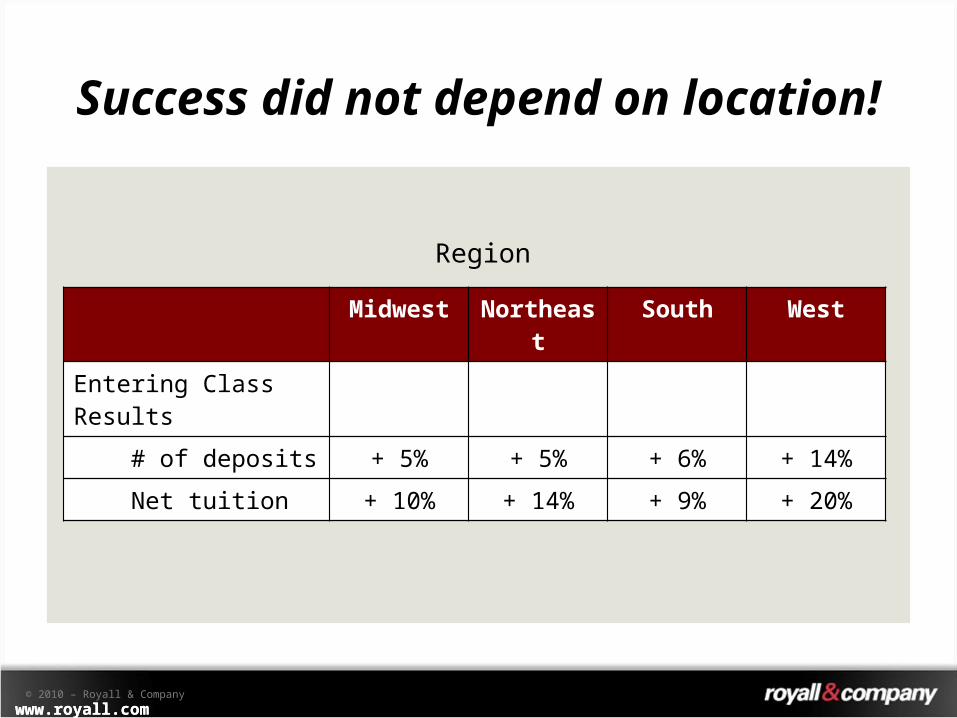
Success did not depend on location!
Midwest Northeast South WestEntering Class Results
# of deposits + 5% + 5% + 6% + 14%
Net tuition + 10% + 14% + 9% + 20%
Region
www.royall.com© 2010 – Royall & Companywww.royall.com
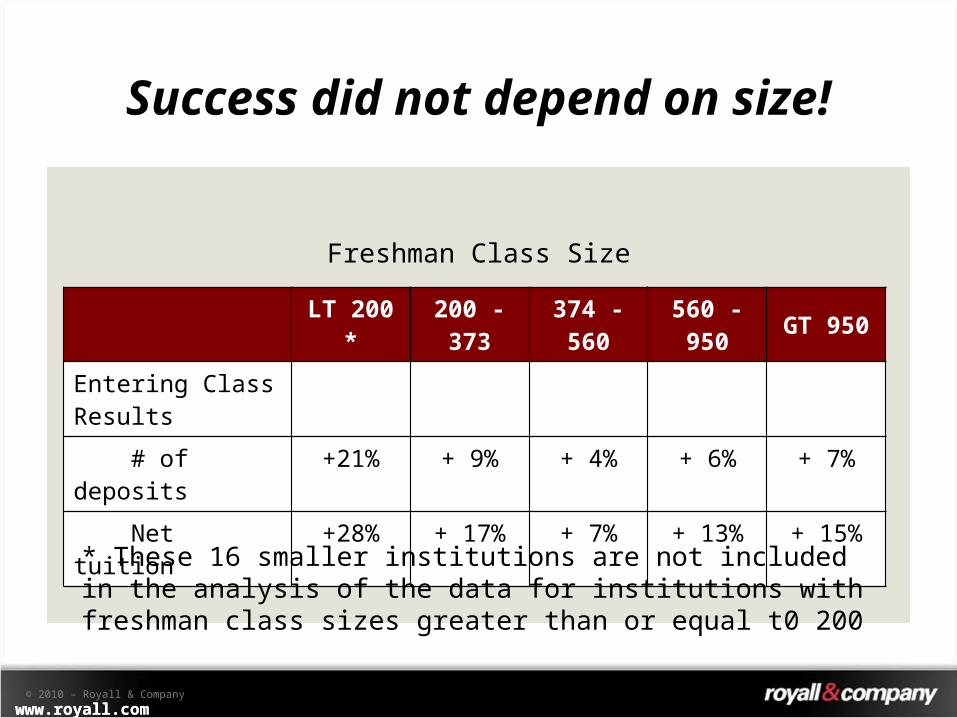
Success did not depend on size!
LT 200 * 200 - 373
374 - 560
560 - 950 GT 950
Entering Class Results # of deposits +21% + 9% + 4% + 6% + 7%
Net tuition +28% + 17% + 7% + 13% + 15%
Freshman Class Size
* These 16 smaller institutions are not included in the analysis of the data for institutions with freshman class sizes greater than or equal t0 200
www.royall.com© 2010 – Royall & Companywww.royall.com
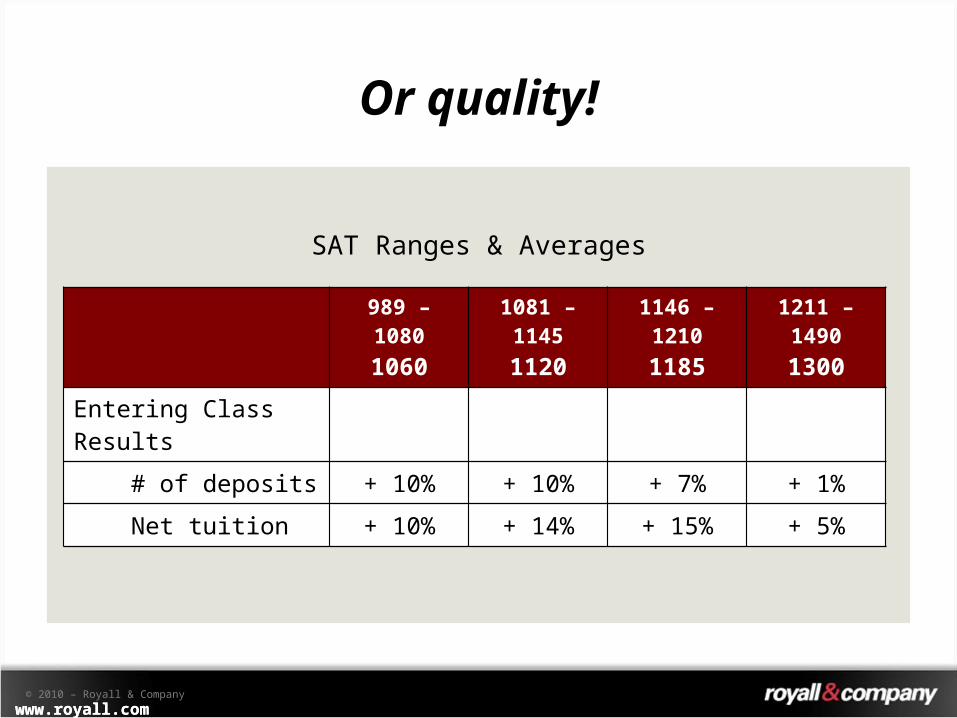
Or quality!
989 – 10801060
1081 – 11451120
1146 – 12101185
1211 – 14901300
Entering Class Results
# of deposits + 10% + 10% + 7% + 1%
Net tuition + 10% + 14% + 15% + 5%
SAT Ranges & Averages
www.royall.com© 2010 – Royall & Companywww.royall.com
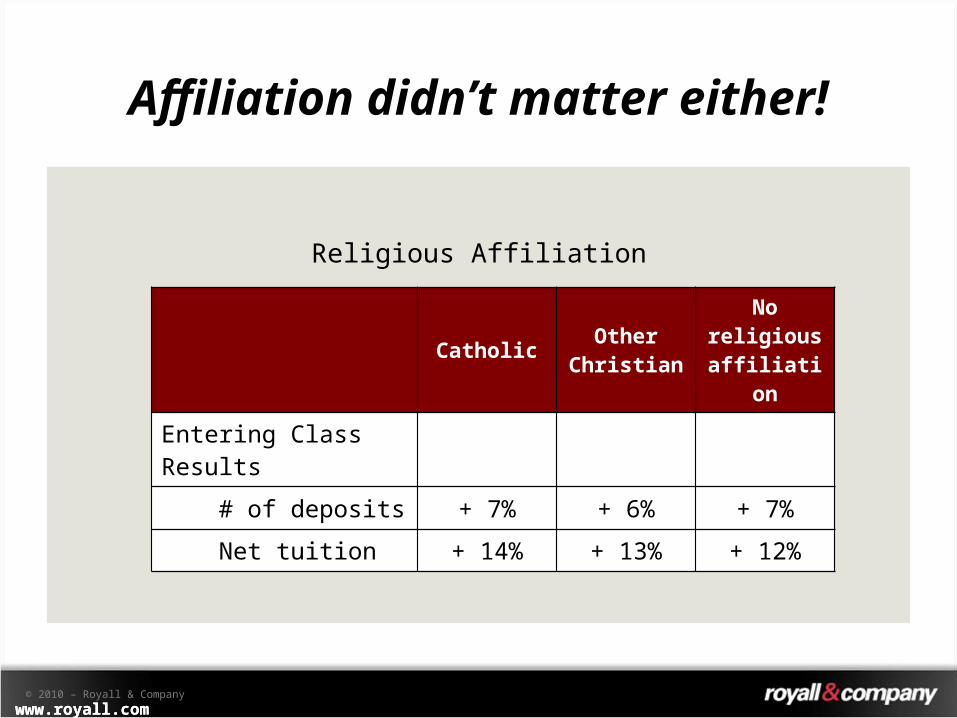
Affiliation didn’t matter either!
Catholic Other Christian
No religious affiliation
Entering Class Results
# of deposits + 7% + 6% + 7%
Net tuition + 14% + 13% + 12%
Religious Affiliation
www.royall.com© 2010 – Royall & Companywww.royall.com
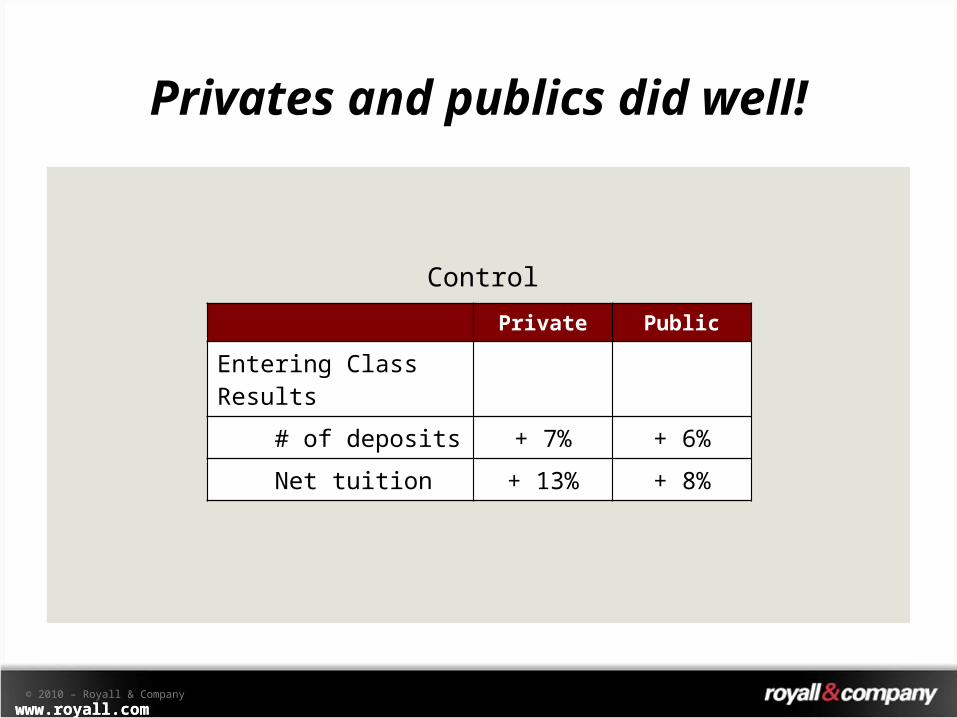
Privates and publics did well!
Private Public
Entering Class Results
# of deposits + 7% + 6%
Net tuition + 13% + 8%
Control
www.royall.com© 2010 – Royall & Companywww.royall.com
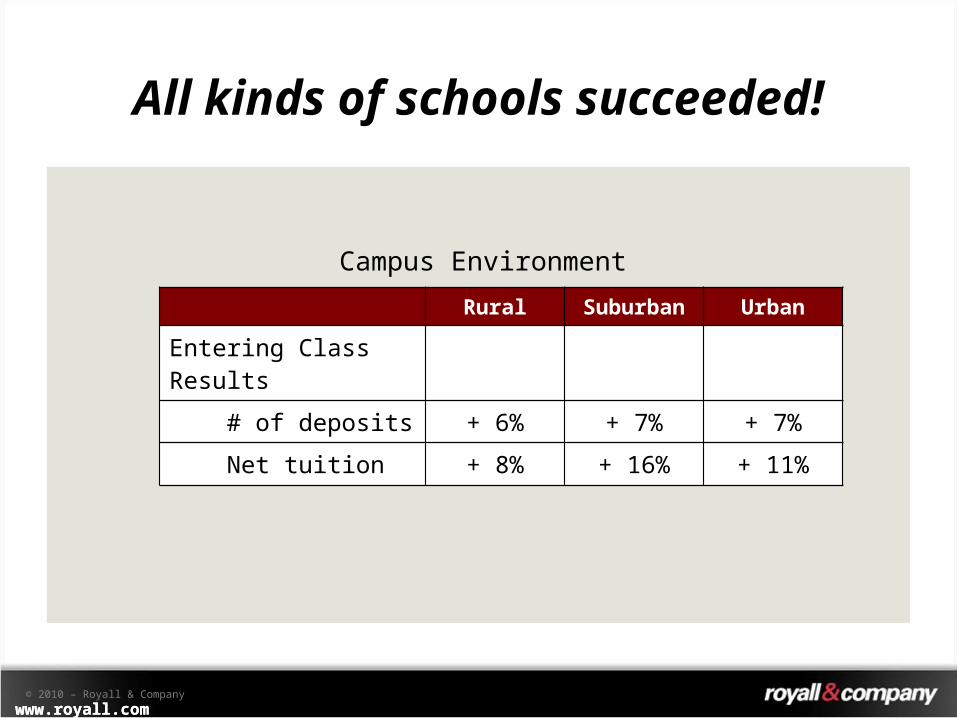
All kinds of schools succeeded!
Rural Suburban Urban
Entering Class Results
# of deposits + 6% + 7% + 7%
Net tuition + 8% + 16% + 11%
Campus Environment

www.royall.com© 2010 – Royall & Companywww.royall.com
Success depended less on who you are than what you did!
www.royall.com© 2010 – Royall & Companywww.royall.com
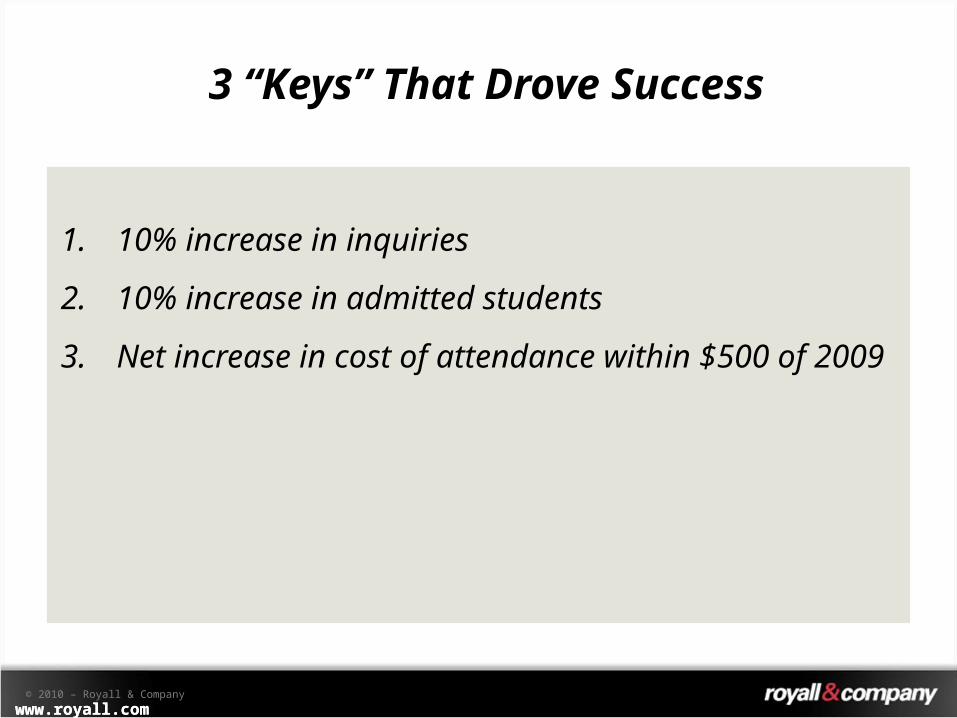
3 “Keys” That Drove Success
1. 10% increase in inquiries
2. 10% increase in admitted students
3. Net increase in cost of attendance within $500 of 2009
www.royall.com© 2010 – Royall & Companywww.royall.com
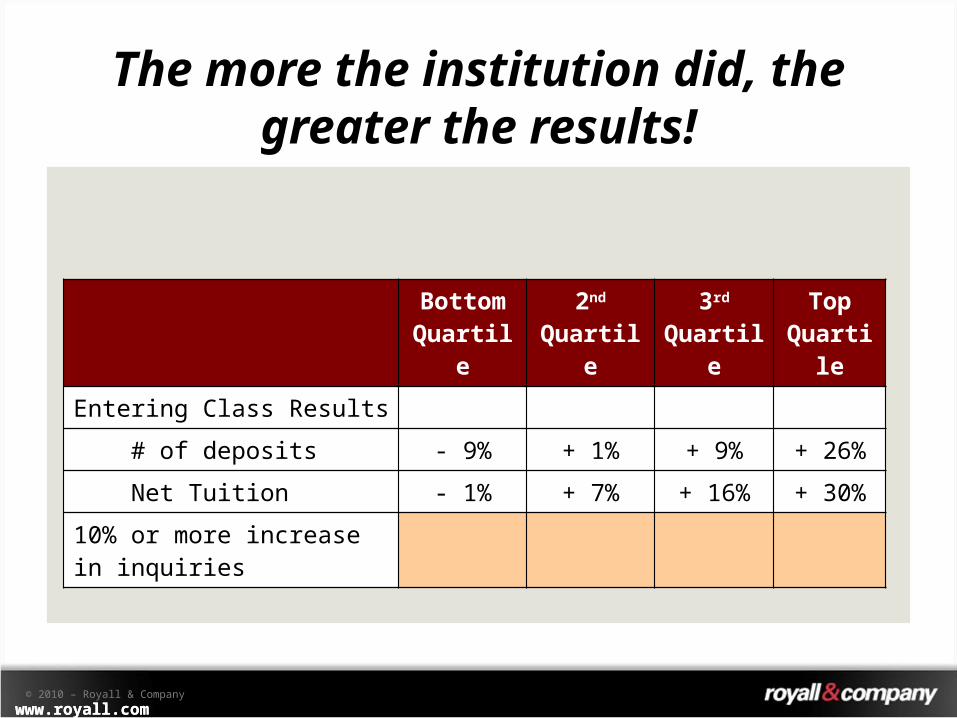
The more the institution did, the greater the results!
Bottom Quartile
2nd Quartile
3rd Quartile
Top Quartile
Entering Class Results
# of deposits - 9% + 1% + 9% + 26%
Net Tuition - 1% + 7% + 16% + 30%
10% or more increase in inquiries
www.royall.com© 2010 – Royall & Companywww.royall.com
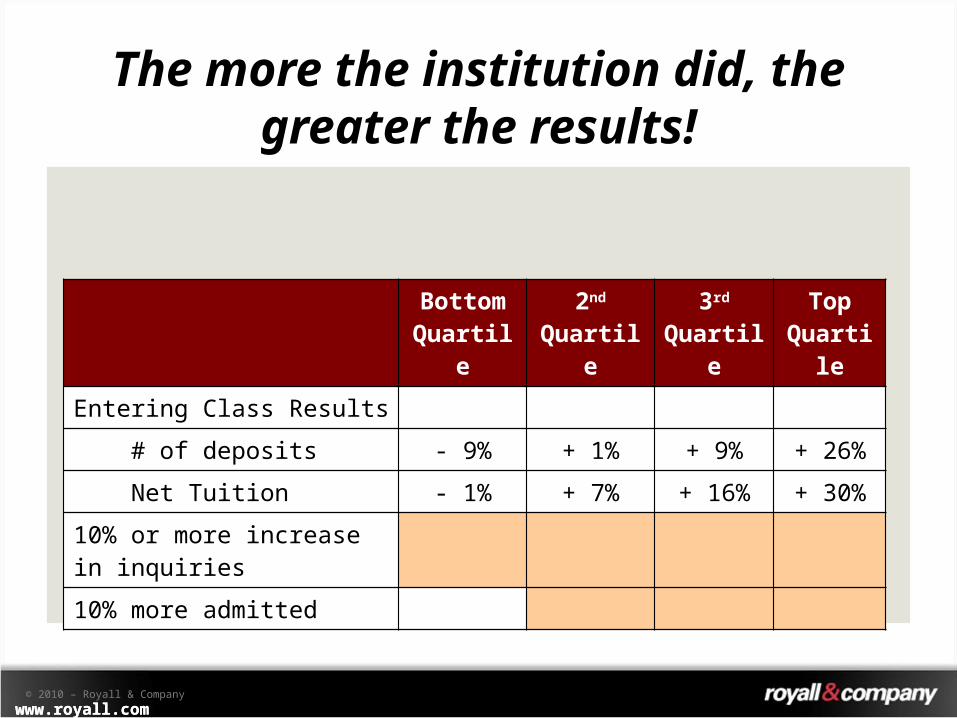
The more the institution did, the greater the results!
Bottom Quartile
2nd Quartile
3rd Quartile
Top Quartile
Entering Class Results
# of deposits - 9% + 1% + 9% + 26%
Net Tuition - 1% + 7% + 16% + 30%
10% or more increase in inquiries 10% more admitted
www.royall.com© 2010 – Royall & Companywww.royall.com
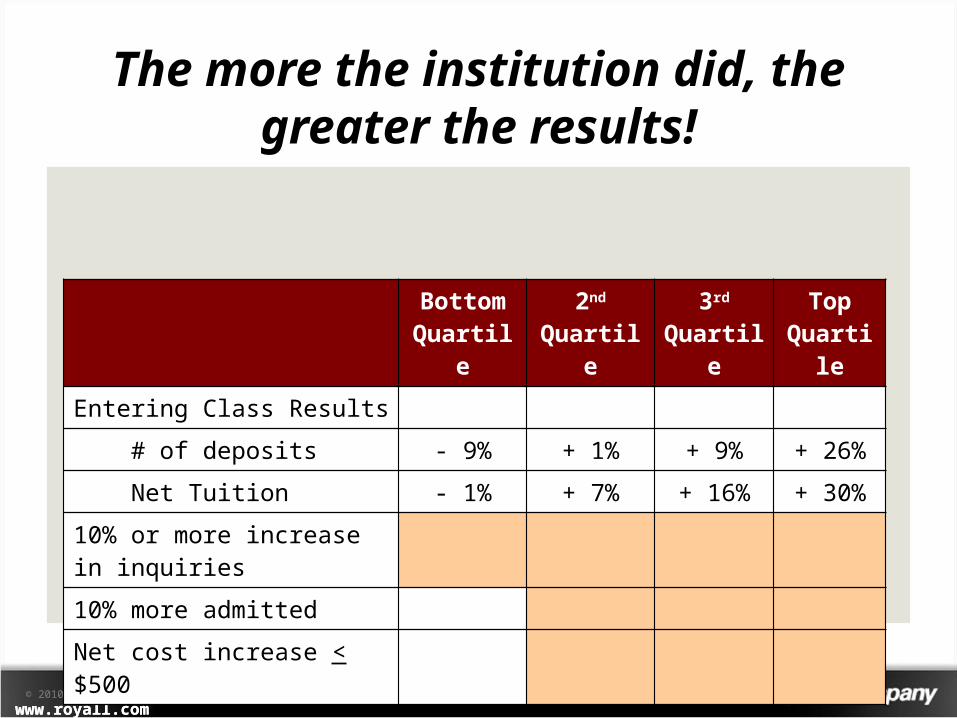
The more the institution did, the greater the results!
Bottom Quartile
2nd Quartile
3rd Quartile
Top Quartile
Entering Class Results
# of deposits - 9% + 1% + 9% + 26%
Net Tuition - 1% + 7% + 16% + 30%
10% or more increase in inquiries 10% more admitted
Net cost increase < $500
www.royall.com© 2010 – Royall & Companywww.royall.com
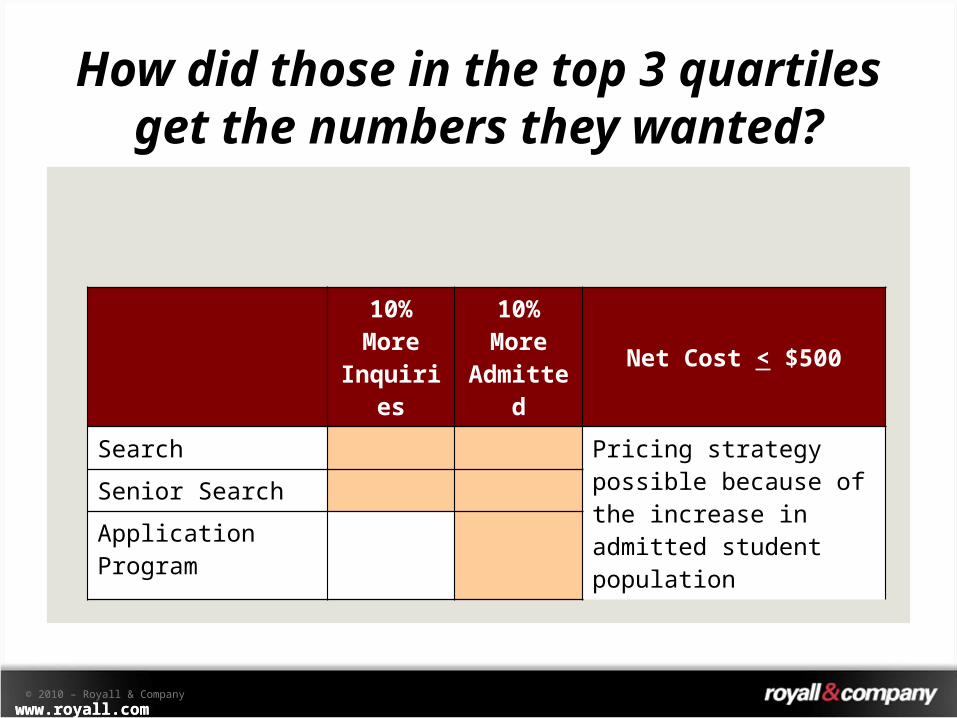
How did those in the top 3 quartiles get the numbers
they wanted?
10% More
Inquiries
10% More
AdmittedNet Cost < $500
Search Pricing strategy possible because of the increase in admitted student population
Senior Search
Application Program
www.royall.com© 2010 – Royall & Companywww.royall.com
How did they do it?
www.royall.com© 2010 – Royall & Companywww.royall.com
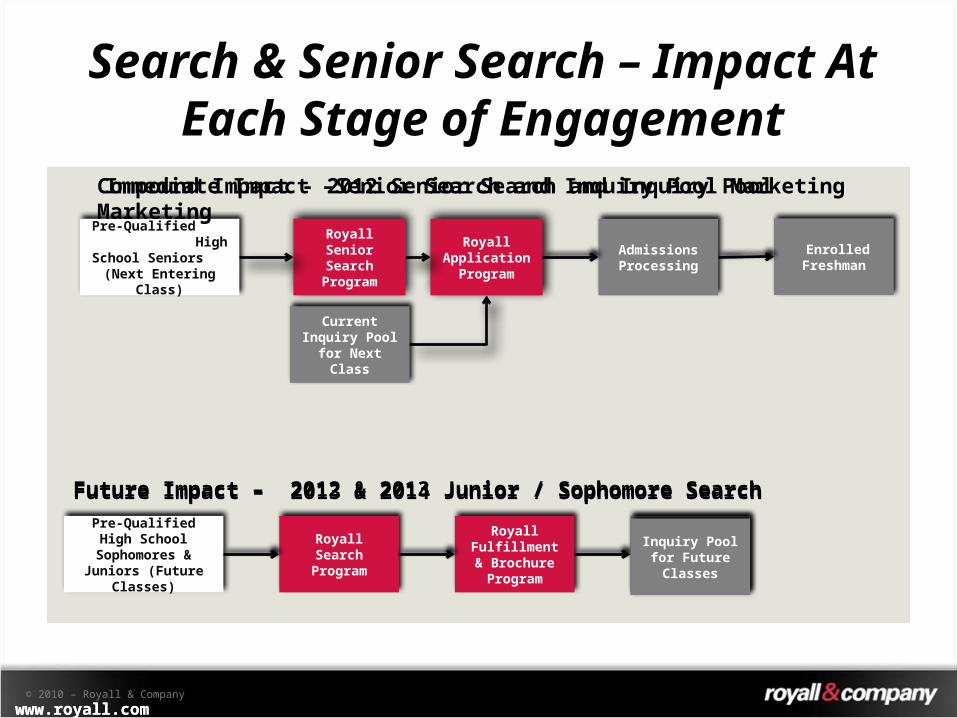
Current Inquiry Pool for Next
Class
Royall Application
Program
Search & Senior Search – Impact At Each Stage of Engagement
Pre-Qualified High School Seniors
(Next Entering Class)
Admissions Processing
Royall Senior Search
Program
Pre-Qualified High School Sophomores
& Juniors (Future Classes)
Royall Fulfillment &
Brochure Program
Royall Search Program
Inquiry Pool for Future Classes
Future Impact – 2012 & 2013 Junior / Sophomore Search
Immediate Impact –Senior Search and Inquiry Pool Marketing
Enrolled Freshman
Compound Impact - 2012 Senior Search and Inquiry Pool Marketing
Future Impact – 2013 & 2014 Junior / Sophomore Search
Inquiry Pool for Future Classes
www.royall.com© 2010 – Royall & Companywww.royall.com
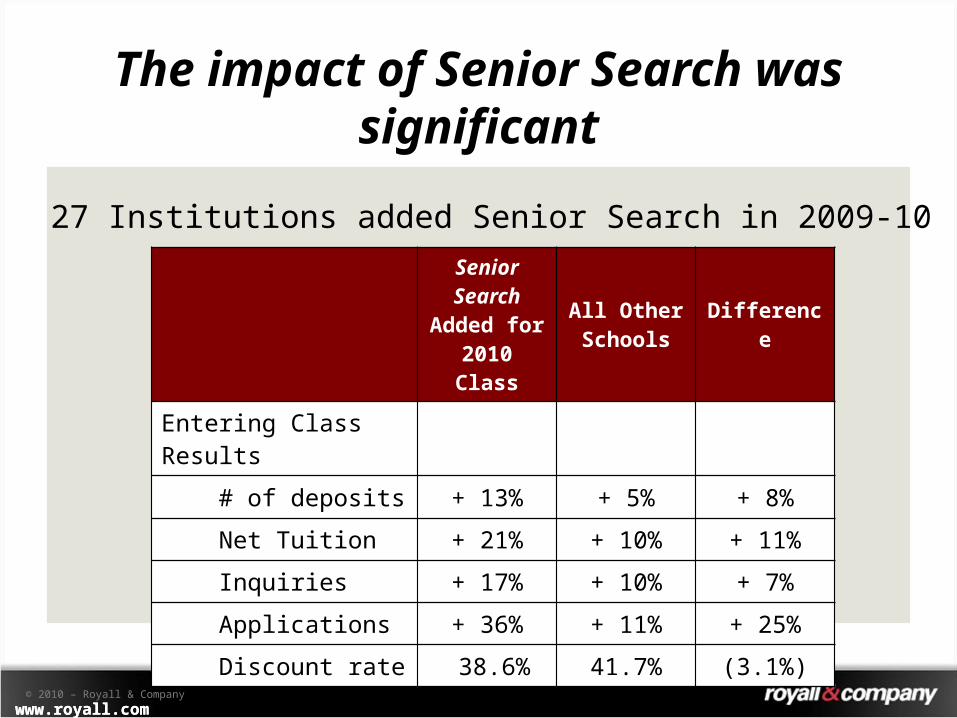
The impact of Senior Search was significant
Senior Search
Added for 2010 Class
All Other Schools Difference
Entering Class Results
# of deposits + 13% + 5% + 8%
Net Tuition + 21% + 10% + 11%
Inquiries + 17% + 10% + 7%
Applications + 36% + 11% + 25%
Discount rate 38.6% 41.7% (3.1%)
27 Institutions added Senior Search in 2009-10
www.royall.com© 2010 – Royall & Companywww.royall.com
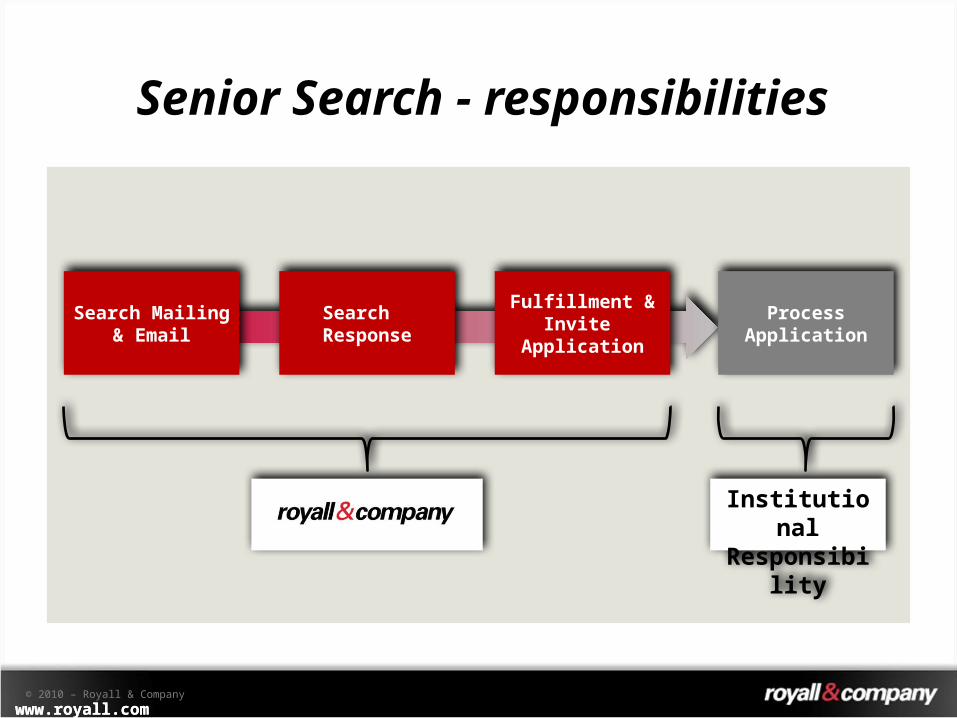
Institutional Responsibility
Senior Search - responsibilities
Search Mailing & Email
Search Response
Fulfillment &
Invite Application
Process Application
www.royall.com© 2010 – Royall & Companywww.royall.com
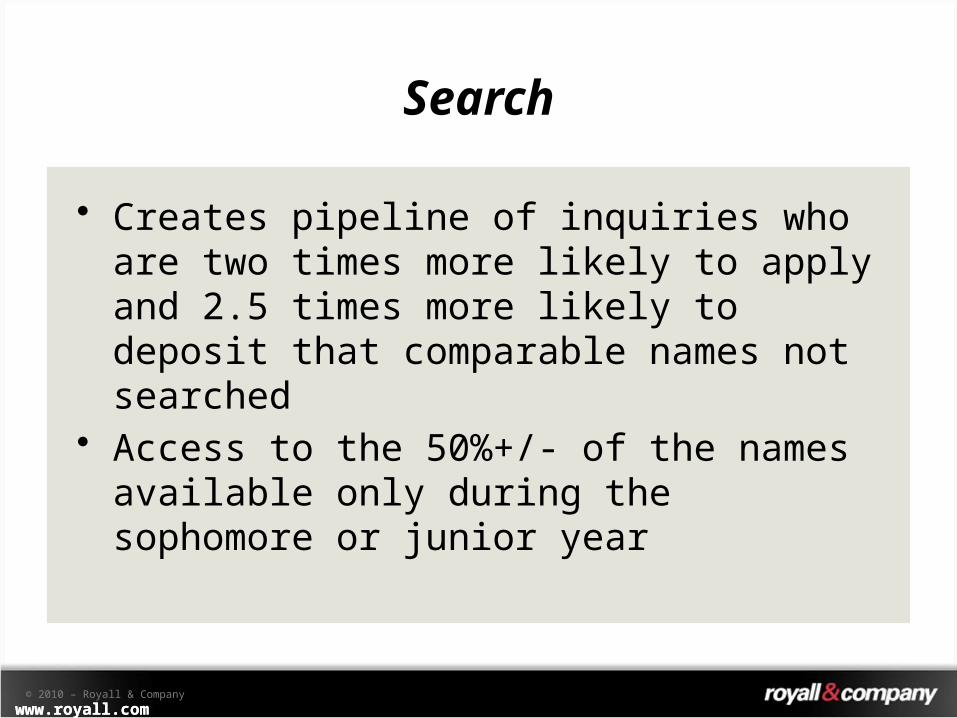
Search
• Creates pipeline of inquiries who are two times more likely to apply and 2.5 times more likely to deposit that comparable names not searched
• Access to the 50%+/- of the names available only during the sophomore or junior year
www.royall.com© 2010 – Royall & Companywww.royall.com
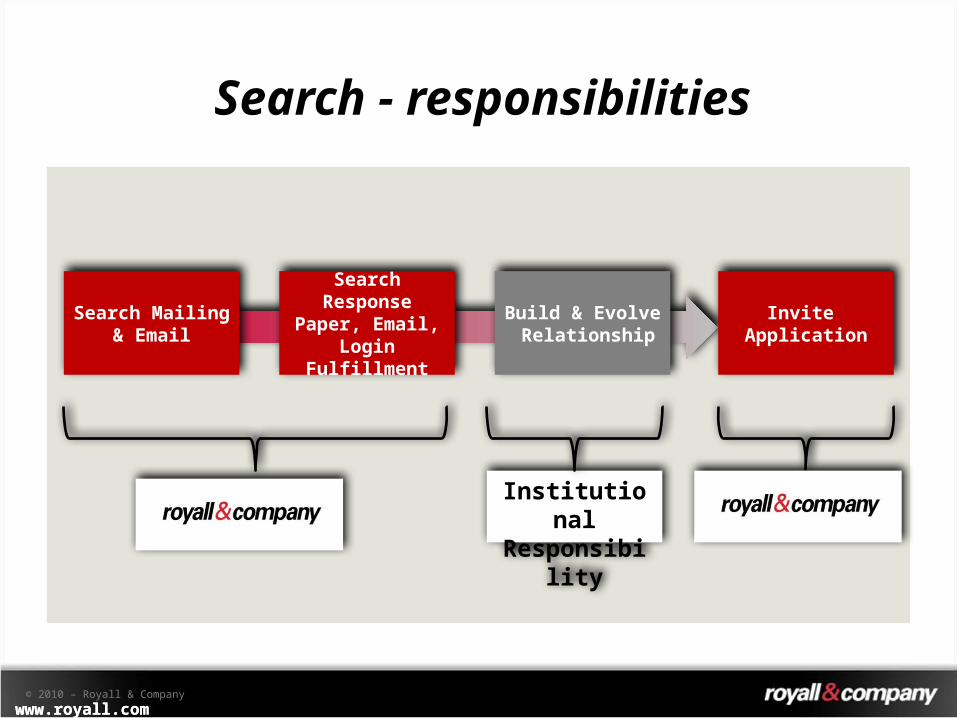
Institutional Responsibility
Search - responsibilities
Search Mailing & Email
Search Response Paper, Email,
Login Fulfillment
Build & Evolve Relationship
Invite Application
www.royall.com© 2010 – Royall & Companywww.royall.com
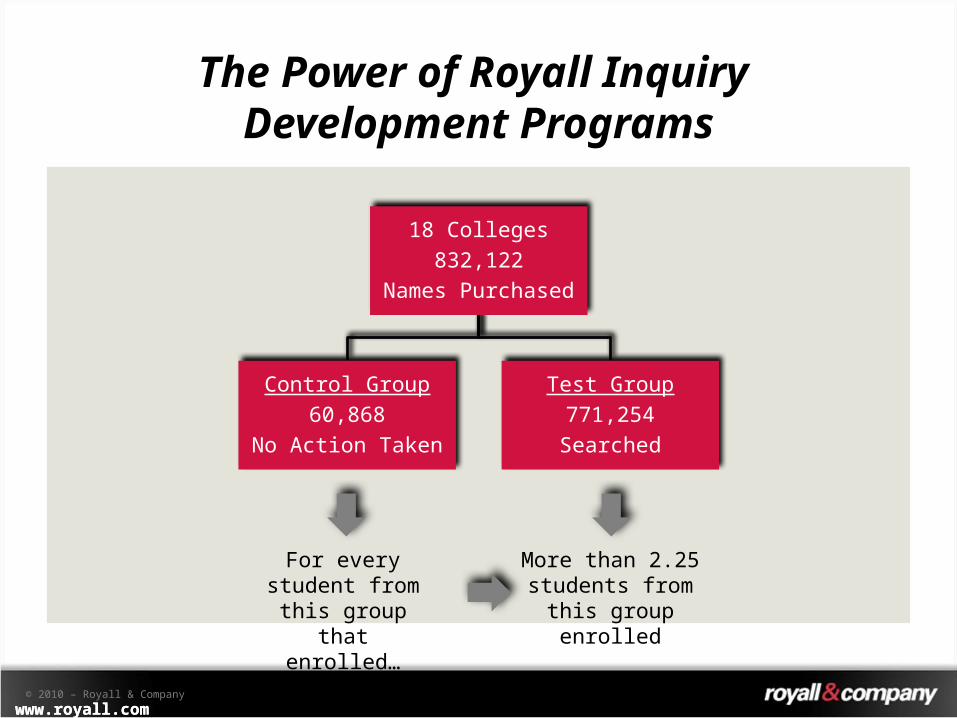
The Power of Royall Inquiry Development Programs
18 Colleges832,122
Names Purchased
Control Group60,868
No Action Taken
Test Group771,254
Searched
More than 2.25 students from this
group enrolled
For every student from this group that
enrolled…
www.royall.com© 2010 – Royall & Companywww.royall.com
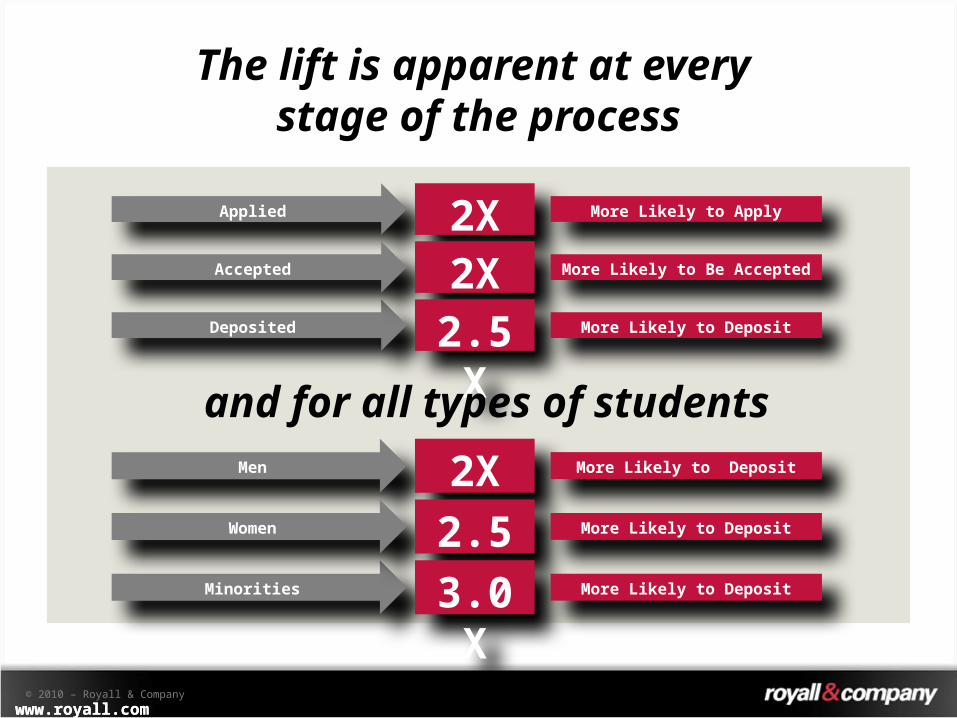
The lift is apparent at every stage of the process
Applied
Deposited
Accepted
2X More Likely to Apply
2X More Likely to Be Accepted
2.5X More Likely to Deposit
and for all types of studentsMen
Minorities
Women
2X More Likely to Deposit
2.5X More Likely to Deposit
3.0X More Likely to Deposit
www.royall.com© 2010 – Royall & Companywww.royall.com
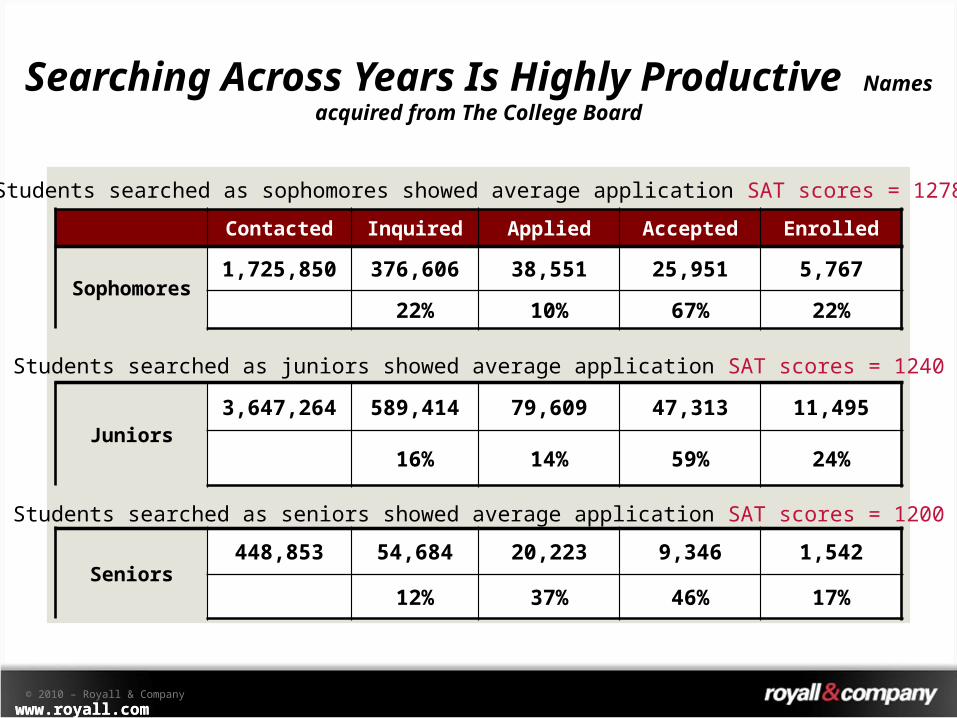
Juniors3,647,264 589,414 79,609 47,313 11,495
16% 14% 59% 24%
Contacted Inquired Applied Accepted Enrolled
Sophomores1,725,850 376,606 38,551 25,951 5,767
22% 10% 67% 22%
Students searched as sophomores showed average application SAT scores = 1278
Students searched as juniors showed average application SAT scores = 1240
Students searched as seniors showed average application SAT scores = 1200
Seniors448,853 54,684 20,223 9,346 1,542
12% 37% 46% 17%
Searching Across Years Is Highly Productive Names acquired from The College Board
www.royall.com© 2010 – Royall & Companywww.royall.com
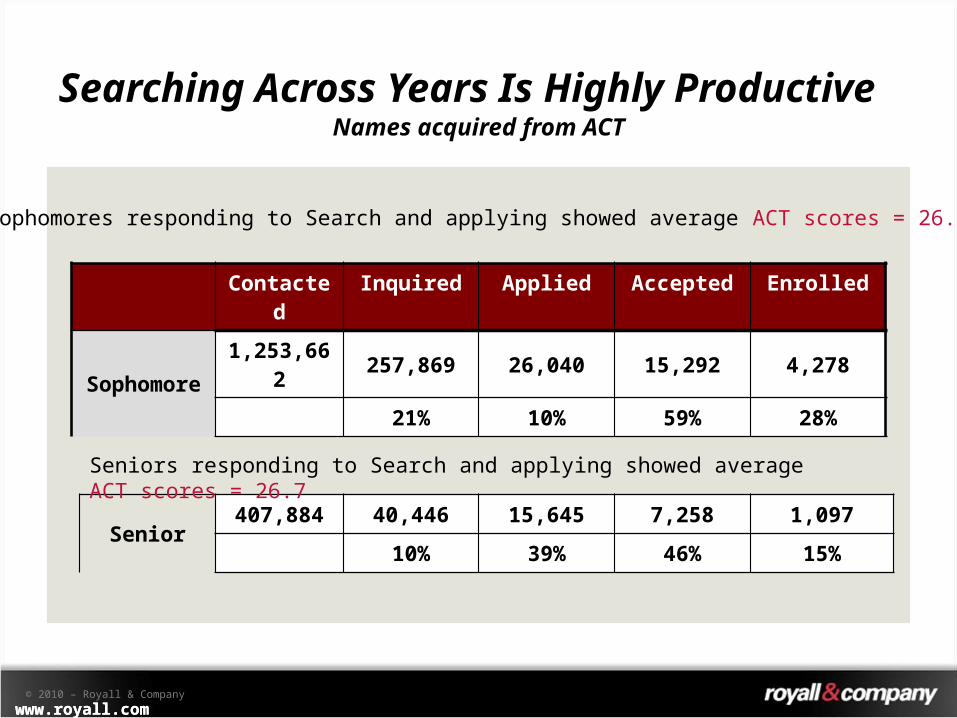
Contacted Inquired Applied Accepted Enrolled
Sophomore1,253,662 257,869 26,040 15,292 4,278
21% 10% 59% 28%
Sophomores responding to Search and applying showed average ACT scores = 26.6
Senior407,884 40,446 15,645 7,258 1,097
10% 39% 46% 15%
Seniors responding to Search and applying showed average ACT scores = 26.7
Searching Across Years Is Highly Productive
Names acquired from ACT
www.royall.com© 2010 – Royall & Companywww.royall.com
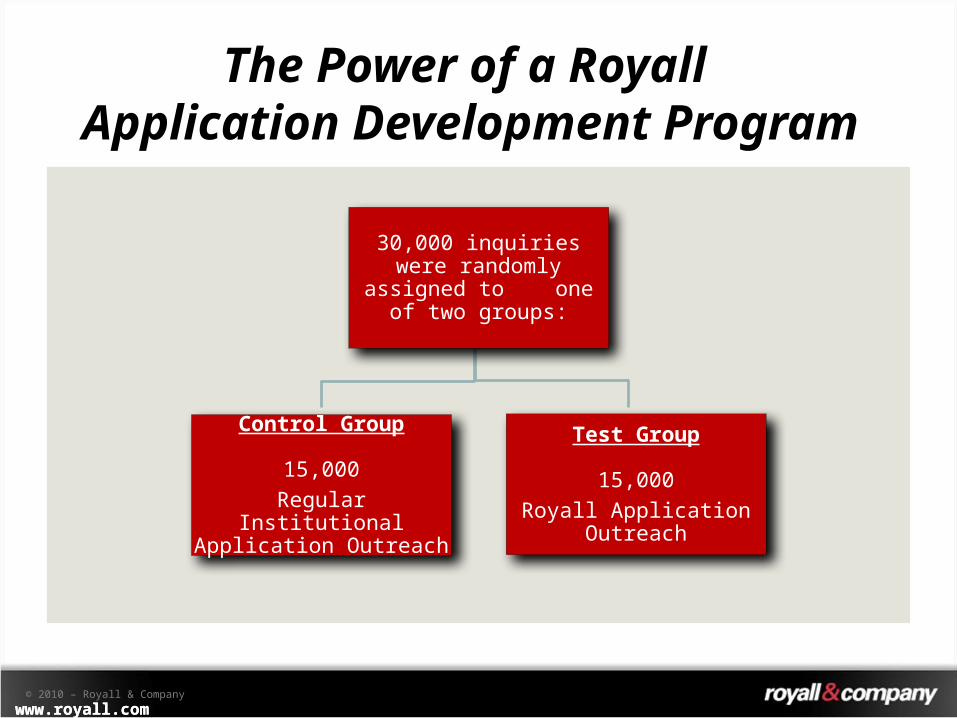
The Power of a Royall Application Development
Program
30,000 inquiries were randomly assigned to
one of two groups:
Control Group
15,000Regular Institutional Application Outreach
Test Group
15,000Royall Application
Outreach
www.royall.com© 2010 – Royall & Companywww.royall.com
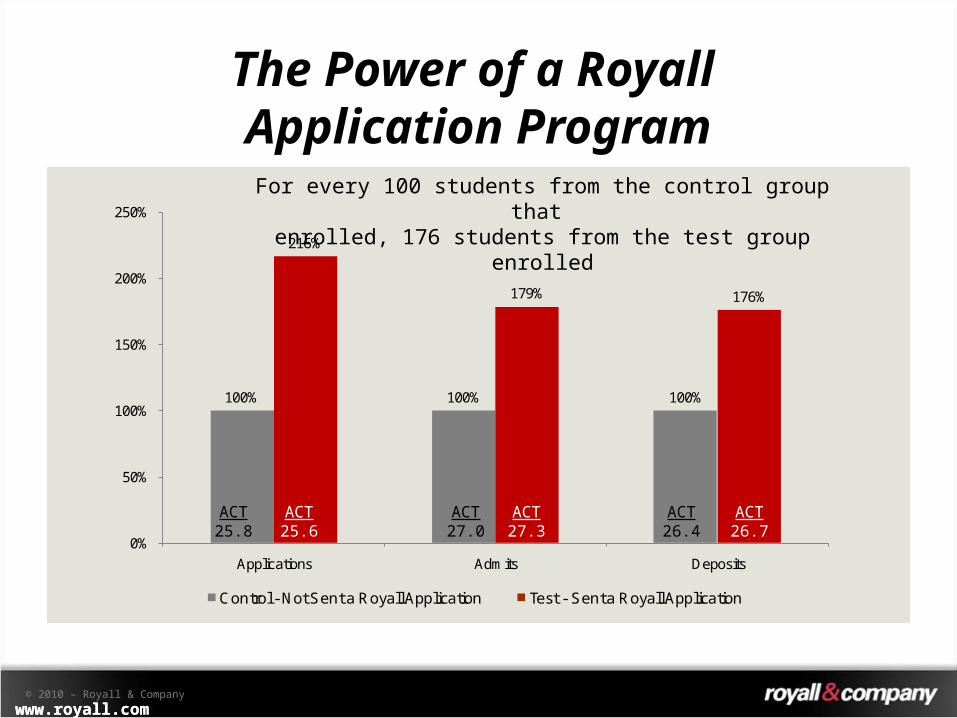
The Power of a Royall Application Program
100% 100% 100%
216%
179% 176%
0%
50%
100%
150%
200%
250%
Applications Admits Deposits
Control - Not Sent a Royall Application Test - Sent a Royall Application
ACT25.8
ACT25.6
ACT27.0
ACT27.3
ACT26.4
ACT26.7
For every 100 students from the control group that enrolled, 176 students from the test group enrolled
www.royall.com© 2010 – Royall & Companywww.royall.com
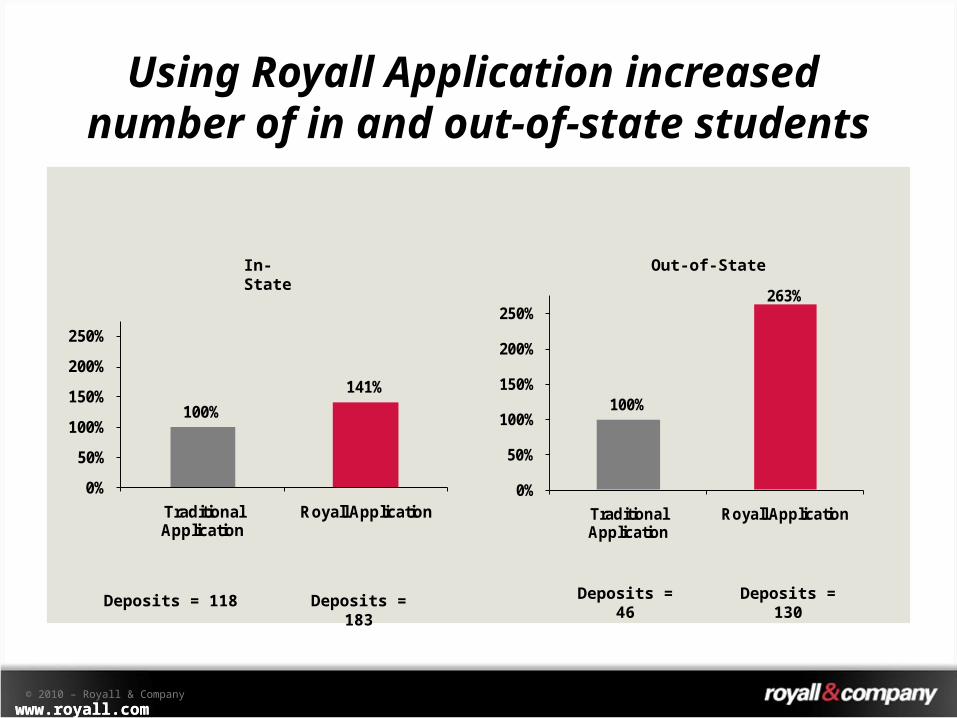
Using Royall Application increased number of in and out-of-state students
In-State
100%141%
0%
50%
100%
150%
200%
250%
Traditional Application
Royall Application
Deposits = 118 Deposits = 183
Out-of-State
100%
263%
0%
50%
100%
150%
200%
250%
Traditional Application
Royall Application
Deposits = 46 Deposits = 130
www.royall.com© 2010 – Royall & Companywww.royall.com
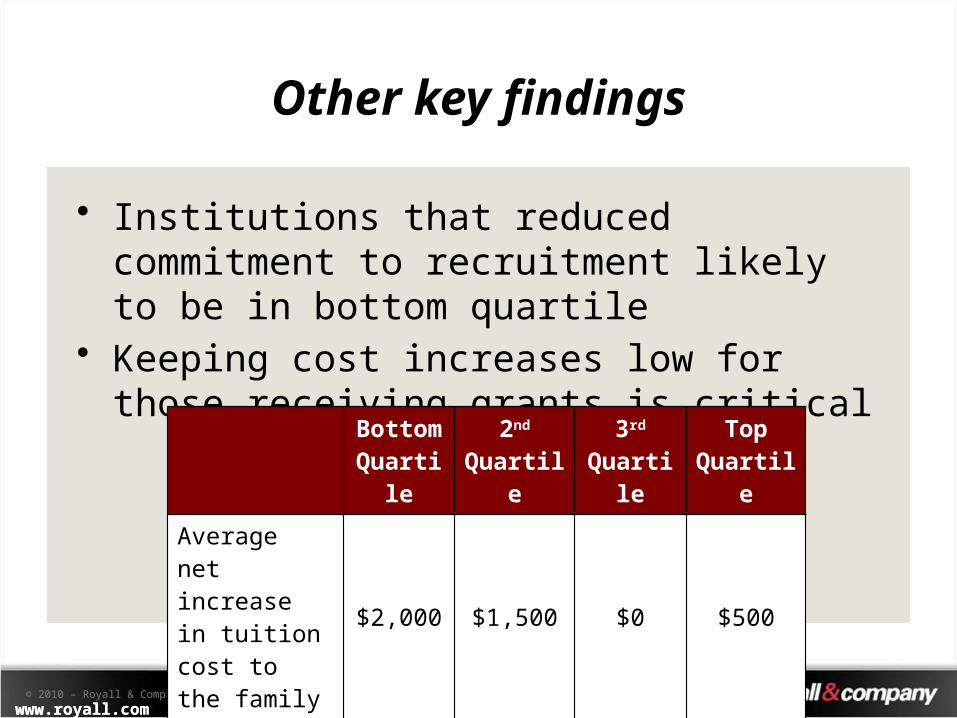
Other key findings
• Institutions that reduced commitment to recruitment likely to be in bottom quartile
• Keeping cost increases low for those receiving grants is critical
Bottom Quartile
2nd Quartile
3rd Quartile
Top Quartile
Average net increase in tuition cost to the family
$2,000 $1,500 $0 $500
www.royall.com© 2010 – Royall & Companywww.royall.com
Continued
• The best performers distributed applications, acceptances, merit-based awards and need-based awards 10 – 14 days earlier than those institutions that did not perform well!
• Their deposits are more likely to be refundable through May 1.
• Less likely to be Common Application members• More likely to mail an institutionally branded
application
www.royall.com© 2010 – Royall & Companywww.royall.com
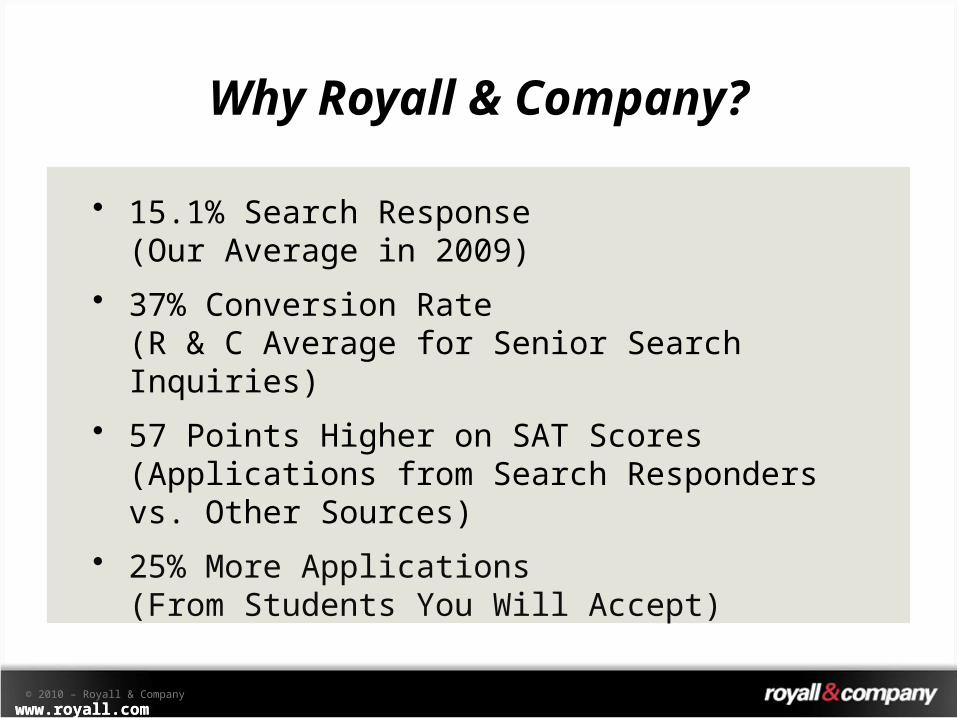
Why Royall & Company?
• 15.1% Search Response (Our Average in 2009)
• 37% Conversion Rate (R & C Average for Senior Search Inquiries)
• 57 Points Higher on SAT Scores (Applications from Search Responders vs. Other Sources)
• 25% More Applications (From Students You Will Accept)
www.royall.com© 2010 – Royall & Companywww.royall.com
Questions?Richard Whiteside
Dean, Strategic Enrollment ManagementRoyall & Company
1920 E. Parham RoadRichmond, VA 23228
[email protected](804) 741-8965www.royall.com