Embed Size (px)
Citation preview
How can the business benefit of Business Continuity Planning be measured? -A case study at AstraZeneca Lisa Degerfalk Mattias Larsson
Department of Fire Safety Engineering Lund University, Sweden Brandteknik Lunds tekniska högskola Lunds universitet Report 5212, Lund 2006
Rapporten har finansierats av AstraZeneca

How can the business benefit of Business Continuity Planning be measured?
-A case study at AstraZeneca
Lisa Degerfalk Mattias Larsson
Lund 2006
How can the business benefit of Business Continuity Planning be measured? -A case study at AstraZeneca Lisa Degerfalk Mattias Larsson Report 5212 ISSN: 1402-3504 ISRN: LUTVDG/TVBB--5212--SE Keywords: AstraZeneca, Business Continuity Planning (BCP), Business benefit, Decision making, Net Present Value (NPV), Risk Adjusted Net Present Values (RANPV), Risk reducing investment alternative. Sökord: AstraZeneca, Business Continuity Planning (BCP), Affärsnytta, Beslutsfattande, Kapitalvärde, Riskjusterat kapitalvärde, Riskreducerande investeringsalternativ. Abstract: This thesis treats the area of Business Continuity Planning (BCP), which is one way to decrease the vulnerability in an organization. The main objective was to investigate how the business benefit of BCP could be measured in monetary terms. The aim of this investigation was the development of a general and practically usable framework. The framework was developed in a deductive way by combining theory about BCP, risk, decision making, and investment valuation. The framework is a five step work process that results in a ranking of the risk reducing investments based on their calculated Risk Adjusted Net Present Value (RANPV). The BCP process generates risk reducing investment alternatives that can be valuated with the framework. The thesis has been performed in cooperation with AstraZeneca where a case study was carried out to test the practical usability of the framework. This thesis showed that the developed framework is general, practically usable and can measure the business benefit of BCP in monetary terms if the requirements of the user of the framework are met. © Copyright: Brandteknik, Lunds tekniska högskola, Lunds universitet, Lund 2006.
Department of Fire Safety Engineering Lund University
P.O. Box 118 SE-221 00 Lund
Sweden
[email protected] http://www.brand.lth.se/english
Telephone: +46 46 222 73 60
Fax: +46 46 222 46 12
Brandteknik Lunds tekniska högskola
Lunds universitet Box 118
221 00 Lund
[email protected] http://www.brand.lth.se
Telefon: 046 - 222 73 60 Telefax: 046 - 222 46 12
Summary
L. Degerfalk & M. Larsson i
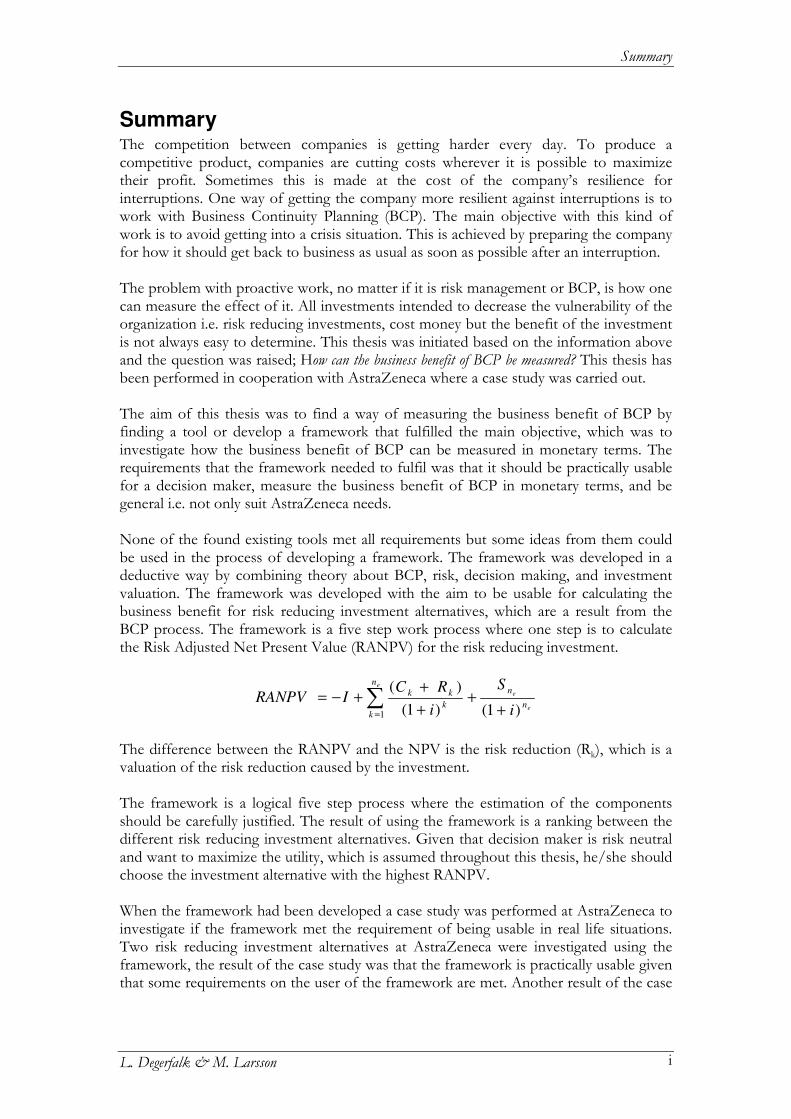
Summary The competition between companies is getting harder every day. To produce a competitive product, companies are cutting costs wherever it is possible to maximize their profit. Sometimes this is made at the cost of the company’s resilience for interruptions. One way of getting the company more resilient against interruptions is to work with Business Continuity Planning (BCP). The main objective with this kind of work is to avoid getting into a crisis situation. This is achieved by preparing the company for how it should get back to business as usual as soon as possible after an interruption. The problem with proactive work, no matter if it is risk management or BCP, is how one can measure the effect of it. All investments intended to decrease the vulnerability of the organization i.e. risk reducing investments, cost money but the benefit of the investment is not always easy to determine. This thesis was initiated based on the information above and the question was raised; How can the business benefit of BCP be measured? This thesis has been performed in cooperation with AstraZeneca where a case study was carried out. The aim of this thesis was to find a way of measuring the business benefit of BCP by finding a tool or develop a framework that fulfilled the main objective, which was to investigate how the business benefit of BCP can be measured in monetary terms. The requirements that the framework needed to fulfil was that it should be practically usable for a decision maker, measure the business benefit of BCP in monetary terms, and be general i.e. not only suit AstraZeneca needs. None of the found existing tools met all requirements but some ideas from them could be used in the process of developing a framework. The framework was developed in a deductive way by combining theory about BCP, risk, decision making, and investment valuation. The framework was developed with the aim to be usable for calculating the business benefit for risk reducing investment alternatives, which are a result from the BCP process. The framework is a five step work process where one step is to calculate the Risk Adjusted Net Present Value (RANPV) for the risk reducing investment.
e
e
e
n
nn
kk
kk
i
S
i
RCIRANPV
)1()1(
)(
1 ++
+
++−= ∑
=
The difference between the RANPV and the NPV is the risk reduction (Rk), which is a valuation of the risk reduction caused by the investment. The framework is a logical five step process where the estimation of the components should be carefully justified. The result of using the framework is a ranking between the different risk reducing investment alternatives. Given that decision maker is risk neutral and want to maximize the utility, which is assumed throughout this thesis, he/she should choose the investment alternative with the highest RANPV. When the framework had been developed a case study was performed at AstraZeneca to investigate if the framework met the requirement of being usable in real life situations. Two risk reducing investment alternatives at AstraZeneca were investigated using the framework, the result of the case study was that the framework is practically usable given that some requirements on the user of the framework are met. Another result of the case
How can the business benefit of Business Continuity Planning be measured?
L. Degerfalk & M. Larsson ii
study was that the use of the framework was combined with both difficulties and potential. One requirement that the user of the framework needs to fulfil is that he/she needs to posses knowledge about risk, investment valuation, and uncertainty. The reason for this is that the degree of reliability in the RANPV’s result is dependent on the users knowledge in the mentioned areas as well as the quality of the users estimations of the risk and investment valuation components. This was a difficulty discovered through the process of creating the framework and performing the case study. Another difficulty with the framework is that it is hard to say anything about the calculated RANPV’s trustworthiness just by looking at the single number. Therefore, it is important that each step of the framework is carefully performed and justified to create a logical decision process. Even though the use of the framework was combined with some difficulties the framework’s potential is predominating. The work with estimating the components in the framework forces people to cooperate throughout the organization, which increases the organization’s degree of safety awareness and its ability to cope with new situations thanks to the strengthening of networks. The framework also decreases the possibility for suboptimization in an organization since the RANPV makes it possible to compare the profitability of different risk reducing investments. Another potential of the framework is that it helps the decision maker to follow a logical decision procedure and make a well founded decision. In other words, justifying the risk reducing investment in the same way as normal investments needs to be justified. Last but not least, the framework also helps the people working with BCP to increase the creditability of working with BCP thanks to the possibility to show it is profitable. The case study showed that the framework was usable for measuring the business benefit of an investment alternative in a real life situation in monetary terms i.e. the case study showed that two out of three requirements were met. The third requirement, which was to develop a general framework, was not showed during the case study. This requirement was considered throughout the process of creating the framework and regarded by using general theories in a deductive way and not only information that was received from AstraZeneca. To ensure that the framework turned out general, discussions have been held with experts outside AstraZeneca. The main question of the thesis is: How can the business benefit of Business Continuity Planning be measured? By looking at the total work with BCP as the investment alternative the benefit of it can be measured in the same way as a specific investment alternative from the BCP process i.e. by calculating the RANPV. When using the framework to measure the business benefit of BCP in an organization it gets more difficult to estimate the framework components the bigger and more complex the investment alternative is. This is not seen as a major weakness because the only reason to measure the total business benefit of BCP in a large organization would be to investigate if BCP is profitable. We believe that the developed framework has the greatest potential when it is used to valuate single investment alternatives and the aim is to investigate which investment alternative that is the most profitable one.
Sammanfattning
L. Degerfalk & M. Larsson iii
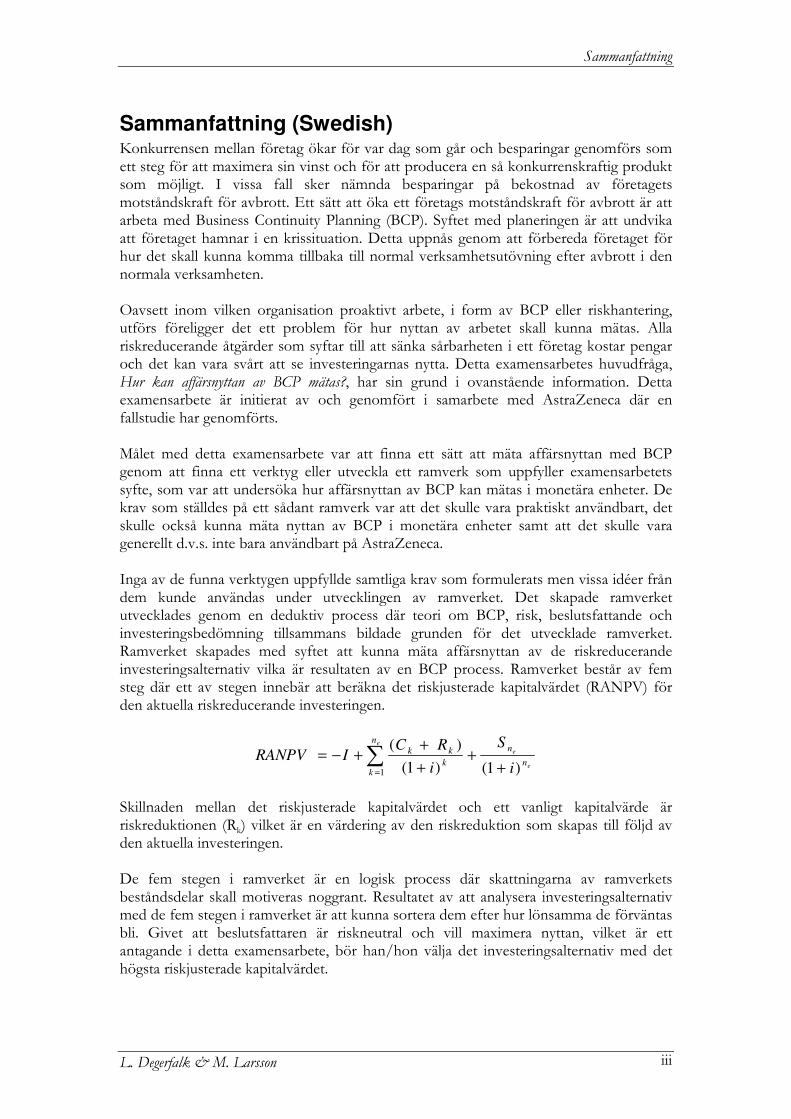
Sammanfattning (Swedish) Konkurrensen mellan företag ökar för var dag som går och besparingar genomförs som ett steg för att maximera sin vinst och för att producera en så konkurrenskraftig produkt som möjligt. I vissa fall sker nämnda besparingar på bekostnad av företagets motståndskraft för avbrott. Ett sätt att öka ett företags motståndskraft för avbrott är att arbeta med Business Continuity Planning (BCP). Syftet med planeringen är att undvika att företaget hamnar i en krissituation. Detta uppnås genom att förbereda företaget för hur det skall kunna komma tillbaka till normal verksamhetsutövning efter avbrott i den normala verksamheten. Oavsett inom vilken organisation proaktivt arbete, i form av BCP eller riskhantering, utförs föreligger det ett problem för hur nyttan av arbetet skall kunna mätas. Alla riskreducerande åtgärder som syftar till att sänka sårbarheten i ett företag kostar pengar och det kan vara svårt att se investeringarnas nytta. Detta examensarbetes huvudfråga, Hur kan affärsnyttan av BCP mätas?, har sin grund i ovanstående information. Detta examensarbete är initierat av och genomfört i samarbete med AstraZeneca där en fallstudie har genomförts. Målet med detta examensarbete var att finna ett sätt att mäta affärsnyttan med BCP genom att finna ett verktyg eller utveckla ett ramverk som uppfyller examensarbetets syfte, som var att undersöka hur affärsnyttan av BCP kan mätas i monetära enheter. De krav som ställdes på ett sådant ramverk var att det skulle vara praktiskt användbart, det skulle också kunna mäta nyttan av BCP i monetära enheter samt att det skulle vara generellt d.v.s. inte bara användbart på AstraZeneca. Inga av de funna verktygen uppfyllde samtliga krav som formulerats men vissa idéer från dem kunde användas under utvecklingen av ramverket. Det skapade ramverket utvecklades genom en deduktiv process där teori om BCP, risk, beslutsfattande och investeringsbedömning tillsammans bildade grunden för det utvecklade ramverket. Ramverket skapades med syftet att kunna mäta affärsnyttan av de riskreducerande investeringsalternativ vilka är resultaten av en BCP process. Ramverket består av fem steg där ett av stegen innebär att beräkna det riskjusterade kapitalvärdet (RANPV) för den aktuella riskreducerande investeringen.
e
e
e
n
nn
kk
kk
i
S
i
RCIRANPV
)1()1(
)(
1 ++
+
++−= ∑
=
Skillnaden mellan det riskjusterade kapitalvärdet och ett vanligt kapitalvärde är riskreduktionen (Rk) vilket är en värdering av den riskreduktion som skapas till följd av den aktuella investeringen. De fem stegen i ramverket är en logisk process där skattningarna av ramverkets beståndsdelar skall motiveras noggrant. Resultatet av att analysera investeringsalternativ med de fem stegen i ramverket är att kunna sortera dem efter hur lönsamma de förväntas bli. Givet att beslutsfattaren är riskneutral och vill maximera nyttan, vilket är ett antagande i detta examensarbete, bör han/hon välja det investeringsalternativ med det högsta riskjusterade kapitalvärdet.
How can the business benefit of Business Continuity Planning be measured?
L. Degerfalk & M. Larsson iv
När ramverket var färdigutvecklat genomfördes en fallstudie på AstraZeneca där det testades huruvida ramverkets användbarhet uppfyllde kravet i att vara praktiskt användbart. Fallstudien bestod i att med hjälp av ramverket utreda två riskreducerande investeringsalternativs lönsamhet på AstraZeneca. Fallstudien visade att ramverket är praktiskt användbart givet att användaren uppfyller vissa förkunskapskrav. Fallstudien visade även att det förelåg vissa svårigheter vid arbete med ramverket men att fördelarna övervägde dessa. För att kunna använda ramverket måste användaren inneha kunskap om risk, investeringsbedömning och osäkerheter. Anledningen till detta är att graden av reliabilitet i de uträknade riskjusterade kapitalvärdena beror på användarens kunskap i de nämnda områdena samt på kvalitén på uppskattningen av risk och investeringsbedömningarnas beståndsdelar. Detta var svårigheter som uppmärksammades under skapandet av ramverket och under fallstudien på AstraZeneca. En annan svårighet vid användandet av ramverket är att det är svårt att uttala sig om resultatets trovärdighet genom att titta på det beräknade riskjusterade kapitalvärdet. Det är därför viktigt att varje steg i ramverket är noggrant utfört och motiverat för att skapa en logisk beslutsgång. Även om det föreligger svårigheter vid användandet av ramverket så överväger de fördelar som följer användandet av ramverket. Arbetet med att uppskatta de nödvändiga komponenterna i de fem stegen tvingar personer inom den aktuella organisationen att samarbeta vilket ökar dess säkerhetsmedvetenhet. Samarbetet ökar även organisationens möjlighet att klara av nya situationer genom stärkta nätverk. En annan fördel som följer arbetet med ramverket är att suboptimering kan undvikas i större utsträckning tack vare att det riskjusterade kapitalvärdet gör det möjligt att jämföra lönsamheten mellan olika riskreducerande investeringar. Ramverket hjälper även beslutsfattaren att följa en logisk beslutsgång för att kunna fatta välunderbyggda beslut. Med andra ord, berättiga den riskreducerande investeringen på samma sätt som normala investeringar måste försvaras. Till sist kan det konstateras att ramverket hjälper de som arbetar med BCP att öka detta arbetes trovärdighet tack vare att det ges en möjlighet att visa att arbetet är lönsamt. Fallstudien visade att ramverket var praktiskt användbart för att mäta affärsnyttan av ett riskreducerande investeringsalternativ i monetära enheter d.v.s. två av de tre uttryckta kraven i syftet blev uppfyllda. Det tredje kravet vilket var att ramverket skulle vara generellt blev inte bevisat genom fallstudien. Detta togs istället i beaktande under utvecklingen av ramverket genom att använda generella teorier i en deduktiv arbetsgång och inte bara baseras på information från AstraZeneca. För att säkerställa att ramverket blev generellt diskuterades det med experter utanför AstraZeneca under utvecklingsprocessen. Examensarbetets huvudfråga är Hur kan affärsnyttan av BCP mätas? Affärsnyttan med BCP kan mätas genom att se BCP som ett investeringsalternativ och på så sätt kan nyttan med det beräknas på samma sätt som för ett specifikt investeringsalternativ från BCP processen d.v.s. genom att beräkna RANPV. När ramverket används för att mäta affärsnyttan av BCP i en organisation blir det svårare att uppskatta ramverkets komponenter ju större och mer komplex investeringsalternativet är. Detta ses inte som en stor svaghet eftersom den enda anledningen att mäta den totala affärsnyttan med BCP i en stor organisation skulle vara att utreda om BCP är lönsamt. Vi anser att det utvecklade ramverket har de största fördelarna när det används för att värdera enstaka investeringsalternativ och syftet är att se till att det valda investeringsalternativet är det mest lönsamma.

Acknowledgements
L. Degerfalk & M. Larsson v
Acknowledgements During the work with this thesis several persons have helped us and we want to express our gratitude to them. To our advisor at The Department of Fire Safety Engineering, Lund University, Henrik Johansson, thank you for all the help and support you have given us and for always answering our questions and giving us valuable comments. We would also like to show our appreciation to the BCP Team at AstraZeneca, especially to our advisor Pierre Wettergren, for letting us take part in their work with implementing BCP in the organization. To the persons engaged in the performed case study at AstraZeneca, thanks for taking the time to help us and for having an open mind to our work. We are also grateful for Per Perssons positive attitude and helpfulness, you have made our work much easier. Jonas Roosberg, at Willis, thank you for rewarding and interesting discussions and for taking the time to help us. In addition we want to show our appreciation to Andreas Larsson for proofreading this thesis. Last but not least we want to thank John and John for inspiring lunch and coffee breaks, and of course our families and friends for endless encouragement and support during the work with this thesis. Enjoy the reading! Lisa Degerfalk & Mattias Larsson Lund 2006-12-19

How can the business benefit of Business Continuity Planning be measured?
L. Degerfalk & M. Larsson vi
Table of contents
L. Degerfalk & M. Larsson vii
Table of contents
SUMMARY...............................................................................................................I
SAMMANFATTNING (SWEDISH)....................................................................III
ACKNOWLEDGEMENTS ....................................................................................V
TABLE OF CONTENTS ....................................................................................VII
1 TERMINOLOGY.............................................................................................1
1.1 ACRONYMS.........................................................................................................................1 1.2 GLOSSARY ..........................................................................................................................1
2 INTRODUCTION...........................................................................................3
2.1 BACKGROUND...................................................................................................................3 2.2 KEY FACTS ASTRAZENECA .............................................................................................3 2.3 OBJECTIVE .........................................................................................................................4 2.4 DEFINING THE PROBLEM ................................................................................................4 2.5 TARGET GROUP.................................................................................................................5 2.6 DELIMITATIONS ................................................................................................................5
3 METHOD AND STRUCTURE ......................................................................7
3.1 RELIABILITY AND VALIDITY............................................................................................7 3.2 WORK PROCEDURE ..........................................................................................................7 3.3 THESIS STRUCTURE ...........................................................................................................9
4 THEORY........................................................................................................ 11
4.1 BUSINESS CONTINUITY..................................................................................................11 Business Continuity Management............................................................................................ 11 Business Continuity Planning.................................................................................................. 12 BCP Programme at AstraZeneca ........................................................................................... 15
4.2 RISK AND UNCERTAINTY ...............................................................................................17 Different perspectives on risk ................................................................................................... 17 Quantitative definition of risk ................................................................................................. 17 Different views of probability ................................................................................................... 18 Finding the triplets.................................................................................................................. 18
4.3 SCENARIO STRUCTURING...............................................................................................21 4.4 DECISION MAKING .........................................................................................................22 Decision analysis..................................................................................................................... 23 Decision criteria ...................................................................................................................... 23 Decision theory........................................................................................................................ 24
4.5 INVESTMENT VALUATION .............................................................................................25 Net Present Value ................................................................................................................. 25 Certainty Equivalent .............................................................................................................. 26 Risk Adjusted Net Present Value.......................................................................................... 27
5 DEVELOPING THE FRAMEWORK ..........................................................29
5.1 EXISTING WAYS OF MEASUREMENT .............................................................................29 Empirical comparisons............................................................................................................ 29 Existing research and tools...................................................................................................... 29
5.2 FUNDAMENTAL THEORIES OF THE FRAMEWORK ......................................................30
How can the business benefit of Business Continuity Planning be measured?
L. Degerfalk & M. Larsson viii
Basic viewpoints ...................................................................................................................... 30 Theories used in the decision analysis ....................................................................................... 31
6 FRAMEWORK PRESENTATION...............................................................35
6.1 THE FIVE STEP WORK PROCESS.....................................................................................35 6.2 MANUAL...........................................................................................................................36 Scope of the framework manual ............................................................................................... 36 Step 1: List of investment alternatives...................................................................................... 37 Step 2: Estimation of the components ...................................................................................... 37 Step 3: Risk reduction and cash flow....................................................................................... 39 Step 4: Risk Adjusted Net Present Value.............................................................................. 39 Step 5: Choosing investment alternative ................................................................................... 40
7 CASE STUDY AT ASTRAZENECA ............................................................. 41
7.1 METHOD ..........................................................................................................................41 7.2 CASE: BACK-UP SERVER .................................................................................................42 Estimation of components........................................................................................................ 43 Results and analysis................................................................................................................ 44
7.3 CASE: TEXT SYSTEM .......................................................................................................45 Estimation of components........................................................................................................ 45 Results and analysis................................................................................................................ 48
8 FRAMEWORK ANALYSIS............................................................................49
8.1 USER REQUIREMENTS ....................................................................................................49 8.2 DIFFICULTIES ..................................................................................................................49 8.3 POTENTIAL ......................................................................................................................51
9 DISCUSSION .................................................................................................53
9.1 TASK PERFORMANCE......................................................................................................53 Solving the problems................................................................................................................ 53 Main question ........................................................................................................................ 54
9.2 FUTURE STUDIES.............................................................................................................54
10 CONCLUSIONS ............................................................................................57
11 REFERENCES...............................................................................................59
BOOKS AND REPORTS..............................................................................................................59 ARTICLES...................................................................................................................................60 WEB BASED REFERENCES .......................................................................................................61 EXPERTS INVOLVED IN THIS THESIS .....................................................................................61
APPENDIX I – FAILURE TREE AND EVENT TREE APPENDIX II – EVIDENCE BASED DECISION MAKING APPENDIX III – FUNDAMENTAL THEORIES OF THE FRAMEWORK APPENDIX IV – COST BENEFIT ANALYSIS APPENDIX V – CASE: BACK-UP SERVER APPENDIX VI – CASE: TEXT SYSTEM
Terminology
L. Degerfalk & M. Larsson 1
1 Terminology
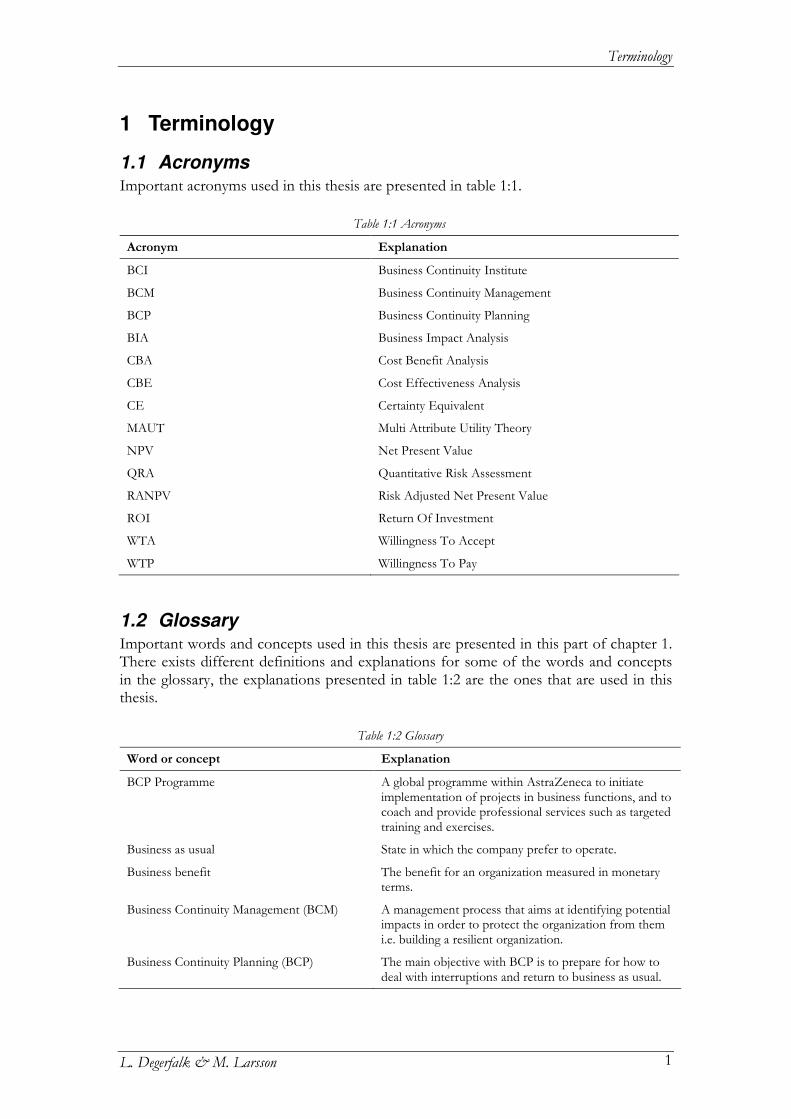
1.1 Acronyms Important acronyms used in this thesis are presented in table 1:1.
Table 1:1 Acronyms
Acronym Explanation
BCI Business Continuity Institute
BCM Business Continuity Management
BCP Business Continuity Planning
BIA Business Impact Analysis
CBA Cost Benefit Analysis
CBE Cost Effectiveness Analysis
CE Certainty Equivalent
MAUT Multi Attribute Utility Theory
NPV Net Present Value
QRA Quantitative Risk Assessment
RANPV Risk Adjusted Net Present Value
ROI Return Of Investment
WTA Willingness To Accept
WTP Willingness To Pay
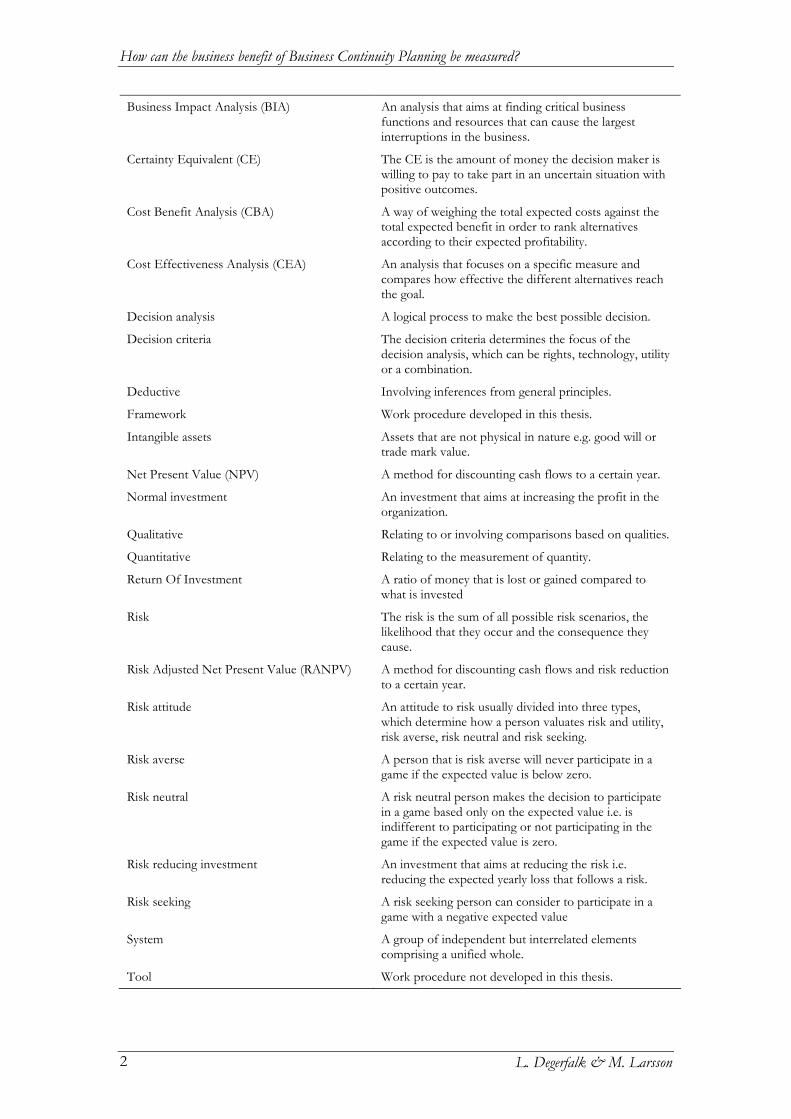
1.2 Glossary Important words and concepts used in this thesis are presented in this part of chapter 1. There exists different definitions and explanations for some of the words and concepts in the glossary, the explanations presented in table 1:2 are the ones that are used in this thesis.
Table 1:2 Glossary
Word or concept Explanation
BCP Programme A global programme within AstraZeneca to initiate implementation of projects in business functions, and to coach and provide professional services such as targeted training and exercises.
Business as usual State in which the company prefer to operate.
Business benefit The benefit for an organization measured in monetary terms.
Business Continuity Management (BCM) A management process that aims at identifying potential impacts in order to protect the organization from them i.e. building a resilient organization.
Business Continuity Planning (BCP) The main objective with BCP is to prepare for how to deal with interruptions and return to business as usual.
How can the business benefit of Business Continuity Planning be measured?
L. Degerfalk & M. Larsson 2
Business Impact Analysis (BIA) An analysis that aims at finding critical business functions and resources that can cause the largest interruptions in the business.
Certainty Equivalent (CE) The CE is the amount of money the decision maker is willing to pay to take part in an uncertain situation with positive outcomes.
Cost Benefit Analysis (CBA) A way of weighing the total expected costs against the total expected benefit in order to rank alternatives according to their expected profitability.
Cost Effectiveness Analysis (CEA) An analysis that focuses on a specific measure and compares how effective the different alternatives reach the goal.
Decision analysis A logical process to make the best possible decision.
Decision criteria The decision criteria determines the focus of the decision analysis, which can be rights, technology, utility or a combination.
Deductive Involving inferences from general principles.
Framework Work procedure developed in this thesis.
Intangible assets Assets that are not physical in nature e.g. good will or trade mark value.
Net Present Value (NPV) A method for discounting cash flows to a certain year.
Normal investment An investment that aims at increasing the profit in the organization.
Qualitative Relating to or involving comparisons based on qualities.
Quantitative Relating to the measurement of quantity.
Return Of Investment A ratio of money that is lost or gained compared to what is invested
Risk The risk is the sum of all possible risk scenarios, the likelihood that they occur and the consequence they cause.
Risk Adjusted Net Present Value (RANPV) A method for discounting cash flows and risk reduction to a certain year.
Risk attitude An attitude to risk usually divided into three types, which determine how a person valuates risk and utility, risk averse, risk neutral and risk seeking.
Risk averse A person that is risk averse will never participate in a game if the expected value is below zero.
Risk neutral A risk neutral person makes the decision to participate in a game based only on the expected value i.e. is indifferent to participating or not participating in the game if the expected value is zero.
Risk reducing investment An investment that aims at reducing the risk i.e. reducing the expected yearly loss that follows a risk.
Risk seeking A risk seeking person can consider to participate in a game with a negative expected value
System A group of independent but interrelated elements comprising a unified whole.
Tool Work procedure not developed in this thesis.
Introduction
L. Degerfalk & M. Larsson 3
2 Introduction
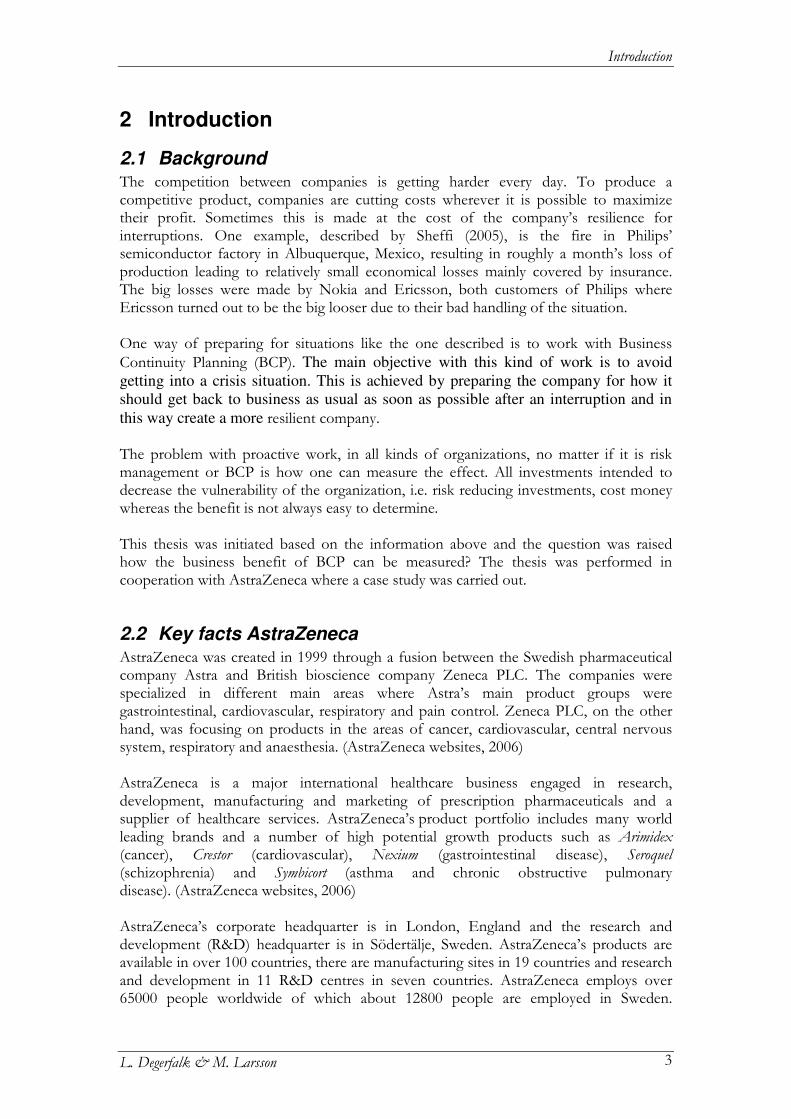
2.1 Background The competition between companies is getting harder every day. To produce a competitive product, companies are cutting costs wherever it is possible to maximize their profit. Sometimes this is made at the cost of the company’s resilience for interruptions. One example, described by Sheffi (2005), is the fire in Philips’ semiconductor factory in Albuquerque, Mexico, resulting in roughly a month’s loss of production leading to relatively small economical losses mainly covered by insurance. The big losses were made by Nokia and Ericsson, both customers of Philips where Ericsson turned out to be the big looser due to their bad handling of the situation. One way of preparing for situations like the one described is to work with Business Continuity Planning (BCP). The main objective with this kind of work is to avoid
getting into a crisis situation. This is achieved by preparing the company for how it
should get back to business as usual as soon as possible after an interruption and in
this way create a more resilient company. The problem with proactive work, in all kinds of organizations, no matter if it is risk management or BCP is how one can measure the effect. All investments intended to decrease the vulnerability of the organization, i.e. risk reducing investments, cost money whereas the benefit is not always easy to determine. This thesis was initiated based on the information above and the question was raised how the business benefit of BCP can be measured? The thesis was performed in cooperation with AstraZeneca where a case study was carried out.
2.2 Key facts AstraZeneca AstraZeneca was created in 1999 through a fusion between the Swedish pharmaceutical company Astra and British bioscience company Zeneca PLC. The companies were specialized in different main areas where Astra’s main product groups were gastrointestinal, cardiovascular, respiratory and pain control. Zeneca PLC, on the other hand, was focusing on products in the areas of cancer, cardiovascular, central nervous system, respiratory and anaesthesia. (AstraZeneca websites, 2006) AstraZeneca is a major international healthcare business engaged in research, development, manufacturing and marketing of prescription pharmaceuticals and a supplier of healthcare services. AstraZeneca’s product portfolio includes many world leading brands and a number of high potential growth products such as Arimidex (cancer), Crestor (cardiovascular), Nexium (gastrointestinal disease), Seroquel (schizophrenia) and Symbicort (asthma and chronic obstructive pulmonary disease). (AstraZeneca websites, 2006) AstraZeneca’s corporate headquarter is in London, England and the research and development (R&D) headquarter is in Södertälje, Sweden. AstraZeneca’s products are available in over 100 countries, there are manufacturing sites in 19 countries and research and development in 11 R&D centres in seven countries. AstraZeneca employs over 65000 people worldwide of which about 12800 people are employed in Sweden.
How can the business benefit of Business Continuity Planning be measured?
L. Degerfalk & M. Larsson 4
Healthcare sales in 2005 totalled $24 billion, with an operating profit of $6.5 billion. (AstraZeneca websites, 2006)
2.3 Objective The main objective of this Master’s thesis is to investigate how an organization that is working with BCP can measure the business benefit of the work in monetary terms. The result of this investigation is the development of a general and practically usable framework for measuring the business benefit of BCP. The objective leads to the following requirements of the framework:
• Practically usable for a decision maker. • Measure the business benefit of BCP in monetary terms. • General i.e. not only suit AstraZeneca needs.
To develop a general framework as the one suggested, the area needs to be analysed and the work needs to be performed in a scientific way. The developed framework is evaluated by performing a case study at AstraZeneca. This results in a discussion about the potentials and difficulties of using the framework.
2.4 Defining the problem To achieve the objective a number of questions need to be answered. The main question of this thesis is; How can the business benefit of Business Continuity Planning be measured? Due to the complexity of this question it was divided into less extensive problems. 1. Can any existing research or tools be of use without modification to measure the benefits of BCP?
This question is of great interest because it presents the opportunity to do a thorough study of literature to find existing research and tools that might fit the purpose of this thesis. Another positive outcome of the question is the opportunity to gain deeper knowledge in the area of BCP.
2. Are there any existing general tools to measure benefit that can be of use?
If existing research and tools that are created for measuring the benefit of BCP cannot be found, a search for tools from some other area that might be applicable in the BCP area is performed.
3. Can the found tools be of use when developing a framework to measure the business benefit of BCP? If a tool that can be used directly cannot be found, a framework needs to be developed. Ideas from the identified research and tools are used when developing a framework that fit the purpose of this thesis. The following more specific questions also needs to be addressed to solve the problem: • How should one manage uncertainty? • How should one manage the estimation of costs? • How should one manage the evaluation of risk?
4. Is the framework usable for measuring the business benefit of BCP? A case study is carried out at AstraZeneca where the framework is developed. The aim of the case study is to examine the usability of the framework and to identify the potential and difficulties with the framework.
Introduction
L. Degerfalk & M. Larsson 5
2.5 Target group The target group for this thesis are people working with BCP in different organizations and risk managers with interest in the area. To make the thesis interesting and usable for the broad spectra of possible readers it contains a thorough description of the different theories used in the thesis.
2.6 Delimitations The scope of this thesis is limited in several areas to keep focus on the main questions of the thesis. Some assumptions have been made to make it possible to focus on the important issues. In this thesis it is assumed that BCP leads to a less vulnerable company and there is no intention to evaluate whether there are better ways than BCP to achieve this. The main reason for this limitation is that the result of such an evaluation is of no interest for the main question. The theories used as foundation in the process of creating the framework for measurement of the business benefit of BCP are assumed to be accepted and they are not questioned in this thesis. The reason for this supposition is that the used theories derive from reliable sources, which have been carefully chosen, and the content have been compared with other sources. The two assumptions, that BCP leads to a less vulnerable company and that the used theories are accepted, are used in a deductive1 way. To meet the objective of this thesis the focus is how one can measure the business benefit of BCP in monetary terms. The reason for this is to make it possible to compare different investment alternatives. There is no intention to treat the questions of how benefits could be measured in qualitative ways because it will not be of use in this thesis. By having a number of persons use the framework developed in this thesis with the help of the framework manual and compare the results, the reliability of the framework can be tested. This is not performed since it required more recourses than the ones available.
1 Deductive: “involving inferences from general principles”, WordNet - a lexical database for the English language, (2006-10-12, 15:50).

How can the business benefit of Business Continuity Planning be measured?
L. Degerfalk & M. Larsson 6
Method and structure
L. Degerfalk & M. Larsson 7
3 Method and structure It is necessary to perform a thorough description of the used methods when writing a scientific report (Backman, 1998). The reason for this is to make it possible for other persons to replicate and evaluate the work process. This chapter aims at describing the work process and different methods used throughout this thesis.
3.1 Reliability and validity Reliability and validity are concepts that are used to evaluate measurements, parameters, tests and methods for investigation. Backman (1998) states that if the reliability and validity are low the research results are of no scientific value. The reliability states the trustworthiness of a measuring instrument and the unit of measurement. The reliability of the framework developed in this thesis can be tested by having a number of persons use the framework with the help of the framework manual and then compare the results. This is not performed in due to lack of recourses but it is proposed as a future study. The validity states to what extent a measuring instrument really measures what it is intended to measure. The validity of the developed framework is hard to test, since it is difficult to falsify the results of the framework. The validity of the framework is supported by the fact that the framework is based on the presented theory. Since the development of the framework is performed in a deductive way the framework must be valid if the theory is valid and used in an acceptable and carefully justified way. To make sure that the theory in the framework is used and connected in an acceptable way the choice of what parts of the theory that is used as foundation of the framework is carefully explained.
3.2 Work procedure The research process could either be seen in a traditional or a qualitative way (Backman, 1998). The work process depends on which perspective that is chosen to work after. Some typical work procedures that can be used and some requirements that need to be taken under consideration in the qualitative perspective are:
• The research is practical and is performed in a real life situation instead of in a laboratory.
• Case studies are a frequently used method in the qualitative research process. • Opposite to the traditionally research process the qualitative perspective does not
look for causality. • The object of the analysis is chosen subjectively and the research is performed in
a close cooperation between the object and the researcher. The chosen work process in this thesis is both traditional and qualitative. The first part of the thesis was performed in a traditional way where a deductive work process was used to find a tool or create a framework, which met the objective of this thesis. The second part of the thesis, where the developed framework was investigated, was chosen to follow the described qualitative work procedure to meet purpose of the case study.
How can the business benefit of Business Continuity Planning be measured?
L. Degerfalk & M. Larsson 8
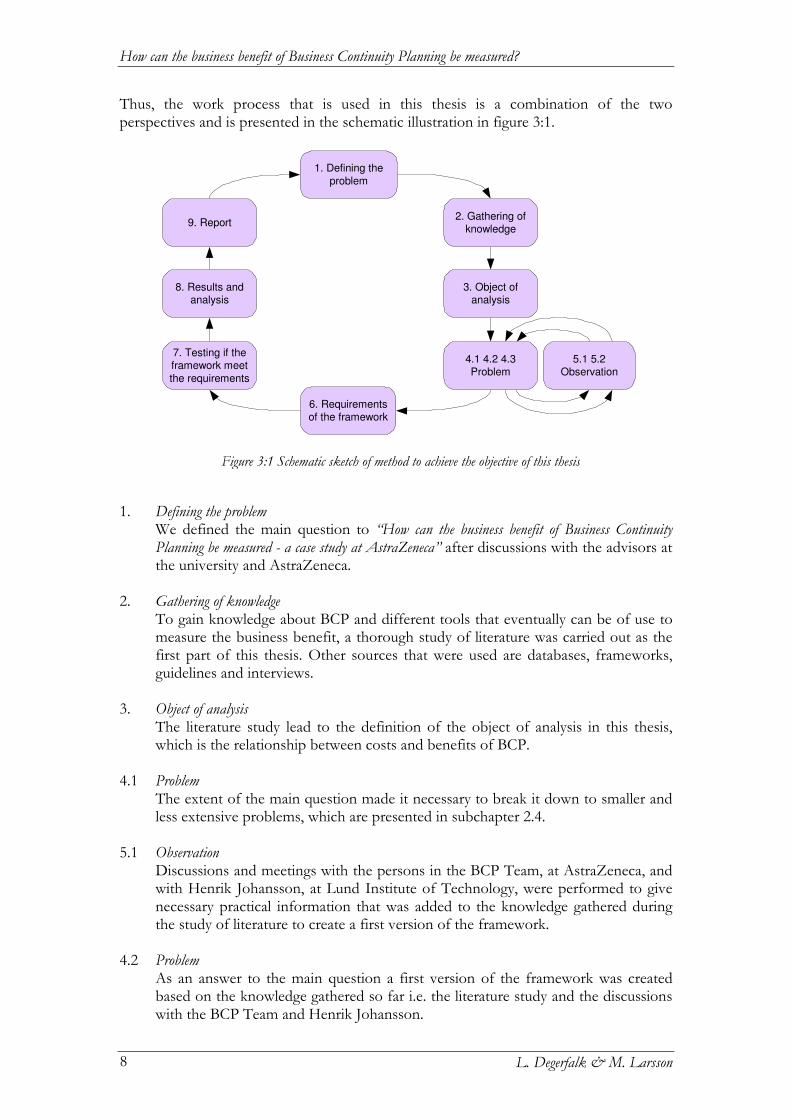
Thus, the work process that is used in this thesis is a combination of the two perspectives and is presented in the schematic illustration in figure 3:1.
1. Defining the problem
We defined the main question to “How can the business benefit of Business Continuity Planning be measured - a case study at AstraZeneca” after discussions with the advisors at the university and AstraZeneca.
2. Gathering of knowledge
To gain knowledge about BCP and different tools that eventually can be of use to measure the business benefit, a thorough study of literature was carried out as the first part of this thesis. Other sources that were used are databases, frameworks, guidelines and interviews.
3. Object of analysis
The literature study lead to the definition of the object of analysis in this thesis, which is the relationship between costs and benefits of BCP.
4.1 Problem
The extent of the main question made it necessary to break it down to smaller and less extensive problems, which are presented in subchapter 2.4.
5.1 Observation
Discussions and meetings with the persons in the BCP Team, at AstraZeneca, and with Henrik Johansson, at Lund Institute of Technology, were performed to give necessary practical information that was added to the knowledge gathered during the study of literature to create a first version of the framework.
4.2 Problem
As an answer to the main question a first version of the framework was created based on the knowledge gathered so far i.e. the literature study and the discussions with the BCP Team and Henrik Johansson.
Figure 3:1 Schematic sketch of method to achieve the objective of this thesis
1. Defining the
problem
4.1 4.2 4.3Problem
6. Requirementsof the framework
3. Object ofanalysis
2. Gathering ofknowledge
8. Results andanalysis
5.1 5.2Observation
9. Report
7. Testing if theframework meet
the requirements
Method and structure
L. Degerfalk & M. Larsson 9
5.2 Observation:
To make the framework more reliable for the measurement of the business benefit of BCP, further discussions with the BCP Team were held to evaluate the first version of the framework. Discussions were also performed with experts in the area from the university, Henrik Johansson, and companies, Jonas Roosberg, to make the framework more general.
4.3 Problem
To answer the main question the first version of the framework was modified with the new knowledge from the discussions about the first version of the framework. The reason for this modification was to create a framework that was general and reliable for measuring the business benefit of BCP.
6. Requirements of the framework
The framework needs to meet the following requirements to answer the main question of this thesis:
• Practically usable for a decision maker. • Measure the business benefit of BCP in monetary terms. • General i.e. not only suit AstraZeneca needs.
7. Testing if the framework meets the requirements
A case study was performed at AstraZeneca to investigate if the framework met the requirements.
8. Results and analysis
Results from the case study were discussed and analysed and an investigation about the validity and reliability of the developed framework was performed. If the framework met the requirements and if the problems presented in subchapter 2.4 were solved are also analysed and discussed.
9. Report
This report was created during the entire process of developing of the framework, making the case study and during the discussion and the analysis.
3.3 Thesis structure This part of the chapter aims at helping the reader to see and follow the main thread of the thesis. Chapter 1: Terminology (p. 1-2) The acronyms that are used throughout this thesis are explained. The definitions of the different words and concepts of the thesis are also described in this chapter to make it easier for the reader to understand the thesis. Chapter 2: Introduction (p. 3-6) This chapter contains short background information of the area, the objective of this thesis, a definition of the problem as well as target group and delimitation of the thesis.
How can the business benefit of Business Continuity Planning be measured?
L. Degerfalk & M. Larsson 10
Chapter 3: Method and structure (p. 7-10) Description of the work process i.e. how the main question is to be answered. The structure of the thesis is also described by a short explanation of the contents of each chapter. Chapter 4: Theory (p. 11-28) A compilation of the theoretical areas used as a foundation of the framework. The different areas of interest are business continuity, risk and uncertainty, scenario structuring, decision making and investment valuation. The chapter is written on a basic level since the readers as mentioned in subchapter 2.5 can have various knowledge about the different areas. Chapter 5: Developing the framework (p. 29-34) This chapter contains a presentation of existing ways to measure business benefit. How the theory in chapter 4 is used in the development of the framework and what parts of the theory that have been chosen is also described. Chapter 6: Framework presentation (p. 35-40) The developed framework is presented as a five step work process, which aims at measuring the business benefit of BCP. The chapter also contains a manual for how to work with each step of the framework in order to obtain the best possible result. Chapter 7: Case study at AstraZeneca (p. 41-48) The framework is evaluated by performing a case study of two investment alternatives at AstraZeneca. The case study aims at answering how the framework manual works as a facilitating framework for the decision maker and how the framework works in reality. Another purpose of the case study is to create an example of how to use the framework in a real life situation. In this way the example works as a complement to the framework manual. Chapter 8: Framework analysis (p. 49-52) In this chapter the requirements, difficulties and potential of the framework are analysed. The analysis is based on the knowledge and information gathered throughout the process of creating the framework and performing the case study. Chapter 9: Discussion (p. 53-56) A discussion of how the task is solved and how the main question is answered, possible future studies are also discussed. Chapter 10: Conclusions (p. 57-58) The most important conclusions of this thesis are presented.
Theory
L. Degerfalk & M. Larsson 11
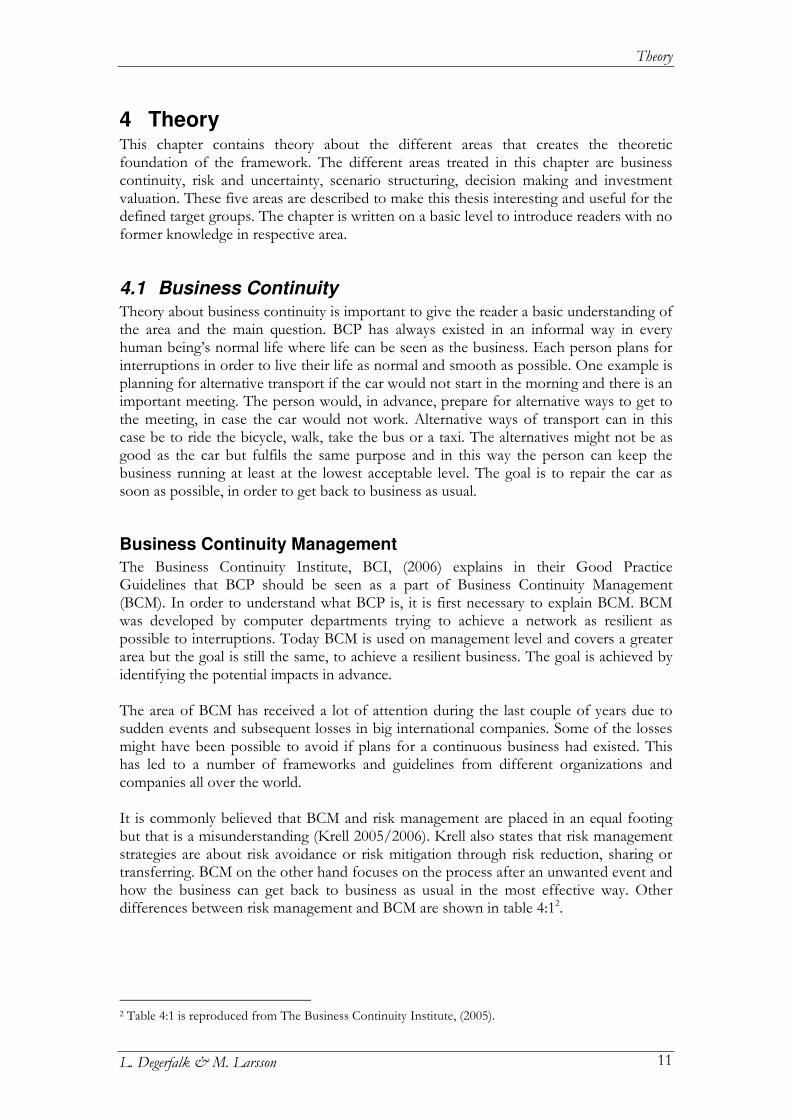
4 Theory This chapter contains theory about the different areas that creates the theoretic foundation of the framework. The different areas treated in this chapter are business continuity, risk and uncertainty, scenario structuring, decision making and investment valuation. These five areas are described to make this thesis interesting and useful for the defined target groups. The chapter is written on a basic level to introduce readers with no former knowledge in respective area.
4.1 Business Continuity Theory about business continuity is important to give the reader a basic understanding of the area and the main question. BCP has always existed in an informal way in every human being’s normal life where life can be seen as the business. Each person plans for interruptions in order to live their life as normal and smooth as possible. One example is planning for alternative transport if the car would not start in the morning and there is an important meeting. The person would, in advance, prepare for alternative ways to get to the meeting, in case the car would not work. Alternative ways of transport can in this case be to ride the bicycle, walk, take the bus or a taxi. The alternatives might not be as good as the car but fulfils the same purpose and in this way the person can keep the business running at least at the lowest acceptable level. The goal is to repair the car as soon as possible, in order to get back to business as usual.
Business Continuity Management
The Business Continuity Institute, BCI, (2006) explains in their Good Practice Guidelines that BCP should be seen as a part of Business Continuity Management (BCM). In order to understand what BCP is, it is first necessary to explain BCM. BCM was developed by computer departments trying to achieve a network as resilient as possible to interruptions. Today BCM is used on management level and covers a greater area but the goal is still the same, to achieve a resilient business. The goal is achieved by identifying the potential impacts in advance. The area of BCM has received a lot of attention during the last couple of years due to sudden events and subsequent losses in big international companies. Some of the losses might have been possible to avoid if plans for a continuous business had existed. This has led to a number of frameworks and guidelines from different organizations and companies all over the world. It is commonly believed that BCM and risk management are placed in an equal footing but that is a misunderstanding (Krell 2005/2006). Krell also states that risk management strategies are about risk avoidance or risk mitigation through risk reduction, sharing or transferring. BCM on the other hand focuses on the process after an unwanted event and how the business can get back to business as usual in the most effective way. Other differences between risk management and BCM are shown in table 4:12.
2 Table 4:1 is reproduced from The Business Continuity Institute, (2005).
How can the business benefit of Business Continuity Planning be measured?
L. Degerfalk & M. Larsson 12
Business Continuity Planning
The BCP process
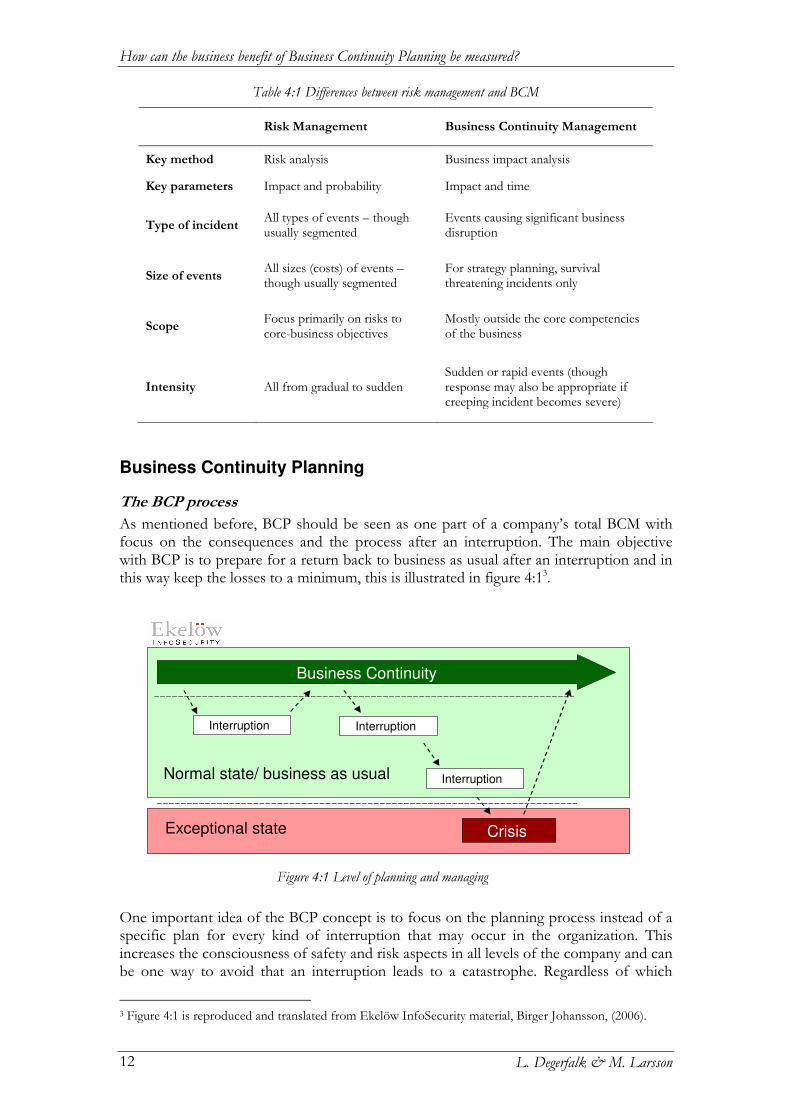
As mentioned before, BCP should be seen as one part of a company’s total BCM with focus on the consequences and the process after an interruption. The main objective with BCP is to prepare for a return back to business as usual after an interruption and in this way keep the losses to a minimum, this is illustrated in figure 4:13.
One important idea of the BCP concept is to focus on the planning process instead of a specific plan for every kind of interruption that may occur in the organization. This increases the consciousness of safety and risk aspects in all levels of the company and can be one way to avoid that an interruption leads to a catastrophe. Regardless of which
3 Figure 4:1 is reproduced and translated from Ekelöw InfoSecurity material, Birger Johansson, (2006).
Table 4:1 Differences between risk management and BCM
Risk Management Business Continuity Management
Key method Risk analysis Business impact analysis
Key parameters Impact and probability Impact and time
Type of incident All types of events – though usually segmented
Events causing significant business disruption
Size of events All sizes (costs) of events – though usually segmented
For strategy planning, survival threatening incidents only
Scope Focus primarily on risks to core-business objectives
Mostly outside the core competencies of the business
Intensity All from gradual to sudden Sudden or rapid events (though response may also be appropriate if creeping incident becomes severe)
Figure 4:1 Level of planning and managing
Interruption
Crisis
Interruption
Interruption
Business Continuity
Normal state/ business as usual
Exceptional state
Theory
L. Degerfalk & M. Larsson 13
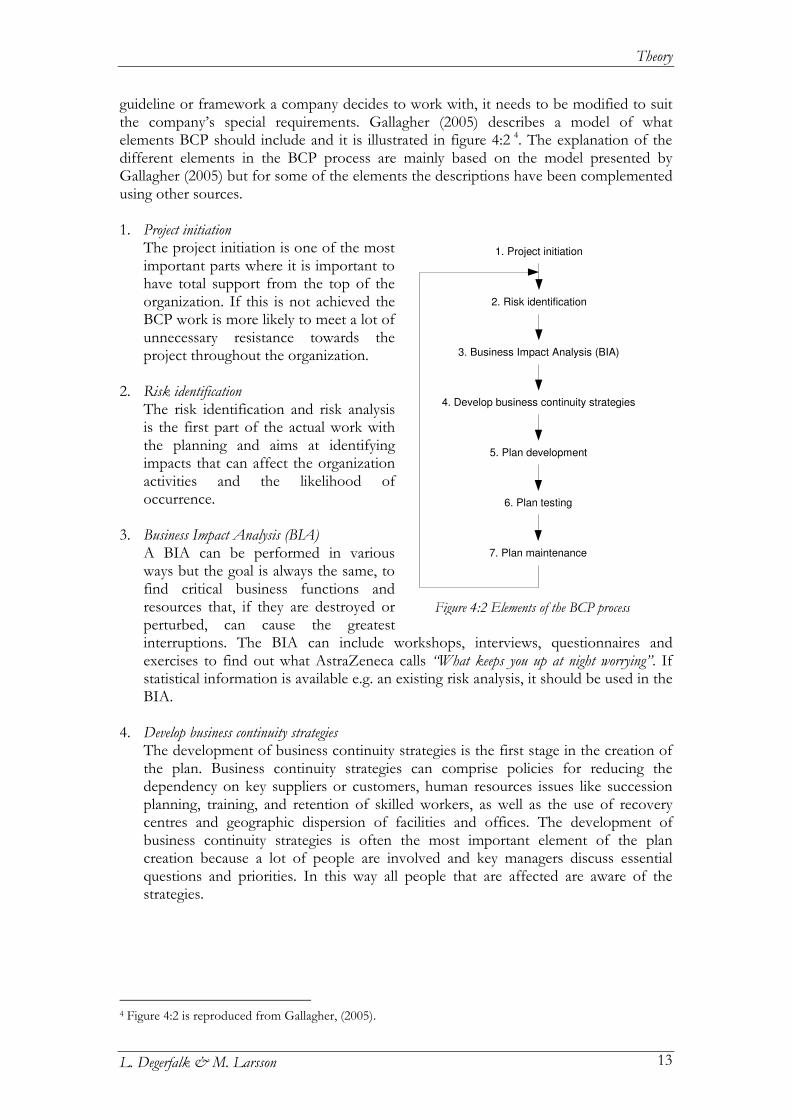
guideline or framework a company decides to work with, it needs to be modified to suit the company’s special requirements. Gallagher (2005) describes a model of what elements BCP should include and it is illustrated in figure 4:2 4. The explanation of the different elements in the BCP process are mainly based on the model presented by Gallagher (2005) but for some of the elements the descriptions have been complemented using other sources. 1. Project initiation
The project initiation is one of the most important parts where it is important to have total support from the top of the organization. If this is not achieved the BCP work is more likely to meet a lot of unnecessary resistance towards the project throughout the organization.
2. Risk identification
The risk identification and risk analysis is the first part of the actual work with the planning and aims at identifying impacts that can affect the organization activities and the likelihood of occurrence.
3. Business Impact Analysis (BIA)
A BIA can be performed in various ways but the goal is always the same, to find critical business functions and resources that, if they are destroyed or perturbed, can cause the greatest interruptions. The BIA can include workshops, interviews, questionnaires and exercises to find out what AstraZeneca calls “What keeps you up at night worrying”. If statistical information is available e.g. an existing risk analysis, it should be used in the BIA.
4. Develop business continuity strategies
The development of business continuity strategies is the first stage in the creation of the plan. Business continuity strategies can comprise policies for reducing the dependency on key suppliers or customers, human resources issues like succession planning, training, and retention of skilled workers, as well as the use of recovery centres and geographic dispersion of facilities and offices. The development of business continuity strategies is often the most important element of the plan creation because a lot of people are involved and key managers discuss essential questions and priorities. In this way all people that are affected are aware of the strategies.
4 Figure 4:2 is reproduced from Gallagher, (2005).
Figure 4:2 Elements of the BCP process
1. Project initiation
2. Risk identification
3. Business Impact Analysis (BIA)
4. Develop business continuity strategies
5. Plan development
6. Plan testing
7. Plan maintenance
How can the business benefit of Business Continuity Planning be measured?
L. Degerfalk & M. Larsson 14
5. Plan development The plan will vary in size and layout depending on the needs and size of the organization. BCP is similar to working with other frameworks, there is no general plan that fits all because every single organization is unique.
6. Plan testing
To avoid the plan resulting in a folder in the bookshelf it is important that the plan is regularly tested to discover weaknesses and to keep employees updated. One way to test the plan is to execute exercises.
7. Plan Maintenance
The fast rate of changes in technology and the business environment makes it necessary to update the plans to maintain a high level of preparedness for interruptions. Elliott et al (2002) say it in other words “Consider a plan to be like a pet – both start with a ‘P’ and both need to be fed to be kept alive!” (p. 74-75).
A result of the BCP process is an action list containing different investment alternatives. All investments aim at making the organization more resilient against interruptions in critical processes. Another result is increased understanding and collaboration between different parts of the organization. According to Krackhardt and Stern (1988) informal relationships and networks across organizational subunits can result in situations being solved before they turn into crisis situations. Krackhardt and Stern believe that the reason for this is that the informal networks are a resource that makes it possible to handle rapidly changing situations. The aim of BCP is to enhance the organizations capability to get back to business as usual as soon as possible after an undesired event, this is also the basic idea for the vulnerability analysis. A description of vulnerability analysis made by Abrahamsson and Magnusson (2004) shows that the work process of vulnerability analysis is similar to the work process of BCP. According to Abrahamsson and Magnusson a vulnerability analysis starts with identifying the risk sources and accident scenarios. The scenarios with low probability are sifted out and the consequences of the remaining scenarios are estimated. The vulnerability is concluded by evaluating the damage reducing resources and the resources for rebuilding and recreating the company. One difference between BCP and vulnerability analysis is that BCP in more commonly used in companies while vulnerability analysis is more commonly used in society e.g. by national and local government. The main objective in a company that works with BCP is to create a resilient business in order to minimize losses in case of interruptions. In the society on the other hand, the main objective is to increase the inhabitants’ safety level.
Motives for BCP
Knight and Pretty (1996) showed in a study that damage to a critical resource in a company often have a catastrophic outcome resulting in lost market shares or in the worst case scenario bankruptcy. Knight and Pretty divided companies into two groups, recovers and non-recovers. The study shows that all companies suffer approximately the same momentary losses compared to other companies of the same size. Still some companies recover while others cannot get back on track. According to Knight and Pretty this is dependent on the level of preparedness or in other words their BCP. One reason for the big losses in market shares and stock value in modern companies after a catastrophe is that an increasing part of the companies’ assets are intangible. Typical
Theory
L. Degerfalk & M. Larsson 15
intangible assets are good will, trademark value, knowledge etc. Myers (1996) points out that up to two thirds of the total assets in an average company is intangible. These assets are built up by the beliefs of the stakeholders and they can be strengthened by advertisement (Hiles, 1999). In the same way advertisement can have a positive effect on the intangible assets a catastrophe can have a negative effect. BCP aims to reduce the likelihood of an interruption leading to a catastrophe. i.e. reduce the likelihood of “bad advertisement”. This should be a strong justification for investing money in BCP. Another advantage that follows BCP is that although there are no legal requirements, similar to the Sarbanes-Oxley Act5 in the area of quality management systems, companies working with BCP still benefits from it (Krell, 2005/2006). One reason to work with BCP might be to show external auditors how risks are handled in the company and how the company can recover from minor and large interruptions. BCP also gives the company the possibility to show the stakeholders of the company that they are trying to do what is possible to secure their interests. An improvement of a company’s safety culture is one advantage that comes with BCP. Elliott et al (2002) state that the BIA and the following exercise in the BCP process increase the risk and safety awareness throughout the company. This is achieved thanks to collaboration between important key persons where they get the opportunity to get together and share information and experience.
BCP Programme at AstraZeneca
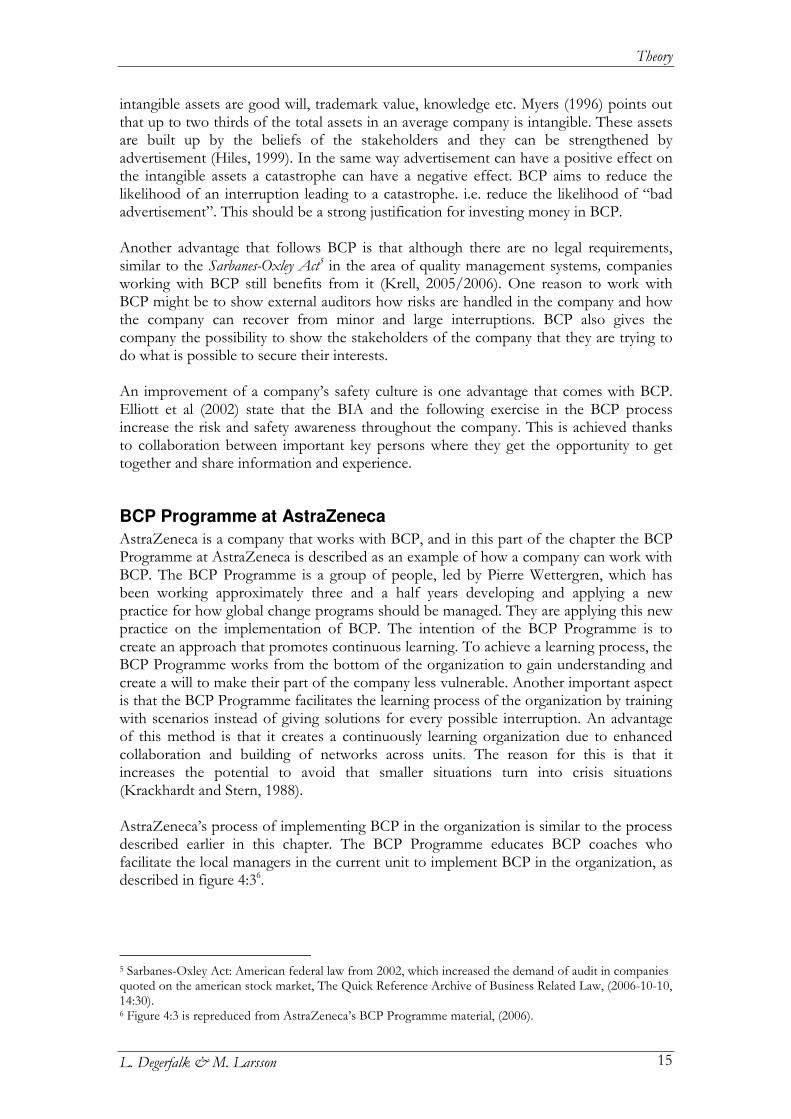
AstraZeneca is a company that works with BCP, and in this part of the chapter the BCP Programme at AstraZeneca is described as an example of how a company can work with BCP. The BCP Programme is a group of people, led by Pierre Wettergren, which has been working approximately three and a half years developing and applying a new practice for how global change programs should be managed. They are applying this new practice on the implementation of BCP. The intention of the BCP Programme is to create an approach that promotes continuous learning. To achieve a learning process, the BCP Programme works from the bottom of the organization to gain understanding and create a will to make their part of the company less vulnerable. Another important aspect is that the BCP Programme facilitates the learning process of the organization by training with scenarios instead of giving solutions for every possible interruption. An advantage of this method is that it creates a continuously learning organization due to enhanced collaboration and building of networks across units. The reason for this is that it increases the potential to avoid that smaller situations turn into crisis situations (Krackhardt and Stern, 1988). AstraZeneca’s process of implementing BCP in the organization is similar to the process described earlier in this chapter. The BCP Programme educates BCP coaches who facilitate the local managers in the current unit to implement BCP in the organization, as described in figure 4:36.
5 Sarbanes-Oxley Act: American federal law from 2002, which increased the demand of audit in companies quoted on the american stock market, The Quick Reference Archive of Business Related Law, (2006-10-10, 14:30). 6 Figure 4:3 is repreduced from AstraZeneca’s BCP Programme material, (2006).
How can the business benefit of Business Continuity Planning be measured?
L. Degerfalk & M. Larsson 16
AstraZeneca’s BCP process contains the five main steps, contract, BIA, exercise, BCP support, and implement support. 1. Contract
During the contract meeting it is important for the BCP coach to get the unit manager to understand the importance of working with BCP. A time frame is also agreed upon to get the process started and follow up meetings for the BIA and Exercise is determined.
2. BIA
The BIA aims at describing the unit’s core business and its critical dependencies. This is made through brainstorming including the unit manager and key people in the unit. It is important that these people participate during this process in order not to omit any important dependencies.
3. Exercise
An exercise is created with input from the BIA that aims at training the organization and finding weaknesses in order to be more resilient to interruptions.
4. BCP support
The knowledge gathered through the BIA and the exercise works as a foundation in the creation of the plan. The plan needs to be created by the unit manager or a key person with support from the BCP coach.
5. Implement support
The BCP coach helps the unit manager in the follow up work creating action lists and maintenance of the plan.
Figure 4:3 AstraZeneca’s BCP coaching process
Exercise
A CB A’
Planning ResumptionHandling
Contract
BIA
BCP Support
Implementsupport
Agreement offramework forcooperation
Description of corebusiness and its
critical dependencies
What would we dobefore, during and after
a major interruption
Knowledge andexperience is
stored in a plan
Training, maintenanceand any other
necessary actions
UnitManager
Internalsupplier
ExternalSupplier
BCPCoach
BCP
Coach
Unit
ManagerKey unitpeople
BCP
Coach
Unit
ManagerKey unitpeople
UnitManager
BCPCoach
BCP
Coach
Unit
ManagerKey unitpeople
Theory
L. Degerfalk & M. Larsson 17
4.2 Risk and uncertainty It is necessary to possess knowledge about risk and uncertainty because these are fundamental parts of BCP. Risk and uncertainty are complex areas with a lot of different definitions, and does not provide an operational definition of risk i.e. a definition that is practically useful. A quantitative way of expressing risk is required when evaluating the risk with the costs and benefits in the process of decision making. Kaplan and Garrick (1980) states that: “the purpose of risk analysis and risk quantification is always to provide input to an underlying decision problem which involves not just risks but also other forms of costs and benefits”. (p. 25) If risks are viewed from the perspective of a company, basically all risks consider the likelihood that the profit can be affected in a negative way. It is not possible, or even necessary, to eliminate all risks but it is necessary to be able to make well founded decisions about which risks that should be dealt with. This can be achieved by connecting the company’s BCP to the long term business strategy of the company.
Different perspectives on risk
One way to look at risk is the technical perspective where risk is represented by the likelihood of one event and the negative consequences that the event can lead to. The problem with the technical perspective is that it gives a relatively uncomplicated image of the risks. Renn (1998) describes a number of shortages of the technical perspective. One is that the technical perspective disregards the multitude of negative aspects that people in general associate with risk. Another shortage is that the interaction between human activities and consequences is more complex than can be described from a technical perspective. The fact that technical risk analyses results in aggregated data for large groups and over a long time period combined with the fact that different individuals are exposed to risk in different degrees due to variations in the probability distribution is also a shortage. The reason for this is that there are persons that will be exposed to a larger risk than the average since the technical perspective is based on aggregated calculations. One perspective that includes these aspects of risk is called the social science perspective. Nilsson (2003) states that there is a perspective that lies somewhere in between the technical and the social science perspectives, called the economical perspective. In this perspective one tries to determine a price for people’s opinions of utility, in the same way consequences are estimated in the form of lost utility i.e. economical loss. According to Renn (1998) the major application area for the economic perspective is decision making, where the risks are balanced against the benefits and the base unit is expected utility.
Quantitative definition of risk
Kaplan and Garrick (1980) give a quantitative definition of risk from a technical perspective and states that risk can be defined by answering three questions:
• What can happen? • How likely is that? • What are the consequences?
How can the business benefit of Business Continuity Planning be measured?
L. Degerfalk & M. Larsson 18
The answers to these questions can be expressed with the triplet of scenario (S), likelihood (L) and consequence (X). The risk is the sum of all scenarios, the likelihood that they occur and the consequence they cause. The first level definition of risk defined by Kaplan and Garrick (1980) is illustrated in definition 4:1.
First level: Risk = { < Si , Li , Xi > }c (Definition 4:1) The “c” in definition 4:1 stands for complete since the complete set of answers i.e. all possible answers are included. In the second level definition the state of knowledge about the likelihood and the consequence is represented with probability curves, as illustrated in definition 4:2.
Second level: Risk = { < Si , pi (ϕi) , pi (Xi) > }c (Definition 4:2) The second level definition of risk provides the ability to explicitly include uncertainty regarding probabilities of the risk scenarios and consequences due to these scenarios.
Different views of probability
The representation of the likelihood in the triplet described earlier is dependent on the decision makers’ view of probability. Kaplan (1997) describes three major views of probability: the statistician’s, the Bayesian’s and the mathematician’s. According to Morgan and Henrion (1990) the statistician defines an event’s probability as the frequency of the event’s occurrence in a repetitive experiment. This view of probability is called the objective probability since it exists in the real world and can, in principle, be measured by doing repetitive experiments. In the statistician’s meaning of probability the likelihood of a specific scenario (Si) is represented as a frequency, Li = Φi. The Bayesian view, described by Morgan and Henrion (1990), defines probability as the degree of confidence that an event will occur given the currently known state of information. In this view the likelihood is represented as a probability, Li = pi. Since the Bayesian meaning of probability only exist mentally and not in reality it is also known as the subjective probability. Kaplan (1997) think that describing probability with the word subjective can be misleading and that the misunderstanding origin from the usage of the word confidence. He believes that when the term “degree of confidence” is used in the Bayesian view it is important to have in mind that the confidence level is a property of the evidence, and not the person. The last view of probability is the mathematicians view, Kaplan (1997) states that this view is useful if a frequency exists but it is uncertain what the frequency is. Based on the state of knowledge about the frequency the likelihood is represented with a probability curve, Li = pi(Φi), the probability of frequency. The probability curve can also represent the degree of confidence of the occurrence of a scenario.
Finding the triplets
As the quantitative risk definition mentions, the triplets need to be estimated to get a measurement of the risk. The scenarios can be identified in different ways depending on how detailed the analysis is. General scenarios can be identified by performing a BIA as described in subchapter 4.1. If one wants to identify more specific hazards IEC (1995)
Theory
L. Degerfalk & M. Larsson 19
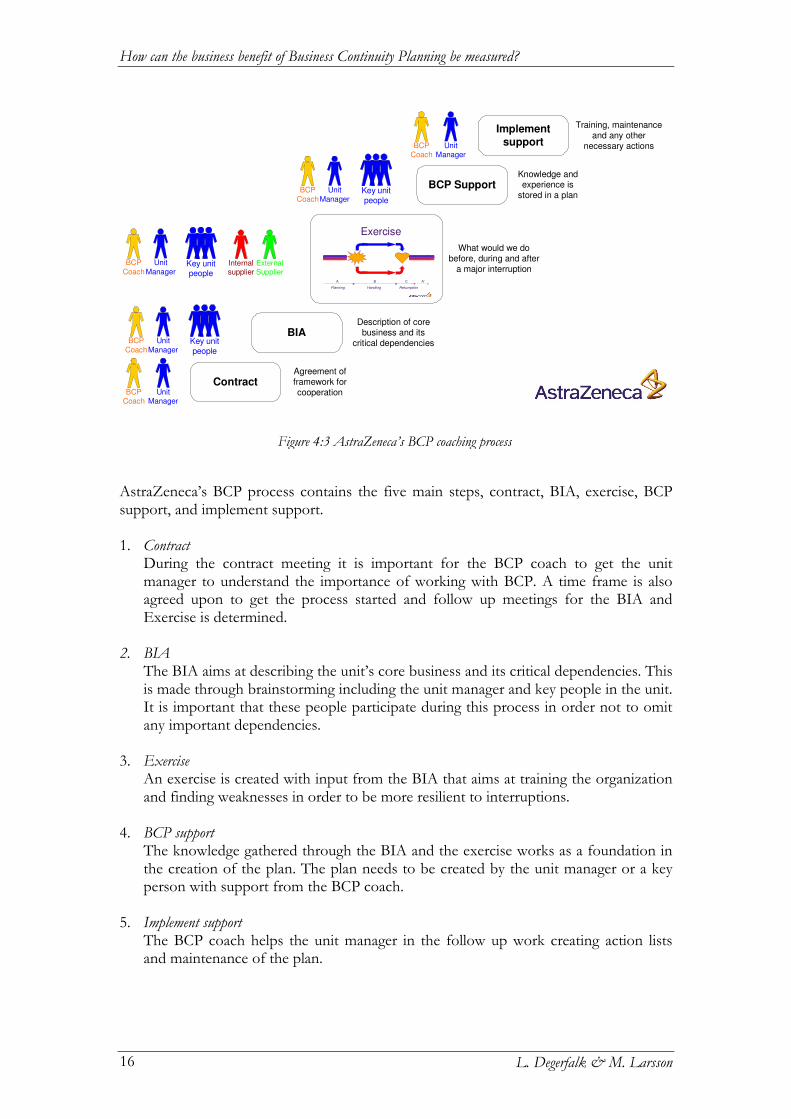
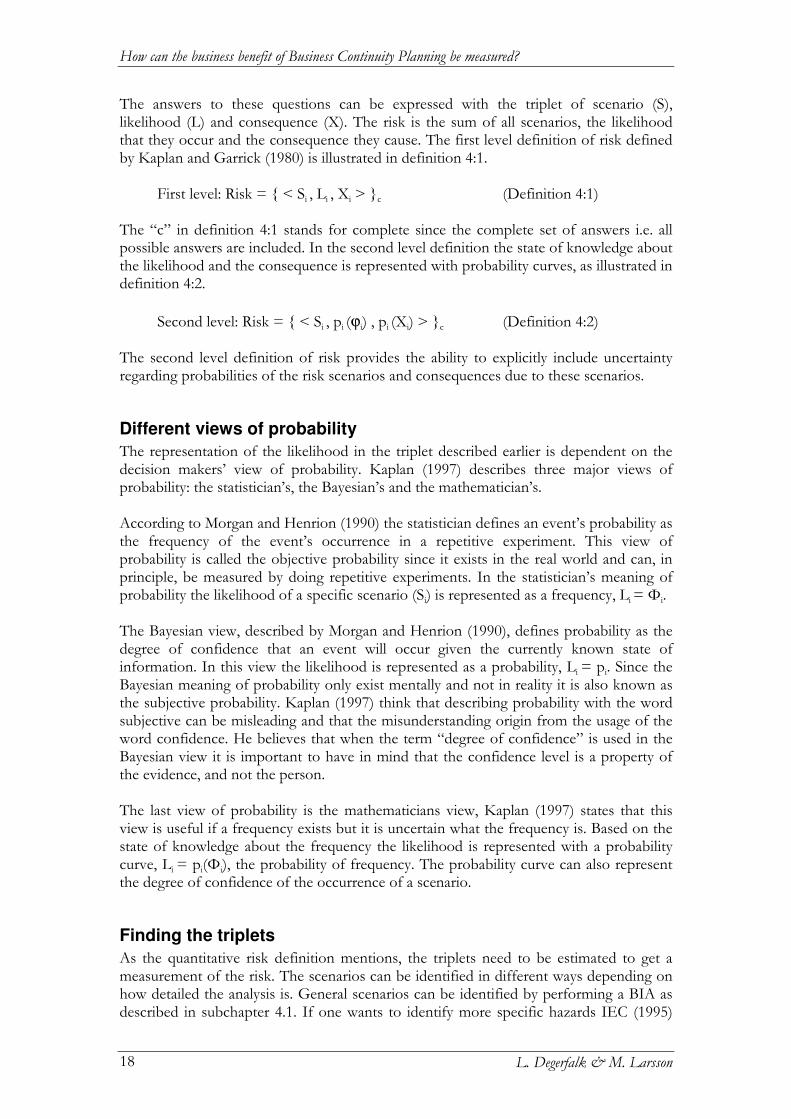
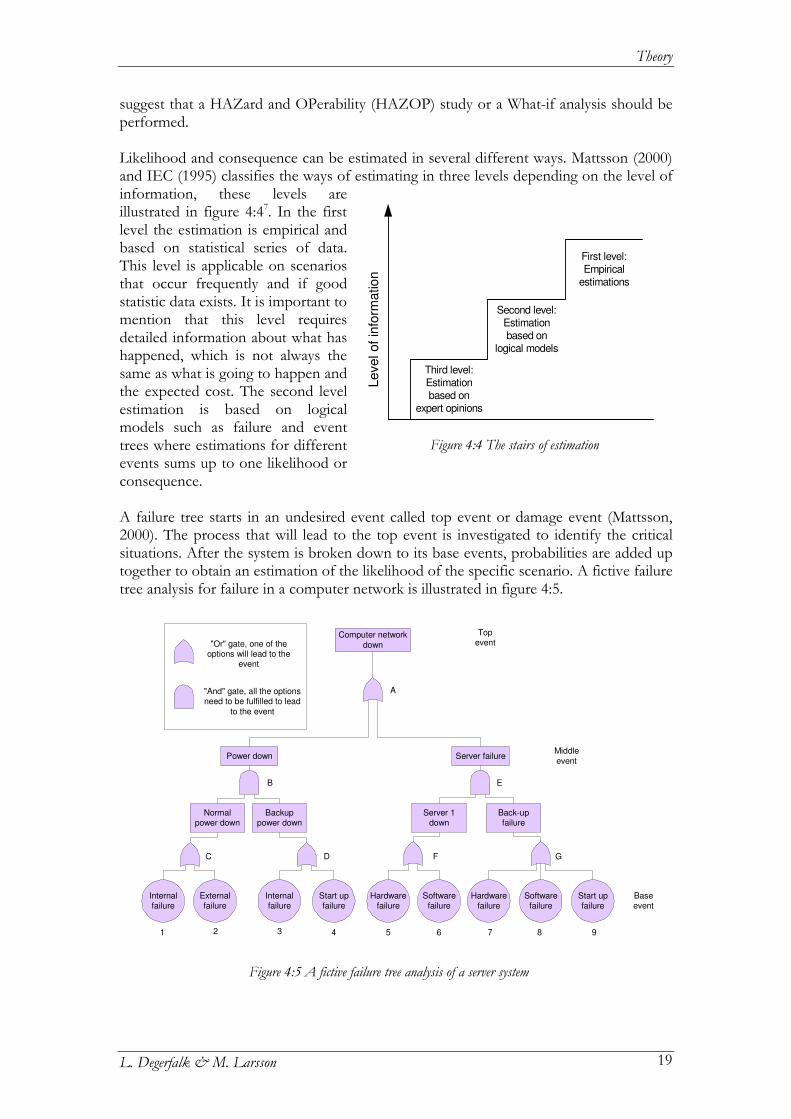
suggest that a HAZard and OPerability (HAZOP) study or a What-if analysis should be performed. Likelihood and consequence can be estimated in several different ways. Mattsson (2000) and IEC (1995) classifies the ways of estimating in three levels depending on the level of information, these levels are illustrated in figure 4:47. In the first level the estimation is empirical and based on statistical series of data. This level is applicable on scenarios that occur frequently and if good statistic data exists. It is important to mention that this level requires detailed information about what has happened, which is not always the same as what is going to happen and the expected cost. The second level estimation is based on logical models such as failure and event trees where estimations for different events sums up to one likelihood or consequence. A failure tree starts in an undesired event called top event or damage event (Mattsson, 2000). The process that will lead to the top event is investigated to identify the critical situations. After the system is broken down to its base events, probabilities are added up together to obtain an estimation of the likelihood of the specific scenario. A fictive failure tree analysis for failure in a computer network is illustrated in figure 4:5.
Figure 4:4 The stairs of estimation
Level of
info
rmation
First level:
Empirical
estimations
Second level:
Estimation
based on
logical models
Third level:
Estimation
based on
expert opinions
Figure 4:5 A fictive failure tree analysis of a server system
Computer network
down
Power down Server failure
Back-upfailure
Server 1down
Hardwarefailure
Softwarefailure
Hardwarefailure
Softwarefailure
Start upfailure
Normalpower down
Backuppower down
Internalfailure
Externalfailure
Internalfailure
Start upfailure
Topevent
Middle
event
Baseevent
"Or" gate, one of theoptions will lead to the
event
"And" gate, all the optionsneed to be fulfilled to lead
to the event
31 42 75 86 9
A
B E
C D F G
How can the business benefit of Business Continuity Planning be measured?
L. Degerfalk & M. Larsson 20
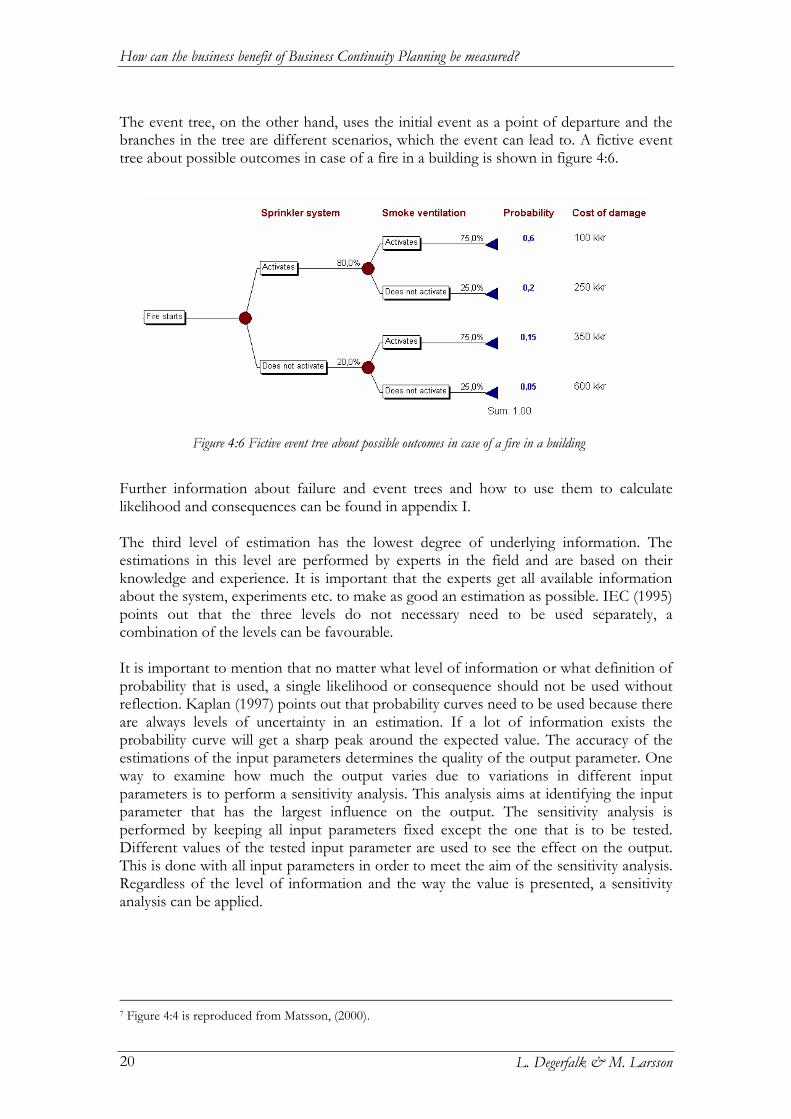
The event tree, on the other hand, uses the initial event as a point of departure and the branches in the tree are different scenarios, which the event can lead to. A fictive event tree about possible outcomes in case of a fire in a building is shown in figure 4:6.
Further information about failure and event trees and how to use them to calculate likelihood and consequences can be found in appendix I. The third level of estimation has the lowest degree of underlying information. The estimations in this level are performed by experts in the field and are based on their knowledge and experience. It is important that the experts get all available information about the system, experiments etc. to make as good an estimation as possible. IEC (1995) points out that the three levels do not necessary need to be used separately, a combination of the levels can be favourable. It is important to mention that no matter what level of information or what definition of probability that is used, a single likelihood or consequence should not be used without reflection. Kaplan (1997) points out that probability curves need to be used because there are always levels of uncertainty in an estimation. If a lot of information exists the probability curve will get a sharp peak around the expected value. The accuracy of the estimations of the input parameters determines the quality of the output parameter. One way to examine how much the output varies due to variations in different input parameters is to perform a sensitivity analysis. This analysis aims at identifying the input parameter that has the largest influence on the output. The sensitivity analysis is performed by keeping all input parameters fixed except the one that is to be tested. Different values of the tested input parameter are used to see the effect on the output. This is done with all input parameters in order to meet the aim of the sensitivity analysis. Regardless of the level of information and the way the value is presented, a sensitivity analysis can be applied.
7 Figure 4:4 is reproduced from Matsson, (2000).
Figure 4:6 Fictive event tree about possible outcomes in case of a fire in a building
Theory
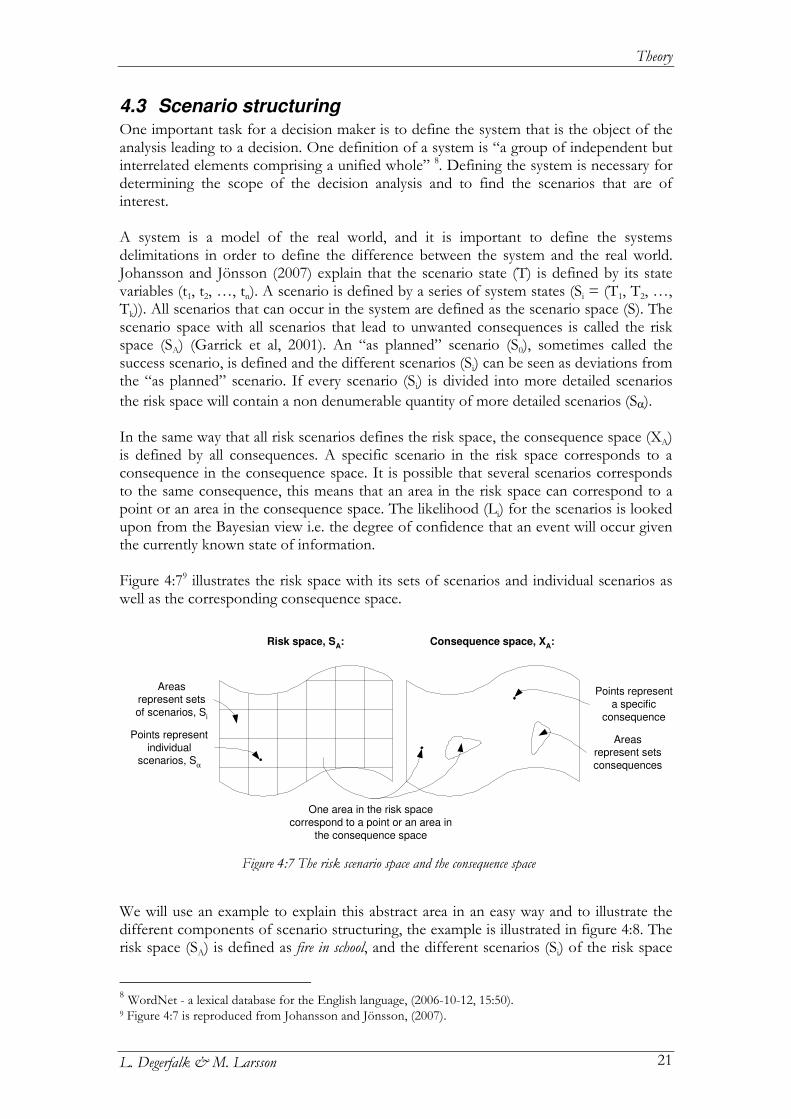
L. Degerfalk & M. Larsson 21
4.3 Scenario structuring One important task for a decision maker is to define the system that is the object of the analysis leading to a decision. One definition of a system is “a group of independent but interrelated elements comprising a unified whole” 8. Defining the system is necessary for determining the scope of the decision analysis and to find the scenarios that are of interest. A system is a model of the real world, and it is important to define the systems delimitations in order to define the difference between the system and the real world. Johansson and Jönsson (2007) explain that the scenario state (T) is defined by its state variables (t1, t2, …, tn). A scenario is defined by a series of system states (Si = (T1, T2, …, Tk)). All scenarios that can occur in the system are defined as the scenario space (S). The scenario space with all scenarios that lead to unwanted consequences is called the risk space (SA) (Garrick et al, 2001). An “as planned” scenario (S0), sometimes called the success scenario, is defined and the different scenarios (Si) can be seen as deviations from the “as planned” scenario. If every scenario (Si) is divided into more detailed scenarios the risk space will contain a non denumerable quantity of more detailed scenarios (Sα). In the same way that all risk scenarios defines the risk space, the consequence space (XA) is defined by all consequences. A specific scenario in the risk space corresponds to a consequence in the consequence space. It is possible that several scenarios corresponds to the same consequence, this means that an area in the risk space can correspond to a point or an area in the consequence space. The likelihood (Li) for the scenarios is looked upon from the Bayesian view i.e. the degree of confidence that an event will occur given the currently known state of information. Figure 4:79 illustrates the risk space with its sets of scenarios and individual scenarios as well as the corresponding consequence space.
We will use an example to explain this abstract area in an easy way and to illustrate the different components of scenario structuring, the example is illustrated in figure 4:8. The risk space (SA) is defined as fire in school, and the different scenarios (Si) of the risk space
8 WordNet - a lexical database for the English language, (2006-10-12, 15:50). 9 Figure 4:7 is reproduced from Johansson and Jönsson, (2007).
Figure 4:7 The risk scenario space and the consequence space
Risk space, SA: Consequence space, X
A:
Areasrepresent sets
of scenarios, Si
Points represent
individualscenarios, S
α
Points represent
a specific
consequence
Areasrepresent sets
consequences
One area in the risk space
correspond to a point or an area in
the consequence space
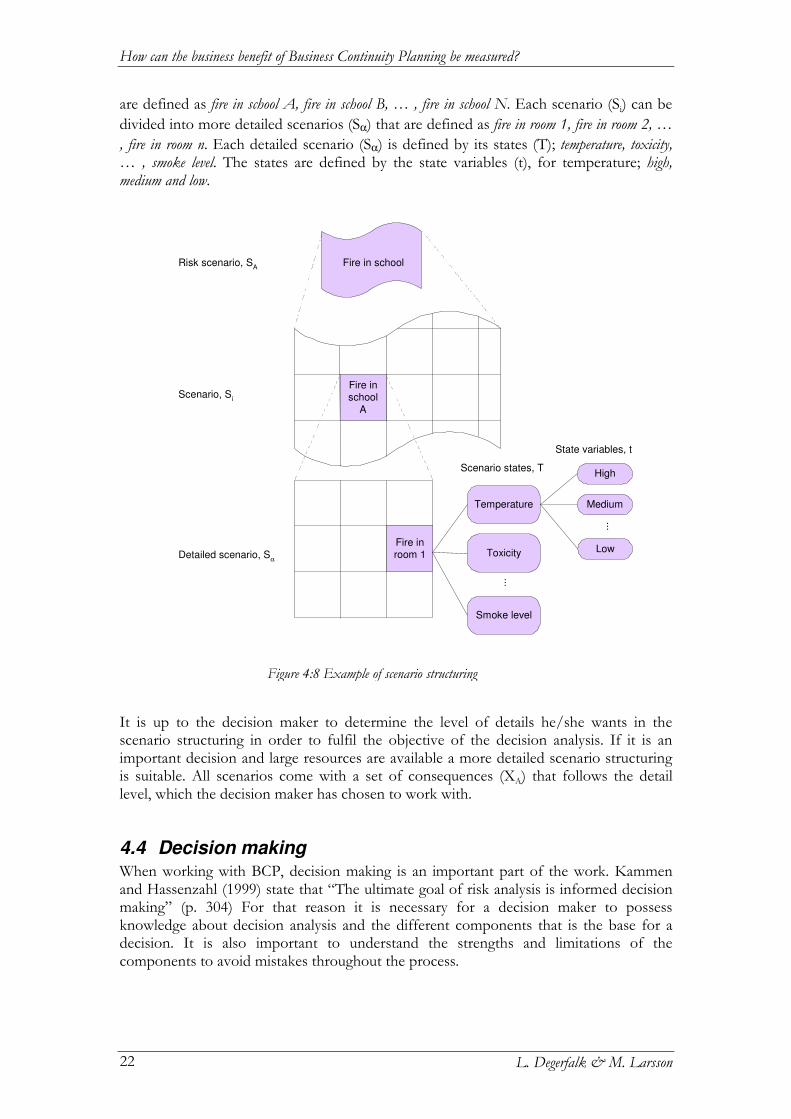
How can the business benefit of Business Continuity Planning be measured?
L. Degerfalk & M. Larsson 22
are defined as fire in school A, fire in school B, … , fire in school N. Each scenario (Si) can be divided into more detailed scenarios (Sα) that are defined as fire in room 1, fire in room 2, … , fire in room n. Each detailed scenario (Sα) is defined by its states (T); temperature, toxicity, … , smoke level. The states are defined by the state variables (t), for temperature; high, medium and low.
It is up to the decision maker to determine the level of details he/she wants in the scenario structuring in order to fulfil the objective of the decision analysis. If it is an important decision and large resources are available a more detailed scenario structuring is suitable. All scenarios come with a set of consequences (XA) that follows the detail level, which the decision maker has chosen to work with.
4.4 Decision making When working with BCP, decision making is an important part of the work. Kammen and Hassenzahl (1999) state that “The ultimate goal of risk analysis is informed decision making” (p. 304) For that reason it is necessary for a decision maker to possess knowledge about decision analysis and the different components that is the base for a decision. It is also important to understand the strengths and limitations of the components to avoid mistakes throughout the process.
Figure 4:8 Example of scenario structuring
Fire in school
Fire inschool
A
Fire inroom 1
...
Smoke level
Toxicity
Temperature
...
Low
Medium
High
Risk scenario, SA
Scenario, Si
Detailed scenario, Sα
Scenario states, T
State variables, t
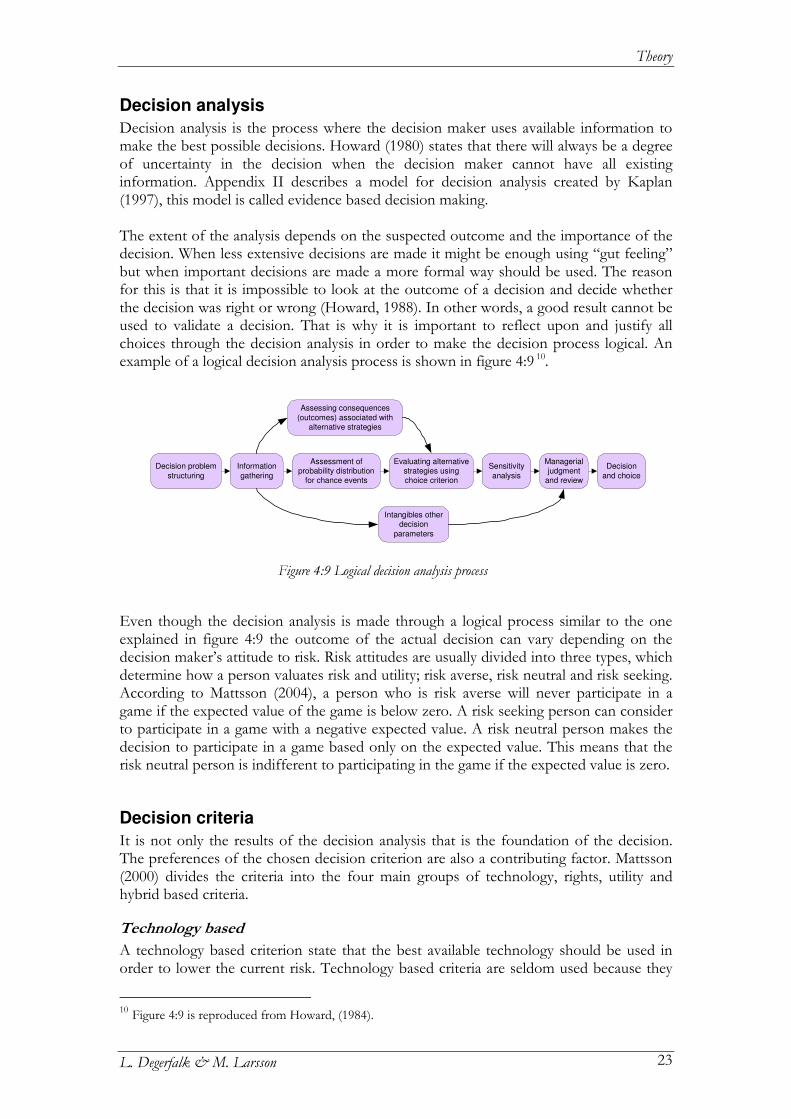
Theory
L. Degerfalk & M. Larsson 23
Decision analysis
Decision analysis is the process where the decision maker uses available information to make the best possible decisions. Howard (1980) states that there will always be a degree of uncertainty in the decision when the decision maker cannot have all existing information. Appendix II describes a model for decision analysis created by Kaplan (1997), this model is called evidence based decision making. The extent of the analysis depends on the suspected outcome and the importance of the decision. When less extensive decisions are made it might be enough using “gut feeling” but when important decisions are made a more formal way should be used. The reason for this is that it is impossible to look at the outcome of a decision and decide whether the decision was right or wrong (Howard, 1988). In other words, a good result cannot be used to validate a decision. That is why it is important to reflect upon and justify all choices through the decision analysis in order to make the decision process logical. An example of a logical decision analysis process is shown in figure 4:9 10.
Even though the decision analysis is made through a logical process similar to the one explained in figure 4:9 the outcome of the actual decision can vary depending on the decision maker’s attitude to risk. Risk attitudes are usually divided into three types, which determine how a person valuates risk and utility; risk averse, risk neutral and risk seeking. According to Mattsson (2004), a person who is risk averse will never participate in a game if the expected value of the game is below zero. A risk seeking person can consider to participate in a game with a negative expected value. A risk neutral person makes the decision to participate in a game based only on the expected value. This means that the risk neutral person is indifferent to participating in the game if the expected value is zero.
Decision criteria
It is not only the results of the decision analysis that is the foundation of the decision. The preferences of the chosen decision criterion are also a contributing factor. Mattsson (2000) divides the criteria into the four main groups of technology, rights, utility and hybrid based criteria.
Technology based
A technology based criterion state that the best available technology should be used in order to lower the current risk. Technology based criteria are seldom used because they
10 Figure 4:9 is reproduced from Howard, (1984).
Assessing consequences
(outcomes) associated withalternative strategies
Decision problem
structuring
Information
gathering
Assessment ofprobability distribution
for chance events
Evaluating alternativestrategies usingchoice criterion
Sensitivity
analysis
Managerialjudgment
and review
Decision
and choice
Intangibles otherdecision
parameters
Figure 4:9 Logical decision analysis process
How can the business benefit of Business Continuity Planning be measured?
L. Degerfalk & M. Larsson 24
are an ineffective way of working due to the possibility of using resources inefficiently. When focusing on only one variable, for instance technology, other important variables where the resources could have had a larger positive impact can be omitted.
Rights based
Decisions concerning societal risks are often taken from this point of view. The rights based criteria can be divided into two sub-criterion called zero risk and maximum risk. One thing that the two sub-criteria have in common is that they focus on the individuals in society and the risk to which they are exposed. If the zero risk criterion is used the risk must not exceed zero, and if the maximum risk criterion is used the risk must not exceed the determined maximum value. Rights based criteria can result in very expensive measures, an example of this is the Swedish national road administration that set the goal of zero killed in the traffic, which if the goal is to be realized will lead to very expensive measures. When rights based criteria are used there exists a possibility that the resources are not used in a cost effective way.
Utility based
When the goal is to maximize the utility of a risk reducing investment utility based criteria can be used. There are three tools for decision analysis based on utility, the first tool is called Cost Benefit Analysis (CBA) where the analyst assigns a number to the costs and benefits of different decision alternatives in order to compare them. The second tool is the Cost Effectiveness Analysis (CEA) where the analyst focuses on a specific measure and only compares different alternatives on the basis of to what extent they fulfil the goal as effective as possible. The third tool is Multi Attribute Utility Theory (MAUT), which aims at reaching a wide single goal such as “a good life”. The extent of the main goal makes it necessary to break it down to several sub-goals. To make it possible to measure if the sub-goals are reached different attributes need to be investigated to see if they are fulfilled.
Hybrid based
This type of criteria is a combination of two or more of the mentioned criterions, e.g. rights and utility based criteria. When more than one measure results in an acceptable risk according to rights based criteria the measure with the highest utility should be chosen in order to make the best decision.
Decision theory
According to Mattsson (2000) decision making is divided into three types of theories, normative, descriptive, and prescriptive theories. A normative theory describes how a decision ideally should be made. The descriptive theories are based on how decision makers actually behave when making decisions. A prescriptive theory aims at helping the decision makers to improve their decision process. The prescriptive theory is according to Howard (1992) a practical application of the normative theory. Aven and Kørte (2003) state that prescriptive theories need to be used when attacking new complex problems. Table 4:2 11 shows in a structured way the difference between the theories.
11 Table 4:2 is reproduced from Mattsson, (2000).
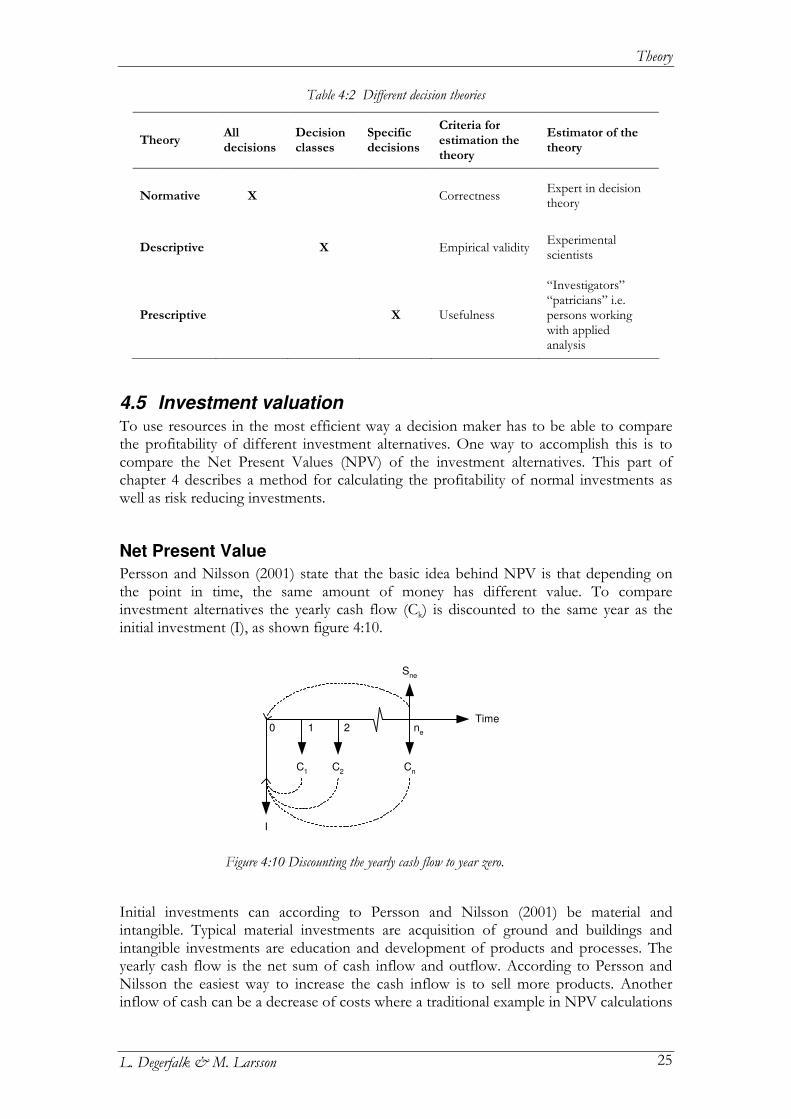
Theory
L. Degerfalk & M. Larsson 25
4.5 Investment valuation To use resources in the most efficient way a decision maker has to be able to compare the profitability of different investment alternatives. One way to accomplish this is to compare the Net Present Values (NPV) of the investment alternatives. This part of chapter 4 describes a method for calculating the profitability of normal investments as well as risk reducing investments.
Net Present Value
Persson and Nilsson (2001) state that the basic idea behind NPV is that depending on the point in time, the same amount of money has different value. To compare investment alternatives the yearly cash flow (Ck) is discounted to the same year as the initial investment (I), as shown figure 4:10.
Initial investments can according to Persson and Nilsson (2001) be material and intangible. Typical material investments are acquisition of ground and buildings and intangible investments are education and development of products and processes. The yearly cash flow is the net sum of cash inflow and outflow. According to Persson and Nilsson the easiest way to increase the cash inflow is to sell more products. Another inflow of cash can be a decrease of costs where a traditional example in NPV calculations
Table 4:2 Different decision theories
Theory All decisions
Decision classes
Specific decisions
Criteria for estimation the theory
Estimator of the theory
Normative X Correctness Expert in decision theory
Descriptive X Empirical validity Experimental scientists
Prescriptive X Usefulness
“Investigators” “patricians” i.e. persons working with applied analysis
Figure 4:10 Discounting the yearly cash flow to year zero.
0 1 2 ne
C1
Cn
C2
I
Time
Sne
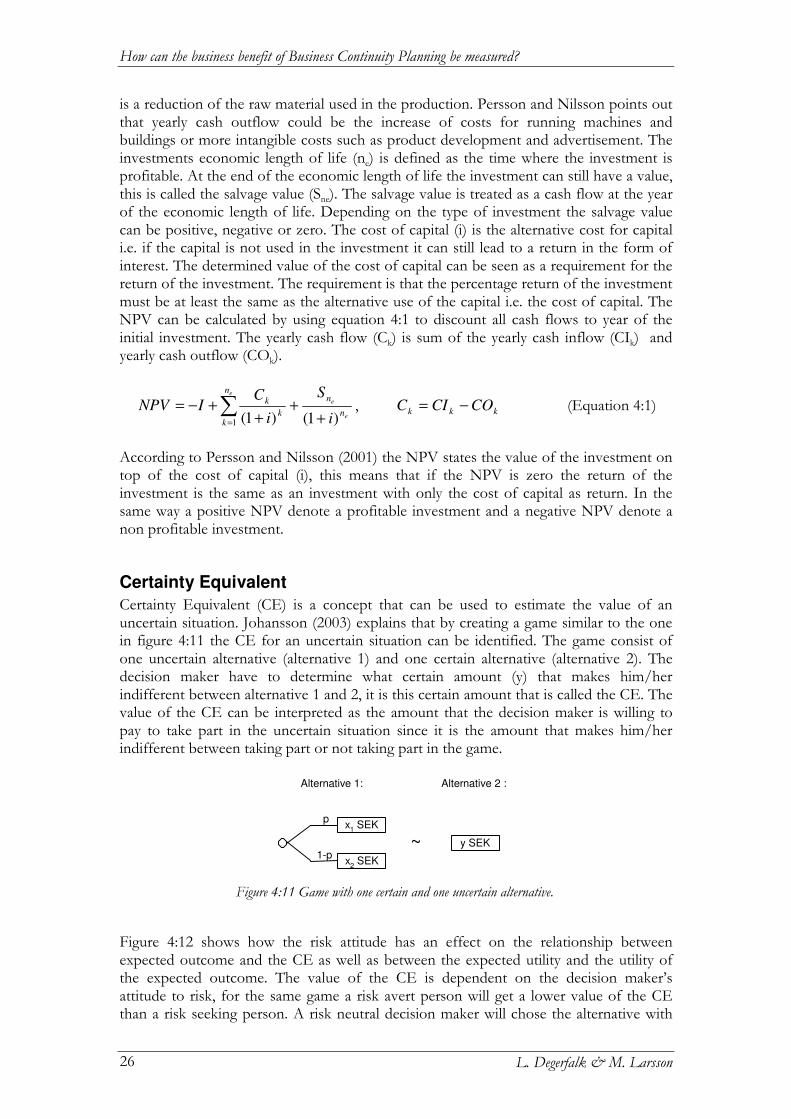
How can the business benefit of Business Continuity Planning be measured?
L. Degerfalk & M. Larsson 26
is a reduction of the raw material used in the production. Persson and Nilsson points out that yearly cash outflow could be the increase of costs for running machines and buildings or more intangible costs such as product development and advertisement. The investments economic length of life (ne) is defined as the time where the investment is profitable. At the end of the economic length of life the investment can still have a value, this is called the salvage value (Sne). The salvage value is treated as a cash flow at the year of the economic length of life. Depending on the type of investment the salvage value can be positive, negative or zero. The cost of capital (i) is the alternative cost for capital i.e. if the capital is not used in the investment it can still lead to a return in the form of interest. The determined value of the cost of capital can be seen as a requirement for the return of the investment. The requirement is that the percentage return of the investment must be at least the same as the alternative use of the capital i.e. the cost of capital. The NPV can be calculated by using equation 4:1 to discount all cash flows to year of the initial investment. The yearly cash flow (Ck) is sum of the yearly cash inflow (CIk) and yearly cash outflow (COk).
e
e
e
n
nn
kk
k
i
S
i
CINPV
)1()1(1 ++
++−= ∑
=
, kkk COCIC −= (Equation 4:1)
According to Persson and Nilsson (2001) the NPV states the value of the investment on top of the cost of capital (i), this means that if the NPV is zero the return of the investment is the same as an investment with only the cost of capital as return. In the same way a positive NPV denote a profitable investment and a negative NPV denote a non profitable investment.
Certainty Equivalent
Certainty Equivalent (CE) is a concept that can be used to estimate the value of an uncertain situation. Johansson (2003) explains that by creating a game similar to the one in figure 4:11 the CE for an uncertain situation can be identified. The game consist of one uncertain alternative (alternative 1) and one certain alternative (alternative 2). The decision maker have to determine what certain amount (y) that makes him/her indifferent between alternative 1 and 2, it is this certain amount that is called the CE. The value of the CE can be interpreted as the amount that the decision maker is willing to pay to take part in the uncertain situation since it is the amount that makes him/her indifferent between taking part or not taking part in the game.
Figure 4:12 shows how the risk attitude has an effect on the relationship between expected outcome and the CE as well as between the expected utility and the utility of the expected outcome. The value of the CE is dependent on the decision maker’s attitude to risk, for the same game a risk avert person will get a lower value of the CE than a risk seeking person. A risk neutral decision maker will chose the alternative with
Figure 4:11 Game with one certain and one uncertain alternative.
Alternative 1: Alternative 2 :
p
1-p
x1 SEK
x2 SEK
y SEK~
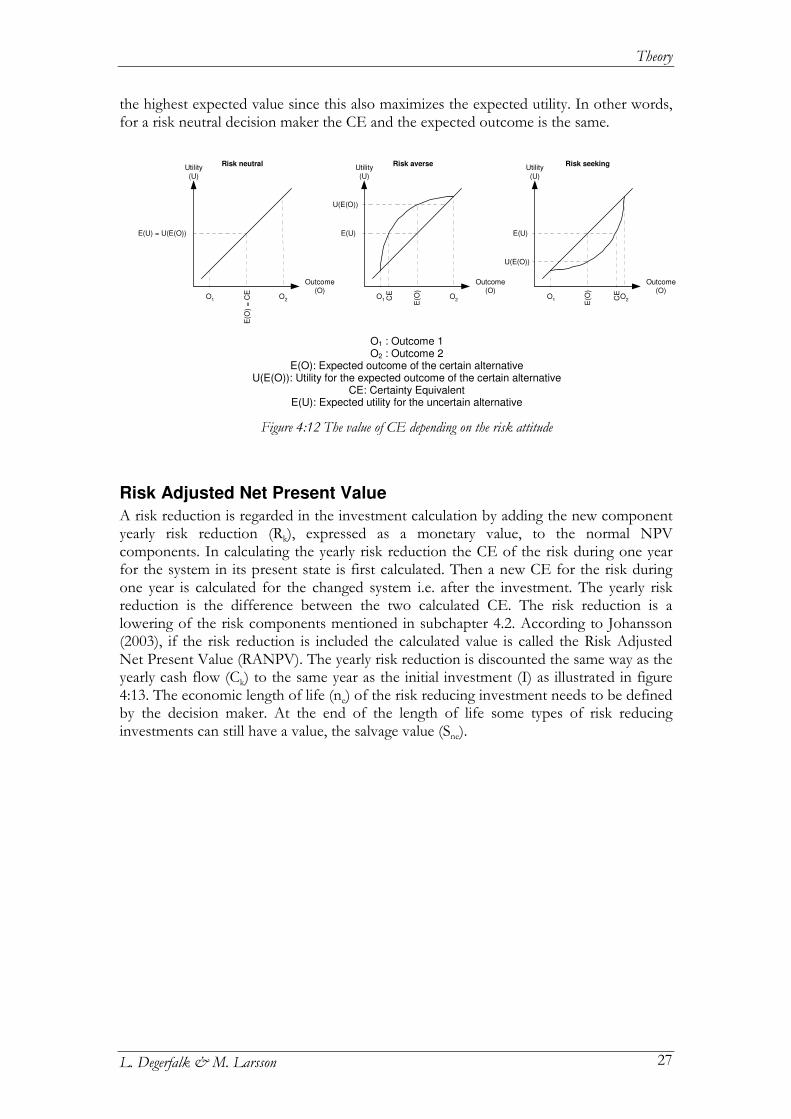
Theory
L. Degerfalk & M. Larsson 27
the highest expected value since this also maximizes the expected utility. In other words, for a risk neutral decision maker the CE and the expected outcome is the same.
Risk Adjusted Net Present Value
A risk reduction is regarded in the investment calculation by adding the new component yearly risk reduction (Rk), expressed as a monetary value, to the normal NPV components. In calculating the yearly risk reduction the CE of the risk during one year for the system in its present state is first calculated. Then a new CE for the risk during one year is calculated for the changed system i.e. after the investment. The yearly risk reduction is the difference between the two calculated CE. The risk reduction is a lowering of the risk components mentioned in subchapter 4.2. According to Johansson (2003), if the risk reduction is included the calculated value is called the Risk Adjusted Net Present Value (RANPV). The yearly risk reduction is discounted the same way as the yearly cash flow (Ck) to the same year as the initial investment (I) as illustrated in figure 4:13. The economic length of life (ne) of the risk reducing investment needs to be defined by the decision maker. At the end of the length of life some types of risk reducing investments can still have a value, the salvage value (Sne).
Figure 4:12 The value of CE depending on the risk attitude
O1 : Outcome 1 O2 : Outcome 2
E(O): Expected outcome of the certain alternative U(E(O)): Utility for the expected outcome of the certain alternative
CE: Certainty Equivalent E(U): Expected utility for the uncertain alternative
Utility
(U)
Outcome(O)
O1
O2
Utility
(U)
Outcome(O)
O1
O2
Utility
(U)
Outcome(O)
O1
O2
E(O
) =
CE
CE
E(O
)
CE
E(O
)
E(U) = U(E(O)) E(U)
U(E(O))
E(U)
U(E(O))
Risk averseRisk neutral Risk seeking
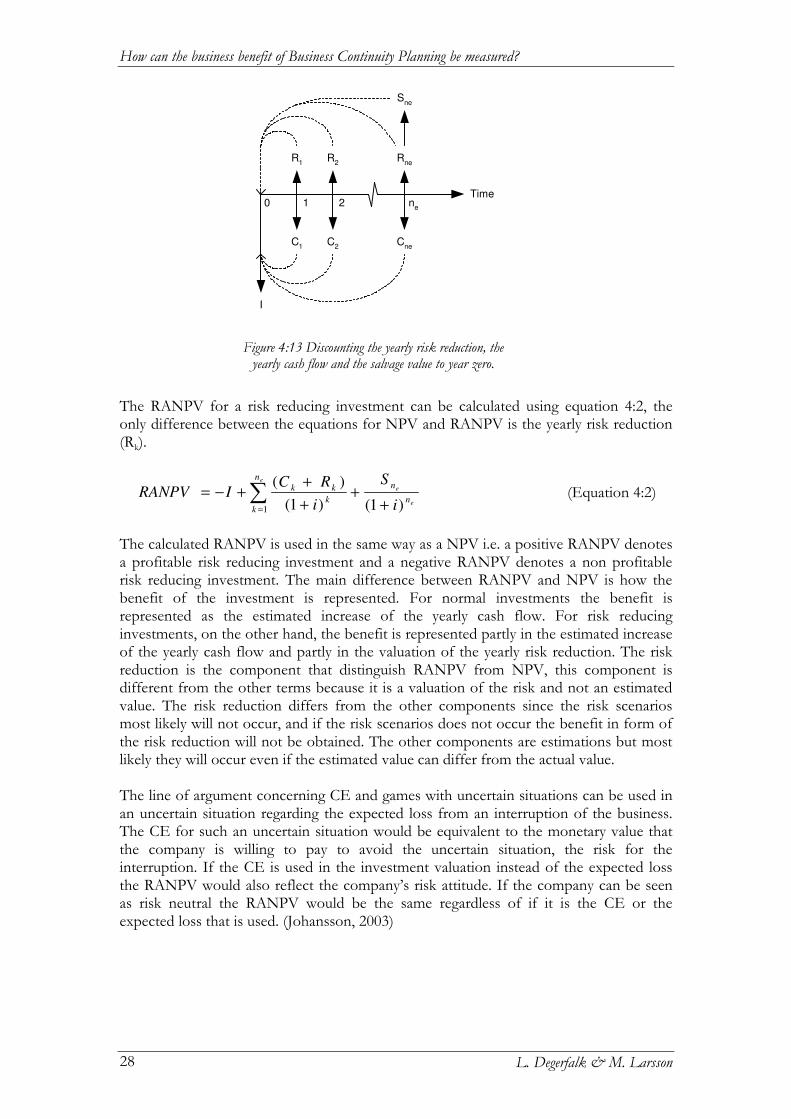
How can the business benefit of Business Continuity Planning be measured?
L. Degerfalk & M. Larsson 28
The RANPV for a risk reducing investment can be calculated using equation 4:2, the only difference between the equations for NPV and RANPV is the yearly risk reduction (Rk).
e
e
e
n
nn
kk
kk
i
S
i
RCIRANPV
)1()1(
)(
1 ++
+
++−= ∑
=
(Equation 4:2)
The calculated RANPV is used in the same way as a NPV i.e. a positive RANPV denotes a profitable risk reducing investment and a negative RANPV denotes a non profitable risk reducing investment. The main difference between RANPV and NPV is how the benefit of the investment is represented. For normal investments the benefit is represented as the estimated increase of the yearly cash flow. For risk reducing investments, on the other hand, the benefit is represented partly in the estimated increase of the yearly cash flow and partly in the valuation of the yearly risk reduction. The risk reduction is the component that distinguish RANPV from NPV, this component is different from the other terms because it is a valuation of the risk and not an estimated value. The risk reduction differs from the other components since the risk scenarios most likely will not occur, and if the risk scenarios does not occur the benefit in form of the risk reduction will not be obtained. The other components are estimations but most likely they will occur even if the estimated value can differ from the actual value. The line of argument concerning CE and games with uncertain situations can be used in an uncertain situation regarding the expected loss from an interruption of the business. The CE for such an uncertain situation would be equivalent to the monetary value that the company is willing to pay to avoid the uncertain situation, the risk for the interruption. If the CE is used in the investment valuation instead of the expected loss the RANPV would also reflect the company’s risk attitude. If the company can be seen as risk neutral the RANPV would be the same regardless of if it is the CE or the expected loss that is used. (Johansson, 2003)
Figure 4:13 Discounting the yearly risk reduction, the yearly cash flow and the salvage value to year zero.
0 1 2 ne
R1
Rne
R2
C1
Cne
C2
I
Time
Sne
Developing the framework
L. Degerfalk & M. Larsson 29
5 Developing the framework As mentioned in subchapter 2.3 the objective is to find a tool to measure the business benefit of BCP. If no tool is to be found a general framework need to be developed. To fully meet the objective of the thesis some requirements need to be considered when creating the framework. The framework is developed to be general in order not only be applicable to AstraZeneca. Another requirement is that the framework must measure the business benefit of BCP in monetary terms. Furthermore, the framework needs to be practically usable for a decision maker.
5.1 Existing ways of measurement An investigation was performed to see if there were any existing research or tools, which could be applicable for answering the three first problems in subchapter 2.4.
Empirical comparisons
In theory, the easiest and best way of measuring the benefit of BCP would be an empirical study several organizations to determine if the work is profitable. A study like that was not found, which made sense because in reality such a study would have a lot of weaknesses. One obvious problem would be to find organizations that are so alike that comparing them is meaningful. For a meaningful comparison the organizations must be identical with the exception that one works with BCP and the other one does not, if this is not the case the study would be difficult to validate. Another problem would be to find two organizations that would let somebody take part of the confidential information necessary for a reliable comparison. As a general model for measuring the total business benefit of BCP was not found it became obvious that it would be hard to perform a similar comparison in this thesis. Not only would the earlier mentioned problems have been faced, a study of this size would also be much more extensive than a master’s thesis.
Existing research and tools
In situations where empirical comparisons are not available and not possible to make, models and tools are created to reflect reality in the best possible way. These are developed to give decision makers a foundation for decisions. Kotheimer and Coffin (2003) describe how the benefit of BCP could be compared to the benefit of other activities of an organization, for instance internal audit, that does not contribute directly to the organization’s profit. The main idea is to summarize the BCM’s advantages and disadvantages to be able to perform the empirical comparison mentioned earlier. This approach could have been good but it contains too many estimations without justification and the aim is to justify BCM and not BCP. This tool cannot be used directly but the idea with the comparison might be applicable when measuring the business benefit of BCP. Cecich (2005) states that it is getting more important to show the Return Of Investment (ROI) for safety and health investments. The reasons are that the organization has to show that the investment in safety does save more money than could have been won by
How can the business benefit of Business Continuity Planning be measured?
L. Degerfalk & M. Larsson 30
investing in other projects (Cecich, 2005). Cecich argues that one need to build a strong business case for risk reducing investments based on the following key issues:
1. ROI on productivity improvement 2. ROI on direct cost savings 3. ROI on direct/indirect cost savings 4. Improving organizational metrics 5. Reducing inherent risk 6. Improving compliance position 7. Aligning with corporate values
Some of the ideas presented by Cecich (2005) are applicable when creating the framework. The ROI on direct/indirect cost savings is of special interest during the process of creating the framework because that is what BCP aims at doing. There are qualitative tools for measuring the benefits of investments in BCP and safety. The tools are often based on subjective comparisons in pairs, where the decision maker compare the different alternatives with each other two by two in order to obtain a ranking of the different alternatives. This means that the result is dependent on the person who is performing the comparison. A weakness with a tool similar to that is that the comparison is not based on logical decision process i.e. the person who is making the comparison is just using his/her gut feeling. One example of a tool based on comparisons in pairs is Telelogic FOCAL POINT™ (2006-11-06), a Web-based decision support platform where the effect of a given measure is estimated in terms of worse, equal, better or much better. This kind of measurement gives the decision maker an indication whether the person performing the comparison thinks the investment is good or bad. The problem with this model is that it does not say anything about monetary benefits, which makes it of no use in this thesis. The area of benefit measurement provides many more tools but the ones mentioned represent the most important types. The problem is that none of the found tools met the requirements of this thesis’ objective in subchapter 2.3. However, ideas from them have been adapted throughout the process of creating the framework.
5.2 Fundamental theories of the framework Since none of the found existing tools met the requirements a framework needed to be developed. In this part of chapter 5 the theories used as foundation for the framework as well as the reasons to why these theories were chosen are described. Appendix III shows the structure for the fundamental theories used in the process of developing the framework i.e. the structure for subchapter 5.2.
Basic viewpoints
The aim of the framework was determined by the choice of decision theory. The framework is prescriptive which means that it aims at helping decision makers to improve their decision process. If it had been a normative framework the aim would have been to describe an ideal way to make decisions and if it had been a descriptive framework the aim would have been to try to describe how decision makers actually make decisions. Howard (1992) states that people do not always make decisions according to normative and prescriptive theories. However, a prescriptive framework is,
Developing the framework
L. Degerfalk & M. Larsson 31
as mentioned in subchapter 4.4, designed to help the decision maker, which makes the prescriptive decision theory best suited for this thesis. In the process of developing the framework, BCP was always considered to make sure that the framework would meet the requirements. The prescriptive decision theory aims at helping the decision maker to make better decisions and in this case a better decision is a more well founded decision. The knowledge about BCP and the prescriptive decision theory was the foundation of the developed framework and the purpose was to help the decision maker in the decision process of what risk reducing investment alternative to invest in.
Theories used in the decision analysis
This part of subchapter 5.2 treats the different theories that have been used in the process of creating the framework and the assumptions that was made. They are presented in a schematic illustration in appendix III. In order to perform a well founded decision analysis it is important to be able to perform proper investment valuations and to chose the right decision criterion. The decision maker also needs a deep understanding of why it is of great importance to define a specific system and its different investment alternatives. The risk reducing investment alternatives are evaluated based on their different scenarios, consequences and likelihood. As pointed out in subchapter 4.3 it is important for the decision maker to define and describe the system where he/she has the intention to make the decisions. The scope of the system in the analysis needs to be determined by the decision maker to focus on the most important issues. The decision maker can use the different system levels described in subchapter 4.3 to systematise his/her work. The choice of decision criterion determines the focus of the decision analysis. The criteria based on rights and technology cannot be used to maximize the utility as described in subchapter 4.4. Therefore, these criteria cannot be used to answer the main question in this thesis, instead the utility based criterion is chosen as it best serves the objective. The process used to evaluate alternatives based on their utility have many similarities to the CBA described in Appendix IV. The major difference is the approach to the estimation of the utility where the chosen approach is more similar to the quantitative definition of risk i.e. Kaplan and Garrick’s (1980) triplets mentioned in subchapter 4.2. The alternative approach used in CBA is Willingness To Pay (WTP) and Willingness To Accept (WTA), which are more subjective valuations, these methods are described in appendix IV. The reason to why the triplet thinking was chosen is that Howard (1988) states that a decision cannot be judged based only on the outcome of the decision, it is the process leading to the decision that needs to be logical. To obtain as reliable calculations of the utility as possible the estimations of likelihood and consequence need to be justified i.e. the use of the triplets makes the process of estimating the likelihood and consequence more logical, which results in the best estimations possible. We have chosen to use Kaplan’s way of thinking in triplets described in subchapter 4.2 to estimate likelihood and consequence and use them to calculate the yearly risk reduction. By assuming risk neutrality the CE has the same value as the expected outcome. This means that the calculated expected outcome before and after the risk reducing investment can be used to determine the yearly risk reduction. In this thesis it is assumed
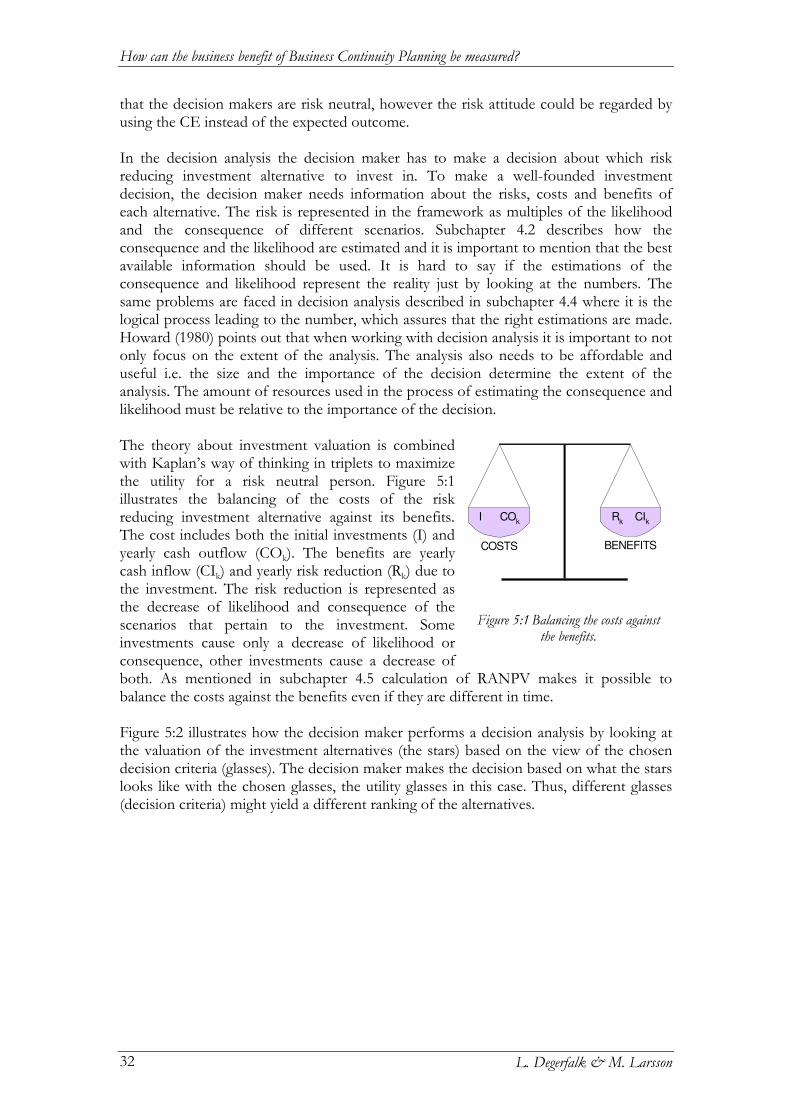
How can the business benefit of Business Continuity Planning be measured?
L. Degerfalk & M. Larsson 32
I COk
Rk CI
k
COSTS BENEFITS
Figure 5:1 Balancing the costs against the benefits.
that the decision makers are risk neutral, however the risk attitude could be regarded by using the CE instead of the expected outcome. In the decision analysis the decision maker has to make a decision about which risk reducing investment alternative to invest in. To make a well-founded investment decision, the decision maker needs information about the risks, costs and benefits of each alternative. The risk is represented in the framework as multiples of the likelihood and the consequence of different scenarios. Subchapter 4.2 describes how the consequence and the likelihood are estimated and it is important to mention that the best available information should be used. It is hard to say if the estimations of the consequence and likelihood represent the reality just by looking at the numbers. The same problems are faced in decision analysis described in subchapter 4.4 where it is the logical process leading to the number, which assures that the right estimations are made. Howard (1980) points out that when working with decision analysis it is important to not only focus on the extent of the analysis. The analysis also needs to be affordable and useful i.e. the size and the importance of the decision determine the extent of the analysis. The amount of resources used in the process of estimating the consequence and likelihood must be relative to the importance of the decision. The theory about investment valuation is combined with Kaplan’s way of thinking in triplets to maximize the utility for a risk neutral person. Figure 5:1
illustrates the balancing of the costs of the risk reducing investment alternative against its benefits. The cost includes both the initial investments (I) and yearly cash outflow (COk). The benefits are yearly cash inflow (CIk) and yearly risk reduction (Rk) due to the investment. The risk reduction is represented as the decrease of likelihood and consequence of the scenarios that pertain to the investment. Some investments cause only a decrease of likelihood or consequence, other investments cause a decrease of both. As mentioned in subchapter 4.5 calculation of RANPV makes it possible to balance the costs against the benefits even if they are different in time. Figure 5:2 illustrates how the decision maker performs a decision analysis by looking at the valuation of the investment alternatives (the stars) based on the view of the chosen decision criteria (glasses). The decision maker makes the decision based on what the stars looks like with the chosen glasses, the utility glasses in this case. Thus, different glasses (decision criteria) might yield a different ranking of the alternatives.
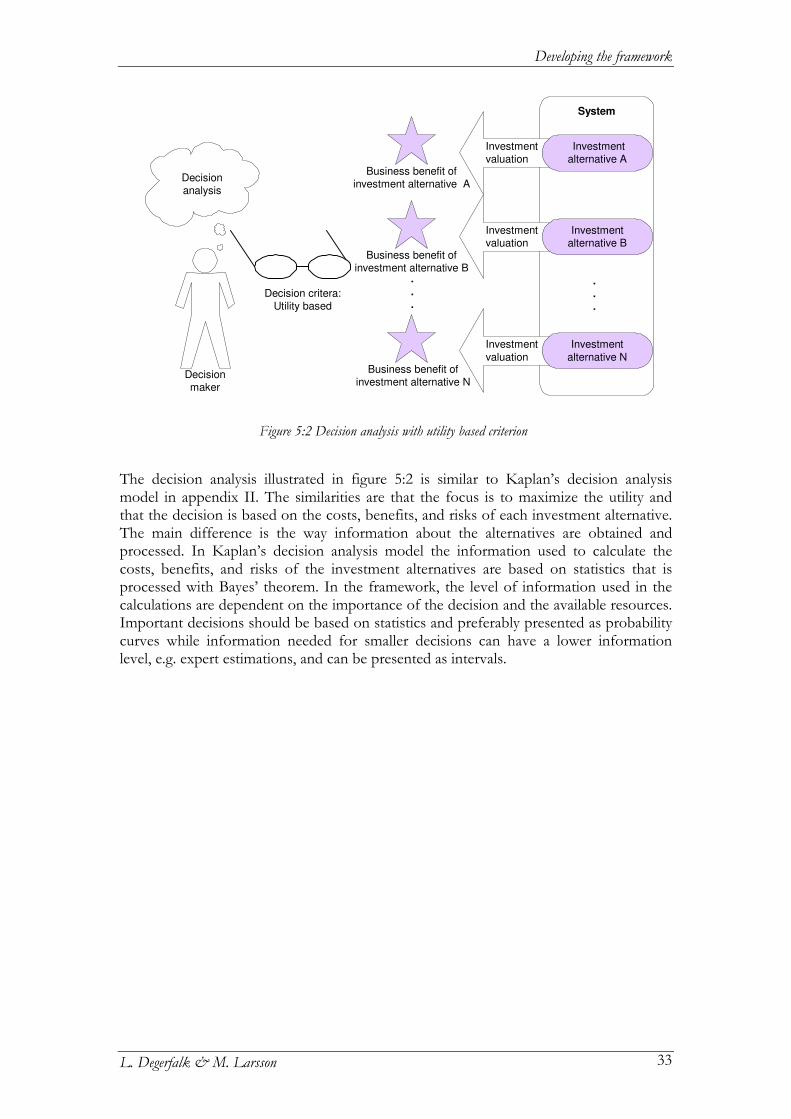
Developing the framework
L. Degerfalk & M. Larsson 33
The decision analysis illustrated in figure 5:2 is similar to Kaplan’s decision analysis model in appendix II. The similarities are that the focus is to maximize the utility and that the decision is based on the costs, benefits, and risks of each investment alternative. The main difference is the way information about the alternatives are obtained and processed. In Kaplan’s decision analysis model the information used to calculate the costs, benefits, and risks of the investment alternatives are based on statistics that is processed with Bayes’ theorem. In the framework, the level of information used in the calculations are dependent on the importance of the decision and the available resources. Important decisions should be based on statistics and preferably presented as probability curves while information needed for smaller decisions can have a lower information level, e.g. expert estimations, and can be presented as intervals.
Figure 5:2 Decision analysis with utility based criterion
System
Decisionanalysis
Decision critera:Utility based
.
.
.
Investment
valuation
.
.
.
Investment
alternative N
Investment valuation
Investment valuation
Investmentalternative A
Investmentalternative B
Business benefit ofinvestment alternative A
Business benefit ofinvestment alternative B
Business benefit ofinvestment alternative N
Decisionmaker

How can the business benefit of Business Continuity Planning be measured?
L. Degerfalk & M. Larsson 34
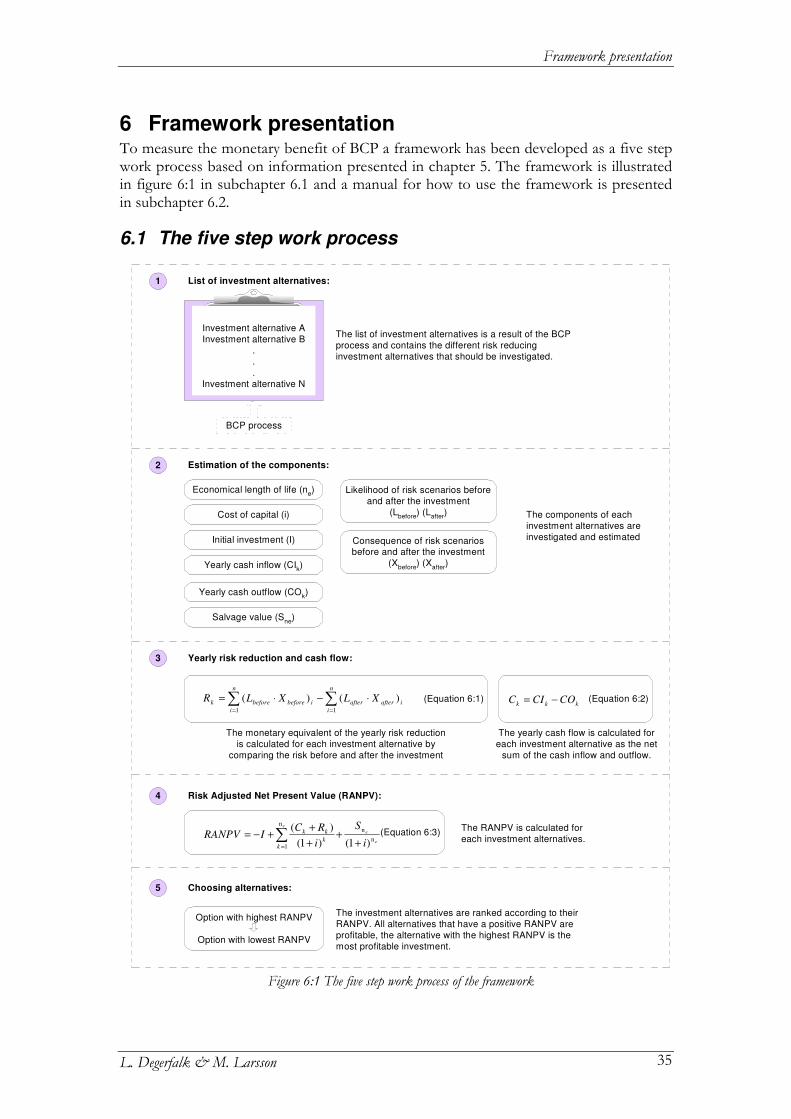
Framework presentation
L. Degerfalk & M. Larsson 35
6 Framework presentation To measure the monetary benefit of BCP a framework has been developed as a five step work process based on information presented in chapter 5. The framework is illustrated in figure 6:1 in subchapter 6.1 and a manual for how to use the framework is presented in subchapter 6.2.
6.1 The five step work process
Figure 6:1 The five step work process of the framework
BCP process
Investment alternative A
Investment alternative B
.
.
.
Investment alternative N
Estimation of the components:
Risk Adjusted Net Present Value (RANPV):
Choosing alternatives:
Likelihood of risk scenarios before
and after the investment
(Lbefore
) (Lafter
)
(Equation 6:3)
Option with highest RANPV
Option with lowest RANPV
1
2
4
5
Initial investment (I)
Yearly cash inflow (CIk)
Cost of capital (i)
Economical length of life (ne)
Yearly risk reduction and cash flow:3
(Equation 6:1)
The list of investment alternatives is a result of the BCP
process and contains the different risk reducing
investment alternatives that should be investigated.
∑∑==
⋅−⋅=n
i
iafterafteri
n
i
beforebeforek XLXLR11
)()(
List of investment alternatives:
Consequence of risk scenariosbefore and after the investment
(Xbefore
) (Xafter
)
The components of each
investment alternatives are
investigated and estimated
(Equation 6:2)kkk COCIC −=
∑= +
++
++−=
e
e
e
kk
kk
i
S
i
RCIRANPV
n
1n
n
)1()1(
)(
The monetary equivalent of the yearly risk reduction
is calculated for each investment alternative by
comparing the risk before and after the investment
The yearly cash flow is calculated for
each investment alternative as the net
sum of the cash inflow and outflow.
The RANPV is calculated for
each investment alternatives.
The investment alternatives are ranked according to their
RANPV. All alternatives that have a positive RANPV are
profitable, the alternative with the highest RANPV is the
most profitable investment.
Yearly cash outflow (COk)
Salvage value (Sne
)
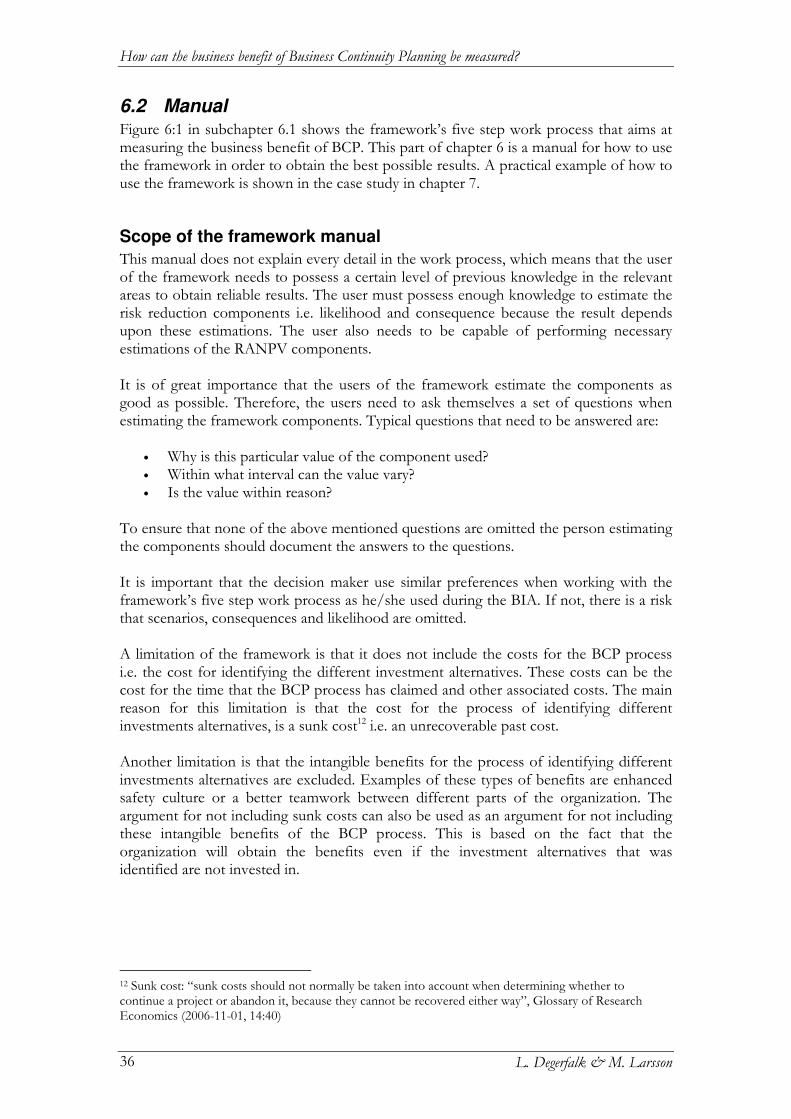
How can the business benefit of Business Continuity Planning be measured?
L. Degerfalk & M. Larsson 36
6.2 Manual Figure 6:1 in subchapter 6.1 shows the framework’s five step work process that aims at measuring the business benefit of BCP. This part of chapter 6 is a manual for how to use the framework in order to obtain the best possible results. A practical example of how to use the framework is shown in the case study in chapter 7.
Scope of the framework manual
This manual does not explain every detail in the work process, which means that the user of the framework needs to possess a certain level of previous knowledge in the relevant areas to obtain reliable results. The user must possess enough knowledge to estimate the risk reduction components i.e. likelihood and consequence because the result depends upon these estimations. The user also needs to be capable of performing necessary estimations of the RANPV components. It is of great importance that the users of the framework estimate the components as good as possible. Therefore, the users need to ask themselves a set of questions when estimating the framework components. Typical questions that need to be answered are:
• Why is this particular value of the component used? • Within what interval can the value vary? • Is the value within reason?
To ensure that none of the above mentioned questions are omitted the person estimating the components should document the answers to the questions. It is important that the decision maker use similar preferences when working with the framework’s five step work process as he/she used during the BIA. If not, there is a risk that scenarios, consequences and likelihood are omitted. A limitation of the framework is that it does not include the costs for the BCP process i.e. the cost for identifying the different investment alternatives. These costs can be the cost for the time that the BCP process has claimed and other associated costs. The main reason for this limitation is that the cost for the process of identifying different investments alternatives, is a sunk cost12 i.e. an unrecoverable past cost. Another limitation is that the intangible benefits for the process of identifying different investments alternatives are excluded. Examples of these types of benefits are enhanced safety culture or a better teamwork between different parts of the organization. The argument for not including sunk costs can also be used as an argument for not including these intangible benefits of the BCP process. This is based on the fact that the organization will obtain the benefits even if the investment alternatives that was identified are not invested in.
12 Sunk cost: “sunk costs should not normally be taken into account when determining whether to continue a project or abandon it, because they cannot be recovered either way”, Glossary of Research Economics (2006-11-01, 14:40)
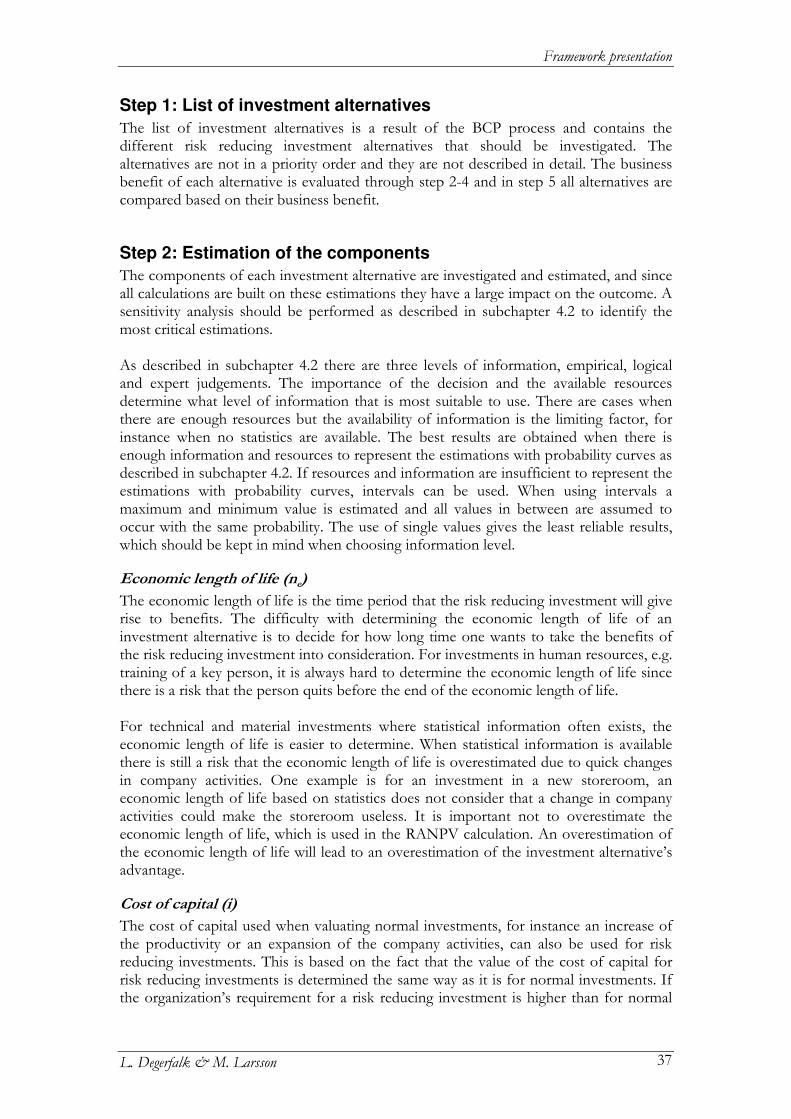
Framework presentation
L. Degerfalk & M. Larsson 37
Step 1: List of investment alternatives
The list of investment alternatives is a result of the BCP process and contains the different risk reducing investment alternatives that should be investigated. The alternatives are not in a priority order and they are not described in detail. The business benefit of each alternative is evaluated through step 2-4 and in step 5 all alternatives are compared based on their business benefit.
Step 2: Estimation of the components
The components of each investment alternative are investigated and estimated, and since all calculations are built on these estimations they have a large impact on the outcome. A sensitivity analysis should be performed as described in subchapter 4.2 to identify the most critical estimations. As described in subchapter 4.2 there are three levels of information, empirical, logical and expert judgements. The importance of the decision and the available resources determine what level of information that is most suitable to use. There are cases when there are enough resources but the availability of information is the limiting factor, for instance when no statistics are available. The best results are obtained when there is enough information and resources to represent the estimations with probability curves as described in subchapter 4.2. If resources and information are insufficient to represent the estimations with probability curves, intervals can be used. When using intervals a maximum and minimum value is estimated and all values in between are assumed to occur with the same probability. The use of single values gives the least reliable results, which should be kept in mind when choosing information level.
Economic length of life (ne)
The economic length of life is the time period that the risk reducing investment will give rise to benefits. The difficulty with determining the economic length of life of an investment alternative is to decide for how long time one wants to take the benefits of the risk reducing investment into consideration. For investments in human resources, e.g. training of a key person, it is always hard to determine the economic length of life since there is a risk that the person quits before the end of the economic length of life. For technical and material investments where statistical information often exists, the economic length of life is easier to determine. When statistical information is available there is still a risk that the economic length of life is overestimated due to quick changes in company activities. One example is for an investment in a new storeroom, an economic length of life based on statistics does not consider that a change in company activities could make the storeroom useless. It is important not to overestimate the economic length of life, which is used in the RANPV calculation. An overestimation of the economic length of life will lead to an overestimation of the investment alternative’s advantage.
Cost of capital (i)
The cost of capital used when valuating normal investments, for instance an increase of the productivity or an expansion of the company activities, can also be used for risk reducing investments. This is based on the fact that the value of the cost of capital for risk reducing investments is determined the same way as it is for normal investments. If the organization’s requirement for a risk reducing investment is higher than for normal
How can the business benefit of Business Continuity Planning be measured?
L. Degerfalk & M. Larsson 38
investments, a higher value on the cost of capital should be used and the other way around.
Initial investment of the alternative (I)
When estimating the initial investment it is important to include both the material and intangible investments to make sure that no costs are excluded. If the initial investment is underestimated the RANPV is overestimated
Yearly cash inflow (CIk)
When estimating the yearly cash inflow it is important to add up all expected inflows such as increase in sold products or decrease of costs. An example of cost reduction as a result of risk reducing investments is decrease of insurance premium. If any cash inflows are excluded the RANPV is underestimated.
Yearly cash outflow (COk)
All yearly costs that result from the investments need to be added up. Typical costs that should be included are decrease in production, increase of running cost for machines and buildings, advertisement etc. If any cash outflows are excluded the RANPV is overestimated.
Salvage value (ST)
An investment can have a salvage value after the chosen economic length of life. It is important to keep this in mind when making the RANPV calculation. Depending on the type of investment the salvage value can be positive, negative or zero. A positive salvage value comes from an investment that can be sold after the economic length of life and gain a cash inflow. The negative salvage values arise when a termination of the investment leads to a cash outflow. In some cases there are no salvage value i.e. it is zero.
Change in likelihood (L) and consequence (X) due to the investment
One investment alternative can lead to a risk reduction of a single scenario, one pair of X and L, or of several scenarios, multiple pairs of X and L. This makes it important to identify all scenarios affected by the investment and to estimate the likelihood and consequence for these scenarios before and after the investment. If scenarios are omitted the benefit of the investment alternative can be underestimated. The change in likelihood (Lbefore, Lafter) and consequence (Xbefore, Xafter) due to the investment is needed when calculating the risk reduction in step 3. The estimation of the likelihood and consequence before and after the investment follows the same procedure and has the same difficulties. The likelihood that each risk scenario occurs before and after the investment need to be estimated. The likelihood of a scenario is expressed as a frequency on a yearly basis. When estimating the likelihood of the scenario the importance of the decision and the available information need to be considered. As mentioned in subchapter 4.2 the likelihood can be estimated in three different levels depending on the available information. 1. Empirical
• Relevant statistical information within the organization should be used if it exists in order to obtain as reliable estimations of the likelihood as possible.
• If relevant statistical information within the organization does not exist external statistics could be used. It is important that the external statistics comes from a comparable organization.
Framework presentation
L. Degerfalk & M. Larsson 39
• If a comparable organization does not exist likelihood from other external organizations could be modified and used. The modification has to be done by the decision maker in terms where he/she estimates if the likelihood for an event should be lower or higher than in the external organization.
2. Logical
• Failure trees could be used in order to estimate the likelihood in a logical way. Statistics, experts or a combination can be used to estimate information in the trees. More information about the failure trees can be found in subchapter 4.2 and appendix I.
3. Expert
• If empirical information does not exist and logical models cannot be used, an expert or a group of experts can estimate the likelihood.
When estimating a monetary value of the consequence of the scenario before and after the investment it is important to consider many types of consequences. Different types of consequences, which should be included in the total consequence, are:
• Damage to personnel health e.g. injuries and fatalities. • Damage to the environment and ecosystems. • Monetary damages e.g. property damage, damage on surrounding property,
damage due to loss of production/sale or lost working days. • Damage to intangible assets e.g. bad publicity or loss of valuable information.
All the mentioned types of consequences can be estimated in the same three levels as the likelihood. The difference is that the logical model used for estimating consequences is event trees described in subchapter 4.2 and appendix I.
Step 3: Risk reduction and cash flow
The components estimated in step 2 are used to calculate the risk reduction and cash flow, which are necessary to determine the RANPV.
Risk reduction
The yearly risk reduction (Rk) is calculated with equation 6:1 by comparing the risk before and after the investment.
Cash flow
The yearly cash flow (Ck) is calculated with equation 6:2 as the net sum of the cash inflow and outflow.
Step 4: Risk Adjusted Net Present Value
The RANPV is calculated with equation 6:3 and the components of the equation is estimated and calculated in step 2-3. It is important to use the economic length of life that is determined in step 2 to discount the components to the year of the initial investment.

How can the business benefit of Business Continuity Planning be measured?
L. Degerfalk & M. Larsson 40
Step 5: Choosing investment alternative
The risk reducing investment alternatives should be arranged according to their RANPV with the highest positive RANPV in the top. A positive RANPV denote a profitable investment and a negative RANPV denote a non-profitable investment. If RANPV is zero the return of the investment is the same as an investment with only the cost of capital as return. All alternatives with positive RANPV are profitable but the decision maker should invest in the alternative with the highest RANPV in order to maximize the utility i.e. the business benefit.
Case study at AstraZeneca
L. Degerfalk & M. Larsson 41
7 Case study at AstraZeneca Case study is a well known method for investigating real life situations and according to Yin (2003) especially within social science. The area of case study has received a lot of criticism throughout the years for the low degree of precision and objectivity. Yin points out that this is the fact and it is important to prepare the case study to obtain results with as high reliability as possible. The case study aimed at testing the developed framework in a real life situation by evaluating two investment alternatives at AstraZeneca. A RANPV was calculated for each investment alternative by using key persons at AstraZeneca to estimate the framework components. The estimations were made with help from the framework manual, subchapter 6.2. The case study was performed to investigate if the framework manual is usable as a facilitating framework for the RANPV calculations i.e. investigate if framework fulfils the requirement of being usable which is presented in subchapter 2.3. As mentioned in subchapter 2.4 another reason for the case study is to exemplify how the framework can be used in a real life situation to valuate risk reducing investment alternatives and to identify the framework’s potential and difficulties. The case study was performed with the intention to be as valid and reliable as possible. The validity was considered by facilitating the key persons is the process of estimating the components just by using the framework and the manual to see if they were usable. The case study’s validity could have been higher if the facilitators would have been other persons than the creators of the framework. A case study similar to this was unfortunately not possible to perform due to lack of resources but has been suggested in future studies in subchapter 9.2. The reliability on the other hand was considered by choosing the key persons, which would have been doing this kind of estimations in the reality.
7.1 Method Yin (2003) states that a case study is applicable on questions asked in terms of “how” and “why”. The first question that was asked was; how does the framework manual work as a facilitating framework for the decision maker? The second question that was asked was: how does the framework work in reality? This kind of case study questions opens for a descriptive answer and is called an explanatory case study. No matter what type of case study that is performed the level of preparedness need to reflect the size of the case study. The performed case study is inductive13 which means that general conclusions was drawn from single cases. General conclusions about the usability of the developed framework was drawn by valuating two investment alternatives. As shown in figure 7:1, the first step in the case study was to chose which investment alternatives to include. By participating in the BCP process at different functions at AstraZeneca, several investment alternatives suitable for the case study emerged. The choice of which investment alternatives to include in the case study was made based on different aspects. One important aspect was time, only the investment alternatives that fit
13 Inductive: “proceeding from particular facts to a general conclusion”, WordNet - a lexical database for the English language, (2006-10-12, 15:50).
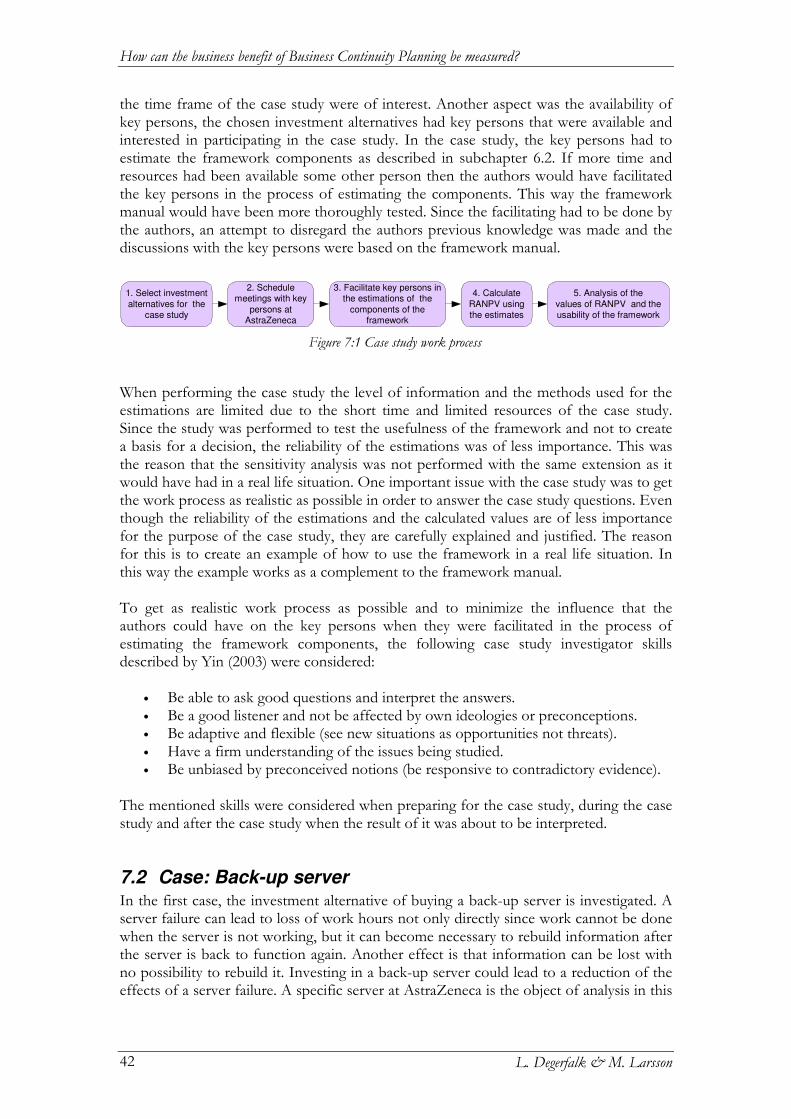
How can the business benefit of Business Continuity Planning be measured?
L. Degerfalk & M. Larsson 42
the time frame of the case study were of interest. Another aspect was the availability of key persons, the chosen investment alternatives had key persons that were available and interested in participating in the case study. In the case study, the key persons had to estimate the framework components as described in subchapter 6.2. If more time and resources had been available some other person then the authors would have facilitated the key persons in the process of estimating the components. This way the framework manual would have been more thoroughly tested. Since the facilitating had to be done by the authors, an attempt to disregard the authors previous knowledge was made and the discussions with the key persons were based on the framework manual.
When performing the case study the level of information and the methods used for the estimations are limited due to the short time and limited resources of the case study. Since the study was performed to test the usefulness of the framework and not to create a basis for a decision, the reliability of the estimations was of less importance. This was the reason that the sensitivity analysis was not performed with the same extension as it would have had in a real life situation. One important issue with the case study was to get the work process as realistic as possible in order to answer the case study questions. Even though the reliability of the estimations and the calculated values are of less importance for the purpose of the case study, they are carefully explained and justified. The reason for this is to create an example of how to use the framework in a real life situation. In this way the example works as a complement to the framework manual. To get as realistic work process as possible and to minimize the influence that the authors could have on the key persons when they were facilitated in the process of estimating the framework components, the following case study investigator skills described by Yin (2003) were considered:
• Be able to ask good questions and interpret the answers. • Be a good listener and not be affected by own ideologies or preconceptions. • Be adaptive and flexible (see new situations as opportunities not threats). • Have a firm understanding of the issues being studied. • Be unbiased by preconceived notions (be responsive to contradictory evidence).
The mentioned skills were considered when preparing for the case study, during the case study and after the case study when the result of it was about to be interpreted.
7.2 Case: Back-up server In the first case, the investment alternative of buying a back-up server is investigated. A server failure can lead to loss of work hours not only directly since work cannot be done when the server is not working, but it can become necessary to rebuild information after the server is back to function again. Another effect is that information can be lost with no possibility to rebuild it. Investing in a back-up server could lead to a reduction of the effects of a server failure. A specific server at AstraZeneca is the object of analysis in this
1. Select investment
alternatives for thecase study
2. Schedulemeetings with key
persons atAstraZeneca
3. Facilitate key persons inthe estimations of the
components of theframework
4. Calculate
RANPV usingthe estimates
5. Analysis of the
values of RANPV and theusability of the framework
Figure 7:1 Case study work process
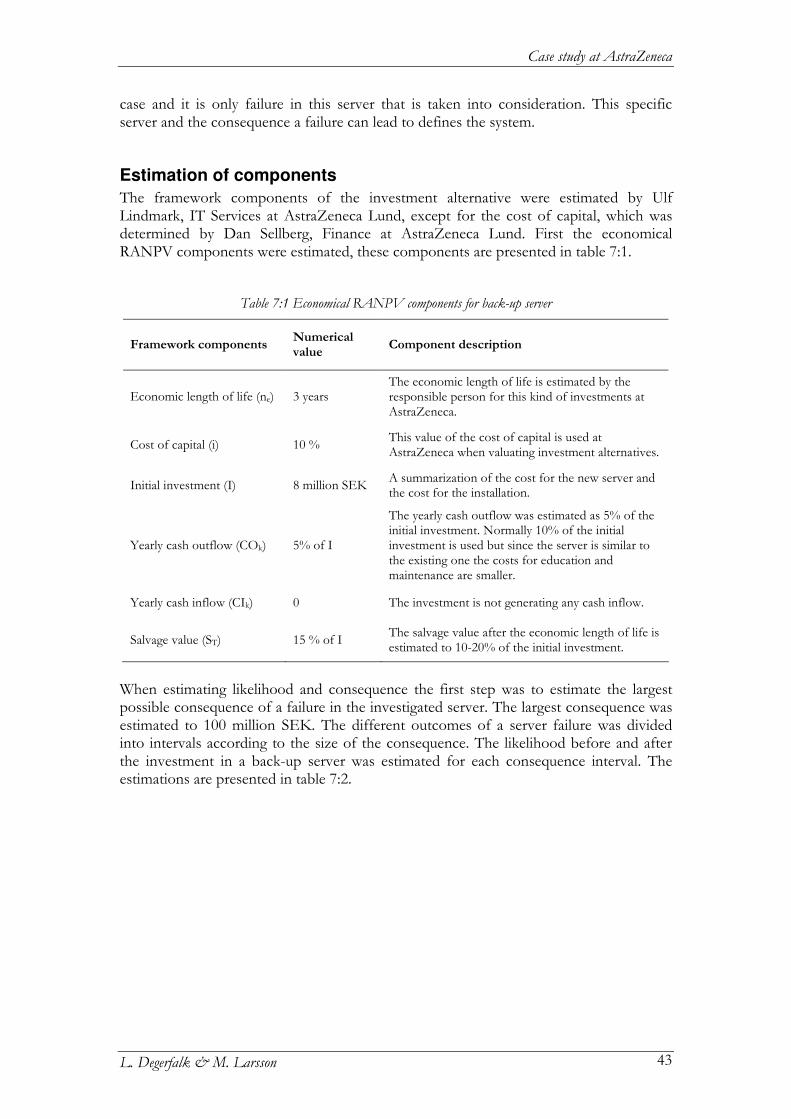
Case study at AstraZeneca
L. Degerfalk & M. Larsson 43
case and it is only failure in this server that is taken into consideration. This specific server and the consequence a failure can lead to defines the system.
Estimation of components
The framework components of the investment alternative were estimated by Ulf Lindmark, IT Services at AstraZeneca Lund, except for the cost of capital, which was determined by Dan Sellberg, Finance at AstraZeneca Lund. First the economical RANPV components were estimated, these components are presented in table 7:1.
When estimating likelihood and consequence the first step was to estimate the largest possible consequence of a failure in the investigated server. The largest consequence was estimated to 100 million SEK. The different outcomes of a server failure was divided into intervals according to the size of the consequence. The likelihood before and after the investment in a back-up server was estimated for each consequence interval. The estimations are presented in table 7:2.
Table 7:1 Economical RANPV components for back-up server
Framework components Numerical value
Component description
Economic length of life (ne) 3 years The economic length of life is estimated by the responsible person for this kind of investments at AstraZeneca.
Cost of capital (i) 10 % This value of the cost of capital is used at AstraZeneca when valuating investment alternatives.
Initial investment (I) 8 million SEK A summarization of the cost for the new server and the cost for the installation.
Yearly cash outflow (COk) 5% of I
The yearly cash outflow was estimated as 5% of the initial investment. Normally 10% of the initial investment is used but since the server is similar to the existing one the costs for education and maintenance are smaller.
Yearly cash inflow (CIk) 0 The investment is not generating any cash inflow.
Salvage value (ST) 15 % of I The salvage value after the economic length of life is estimated to 10-20% of the initial investment.
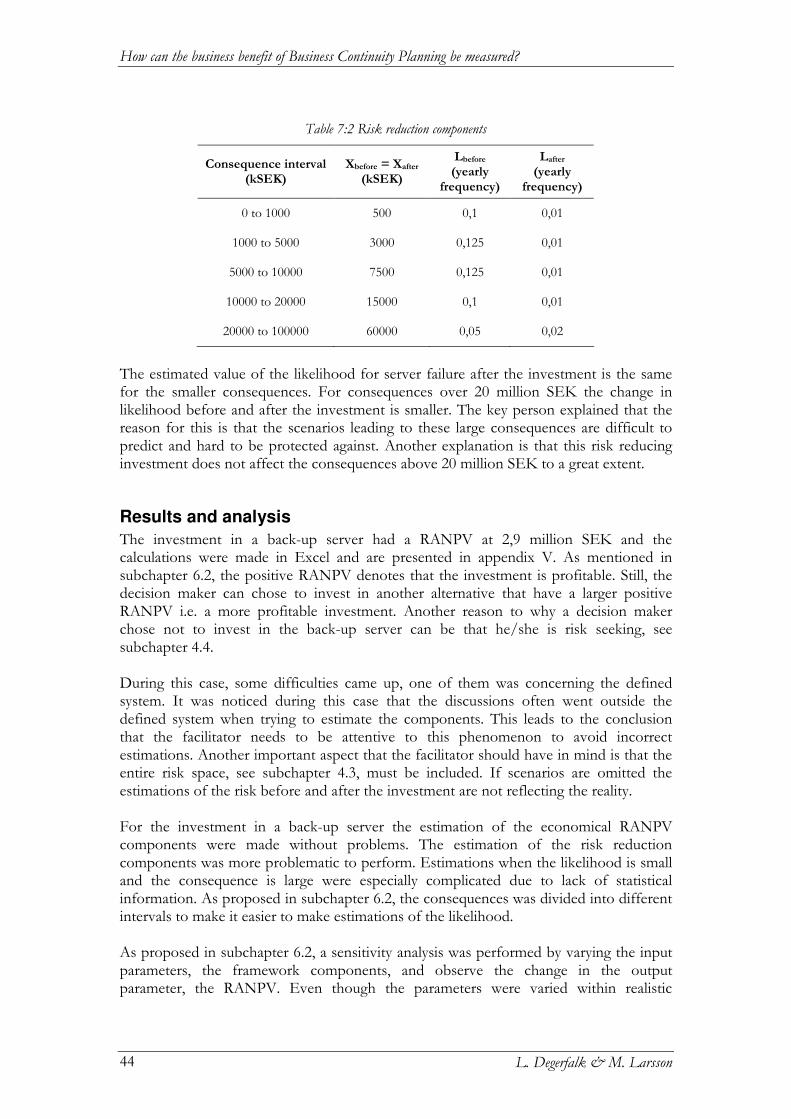
How can the business benefit of Business Continuity Planning be measured?
L. Degerfalk & M. Larsson 44
Table 7:2 Risk reduction components
Consequence interval (kSEK)
Xbefore = Xafter (kSEK)
Lbefore (yearly
frequency)
Lafter (yearly
frequency)
0 to 1000 500 0,1 0,01
1000 to 5000 3000 0,125 0,01
5000 to 10000 7500 0,125 0,01
10000 to 20000 15000 0,1 0,01
20000 to 100000 60000 0,05 0,02
The estimated value of the likelihood for server failure after the investment is the same for the smaller consequences. For consequences over 20 million SEK the change in likelihood before and after the investment is smaller. The key person explained that the reason for this is that the scenarios leading to these large consequences are difficult to predict and hard to be protected against. Another explanation is that this risk reducing investment does not affect the consequences above 20 million SEK to a great extent.
Results and analysis
The investment in a back-up server had a RANPV at 2,9 million SEK and the calculations were made in Excel and are presented in appendix V. As mentioned in subchapter 6.2, the positive RANPV denotes that the investment is profitable. Still, the decision maker can chose to invest in another alternative that have a larger positive RANPV i.e. a more profitable investment. Another reason to why a decision maker chose not to invest in the back-up server can be that he/she is risk seeking, see subchapter 4.4. During this case, some difficulties came up, one of them was concerning the defined system. It was noticed during this case that the discussions often went outside the defined system when trying to estimate the components. This leads to the conclusion that the facilitator needs to be attentive to this phenomenon to avoid incorrect estimations. Another important aspect that the facilitator should have in mind is that the entire risk space, see subchapter 4.3, must be included. If scenarios are omitted the estimations of the risk before and after the investment are not reflecting the reality. For the investment in a back-up server the estimation of the economical RANPV components were made without problems. The estimation of the risk reduction components was more problematic to perform. Estimations when the likelihood is small and the consequence is large were especially complicated due to lack of statistical information. As proposed in subchapter 6.2, the consequences was divided into different intervals to make it easier to make estimations of the likelihood. As proposed in subchapter 6.2, a sensitivity analysis was performed by varying the input parameters, the framework components, and observe the change in the output parameter, the RANPV. Even though the parameters were varied within realistic
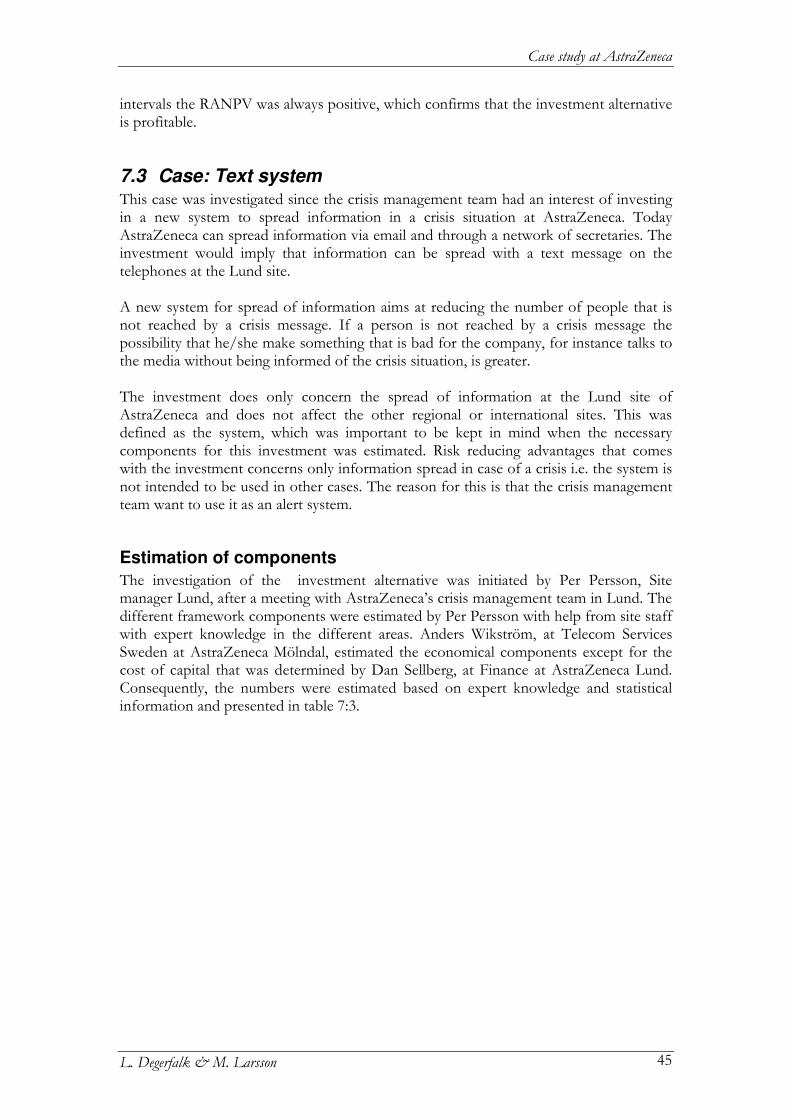
Case study at AstraZeneca
L. Degerfalk & M. Larsson 45
intervals the RANPV was always positive, which confirms that the investment alternative is profitable.
7.3 Case: Text system This case was investigated since the crisis management team had an interest of investing in a new system to spread information in a crisis situation at AstraZeneca. Today AstraZeneca can spread information via email and through a network of secretaries. The investment would imply that information can be spread with a text message on the telephones at the Lund site. A new system for spread of information aims at reducing the number of people that is not reached by a crisis message. If a person is not reached by a crisis message the possibility that he/she make something that is bad for the company, for instance talks to the media without being informed of the crisis situation, is greater. The investment does only concern the spread of information at the Lund site of AstraZeneca and does not affect the other regional or international sites. This was defined as the system, which was important to be kept in mind when the necessary components for this investment was estimated. Risk reducing advantages that comes with the investment concerns only information spread in case of a crisis i.e. the system is not intended to be used in other cases. The reason for this is that the crisis management team want to use it as an alert system.
Estimation of components
The investigation of the investment alternative was initiated by Per Persson, Site manager Lund, after a meeting with AstraZeneca’s crisis management team in Lund. The different framework components were estimated by Per Persson with help from site staff with expert knowledge in the different areas. Anders Wikström, at Telecom Services Sweden at AstraZeneca Mölndal, estimated the economical components except for the cost of capital that was determined by Dan Sellberg, at Finance at AstraZeneca Lund. Consequently, the numbers were estimated based on expert knowledge and statistical information and presented in table 7:3.
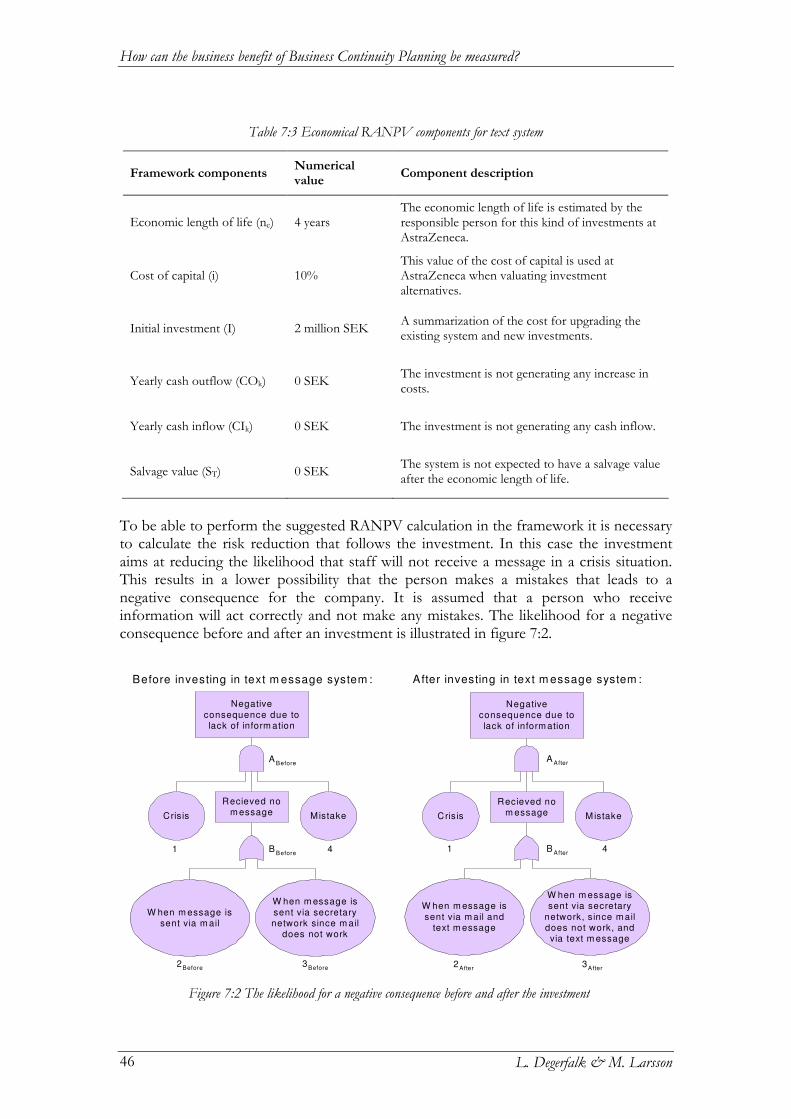
How can the business benefit of Business Continuity Planning be measured?
L. Degerfalk & M. Larsson 46
Table 7:3 Economical RANPV components for text system
Framework components Numerical value
Component description
Economic length of life (ne) 4 years The economic length of life is estimated by the responsible person for this kind of investments at AstraZeneca.
Cost of capital (i) 10% This value of the cost of capital is used at AstraZeneca when valuating investment alternatives.
Initial investment (I) 2 million SEK A summarization of the cost for upgrading the existing system and new investments.
Yearly cash outflow (COk) 0 SEK The investment is not generating any increase in costs.
Yearly cash inflow (CIk) 0 SEK The investment is not generating any cash inflow.
Salvage value (ST) 0 SEK The system is not expected to have a salvage value after the economic length of life.
To be able to perform the suggested RANPV calculation in the framework it is necessary to calculate the risk reduction that follows the investment. In this case the investment aims at reducing the likelihood that staff will not receive a message in a crisis situation. This results in a lower possibility that the person makes a mistakes that leads to a negative consequence for the company. It is assumed that a person who receive information will act correctly and not make any mistakes. The likelihood for a negative consequence before and after an investment is illustrated in figure 7:2.
Negative
consequence due tolack of inform ation
MistakeCrisis
Before investing in text m essage system :
Recieved nom essage
Negativeconsequence due to
lack of inform ation
MistakeCrisis
Recieved nom essage
After investing in text m essage system :
ABefore
BBefore
1 4
2Before
3Before
AAfter
BAfter
1 4
2After
3After
W hen m essage issent via secretary
network, since m aildoes not work, andvia text m essage
W hen m essage is
sent via m ail andtext m essage
W hen m essage is
sent via secretarynetwork since m ail
does not work
W hen m essage issent via m ail
Figure 7:2 The likelihood for a negative consequence before and after the investment
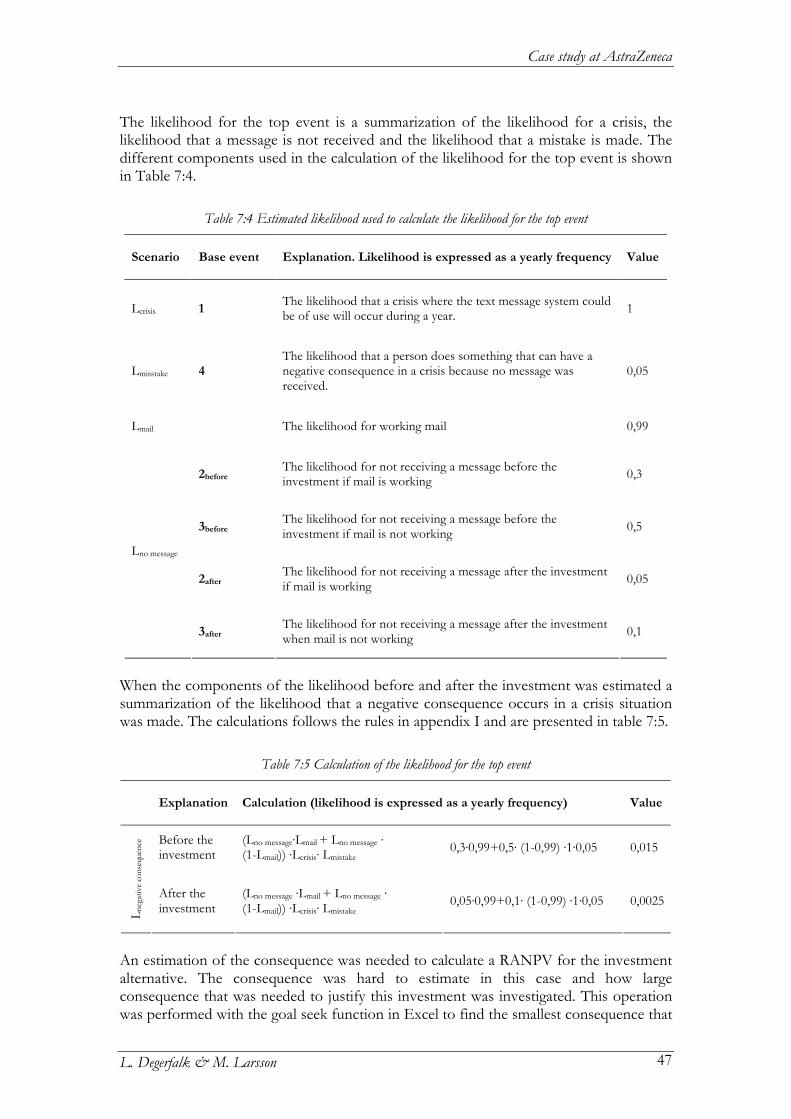
Case study at AstraZeneca
L. Degerfalk & M. Larsson 47
The likelihood for the top event is a summarization of the likelihood for a crisis, the likelihood that a message is not received and the likelihood that a mistake is made. The different components used in the calculation of the likelihood for the top event is shown in Table 7:4.
Table 7:4 Estimated likelihood used to calculate the likelihood for the top event
Scenario Base event Explanation. Likelihood is expressed as a yearly frequency Value
Lcrisis 1 The likelihood that a crisis where the text message system could be of use will occur during a year.
1
Lmisstake 4 The likelihood that a person does something that can have a negative consequence in a crisis because no message was received.
0,05
Lmail The likelihood for working mail 0,99
2before The likelihood for not receiving a message before the investment if mail is working
0,3
3before The likelihood for not receiving a message before the investment if mail is not working
0,5
2after The likelihood for not receiving a message after the investment if mail is working
0,05
Lno message
3after The likelihood for not receiving a message after the investment when mail is not working
0,1
When the components of the likelihood before and after the investment was estimated a summarization of the likelihood that a negative consequence occurs in a crisis situation was made. The calculations follows the rules in appendix I and are presented in table 7:5.
Table 7:5 Calculation of the likelihood for the top event
Explanation Calculation (likelihood is expressed as a yearly frequency) Value
Before the investment
(Lno message·Lmail + Lno message · (1-Lmail)) ·Lcrisis· Lmistake
0,3·0,99+0,5· (1-0,99) ·1·0,05 0,015
Lne
gativ
e co
nseq
uenc
e
After the investment
(Lno message ·Lmail + Lno message · (1-Lmail)) ·Lcrisis· Lmistake
0,05·0,99+0,1· (1-0,99) ·1·0,05 0,0025
An estimation of the consequence was needed to calculate a RANPV for the investment alternative. The consequence was hard to estimate in this case and how large consequence that was needed to justify this investment was investigated. This operation was performed with the goal seek function in Excel to find the smallest consequence that
How can the business benefit of Business Continuity Planning be measured?
L. Degerfalk & M. Larsson 48
give a RANPV larger than zero. The calculations were made in Excel and are presented in appendix VI.
Results and analysis
The goal seek of the consequence in Excel showed that the consequence needs to be at least 50 million SEK to justify this investment. A sensitivity analysis was performed as described in subchapter 6.2 and it showed that the smallest consequence that gave a positive RANPV was 50 million SEK. This means that to justify the investment the negative consequence needs to be at least 50 million SEK. 50 million SEK is considered to be a larger amount of money than the actual cost of the consequence in question. Therefore, the result of the RANPV calculation shows that the investment cannot be seen as profitable by just looking at the risk reduction. The investment can be justified if the decision maker can find other advantages than the risk reduction that will counterbalance the costs. As stated in subchapter 6.2 the assumption is made that people using the framework is risk neutral i.e. they want to pay the same or less than the expected value of a risky situation. If the decision maker or the organization is averse towards risks they might consider paying more than the expected value, similar to the line of argument concerning CE in subchapter 4.5. The key persons felt comfortable, in most cases, when estimating the components. The problems occurred for the components, which was not within the key person’s main area. This problem was easily solved by experts e.g. the cost of capital was estimated by a person from the finance function.
Framework analysis
L. Degerfalk & M. Larsson 49
8 Framework analysis This chapter contains analyses of requirements, difficulties, and potential of the framework. The analyses are performed with knowledge and information gathered throughout the process of creating the framework and performing the case study.
8.1 User requirements In order to use the framework in the best possible way some requirements need to be met by the user and the organization. It was stated in subchapter 6.2 that the person using the framework needs to possess knowledge about estimation of the framework components. This was confirmed during the case study when key persons were facilitated in the process of estimating the components. The key persons needed different degrees of support when estimating the components to obtain trustworthy values. If the estimations are performed without full understanding there is a possibility that the estimations turn out to be useless. The reason for this is that the results of the framework depend on good estimations of its components. It was noticed during the work with the thesis that it is hard to get people not familiar with BCP to understand how and why there could be a need for a framework like the one that has been developed. We believe that the framework cannot be initiated in an organization that does not have a positive and mature attitude to BCP and the framework. A certain level of awareness regarding safety and risk is needed to be able to use the results from the framework in an efficient way. The impression throughout the process of creating this thesis is that persons from an immature organization have a more negative attitude to working with BCP. We believe that the negative attitude is based on a lack of understanding of the advantages that work with questions similar to these will give the organization. An immature organization only sees the extra work with using the framework i.e. they disregards the advantages. This line of argument is the foundation of the requirement of a maturity level in the organization before the framework can be introduced. Another thing that was noticed is that the attitude to the framework differs depending on how familiar the persons are with BCP. Persons with longer experience and better understanding i.e. persons from a more mature organization are more positive to the framework.
8.2 Difficulties The framework was created to be usable to get people to work with the framework in as great extent as possible. However, it comes to an end how easy a framework can be made to work with and still obtain reliable results. The framework was developed to have a high degree of reliability, which makes the framework a bit complicated to work with due to difficulties in estimating some of the necessary components. A difficulty that has been pointed out throughout the creation of this thesis is that it is hard to determine weather the calculated RANPV is reliable. The result of the RANPV calculation reflects the quality of the estimations of the framework components. As mentioned in subchapter 4.4 one cannot see whether a decision is right or wrong by looking at the result. It is the process leading to the decision that is important, in this case it is the process of estimating the framework components. This is the reason why
How can the business benefit of Business Continuity Planning be measured?
L. Degerfalk & M. Larsson 50
the framework and the manual are made in a structured way where the different steps are described one by one. There is a possibility that investment alternatives, which would have had a higher positive RANPV than the investigated investment alternatives, are omitted in the BCP process. This can lead to a problem in the last step of the framework where different investment alternatives are listed after their RANPV. This can cause the decision maker to invest in an alternative that is not the most profitable one, which leads to an inefficient use of resources. This highlights the importance of not omitting any investment alternatives during the BCP process. As mentioned in subchapter 6.2 and earlier in this chapter, the user of the framework need to possess knowledge in the area of NPV calculations and be able to estimate the likelihood and consequence of scenarios. As suspected, during the case study it was detected that the staff had difficulties estimating components that are not close to their state of the art competence. This is not a major difficulty and can easily be put right with help from experts in the specific area. When estimating the framework components the economical RANPV components were estimated without a lot of difficulties, for the more common scenarios the key persons also found it easy to estimate the risk reduction components i.e. likelihood and consequence. The difficulties occurred when the likelihood was small and the consequence large. The reason for this is that small likelihood is abstract and hard to relate to. This thought is supported by Swedish Society For Risk Sciences (1991), which states that people have difficulties with estimating small likelihood. Difficulties also occurred concerning the defined system, when the system is defined all scenarios included in the system and only these scenarios should be included in the total risk scenario space. The difficulties are, not to omit scenarios that should be included and not to include scenarios outside the system. Therefore it is important that the decision maker and/or the facilitator possesses good understanding in the area in order to explain difficulties for the decision maker and make him/her stay within the systems limitation. If the decision maker and/or the facilitator fails there is a possibility that the value of the result from the analysis is limited. Another difficulty that occurred when estimating the consequence was estimation of losses in intangible assets. The persons involved in the process of this thesis have pointed out that estimating intangible assets is a difficult problem to solve. A study of literature showed the same dilemma and the conclusion was drawn that companies and organizations are not used to do these kind of estimations. One suggestion on how evaluation of intangible losses should be performed is given by Hiles (1999). This is mentioned in subchapter 4.1 where Hiles suggests that losses of intangible assets can be estimated in the opposite way that an increase of intangible assets thanks to advertisement is estimated. The estimations of these parameters could be performed but the study of literature did not show any widely used method and the question is if Hiles method can be of use. We believe that by estimating the change in intangible assets the choice of which investment alternative to invest in can be justified. If the RANPV is positive when the change in intangible assets is excluded the investment is clearly profitable. However, a negative RANPV does not have to denote a non-profitable investment, if the change in intangible assets is large enough to make the RANPV positive the investment can be profitable.
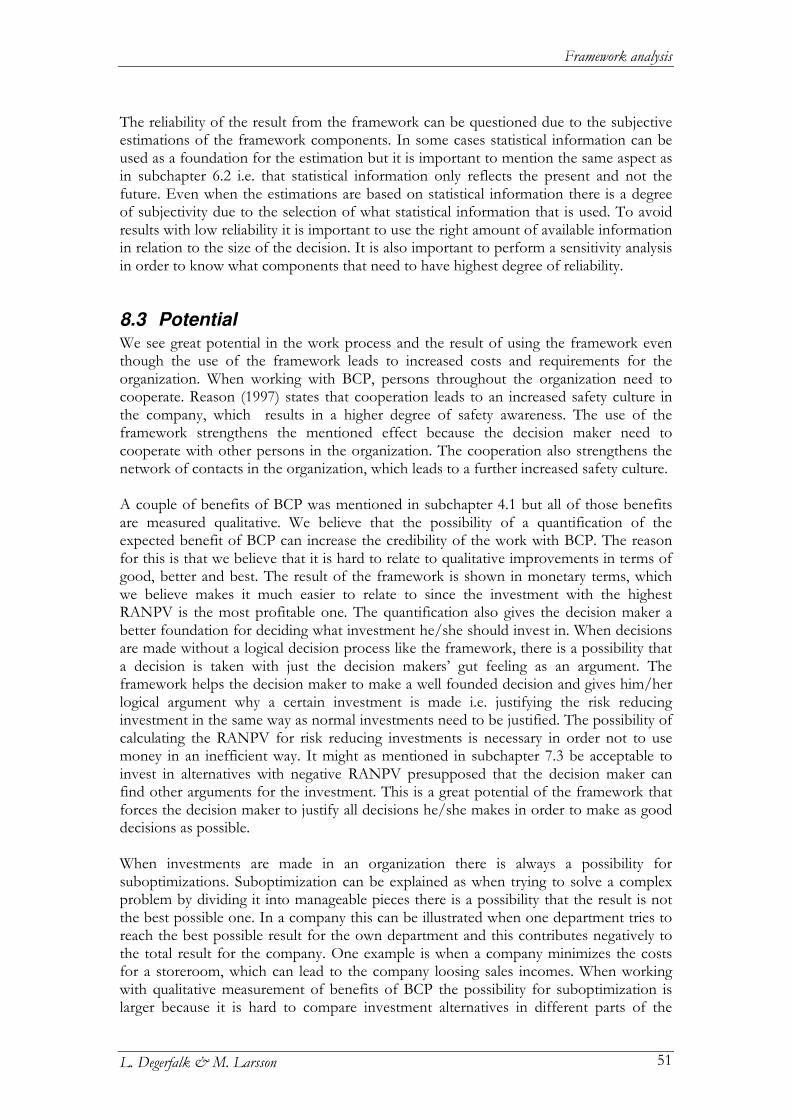
Framework analysis
L. Degerfalk & M. Larsson 51
The reliability of the result from the framework can be questioned due to the subjective estimations of the framework components. In some cases statistical information can be used as a foundation for the estimation but it is important to mention the same aspect as in subchapter 6.2 i.e. that statistical information only reflects the present and not the future. Even when the estimations are based on statistical information there is a degree of subjectivity due to the selection of what statistical information that is used. To avoid results with low reliability it is important to use the right amount of available information in relation to the size of the decision. It is also important to perform a sensitivity analysis in order to know what components that need to have highest degree of reliability.
8.3 Potential We see great potential in the work process and the result of using the framework even though the use of the framework leads to increased costs and requirements for the organization. When working with BCP, persons throughout the organization need to cooperate. Reason (1997) states that cooperation leads to an increased safety culture in the company, which results in a higher degree of safety awareness. The use of the framework strengthens the mentioned effect because the decision maker need to cooperate with other persons in the organization. The cooperation also strengthens the network of contacts in the organization, which leads to a further increased safety culture. A couple of benefits of BCP was mentioned in subchapter 4.1 but all of those benefits are measured qualitative. We believe that the possibility of a quantification of the expected benefit of BCP can increase the credibility of the work with BCP. The reason for this is that we believe that it is hard to relate to qualitative improvements in terms of good, better and best. The result of the framework is shown in monetary terms, which we believe makes it much easier to relate to since the investment with the highest RANPV is the most profitable one. The quantification also gives the decision maker a better foundation for deciding what investment he/she should invest in. When decisions are made without a logical decision process like the framework, there is a possibility that a decision is taken with just the decision makers’ gut feeling as an argument. The framework helps the decision maker to make a well founded decision and gives him/her logical argument why a certain investment is made i.e. justifying the risk reducing investment in the same way as normal investments need to be justified. The possibility of calculating the RANPV for risk reducing investments is necessary in order not to use money in an inefficient way. It might as mentioned in subchapter 7.3 be acceptable to invest in alternatives with negative RANPV presupposed that the decision maker can find other arguments for the investment. This is a great potential of the framework that forces the decision maker to justify all decisions he/she makes in order to make as good decisions as possible. When investments are made in an organization there is always a possibility for suboptimizations. Suboptimization can be explained as when trying to solve a complex problem by dividing it into manageable pieces there is a possibility that the result is not the best possible one. In a company this can be illustrated when one department tries to reach the best possible result for the own department and this contributes negatively to the total result for the company. One example is when a company minimizes the costs for a storeroom, which can lead to the company loosing sales incomes. When working with qualitative measurement of benefits of BCP the possibility for suboptimization is larger because it is hard to compare investment alternatives in different parts of the
How can the business benefit of Business Continuity Planning be measured?
L. Degerfalk & M. Larsson 52
company. The quantification leads to the possibility to control how money is used in different parts and levels in the organization i.e. decrease in suboptimization. In the early stages of working with BCP when the level of business continuity is low, the cost for a certain increase in business continuity can be small. The reason for this is that when starting up BCP in an organization it is often unproblematic to find investment alternatives that have small costs in relation to its benefit i.e. its risk reduction. When the organization has been working with BCP some time and have a higher level of business continuity it becomes more difficult to find investment alternatives with small costs and large benefits. For an organization in this position it becomes important to evaluate the different investment alternatives in order to invest in the alternative that gives the largest benefit in relation to its cost. In other words, to make sure that the money is invested in the investment alternative that maximizes the utility to the greatest extent. This line of argument is illustrated in figure 8:1.
Figure 8:1 Relation between expected loss and investments in BCP for different levels of business continuity
Investmentsin BCP
Expectedloss
Businesscontinuity
Discussion
L. Degerfalk & M. Larsson 53
9 Discussion This chapter contains a discussion about how the main question and the problems presented in subchapter 2.4 have been solved. Areas that could be further investigated are also described.
9.1 Task performance This part of the chapter aims at showing that the task is fulfilled and that the problems and the main question presented in subchapter 2.4 have been answered. The first part answers to the four problems, which the main question was divided into. The second part answers the main question and is a discussion of the framework’s validity.
Solving the problems
The first two problems in subchapter 2.4, Can any existing research or tools be of use without modification to measure the benefits of BCP? and Are there any existing general tools to measure benefit that can be of use?, was solved by performing a thorough study of literature to if possible find a tool or theory usable for measuring the benefit of BCP. This is described in a more detailed way in chapter 5 and the result of the study showed that no tool or theory that fully fitted the objective could be found. The result of the study and the answer to the third problem and its subquestions, Can the found tools be of use when developing a framework to measure the business benefit of BCP?, was that some of the ideas from the theories and tools that were identified could be used in the process of creating the framework. The ideas that were used in the development of the framework were from theory about NPV calculations, RANPV calculations, decision making and risk. A deductive way of working was chosen where the theories were combined to obtain a framework that fitted the objective i.e. measuring the benefit of BCP in monetary terms. When the third problem had been answered the fourth problem, Is the framework usable for measuring the business benefit of BCP?, needed to be investigated. Chapter 8 contains detailed answers about the framework’s difficulties and potentials. In the following parts of chapter 9 the fourth problem is discussed from a more general point of view. Since the framework is carefully developed in a deductive way it should from a theoretical point of view be a good way of measuring the benefit of BCP. The case study points at the same result as mentioned earlier where the decision maker could use the framework to measure the benefit of a certain investment alternative. It is hard to valuate if the framework is usable for a user without help from a facilitator with the same knowledge in the area as the authors. There was no possibility to examine this area because there were not enough resources to perform a case study under this condition. We believe that problems occur when the decision maker and the facilitator do not posses enough knowledge in the areas, which was mentioned as requirements in subchapter 6.2. As earlier mentioned the reason for this is that the result of the use of the framework depends on these estimations. A framework for measuring the benefit of BCP that would be functional for a user without knowledge in the area would not be usable in reality. The reason for this is the lack of reliable result a framework like that would result in. If the framework had been created for people with no or little knowledge in the areas described in subchapter 6.2 the framework manual would need to be very detailed. The reason for this is described in subchapter 6.2, a person need to posses
How can the business benefit of Business Continuity Planning be measured?
L. Degerfalk & M. Larsson 54
knowledge in the described areas to make good estimations or facilitate a key person in the process of estimating the components. A framework manual for people with not enough knowledge in this areas would need to comprise basic information about all the areas described in the theory chapter. We believe that a framework manual like that would not be usable due to the large amount of information it would need to contain. After a thorough search of information about investment calculation for risk reducing investments our opinion is that the area is not fully explored. We do not know why this is the case but we have a feeling that the reason is that BCP is a fairly new area and has not received the same attention as normal investments. Traditionally normal investments need to be justified by NPV calculations and we predict that in the future the same will happen with larger investments in BCP. It is hard to say anything general about the framework’s usability because the case study is only performed at one company, AstraZeneca. To draw general conclusions about the usability case studies at other organizations, which also are working with BCP, would need to be performed. The framework on the other hand is general due to the use of accepted theories, which have been used in a deductive way in the process of developing the framework. During the development process the framework have been discussed with experts outside AstraZeneca, Henrik Johansson and Jonas Roosberg, which we believe have made the framework more general.
Main question
The four problems were used to develop a framework that would fulfil the requirements. This part of chapter 9 is used to discuss the main question, How can the business benefit of BCP be measured? As mentioned throughout this thesis the framework was developed to measure the business benefit of one investment alternative. The reason for this approach was to make the framework applicable in real life situations. In chapter 5 and 6 it is showed in a logical and theoretical way that the framework can be used to fulfil the objective of the thesis. The case study in chapter 7 showed that the framework was usable for measuring the business benefit of an investment alternative in a real life situation. By looking at the total work with BCP as the investment alternative the benefit of it can be measured in the same way as a specific investment alternative from the BCP process i.e. by calculating the RANPV. When using the framework to measure the business benefit in an organization it is a problem that the framework components get harder to estimate the bigger and more complex the organization is. This is not seen as a major weakness because the only reason to measure the total business benefit of BCP in a large organization would be to investigate if BCP is profitable. This would only be an end in itself since it cannot be used for anything other than to pat oneself on the back. We believe that the framework’s potential in the smaller organization and for single investment alternatives exceeds the difficulties in the large organization. The main argument for this is that the framework can be used in the smaller organization or in a part of a larger organization to optimise decisions and help the decision maker in a decision process.
9.2 Future studies During the process of creating this thesis and the framework a couple of areas have been detected which we believe need to be further examined. In this part of chapter 9 we will treat some areas and explain why we think it would be interesting to examine them more.
Discussion
L. Degerfalk & M. Larsson 55
A weakness of the framework is the degree of generalization, which was described earlier in this chapter. To draw more general conclusions about the framework it would be necessary to perform a study that aims at making case studies similar to the one that was performed at AstraZeneca on other companies that are working with BCP. Depending on the extent of a study other pharmaceutical companies and/or companies in other business areas would be investigated. The more business areas that are investigated, the more general conclusions can be drawn about the framework’s generalization. The framework is developed with the aim to be usable in any organization and not only at AstraZeneca. Presupposed that AstraZeneca or some other company decide to use the framework in the future it is of great interest to investigate the framework’s usability, the reliability of the results and people’s attitude to the framework. An investigation as the one proposed could be interesting in order to develop the framework to be more usable and reliable. It is hard to give a statement about the framework’s usability for users without the same background as the authors. It could be of interest to perform studies that aims at investigating the framework’s usability for other users than the staff at AstraZeneca with support from the authors of this thesis. The same study could also aim at improving the framework’s possible weaknesses in usability. To get an understanding of the frameworks ability to minimize the spread of the results of an investment valuation, the following study is suggested. First a number of persons valuates the same investment without the framework, the results and the spread of the results are observed. The next step is to let the same persons valuate the investment alternative using the framework. The results from the two valuations as well as the spread of the results is compared to investigate if using the framework decreases the spread of the results. One of the largest problems that was found during the case study was estimating losses in intangible assets. This is one part of the consequence, which needs to be estimated to calculate the risk reduction. No literature were found that treated this area in a way that could help a key person in the process of estimating the losses in intangible assets. We think the area need to be further examined and that there is a need for a model that describes how to evaluate expected losses in intangible assets in a structural way.

How can the business benefit of Business Continuity Planning be measured?
L. Degerfalk & M. Larsson 56
Conclusions
L. Degerfalk & M. Larsson 57
10 Conclusions The main question of this thesis is: How can the business benefit of Business Continuity Planning be measured? The business benefit of Business Continuity Planning (BCP) can be measured by calculating a Risk Adjusted Net Present Value (RANPV) for a risk reducing investment by using the framework, which has been developed and presented in this thesis. The framework for measuring the business benefit of BCP is developed in a deductive way where accepted theories have been carefully chosen and combined. This means that the developed framework should be theoretically accepted thanks to the process from which it has been developed. The case study where the framework was used to facilitate decision makers in the process of investigating the profitability for two risk reducing investment alternatives at AstraZeneca showed that the framework was practically usable, which was one of the three expressed requirements of this thesis’ objective. The second requirement was that the measurement of the business benefit should be in monetary terms and the case study showed that this requirement was met. The third requirement, which was to develop a general framework, was not showed during the case study. This requirement was considered throughout the process of creating the framework and regarded by using general theories in a deductive way and not only information that was received from AstraZeneca. To ensure that the framework turned out general, discussions have been held with experts outside AstraZeneca. In order to use the framework in the best possible way some requirements need to be met by the user. The user needs to posses knowledge about risk, investment valuation, uncertainty and, how to estimate the framework components. The reason for this is that the degree of reliability in the RANPV’s result is dependent on the users knowledge in the mentioned areas as well as the quality of the users’ estimations of the risk and investment valuation components. This was a difficulty discovered through the process of creating the framework and performing the case study. Another difficulty with the framework is that it is hard to say anything about the calculated RANPV’s trustworthiness just looking at the single number. Therefore, it is important that each step of the framework is carefully performed and justified to create a logical decision process. Even though the framework contains difficulties the framework’s potential is predominating. One advantage with using the framework is that the estimation of the components forces people to cooperate throughout the company, which increases the company’s degree of safety awareness and its ability to cope with new situation thanks to the strengthening of networks. The framework also decreases the possibility for suboptimization in an organization since the RANPV highlights the profitability of risk reducing investments and makes it possible to compare them. The framework helps the decision maker to follow a logical decision procedure and make a well founded decision. In other words, it gives him/her a logical argument why a certain investment is made i.e. justifying the risk reducing investment in the same way as normal investments needs to be justified. Last but not least, the framework also helps people working with BCP to increase the creditability of the BCP process thanks to the possibility to show it is profitable. As described in this chapter, the framework was usable for measuring the business benefit of an investment alternative in a real life situation. By looking at the total work

How can the business benefit of Business Continuity Planning be measured?
L. Degerfalk & M. Larsson 58
with BCP as the investment alternative the benefit of it can be measured in the same way as a specific investment alternative from the BCP process i.e. by calculating the RANPV. When using the framework to measure the business benefit of BCP in an organization it gets more difficult to estimate the framework components the bigger and more complex the investment alternative is. This is not seen as a major weakness because the only reason to measure the total business benefit of BCP in a large organization would be to investigate if BCP is profitable. We believe that the developed framework has the greatest potential when it is used to valuate single investment alternatives and the aim is to make sure that the chosen investment alternative is the most profitable one. Last but not least, we would like to point out that we think that the framework should be used since the use is followed by many benefits, which we have pointed out in this thesis. We predict that in the future, larger risk reducing investments will need to be justified in the same way as normal investments. It is our opinion that the developed framework can be used to justify a risk reducing investment by calculating its RANPV with the five step work process described in this thesis.
References
L. Degerfalk & M. Larsson 59
11 References
Books and reports Abrahamsson, M., Magnusson, S.E. (2004). Risk- och sårbarhetsanalyser – utgångspunkter för fortsatt arbete. Stockholm: Krisberedskapsmyndigheten. Backman, J. (1998). Rapporter och uppsatser. Lund: Studentlitteratur Elliot, D., Swartz, E., Herbane, B. (2002). Business Continuity Management, a crisis management approach. London: Routledge. Hiles, A. (1999). The Definitive Handbook of Business Continuity Management. Chichester, England: John Wiley & sons Ltd. Howard, R. A. (1992). In Praise of the Old Time Religion, Utility theories: Measurements and applications. (ed.) Edwards, W. Kluwer Academic Publisher, Boston. Johansson, H. (2003). Decision Analysis in Fire Safety Engineering – Analysing Investments in Fire Safety. Lund: Department of Fire Safety Engineering, Lund University. Johansson, H., Jönsson, H. (2007). Metoder för risk- och sårbarhetsanalys från ett systemperspektiv. Lund: Department of Fire Safety Engineering, Lund University. Kammen, D.M., Hassenzahl, D.M. (1999). Should we risk it? New Jersey: Princeton University Press. Knight, R.F., Pretty, D.J. (1996). The impacts of catastrophes on shareholder value. Oxford, England: University of Oxford. Mattsson, B. (2000). Riskhantering vid skydd mot olyckor – problemlösning och beslutsfattande. Karlstad: Räddningsverket. Mattsson, B. (2004). Kostnads- nyttoanalys, värdegrunder, användbarhet, användning. Karlstad: Räddningsverket. Morgan, M.G., Henrion, M. (1990). Uncertainty: A Guide to Dealing with Uncertainty in Quantitative Risk and Policy Analysis. Cambridge, U.K.: Cambridge University Press. Nilsson, J. (2003). Introduktion till riskanalysmetoder. Lund: Department of Fire Safety Engineering, Lund University. Persson, I., Nilsson, S.Å. (2001). Investeringsbedömning. Helsingborg: Liber Ekonomi. Reason, J. (1997). Managing the risks of organizational accidents. Aldershot: Ashgate Publishing Ltd. Sheffi, Y. (2005). The Resilient Enterprise - Overcoming Vulnerability for Competitive Advantage. Cambridge: MIT Press.
How can the business benefit of Business Continuity Planning be measured?
L. Degerfalk & M. Larsson 60
Swedish Society For Risk Sciences (1991). Skrift nr 1: Att jämföra risker – Information och rekommendationer från Riskkollegiet. Stockholm: Riskkollegiet. Yin, R.K. (2003). Case study research -design and methods. Thousand Oaks, California: Sage Publications.
Articles Aven, T., Kørte, J. (2003). On the use of risk and decision analysis to support decision-making. Reliability Engineering and System Safety, 79, p. 289–299. Cecich, T. F. (2005). Where’s my return: Many Safety Investments Won’t Show Financial Gain. Industrial Safety & Hygiene News, 39, (9), p. 38-40. Coffin, B. and Kotheimer, C. J. (2003). How to Justify Business Continuity Management, Risk Management, 50, p.30-34. Gallagher, M. (April 2005). The Road to Effective business continuity management. Accountancy Ireland, 37, 66-68. Garrick, J. B., Haimes,Y. Y. and Kaplan, S. (2001) Fitting Hierarchical Holographic Modelling into the Theory of Scenario Structuring and a Resulting Refinement to the Quantitative Definition of Risk. Risk Analysis, 21, (5) p. 807-819. Hicks, J.R., (1939). The Foundation of Welfare Economics. The Economic Journal, 49, (196), p. 696-712. Howard, R. A. (1980). An assessment of decision analysis. Operations Research, 28, (1), p. 4-27. Howard, R. A. (1988). Decision Analysis: Practice and promise. Management Science, 34, (6), p. 679-695. Howard, T. (1984). Strategic decision analysis: Applied decision analysis and its role in the strategic management process. Strategic Management Journal, 5, (2), p. 139-156. IEC 300-3-9.International standard, Dependability management. Geneve: International Electrotechnical Commission, first edition, 1195-12. Kahneman, D., Tversky, A. (1979). Prospect Theory: An Analysis of Decision under Risk. Econometrica, 47, (2), p. 263-291. Kaldor, N., Welfare Propositions of Economics and Interpersonal Comparisons of Utility. The Economic Journal, 49, (195), p. 549-552. Kaplan, S. (1997). The words of risk analysis. Risk Analysis, 17, (4), p. 407-417. Kaplan, S., Garrick, B. J. (1980). On the Quantitative Definition of Risk. Risk Analysis, 1, (1), p. 11-27. Krackhardt, D., Stern, R.N. (1988). Informal networks and organizational crises: An experimental simulation. Social Psychology Quarterly, 51, (2), 123-140.
References
L. Degerfalk & M. Larsson 61
Krell, E. (Dec2005/jan2006). Business continuity: creating a framework for success. CMA management, 79, p. 30-33. Myers, R. (1996). Getting a Grip On Intangibles, CFO, 12, (9), p. 49-54. Renn, O. (1998). The role of risk perception for risk management. Reliability Engineering and System Safety, 59, p. 49-62.
Web based references AstraZeneca global website, About us, http://www.astrazeneca.com/article/11148.aspx, (2006-08-23, 10:10). AstraZeneca Swedish website, Om oss, http://www.astrazeneca.se/OmOss/Om-oss.aspx?mid=71, (2006-08-23, 10:10). Glossary of Research Economics, http://econterms.com, (2006-11-01, 14:40). The Business Continuity Institute, Standards, Good Practice Guidelines (Version.1 17 june 2005), http://www.thebci.org/gpgdownloadpage.htmGood practice guidelines, (2006-08-02, 14:20). Telelogic FOCAL POINT™ Version 5.3 SP2, ( 2006-11-06). The Quick Reference Archive of Business Related Law, Sarbanes-Oxley, http://www.legalarchiver.org/soa.htm, (2006-10-10, 14:30). WordNet - a lexical database for the English language, Use WordNet online, http://wordnet.princeton.edu/perl/webwn, (2006-10-12, 15:50).
Experts involved in this thesis Experts from the BCP Team at AstraZeneca: • Pierre Wettergren, Manager of the BCP Team and BCP Programme • Mona Holmström, BCM Model Manager and BCM Agent • Annica Lembäck, BCM Agent in Clinical Development • Oskar Söderström, BCM Implementation and BCM Agent • Birger Johansson, BCM Knowledge Manager and BCM Agent Experts from AstraZeneca: • Per Persson, Site Manager at AstraZeneca Lund • Ulf Lindmark, IT Services at AstraZeneca Lund • Dan Sellberg, Finance at AstraZeneca Lund • Anders Wikström, Telecom Services Sweden at AstraZeneca Mölndal Experts outside AstraZeneca: • Henrik Johansson, Senior Lecturer at The Department of Fire Safety Engineering,
Lund Institute of Technology • Jonas Roosberg, Risk Consultant at Willis

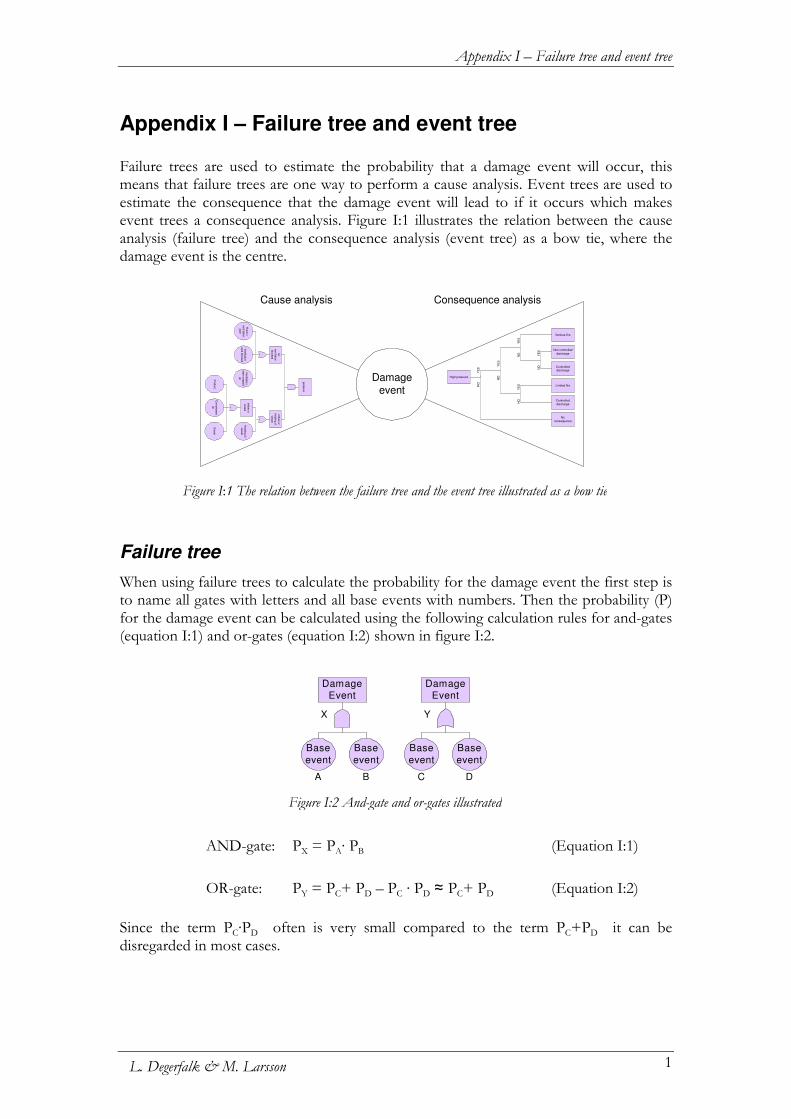
Appendix I – Failure tree and event tree
1 L. Degerfalk & M. Larsson
Appendix I – Failure tree and event tree Failure trees are used to estimate the probability that a damage event will occur, this means that failure trees are one way to perform a cause analysis. Event trees are used to estimate the consequence that the damage event will lead to if it occurs which makes event trees a consequence analysis. Figure I:1 illustrates the relation between the cause analysis (failure tree) and the consequence analysis (event tree) as a bow tie, where the damage event is the centre.
Failure tree
When using failure trees to calculate the probability for the damage event the first step is to name all gates with letters and all base events with numbers. Then the probability (P) for the damage event can be calculated using the following calculation rules for and-gates (equation I:1) and or-gates (equation I:2) shown in figure I:2.
AND-gate: PX = PA· PB (Equation I:1)
OR-gate: PY = PC+ PD – PC · PD ≈ PC+ PD (Equation I:2)
Since the term PC·PD often is very small compared to the term PC+PD it can be disregarded in most cases.
Damageevent
Cause analysis Consequence analysis
High pressure
Serious fire
Non controlled
discharge
Controlleddischarge
Limited fire
Controlled
discharge
No
consequence
YE
SN
O
YE
SN
O
YE
SN
O
YE
SN
O
YE
SN
O
pre
ssure
Pro
duct
Air
ventila
tion
blo
cked
Inflo
w o
r
heatin
g o
f
vesse
l
Inflo
w to
vesse
l
Ste
am
Com
pre
ssed
air
Heatin
g o
f
vesse
l
Flu
id in
ventila
tion
pip
e
Ventila
tion
pip
e sto
pped
up
Ventila
tion
tank b
locke
d
Figure I:1 The relation between the failure tree and the event tree illustrated as a bow tie
DamageEvent
X
Base
event
A B
DamageEvent
Y
C D
Base
event
Base
event
Base
event
Figure I:2 And-gate and or-gates illustrated
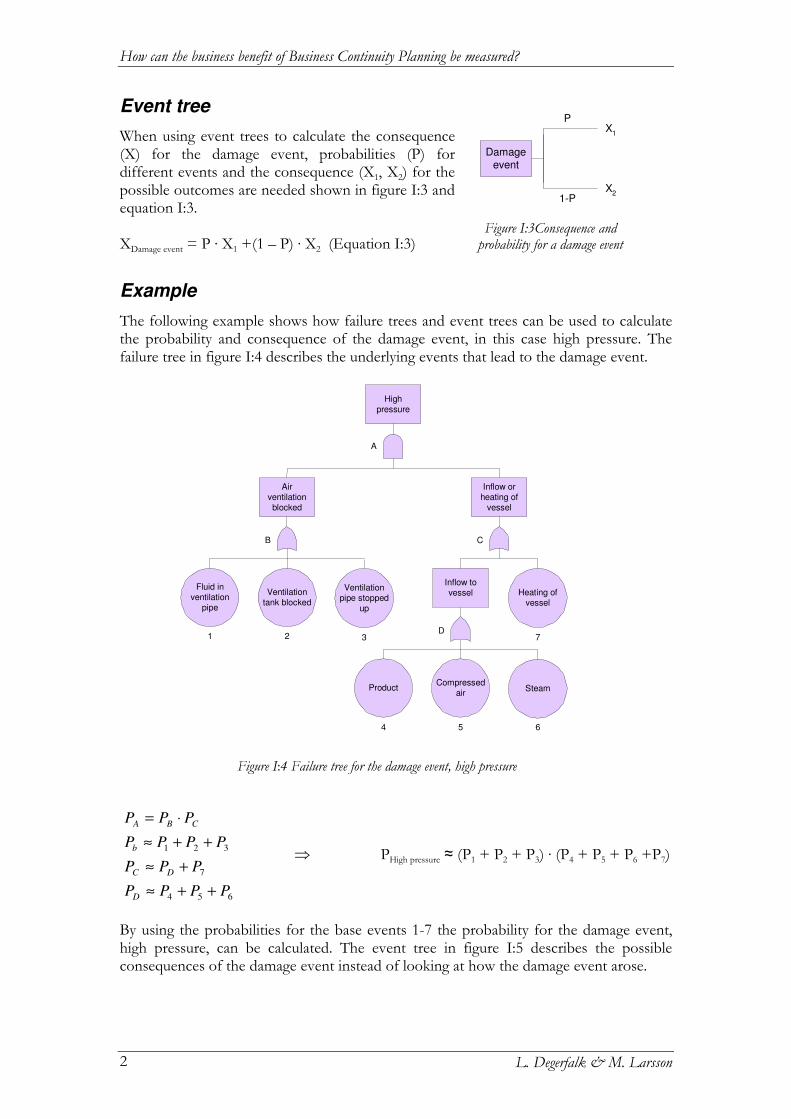
How can the business benefit of Business Continuity Planning be measured?
L. Degerfalk & M. Larsson 2
Event tree
When using event trees to calculate the consequence (X) for the damage event, probabilities (P) for different events and the consequence (X1, X2) for the possible outcomes are needed shown in figure I:3 and equation I:3. XDamage event = P · X1 +(1 – P) · X2 (Equation I:3)
Example
The following example shows how failure trees and event trees can be used to calculate the probability and consequence of the damage event, in this case high pressure. The failure tree in figure I:4 describes the underlying events that lead to the damage event.
654
7
321
PPPP
PPP
PPPP
PPP
D
DC
b
CBA
++≈
+≈
++≈
⋅=
⇒ PHigh pressure ≈ (P1 + P2 + P3) · (P4 + P5 + P6 +P7)
By using the probabilities for the base events 1-7 the probability for the damage event, high pressure, can be calculated. The event tree in figure I:5 describes the possible consequences of the damage event instead of looking at how the damage event arose.
Highpressure
Product
Airventilationblocked
Inflow orheating of
vessel
Inflow tovessel
SteamCompressed
air
Heating ofvessel
Fluid inventilation
pipe
Ventilationpipe stopped
up
Ventilationtank blocked
A
B C
D1 2 3
4 5 6
7
Figure I:4 Failure tree for the damage event, high pressure
Damageevent
P
1-P
X1
X2
Figure I:3Consequence and probability for a damage event
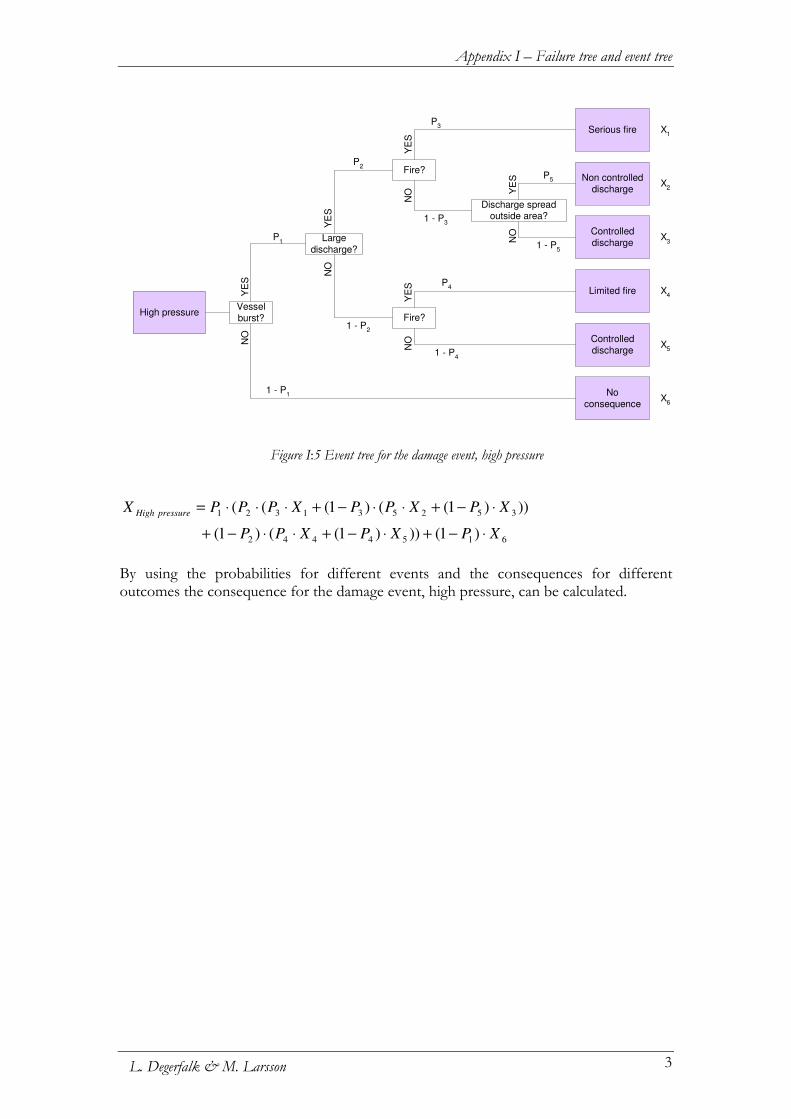
Appendix I – Failure tree and event tree
3 L. Degerfalk & M. Larsson
6154442
352531321
)1()))1(()1(
)))1(()1(((
XPXPXPP
XPXPPXPPPX pressureHigh
⋅−+⋅−+⋅⋅−+
⋅−+⋅⋅−+⋅⋅⋅=
By using the probabilities for different events and the consequences for different outcomes the consequence for the damage event, high pressure, can be calculated.
Figure I:5 Event tree for the damage event, high pressure
High pressureVesselburst?
Largedischarge?
Fire?
Serious fire
Non controlleddischarge
Controlleddischarge
Limited fire
Controlleddischarge
Noconsequence
YE
SN
OP
1
P2
P3
P4
X1
X2
X3
X4
X5
X6
1 - P1
1 - P2
1 - P3
1 - P4
P5
1 - P5
YE
SN
OFire?
YE
SN
OY
ES
NO
Discharge spreadoutside area?
YE
SN
O

How can the business benefit of Business Continuity Planning be measured?
L. Degerfalk & M. Larsson 4
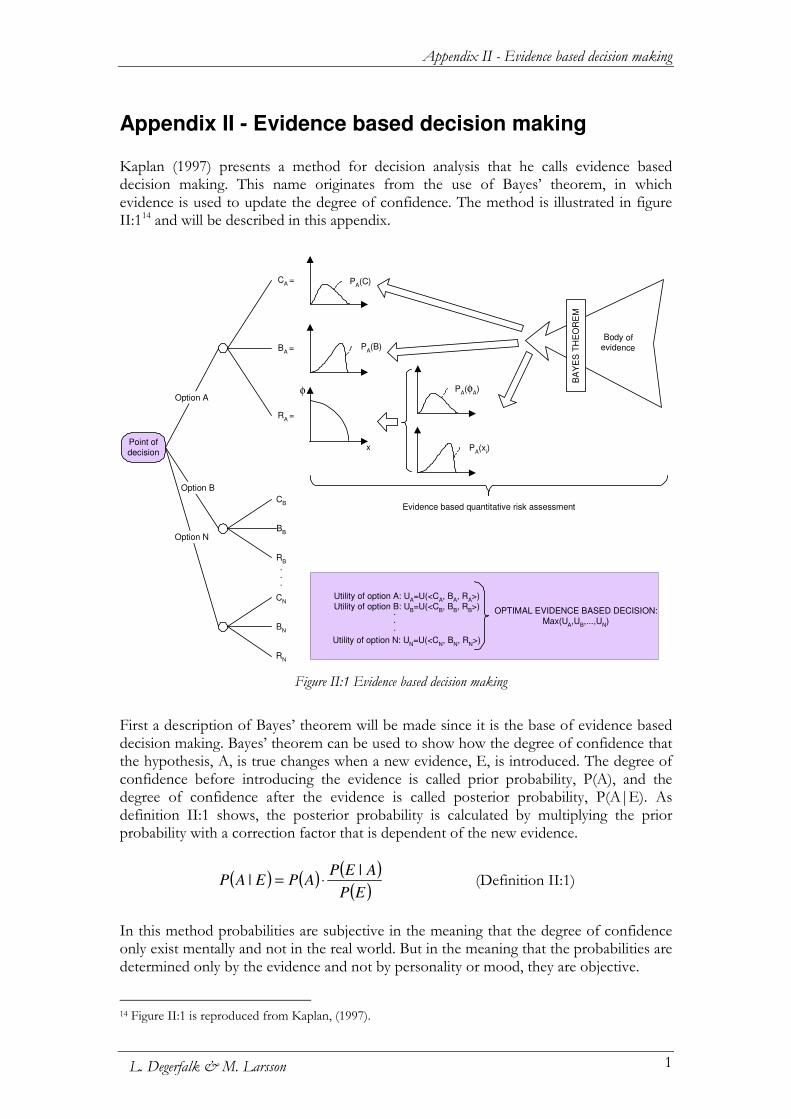
Appendix II - Evidence based decision making
1 L. Degerfalk & M. Larsson
Appendix II - Evidence based decision making Kaplan (1997) presents a method for decision analysis that he calls evidence based decision making. This name originates from the use of Bayes’ theorem, in which evidence is used to update the degree of confidence. The method is illustrated in figure II:114 and will be described in this appendix.
Option A
CA
=
RA
=
BA
=
Option B
CB
RB
BB
Option N
CN
RN
BN
.
.
.
PA(C)
PA(B)
Body of evidence
BA
YE
S T
HE
OR
EM
Evidence based quantitative risk assessment
Point ofdecision
Utility of option A: UA=U(<C
A, B
A, R
A>)
Utility of option B: UB=U(<C
B, B
B, R
B>)
.
.
.
Utility of option N: UN=U(<C
N, B
N, R
N>)
OPTIMAL EVIDENCE BASED DECISION:Max(U
A,U
B,...,U
N)
PA(φ
A)
PA(x
i)x
φ
First a description of Bayes’ theorem will be made since it is the base of evidence based decision making. Bayes’ theorem can be used to show how the degree of confidence that the hypothesis, A, is true changes when a new evidence, E, is introduced. The degree of confidence before introducing the evidence is called prior probability, P(A), and the degree of confidence after the evidence is called posterior probability, P(A|E). As definition II:1 shows, the posterior probability is calculated by multiplying the prior probability with a correction factor that is dependent of the new evidence.
( ) ( )( )
( )EP
AEPAPEAP
|| ⋅= (Definition II:1)
In this method probabilities are subjective in the meaning that the degree of confidence only exist mentally and not in the real world. But in the meaning that the probabilities are determined only by the evidence and not by personality or mood, they are objective.
14 Figure II:1 is reproduced from Kaplan, (1997).
Figure II:1 Evidence based decision making

How can the business benefit of Business Continuity Planning be measured?
L. Degerfalk & M. Larsson 2
At the point of decision the decision maker has to choose between a number of options, each option characterized by its costs (C), benefits (B) and risks (R). The costs, benefits and risks are quantified as probability curves. Kaplan states that “Probability curves are the language of uncertainty. Since the truth is, we always have uncertainty, we say that speaking in probability curves is telling the truth” (p. 412) The probability curves are calculated with the help of evidence based quantitative risk assessment (QRA). In this type of QRA the evidence is processed, one by one, through Bayes’ theorem and in this way the probability curves are generated. The curves will be very wide in the beginning and as new evidence is added they will home in on the “right” value. When the decision maker decide on which option to invest in based on these curves it is an evidence based decision.
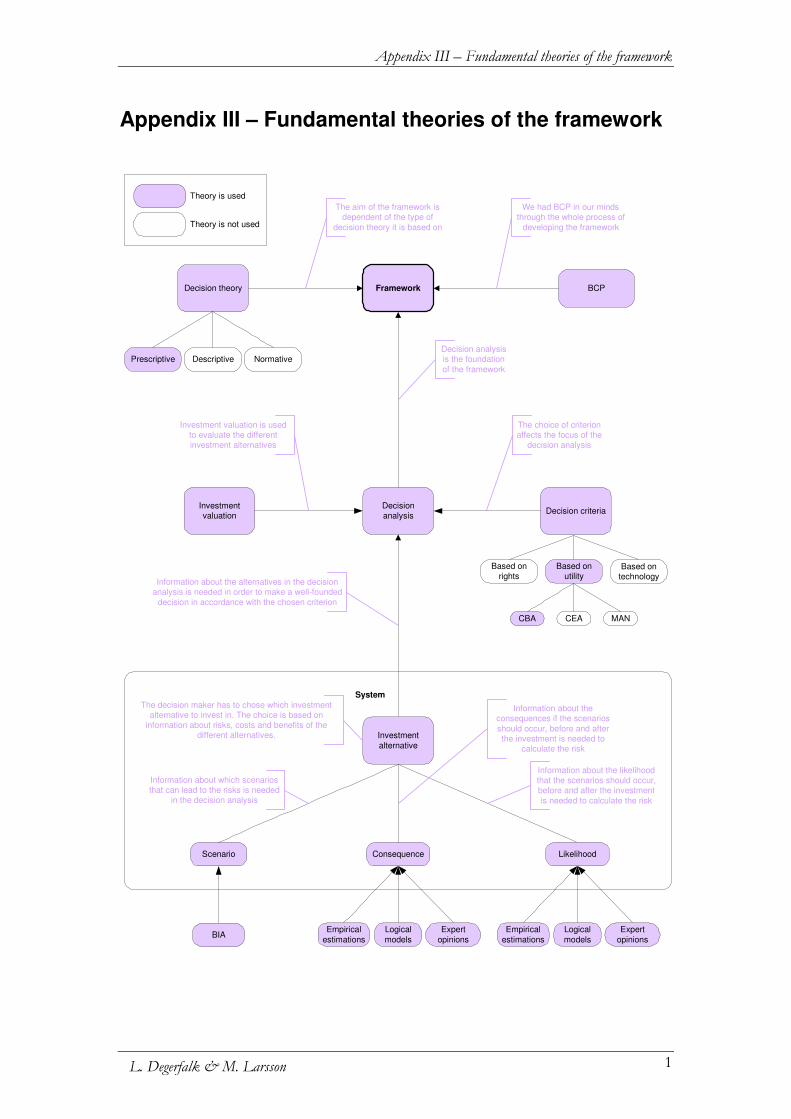
Appendix III – Fundamental theories of the framework
1 L. Degerfalk & M. Larsson
Appendix III – Fundamental theories of the framework
System
FrameworkDecision theory
Decision criteriaDecisionanalysis
NormativeDescriptivePrescriptive
Based onutility
Based onrights
Based ontechnology
CBA CEA MAN
Investment
alternative
Scenario Consequence
Empirical
estimations
Logical
models
Expert
opinions
BCP
BIA
Likelihood
Empirical
estimations
Logical
models
Expert
opinions
The aim of the framework isdependent of the type of
decision theory it is based on
We had BCP in our mindsthrough the whole process of
developing the framework
Decision analysisis the foundation
of the framework
The choice of criterionaffects the focus of the
decision analysis
Information about the alternatives in the decisionanalysis is needed in order to make a well-founded
decision in accordance with the chosen criterion
The decision maker has to chose which investmentalternative to invest in. The choice is based on
information about risks, costs and benefits of thedifferent alternatives.
Investmentvaluation
Information about which scenariosthat can lead to the risks is needed
in the decision analysis
Information about theconsequences if the scenarios
should occur, before and afterthe investment is needed to
calculate the risk
Information about the likelihoodthat the scenarios should occur,before and after the investment
is needed to calculate the risk
Investment valuation is usedto evaluate the differentinvestment alternatives
Theory is used
Theory is not used

How can the business benefit of Business Continuity Planning be measured?
L. Degerfalk & M. Larsson 2
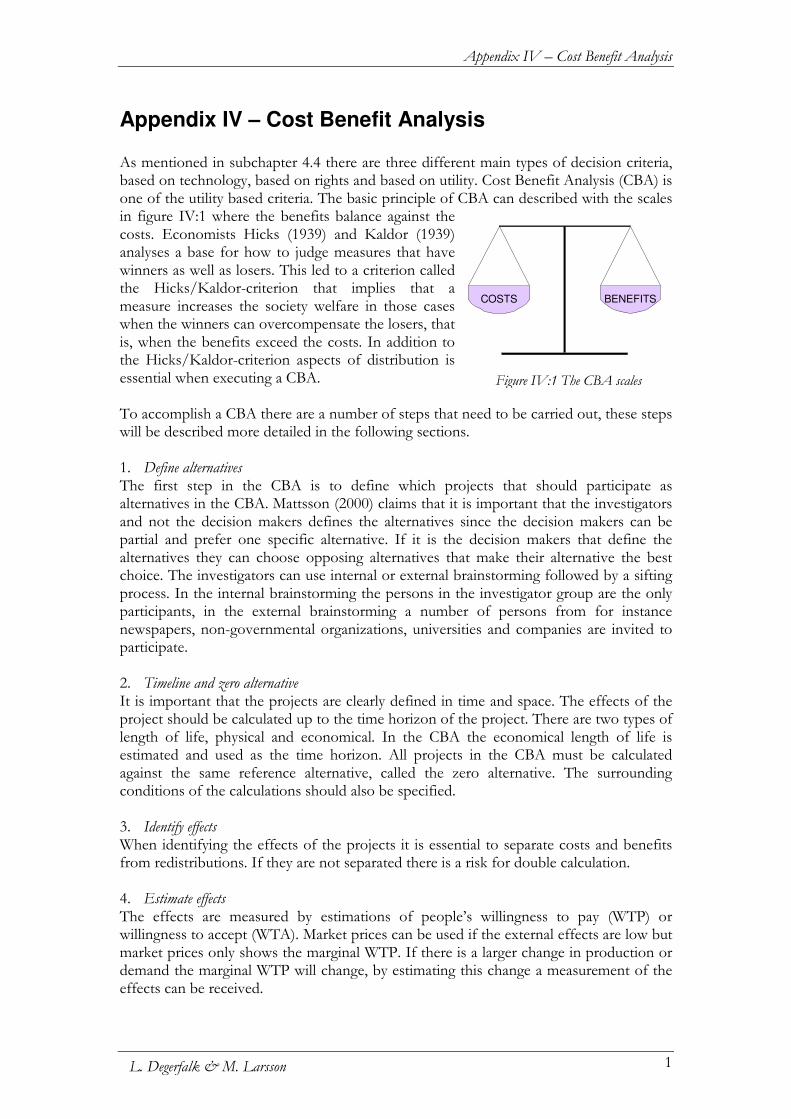
Appendix IV – Cost Benefit Analysis
1 L. Degerfalk & M. Larsson
Appendix IV – Cost Benefit Analysis As mentioned in subchapter 4.4 there are three different main types of decision criteria, based on technology, based on rights and based on utility. Cost Benefit Analysis (CBA) is one of the utility based criteria. The basic principle of CBA can described with the scales in figure IV:1 where the benefits balance against the costs. Economists Hicks (1939) and Kaldor (1939) analyses a base for how to judge measures that have winners as well as losers. This led to a criterion called the Hicks/Kaldor-criterion that implies that a measure increases the society welfare in those cases when the winners can overcompensate the losers, that is, when the benefits exceed the costs. In addition to the Hicks/Kaldor-criterion aspects of distribution is essential when executing a CBA. To accomplish a CBA there are a number of steps that need to be carried out, these steps will be described more detailed in the following sections. 1. Define alternatives The first step in the CBA is to define which projects that should participate as alternatives in the CBA. Mattsson (2000) claims that it is important that the investigators and not the decision makers defines the alternatives since the decision makers can be partial and prefer one specific alternative. If it is the decision makers that define the alternatives they can choose opposing alternatives that make their alternative the best choice. The investigators can use internal or external brainstorming followed by a sifting process. In the internal brainstorming the persons in the investigator group are the only participants, in the external brainstorming a number of persons from for instance newspapers, non-governmental organizations, universities and companies are invited to participate. 2. Timeline and zero alternative It is important that the projects are clearly defined in time and space. The effects of the project should be calculated up to the time horizon of the project. There are two types of length of life, physical and economical. In the CBA the economical length of life is estimated and used as the time horizon. All projects in the CBA must be calculated against the same reference alternative, called the zero alternative. The surrounding conditions of the calculations should also be specified. 3. Identify effects When identifying the effects of the projects it is essential to separate costs and benefits from redistributions. If they are not separated there is a risk for double calculation. 4. Estimate effects The effects are measured by estimations of people’s willingness to pay (WTP) or willingness to accept (WTA). Market prices can be used if the external effects are low but market prices only shows the marginal WTP. If there is a larger change in production or demand the marginal WTP will change, by estimating this change a measurement of the effects can be received.
Figure IV:1 The CBA scales
COSTS BENEFITS
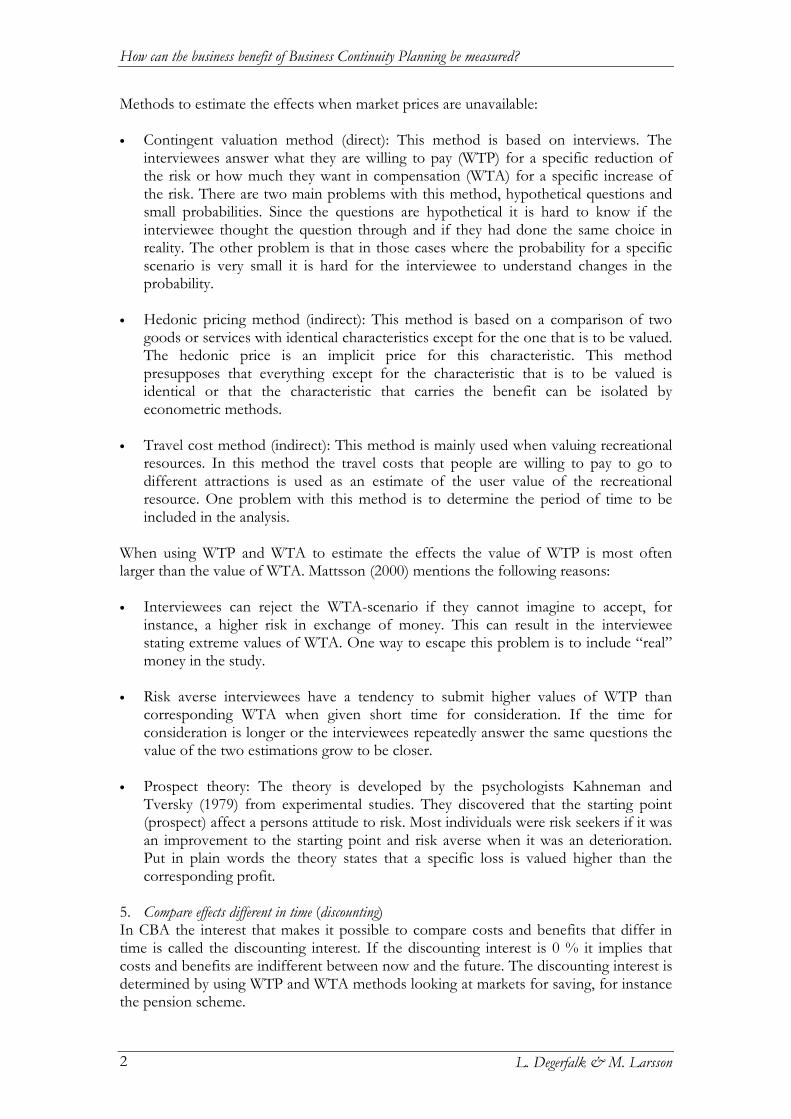
How can the business benefit of Business Continuity Planning be measured?
L. Degerfalk & M. Larsson 2
Methods to estimate the effects when market prices are unavailable: • Contingent valuation method (direct): This method is based on interviews. The
interviewees answer what they are willing to pay (WTP) for a specific reduction of the risk or how much they want in compensation (WTA) for a specific increase of the risk. There are two main problems with this method, hypothetical questions and small probabilities. Since the questions are hypothetical it is hard to know if the interviewee thought the question through and if they had done the same choice in reality. The other problem is that in those cases where the probability for a specific scenario is very small it is hard for the interviewee to understand changes in the probability.
• Hedonic pricing method (indirect): This method is based on a comparison of two
goods or services with identical characteristics except for the one that is to be valued. The hedonic price is an implicit price for this characteristic. This method presupposes that everything except for the characteristic that is to be valued is identical or that the characteristic that carries the benefit can be isolated by econometric methods.
• Travel cost method (indirect): This method is mainly used when valuing recreational
resources. In this method the travel costs that people are willing to pay to go to different attractions is used as an estimate of the user value of the recreational resource. One problem with this method is to determine the period of time to be included in the analysis.
When using WTP and WTA to estimate the effects the value of WTP is most often larger than the value of WTA. Mattsson (2000) mentions the following reasons: • Interviewees can reject the WTA-scenario if they cannot imagine to accept, for
instance, a higher risk in exchange of money. This can result in the interviewee stating extreme values of WTA. One way to escape this problem is to include “real” money in the study.
• Risk averse interviewees have a tendency to submit higher values of WTP than
corresponding WTA when given short time for consideration. If the time for consideration is longer or the interviewees repeatedly answer the same questions the value of the two estimations grow to be closer.
• Prospect theory: The theory is developed by the psychologists Kahneman and
Tversky (1979) from experimental studies. They discovered that the starting point (prospect) affect a persons attitude to risk. Most individuals were risk seekers if it was an improvement to the starting point and risk averse when it was an deterioration. Put in plain words the theory states that a specific loss is valued higher than the corresponding profit.
5. Compare effects different in time (discounting) In CBA the interest that makes it possible to compare costs and benefits that differ in time is called the discounting interest. If the discounting interest is 0 % it implies that costs and benefits are indifferent between now and the future. The discounting interest is determined by using WTP and WTA methods looking at markets for saving, for instance the pension scheme.
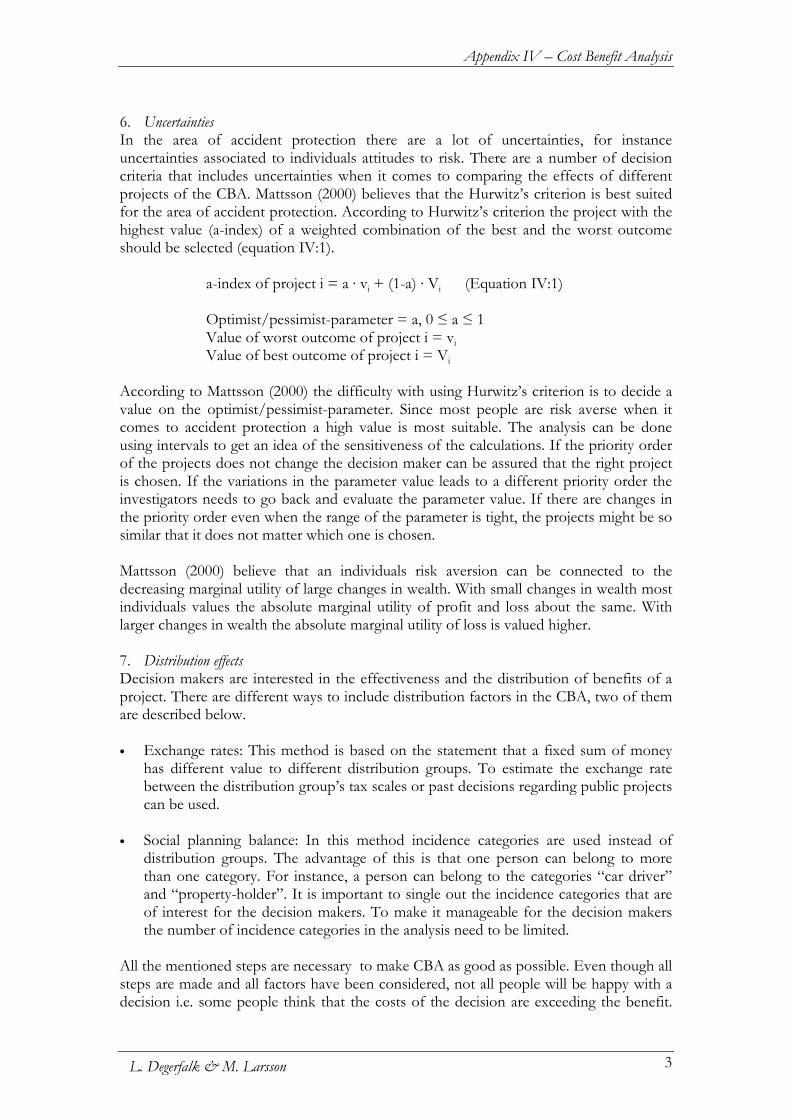
Appendix IV – Cost Benefit Analysis
3 L. Degerfalk & M. Larsson
6. Uncertainties In the area of accident protection there are a lot of uncertainties, for instance uncertainties associated to individuals attitudes to risk. There are a number of decision criteria that includes uncertainties when it comes to comparing the effects of different projects of the CBA. Mattsson (2000) believes that the Hurwitz’s criterion is best suited for the area of accident protection. According to Hurwitz’s criterion the project with the highest value (a-index) of a weighted combination of the best and the worst outcome should be selected (equation IV:1). a-index of project i = a · vi + (1-a) · Vi (Equation IV:1) Optimist/pessimist-parameter = a, 0 ≤ a ≤ 1 Value of worst outcome of project i = vi Value of best outcome of project i = Vi According to Mattsson (2000) the difficulty with using Hurwitz’s criterion is to decide a value on the optimist/pessimist-parameter. Since most people are risk averse when it comes to accident protection a high value is most suitable. The analysis can be done using intervals to get an idea of the sensitiveness of the calculations. If the priority order of the projects does not change the decision maker can be assured that the right project is chosen. If the variations in the parameter value leads to a different priority order the investigators needs to go back and evaluate the parameter value. If there are changes in the priority order even when the range of the parameter is tight, the projects might be so similar that it does not matter which one is chosen. Mattsson (2000) believe that an individuals risk aversion can be connected to the decreasing marginal utility of large changes in wealth. With small changes in wealth most individuals values the absolute marginal utility of profit and loss about the same. With larger changes in wealth the absolute marginal utility of loss is valued higher. 7. Distribution effects Decision makers are interested in the effectiveness and the distribution of benefits of a project. There are different ways to include distribution factors in the CBA, two of them are described below. • Exchange rates: This method is based on the statement that a fixed sum of money
has different value to different distribution groups. To estimate the exchange rate between the distribution group’s tax scales or past decisions regarding public projects can be used.
• Social planning balance: In this method incidence categories are used instead of
distribution groups. The advantage of this is that one person can belong to more than one category. For instance, a person can belong to the categories “car driver” and “property-holder”. It is important to single out the incidence categories that are of interest for the decision makers. To make it manageable for the decision makers the number of incidence categories in the analysis need to be limited.
All the mentioned steps are necessary to make CBA as good as possible. Even though all steps are made and all factors have been considered, not all people will be happy with a decision i.e. some people think that the costs of the decision are exceeding the benefit.

How can the business benefit of Business Continuity Planning be measured?
L. Degerfalk & M. Larsson 4
Even though all people are not happy with a decision the CBA creates a good logical foundation for a decision maker in his/her decision process.
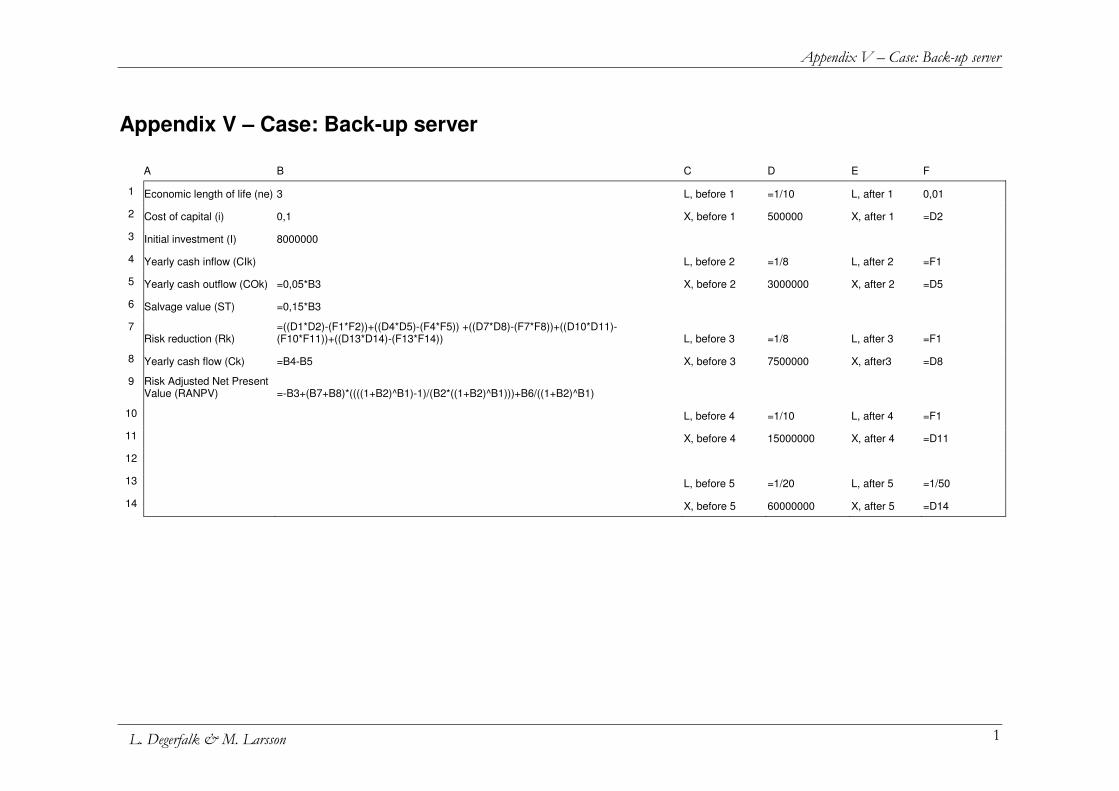
Appendix V – Case: Back-up server
1 L. Degerfalk & M. Larsson
Appendix V – Case: Back-up server
A B C D E F
1 Economic length of life (ne) 3 L, before 1 =1/10 L, after 1 0,01
2 Cost of capital (i) 0,1 X, before 1 500000 X, after 1 =D2
3 Initial investment (I) 8000000
4 Yearly cash inflow (CIk) L, before 2 =1/8 L, after 2 =F1
5 Yearly cash outflow (COk) =0,05*B3 X, before 2 3000000 X, after 2 =D5
6 Salvage value (ST) =0,15*B3
7 Risk reduction (Rk)
=((D1*D2)-(F1*F2))+((D4*D5)-(F4*F5)) +((D7*D8)-(F7*F8))+((D10*D11)-(F10*F11))+((D13*D14)-(F13*F14)) L, before 3 =1/8 L, after 3 =F1
8 Yearly cash flow (Ck) =B4-B5 X, before 3 7500000 X, after3 =D8
9 Risk Adjusted Net Present Value (RANPV) =-B3+(B7+B8)*((((1+B2)^B1)-1)/(B2*((1+B2)^B1)))+B6/((1+B2)^B1)
10 L, before 4 =1/10 L, after 4 =F1
11 X, before 4 15000000 X, after 4 =D11
12
13 L, before 5 =1/20 L, after 5 =1/50
14 X, before 5 60000000 X, after 5 =D14
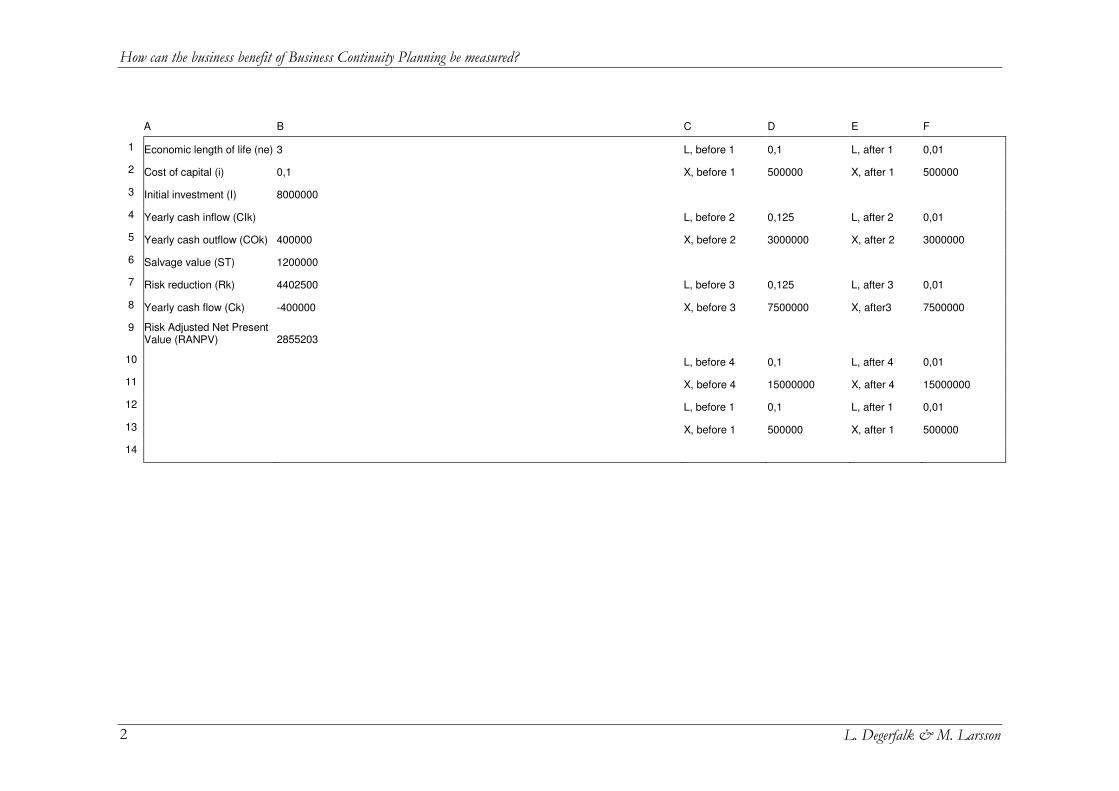
How can the business benefit of Business Continuity Planning be measured?
L. Degerfalk & M. Larsson 2
A B C D E F
1 Economic length of life (ne) 3 L, before 1 0,1 L, after 1 0,01
2 Cost of capital (i) 0,1 X, before 1 500000 X, after 1 500000
3 Initial investment (I) 8000000
4 Yearly cash inflow (CIk) L, before 2 0,125 L, after 2 0,01
5 Yearly cash outflow (COk) 400000 X, before 2 3000000 X, after 2 3000000
6 Salvage value (ST) 1200000
7 Risk reduction (Rk) 4402500 L, before 3 0,125 L, after 3 0,01
8 Yearly cash flow (Ck) -400000 X, before 3 7500000 X, after3 7500000
9 Risk Adjusted Net Present Value (RANPV) 2855203
10 L, before 4 0,1 L, after 4 0,01
11 X, before 4 15000000 X, after 4 15000000
12 L, before 1 0,1 L, after 1 0,01
13 X, before 1 500000 X, after 1 500000
14
Appendix VI – Case: Text system
1 L. Degerfalk & M. Larsson
Appendix VI – Case: Text system
A B C D E F
1 Economic length of life (ne) 4 L, before 1 0,0151 L, after 1 0,002525
2 Cost of capital (i) 0,1 X, before 1 5,02E+07 X, after 1 =D2
3 Initial investment (I) 2000000
4 Yearly cash inflow (CIk) 0
5 Yearly cash outflow (COk) 0
6 Salvage value (ST) 0
7 Risk reduction (Rk) =((D1*D2)-(F1*F2))
8 Yearly cash flow (Ck) =B4-B5
9 Risk Adjusted Net Present Value (RANPV) =-B3+(B7+B8)*((((1+B2)^B1)-1)/(B2*((1+B2)^B1)))+B6/((1+B2)^B1)
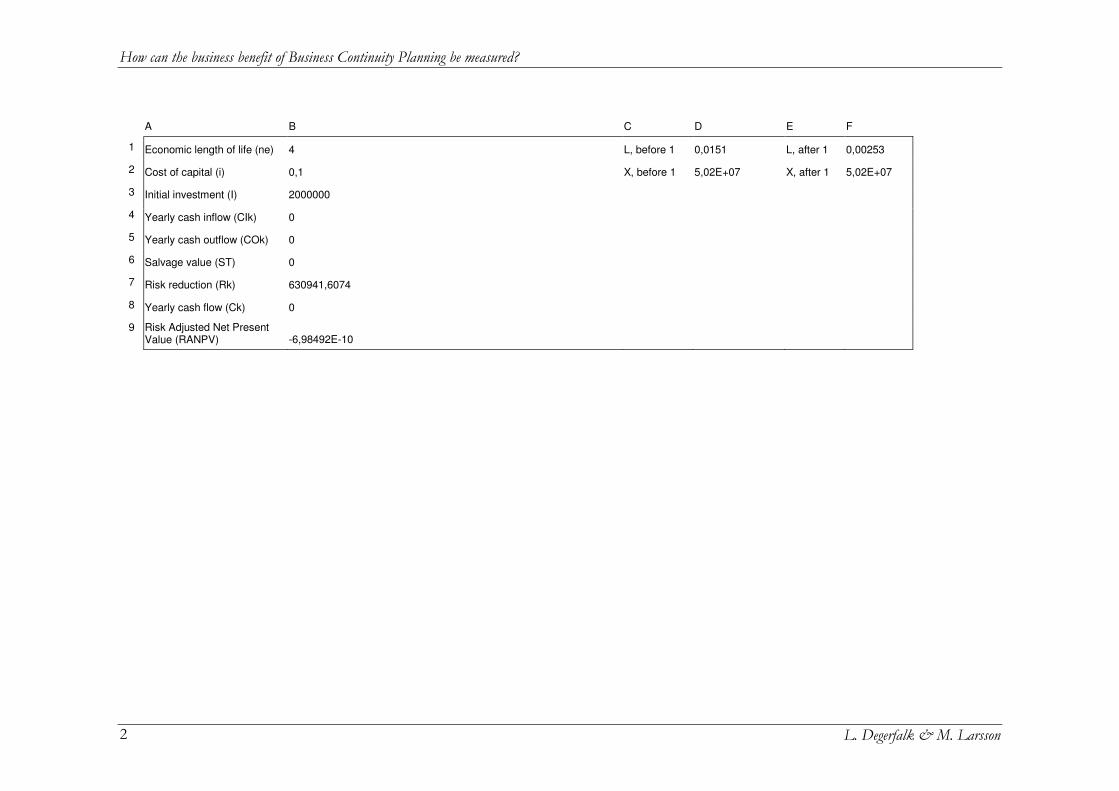
How can the business benefit of Business Continuity Planning be measured?
L. Degerfalk & M. Larsson 2
A B C D E F
1 Economic length of life (ne) 4 L, before 1 0,0151 L, after 1 0,00253
2 Cost of capital (i) 0,1 X, before 1 5,02E+07 X, after 1 5,02E+07
3 Initial investment (I) 2000000
4 Yearly cash inflow (CIk) 0
5 Yearly cash outflow (COk) 0
6 Salvage value (ST) 0
7 Risk reduction (Rk) 630941,6074
8 Yearly cash flow (Ck) 0
9 Risk Adjusted Net Present Value (RANPV) -6,98492E-10