Embed Size (px)
Citation preview

How circular is Norway’sBIOECONOMY ?


100%


Resources

Resources
Emissions

NorwegianBIOECONOMY
Nutrients Energy Water Land

Importance of Phosphorus
Critical Plant
NutrientIrreplaceable
P N
Limited Underpins all food systems
NO P = NO FOOD
Used Inefficiently

Eutrophication
Image Sources: https://serc.carleton.edu/microbelife/topics/deadzone/index.html (top) https://www.aftenposten.no/norge/i/K3G0M7/Havforskningsinstituttet--Oppdrett-har-ikke-skylden-for-algeoppblomstring (bottom)

Material Flow Analysis
Image Source: MinFuture Project, https://minfuture.eu/

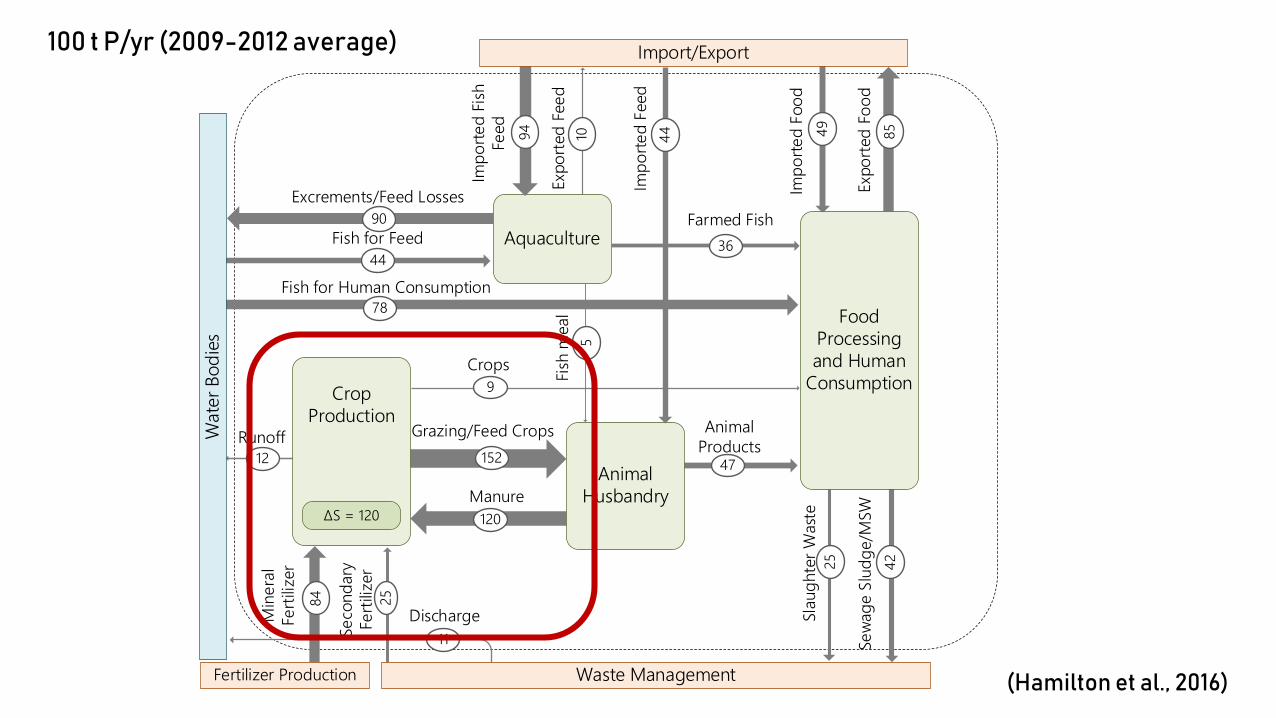
Norwegian Phosphorus Flow Analysis
Wat
er B
odie
s
Import/Export
Waste Management
Crop Production
Meat and Fish
Production∆S
Food Processing
Human Consumption
Min
eral
Fer
tilize
r
Impo
rted
Feed
Expo
rted
Feed
Expo
rted
Food
Impo
rted
Food
Feed Crops
Animal and Fish Products
Food Products
Fish for FeedRunoff
Crops
Seco
ndar
y Fe
rtiliz
er
Slau
ghte
r Was
te
Sewa
ge S
ludg
e/M
SW
Was
te fo
r fee
d
Manure
Losses

Animal Husbandry
Min
eral
Fe
rtiliz
er
Impo
rted
Feed
Expo
rted
Feed
Expo
rted
Food
Impo
rted
Food
Grazing/Feed Crops Animal Products
Fish for Feed
Runoff
CropsSe
cond
ary
Ferti
lizer
Slau
ghte
r Was
te
Sewa
ge S
ludg
e/M
SW
Farmed Fish
4410 49
Manure
85
84
44
152
25
120
25 42
Discharge11
9
47
Aquaculture
Fertilizer Production
12
Crop Production
∆S = 120
Food Processing and Human
Consumption
Wat
er B
odie
s
Fish for Human Consumption78
Fish
mea
l5
36
Import/Export
Impo
rted
Fish
Fe
ed 94
Excrements/Feed Losses90
Waste Management (Hamilton et al., 2016)
100 t P/yr (2009-2012 average)

(Hamilton et al., 2016)
100 t P/yr (2009-2012 average)
Animal Husbandry
Min
eral
Fe
rtiliz
er
Grazing/Feed Crops
Runoff
Crops
Seco
ndar
y Fe
rtiliz
er
Manure
84
152
25
120
Discharge11
9
Fertilizer Production
12
Crop Production
∆S = 120
Wat
er B
odie
s
Fish
mea
5
Waste Manage

Animal Husbandry
Min
eral
Fe
rtiliz
er
Impo
rted
Feed
Expo
rted
Feed
Expo
rted
Food
Impo
rted
Food
Grazing/Feed Crops Animal Products
Fish for Feed
Runoff
CropsSe
cond
ary
Ferti
lizer
Slau
ghte
r Was
te
Sewa
ge S
ludg
e/M
SW
Farmed Fish
4410 49
Manure
85
84
44
152
25
120
25 42
Discharge11
9
47
Aquaculture
Fertilizer Production
12
Crop Production
∆S = 120
Food Processing and Human
Consumption
Wat
er B
odie
s
Fish for Human Consumption78
Fish
mea
l5
36
Import/Export
Impo
rted
Fish
Fe
ed 94
Excrements/Feed Losses90
Waste Management
100 t P/yr (2009-2012 average)
(Hamilton et al., 2016)
2050?

Norwegian Secondary P Sources
(Hamilton et al., 2016)

Fisheries and Aquaculture Eutrophication Footprint
500000
550000
600000
650000
700000
750000
800000
850000
2000 2001 2002 2003 2004 2005 2006 2007 2008 2009 2010 2011
t N e
q.
Marine Eutrophication
11000
12000
13000
14000
15000
16000
17000
18000
2000 2001 2002 2003 2004 2005 2006 2007 2008 2009 2010 2011
t P e
q.
Freshwater Eutrophication
Figure 1. Global marine and freshwater eutrophication due to fisheries and aquaculture (Source: Hamilton et al., 2018, Nature Sustainability)

How circular is Norway’sBIOECONOMY ?
~50%
[in terms of phosphorus]

Is circular always better?

Manure
Plant Availability
Fish Scrap
Meat bone mealFish excrements and feed losses
Sewage sludge
Food waste
Plant available P
Total P
76-100%100 100
10-60%
22-40%
100
19-60%
41-75%
100
100
100 21-
115%
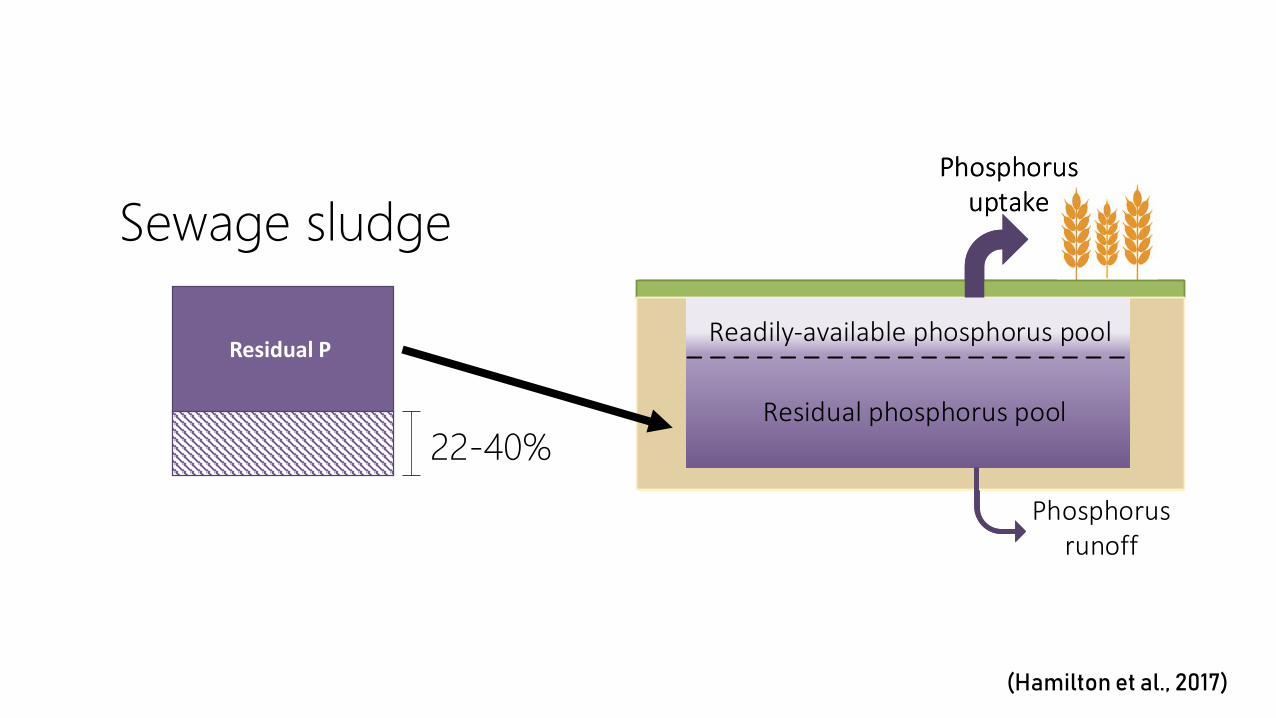
(Hamilton et al., 2017)

Sewage sludge
22-40%
Residual P Readily-available phosphorus pool
Residual phosphorus pool
Phosphorus uptake
Phosphorus runoff
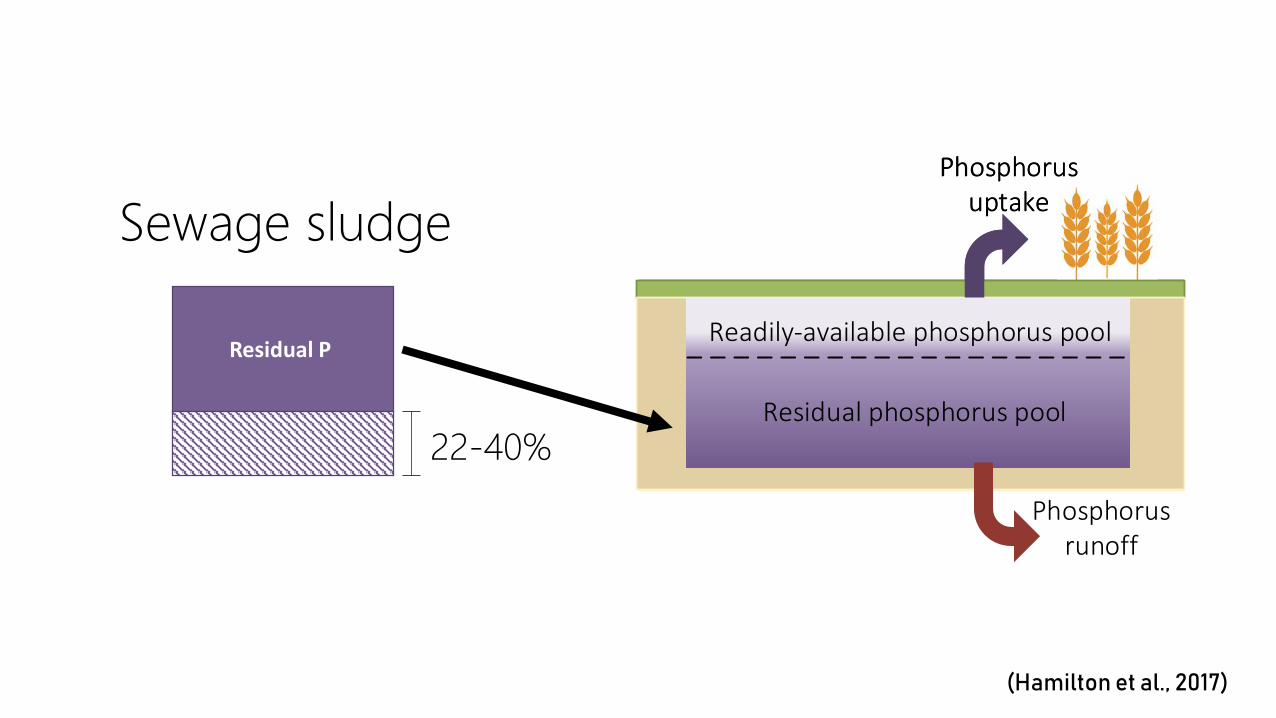
(Hamilton et al., 2017)
Sewage sludge
22-40%
Residual P Readily-available phosphorus pool
Residual phosphorus pool
Phosphorus uptake
Phosphorus runoff
(Hamilton et al., 2017)
Readily-available phosphorus pool
Residual phosphorus pool
Phosphorus uptake
Sewage sludge
22-40%
Residual P Readily-available phosphorus pool
Residual phosphorus pool
Phosphorus uptake
Phosphorus runoff
(Hamilton et al., 2017)
Readily-available phosphorus pool
Residual phosphorus pool
Phosphorus uptake
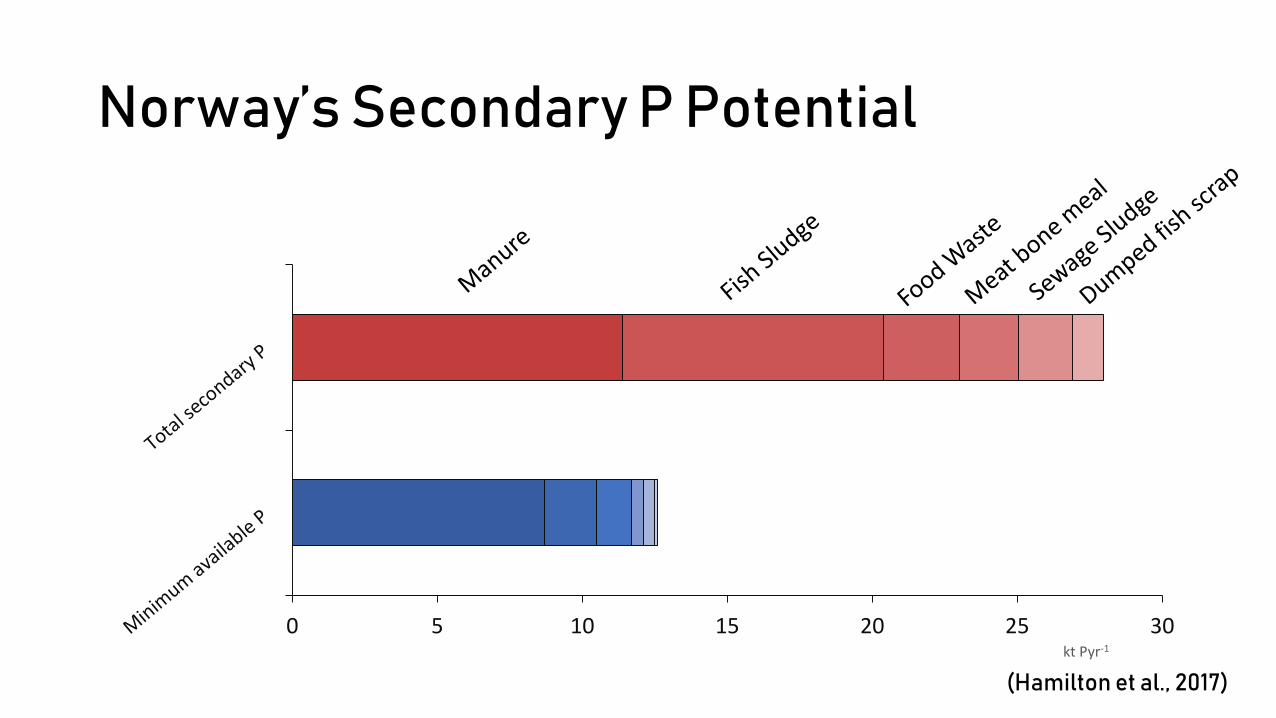
Norway’s Secondary P Potential
0 5 10 15 20 25 30kt Pyr-1
(Hamilton et al., 2017)

P Supply
P Demand
(Hanserud et al., 2015)


X


Means to an end
Thank you for your attention
Helen Ann Hamilton, Ph.D.Industrial Ecology Programme
Norwegian University of Science and [email protected]

Helen Ann Hamilton, Ph.DSources:
Hamilton, Helen Ann; Ivanova, Diana; Stadler, Konstantin; Merciai, Stefano; Schmidt, Jannick; Van Zelm, Rosalie; Moran, Daniel; Wood, Richard. (2018) Trade and the role of non-food commodities for global eutrophication. Nature Sustainability. vol. 1 (6)
Hamilton, Helen Ann; Brod, Eva; Hanserud, Ola Stedje; Müller, Daniel Beat; Brattebø, Helge; Haraldsen, Trond. (2017) Recyclingpotential of secondary phosphorus resources as assessed by integrating substance flow analysis and plant-availability. Science of the Total Environment. vol. 575.
Hamilton, Helen Ann; Brod, Eva; Hanserud, Ola Stedje; Gracey, Erik Olav; Vestrum, Magnus Inderberg; Bøen, Anne; Steinhoff, Franciska Senta; Müller, Daniel Beat; Brattebø, Helge. (2016) Investigating cross-sectoral synergies through integratedaquaculture, fisheries and agriculture phosphorus assessments: A case study of Norway. Journal of Industrial Ecology. vol. 20 (4).
Hamilton, Helen Ann; Peverill, M. Samantha; Müller, Daniel Beat; Brattebø, Helge. (2015) Assessment of food waste preventionand recycling strategies using a multi-layer systems approach. Environmental Science and Technology. vol. 49.
Hanserud, Ola; E. Brod, A.F. Øgaard, D.B. Müller and H. Brattebø.(2016) A multi-regional soil phosphorus balance for exploring secondary fertilizer potential: the case of Norway. Nutrient Cycling in Agroecosystems. Vol 104.
Icons from pixabay.com