Embed Size (px)
Citation preview

Ch 9, Clearing the Water – Dairying, March 5, 2014 – By Jim Tucker
HERE is strange emotive power to alliteration.
Headline writers use it when they string together words beginning with the same
letter or sound: French farce, fickle fate, Habitat for Humanity’s homes faulted in Florida…dirty dairying.
For an industry that brings billions of dollars to the country’s coffers and is a pivotal way of life in regions like Taranaki, the image is unfortunate, the words an unwelcome reminder that for a new generation the environmental cost of converting green grass to white gold must now be counted. And countered.
Water is central to the conundrum. Taranaki has always been ideal for dairy farming because plentiful rain guarantees good pasture and provides many hundreds of what were once regarded as “drains”, the streams, to take away any unwanted end-product.
Today, despite evidence of climate change, the first part of that sentence still applies, but the second bit is a goner.
The days of building a dairy factory or a cowshed on the banks of a handy stream so you could discharge the milk wastes or hose out the manure after twice-daily milking and rely on the waterway to dispose of it are long gone, a distant memory from the 70s.
Then, nearly all of the 300-plus streams flowing off Mt Taranaki to the sea were so polluted by cattle wastes and milk factory discharges, farmers in the lower parts of the catchments couldn’t use the water for stock.
T
How dairying is
shaking off its
unfortunate image

Ch 9, Clearing the Water – Dairying, March 5, 2014 – By Jim Tucker
These days, despite the total number of cows growing 20% in the past two decades, dairy shed waste gets directly into streams on only rare occasions, and farmers caught polluting may end up in court paying fines of many thousands of dollars.
Shed washings go through treatment ponds or are reapplied to the land. Cattle are mostly kept out of
waterways by bridges, culverts, fences and riparian planting. Farms are inspected annually to ensure they measure up to conditions set out in resource consents.
So why does the label persist? If most Taranaki dairy farmers these days perform way better than their parents did when it comes to caring for the environment, why do they still get “dirty dairying”?
This chapter looks at what has been done to clean up dairying in Taranaki over the past 40 years, and what’s left to do.
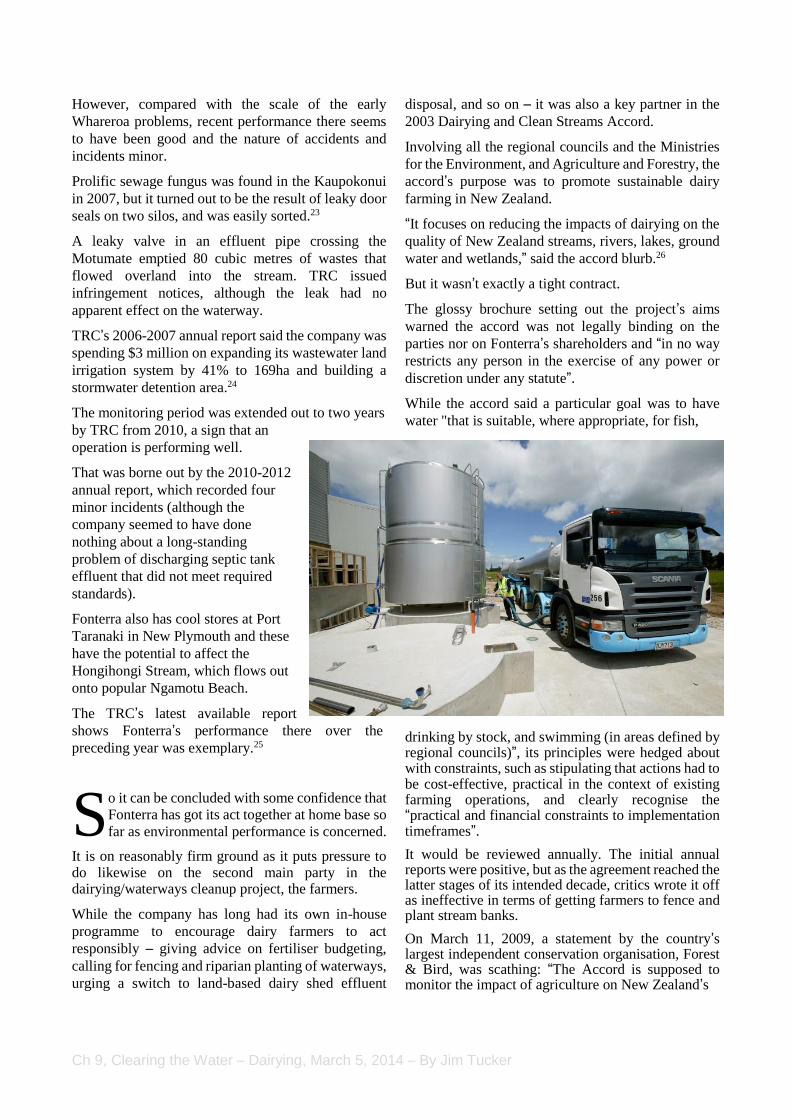
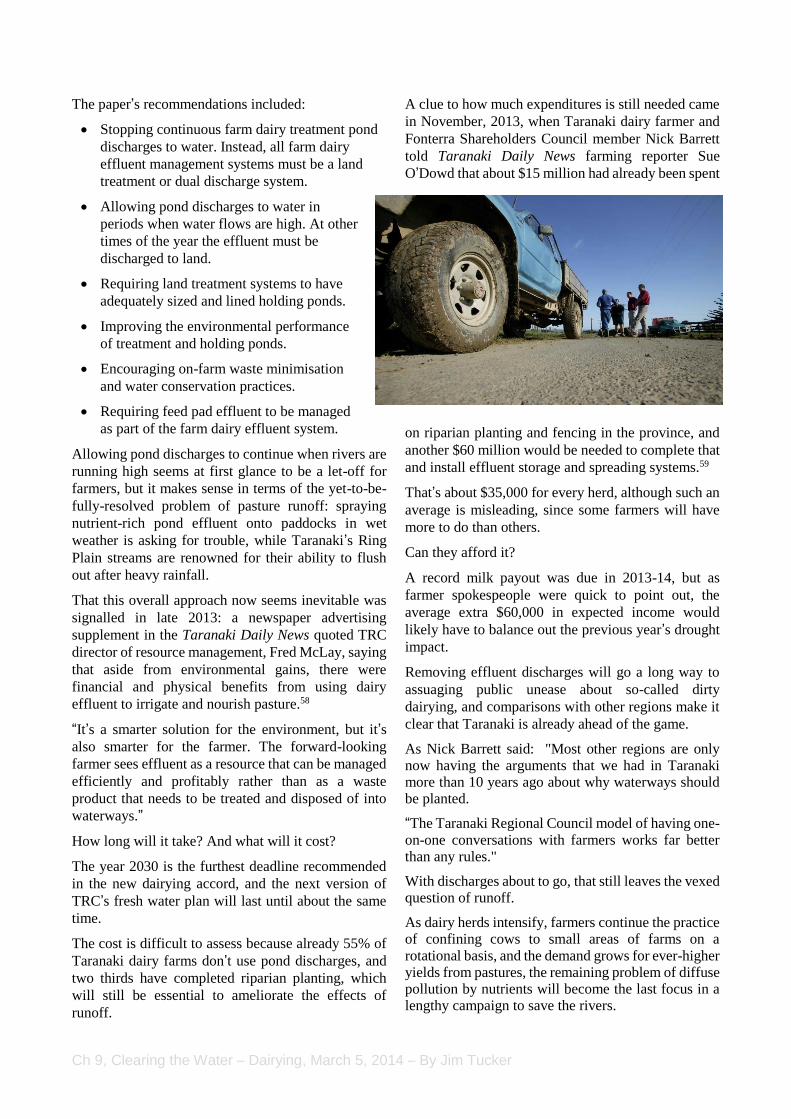
armer Andy – not his real name, but he is real – had good cause to scratch his head in puzzlement one day last year.
A TRC inspector called in unexpectedly to do the annual check on his dairy effluent system (pictured left), and left Andy with an infringement notice and a $500 fine.
Andy was puzzled because he had a current resource consent for his treatment system, a ticket that still had 12 years to run. His standard two-pond system had been working fine, he was compliant…or so he thought.
But the TRC inspector decided to check the creek in the gully below, the receiving waters for a clear, partially treated effluent coming out of the second, aerobic pond.1
It turned out the effluent flow was more than the allowed one percent of creek flow. TRC rules say the discharge has to be less than one litre of effluent for every 100 litres of stream water.
Andy’s farm is the first one the creek crosses. It rises from a spring on a curving hillside at the top of the valley on his south-western boundary, a bowl-like amphitheatre ideal for a rock concert.
F
Ch 9, Clearing the Water – Dairying, March 5, 2014 – By Jim Tucker
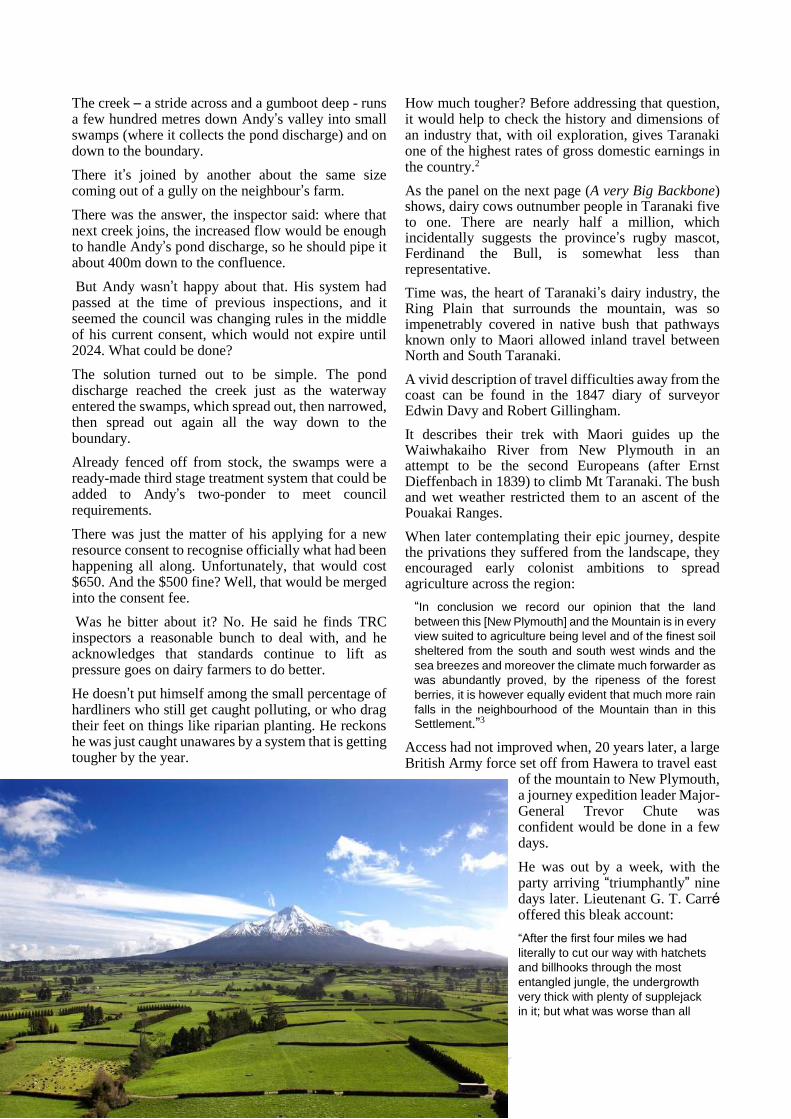
The creek – a stride across and a gumboot deep - runs a few hundred metres down Andy’s valley into small swamps (where it collects the pond discharge) and on down to the boundary.
There it’s joined by another about the same size coming out of a gully on the neighbour’s farm.
There was the answer, the inspector said: where that next creek joins, the increased flow would be enough to handle Andy’s pond discharge, so he should pipe it about 400m down to the confluence.
But Andy wasn’t happy about that. His system had passed at the time of previous inspections, and it seemed the council was changing rules in the middle of his current consent, which would not expire until 2024. What could be done?
The solution turned out to be simple. The pond discharge reached the creek just as the waterway entered the swamps, which spread out, then narrowed, then spread out again all the way down to the boundary.
Already fenced off from stock, the swamps were a ready-made third stage treatment system that could be added to Andy’s two-ponder to meet council requirements.
There was just the matter of his applying for a new resource consent to recognise officially what had been happening all along. Unfortunately, that would cost $650. And the $500 fine? Well, that would be merged into the consent fee.
Was he bitter about it? No. He said he finds TRC inspectors a reasonable bunch to deal with, and he acknowledges that standards continue to lift as pressure goes on dairy farmers to do better.
He doesn’t put himself among the small percentage of hardliners who still get caught polluting, or who drag their feet on things like riparian planting. He reckons he was just caught unawares by a system that is getting tougher by the year.
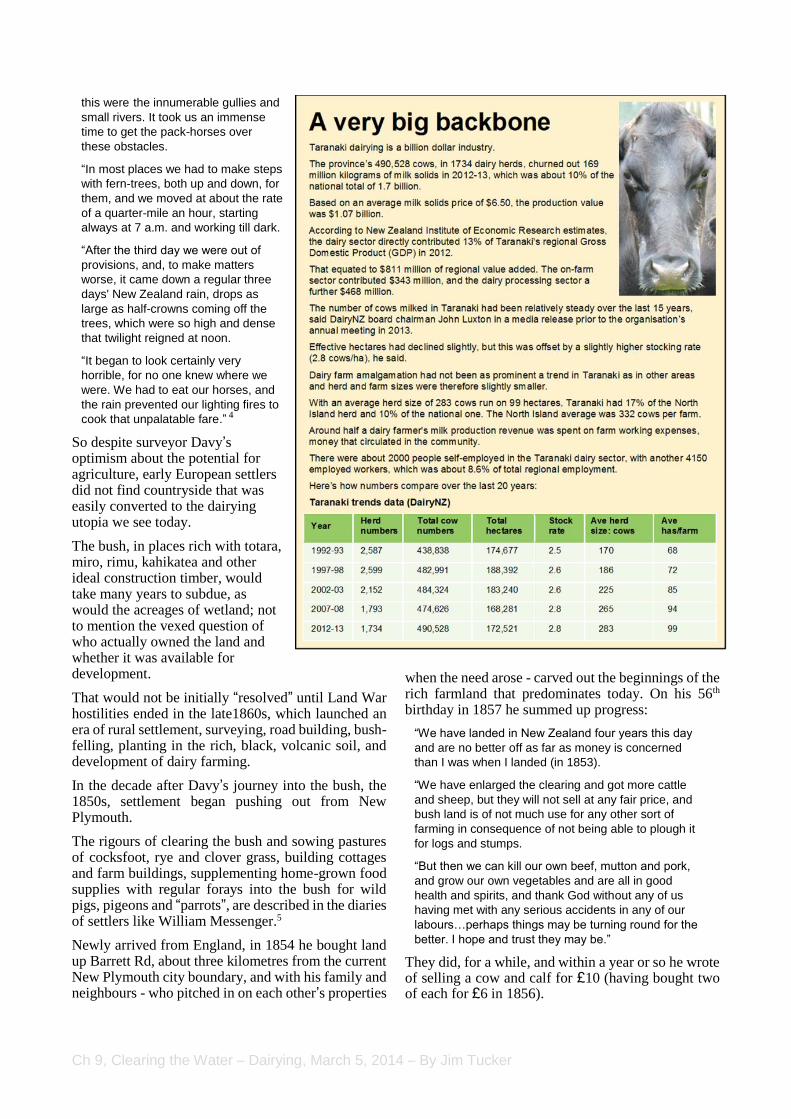
How much tougher? Before addressing that question, it would help to check the history and dimensions of an industry that, with oil exploration, gives Taranaki one of the highest rates of gross domestic earnings in the country.2
As the panel on the next page (A very Big Backbone) shows, dairy cows outnumber people in Taranaki five to one. There are nearly half a million, which incidentally suggests the province’s rugby mascot, Ferdinand the Bull, is somewhat less than representative.
Time was, the heart of Taranaki’s dairy industry, the Ring Plain that surrounds the mountain, was so impenetrably covered in native bush that pathways known only to Maori allowed inland travel between North and South Taranaki.
A vivid description of travel difficulties away from the coast can be found in the 1847 diary of surveyor Edwin Davy and Robert Gillingham.
It describes their trek with Maori guides up the Waiwhakaiho River from New Plymouth in an attempt to be the second Europeans (after Ernst Dieffenbach in 1839) to climb Mt Taranaki. The bush and wet weather restricted them to an ascent of the Pouakai Ranges.
When later contemplating their epic journey, despite the privations they suffered from the landscape, they encouraged early colonist ambitions to spread agriculture across the region:
“In conclusion we record our opinion that the land
between this [New Plymouth] and the Mountain is in every
view suited to agriculture being level and of the finest soil
sheltered from the south and south west winds and the
sea breezes and moreover the climate much forwarder as
was abundantly proved, by the ripeness of the forest
berries, it is however equally evident that much more rain
falls in the neighbourhood of the Mountain than in this
Settlement.”3
Access had not improved when, 20 years later, a large British Army force set off from Hawera to travel east
of the mountain to New Plymouth, a journey expedition leader Major-General Trevor Chute was confident would be done in a few days.
He was out by a week, with the party arriving “triumphantly” nine days later. Lieutenant G. T. Carré offered this bleak account:
“After the first four miles we had
literally to cut our way with hatchets
and billhooks through the most
entangled jungle, the undergrowth
very thick with plenty of supplejack
in it; but what was worse than all
Ch 9, Clearing the Water – Dairying, March 5, 2014 – By Jim Tucker
this were the innumerable gullies and
small rivers. It took us an immense
time to get the pack-horses over
these obstacles.
“In most places we had to make steps
with fern-trees, both up and down, for
them, and we moved at about the rate
of a quarter-mile an hour, starting
always at 7 a.m. and working till dark.
“After the third day we were out of
provisions, and, to make matters
worse, it came down a regular three
days' New Zealand rain, drops as
large as half-crowns coming off the
trees, which were so high and dense
that twilight reigned at noon.
“It began to look certainly very
horrible, for no one knew where we
were. We had to eat our horses, and
the rain prevented our lighting fires to
cook that unpalatable fare.” 4
So despite surveyor Davy’s optimism about the potential for agriculture, early European settlers did not find countryside that was easily converted to the dairying utopia we see today.
The bush, in places rich with totara, miro, rimu, kahikatea and other ideal construction timber, would take many years to subdue, as would the acreages of wetland; not to mention the vexed question of who actually owned the land and whether it was available for development.
That would not be initially “resolved” until Land War hostilities ended in the late1860s, which launched an era of rural settlement, surveying, road building, bush-felling, planting in the rich, black, volcanic soil, and development of dairy farming.
In the decade after Davy’s journey into the bush, the 1850s, settlement began pushing out from New Plymouth.
The rigours of clearing the bush and sowing pastures of cocksfoot, rye and clover grass, building cottages and farm buildings, supplementing home-grown food supplies with regular forays into the bush for wild pigs, pigeons and “parrots”, are described in the diaries of settlers like William Messenger.5
Newly arrived from England, in 1854 he bought land up Barrett Rd, about three kilometres from the current New Plymouth city boundary, and with his family and neighbours - who pitched in on each other’s properties
when the need arose - carved out the beginnings of the rich farmland that predominates today. On his 56th birthday in 1857 he summed up progress:
“We have landed in New Zealand four years this day
and are no better off as far as money is concerned
than I was when I landed (in 1853).
“We have enlarged the clearing and got more cattle
and sheep, but they will not sell at any fair price, and
bush land is of not much use for any other sort of
farming in consequence of not being able to plough it
for logs and stumps.
“But then we can kill our own beef, mutton and pork,
and grow our own vegetables and are all in good
health and spirits, and thank God without any of us
having met with any serious accidents in any of our
labours…perhaps things may be turning round for the
better. I hope and trust they may be.”
They did, for a while, and within a year or so he wrote of selling a cow and calf for £10 (having bought two of each for £6 in 1856).
Ch 9, Clearing the Water – Dairying, March 5, 2014 – By Jim Tucker
His income came mainly from sheep and wool, and sometimes butter they churned at home. At this stage, though, his herd of just a few cows was mainly for home supply.
The Land Wars overtook the following decade, with most settlers retreating to the safety of New Plymouth, but when peace arrived in Taranaki in 1869, the way was opened for rapid development across the Ring Plain and over vast tracts of West Coast Settlement land confiscated in 1865 by the stroke of a government pen. Messenger and his neighbours were no longer at the frontier’s edge.
By 1886, Taranaki had 206,000 acres (more than 80,000 hectares) of fenced land that carried about 80,000 cattle and 132,000 sheep, the census of that year putting the human population at 18,000 “persons”.6
So far as dairying was concerned, the last three decades of the 19th century saw foundations laid for an agricultural industry that would dominate the landscape.
A key player mentioned in dairying histories is Chew Chong (Chau Tseung), who was born in 1828 in Hoiping (now Kaiping), 120kms south-east of Canton city (now Guangzhou), and who migrated to Australia and then to Dunedin in 1866.
He arrived in Taranaki in 1870 in pursuit of a tree fungus highly valued in Chinese cuisine and which Chong bought from farmers for export.
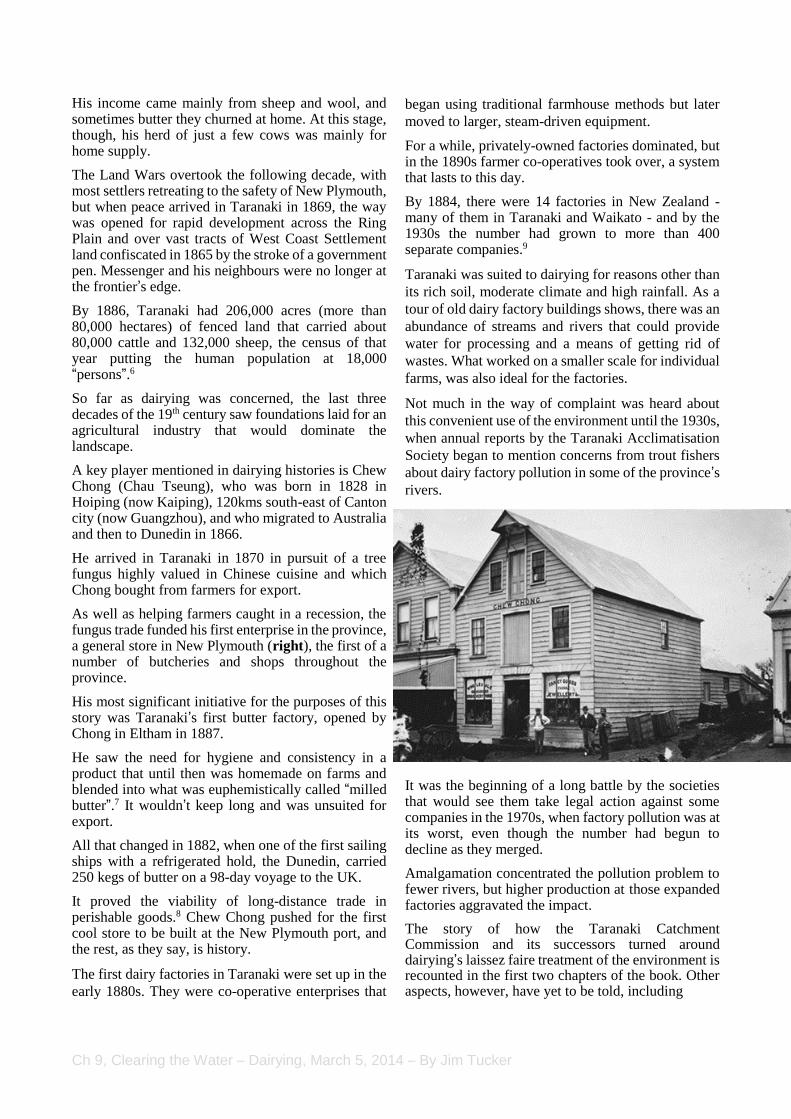
As well as helping farmers caught in a recession, the fungus trade funded his first enterprise in the province, a general store in New Plymouth (right), the first of a number of butcheries and shops throughout the province.
His most significant initiative for the purposes of this story was Taranaki’s first butter factory, opened by Chong in Eltham in 1887.
He saw the need for hygiene and consistency in a product that until then was homemade on farms and blended into what was euphemistically called “milled butter”.7 It wouldn’t keep long and was unsuited for export.
All that changed in 1882, when one of the first sailing ships with a refrigerated hold, the Dunedin, carried 250 kegs of butter on a 98-day voyage to the UK.
It proved the viability of long-distance trade in perishable goods.8 Chew Chong pushed for the first cool store to be built at the New Plymouth port, and the rest, as they say, is history.
The first dairy factories in Taranaki were set up in the
early 1880s. They were co-operative enterprises that
began using traditional farmhouse methods but later
moved to larger, steam-driven equipment.
For a while, privately-owned factories dominated, but in the 1890s farmer co-operatives took over, a system that lasts to this day.
By 1884, there were 14 factories in New Zealand - many of them in Taranaki and Waikato - and by the 1930s the number had grown to more than 400 separate companies.9
Taranaki was suited to dairying for reasons other than
its rich soil, moderate climate and high rainfall. As a
tour of old dairy factory buildings shows, there was an
abundance of streams and rivers that could provide
water for processing and a means of getting rid of
wastes. What worked on a smaller scale for individual
farms, was also ideal for the factories.
Not much in the way of complaint was heard about
this convenient use of the environment until the 1930s,
when annual reports by the Taranaki Acclimatisation
Society began to mention concerns from trout fishers
about dairy factory pollution in some of the province’s
rivers.
It was the beginning of a long battle by the societies that would see them take legal action against some companies in the 1970s, when factory pollution was at its worst, even though the number had begun to decline as they merged.
Amalgamation concentrated the pollution problem to fewer rivers, but higher production at those expanded factories aggravated the impact.
The story of how the Taranaki Catchment Commission and its successors turned around dairying’s laissez faire treatment of the environment is recounted in the first two chapters of the book. Other aspects, however, have yet to be told, including
Ch 9, Clearing the Water – Dairying, March 5, 2014 – By Jim Tucker
the impact of all those dairy factories morphing into
one giant at Whareroa south of Hawera, the initial
battle over Fonterra’s marine outfall, the influence of
Fonterra on its farmer owners, the limited success of
the Clean Streams Accord, the new accord, and the
impact of government ministries intent on improving
the country’s rapidly declining reputation for a “100%
Pure” environment.
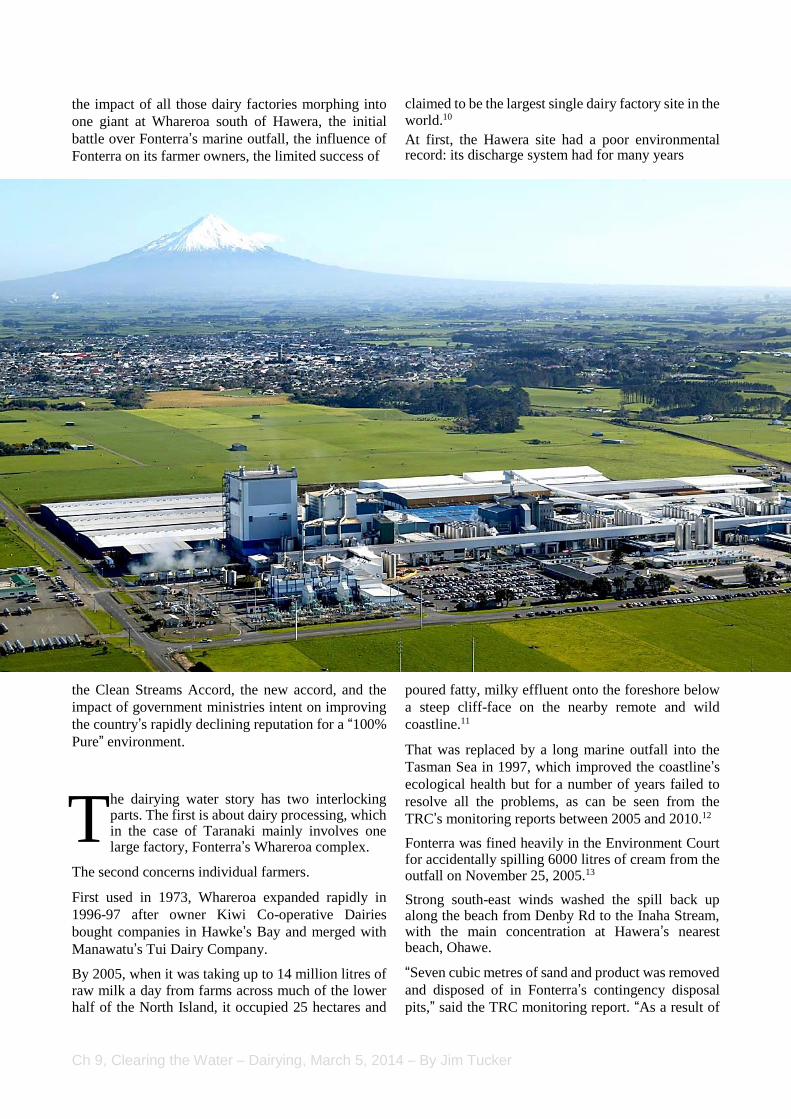
he dairying water story has two interlocking parts. The first is about dairy processing, which in the case of Taranaki mainly involves one large factory, Fonterra’s Whareroa complex.
The second concerns individual farmers.
First used in 1973, Whareroa expanded rapidly in
1996-97 after owner Kiwi Co-operative Dairies
bought companies in Hawke’s Bay and merged with
Manawatu’s Tui Dairy Company.
By 2005, when it was taking up to 14 million litres of raw milk a day from farms across much of the lower half of the North Island, it occupied 25 hectares and
claimed to be the largest single dairy factory site in the world.10
At first, the Hawera site had a poor environmental record: its discharge system had for many years
poured fatty, milky effluent onto the foreshore below
a steep cliff-face on the nearby remote and wild
coastline.11
That was replaced by a long marine outfall into the
Tasman Sea in 1997, which improved the coastline’s
ecological health but for a number of years failed to
resolve all the problems, as can be seen from the
TRC’s monitoring reports between 2005 and 2010.12
Fonterra was fined heavily in the Environment Court for accidentally spilling 6000 litres of cream from the outfall on November 25, 2005.13
Strong south-east winds washed the spill back up along the beach from Denby Rd to the Inaha Stream, with the main concentration at Hawera’s nearest beach, Ohawe.
“Seven cubic metres of sand and product was removed
and disposed of in Fonterra’s contingency disposal
pits,” said the TRC monitoring report. “As a result of
T

Ch 9, Clearing the Water – Dairying, March 5, 2014 – By Jim Tucker
the incident, Fonterra was prosecuted and received a
$25,000 fine and ordered to pay a further $4,000 in
costs.”
It wasn’t the only transgression over that monitoring
year. Whareroa had eight other spills, mostly into the
sea, but also three during unloading milk at the factory
(these were contained by ponds).
In all, these accidents involved about 65,000 litres of
various milk products, including whole milk, whey,
cream, skim milk and concentrate, and were caused by
equipment failure (4) and operator error (5).
Testing by the TRC and
the company itself showed
Fonterra breached some of
its 200 resource consent
conditions on many
occasions.
For instance, it exceeded
the marine outfall
discharge limit 90 times
(mostly during the dairy
flush season in September,
October and November).
On five occasions, it took
more water from the
Tawhiti Stream than was
allowed.
Sometimes (for example,
January 25, 2006), it
discharged effluent
massively contaminated
with bacteria (a count of
10 million enterococci
colony forming units per
100 millilitres of water) and suspended solids.
Occasionally, it exceeded the biochemical oxygen
demand (BOD), oil, grease and chlorine limits in
stormwater discharges to a tributary of the Tawhiti
Stream. And a couple of times, stormwater from the
site going into a tributary of the Tangahoe Stream was
over the limit for suspended solids, BOD and chlorine.
How bad was all this?
Apart from the big cream spill and the bacteria loadings, the 2005-2006 monitoring report paints a relatively positive picture of what was going on, given
Fonterra’s huge growth at the time.
The cream spill cost a big fine, which gives the lie to
criticism sometimes faced by organisations like TRC
that only small targets - that is, farmers - are lined up
for prosecution.
However, the bacteria problem did worry the council’s
scientists:
“The discharge of these bacteria through the marine
outfall with the dairy wastewater has the potential to
confound the results of monitoring of the
microbiological quality of shoreline waters adjacent to
the outfall (undertaken as part of the monitoring
programme associated with the Hawera municipal
wastewater).
“The discharge of domestic wastes
in the dairy wastewater itself is
specifically prohibited, and this
condition is complied with.
“However, the wastewater
disposal system for the dairy
complex is warm and contains
nutrients, which provides a
suitable environment for bacteria
derived from contamination of
stormwater and wastewater by
birds, rodents and tanker
washing.”14
But aside from those concerns, the
report said Fonterra was in fact
getting its act together.
The breaches for taking too much
water, at five, compared more
than favourably with the previous
year’s 44, while the discharge
volume breaches (90) had
dropped from 121.
The amount of fat in the 6.9 million cubic metres of
wastewater discharge also dropped for the first time in
three seasons. It was down 24% on the previous year,
falling from 2399 tonnes to 1816.
The council also found that despite the extra volumes
of effluent going into the sea, there was no apparent
direct effect on sea life.
Tests at six inter-tidal sites showed marine
communities were deteriorating, but comparisons with a control site showed this was the result of natural erosion, sand movement and rough seas, not Fonterra.
“This section of coastline is dominated by large cliff
faces which are prone to erosion, either from large
rainfall events or rough seas coinciding with high
tides,” the report said.15
IMAGE: TRC

Ch 9, Clearing the Water – Dairying, March 5, 2014 – By Jim Tucker
“Large slips are dominant, resulting in very turbid
near-shore waters and a layer of silt which covers the
reefs smothering both marine life and rocks. The
turbidity of the water also reduces the level of light
available for algal (seaweed) growth.”
Probably on the strength of that finding (it’s not clear
in the report), the TRC decided to increase the daily
limit from 26,000 cubic metres to 40,000 for the
coming season (Fonterra’s high had been 32,600).
It was also tolerant of breaches of the limit on water
takes from Tawhiti Stream.
Transgressions had dropped by 90% on the previous
year, and those that did occur never threatened the
minimum residual flow of 50 litres a second, the
lowest the stream reached being 158.
As far as stormwater effects were concerned, the
council decided only a watching brief was needed,
since the limits were exceeded by small amounts on
few occasions, and tests of the macro-invertebrate
communities showed no detrimental effects (although,
given they were dominated by species tolerant to
pollution, that was hardly a surprise).
The Tawhiti was improving since a 2001 survey found
“extensive mats of ‘undesirable heterotrophic
growths’, with no such problems evident in 2005-
2006.16
But things would get worse at Whareroa before they got better.
The following year, the marine outfall was used to get rid of 345,000 litres of unauthorised milk products after eight incidents of operator error or plant malfunctions.
None went on the beaches, so the company escaped
any fines.17
The 2007-2008 season was better, with the outfall
discharging 77,000 litres of buttermilk, whole milk
and cream in four incidents.18 In a fifth, a thousand
kilogrammes of anhydrous milk fat (pure butter fat)
went out.
The company got a $750 infringement notice for the
latter, but since no product was found on the beaches
from the other discharges, there was no penalty for
those.
Fonterra was by now at least meeting the daily limit of
40,000 cubic metres of effluent, although on one
occasion the fat content was too high.
It breached the water take limit on the Tawhiti three
times, and there were instances of excessive levels of
chlorine, suspended solids and biochemical oxygen
demand in discharges from the three stormwater
systems into three small streams.
No detrimental effects were noticed in either the sea
or river environments.
The next year, 2008-2009, was one of
Fonterra’s worst ever for pollution at
Whareroa and demonstrated the impact
when something at a plant as big as this
goes wrong.
In nine incidents, a total 385,000 litres of
various milk products, some contaminated,
went out to sea.
Not all of it stayed there: in July, 2008, a
‘butter-like” substance washed up along
4.6km of foreshore around Ohawe Beach.
On September 4 the same year, 110,000
litres of old skim milk were discharged,
coating the high tide mark around Ohawe
for three days (pictured).
It happened again on September 21 after a discharge
of 13,000 litres of milk products.
On October 23, caustic solution accidentally got into
60,000 litres of skim milk and because it was at full
capacity, Fonterra asked TRC to let it dilute the milk
with water and discharge it slowly.
The council reluctantly agreed, then found milky scum
on the beaches. It took legal advice and warned
Fonterra it wouldn’t let that happen again without first
doing further investigations.
IMAGE: TRC

Ch 9, Clearing the Water – Dairying, March 5, 2014 – By Jim Tucker
It fined Fonterra $750 for each of the two worst
transgressions.
Most times, video monitoring showed the outfall was
working as designed, with any discoloured plumes
staying horizontal to the shore and well away from the
coast.
The company did not exceed the daily effluent
discharge limit – it had installed ways to cut down the
flow, such as recycling three million litres of water a
day - but the wastewater went beyond suspended
solids limits three times and the fat one on five
occasions.
It broke the condition forbidding adverse effects
beyond the sea mixing zone four times.
The TRC annual report was typically low key, but its
message was clear: “During the 2008-2009 year, the
Company demonstrated a good level of environmental
performance, however an improvement with the
compliance of resource consents and a reduction in
unauthorised incidents is desired.
“The outfall is not a disposal option for contaminated
product, it is for the purpose
of disposing of wastewater
only and Fonterra should
use its contingency
measures (such as pits or
external contractors) as a
means of disposing of any
unusable or contaminated
product.”19
The message was heeded.
The report for 2009-2010
found there were no
incidents like those of
previous years and the effluent exceeded the
suspended solids limit only once.20
It would have been a complete turnaround, except a
new problem was discovered with the stormwater
ponds. Heterotrophic growth (sewage fungus) and
abundant numbers of pollution-tolerant snails and
worms had begun to appear in a tributary of the
Tawhiti Stream that was taking discharges from one
of the stormwater systems.
Fonterra upgraded and cleaned out the systems and
after a year there were no more problems.
A look at the latest available TRC report on Whareroa
(2011-2012) shows Fonterra is now living up to the
promises it makes in its 2013 annual review report,
which dwells on the need for the company and its
suppliers to meet high environmental standards.
The company complied with all the resource
conditions, apart from one instance of the suspended
solids limit being exceeded.
Only one sea-related incident was reported – a rancid
scum found at the beach near the mouth of the
Manawapou River. The company said it appeared to
have come from Whareroa, but since nothing unusual
had happened with discharges it could not explain
why.
Testing on the reefs, dives down to the outfall diffuser, MCI sampling in the streams and other tests showed the plant no longer has any detrimental effects on the environment.
As the report executive summary noted: “Overall, in
terms of compliance with consents and environmental performance associated with the Fonterra Whareroa plant, this can be considered the best annual performance to date.”21
Following start-up of the Eltham sewerage treatment plant pipeline to Hawera in
2010, the company now has a useful alternative if it needs to get rid of contaminated milk products.
This option was used in 2013 when several full milk tankers
were contaminated after a contractor’s vehicle, called in to help meet the spring flush, accidentally went through the cleaning system with oil waste residue aboard.22
The tankers were re-routed to discharge at Eltham, from whence the dumped milk was piped with other treated sewage to the Hawera municipal wastewater plant, where it underwent standard dilution and treatment before exiting via the Fonterra marine outfall.
The Eltham option has its limits, however, discovered in the 2013 flush when milk products dumped there created a major odour problem for nearby residents.
The giant Whareroa complex is not the only Fonterra
operation in Taranaki with potential to harm the waterways. The company also owns the lactose factory at Kapuni, which had a chequered history so far as its wastewater irrigation area and the Kapuni and Kaupokonui Rivers and Motumate Stream, and groundwater are concerned.
Ch 9, Clearing the Water – Dairying, March 5, 2014 – By Jim Tucker
However, compared with the scale of the early
Whareroa problems, recent performance there seems
to have been good and the nature of accidents and
incidents minor.
Prolific sewage fungus was found in the Kaupokonui
in 2007, but it turned out to be the result of leaky door
seals on two silos, and was easily sorted.23
A leaky valve in an effluent pipe crossing the
Motumate emptied 80 cubic metres of wastes that
flowed overland into the stream. TRC issued
infringement notices, although the leak had no
apparent effect on the waterway.
TRC’s 2006-2007 annual report said the company was
spending $3 million on expanding its wastewater land
irrigation system by 41% to 169ha and building a
stormwater detention area.24
The monitoring period was extended out to two years
by TRC from 2010, a sign that an
operation is performing well.
That was borne out by the 2010-2012
annual report, which recorded four
minor incidents (although the
company seemed to have done
nothing about a long-standing
problem of discharging septic tank
effluent that did not meet required
standards).
Fonterra also has cool stores at Port
Taranaki in New Plymouth and these
have the potential to affect the
Hongihongi Stream, which flows out
onto popular Ngamotu Beach.
The TRC’s latest available report
shows Fonterra’s performance there over the
preceding year was exemplary.25
o it can be concluded with some confidence that
Fonterra has got its act together at home base so
far as environmental performance is concerned.
It is on reasonably firm ground as it puts pressure to do likewise on the second main party in the dairying/waterways cleanup project, the farmers.
While the company has long had its own in-house
programme to encourage dairy farmers to act
responsibly – giving advice on fertiliser budgeting,
calling for fencing and riparian planting of waterways,
urging a switch to land-based dairy shed effluent
disposal, and so on – it was also a key partner in the
2003 Dairying and Clean Streams Accord.
Involving all the regional councils and the Ministries
for the Environment, and Agriculture and Forestry, the
accord’s purpose was to promote sustainable dairy
farming in New Zealand.
“It focuses on reducing the impacts of dairying on the
quality of New Zealand streams, rivers, lakes, ground
water and wetlands,” said the accord blurb.26
But it wasn’t exactly a tight contract.
The glossy brochure setting out the project’s aims
warned the accord was not legally binding on the
parties nor on Fonterra’s shareholders and “in no way
restricts any person in the exercise of any power or
discretion under any statute”.
While the accord said a particular goal was to have
water "that is suitable, where appropriate, for fish,
drinking by stock, and swimming (in areas defined by regional councils)”, its principles were hedged about with constraints, such as stipulating that actions had to be cost-effective, practical in the context of existing farming operations, and clearly recognise the “practical and financial constraints to implementation timeframes”.
It would be reviewed annually. The initial annual reports were positive, but as the agreement reached the latter stages of its intended decade, critics wrote it off as ineffective in terms of getting farmers to fence and plant stream banks.
On March 11, 2009, a statement by the country’s largest independent conservation organisation, Forest & Bird, was scathing: “The Accord is supposed to monitor the impact of agriculture on New Zealand’s
S

Ch 9, Clearing the Water – Dairying, March 5, 2014 – By Jim Tucker
waterways, but its annual ‘snapshot report’ issued today contains numerous inaccuracies, Forest & Bird Advocacy Manager Kevin Hackwell says.”27
He said figures released to Forest & Bird under the
Official Information Act showed that nationally more
than 1200 dairy farms were in serious non-compliance
with their consents for effluent discharge, “however
the report uses just 750 farms to calculate the national
average.
“Another example of the mistakes behind this year’s
data is that it claims Southland lost more
than 100 dairy farms between 2006/07
and 2007/08.
“This conflicts with Environment
Southland figures showing that the
number of dairy farms in the region has
been steadily increasing every year.”
Even if the figures in the report could be
relied on, they made alarming reading,
said Hackwell.
“While there are four regions where
serious non-compliance with consents
is less than 2% [Taranaki was one of
them] there are another four regions
(Northland, Horizons, Wellington and
Canterbury) where serious non-
compliance is 20% or more.
“In Wellington the level of serious non-compliance
has risen from last year’s publically reported 2% to a
staggering 28% reported this year.”28
More than two years later, in December, 2011, another
outspoken monitor of the accord, Fish and Game NZ,
questioned the credibility of the latest Fonterra Accord
“snapshot report”, saying numbers did not match
statistics released by one of the accord’s own partners,
the Ministry of Agriculture and Forestry.29
The snapshot said 84% of farmers were keeping stock
out of waterways, but F&G chief executive Bryce
Johnson said MAF’s independent audit showed only
half that number achieved 100% exclusion.
“Given the extent to which the Accord achievements
have been talked up in the past, this latest revelation
raises questions about the accuracy of all the other
performance targets reported to the New Zealand
public, politicians and the government’s Land and
Water Forum,” said Johnson.
Fonterra’s general manager milk supply, Steve
Murphy, conceded there was more work to be done,
saying the results were mixed.
“Overall, it highlights that a lot of progress has been
made by farmers but, ultimately, we recognise that
there is still more that needs to be done.” Fonterra was
taking a lead “…requiring our suppliers to have
remaining waterways fenced off by the end of 2013 at
the latest. This will be a condition of supply.”
In his 2009 criticism, Forest & Bird’s Hackwell
claimed a major factor in ongoing freshwater
degradation was poor enforcement by regional
councils in some of the poorly performing regions.
Did that apply to Taranaki?
It’s clear from reading all the reports over the years of the accord that Taranaki was among the leading regional councils, if not the clear leader, when it came to getting farmers to co-operate with its push for fencing, planting, crossings and nutrient budgets.
In fact, it could be argued the accord was irrelevant in the province because of progress already made with the TRC riparian project, under way for a decade before the accord gathered any pace.
As reported in Chapter 2, by 2013 more than 1769
(99%) of Taranaki dairy farms had active or
completed riparian fencing/planting plans.30
In the year to June 30, 2013, TRC prepared a further
68 riparian management plans covering 565km of
stream bank, taking the total to 2463 plans covering
13,549 kilometres of stream banks.31
With about half the potentially suitable stream banks
already having fences and vegetation, new fencing
under the council’s riparian project increased the
enclosures by another 21% (2882km), and planting by
11% (1463km).
In total, three-quarters of the Taranaki dairy farm river
banks were fenced and nearly two thirds (63%) of
banks needing protection from vegetation were
planted by the middle of 2013. The deadline for
fencing was the end of 2013 and for planting, the end
of 2015.
iven the poor performance in many other
regions, something had to be done about the
Clean Streams Accord, whether or not it was
still relevant to Taranaki.
G

Ch 9, Clearing the Water – Dairying, March 5, 2014 – By Jim Tucker
Further motivation for the accord partners to contemplate improvements came from the Government.
Mindful of New Zealand’s declining international
reputation for pristine rivers and a clean, green
environment, in 2009 it set up a new round of
consultation, the Land and Water Forum.
This involved 68 organisations, including five river
iwi, conservation and recreation groups, and
agriculture, hydro and other development
organisations.32
Under the heading Good
management practice - recent
action, the forum’s first report
in 2010 said the dairy sector
was committed to “audited self-
management”, with initial
targets set through the dairying
and clean streams accord.33
Nothing was said about
progress under the accord, other
than a rather vague comment
that “virtually all dairy farmers
now have nutrient budgets to
inform fertiliser use”.
The latter was somewhat
nullified by the section on
fertiliser use, which said the
aim was to have half the
farmers actually implementing their nutrient
management plan by 2012, rising to 100% in 2016.
Having noted that point source pollution was now
much less significant, the report addressed the
intransigent nutrient runoff problem with the vague
statement that the dairy sector “is now collaborating
with stakeholders to proactively negotiate specific
targets for action on nutrient levels in particularly
nutrient-sensitive catchments”.
It said there was now a code of practice and design standards for dairy effluent management, and Fonterra was encouraging good practice by offering one-on-one advice to suppliers, as well as making milk pay-out deductions of between $1500 and $3000 for those
who transgressed.
The status of Taranaki as a region setting the standard
emerged in a comment that the sector “continues to
advocate for the ‘Taranaki model’ of encouraging
riparian planting in other dairying regions, whereby
the regional council prepares riparian management
plans and provides native plants at cost price to
implement the plan.
“The dairy sector will work with regional councils to
prioritise universal stock exclusion including
investigating regulatory instruments.”
Fonterra had recently introduced annual appraisals of
suppliers’ effluent infrastructure and would be
implementing effluent improvement plans "for those
who need them. Sanctions for failing to comply with
such a plan will include non-pick-up of milk.”
It also proposed a new scheme to
give farmers merit payments if they
addressed “the full suite of on-farm
water issues (that is, effluent
management, nutrient management
and water efficiency)”.
So how has all that worked out?
There was no specific mention of
dairy farmers in the Land and Water
Forum’s second and third reports,
which appeared in 2012, since they
concentrated on recommendations
to the government for broad
national water quality standards and
ways to standardise the role of
regional councils.
One way to find out is to ask
Fonterra: in response to a series of
written questions in 2013, the company advised that
only one dairy farmer in the country had had his milk
collection stopped through lack of action on effluent
management.
The company said it preferred to work with farmers
“and put an environmental plan in place to help them
to make the required changes”.34
On the issue of keeping stock out of waterways, the
company said there had been some confusion about
what needed to be fenced.
“We are now really clear on this and it is part of every
farmer’s annual farm dairy and environmental
assessment, and our conditions of supply require all
Accord-type waterways to be fenced by the end of this
year (2013).”
Fonterra said it also supported the TRC’s own stock exclusion programme: “It has been developed specifically for the priorities in the Taranaki region, and goes further by including planting in its implementation.
Ch 9, Clearing the Water – Dairying, March 5, 2014 – By Jim Tucker
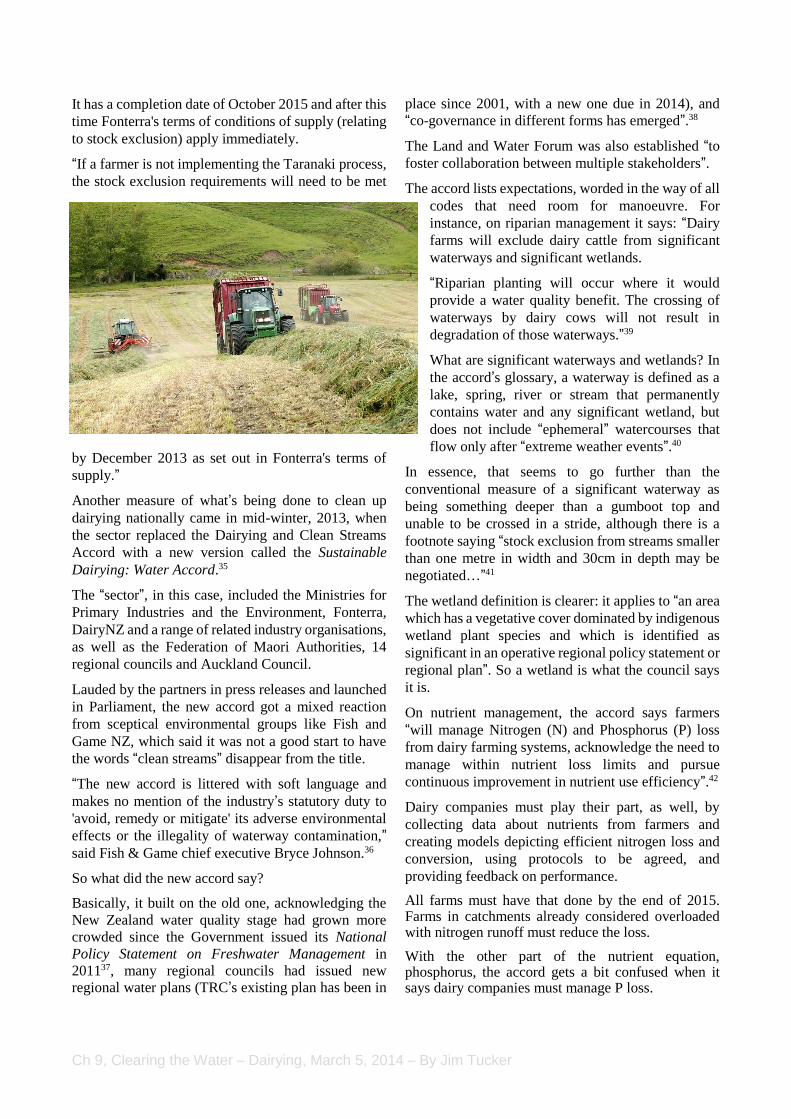
It has a completion date of October 2015 and after this
time Fonterra's terms of conditions of supply (relating
to stock exclusion) apply immediately.
“If a farmer is not implementing the Taranaki process,
the stock exclusion requirements will need to be met
by December 2013 as set out in Fonterra's terms of
supply.”
Another measure of what’s being done to clean up
dairying nationally came in mid-winter, 2013, when
the sector replaced the Dairying and Clean Streams
Accord with a new version called the Sustainable
Dairying: Water Accord.35
The “sector”, in this case, included the Ministries for
Primary Industries and the Environment, Fonterra,
DairyNZ and a range of related industry organisations,
as well as the Federation of Maori Authorities, 14
regional councils and Auckland Council.
Lauded by the partners in press releases and launched
in Parliament, the new accord got a mixed reaction
from sceptical environmental groups like Fish and
Game NZ, which said it was not a good start to have
the words “clean streams” disappear from the title.
“The new accord is littered with soft language and
makes no mention of the industry’s statutory duty to
'avoid, remedy or mitigate' its adverse environmental
effects or the illegality of waterway contamination,”
said Fish & Game chief executive Bryce Johnson.36
So what did the new accord say?
Basically, it built on the old one, acknowledging the
New Zealand water quality stage had grown more
crowded since the Government issued its National
Policy Statement on Freshwater Management in
201137, many regional councils had issued new
regional water plans (TRC’s existing plan has been in
place since 2001, with a new one due in 2014), and
“co-governance in different forms has emerged”.38
The Land and Water Forum was also established “to
foster collaboration between multiple stakeholders”.
The accord lists expectations, worded in the way of all
codes that need room for manoeuvre. For
instance, on riparian management it says: “Dairy
farms will exclude dairy cattle from significant
waterways and significant wetlands.
“Riparian planting will occur where it would
provide a water quality benefit. The crossing of
waterways by dairy cows will not result in
degradation of those waterways.”39
What are significant waterways and wetlands? In
the accord’s glossary, a waterway is defined as a
lake, spring, river or stream that permanently
contains water and any significant wetland, but
does not include “ephemeral” watercourses that
flow only after “extreme weather events”.40
In essence, that seems to go further than the
conventional measure of a significant waterway as
being something deeper than a gumboot top and
unable to be crossed in a stride, although there is a
footnote saying “stock exclusion from streams smaller
than one metre in width and 30cm in depth may be
negotiated…”41
The wetland definition is clearer: it applies to “an area
which has a vegetative cover dominated by indigenous
wetland plant species and which is identified as
significant in an operative regional policy statement or
regional plan”. So a wetland is what the council says
it is.
On nutrient management, the accord says farmers
“will manage Nitrogen (N) and Phosphorus (P) loss
from dairy farming systems, acknowledge the need to
manage within nutrient loss limits and pursue
continuous improvement in nutrient use efficiency”.42
Dairy companies must play their part, as well, by
collecting data about nutrients from farmers and
creating models depicting efficient nitrogen loss and
conversion, using protocols to be agreed, and
providing feedback on performance.
All farms must have that done by the end of 2015. Farms in catchments already considered overloaded with nitrogen runoff must reduce the loss.
With the other part of the nutrient equation, phosphorus, the accord gets a bit confused when it says dairy companies must manage P loss.

Ch 9, Clearing the Water – Dairying, March 5, 2014 – By Jim Tucker
Presumably, it meant to say farmers must do that by
meeting stock exclusion commitments by May 31,
2017; putting bridges or culverts over all waterways
crossed by cattle by May 31, 2018; meeting riparian
planting commitments by May 31, 2030; properly
managing tracks, races and winter cropping (no
deadline), and meeting effluent management
commitments (no deadline).
The section on effluent management is perhaps
weakest because while it promises all dairy
farms will be assessed for compliance by May
31, 2014, the all-important question over
discharges to streams by two-pond treatment
systems is only vaguely addressed.
It says where land application (spraying or
draining the contents of the second pond back
onto pastures) would “result in improved water
quality outcomes”, farmers will need to
introduce such an approach by May 31, 2014.
Given that more than 800 Taranaki dairy farms
still have consents to discharge to waterways,
this is an important factor in the region.
Do such discharges harm the streams? Between
2000 and 2002 – when 60% (1180) of the
province’s dairy farms used treatment pond
discharges to waterways - TRC studied 10 such farms
in the upper stretches of various Ring Plain streams.43
The results, not published until 2006, confirmed the
council’s freshwater plan rules for such systems were
working.
The rules (about to be revised in the new draft plan
due in 2014) stipulate a dilution rate of one litre of
effluent to 100 litres of stream water; that downstream
concentrations of toxic un-ionised ammonia44 cannot
exceed 0.025 gm per cubic metre of water beyond a
mixing zone determined by the council; biochemical
oxygen demand has to be less than 2.0 gm per cubic
metre beyond the zone; and that “the discharger shall
at all times adopt the best practicable option to prevent
or minimise any adverse effects on any water body”.
The study found some interesting variations, including
strong indications that even ponds too small for the
number of cows on a farm could produce an
acceptable result, and that riparian planting had a big
impact on the health of waterways below
discharge points.
It was also clear the larger the pond system,
the better the result, with the reverse also
being obvious. The diagram above illustrated
such findings.45
The report took no account of the cumulative
effects of multiple discharges along the
length of a stream46, so in 2008 TRC decided
to find out more by studying a single farm
that had consent to discharge pond effluent
into the Tuikonga Stream, a waterway that
arises in farmland on the lower south-eastern
slopes of Mt Taranaki.47
(The Tuikonga featured in a news report in 2013 after
a farm severely polluted one of its tributaries, resulting
in a TRC prosecution and a $63,000 fine imposed by
the Environment Court48).
The study aimed to establish how long it took a typical
Ring Plain stream to recover from a two-pond
treatment system.
About 450 metres or “somewhat less” was the
conclusion: “Overall, there was effective attenuation
IMAGE: TRC
Ch 9, Clearing the Water – Dairying, March 5, 2014 – By Jim Tucker
within 120 metres for ammonia and DRP (dissolved
reactive phosphorus), significant attenuation within
120 metres and effective attenuation within 450m
for BOD (biochemical oxygen demand) and
faecal coliforms, and effective attenuation
within 1.55 kilometres for TP (total
phosphorous) and nitrate.”
So, depending on the size of the waterway,
and the gap between farm discharges, and
whether the ponds were properly operated, it
was reasonable to conclude farms could
discharge into a stream all the way down to
the sea.
Another important finding of this study was it
confirmed without any doubt that riparian
planting improved river water quality
significantly, affirming the council’s long-
term commitment to driving its planting and
fencing programme.
It also found that whenever there is heavy
rainfall, river pollution counts go much higher than
those from a standard pond discharge.
hether these studies were enough to affirm the TRC’s long-standing approach of allowing pond discharge to continue was another matter, however.
Other factors – such as diffuse runoff from farm paddocks - and other agencies were at play, including a 2009 study by the Ministry for the Environment of 14 dairy farm catchments monitored between 2001 and 2007, one of them the Waiokura, which runs past Manaia in South Taranaki.49
The study described the Waiokura catchment as warm, wet, volcanic, pastoral lowland, 99% dairy farming (17 farms, 4352 cows at 3.4 per hectare), and doused with 1634 millimetres of rain a year (New Plymouth gets 1432mm a year, North Egmont 8000).
The catchment did not score well for cattle-sourced bacteria levels: “Three catchments – Waiokura, Inchbonnie and Washpool – had median E. coli concentrations in excess of the Action level of 550 per 100 mL…
“…This is indicative of an unacceptable health risk, although it should be noted that activities such as swimming are not known (by council staff) to occur in the streams in these catchments.”50
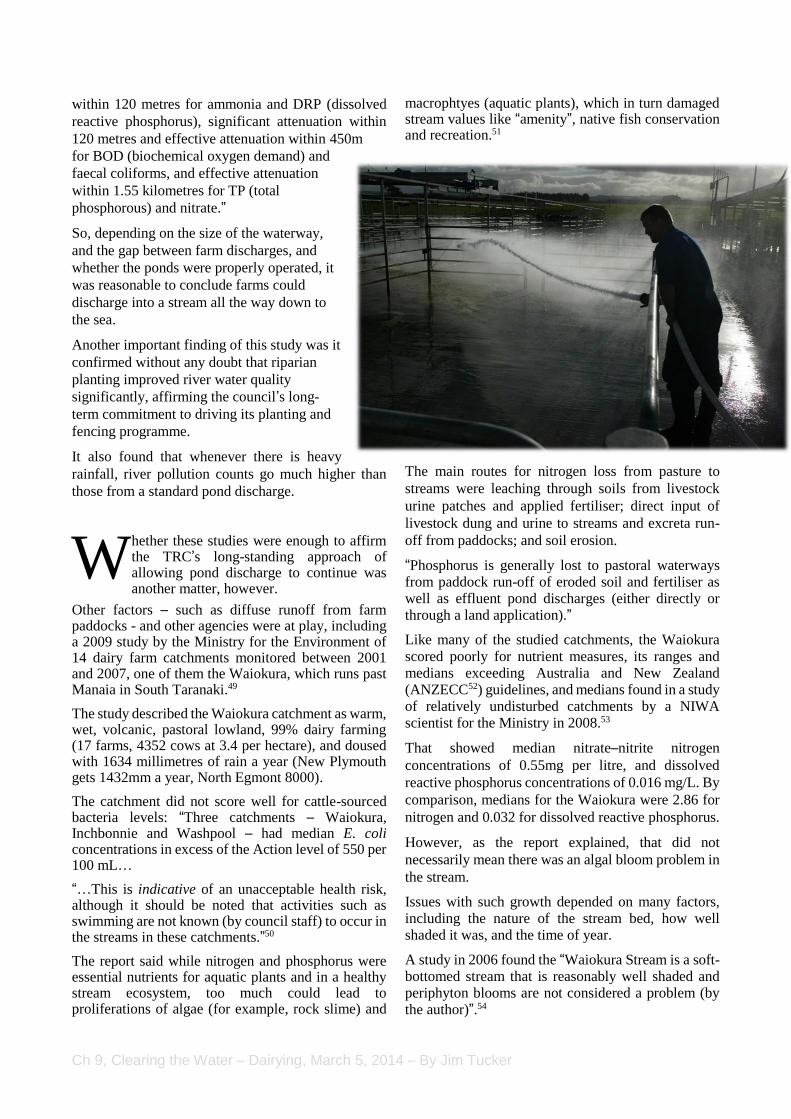
The report said while nitrogen and phosphorus were essential nutrients for aquatic plants and in a healthy stream ecosystem, too much could lead to proliferations of algae (for example, rock slime) and
macrophtyes (aquatic plants), which in turn damaged stream values like “amenity”, native fish conservation and recreation.51
The main routes for nitrogen loss from pasture to
streams were leaching through soils from livestock
urine patches and applied fertiliser; direct input of
livestock dung and urine to streams and excreta run-
off from paddocks; and soil erosion.
“Phosphorus is generally lost to pastoral waterways from paddock run-off of eroded soil and fertiliser as well as effluent pond discharges (either directly or through a land application).”
Like many of the studied catchments, the Waiokura
scored poorly for nutrient measures, its ranges and medians exceeding Australia and New Zealand (ANZECC52) guidelines, and medians found in a study of relatively undisturbed catchments by a NIWA scientist for the Ministry in 2008.53
That showed median nitrate–nitrite nitrogen
concentrations of 0.55mg per litre, and dissolved
reactive phosphorus concentrations of 0.016 mg/L. By
comparison, medians for the Waiokura were 2.86 for
nitrogen and 0.032 for dissolved reactive phosphorus.
However, as the report explained, that did not
necessarily mean there was an algal bloom problem in
the stream.
Issues with such growth depended on many factors, including the nature of the stream bed, how well shaded it was, and the time of year.
A study in 2006 found the “Waiokura Stream is a soft-bottomed stream that is reasonably well shaded and periphyton blooms are not considered a problem (by the author)”.54
W
Ch 9, Clearing the Water – Dairying, March 5, 2014 – By Jim Tucker
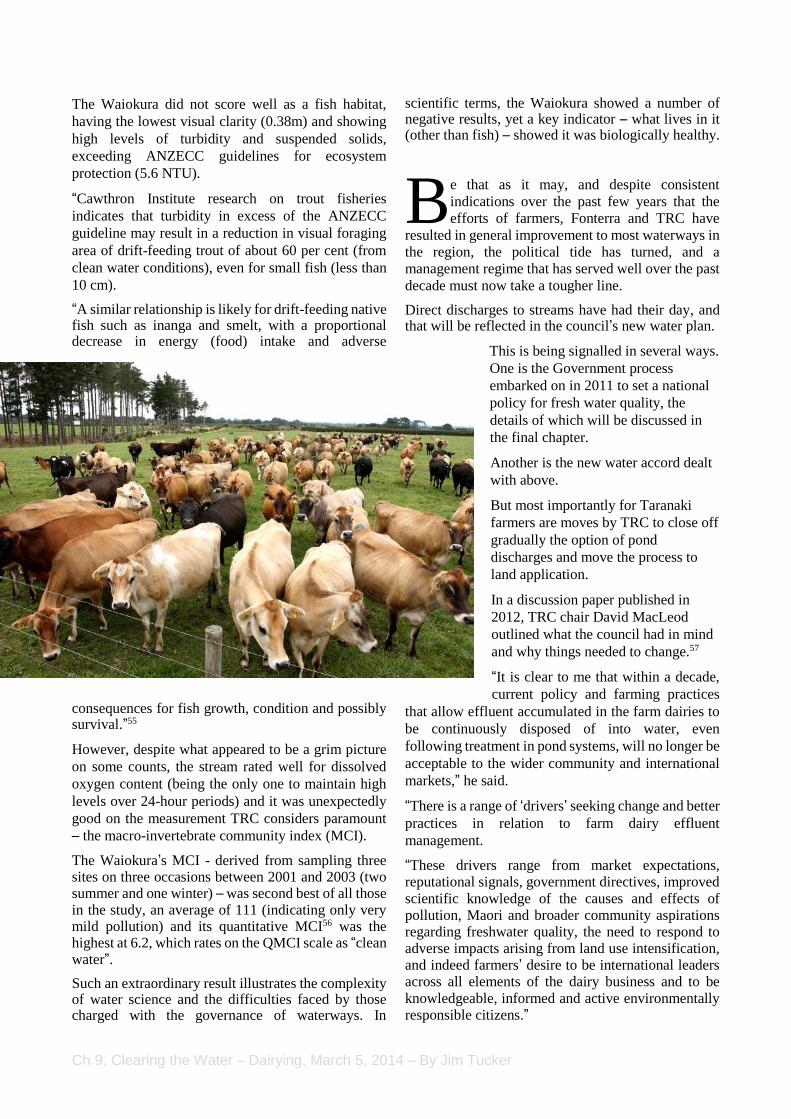
The Waiokura did not score well as a fish habitat,
having the lowest visual clarity (0.38m) and showing
high levels of turbidity and suspended solids,
exceeding ANZECC guidelines for ecosystem
protection (5.6 NTU).
“Cawthron Institute research on trout fisheries
indicates that turbidity in excess of the ANZECC
guideline may result in a reduction in visual foraging
area of drift-feeding trout of about 60 per cent (from
clean water conditions), even for small fish (less than
10 cm).
“A similar relationship is likely for drift-feeding native fish such as inanga and smelt, with a proportional decrease in energy (food) intake and adverse
consequences for fish growth, condition and possibly survival.”55
However, despite what appeared to be a grim picture
on some counts, the stream rated well for dissolved
oxygen content (being the only one to maintain high
levels over 24-hour periods) and it was unexpectedly
good on the measurement TRC considers paramount
– the macro-invertebrate community index (MCI).
The Waiokura’s MCI - derived from sampling three sites on three occasions between 2001 and 2003 (two summer and one winter) – was second best of all those in the study, an average of 111 (indicating only very mild pollution) and its quantitative MCI56 was the highest at 6.2, which rates on the QMCI scale as “clean water”.
Such an extraordinary result illustrates the complexity of water science and the difficulties faced by those charged with the governance of waterways. In
scientific terms, the Waiokura showed a number of negative results, yet a key indicator – what lives in it (other than fish) – showed it was biologically healthy.
e that as it may, and despite consistent
indications over the past few years that the
efforts of farmers, Fonterra and TRC have
resulted in general improvement to most waterways in
the region, the political tide has turned, and a
management regime that has served well over the past
decade must now take a tougher line.
Direct discharges to streams have had their day, and that will be reflected in the council’s new water plan.
This is being signalled in several ways.
One is the Government process
embarked on in 2011 to set a national
policy for fresh water quality, the
details of which will be discussed in
the final chapter.
Another is the new water accord dealt
with above.
But most importantly for Taranaki
farmers are moves by TRC to close off
gradually the option of pond
discharges and move the process to
land application.
In a discussion paper published in
2012, TRC chair David MacLeod
outlined what the council had in mind
and why things needed to change.57
“It is clear to me that within a decade,
current policy and farming practices
that allow effluent accumulated in the farm dairies to
be continuously disposed of into water, even
following treatment in pond systems, will no longer be
acceptable to the wider community and international
markets,” he said.
“There is a range of ‘drivers’ seeking change and better
practices in relation to farm dairy effluent
management.
“These drivers range from market expectations, reputational signals, government directives, improved
scientific knowledge of the causes and effects of pollution, Maori and broader community aspirations regarding freshwater quality, the need to respond to adverse impacts arising from land use intensification, and indeed farmers’ desire to be international leaders across all elements of the dairy business and to be
knowledgeable, informed and active environmentally responsible citizens.”
B
Ch 9, Clearing the Water – Dairying, March 5, 2014 – By Jim Tucker
The paper’s recommendations included:
Stopping continuous farm dairy treatment pond
discharges to water. Instead, all farm dairy
effluent management systems must be a land
treatment or dual discharge system.
Allowing pond discharges to water in
periods when water flows are high. At other
times of the year the effluent must be
discharged to land.
Requiring land treatment systems to have
adequately sized and lined holding ponds.
Improving the environmental performance
of treatment and holding ponds.
Encouraging on-farm waste minimisation
and water conservation practices.
Requiring feed pad effluent to be managed
as part of the farm dairy effluent system.
Allowing pond discharges to continue when rivers are
running high seems at first glance to be a let-off for
farmers, but it makes sense in terms of the yet-to-be-
fully-resolved problem of pasture runoff: spraying
nutrient-rich pond effluent onto paddocks in wet
weather is asking for trouble, while Taranaki’s Ring
Plain streams are renowned for their ability to flush
out after heavy rainfall.
That this overall approach now seems inevitable was
signalled in late 2013: a newspaper advertising
supplement in the Taranaki Daily News quoted TRC
director of resource management, Fred McLay, saying
that aside from environmental gains, there were
financial and physical benefits from using dairy
effluent to irrigate and nourish pasture.58
“It’s a smarter solution for the environment, but it’s
also smarter for the farmer. The forward-looking
farmer sees effluent as a resource that can be managed
efficiently and profitably rather than as a waste
product that needs to be treated and disposed of into
waterways.”
How long will it take? And what will it cost?
The year 2030 is the furthest deadline recommended
in the new dairying accord, and the next version of
TRC’s fresh water plan will last until about the same
time.
The cost is difficult to assess because already 55% of
Taranaki dairy farms don’t use pond discharges, and
two thirds have completed riparian planting, which
will still be essential to ameliorate the effects of
runoff.
A clue to how much expenditures is still needed came
in November, 2013, when Taranaki dairy farmer and
Fonterra Shareholders Council member Nick Barrett
told Taranaki Daily News farming reporter Sue
O’Dowd that about $15 million had already been spent
on riparian planting and fencing in the province, and
another $60 million would be needed to complete that
and install effluent storage and spreading systems.59
That’s about $35,000 for every herd, although such an
average is misleading, since some farmers will have
more to do than others.
Can they afford it?
A record milk payout was due in 2013-14, but as
farmer spokespeople were quick to point out, the
average extra $60,000 in expected income would
likely have to balance out the previous year’s drought
impact.
Removing effluent discharges will go a long way to
assuaging public unease about so-called dirty
dairying, and comparisons with other regions make it
clear that Taranaki is already ahead of the game.
As Nick Barrett said: "Most other regions are only now having the arguments that we had in Taranaki more than 10 years ago about why waterways should be planted.
“The Taranaki Regional Council model of having one-
on-one conversations with farmers works far better than any rules."
With discharges about to go, that still leaves the vexed question of runoff.
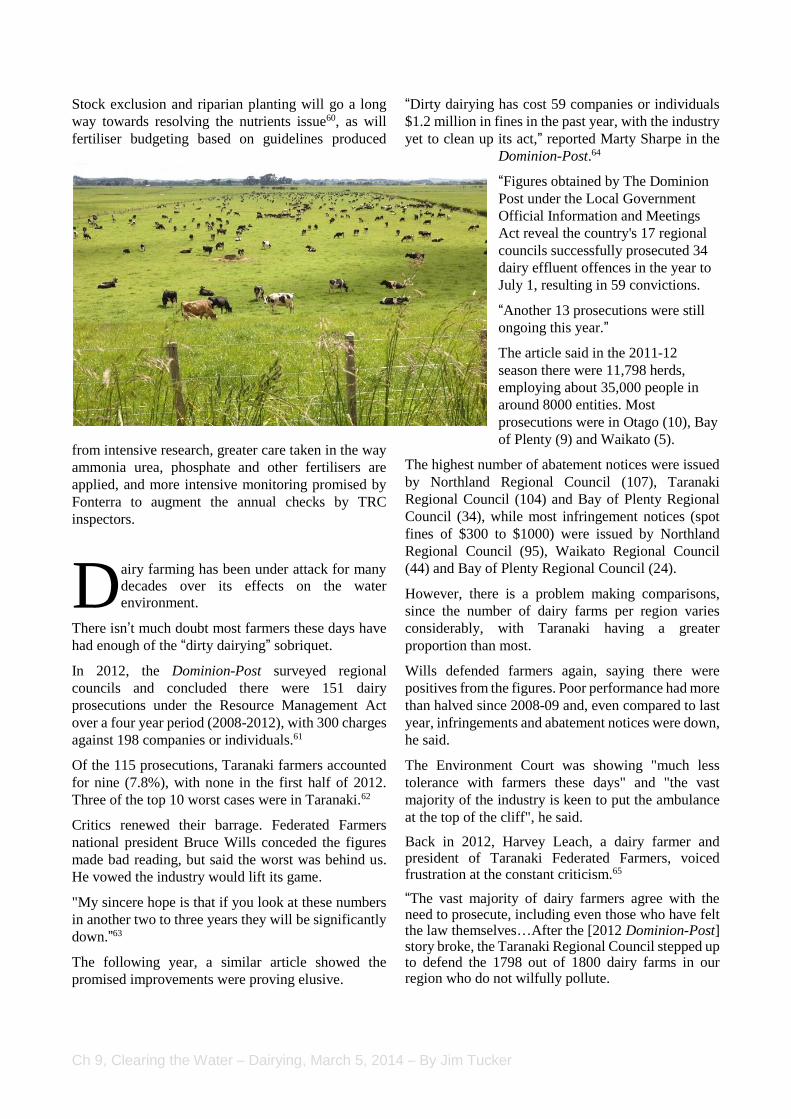
As dairy herds intensify, farmers continue the practice of confining cows to small areas of farms on a
rotational basis, and the demand grows for ever-higher yields from pastures, the remaining problem of diffuse pollution by nutrients will become the last focus in a lengthy campaign to save the rivers.
Ch 9, Clearing the Water – Dairying, March 5, 2014 – By Jim Tucker
Stock exclusion and riparian planting will go a long
way towards resolving the nutrients issue60, as will
fertiliser budgeting based on guidelines produced
from intensive research, greater care taken in the way
ammonia urea, phosphate and other fertilisers are
applied, and more intensive monitoring promised by
Fonterra to augment the annual checks by TRC
inspectors.
airy farming has been under attack for many
decades over its effects on the water
environment.
There isn’t much doubt most farmers these days have
had enough of the “dirty dairying” sobriquet.
In 2012, the Dominion-Post surveyed regional
councils and concluded there were 151 dairy
prosecutions under the Resource Management Act
over a four year period (2008-2012), with 300 charges
against 198 companies or individuals.61
Of the 115 prosecutions, Taranaki farmers accounted
for nine (7.8%), with none in the first half of 2012.
Three of the top 10 worst cases were in Taranaki.62
Critics renewed their barrage. Federated Farmers
national president Bruce Wills conceded the figures
made bad reading, but said the worst was behind us.
He vowed the industry would lift its game.
"My sincere hope is that if you look at these numbers
in another two to three years they will be significantly
down.”63
The following year, a similar article showed the
promised improvements were proving elusive.
“Dirty dairying has cost 59 companies or individuals
$1.2 million in fines in the past year, with the industry
yet to clean up its act,” reported Marty Sharpe in the
Dominion-Post.64
“Figures obtained by The Dominion
Post under the Local Government
Official Information and Meetings
Act reveal the country's 17 regional
councils successfully prosecuted 34
dairy effluent offences in the year to
July 1, resulting in 59 convictions.
“Another 13 prosecutions were still
ongoing this year.”
The article said in the 2011-12
season there were 11,798 herds,
employing about 35,000 people in
around 8000 entities. Most
prosecutions were in Otago (10), Bay
of Plenty (9) and Waikato (5).
The highest number of abatement notices were issued
by Northland Regional Council (107), Taranaki
Regional Council (104) and Bay of Plenty Regional
Council (34), while most infringement notices (spot
fines of $300 to $1000) were issued by Northland
Regional Council (95), Waikato Regional Council
(44) and Bay of Plenty Regional Council (24).
However, there is a problem making comparisons,
since the number of dairy farms per region varies
considerably, with Taranaki having a greater
proportion than most.
Wills defended farmers again, saying there were
positives from the figures. Poor performance had more
than halved since 2008-09 and, even compared to last
year, infringements and abatement notices were down,
he said.
The Environment Court was showing "much less
tolerance with farmers these days" and "the vast
majority of the industry is keen to put the ambulance
at the top of the cliff", he said.
Back in 2012, Harvey Leach, a dairy farmer and president of Taranaki Federated Farmers, voiced frustration at the constant criticism.65
“The vast majority of dairy farmers agree with the need to prosecute, including even those who have felt the law themselves…After the [2012 Dominion-Post] story broke, the Taranaki Regional Council stepped up to defend the 1798 out of 1800 dairy farms in our region who do not wilfully pollute.
D
Ch 9, Clearing the Water – Dairying, March 5, 2014 – By Jim Tucker
“It is true there have been 300 charges levelled against
198 companies or individuals over four years, but it
needs a context.
“This starts with providing a scale because over four
years New Zealand's 11,750 dairy herds would have
clocked up some 1176 milking days for a collective
total of 13.8 million milking days. That's a lot.
“These herds directly employ 35,000 individuals, with
a further 10,000 estimated to be self-employed. With
around 45,000 people in our industry and as a dairy
farmer myself, I resent the notion I am only as good as
those 198 companies or individuals prosecuted over
four years. Another way to report things is that over
four years, 44,802 out of 45,000 individuals were not
prosecuted.
“Like everyone else in the federation I would dearly love dairy prosecutions to be zero. I would also love to see a zero road toll and zero crime too, but I guess humans are not all perfect and farmers are no exception.
“This doesn't stop us from trying to farm better and the public deserves to know what we are actually doing and achieving.”
Recent statistics may show the number of prosecutions in Taranaki is low by national standards, but need to be considered in the context of the high rate in the early 1990s. Critics may take that as a sign TRC is not doing its job, but there are more likely explanations.
One is that the council has been working steadily on the problem since 1970, achieving 100% coverage with consents by 1992, which meant every farm was monitored regularly from that time.
It also takes the approach that it’s better to get farmers’ co-operation than hit them with a stick. The stick is reserved for those few who take advantage.
Another factor to consider is that dirty dairying in Taranaki is on the decline after so many years of
monitoring, advising and cajoling. That is supported
by the latest TRC state of the environment reports,
which will be discussed in the last chapter.
There are still occasional problems with visible dairy
pollution, but the council finds it more productive to
use all its enforcement tools - warnings, abatement
notices, infringement notices and instant fines – before
resorting to prosecutions, a conclusion that can be
drawn from the comparatively high number of such
notices it issues each year.
Nobody is getting off lightly, if Farmer Andy’s
experience is anything to go by. And some industry
observers believe it’s time to give dairy farmers a
break.
One such is Dominion-Post farming editor Jon
Morgan, a veteran journalist with nearly half a century
of experience, some in Taranaki. Morgan wrote:
“…dairy farmers…now know how much environmental
damage their cows have caused. And they know how
badly urban New Zealand thinks of that. In many
people's minds - to judge from recent comments on
NZFarmer's web page - they sit at the top of the
villainy charts…
“But now it's time to lay off the booing. I believe we
should now be applauding dairy farmers for the good
work they are doing, and have promised to do, to lift
their game. They deserve it, and, anyway,
encouragement works better than constant criticism.
“Under the new dairy accord, they will keep cows from
streams wider than a stride, as well as lakes, drains,
springs and significant wetlands.
‘As these waterways are fenced off, a strip of plants
will go in designed to reduce phosphorous and
nitrogen leaching.
“At the same time, regional councils are setting
leaching limits and keeping a close eye on their
farmers. Take away the environmental concerns and
dairy farming is a highly admirable career…”66
Andy would agree with that.

Ch 9, Clearing the Water – Dairying, March 5, 2014 – By Jim Tucker
NOTES
1 Two-pond treatment systems have been used by most Taranaki dairy farms since the early failure of spray irrigation systems in the mid- to late-1970s. With this approach, the first pond has no oxygen in the liquid (hence the name “anaerobic”) and is full of bacteria that break down harmful microbes; it also settles out sediment. The first pond drains into the second, which is shallower, has oxygen and uses aerobic bacteria, sunlight and wind action to further reduce microbes.
Farms with more than 250 cows need to use more than one aerobic pond, and some also use a third treatment wetland to reduce nutrient (for example, nitrogen and phosphorus) content in the effluent. Until recent times, regional council rules allowed farmers to discharge the clarified and 90%-bacteria free liquid from second ponds into a waterway, but new national water quality rules being established by the Government and gradually being enforced by regional councils and Fonterra mean the days of allowing that are numbered. Farmers will have to distribute the second pond discharge back onto the land, where it acts as a useful fertiliser.
2 The average personal GDP for Taranaki’s population of about 108,000 fluctuated around $75,000 between 2008 and 2010, compared with the national average of about $43,000.From Statistics NZ website accessed November 18, 2013: http://www.stats.govt.nz/searchresults.aspx?q=gross%20domestic%20product%20Taranaki
3 Davy, Edwin, and Robert Gillingham, March 17, 1847, A report of an exploring expedition from New Plymouth, through the New Zealand Company's settlement, over part of the middle range, commonly called Batu-wa to Mount Egmont. From: National Library of NZ: Papers relating to provincial affairs - Taranaki. Inspector of police, Reference Number MS-Papers-0032-0123 (71 digitised items), Series 7 Official papers, Reference Number Series 7 Official papers (3737 digitised items), McLean Papers, Reference Number MS-Group-1551 (30238 digitised items).
4 Cowan, James, 1956, Chapter 6: “Chute's Taranaki Campaign” in The New Zealand Wars: A History of the Maori Campaigns and the Pioneering Period: Volume II: The Hauhau Wars, 1864–72. R. E. Owen, Wellington.
5 Messenger, William, Diary - 1853-1858. Held at Puke Ariki Museum, New Plymouth.
6 Bradshaw, John, 1888, New Zealand of To-Day – 1884-1887, Sampson Low, Marston, Searle & Rivington, London.
7 Winder, Virginia, 2003, “Chew Chong plays leading role in dairy industry”, Taranaki Stories, Puke Ariki website, New Plymouth.
8 Dunedin (Ship), Wikipedia, accessed October 26, 2013.
9 About NZ Dairy industry, DCANZ – Dairy Companies Association of NZ website, accessed October 26, 2013.
10 Taranaki Regional Council, 2007, Fonterra Whareroa Compliance Monitoring Programme Annual Report, 2005-2006, p3.
11 Ibid, P24: “Up until 1997, the wastewater from the factory was discharged over the cliff into the reef communities surrounding the outfall. Fat coated the surrounding rocks and rock pools, and filamentous bacterial growths were dominant. This was until 1997, when a new outfall extending 1845 m offshore was commissioned. Following the commissioning of the outfall an improvement in the ecological diversity and abundance of the intertidal communities has resulted.”
These provide a snapshot of the size of the enterprise. The 2005-2006 report (ibid) said 56 road tankers operated from the Whareroa site, collecting milk from about 2400 suppliers in the surrounding area.12 Each day, as many as four milk trains delivered up to 3.2 million litres of milk to the site from the lower North Island. The factory site manufactured milk powder, cheese, casein, whey protein concentrates and cream products. It had a laboratory, tanker depot, co-generation electricity plant, a water treatment plant, a rail sliding and seven hectares of dry and cool storage.
13 Ibid, P46.
14 Ibid, P22.
15 Ibid, P25.
16 Ibid, P32.
17 Taranaki Regional Council, 2008, Fonterra Whareroa Compliance Monitoring Programme Annual Report, 2006-2007.
18 Taranaki Regional Council, 2009, Fonterra Whareroa Compliance Monitoring Programme Annual Report, 2007-2008.
19 Taranaki Regional Council, 2010, Fonterra Whareroa Compliance Monitoring Programme Annual Report 2008-2009, P67.
Ch 9, Clearing the Water – Dairying, March 5, 2014 – By Jim Tucker
20 Taranaki Regional Council, 2011, Fonterra Whareroa Compliance Monitoring Programme Annual Report, 2009-2010.
21 Taranaki Regional Council, 2013, “Executive Summary”, Fonterra Whareroa Compliance Monitoring Programme Annual Report, 2011-2012.
22 Ewing, Isobel, October 30, 2013, “Mud contaminates Fonterra tankers”, Stuff.co.nz/Taranaki Daily News: http://www.stuff.co.nz/business/farming/dairy/9344271/Mud-contaminates-Fonterra-tankers
23 Taranaki Regional Council, 2008, Fonterra Kapuni Air and Water Monitoring Programme Annual Report 2006-2007, P51
24 Ibid, P52.
25 Taranaki Regional Council, 2013, Hongihongi and Herekawe Streams Joint Monitoring Programme Annual Report 2011-2012.
26 Dairying and Clean Streams Accord, May 26, 2003, P1.
27 Hackwell, Kevin, March 11, 2009, “Clean Streams snapshot out of focus”, media release, Forest & Bird, Wellington.
28 To put that in context, the region has only about 50 dairy farms.
29 Clean Streams Accord report prompts F&G flak, December 13, 2011, Rural News.co.nz, Wellington. The news report quoted MAF as saying: “…the Accord report is a snapshot showing a mixed bag of progress towards improved fresh water quality. Like last year, two out of five of the Accord's targets were met, while some progress was made towards remaining targets. Full compliance with regional council dairy effluent rules and consent conditions increased from 65% in 2009/10 to 69% in 2010/11. Significant non-compliance also improved, down from 16% to 11%, but MAF says this remains a concern and a major focus of collaborative efforts. A target of 90% of regular stock crossing points for dairy cattle to have bridges and culverts by 2012 is exceeded with 99% achieved. Councils that have identified and monitored fencing of their "Regionally Significant Wetlands" remains at 2009/10 levels, though the three which haven’t are in the process of doing so. Nutrient budgets are in place on 99% of farms and 46% have taken this a step further with nutrient management plans.
30 Chapter 2: “…nearly 100% of all farms with waterways deeper than a gumboot have a council-prepared plan for riparian planting, plans that cover 10,800 kilometres of stream banks, of which 61% are now protected by fencing and 56% by vegetation (in 2001 it was 40%). Most farms have built culverts and bridges to keep cattle out of streams when they have to be moved.”
31 Taranaki Regional Council, 2013, “Executive Summary”, Sustainable land management and plant supply Annual report 2012/2013.
32 Details at http://www.landandwater.org.nz/
33 Land and Water Forum, September, 2010, Report of the Land and Water Forum: A Fresh Start for Fresh Water, P28.
34 Pers. comm, July 29, 2013.
35 DairyNZ, July 8, 2013, Sustainable Dairying: Water Accord: http://www.dairynz.co.nz/page/pageid/2145866853?resourceId=790
36 Fish and Game New Zealand press release, July 9, 2013, “Dairy Accord no longer 'Clean Streams'”, Scoop.co.nz: “Mr Johnson commends the commitment to riparian buffer zone management – something environment advocates have wanted for some time – but points out that industry has ‘fumbled’ the timeframes for implementation, some of which extend out to 2030, even though this issue has been around for years. On basic stock exclusion from waterways, this has been on the table for more than a decade now – the public should not have to wait another four years. And why is it going to take six years to produce ‘guidelines’ for riparian management? …Fish & Game is especially concerned that the new accord still fails to address the plight of small streams, completely ignoring waterways that aren’t ‘wider than a metre and deeper than 30cm’. Small streams are critically important as breeding and rearing habitat for both indigenous and valued introduced freshwater fish species, and any pollution reaching these water bodies flows into and despoils larger river systems anyway, says Mr Johnson. Cows must be kept out of these smaller streams and riparian buffer zones created to absorb some of the run-off – instead the accord essentially sanctions turning them into farm drains. On the positive side, Fish & Game says it is good that the new accord formalises the position on conversions – they must comply from the outset– and similarly for offsite grazing, which is also being brought into the frame. But while the new accord recognises the need to manage both nitrogen and phosphorus, it’s worrying that there doesn’t seem to be any clear commitment to implementation and achievement of designated environmental bottom lines. This is the industry’s most significant environmental issue and yet in an accord supposedly demonstrating environmental credibility it hasn’t been adequately addressed. There’s lots of ‘measuring’ and ‘modelling’ mentioned but no solid commitment to actual targets or stocking rate limitations. What’s more, the accord’s stated aim of acknowledging ‘the need to manage within nutrient loss limits’ is completely at odds with what DairyNZ chief executive Tim Mackle is saying publically to farmers: ‘Nationwide limits
Ch 9, Clearing the Water – Dairying, March 5, 2014 – By Jim Tucker
around nitrogen had to be avoided at all costs.’ Why is the dairy industry telling farmers one thing and the New Zealand public something different? asks Mr Johnson. Fish & Game considers that for the public to have any confidence that the sector is serious about reducing its adverse impact on waterways, any accord must be underpinned by strong and clear enforcement measures. A good start would be establishing it as a condition of supply in all dairy company supplier contracts. Simply ‘not picking up the milk’ is a totally inadequate response, says Mr Johnson. To avoid the environmental impact of non-complying suppliers dumping milk, it would be far better to collect it but withhold payment, which then becomes an accumulating incentive for them to meet the accord requirements. Fish & Game also notes its disappointment that there is no reference to public reporting of achievement against accord targets, particularly given the recent Horizons Poll indicating 75% of New Zealanders highlighted water quality of our lakes and rivers being the primary environmental concern.”
37 Ministry for the Environment, 2011, National Policy Statement for Freshwater Management 2011: The National Policy Statement (NPS) for Freshwater Management 2011 came into effect on 1 July 2011 as part of the Fresh Start for Fresh Water package of reforms announced by the Government in May 2011. From 1 July 2011, decision-makers under the Resource Management Act (RMA) must have regard to the NPS in consenting decisions. The RMA requires local authorities to amend regional policy statements, proposed regional policy statements, plans, proposed plans, and variations to give effect to any provision in an NPS that affects those documents. The freshwater NPS will help drive national consistency in local RMA planning and decision-making while allowing for an appropriate level of regional flexibility. This will support improved freshwater management in New Zealand. The NPS sets in place some important ingredients of a strengthened limits-based regime for water management and helps clarify the regulatory framework for the reform package as a whole. http://www.mfe.govt.nz/rma/central/nps/freshwater-management.html, accessed November 20, 2013.
38 P4, Sustainable Dairying: Water Accord.
39 Ibid, P 6.
40 Ibid, P15.
41 Ibid, P6.
42 Ibid, P8.
43 Taranaki Regional Council, October 2006, Dairy shed oxidation pond discharges in Taranaki: a study and discussion of oxidation pond performance, management and environmental effects.
44 Ammonia exists in water in two forms, un-ionised ammonia (NH3) and the ammonium ion (NH4+); the relative proportion of the total ammonia pool in these different fractions depends on pH, temperature and salinity. Un-ionised ammonia is generally regarded as being most toxic to fish and other aquatic animals. www.aqualex.org.
45 Ibid, P5.
46 Ibid, P1, “Executive Summary”.
47 Taranaki Regional Council, November, 2008, The assimilation and dilution of dairy shed effluent pond discharges in Taranaki, A study and discussion of in-stream environmental effects below a treatment pond system discharge.
48 Keith, Leighton, November 6, 2013, “Record fine for farm effluent”, Taranaki Daily News/Stuff.co.nz.
49 Ministry for the Environment, July, 2009, Water Quality in Selected Dairy Farming Catchments: A baseline to support future water-quality trend assessments.
50 Ibid, P24.
51 Ibid, P25.
52 Australian and New Zealand Guidelines for Fresh and Marine Water Quality, known in New Zealand as the “ANZECC guidelines”. See Ministry for the Environment at http://www.mfe.govt.nz/publications/water/anzecc-water-quality-guide-02/revision-water-quality.html: “These guidelines are a key resource for managing water quality and protecting aquatic ecosystems in Australia and New Zealand.” A review was begun in 2006. MfE Water Quality in Selected Dairy Farming Catchments: A baseline to support future water-quality trend assessments, July, 2009: “Arguably, both the periphyton and ANZECC guidelines could be considered environmentally conservative for highly modified dairy catchments. However, in the absence of more appropriate reference data for these modified systems, both guidelines still provide useful contexts for the data in this report.”
53 Scarsbrook M. 2008, An Assessment of Regional Council Water Quality Data (1996-2002) in Support of National State of Environment Reporting (ENZ07), prepared for the Ministry for the Environment. Hamilton: NIWA.
54 Water Quality in Selected Dairy Farming Catchments: A baseline to support future water-quality trend assessments P31.
55 Ibid, P39.

Ch 9, Clearing the Water – Dairying, March 5, 2014 – By Jim Tucker
56 QMCI is one of the measures of biotic richness in a waterway. For a full explanation, go to the Ministry for the Environment website at: http://www.mfe.govt.nz/publications/water/mci-user-guide-may07/html/page2.3.html
57 Taranaki Regional Council, June, 2012, Future directions for the management of farm dairy effluent: Review of the Regional Fresh Water Plan for Taranaki, draft paper.
58 Supplied TRC article, November 21, 2013, “Dairy effluent – a resource not to be wasted”, Taranaki Daily News/Stuff.co.nz.
59 O’Dowd, Sue, November 11, 2013, “Taranaki 'leads way' in green farming practices”, Taranaki Daily News/Stuff.co.nz.
60 Research shows it is not the complete answer. Some nutrients leach into groundwater before they get as far as the riparian zone, and from there may progress as far as waterways, which get some of their water from underground. However, TRC studies have accumulated a strong case showing that stock exclusion, riparian planting and the provision of shade above streams does prevent excessive algal growth fed by nutrients.
61 Sharpe, Marty, June 5, 2012, “Dirty dairying laid bare”, Dominion-Post/Stuff.co.nz. “Environment Court-imposed fines collected from offending parties totalled at least $3,260,825. A further 13 individuals have received community work sentences totalling 1650 hours. Two received sentences of community detention of three and six months. For lesser offences involving dairy effluent discharges, councils have issued 1698 abatement notices and 1564 infringement notices. Abatement notices require someone to stop any activity that contravenes the Resource Management Act, a resource consent or a council plan. Infringement notices impose an instant fine of $300 to $1000. Prosecutions are taken only in the most serious cases, after councils have weighed various factors, including the actual and potential effects of the discharge, whether it was deliberate, the attitude of the offender, profits made from the offending and the efforts made to clean up or remedy after the discharge. Usually 90 per cent of any fine imposed will go to the prosecuting council. The highest fine was $120,000 handed down to Potae and van der Poel Ltd on eight charges of discharging effluent to land and water on three separate farms in 2010. The company was prosecuted by West Coast Regional Council.”
62 $62,000 - (reduced from $70,000 on appeal) Terence Yates on three charges of discharging effluent to land or water, sentenced February, 2010; $60,000 - Murray Andrews on two charges of discharging effluent and silage leachate to land and water, sentenced July, 2009; $60,000 - Trevor Jane on four charges of discharging effluent to land and water, sentenced August, 2008. From Sharpe (2012).
63 Sharpe, June 5, 2012, “Farming leader offers `sincere hope' that dirty dairying will decline”, Dominion-Post/Stuff.co.nz.
64 Sharpe, August 17, 2013, “Dairy industry yet to clean up its act”, Dominion-Post/Stuff.co.nz.
65 Leach, Harvey, June 18, 2012, “Perspective on dairy polluters”, Taranaki Daily News/Stuff.co.nz.
66 Morgan, Jon, August 29, 2013, “It's time to stop booing our dairy farmers”, Stuff/NZFarmer.co.nz. http://www.stuff.co.nz/business/farming/dairy/9100277/Its-time-to-stop-booing-our-dairy-farmers