Embed Size (px)
Citation preview

PAGE 1
How Delivery and Brand/Sales Effectiveness Can Drive Digital Advertising ROI in a Cross-Media World


ABOUT / PAGE 04
INTRODUCTION / PAGE 05
DELIVERY / PAGE 09
NON-HUMAN TRAFFIC (NHT)VALIDATION (VIEWABLE IMPRESSIONS) AUDIENCES HUMAN GRPCROSS-MEDIA REACH
BRAND/SALES & ROI EFFECT / PAGE 19
BRAND EFFECTCROSS-MEDIA BRAND EFFECTSALES EFFECTCROSS-MEDIA SALES EFFECT
PUTTING IT ALL TOGETHER / PAGE 25
CONCLUSION / PAGE 27
PAGE 4
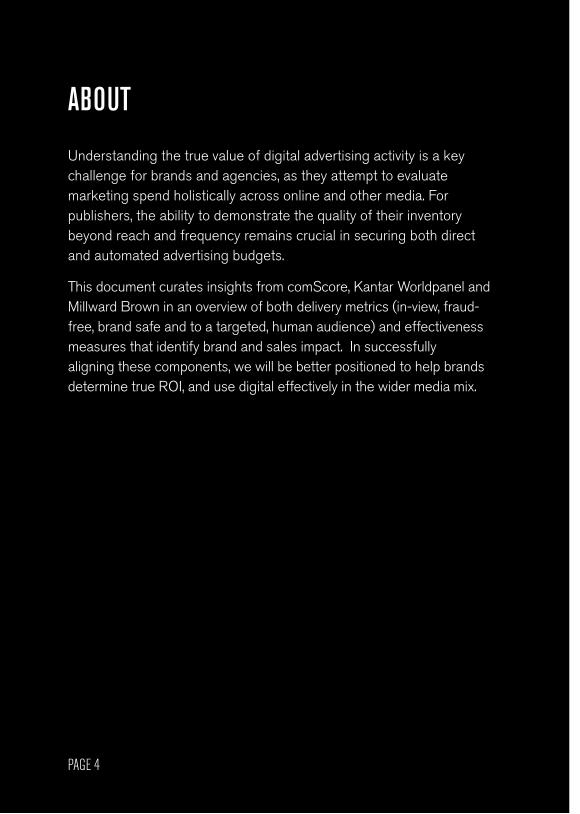
ABOUTUnderstanding the true value of digital advertising activity is a key challenge for brands and agencies, as they attempt to evaluate marketing spend holistically across online and other media. For publishers, the ability to demonstrate the quality of their inventory beyond reach and frequency remains crucial in securing both direct and automated advertising budgets.
This document curates insights from comScore, Kantar Worldpanel and Millward Brown in an overview of both delivery metrics (in-view, fraud-free, brand safe and to a targeted, human audience) and effectiveness measures that identify brand and sales impact. In successfully aligning these components, we will be better positioned to help brands determine true ROI, and use digital effectively in the wider media mix.
PAGE 5
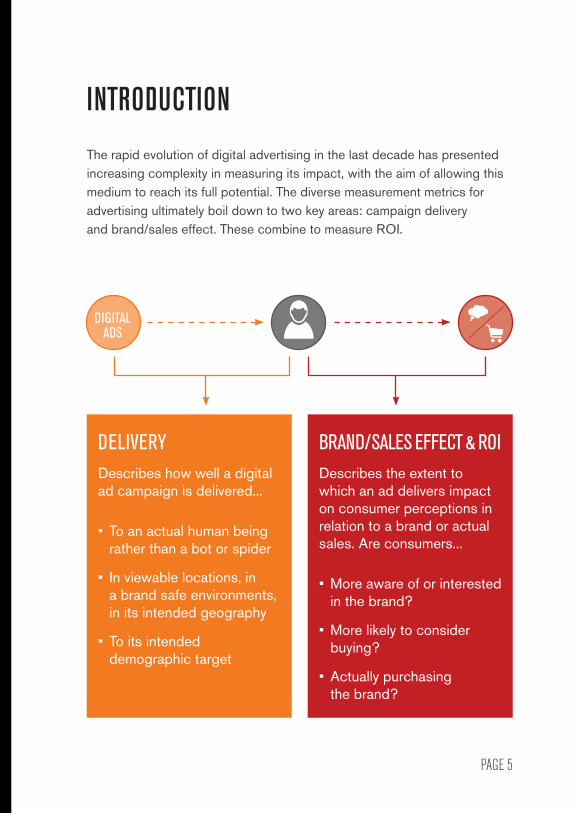
INTRODUCTIONThe rapid evolution of digital advertising in the last decade has presented increasing complexity in measuring its impact, with the aim of allowing this medium to reach its full potential. The diverse measurement metrics for advertising ultimately boil down to two key areas: campaign delivery and brand/sales effect. These combine to measure ROI.
DELIVERY Describes how well a digital ad campaign is delivered...
• To an actual human being rather than a bot or spider
• In viewable locations, in a brand safe environments, in its intended geography
• To its intended demographic target
BRAND/SALES EFFECT & ROI Describes the extent to which an ad delivers impact on consumer perceptions in relation to a brand or actual sales. Are consumers...
• More aware of or interested in the brand?
• More likely to consider buying?
• Actually purchasing the brand?
DIGITAL ADS
PAGE 6
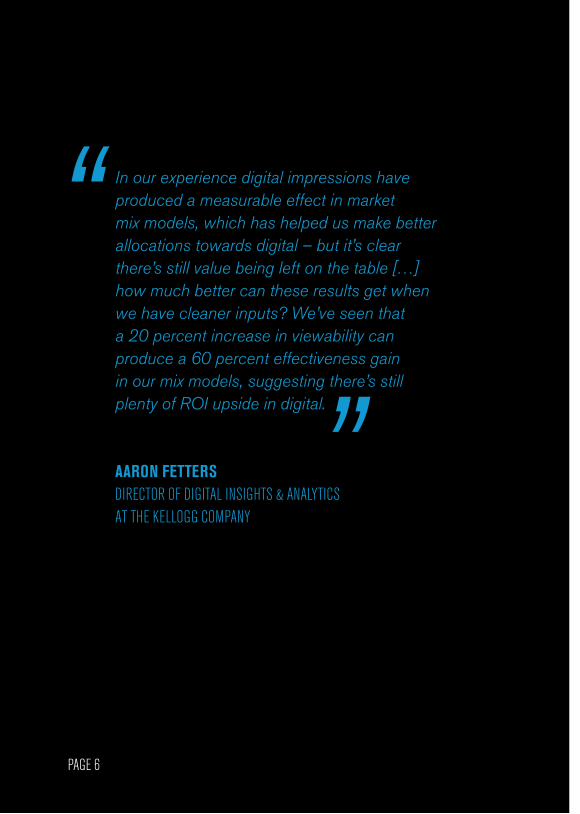
In our experience digital impressions have produced a measurable effect in market mix models, which has helped us make better allocations towards digital – but it’s clear there’s still value being left on the table […] how much better can these results get when we have cleaner inputs? We’ve seen that a 20 percent increase in viewability can produce a 60 percent effectiveness gain in our mix models, suggesting there’s still plenty of ROI upside in digital.
AARON FETTERS DIRECTOR OF DIGITAL INSIGHTS & ANALYTICS AT THE KELLOGG COMPANY
“
”
PAGE 7
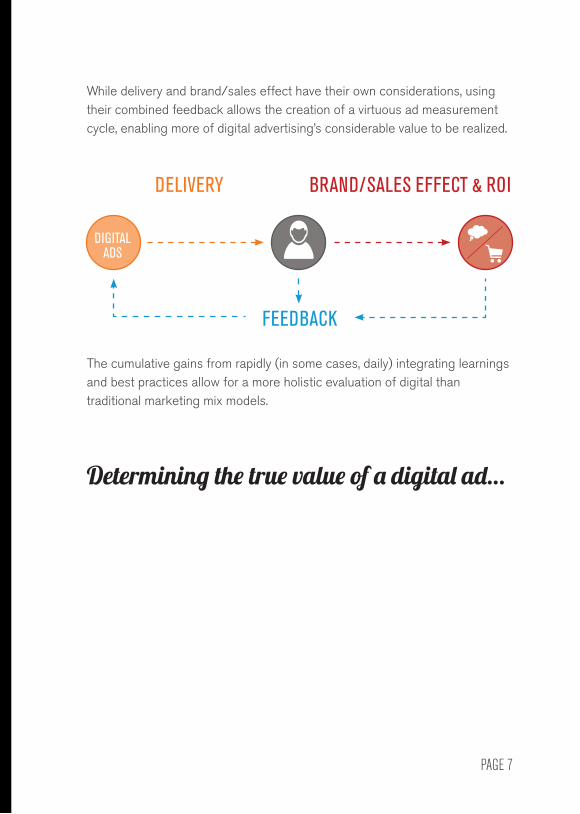
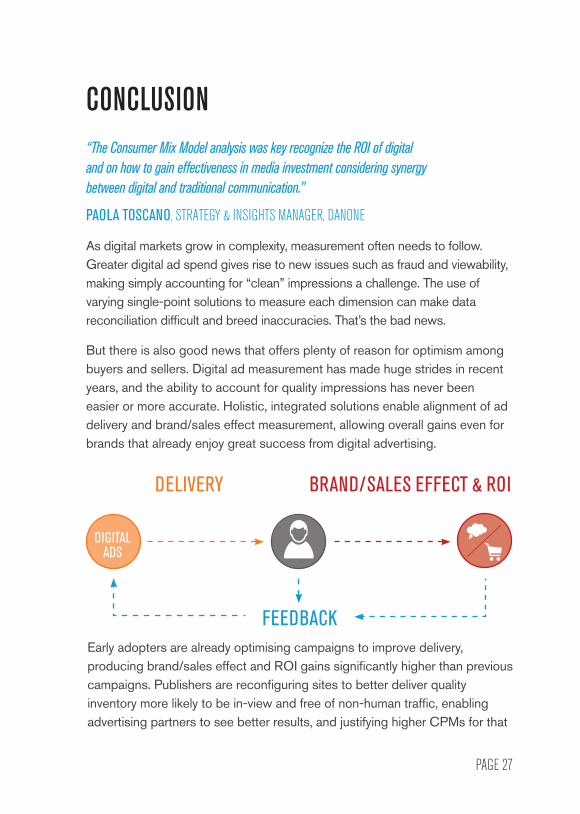
While delivery and brand/sales effect have their own considerations, using their combined feedback allows the creation of a virtuous ad measurement cycle, enabling more of digital advertising’s considerable value to be realized.
The cumulative gains from rapidly (in some cases, daily) integrating learnings and best practices allow for a more holistic evaluation of digital than traditional marketing mix models.
DELIVERY
FEEDBACK
BRAND/SALES EFFECT & ROI
DIGITAL ADS
Determining the true value of a digital ad…

PAGE 9
DELIVERY BRAND/SALES EFFECT & ROI
DIGITAL ADS
DIGITAL ADS
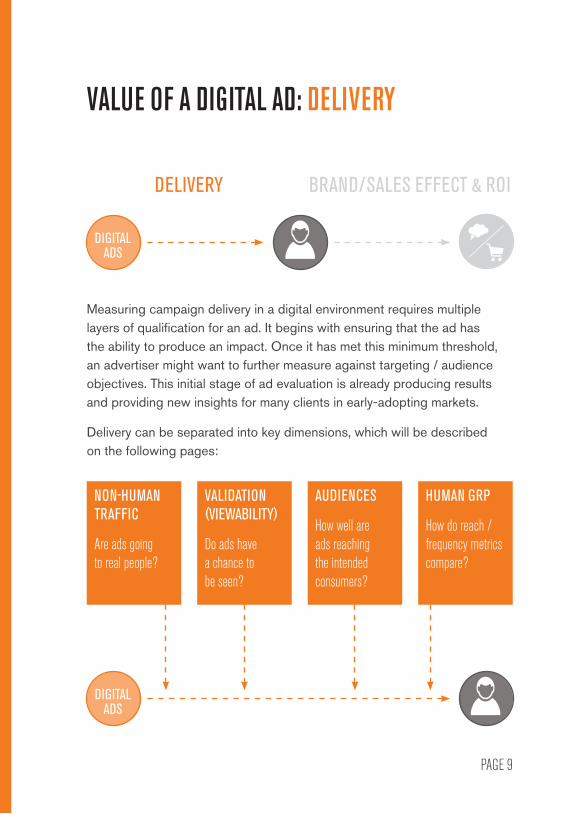
VALUE OF A DIGITAL AD: DELIVERY
Measuring campaign delivery in a digital environment requires multiple layers of qualification for an ad. It begins with ensuring that the ad has the ability to produce an impact. Once it has met this minimum threshold, an advertiser might want to further measure against targeting / audience objectives. This initial stage of ad evaluation is already producing results and providing new insights for many clients in early-adopting markets.
Delivery can be separated into key dimensions, which will be described on the following pages:
NON-HUMAN TRAFFIC
Are ads going to real people?
AUDIENCES
How well are ads reaching the intended consumers?
VALIDATION (VIEWABILITY)
Do ads have a chance to be seen?
HUMAN GRP
How do reach / frequency metrics compare?
PAGE 10
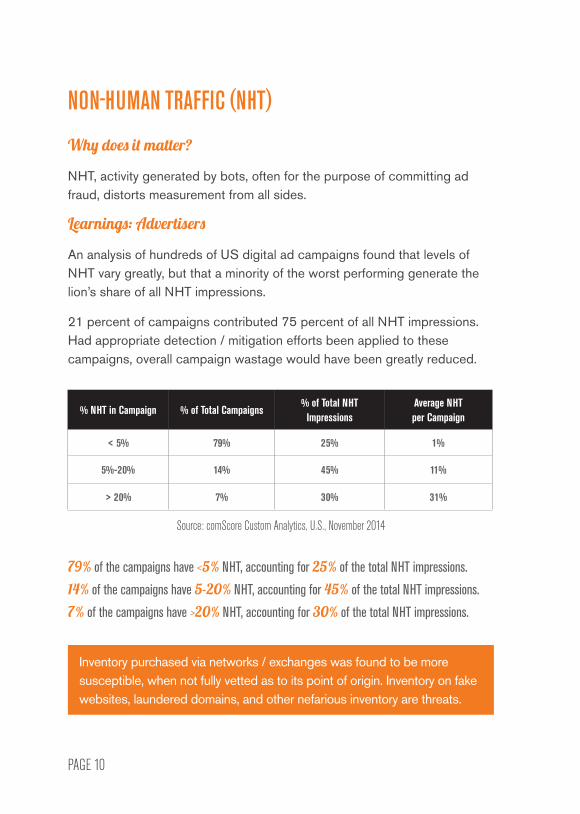
NON-HUMAN TRAFFIC (NHT)
Why does it matter?
NHT, activity generated by bots, often for the purpose of committing ad fraud, distorts measurement from all sides.
Learnings: Advertisers
An analysis of hundreds of US digital ad campaigns found that levels of NHT vary greatly, but that a minority of the worst performing generate the lion’s share of all NHT impressions.
21 percent of campaigns contributed 75 percent of all NHT impressions. Had appropriate detection / mitigation efforts been applied to these campaigns, overall campaign wastage would have been greatly reduced.
Inventory purchased via networks / exchanges was found to be more susceptible, when not fully vetted as to its point of origin. Inventory on fake websites, laundered domains, and other nefarious inventory are threats.
% NHT in Campaign % of Total Campaigns% of Total NHT
ImpressionsAverage NHT per Campaign
< 5% 79% 25% 1%
5%-20% 14% 45% 11%
> 20% 7% 30% 31%
Source: comScore Custom Analytics, U.S., November 2014
79% of the campaigns have <5% NHT, accounting for 25% of the total NHT impressions.14% of the campaigns have 5-20% NHT, accounting for 45% of the total NHT impressions.7% of the campaigns have >20% NHT, accounting for 30% of the total NHT impressions.
PAGE 11
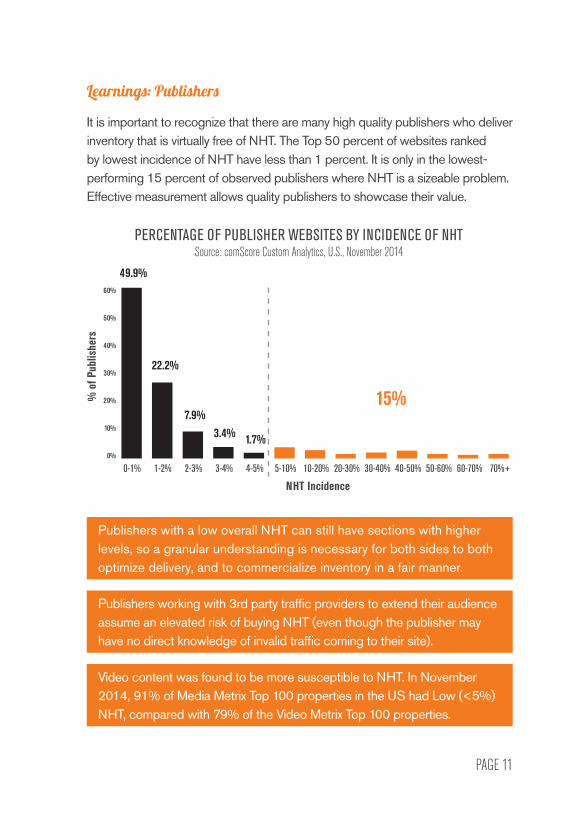
Learnings: Publishers
It is important to recognize that there are many high quality publishers who deliver inventory that is virtually free of NHT. The Top 50 percent of websites ranked by lowest incidence of NHT have less than 1 percent. It is only in the lowest-performing 15 percent of observed publishers where NHT is a sizeable problem. Effective measurement allows quality publishers to showcase their value.
Publishers with a low overall NHT can still have sections with higher levels, so a granular understanding is necessary for both sides to both optimize delivery, and to commercialize inventory in a fair manner.
Publishers working with 3rd party traffic providers to extend their audience assume an elevated risk of buying NHT (even though the publisher may have no direct knowledge of invalid traffic coming to their site).
Video content was found to be more susceptible to NHT. In November 2014, 91% of Media Metrix Top 100 properties in the US had Low (<5%) NHT, compared with 79% of the Video Metrix Top 100 properties.
PERCENTAGE OF PUBLISHER WEBSITES BY INCIDENCE OF NHTSource: comScore Custom Analytics, U.S., November 2014
% o
f Pub
lishe
rs
NHT Incidence
22.2%
49.9%
15%7.9%
3.4% 1.7%
60%
50%
40%
30%
20%
10%
0%
0-1% 1-2% 2-3% 3-4% 4-5% 5-10% 10-20% 20-30% 30-40% 40-50% 50-60% 60-70% 70%+
PAGE 12
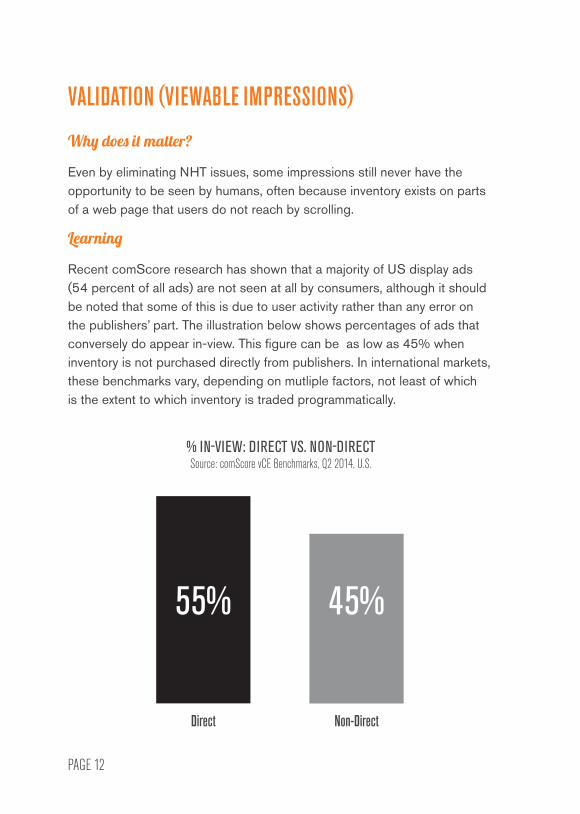
VALIDATION (VIEWABLE IMPRESSIONS)
Why does it matter?
Even by eliminating NHT issues, some impressions still never have the opportunity to be seen by humans, often because inventory exists on parts of a web page that users do not reach by scrolling.
Learning
Recent comScore research has shown that a majority of US display ads (54 percent of all ads) are not seen at all by consumers, although it should be noted that some of this is due to user activity rather than any error on the publishers’ part. The illustration below shows percentages of ads that conversely do appear in-view. This figure can be as low as 45% when inventory is not purchased directly from publishers. In international markets, these benchmarks vary, depending on mutliple factors, not least of which is the extent to which inventory is traded programmatically.
% IN-VIEW: DIRECT VS. NON-DIRECT Source: comScore vCE Benchmarks, Q2 2014, U.S.
Direct Non-Direct
55% 45%
PAGE 13
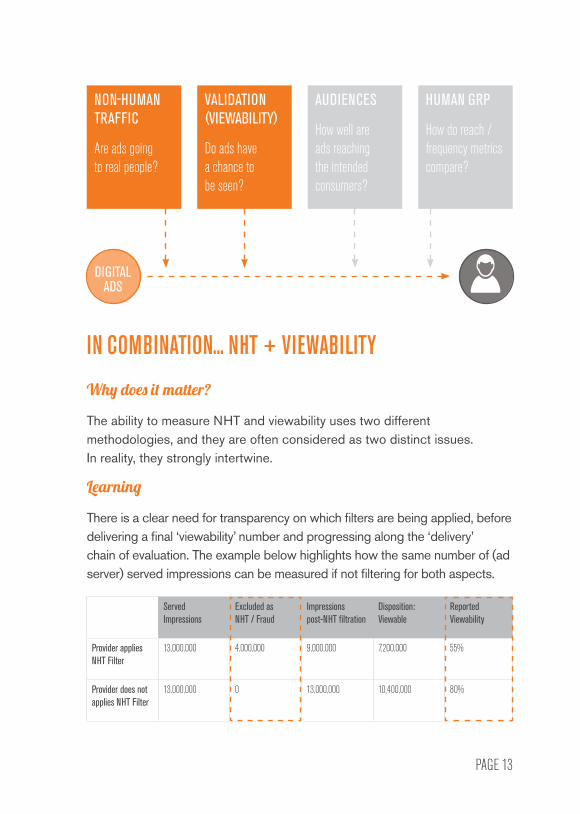
IN COMBINATION... NHT + VIEWABILITY
Why does it matter?
The ability to measure NHT and viewability uses two different methodologies, and they are often considered as two distinct issues. In reality, they strongly intertwine.
Learning
There is a clear need for transparency on which filters are being applied, before delivering a final ‘viewability’ number and progressing along the ‘delivery’ chain of evaluation. The example below highlights how the same number of (ad server) served impressions can be measured if not filtering for both aspects.
DIGITAL ADS
NON-HUMAN TRAFFIC
Are ads going to real people?
AUDIENCES
How well are ads reaching the intended consumers?
VALIDATION (VIEWABILITY)
Do ads have a chance to be seen?
HUMAN GRP
How do reach / frequency metrics compare?
Served Impressions
Excluded as NHT / Fraud
Impressions post-NHT filtration
Disposition: Viewable
Reported Viewability
Provider applies NHT Filter
13,000,000 4,000,000 9,000,000 7,200,000 55%
Provider does not applies NHT Filter
13,000,000 0 13,000,000 10,400,000 80%
PAGE 14
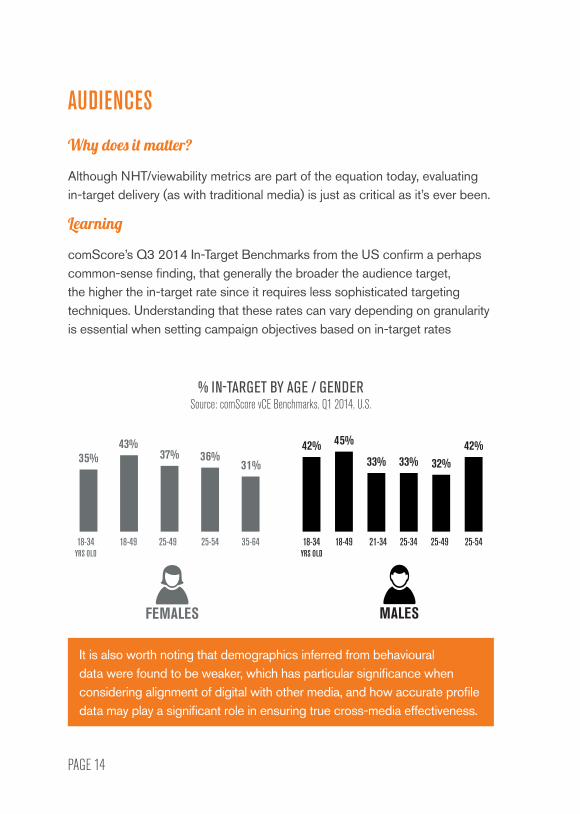
AUDIENCES
Why does it matter?
Although NHT/viewability metrics are part of the equation today, evaluating in-target delivery (as with traditional media) is just as critical as it’s ever been.
Learning
comScore’s Q3 2014 In-Target Benchmarks from the US confirm a perhaps common-sense finding, that generally the broader the audience target, the higher the in-target rate since it requires less sophisticated targeting techniques. Understanding that these rates can vary depending on granularity is essential when setting campaign objectives based on in-target rates
It is also worth noting that demographics inferred from behavioural data were found to be weaker, which has particular significance when considering alignment of digital with other media, and how accurate profile data may play a significant role in ensuring true cross-media effectiveness.
FEMALES
35%43%
37% 36%31%
42% 42%45%
33% 33% 32%
18-49 18-4918-34YRS OLD
18-34YRS OLD
25-54 25-3425-49 21-3435-64 25-49 25-54
MALES
% IN-TARGET BY AGE / GENDER Source: comScore vCE Benchmarks, Q1 2014, U.S.
PAGE 15
IN COMBINATION... AUDIENCES + VALIDATION
Why does it matter?
If these two factors are not measured by a unified, single tag, there is a tendency to apply a blanket viewability expectations to all demographics, over- or undervaluing subsequent activity.
Learning
Unified tagging approaches can directly measure the validated impressions to determine the viewability rate within each demographic individually, allowing for better optimisation of spend and ROI without over or undervaluing performance. The difference is illustrated in this case study for a US CPG advertiser.
DIGITAL ADS
NON-HUMAN TRAFFIC
Are ads going to real people?
AUDIENCES
How well are ads reaching the intended consumers?
VALIDATION (VIEWABILITY)
Do ads have a chance to be seen?
HUMAN GRP
How do reach / frequency metrics compare?
PAGE 16
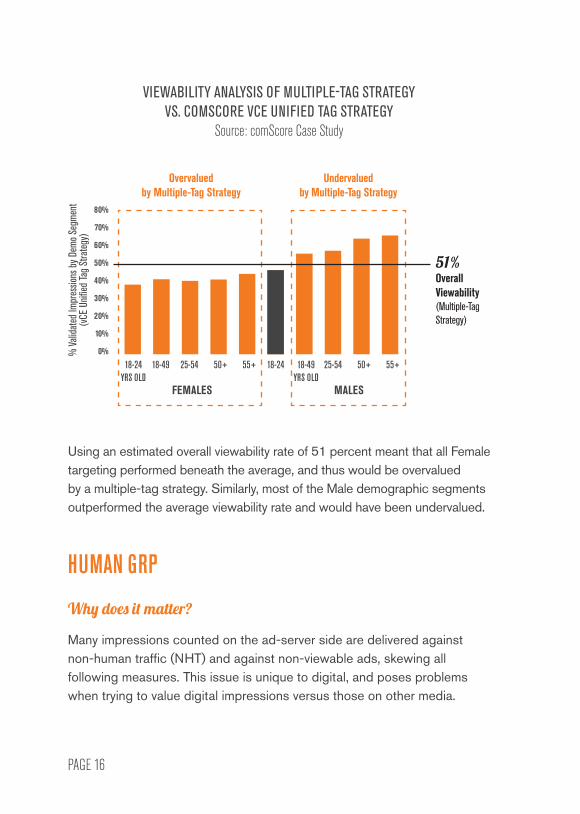
HUMAN GRP
Why does it matter?
Many impressions counted on the ad-server side are delivered against non-human traffic (NHT) and against non-viewable ads, skewing all following measures. This issue is unique to digital, and poses problems when trying to value digital impressions versus those on other media.
Using an estimated overall viewability rate of 51 percent meant that all Female targeting performed beneath the average, and thus would be overvalued by a multiple-tag strategy. Similarly, most of the Male demographic segments outperformed the average viewability rate and would have been undervalued.
51% Overall Viewability(Multiple-Tag Strategy)
% Va
lidate
d Imp
ressio
ns by
Dem
o Seg
ment
(v
CE U
nified
Tag S
trateg
y)VIEWABILITY ANALYSIS OF MULTIPLE-TAG STRATEGY
VS. COMSCORE VCE UNIFIED TAG STRATEGYSource: comScore Case Study
Overvalued by Multiple-Tag Strategy
Undervalued by Multiple-Tag Strategy
FEMALES MALES
18-49 18-49YRS OLD
18-24YRS OLD
18-2450+ 50+25-54 25-5455+ 55+
80%
70%
60%
50%
40%
30%
20%
10%
0%
PAGE 17
Learning
By applying the appropriate filters to qualify an impression against actual people, the ensuing metrics for reach and frequency are made infinitely more useful.
A Human GRP makes digital truly cross-media comparable for planning and evaluation alongside TV and other media that are based on ads delivered with the ‘opportunity-to-see’ against human eyeballs.
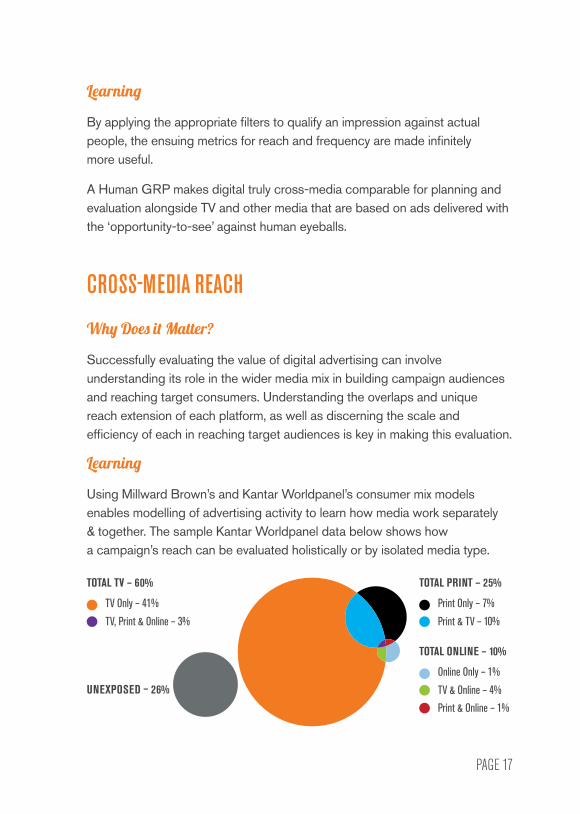
CROSS-MEDIA REACH
Why Does it Matter?
Successfully evaluating the value of digital advertising can involve understanding its role in the wider media mix in building campaign audiences and reaching target consumers. Understanding the overlaps and unique reach extension of each platform, as well as discerning the scale and efficiency of each in reaching target audiences is key in making this evaluation.
Learning
Using Millward Brown’s and Kantar Worldpanel’s consumer mix models enables modelling of advertising activity to learn how media work separately & together. The sample Kantar Worldpanel data below shows how a campaign’s reach can be evaluated holistically or by isolated media type.
TV Only – 41% Print Only – 7%
Online Only – 1%
TOTAL TV – 60% TOTAL PRINT – 25%
TOTAL ONLINE – 10%
UNEXPOSED – 26%
TV, Print & Online – 3% Print & TV – 10%
TV & Online – 4%Print & Online – 1%

PAGE 19
DELIVERY BRAND/SALES EFFECT & ROI
DIGITAL ADS
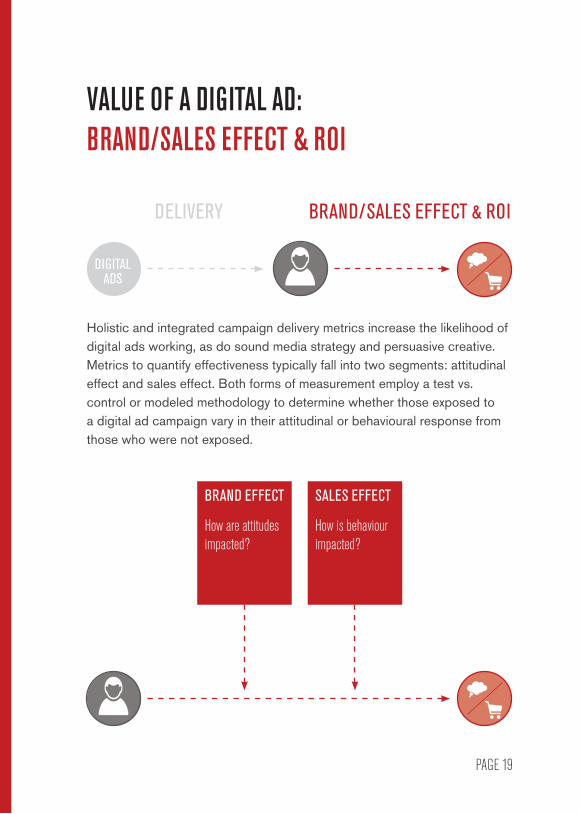
VALUE OF A DIGITAL AD: BRAND/SALES EFFECT & ROI
Holistic and integrated campaign delivery metrics increase the likelihood of digital ads working, as do sound media strategy and persuasive creative. Metrics to quantify effectiveness typically fall into two segments: attitudinal effect and sales effect. Both forms of measurement employ a test vs. control or modeled methodology to determine whether those exposed to a digital ad campaign vary in their attitudinal or behavioural response from those who were not exposed.
SALES EFFECT
How is behaviour impacted?
BRAND EFFECT
How are attitudes impacted?
PAGE 20
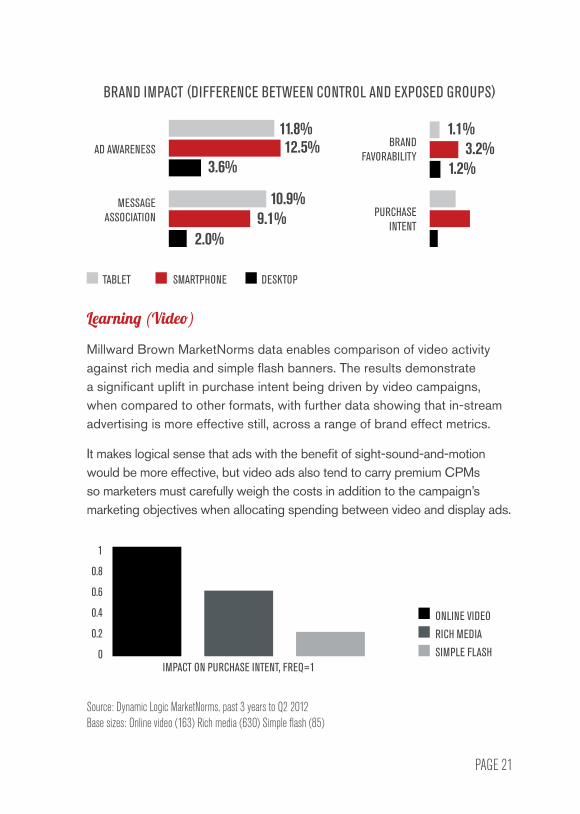
BRAND EFFECT
Why does it matter?
Purchase intent is just one of many the attitudinal metrics that advertisers use to evaluate how their campaign fared, along with aided awareness, favorability. Overall lift in terms of these brand attitudes is important, but comparing metrics across each platform used in the campaign allows more optimal ad spending allocations.
Learnings: Advertisers
Millward Brown MarketNorms shed light on the value of ads on each digital platform. Ads on mobile (smartphone and tablet) devices appear to perform especially well on a variety of brand metrics. Reasons might include:
• Lack of ad clutter
• Proximity to the point of purchase
• The personal nature of mobile devices
• The relative novelty of the mobile medium.
With mobile gaining increasing share of attention from consumers, the strong impact of mobile ads and screen sizes increasing over time, it’s clear that mobile advertising is still in the earlier stages of its upswing. The need for measurement will grow accordingly.
Mobile brand effect metrics show that mobile advertising does work, with tablet and smartphone campaigns performing better at different stages of the funnel.
PAGE 21
Learning (Video)
Millward Brown MarketNorms data enables comparison of video activity against rich media and simple flash banners. The results demonstrate a significant uplift in purchase intent being driven by video campaigns, when compared to other formats, with further data showing that in-stream advertising is more effective still, across a range of brand effect metrics.
It makes logical sense that ads with the benefit of sight-sound-and-motion would be more effective, but video ads also tend to carry premium CPMs so marketers must carefully weigh the costs in addition to the campaign’s marketing objectives when allocating spending between video and display ads.
11.8%12.5%
3.6%
10.9%9.1%
2.0%
1.1%3.2%
1.2%
TABLET SMARTPHONE DESKTOP
AD AWARENESS BRAND FAVORABILITY
MESSAGE ASSOCIATION PURCHASE
INTENT
BRAND IMPACT (DIFFERENCE BETWEEN CONTROL AND EXPOSED GROUPS)
IMPACT ON PURCHASE INTENT, FREQ=1
ONLINE VIDEORICH MEDIASIMPLE FLASH
1
0.8
0.6
0.4
0.2
0
Source: Dynamic Logic MarketNorms, past 3 years to Q2 2012Base sizes: Online video (163) Rich media (630) Simple flash (85)
PAGE 22
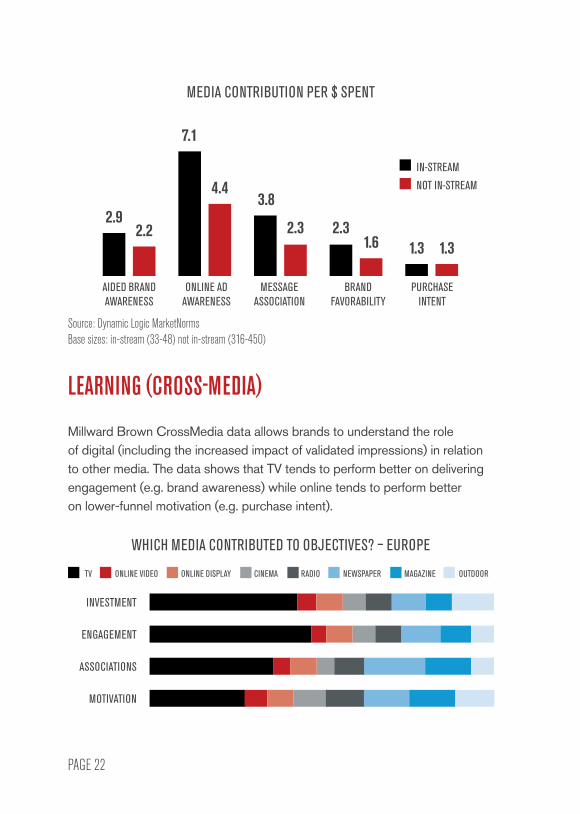
LEARNING (CROSS-MEDIA)
Millward Brown CrossMedia data allows brands to understand the role of digital (including the increased impact of validated impressions) in relation to other media. The data shows that TV tends to perform better on delivering engagement (e.g. brand awareness) while online tends to perform better on lower-funnel motivation (e.g. purchase intent).
AIDED BRAND AWARENESS
ONLINE AD AWARENESS
MESSAGE ASSOCIATION
BRAND FAVORABILITY
PURCHASE INTENT
2.92.2
7.1
4.43.8
2.3 2.31.6 1.3 1.3
IN-STREAMNOT IN-STREAM
MEDIA CONTRIBUTION PER $ SPENT
Source: Dynamic Logic MarketNormsBase sizes: in-stream (33-48) not in-stream (316-450)
TV ONLINE VIDEO ONLINE DISPLAY CINEMA RADIO NEWSPAPER MAGAZINE OUTDOOR
INVESTMENT
ENGAGEMENT
ASSOCIATIONS
MOTIVATION
WHICH MEDIA CONTRIBUTED TO OBJECTIVES? – EUROPE
PAGE 23
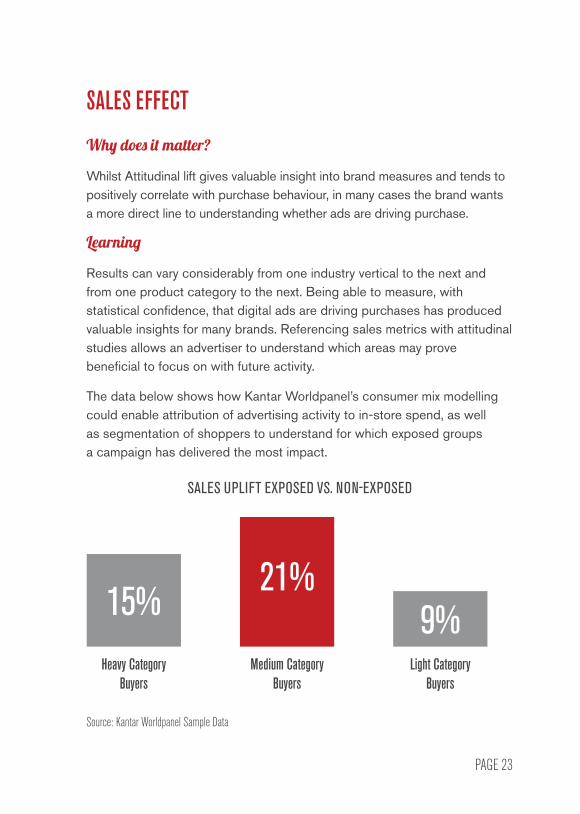
SALES EFFECT
Why does it matter?
Whilst Attitudinal lift gives valuable insight into brand measures and tends to positively correlate with purchase behaviour, in many cases the brand wants a more direct line to understanding whether ads are driving purchase.
Learning
Results can vary considerably from one industry vertical to the next and from one product category to the next. Being able to measure, with statistical confidence, that digital ads are driving purchases has produced valuable insights for many brands. Referencing sales metrics with attitudinal studies allows an advertiser to understand which areas may prove beneficial to focus on with future activity.
The data below shows how Kantar Worldpanel’s consumer mix modelling could enable attribution of advertising activity to in-store spend, as well as segmentation of shoppers to understand for which exposed groups a campaign has delivered the most impact.
SALES UPLIFT EXPOSED VS. NON-EXPOSED
Heavy Category Buyers
Medium Category Buyers
Light Category Buyers
15% 21%9%
Source: Kantar Worldpanel Sample Data
PAGE 24
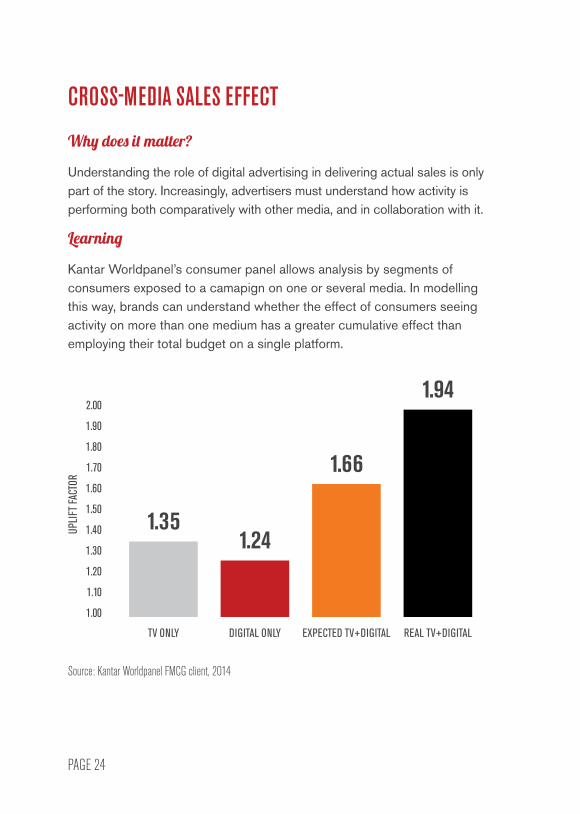
CROSS-MEDIA SALES EFFECT
Why does it matter?
Understanding the role of digital advertising in delivering actual sales is only part of the story. Increasingly, advertisers must understand how activity is performing both comparatively with other media, and in collaboration with it.
Learning
Kantar Worldpanel’s consumer panel allows analysis by segments of consumers exposed to a camapign on one or several media. In modelling this way, brands can understand whether the effect of consumers seeing activity on more than one medium has a greater cumulative effect than employing their total budget on a single platform.
TV ONLY DIGITAL ONLY EXPECTED TV+DIGITAL REAL TV+DIGITAL
1.351.24
1.66
1.94
UPLIF
T FAC
TOR
2.00
1.90
1.80
1.70
1.60
1.50
1.40
1.30
1.20
1.10
1.00
Source: Kantar Worldpanel FMCG client, 2014
PAGE 25
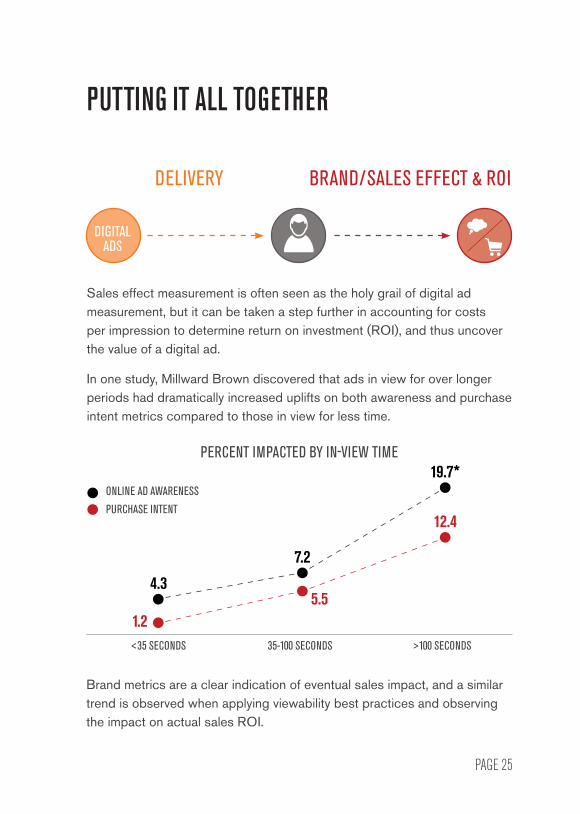
ONLINE AD AWARENESSPURCHASE INTENT
4.37.2
19.7*
1.25.5
12.4
PUTTING IT ALL TOGETHER
DELIVERY BRAND/SALES EFFECT & ROI
DIGITAL ADS
Sales effect measurement is often seen as the holy grail of digital ad measurement, but it can be taken a step further in accounting for costs per impression to determine return on investment (ROI), and thus uncover the value of a digital ad.
In one study, Millward Brown discovered that ads in view for over longer periods had dramatically increased uplifts on both awareness and purchase intent metrics compared to those in view for less time.
Brand metrics are a clear indication of eventual sales impact, and a similar trend is observed when applying viewability best practices and observing the impact on actual sales ROI.
<35 SECONDS 35-100 SECONDS >100 SECONDS
PERCENT IMPACTED BY IN-VIEW TIME

PAGE 26
In the initial analysis, incremental sales volume per impression increased 74 percent through their optimization efforts. A substantial increase but at a higher relative CPM because of the costs of validation.
However, even at the higher CPM, incremental sales per dollar spent on advertising increased 39 percent. They increased their ROI by a significant margin as a result of employing ad validation.
Incremental Volume per Impression Incremental Volume per $ Spent
PREVIOUS YEAR PREVIOUS YEAR
+74% +39%
ConAgra Foods conducted sales effect and ROI measurement for one of its brands’ digital campaigns, taking into account the brand’s use of viewability optimization between the previous year and current year.
PAGE 27
CONCLUSION“The Consumer Mix Model analysis was key recognize the ROI of digital and on how to gain effectiveness in media investment considering synergy between digital and traditional communication.”
PAOLA TOSCANO, STRATEGY & INSIGHTS MANAGER, DANONE
As digital markets grow in complexity, measurement often needs to follow. Greater digital ad spend gives rise to new issues such as fraud and viewability, making simply accounting for “clean” impressions a challenge. The use of varying single-point solutions to measure each dimension can make data reconciliation difficult and breed inaccuracies. That’s the bad news.
But there is also good news that offers plenty of reason for optimism among buyers and sellers. Digital ad measurement has made huge strides in recent years, and the ability to account for quality impressions has never been easier or more accurate. Holistic, integrated solutions enable alignment of ad delivery and brand/sales effect measurement, allowing overall gains even for brands that already enjoy great success from digital advertising.
DELIVERY
FEEDBACK
BRAND/SALES EFFECT & ROI
DIGITAL ADS
Early adopters are already optimising campaigns to improve delivery, producing brand/sales effect and ROI gains significantly higher than previous campaigns. Publishers are reconfiguring sites to better deliver quality inventory more likely to be in-view and free of non-human traffic, enabling advertising partners to see better results, and justifying higher CPMs for that
PAGE 28
inventory. A cleaner and more user-friendly web browsing experience also benefits the user – who returns the favor by increasing usage time online, resulting in greater digital ad spend.
The highly measurable nature of digital allows it to deliver continuous improvements in ad delivery and brand/sales effect. Because digital is also the messiest of all media, however, it must continuously adapt to the challenges. But the more we measure, the better we get at determining the value of a digital ad.
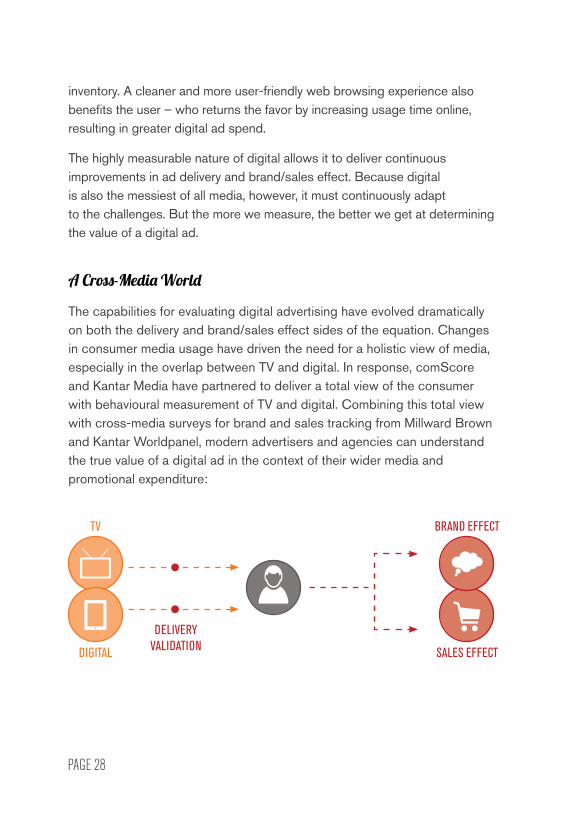
A Cross-Media World
The capabilities for evaluating digital advertising have evolved dramatically on both the delivery and brand/sales effect sides of the equation. Changes in consumer media usage have driven the need for a holistic view of media, especially in the overlap between TV and digital. In response, comScore and Kantar Media have partnered to deliver a total view of the consumer with behavioural measurement of TV and digital. Combining this total view with cross-media surveys for brand and sales tracking from Millward Brown and Kantar Worldpanel, modern advertisers and agencies can understand the true value of a digital ad in the context of their wider media and promotional expenditure:
TV BRAND EFFECT
DIGITAL
DELIVERY VALIDATION SALES EFFECT
PAGE 29
HOW
HAS
DIF
FERE
NT M
ARKE
TING
ACTIV
ITY
CONT
RIBU
TED
TO YO
UR B
RAND
SAL
ES? 35
30
25
20
15
10
5
0
TV PRESS PROMO DIGITAL
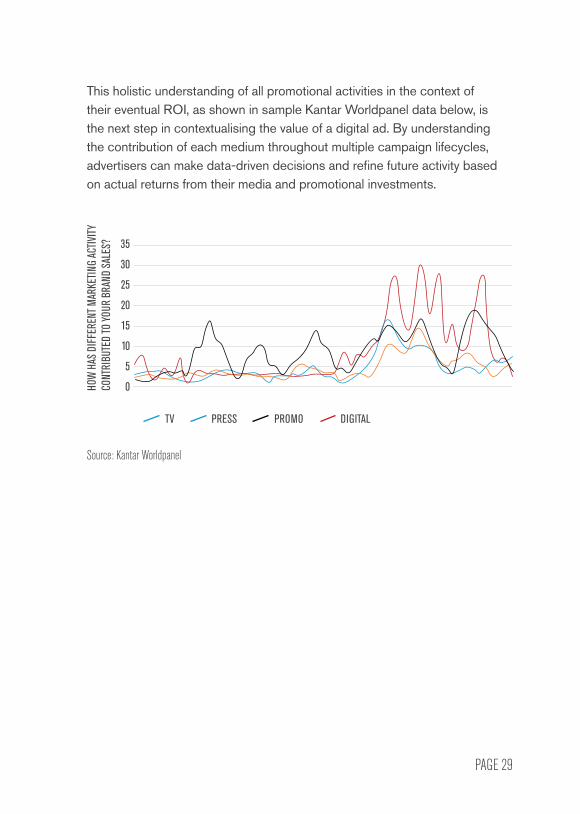
This holistic understanding of all promotional activities in the context of their eventual ROI, as shown in sample Kantar Worldpanel data below, is the next step in contextualising the value of a digital ad. By understanding the contribution of each medium throughout multiple campaign lifecycles, advertisers can make data-driven decisions and refine future activity based on actual returns from their media and promotional investments.
Source: Kantar Worldpanel

PAGE 30
@K_Worldpanel linkedin.com/company/kantar-worldpanel
STAY CONNECTED
comScore is a global leader in digital media analytics. To learn more about how comScore can help you get the most value from audiences and advertising, visit www.comscore.com/learnmore today.
Kantar Worldpanel is the world leader in consumer knowledge and insights based on continuous consumer panels. Combining market monitoring, advanced analytics and tailored market and media research solutions we deliver both the big picture and the fine detail that inspire successful actions by our clients. Our expertise about what people buy or use - and why - has become the market currency for brand owners, retailers, market analysts and government organisations internationally. www.kantarworldpanel.com/global/Expertise/media
Millward Brown is one of the world’s leading research agencies and is expert in effective advertising, marketing communications, media and brand equity research. To find out more about our channel optimization solutions visit: millwardbrown.com/channeloptimization
facebook.com/comscoreinc @comscore linkedin.com/company/comscore
facebook.com/MillwardBrownGlobal @millward_brown linkedin.com/company/millward-brown