Embed Size (px)
Citation preview
General rights Copyright and moral rights for the publications made accessible in the public portal are retained by the authors and/or other copyright owners and it is a condition of accessing publications that users recognise and abide by the legal requirements associated with these rights.
• Users may download and print one copy of any publication from the public portal for the purpose of private study or research. • You may not further distribute the material or use it for any profit-making activity or commercial gain • You may freely distribute the URL identifying the publication in the public portal
If you believe that this document breaches copyright please contact us providing details, and we will remove access to the work immediately and investigate your claim.
Downloaded from orbit.dtu.dk on: Dec 18, 2017
How do dynamic capabilities transform external technologies into firms’ renewedtechnological resources? – A mediation model
Li-Ying, Jason; Wang, Yuandi; Ning , Lutao
Published in:Asia Pacific Journal of Management
Link to article, DOI:10.1007/s10490-016-9469-9
Publication date:2016
Document VersionPeer reviewed version
Link back to DTU Orbit
Citation (APA):Li-Ying, J., Wang, Y., & Ning , L. (2016). How do dynamic capabilities transform external technologies into firms’renewed technological resources? – A mediation model. Asia Pacific Journal of Management, 33(4). DOI:10.1007/s10490-016-9469-9
1
Please cite as:
Li-Ying, J., Wang, Y., Ning, L. (2016). How do dynamic capabilities transform external technologies
into firms' renewed technological resources? - A mediation model. Asia Pacific Journal of Management,
online early view, DOI 10.1007/s10490-016-9469-9
How do dynamic capabilities transform external technologies into
firms’ renewed technological resources? – A mediation model
Jason Li-Ying
Technical University of Denmark
DTU Management Engineering
DK-2800 Kgs. Lyngby, Denmark
Email: [email protected]
Yuandi Wang*
Sichuan University
Business School of Sichuan University
No. 29, Wangjiang Road
Chengdu, 610064, Sichuan, China
Email: [email protected]
*Corresponding author
Lutao Ning
School of Business and Management, Queen Mary
University of London
Mile End Road, London E1 4.25E, UK
Email: [email protected]
Abstract
How externally acquired resources may become valuable, rare, hard-to-imitate, and non-
substitute resource bundles through the development of dynamic capabilities? This study
proposes and tests a mediation model of how firms’ internal technological diversification and
R&D, as two distinctive microfoundations of dynamic technological capabilities, mediate the
relationship between external technology breadth and firms’ technological innovation
performance, based on the resource-based view and dynamic capability view. Using a sample
of listed Chinese licensee firms, we find that firms must broadly explore external technologies
to ignite the dynamism in internal technological diversity and in-house R&D, which play their
crucial roles differently to transform and reconfigure firms’ technological resources.
Key words: resource-based view; dynamic capabilities; technological diversification; in-house
R&D; patent licensing; technological innovation
Acknowledgement: This study is supported by the social science (innovation management
theme) research funding of the Sino-Danish Centre 2014-2015.
2
Introduction
The traditional resource-based view (RBV) emphasizes the role resources, which are arguably
the source of firms’ competitive advantage (Barney, 1991): the heterogeneity of firms’
resources explains differences in performance among firms. The dynamic capabilities view
(DCV) focuses on how firms’ internal capabilities help transform resources into advantaged
firm performance (Barney, 1991; Penrose, 1959; Teece, Pisano, & Shuen, 1997). The recent
theoretical development recognizes that it is the combination of valuable, rare, imperfectly
imitable, and non-substitutable (VRIN) resources and capabilities that lead to a firm’s
renewed/reconfigured resource base, which eventually creates competitive advantages
(Eisenhardt & Martin, 2000; Newbert, 2008; Helfat & Peteraf, 2009).
Researchers have largely recognized two pathways for resource development: either
building from a firm’s prior path or acquiring from external sources that are of value to the
focal firm (Schmidt & Keil, 2013). The former is a result and a reinforcement of path
dependency, but the latter creates new paths for a firm in idiosyncratic situations by externally
searching for new knowledge (Ahuja & Katila, 2001). While the traditional RBV and the DCV
may well explain the internal path of resource development, it remains unclear in the literature
how externally acquired resources may become VRIN in combination with organizational
capabilities (West & Bogers, 2014). For instance, from an outside-in perspective of open
innovation (Enkel et al., 2009), researchers are interested in how firms utilize externally
sourced technologies to enhance their technological innovation performance (Chesbrough,
2003; Vanhaverbeke, Duysters, & Noorderhaven, 2002; Tsai, Hsieh, & Hultink, 2011; Tsai &
Wang, 2009; Zahra, 1996; Jones & Lanctot, 2001; Stuart, 2000), assuming a direct link
between externally sourced technological resources and enhanced performance among
technology-acquiring firms (Tsai & Wang, 2007; Li, 2011; Johnson, 2002; Caloghirou, Kastelli,
3
& Tsakanikas, 2004; Lin, 2003; Ahuja & Katila, 2001; Nieto & Santamaría, 2007; Chen, Chen,
& Vanhaverbeke, 2011). In these studies, researchers often adopt a static RBV and primarily
treat the technology-acquiring firm as a “black box”, in which enhanced performance is
assumed to be a direct result of acquiring external technological resources. This shows a clear
discrepancy between the RBV and DCV (Ambrosini & Bowman, 2009; Arend & Bromiley,
2009). Few empirical studies have integrated the RBV and DCV to investigate how external
sourcing of resources, which are not necessarily VRIN for a firm, can be transformed into
VRIN resource bundles through accordingly developed dynamic capabilities. The question
about how this process takes place and which capabilities may play their roles differently,
therefore, is the focus of this study.
Building upon the foundations of RBV and DCV (Eisenhardt & Martin, 2000), we
conceptually link external technology sourcing, dynamic capabilities, and subsequent renewed
and reconfigured internal resources within a mediation model: a firm’s dynamic capabilities
mediate the relationship between the breadth of external technology sourcing and firms’
technological innovation performance (TIP), which is conceptualized as a set of renewed and
reconfigured technological resources created through the combination of externally acquired
resources and internal dynamic capabilities, instead of a performance measure. The empirical
context of this study is a sample of large Chinese firms that licensed patents during the period
2000-2012.
The contribution of this paper to the literature is twofold. First, we advance the RBV
and DCV by answering how the access to merely valuable external resources leads to renewed
VRIN resources through a process in which certain dynamic capabilities play a mediating role.
Second, this study sheds light on the call in the open innovation literature for a better
understanding of how firms using an outside-in approach can capture the value of external
resources (West & Bogers, 2014) by highlighting the nuanced differences between the two
4
microfoundations of firms’ dynamic technological capabilities with regard to their roles of
transforming firms’ external resource bundles.
In the next section, we discuss the theoretical background through the lenses of the
RBV and DCV, based on which we develop hypotheses. Next, the data and methods used in
the empirical analysis are introduced. After that, the results of the empirical analysis are
presented. Finally, we discuss our findings, address some limitations, and offer some
conclusions.
Theoretical background and hypotheses
Resource-based view vs. Dynamic Capabilities view
Both the RBV and the DCV have a long tradition in the literature in explaining firm
performance. The RBV argues that firms can be conceptualized as bundles of resources that are
heterogeneously distributed across firms (Penrose, 1959; Barney, Wright, & Ketchen Jr, 2001;
Nelson & Winter, 1982; Peteraf, 1993). When these resources are considered VRIN, firms can
develop a competitive advantage that in turn leads to superior performance. A firm’s resource
base determines its strategic position in relation to the changing external environment (Teece,
Pisano, & Shuen, 1997). The DCV focuses on a firm’s abilities to purposefully create, extend
or modify its resource base (Helfat et al., 2007). It suggests that resources can influence
performance only to the extent that a firm can leverage and renew them with organizational
capabilities (Ndofor, Sirmon, & He, 2011; Hitt, Ireland, & Lee, 2000). Recently, it has been
suggested that the RBV and the DCV must be understood as complementary perspectives that
explain firms’ performance to avoid the use of underspecified models and erroneous
conclusions (Sirmon & Hitt, 2009; Ndofor, Sirmon, & He, 2011).
Resources can either be developed within a firm or acquired externally (Ahuja & Katila,
2001; Schmidt & Keil, 2013). Researchers have suggested that both internally developed and
5
externally acquired resources are equally important for sustaining firms’ competitive
advantages (Chesbrough, 2003; Lin, 2003; Chiaroni, Chiesa, & Frattini, 2010). Internally
developed resources are based on a firm’s prior paths and reinforce path dependency (Sydow et
al., 2009); meanwhile externally acquired resources face challenges in being integrated into a
firm’s existing resource base and become renewed VRIN resource bundles (West & Bogers,
2014). While the traditional RBV and the DCV may well account for the resources derived
from the prior paths of a firm and its performance, we know much less about in some
idiosyncratic situations where a firm searches for external resources that are valuable (for some
purposes) but not necessarily rare, inimitable, and non-substitutable for the knowledge-seeking
firm and how these resources can eventually be “transformed” to become reconfigured internal
VRIN resource bundles. Figure 1 conceptually illustrates the rationale behind this study, which
aims at explaining the underexplored pathway of external resource acquisition and dynamic
capabilities. The key logic behind the proposed conceptual framework for the external resource
path is that a firm’s dynamic capabilities will change and develop in response to the attributes
of external access to valuable resources, a process through which a firm’s VRIN resource
configurations could be renewed. This conceptual positioning is in line with the recent
theoretical development regarding the DCV, which suggests that dynamism exists in the
interplay between a firm’s dynamic capabilities and resource base, allowing the modification
of the resource base (Chen, Su, & Tsai, 2007; Ambrosini & Bowman, 2009; Peteraf & Bergen,
2003; Sirmon & Hitt, 2009; Ndofor, Sirmon, & He, 2011; Newbert, 2008).
------------------------------
Insert Figure 1 here
------------------------------
Conceptualization of dynamic capabilities
6
It has been widely accepted that dynamic capabilities are a series of routinized activities, which
are performed to reconfigure firms’ resource base. Dynamic capabilities are “routines” because
they are repetitious and purposefully patterned (Winter, 2003; Teece, Pisano, & Shuen, 1997);
they are also “activities” because they are continuously “in action” in response to changes in a
firm’s resource configuration and external environment (Zollo & Winter, 2002; Ambrosini &
Bowman, 2009). Scholars have studied various actionable microfoundations of dynamic
capabilities, such as research and development (R&D) investments (Tsai, Hsieh, & Hultink,
2011; Lane & Lubatkin, 1998), integrating activities (Sen & Rubenstein, 1989), and
technology diversification (Ndofor, Sirmon, & He, 2011; Argyres, 1996).
Dynamic capabilities is a multi-level concept. In Collis’ (1994) taxonomy, competitive
advantage is a result of combined effects of dynamic capabilities at different levels in a process
that leads to infinite regress with ever higher orders of capabilities. At the most base level,
capabilities are performable routines that enable firm to earn a living. These capabilities
involve those administrative, operational, or governance-related functions, which are highly
likely to be widely adopted by firms across industries (Teece, 2014). These capabilities have
been labeled differently with rubrics of “zero-level” (Winter, 2003) and “ordinary” capabilities
(Teece, 2014). At the next level are capabilities that allow firms to change the base level
capabilities and resources. These capabilities are often referred to as “first-order” capabilities
(Zott and Winter, 2002; Schilke, 2014)1. Collis (1994) further theoretically suggests that the
relevance of a given level of capabilities is dependent on the competitive context: in some
cases, zero-level capabilities are necessary and in other cases first-order capabilities are more
decisive for sustaining competitive advantage. In general, higher-order dynamic capabilities
are more difficult to be imitated than lower-order ones (Teece, 2014), but meanwhile higher-
1 At a higher level, so-called “second-order” capabilities (Zott and Winter, 2002; Schilke, 2014)
involves the learning mechanisms that allow firms “learning to learn”, a concept that is related to
double-loop learning (Argyris & Schön, 1978). To avoid too much conceptual complication and
confusion, we do not address the “second-order” capabilities in our empirical model.
7
order capabilities are also more difficult to be developed within an organziation because they
are derived from repeated learning and experiences, based on the performance of lower-order
capabilities (Bingham et al., 2007; Schreyögg & Kliesch-Eberl, 2007).
Next, due to the nature of routinization and multi-levelness, dynamic capabilities do not
necessarily guarantee competitive advantage (Ambrosini & Bowman, 2009; Winter, 2003).
Rather, lower-order capabilities are likely to be commonly distributed among firms in an
industry so that even “best practice” may be duplicated across firms (Teece, 2007; 2014).
Therefore, what is essential for sustaining competitive advantage is the resource configurations
created and renewed by dynamic capabilities, not in the capabilities themselves (Eisenhardt &
Martin, 2000).
A mediation model
Based on the RVB and the DCV, we propose that dynamic capabilities mediate the
relationships between external valuable technological resources and a firm’s subsequent
renewed technological resource configurations. Instead of conceptualizing a moderating role of
dynamic capability in this case, a mediation model is more logically consistent and
conceptually sense-making because by proposing a moderating model, one implicitly assumes
that dynamic capabilities are given rather than responsive. Such an assumption obviously
violates the responsive nature of dynamic capabilities, which are enabled by a firm’s resource
position and “in action” along with the change in resource configurations (Eisenhardt & Martin,
2000; Helfat & Peteraft, 2009). Therefore, a moderating model is disregarded in this study.
We move on to explain the key concepts in the mediation model in a specific context.
First, concerning external resources, scholars have highlighted the importance of technological
resources in developing innovative products and processes (Miller, 2006; Grant, 1996; Patel &
Pavitt, 1997). Technological resources developed externally can be sourced in by, for instance,
8
licensing, merger and acquisitions (M&A), or spillover effects (Wang & Li-Ying, 2014).
Externally acquired technologies may not be VRIN resources for the technology-acquiring firm
if a firm does not have the capabilities to subsequently create and reconfigure its own new
technological resources. For instance, when a firm licenses technologies for manufacturing
purpose, the licensed technologies are of value for the firm but not necessarily rare, inimitable,
and non-substitutable. It is up to the licensee firm to accordingly develop organizational
capabilities and eventually “transform” licensed technologies into a reconfigured resource base.
In this paper, we empirically focus on one type of external technological resource –
patent licensing. To be more specific, we first focus on the breadth of Chinese firms’ external
technology access in terms of the technological domains covered by licensed patents. A well-
established stream of literature has demonstrated that firms in general need to search broadly or
deeply to adapt to change and therefore innovate (Katila & Ahuja, 2002; Laursen & Salter,
2006; Leiponen & Helfat, 2010). While search depth denotes how intensively and repeatedly a
firm exploits external technological resources, search breadth represents how broadly a firm
explores various domains of external technologies (Chiang & Hung, 2010). The reason why
this study only focuses on the breadth instead of depth is two-fold: (1) Chinese industrial R&D
has been left in a lagging position behind those in the Western countries since the 1980s and
1990s (Xue, 1997). Thus, learning from external technology sources through an effective
technology market has been promoted in China as a primary means of reducing its
technological deficiency and catching up with the Western world (Sun & Du, 2010). Given
limited internal technological knowledge bases of industrial firms and a strong incentive for
economic growth, the breadth of external technology access seems to be more relevant and
more important than the depth of technology exploitation in China (Li-Ying, Wang, & Salomo,
2014; Li-Ying & Wang, 2015). (2) Although broadening might be a relevant and prevailing
strategy of external technology search for Chinese firms, it functions in a confined fashion with
9
respect to technical domains, geography and timing (Li-Ying, Wang, & Salomo, 2014). Prior
studies have not taken a firm’s internal capabilities into consideration when addressing the
breadth issue in this specific context.
Second, drawn on the literature on the technological aspect of dynamic capabilities
(Teece, Pisano, & Shuen, 1997; Eisenhardt & Martin, 2000; Henderson & Clark, 1990), in this
study we introduce a concept of dynamic technological capabilities as a natural response to the
broadened external technological domains through licensing. The multi-level perspective of
organizational capabilities (Collis, 1994) provides us with a foundation to conceptualize a
firm’s dynamic technological capabilities and define its measurable microfoundations. We
focus on two microfoundations of dynamic technological capabilities – in-house R&D
investment (Chesbrough, 2003; Chandler & Hikino, 1990; Mowery & Rosenberg, 1998) and
technological diversification (Ndofor, Sirmon, & He, 2011; Sen & Rubenstein, 1989). First, in-
house R&D is essential for an industrial firm to enhance its technological innovation
performance (Sun & Du, 2010; Li-Ying & Wang, 2015). Even though in-house R&D might be
routinized activities that are commonly adapted among most industrial firms, the intensity and
practices of in-house R&D can still vary to a great extent from one firm to another (Teece,
2007; Eisenhardt & Martin, 2000). Second, technological diversification refers to a firm’s
capabilities to learn from the interaction between its internal knowledge base and externally
acquired technologies and further diversify its technology bases (Agryres, 1996). Both in-
house R&D and technological diversification are conceptualized as first-order capabilities
because they are performable organizational routines that are heterogeneously distributed
among industries and their functions are to reconfigure and renew a firm’s technological
resources.
Teece (2007) explicates the fundamental components of dynamic capabilities as a
firm’s capacities (1) to sense opportunities and threats, (2) to seize opportunities, and (3) to
10
maintain competitiveness through transforming and reconfiguring the business enterprise’s
intangible and tangible assets (Teece, 2007). Seeing them through Teece’s lens of
conceptualization, we suggest that in-house R&D tends to reflect the microfoundations of
sensing and seizing because firms with strong R&D should be able to sense and seize
technological opportunities and their commercialization potential, while technological
diversification is conceptually leaning towards transforming because it entails that a firm’s
resources and (ordinary) capabilities are transformed into new trajectories of potential growth.
It is our intention to investigate how these two microfoundations of technological capabilities
directly contribute to firms’ reconfigured technological resources and how they mediate the
relationship between the breadth of external technologies and firms’ reconfigured
technological resources. More importantly, to better represent the “responsive” nature of
dynamic capabilities, we measure technological capabilities in this study as the change in a
firm’s technological diversification and in-house R&D investment rather than a static value at a
particular point in time.
Next, the reconfigured technological resource base, as a result of the deployment of
dynamic capabilities, is refined to a firm’s technological innovation performance (TIP) in this
study. Often measured by the number of a firm’s new patent applications or granted patents
(Stuart & Podolny, 1996; Acs & Audretsch, 1989; Trajtenberg, 1990; Li-Ying, Wang, &
Salomo, 2014; Li-Ying & Wang, 2015), TIP is usually regarded as a component rather than an
enabler of competitive advantage. In our opinion, this is imprecise from the RBV. On the one
hand, compared to other firm performance measures that focus on the product-market side of
firm advantage (e.g., sales of new products, market share, and return on assets), TIP at most
represents a set of renewed and reconfigured technological resources. For TIP to be further
translated into firm performance, a firm surely needs other types of dynamic capabilities, such
as product development and design, user needs assessment, and marketing, which are outside
11
the scope of this study. On the other hand, TIP represents a renewed resource configuration,
which, together with the corresponding dynamic capabilities, becomes rarer, less imitable, and
less substitutable. Therefore, we conceptually position TIP as a set of renewed and
reconfigured technological resources rather than a firm performance measure.
All in all, a mediation model is specified to connect the breadth of external
technological resources, the change in a firm’s technological diversification and in-house R&D,
and TIP. A full illustration of the empirical model is presented in Figure 2. Hypotheses are
developed accordingly to test these relationships in the next section.
------------------------------
Insert Figure 2 here
------------------------------
Hypotheses
Prior work has strongly suggested that with a broad scope of external technology search, firms
can benefit from more opportunities for novel combinations (Prencipe, 2000; Fleming, 2001).
In addition, a large breadth of external technology resources allows firms to conduct more
experimentations in new technology fields, which help firms to avoid “lock-in” problems and
remain flexible in the face of external technological and market changes (Zahra & George,
2002; Grant, 1996; Cowan & Foray, 2000). A broad scope of external technology search may
increase the chance for a firm to develop VRIN resources derived from the externally acquired
technologies (Laursen & Salter, 2006). Meanwhile, we also notice that prior study has also
suggested that technological over-search, which potentially imposes high degrees of learning
risks and management challenges for a knowledge seeking firm, was not common for Chinese
firms (Li-Ying, Wang, & Salomo, 2014). Thus, we do not expect an inverted-U shaped as
suggested by the literature (Laursen & Salter, 2006; Nooteboom et al., 2007). Therefore, from
the RBV, a baseline hypothesis is straightforward: that the breadth of external technologies and
TIP are positively associated. We formulate the first hypothesis as the following:
12
H1: The breadth of a firm’s external technological resources positively influences its
technological innovation performance.
The addition of broad external resources will eventually be “competence destroying” if
a firm does not develop internal capabilities to create, extend, or modify its resource
configurations, (Laursen & Salter, 2006). Therefore, accordingly developing internal
technological capabilities by technological diversification and in-house R&D is essential for a
firm to capture the innovation value of broadened external technological resources.
First, diversification of a firm’s technological base refers to the expansion of its
knowledge base into a large range of technological areas, expanding its technological
innovations over more than one technological domain (Breschi, Lissoni, & Malerba, 2003). By
technological diversification, a firm can exploit novel combinations of its internal technologies
in combination with unfamiliar external technologies and create new innovation value through
discoveries in related areas (Granstrand et al., 2007; Garcia-Vega, 2006). If it has a diversified
knowledge base, a firm can achieve a great level of cross-fertilization between different yet
related technologies (Granstrand & Sjölander, 1990; Garcia-Vega, 2006). A diversified
knowledge base demonstrates a firm’s strong capabilities to recognize and mobilize the real
option value of knowledge embedded in the licensed technologies and further allow itself to
establish “architectural competence” by integrating dispersed knowledge from various sources
into a coherent whole (Henderson & Cockburn, 1996; McGrath, Macmillan, & Venkataraman,
1995). Therefore, technological diversification should be positively related to a firm’s TIP.
When a firm licenses technologies from other organizations, it requires a process in
which the licensee firm accesses other firms’ knowledge bases and integrates them with its
own current knowledge bases (Li & Wu, 2010). According to cybernetics (Ashby, 1965), the
only way to handle increasing complexity in a system is to increase the complexity of an
adjacent/coupling system. Therefore, the larger the breadth of external technology resources,
13
the stronger the capabilities a firm needs to diversify its own technology bases to cope with the
increasing complexity and broadened technological opportunities brought in by external
technology resources. In other words, if a firm fails to change the current scope of its
knowledge base, it may not be able to capture as many opportunities as it intends to recombine
its existing and newly in-sourced technologies (Fleming, 2001; Laursen, Leone, & Torrisi,
2010) and reap the economies of scope that are created by applying the same technologies in
different product-market contexts (Durand, Bruyaka, & Mangematin, 2008). It is in this sense,
technological diversification becomes a first-order capability, broadening a firm’s resource and
ordinary capabilities that are sufficient to “earn a living” based on existing technologies and
existing product/service offerings (Argyers, 1996; Silverman, 1999). To summarize, we
observe the following pattern of relationships: the broadening of a firm’s external
technological resources forms an idiosyncratic position that requires a firm’s dynamic
capabilities to diversify its current technology bases. Technological diversification, thus,
modifies, extends, or creates new technological resources within a firm. The dynamism lies in
the interconnected changes among a firm’s technological resource configurations and the
capability to reconfigure these resources. This leads to the next hypothesis regarding the
mediating role of technological diversification:
H2: The change in a firm’s internal technological diversification mediates the
relationship between the breadth of external technological resources and the firm’s
technological innovation performance.
Firms’ in-house R&D has long been recognized as one of the major contributors to
technological innovations (Chesbrough, 2003; Chandler & Hikino, 1990; Mowery &
Rosenberg, 1998). In-house R&D is a prerequisite for firms to exploit the knowledge
elements that they are familiar with and recombine internal knowledge in novel ways.
Accumulated R&D experience may reduce the time and costs of external learning (Fleming,
14
2001). R&D also enhances a firm’s ability to capture the value of its internal know-how
(Chandrashekhar, 2006). Today, even in an increasingly collaborative innovation environment,
it is still widely accepted that the sheer size of internal R&D expenditure itself is one of the
main determinants of firms’ superior TIP (Ozman, 2007; Kogut & Zander, 1996; Sun & Du,
2010; Li-Ying & Wang, 2015).
Moreover, in-house R&D investments are needed to improve a firm’s ability to absorb,
assimilate, and extend external technological resources because of the complex nature of
technology acquisition. This functionality of in-house R&D is usually referred to as a part of
“absorptive capacity” (Cohen & Levinthal, 1990). When a firm licenses technologies with a
broad scope, it must invest in its in-house R&D to cope with the increasing complexity of
external technologies and realize their full potential (Matusik & Hill, 1998; Huber, 1991).
Helfat (1997) argues that R&D is one of the dynamic capabilities that may change the way
how a firm configures its technological resources. If a firm fails to routinely invest in R&D and
keep its current scope of knowledge base up-to-date, externally sourced technologies may not
become VRIN for the firm, as the external technological and market environments rapidly
change (Rosenkopf & Nerkar, 2001; Teece, 2007). Studies based on economies with successful
catch-up strategies, such as Japan, South Korea, Singapore, and Taiwan, have repeatedly
shown the critical role of latecomer firms’ own R&D efforts to absorb, assimilate, and diffuse
imported technologies (Kim & Nelson, 2000; Hobday, 1994; Katrak, 1990). Therefore, we
propose that the broadening of a firm’s external technological resources forms an idiosyncratic
position that requires a firm to have dynamic capabilities to strengthen its in-house R&D,
which in turn modifies, extends, or creates new technological resources within a firm. This
leads to the third hypothesis regarding the mediating role of in-house R&D:
15
H3: The change in a firm’s in-house R&D investment mediates the relationship
between the breadth of external technological resources and the firm’s technological
innovation performance.
Methodology
Data and sample
Patent licensing has been one of the most important ways in which firms to gain access to new
technological knowledge (Marcotte & Niosi, 2000; Chen & Sun, 2000). After entering a
technology license agreement, a licensee needs to have the ability to internalize the in-
licensed technologies through a learning process (Cummings & Teng, 2003). A firm’s
licensing activities, thus, are embedded in its overall search strategy and positioning (Kollmer
& Dowling, 2004). Since researchers and practitioners have long recognized that patent
information can be best analyzed and appropriated for strategic technology management
(Argyres, 1996; Ernst, 2003), this study probes the interplay among firms’ external
technological resources, dynamic capabilities, and renewed resource configurations through
the lens of patent in-licensing.
The empirical base in this study is set in China. The dataset we use in this paper was
obtained from the State Intellectual Property Office of China (SIPO). Since 2000 the SIPO
has been authorized to register technology-licensing contracts within three months after a
contract is signed between the licensor and licensee, according to Chinese legislation. Each
technology transfer record registered at the SIPO contains the following information: licensor
name, licensing patent number, patent name, licensee name, contracting number and date, and
license type. License agreements can be signed between individuals and firms in various
forms. The licensors of a licensing agreement can be either Chinese or foreign
individuals/firms, but all licensees are Chinese individuals/firms. So far, this dataset only
16
includes patent licensing agreements. The complete records from 2000 to date are available to
the public on the SIPO website in Chinese (http://www.sipo.gov.cn/). The SIPO also provides
the public with a patent retrieval system to search for a firm’s patent applications and granted
patents (http://search.cnipr.com/). Several prior studies have used this dataset to study issues
related to technology licensing and innovation performance of Chinese firms (e.g., Li-Ying et
al., 2013; Wang, Zhou, & Li-Ying, 2013; Wang & Li-Ying, 2014).
The second dataset is drawn from the Chinese Stock Market and Accounting Research
(CSMAR) to collect information for formulating firm-level variables. Information on the
listed Chinese firms regarding the followings can be found in the CSMA dataset: firm name,
location, industrial classification, ownership, number of employees, total sales, annual profit,
sales through export, R&D investment, year of establishment, and other important indicators.
The CSMAR dataset is currently one of the most official, reliable, and comprehensive firm-
level data sources in China and has been widely used in previous studies (see Wang, Jin, &
Yang, 2015). In addition, we also draw on the WIND database, a Compustat-style database in
China to identify the names of listed Chinese firms, their former names (if any), and their
subsidiaries (see http://www.wind.com.cn). This approach is necessary because listed firms
often change their names or establish new subsidiaries when ownership structure changes.
A sample of 508 indigenous Chinese firms is established, following a selection
process illustrated in Figure 3. First, during the period 2000-2012, 60,405 patents covered by
22,631 license contracts have been licensed in China. Due to the interest of this study, we
focus on firm licensees. Thus, we first exclude all licensing contracts involving only licensees
who are individuals (411 cases) and education and research institutes (1,989 cases) from the
sample. This results in 19,500 firm licensees involved in 21,659 license contracts, which
cover 58,934 licensed patents. At the second step, to ensure reliable and consistent firm-level
information on licensee firms for subsequent analyses, we limit our sample to the Chinese
17
listed firms. As a natural step, we identify all the Chinese listed firms that involved in patent
licensing as licensees during the period of interest, checking firms’ names or their former
names based on the WIND database. As a result, 269 listed firms (parent) and 487
subsidiaries of listed firms are identified. These firms have engaged in 4,120 licensed patents
covered by 1,442 license contracts. As patent licensing between a parent firm and its
subsidiaries can be considered as a firm’s internal knowledge transfer, these cases thus do not
fall in our sample. Therefore, we further exclude 12 parent firms and 184 subsidiaries. After
this step, we obtain a sample of 257 parent firms and 303 subsidiaries, who were involved in
patent licensing as licensees. Finally, we attribute subsidiaries’ licensing activities in a
particular year to their parent firms. This yields a sample of 508 listed firms as licensees,
involving 1,694 licensed patents covered by 828 license contracts. Each observation in our
data regarding the independent variables is a record of a firm’s patent licensing activities in a
particular year. As some firms had more than one patent licensed in a particular year, we
hence finally have a sample of 666 firm-year observations of patent licensing for 508 licensee
firms. The observations regarding the dependent variables for these firms are lagged for three
years2. Thus, our data have a cross-sectional nature with a lagged effect on the observation of
dependent variables.
------------------------------
Insert Figure 3 here
------------------------------
These 508 licensee firms include a number of well-known Chinese firms, such as
Haier, BYD, ZTE, TCL, and Datang Communication. The firms are disproportionately
located in 31 different provinces and municipalities in China. The top five locations are
2 To check the robustness, we also used 1- and 2-year moving windows for all the estimation models.
However, the results show no significant differences regarding the relationships among key variables.
These complementary analyses are available upon request.
18
Guangdong (77 firms), Zhejiang (58 firms), Jiangsu (57 firms), Beijing (41 firms), and
Shanghai (32 firms). The licensee firms are distributed between 79 different industries, which
are denoted by the China Securities Regulatory Commission (CSRC) in 2012. Among these
industries, the top four are: Pharmaceutical manufacturing industry (code: C81) account for
11.22% of the sampled firms, followed by chemical raw materials and chemical products
manufacturing industry (9.65%; code: C43), electrical machinery and equipment
manufacturing industry (6.3%; code: C51), and electronic components manufacturing industry
(4.72%; code C67). With respect to the licensor firms in our sample, 11.75% of the licensing
agreements were made with licensor firms from advanced foreign countries, including the
Netherland, Japan, the United States, France, Germany, and Austria. The most active
licensors are Philips Electronics, Mexico Petroleum Group Co., Ltd., and Sumitomo special
Co., Ltd.
Measurement of variables
Dependent variable
Technological innovation performance (TIP): Two commonly used measures for TIP have
been considered in the literature: new product sales and new patent applications. We have
reasons to discard the former and chose the latter in this study. First, using “new product sales”
to measure TIP in China will introduce a severe bias, because in China when a product is
designated by the government as “new,” the firm can get a tax subsidy from the provincial or
central government. So firms have a strong incentive to over-record their new product sales
(Liu & White, 1997). Moreover, it is difficult to compare this measure across different
provinces, because the level of newness is not evaluated based on a nationally standardized
scheme (Li & Wu, 2010). Also, as we conceptually position TIP as reconfigured resources
instead of a measure for firm performance, new product sales does not appropriately represent
19
a renewed pool of resources. Therefore, we turn our attention to an alternative measure of TIP,
new patent applications.
Scholars have repeatedly discussed the strengths and weaknesses of using patent
counts to measure innovation performance (Ahuja & Katila, 2001; Griliches, 1992; Singh,
2008). Nonetheless, patents have been found to be a reliable proxy for technolgical innovatin
performance (e.g., Pakes & Griliches, 1980; Acs & Audretsch, 1989; Trajtenberg, 1990;
Henderson & Cockburn, 1996; Li-Ying, Wang, & Salomo, 2014; Li-Ying & Wang, 2104).
This is because patents contain reliable information that indicates the generation of inventions
that are industrially useful and non-obvious to an individual who is knowledgeable in the
relevant technical field and the ownership of intellectual properties as firm resources (Ernst,
2003; Lin et al., 2006). Thus, patents have generally been regarded as a signaling mechanism
for firms to credibly publicize information about their R&D focus, technology portfolio, and
potential market access (Lin et al., 2006; Ernst, 2003), making it a good proxy for
(reconfigured) technological resources (Stuart & Podolny, 1996; Coombs & Bierly, 2006).
Compared to the new product sales measure, from a RBV a firm’s patent applications better
represent the ownership of a renewed set of technological resources that are VRIN for the
firm. Therefore, we use the licensee firm’s new patent applications to measure TIP.
The procedure for filing patents is unified and standardized across all provinces and
industries in China. In this paper TIP is measured by the number of patent applications within
three years succeeding the licensing year, including the licensing year. New patent
applications filed by subsidiaries are aggregated into their parent companies. This three-year
period was chosen because it is in line with prior studies that analyze the effects of other types
of organizational learning activities on firms’ subsequent patent applications (Ahuja & Katila,
2001; Hausman & Griliches, 1984; Leone & Reichstein, 2012).
Independent variables
20
External technology breadth is defined as the range of knowledge areas of a firm’s in-licensed
technologies. In the literature, this variable is commonly measured by patent classes, based on
which the knowledge embodied in a patent can be entered into a coherent classification
system (Fleming, 2001). The more unique patent classes within a licensed patent, the broader
technology scope a firm tends to have. However, it is very likely that the more patents a firm
licenses, the more unique patent classes it has. Therefore, we use the average number, instead
of the total number, of unique patent classes to avoid a potentially high correlation between
the number of licensed patents and the number of unique classes. Similar to prior work, we
measure this variable by counting the average number of unique patent classes (using the 4-
digit patent classification code for Chinese invention and utility types of patent) of a firm’s
yearly in-licensed patents (Granstrand & Sjölander, 1990; Wang & von Tunzelmann, 2000;
Zhang & Baden-Fuller, 2010).
Technological diversification: to measure the change of technological diversification
before and after a firm’s licensing, we first follow Hall and his colleagues’ work (Jaffe, 1986;
Hall, Jaffe, & Trajtenberg, 2001; Li-Ying, Wang, & Salomo, 2014) in calculating the
similarity of a firm’s patent portfolios within three years before and after its licensing. Then
we use 1 minus the value of similarity to indicate a firm’s technology diversification driven
by its external technology sourcing. The detailed formula for the similarity is:
Pi and Pj present a firm’s vectors of Chinese patent applications in patent class k over the three
years before and after the licensing year, respectively. Rij represents the technological
similarity, which has a value between “0” and “1”. The value of “1- Rij” thus measures the
technological diversity. A high value means that compared to three years before the licensing,
a firm’s technology portfolio is much more diversified during the three years after the
21
licensing. Patent classes are taken from the International Property Classification. For
invention and utility patents, we use the first four categorical characters, i.e., a section symbol
plus a two-digit number and a subclass letter. For design patents, we use the two-digit main
class number.
In-house R&D refers to a firm’s technological efforts that can be roughly indicated by
measuring its R&D expenditures. We first calculate the licensee firms’ R&D investment per
employee in each year within a three-year period after the licensing year. To capture the
change in R&D investment, we then measure the difference between the average R&D
investments in the three years after licensing and the R&D investments of the licensing year.
There is a clear limitation with respect to the gap between the construct of dynamic
technological capabilities and the way in which we measure its two microfoundations. At the
first place, capabilities are performable organizational routines and activities, which our
measures of technological diversification and in-house R&D we are not directly measuring.
Instead, both measures seem to indirectly measure the outcome of performing dynamic
technological capabilities. However, we argue that they might still be satisfactory proxies for
a number of reasons. First, for tech diversification, the measure is a direct indication of
diversified technological domains of a firm as a consequence of its continuous exploration of
new combinations of technological elements. Thus, it is an outcome measure, but it is also a
good proxy that is very closely reflecting organizational routines and activities. Second, firms’
R&D activities usually focus on lab testing, quality control, hiring new scientists and
engineers, identifying alternative uses, and introducing new product/process prototypes
(Helfat, 1997). Eisenhardt and Martin (2000) also identify cross-functional R&D teams, new
product development routines, quality control routines, technology transfer and/or knowledge
transfer routines, and certain performance measurement systems as important elements of
R&D routines. A sure thing is that they all cost money. One may fairly argue that an
22
innovating firm may differentiate itself by seeking new ways of performing R&D that is
different from the majority of the industry, so that what matters is how to carry out R&D
instead of how much to spend on R&D. However, it is important to emphasize that
differentiating a firm’s R&D means deviating from the industrial best practices and standards,
requiring substantial investment in R&D to achieve. Therefore, we believe that R&D
expenditure itself represents a great deal of the quality and innovativeness of a firm’s R&D
activities. Given the limitation of our data, which do not allow us to directly observe micro-
level R&D activities, R&D expenditure might be a second best proxy to measure capabilities.
Control variables
We control for several variables that are widely used in the studies on innovation. At the firm
level, we control for firm age, measured by the number of years between a firm’s year of
establishment and the licensing year, and firm size, measured as the number of employees.
Next, the export orientation of firms is controlled for and measured by the sales derived from
exports divided by total sales. When this ratio is more than 5%, we set this variable as “1”,
otherwise “0”. Licensee firms’ existing technology scale, measured by the total number of
patent applications within the three-year period before the licensing year, is controlled for as
well. We also control for the intensity of co-patenting with local university/research institutes
and co-patenting with local industrial firms, measured by the number of co-patents made by
the licensee firms accordingly. To avoid a potential endogeneity problem caused by
correlations among independent variables, we set a one-year lag for the value of firm size,
export orientation, co-patenting with universities/research institutes, and co-patenting with
industrial firms.
At the industry level, we control for firms’ industry sector. As the licensee firms are
distributed among 79 industries according to the CSRC code, it is not feasible to add so many
dummy variables into the regression models. To avoid over-restricting the models by
23
introducing too many dummy variables, we alternatively categorize the firms into five groups:
four groups for the top four representative industries in the sample (see earlier discussions)
and a fourth group for all other industries. We thus use four dummy variables to represent
these five categories of industries.
In addition, we control for the technology source origin. The value of this variable is
coded as such: when the licensed technology originates from foreign licensors, we denote a
dummy (origin) as “1”, and we denote the dummy as “0” otherwise. We also use a dummy
variable to control for the licensor types (coded as “1” when a licensor is a firm and “0”
otherwise). Finally, to control for the time effect due to any unobserved variance associated
with time in the rapid transition process in China, we introduce year dummies for the period
2000 to 2012, with 2000 omitted as the reference year.
Estimations
The study builds up a mediated model between the breadth of external technologies,
(technological) dynamic capabilities, and technological innovation performance as a
reconfiguration of resources. To test for a mediation effect, three conditions must be met: (1)
the independent variable must significantly impact the dependent variable(s); (2) the
independent variable must significantly influence the mediator(s), and (3) the mediator(s)
must significantly affect the dependent variable(s) after the influence of the independent
variable is controlled (Baron & Kenny, 1986). The last step involves demonstrating that when
the mediator and the independent variable are used simultaneously to predict the dependent
variable, the previously significant path between the independent and dependent variables will
be reduced. Alternative tests for mediation effect exist and will be used in this study as well
(Sobel, 1982; Clogg, Petkova, & Shihadeh, 1992; Freedman & Schatzkin, 1992).
The nature of our data is cross-sectional with a time-lag effect on the dependent
variables. The dependent variable, TIP, is a count variable in this study. A Poisson model is
24
appropriate to model discrete rare events such as those observed in our sample and is
particularly suitable for patents (Hausman & Griliches, 1984). However, in Poisson models,
unobserved heterogeneity in the sample might result in overdispersion, a condition in which
the variance exceeds the mean, causing the underestimation of standard errors and the
inflation of significance levels. In response, a negative binomial regression is introduced to
overcome this drawback. As an α tests indicate that overdispersion is present in our data, we
decide to use the negative binomial regression as the estimation model.
When testing the effect of the independent variable on the two mediators, two
additional models are needed to regress “technological diversification” and “internal R&D”
on external technology breadth, respectively. The two mediators, “technological
diversification” and “in-house R&D,” are both continuous variables with limited values (the
former is bounded within “0” and “1”, and the latter is bounded right to “0”). That means it
violates the normal distribution assumption. Thus, we need to employ generalized estimating
equations (GEE) to estimate the parameters for these two models. It has been proven that
GEE is more efficient than other panel data methodologies because it provides multiple
correlation matrix structures to best match the data (Liang & Zeger, 1986). Prior work has
shown that the “independent” matrix option that we use in this study is more appropriate than
fixed- or random-effects models (Hilbe, 2011).
Results
Table 1 summarizes the descriptive statistics and correlations of all variables in the empirical
analyses. The independent variables are not highly correlated among themselves or with the
control variables. Further tests of the variance inflation factor (VIF) yielded a value that is
less than 2.07 for all cases. It is much below the critical point 10, indicating no existence of
severe multicollinearity (Belsley, 1980). Table 2 presents the statistical analysis results based
25
on negative binominal regression (for Models 1, 2, 3, and 6) and GEE models (for Models 4
and 5). All models are reported by using the Wald chi-square test. Model 1 is the base model,
which includes only the control variables.
--------------------------------------
Insert Tables 1 and 2 here
-------------------------------------
Hypothesis 1 predicts that the breadth of external technology resources will positively
influence TIP. In Model 2, external technology breadth is positive and significant (β =0.0997,
p < 0.01). Hypothesis 1, thus, is supported. Hypotheses 2 and 3 predict the mediation effects
of technological diversification and internal R&D, respectively, on TIP. We first regress the
dependent variable, TIP, on these two mediators in Model 3 in Table 2. The coefficients of
both mediators are positive and significant (for technological diversification β = 0.0705, p <
0.01; for internal R&D, β = 0.00789, p < 0.01). Next, we regress technological diversification
in Model 4 and in-house R&D in Model 5 on external technology breadth. The coefficients of
technological diversification in Model 4 and in-house R&D in Model 5 are both positive and
marginally significant (β = 0.0425, p < 0.10, and β = 3.280, p < 0.10, respectively). Finally,
we insert the independent variable and two mediators in the full model, Model 6. We find that
their positive and significant effects still hold, but meanwhile the coefficient of external
technology breadth in Model 6 (β =0.0978, p < 0.01) is reduced compared to its effect in
Model 2 (β =0.0997, p < 0.01). The confirmation of all conditions of Baron and Kenny’s
(1986) method to detect a mediation effect.
In addition, as the popular and traditional method for testing mediation models
suggested by Baron and Kenny (1986) has been increasingly criticized (Edwards & Lambert,
2007) and the reduced effects of external technology breadth in Model 6 does not seem very
significant compared to Model 2, we decide to make two alternative tests to check the
mediation effects. First, the Sobel test is commonly used (Sobel, 1982) as a product of
26
coefficients approach (MacKinnon et al., 2002). Second, the Clogg and Freedman test is
commonly used as a difference in coefficients approach,(Clogg, Petkova, & Shihadeh, 1992;
Freedman & Schatzkin, 1992).
According to the Sobel test, if the Z-value is significant and the effect ratio is lower
than 0.8, then the mediation relationship is partial. Otherwise, a significant Z-value and an
effect ratio over 0.8 indicate a full mediation relationship (Sobel, 1982). Table 3 reports the
results of the Sobel test: for technological diversification and in-house R&D, the Z scores are
significant and the effect ratio is 0.022 and 0.25, respectively, providing support for the
presence of partial mediation effects. Moreover, the test results of the Clogg and Freedman
methods are presented in Table 4, supporting the presence of a partial mediation relationship
between external technology breadth, technological diversification, in-house R&D, and TIP as
well. To conclude, we find partial mediation effects of two key indicators of dynamic
capability – technological diversification and internal R&D – on the licensee firms’ TIP as an
indicator of reconfigured firm resources.
For a partial mediation effect, it is also important to have a close look at the effect size,
which is also referred to as the indirect effect in mediation models. In our case, indirect effect
equals the reduction of the effect of the causal variable (“external technology breadth”) on the
outcome (“TIP”) and is the measure of the amount of mediation. Even though other complex
measures for the indirect effect exist, most often it is directly computed as the product of the
coefficients of path a (causal variable to mediator) and path b (mediator to outcome variable)
because it is simple and robust enough (Imai, Keele, & Tingly, 2010). As we have two
mediators in our model, the indirect effect can be computed as following, where a1b1 denotes
the path for “technological diversification”, and a2b2 denotes the path for “in-house R&D”.
a1b1 + a2b2= 0.0425*0.0705 + 3.280*0.00789 = 0.029
27
A simple and usual standard to determine small, medium, or large effect sizes, following
Shrout and Bolger (2002), is that of 0.1 for small, 0.3 for medium, and 0.5 for large.
Apparently, the effect size for the amount of mediation (indirect effect) is very small in the
results, whereas a large portion of the effect size comes from the path of “in-house R&D”.
The small effect size of the indirect effect deserves further conceptual discussion later in
relation to the combination of direct effect and indirect effect.
-------------------------------------------
Insert Tables 3 and 4 here
-------------------------------------------
Note that we use patent applications rather than granted patents because a patent
application simply indicates a firm’s effort in knowledge creation and technological
innovation with a clear purpose to protect the knowledge for commercial exploitation in the
future. In contrast, if information on granted patents is used, researchers inevitably have to
take into account an external evaluation process by the patent office with regard to the
newness and originality of an application, a process has little to do with the concept of
reconfigured resource base. Nevertheless, to test the robustness of our results, we also make
an additional analysis to perform the same model estimations using granted patents as the
dependent variable, measured by the number of granted patents within three years succeeding
the licensing year. The results are shown in Table 5 where one can observe a pattern of effects
that are similar to the results in Table 3 in all models. Further Sobel test and Clogg and
Freedman test confirm the partial mediation effects as well, for which the size of the indirect
effect is small.
--------------------------------------
Insert Table 5 here
-------------------------------------
28
Discussion
We establish a stepwise linkage among the breadth of external technology search, dynamic
technological capabilities, and reconfigured internal technological resources. It conceptually
redefines a firm’s technological innovation performance (TIP) as an interim indicator of
reconfigured resources instead of a direct firm performance measure to better conceptually
connect the RBV and the DCV. The results show that, on the one hand, a broad intake of
externally acquired technological resources has a positive impact on a firm’s subsequent
resource reconfiguration within the firm; on the other hand, this positive impact needs to be,
at least partially, translated and transformed accordingly through changes in dynamic
capabilities. This also means that dynamic capabilities vary in response to the variation in
external learning activities and develop accordingly. This variation, in turn, influences a
firm’s resource reconfiguration to some degree. When a firm obtains access to a broad range
of external technological knowledge, it will be motivated and urged to increase internal R&D
and diversify its internal technology base to cope with the increasing complexity associated
with the broadened external knowledge search. Overall, our findings also shed light on the
research challenge with regard to reducing causal ambiguity between a task and its
performance outcomes by deploying an explicit articulation and codification mechanism to
develop dynamic capabilities (Zollo & Winter, 2002).
From a DCV, we argue that R&D expenditures and technology diversification are two
microfoundations of a firm’s dynamic technological capabilities, as first-order capabilities.
The results suggest that (1) both in-house R&D and technological diversification positively
contribute to resource reconfiguration of a firm; (2) technological diversification makes much
stronger direct positive contribution to TIP than in-house R&D does; (3) but when the scope
of a firm’s external technology resources is broadened, the positive contribution of external
technology breadth to TIP relies very much on the in-house R&D at the first place (stronger
29
mediation) and much less dependent on technological diversification (weaker mediation).
These interesting findings suggests that to effectively reconfigure a firm’s technological
resources, a firm has dual strategies: (1) to primarily focus on developing and strengthening
technological diversification, when the scope of external technology access is not an issue; (2)
to pay immediate attention to enhancing in-house R&D, when the scope of external
technology access is broadened.
Furthermore, the effect size of the indirect effect is found quite small and a big portion
of the indirect effect comes from in-house R&D compared to technology diversification. Our
interpretation about this finding is that when a firm broadens its external technology resources,
different microfoundations of capabilities change accordingly to different degrees. It is
perhaps easier to directly change in-house R&D expenditures, but it might take longer time to
realize the desired change of diversification of a firm’s technology base because technology
diversification involves a learning process which entails more uncertain outcomes.
In the case of partial mediation, it is necessary to discuss if indirect effects of other
variables could (and probably should) affect the causal effects (Rucker et al., 2011). We
hereby provide two insights for discussion. First, as the indirect effect of technological
capabilities in our model is small in effect size, it is reasonable to expect that there might be
other first-order capabilities that mediate the potential positive contribution of broad external
technology access. For instance, another source of indirect effect might be a function of
dynamic managerial capabilities, which are defined as the capabilities with which managers
build, integrate, and reconfigure organizational resources and competences (Adner & Helfat,
2003; Helfat & Martin, 2015; Helfat & Peteraf, 2015). Firms that seek broad external
technological resources probably also need strong capabilities of top managers to unleash the
potential of external technological resources. Second, beyond first-order capabilities, the
literature has suggested that there are second-order capabilities, which are a higher-order of
30
organizational heuristics of “learning-to-learn” from lower-order capabilities (Schilke, 2014).
Although empirical studies on the interplay among different levels of dynamic capabilities
and their impacts on firm performance are rare, the idea that various types and levels of
dynamic capabilities coexist and co-develop within a firm may provide a reasonable
theoretical explanation on why the indirect effect of dynamic technological capabilities alone
has a small effect size. This could be a highly interesting direction for future research.
The findings provide some practical implications for innovation managers who are
interested in taking advantage of external knowledge resources but struggle to determine how
to transform external resources into reconfigured internal resources that can lead to
competitive advantages. Innovation managers understand the positive contribution of external
knowledge acquisition with a broad search scope, but they often need to justify the continuous
commitment from top management in terms of internal R&D investment and internal
diversification of the firm’s knowledge base. These demanding tasks do not always receive
equal attention from the top management if they are separately raised before the leadership. In
this respect, our study enables innovation managers to formulate a sound argument that, first,
despite how broad the scope of a firm’s external technology resource is, it is usually
beneficial to develop technological capabilities and a premium needs to be put on
technological diversification; second, to realize the full potential of accessing a broad scope of
external technologies, a company must routinely develop dynamic capabilities in response to
the enlarged exposure to external knowledge sources by primarily following up with
increasing R&D expenditures and meanwhile considering technological diversification. This
logic can also be used in reverse – for example, a good way to secure a sufficient level of
R&D and technological diversification within a firm is to maintain a sufficient level of
external knowledge searching. In this way, innovation managers may find it helpful to
31
identify and justify the level of R&D expenditure and technological diversification by
assessing the existing breadth and complexity of externally acquired knowledge resources.
This study has limitations. First, it relies on the patent licensing as the main channel to
access external knowledge sources. There are other means through which external knowledge
resources can be acquired, e.g., joint ventures, merger and acquisitions, and spillover effects
from informal knowledge sharing (Ahuja & Katila, 2001; Vanhaverbeke, Duysters,
Noorderhaven, 2002; Nieto & Santamaría, 2007). Future research is encouraged to investigate
these alternatives and their impacts on dynamic capabilities and resource reconfiguration.
Second, in this study, we only focus on the breadth of external technology sources, while
other characteristics of external technologies are not considered. Future studies should include
other characteristics of external technologies in the mediation model, e.g., technology
importance, generality, newness, applicability, and maturity (Wang, Zhou, & Li-Ying, 2013).
Conclusion
This study investigates the relationship between external resources and internal resource
reconfiguration via the mediating role of firms’ dynamic technological capabilities based on
the RBV and the DCV. We find that the benefits derived from a broad access to external
technologies must be to some extent translated into and transformed by corresponding dynamic
capabilities at the first place. In this sense, capabilities are “dynamic” because they interact
with the emerging demands caused by the change in accessible external resources and
recurrently define firm performance. More importantly, managers should take notes that
different microfoundations of dynamic technological capabilities play their mediation roles
differently in reaction to the changing scope of external technological resources.
32
References
Acs, Z. J., & Audretsch, D. B. 1989. Patents as a measure of innovative activity. Kyklos, 42: 171-180.
Adner, R., & Helfat, C. E. 2003. Corporate effects and dynamic managerial capabilities. Strategic
Management Journal, 24(10): 1011-1025.
Ahuja, G., & Katila, R. 2001. Technological acquisitions and the innovation performance of acquiring
firms: A longitudinal study. Strategic Management Journal, 22(3): 197-220.
Ambrosini, V., & Bowman, C. 2009. What are dynamic capabilities and are they a useful construct in
strategic management? International Journal of Management Reviews, 11: 29-49.
Arend, R.J., & Bromiley, P. 2009. Assessing the dynamic capabilities view: spare change, everyone?
Strategic Organization, 7: 75-90.
Argyris, C., & Schön, D.A. 1978. Organizational learning: A theory of action perspective. Reading,
MA: Addison-Wesley.
Argyres, N. 1996. Capabilities, technological diversification and divisionalization. Strategic
Management Journal, 17: 395-410.
Ashby, W. R. 1965. An Introduction to Cybernetics. Methuen: London.
Barney, J. 1991. Firm resources and sustained competitive advantage. Journal of Management, 17(1):
99-120.
Barney, J., Wright, M., & Ketchen Jr, D. J. 2001. The resource-based view of the firm: Ten years after
1991. Journal of Management, 27(6): 625-641.
Baron, R. M., & Kenny, D. A. 1986. The moderator-mediator variable distinction in social
psychological research. Journal of Personality and Social Psychology, 51(6): 1173-1182.
Belsley, D. A. 1980. On the efficient computation of the nonlinear full-information maximum-
likelihood estimator. Journal of Econometrics, 14(2): 203-225.
Bingham, C. B., Eisenhardt, K. M., Furr, N. R., 2007. What makes a process a capability? Heuristics,
strategy and effective capture of opportunities. Strategic Entrepreneurship Journal, 1(1): 27–47.
Breschi, S., Lissoni, F., & Malerba, F. 2003. Knowledge-relatedness in firm technological
diversification. Research Policy, 32(1): 69-87.
Caloghirou, Y., Kastelli, I., & Tsakanikas, A. 2004. Internal capabilities and external knowledge
sources: complements or substitutes for innovative performance? Technovation, 24(1): 29-39.
Chandler, A. D., & Hikino, T. 1990. Scale and scope: The dynamics of industrial capitalism.
Cambridge, Mass: Belknap Press.
Chandrashekhar, G. R. G. 2006. Examining the impact of internationalization on competitive
dynamics. Asian Business & Management, 5(3): 399-417.
Chen, X., & Sun, C. 2000. Technology transfer to China: Alliances of Chinese enterprises with
western technology exporters. Technovation, 20: 353-362.
Chen, M.-J., Su, K.-S., & Tsai, W. 2007. Competitive tension: The awareness-motivation-capability
perspective. Academy of Management Journal, 50: 101-118.
Chen, J., Chen, Y., & Vanhaverbeke, W. 2011. The influence of scope, depth, and orientation of
external technology sources on the innovative performance of Chinese firms. Technovation, 31(8):
362-373.
Chesbrough, H. W. 2003. Open Innovation: The new imperative for creating and profiting from
technology. Boston, Mass: Harvard Business School Press.
33
Chiang, Y.-H., & Hung, K.-P. 2010. Exploring open search strategies and perceived innovation
performance from the perspective of inter-organizational knowledge flows. R&D Management,
40: 292--299.
Chiaroni, D., Chiesa, V., & Frattini, F. 2010. Unravelling the process from Closed to Open Innovation:
evidence from mature, asset-intensive industries. R&D Management, 40(3): 222-245.
Clogg, C. C., Petkova, E., & Shihadeh, E. S. 1992. Statistical methods for analyzing collapsibility in
regression models. Journal of Educational and Behavioral Statistics, 17(1): 51-74.
Cohen, W. M., & Levinthal, D. A. 1990. Absorptive capacity: A new perspective on learning and
innovation. Administrative Science Quarterly, 35: 128-152.
Collis, D. J. 1994. Research note: How valuable are organizational capabilities? Strategic
Management Journal, 15: 143–152.
Cowan, R., & Foray, D. 2000. The economics of codification and the diffusion of knowledge.
Industrial and Corporate Change, 6: 595-622.
Coombs, J. E., & Bierly, P. E. 2006. Measuring technological capability and performance. R&D
Management, 36: 421–438.
Cummings, J. L., & Teng, B.-S. 2003. Transferring R&D knowledge: the key factors affecting
knowledge transfer success. Journal of Engineering and Technology Management, 20(1-2): 39-
68.
Durand, R., Bruyaka, O., & Mangematin, V. 2008. Do science and money go together? The case of the
French biotech industry. Strategic Management Journal, 29(12): 1281-1299.
Edwards, J. R., & Lambert, L. S. 2007. Methods for integrating moderation and mediation: a general
analytical framework using moderated path analysis. Psychological Methods, 12(1): 1-22.
Enkel, E., Gassmann, O., & Chesbrough H. 2009. Open R&D and open innovation: exploring the
phenomenon. R&D Management, 39(4): 311-316.
Eisenhardt, K. M., & Martin, J. A. 2000. Dynamic capabilities: What are they? Strategic Management
Journal, 21(10/11): 1105-1121.
Ernst, H. 2003. Patent information for strategic technology management. World Patent Information,
25: 233-242.
Fleming, L. 2001. Recombinant uncertainty in technological search. Management Science, 47(1): 117-
132.
Freedman, L. S., & Schatzkin, A. 1992. Sample size for studying intermediate endpoints within
intervention trials or observational studies. American Journal of Epidemiology, 136(9): 1148-
1159.
Garcia-Vega, M. 2006. Does technological diversification promote innovation?: An empirical analysis
for European firms. Research Policy, 35(2): 230-246.
Granstrand, O., & Sjölander, S. 1990. The acquisition of technology and small firms by large firms.
Journal of Economic Behavior & Organization, 13(3): 367-386.
Granstrand, O., Bohlin, E., Oskarsson, C., & Sjöberg, N. 2007. External technology acquisition in
large multi-technology corporations. R&D Management, 22(2): 111-134.
Grant, R. M. 1996. Toward a knowledge-based theory of the firm. Strategic Management Journal, 17:
109-122.
Griliches, Z. 1992. The search for R&D spillovers. Scandinavian Journal of Economics, 94: S29-S47.
Hall, B. H., Jaffe, A., & Trajtenberg, M. 2001. The NBER patent citations data file: Lessons, insights,
and methodological tools. In Jaffe, & Trajtenberg (Eds.), Patents, Citations, and Innovations.
Cambridge, MA: MIT Press.
34
Hausman, J. A., & Griliches, Z. 1984. Econometric models for count data with an application to the
patents-R&D relationship. Economic and Political Weekly, 27: 909-938.
Helfat, C. E. 1997. Know-how and asset complementarity and dynamic capability accumulation: The
case of R&D. Strategic Management Journal, 18: 339–360.
Helfat, C. E., Finkelstein, S., Mitchell, W., Peteraf, M., Singh, H., Teece, D., & Winter, S. 2007.
Dynamic Capabilities: Understanding Strategic Change in Organizations. London: Blackwell.
Helfat, C. E., & Martin, J. A. 2015. Dynamic Managerial Capabilities: Review and Assessment of
Managerial Impact on Strategic Change. Journal of Management, 41(5): 1281–1312.
Helfat, C.E., & Peteraf, M. A. 2009. Understanding dynamic capabilities: Progress along a
developmental path. Strategic Organization, 7: 91-102.
Helfat, C. E., & Peteraf, M. A. 2015. Managerial cognitive capabilities and the microfoundations of
dynamic capabilities. Strategic Management Journal, 36(6): 831-850.
Henderson, R., & Clark, K. B. 1990. Architectural innovation: The reconfiguration of existing product
technologies and the failure of established firms. Administrative Science Quarterly, 35(1): 9-30.
Henderson, R., & Cockburn, I. 1996. Scale, scope, and spillovers: The determinants of research
productivity in drug discovery. Rand Journal of Economics, 27(1): 32-59.
Hilbe, J. M. 2011. Negative Binomial Regression. Cambridge: Cambridge University Press.
Hitt, M. A., Ireland, R. D., & Lee, H.-u. 2000. Technological learning, knowledge management, firm
growth and performance: an introductory essay. Journal of Engineering and Technology
Management, 17(3-4): 231-246.
Hobday, M. 1994. Technological learning in Singapore: A test case of leapfrogging. Journal of
Development Studies, 30(4): 831-858.
Huber, G. P. 1991. Organizational learning: The contributing processes and the literatures.
Organization Science, 2(1): 88-115.
Imai, K., Keele, L., & Tingley, D. 2010. A general approach to causal mediation analysis.
Psychological Methods, 15: 309-334.
Jaffe, A. 1986. Technological opportunity and spillovers of R&D: Evidence from firms' patents,
profits, and market value. American Economic Review, 76(5): 984-1002.
Johnson, D. K. N. 2002. 'Learning-by-licensing': R&D and technology licensing in Brazilian invention.
Economics of Innovation & New Technology, 11(3): 163-177.
Jones, G. K., & Lanctot, J. A. 2001. Determinants and performance impacts of external technology
acquisition. Journal of Business Venturing, 16(3): 255-283.
Katila, R., & Ahuja, G. 2002. Something old, something new: A longitudinal study of search behavior
and new product introduction. Academy of Management Journal, 45: 1183-1194.
Katrak, H. 1990. Imports of technology and the technological effort of Indian enterprises. World
Development, 18(3): 371-381.
Kim, L., & Nelson, R. R. 2000. Technology, Learning and Innovation: Experiences of Newly
Industrializing Economies. Cambridge: Cambridge University Press.
Kogut, B., & Zander, U. 1996. What firms do? Coordination, identity, and learning. Organization
Science, 7(5): 502-518.
Kollmer, H., & Dowling, M. 2004. Licensing as a commercialisation strategy for new technology-
based firms. Research Policy, 33: 1141-1151.
Lane, P. J., & Lubatkin, M. 1998. Relative absorptive capacity and interorganizational learning.
Strategic Management Journal, 19(5): 461-477.
35
Laursen, K., & Salter, A. 2006. Open for innovation: The role of openness in explaining innovation
performance among UK manufacturing firms. Strategic Management Journal, 27: 131–150.
Laursen, K., Leone, M. I., & Torrisi, S. 2010. Technological exploration through licensing: New
insights from the licensee's point of view. Industrial & Corporate Change, 19(3): 871-897.
Leiponen, A., & Helfat, C. E. 2010. Innovation objectives, knowledge sources, and the benefits of
breadth. Strategic Management Journal, 31: 224-236.
Leone, M. I., & Reichstein, T. 2012. Licensing fosters rapid innovation! The effect of the grant-back-
clause and technological unfamiliarity. Strategic Management Journal, 33: 965-985.
Li, X. 2011. Sources of external technology, absorptive capacity, and innovation capability in Chinese
state-owned high-tech enterprises. World Development, 39(7): 1240-1248.
Li, X., & Wu, G. 2010. In-house R&D, technology purchase and innovation: Empirical evidences
from Chinese hi-tech industries, 1995-2004. International Journal of Technology Management,
51(2): 217-238.
Liang, K.-Y., & Zeger, S. L. 1986. Longitudinal data analysis using generalized linear models.
Biometrika, 73(1): 13-22.
Lin, B.-W. 2003. Technology transfer as technological learning: A source of competitive advantage
for firms with limited R&D resources. R&D Management, 33(3): 327-341.
Lin, B. W., Chen, C. J., & Wu, H. L. 2006. Patent portfolio diversity, technology strategy, and firm
value. IEEE Transactions on Engineering Management, 53: 17-26.
Liu, X., & White, R. S. 1997. The relative contributions of foreign technology and domestic inputs to
innovation in Chinese manufacturing industries. Technovation, 17(3): 119-125.
Li-Ying, J., Wang, Y., Salomo, S., & Vanhaverbeke, W. 2013. Have Chinese firms learnt from their
prior technology in-licensing? An analysis based on patent citations. Scientometrics, 95(1):183-
195.
Li-Ying, J., Wang, Y., & Salomo, S. 2014. An inquiry on external technology search through patent
in-licensing and firms’ technological innovations: evidence from china. R&D Management, 44(1):
53–74.
Li-Ying, J., & Wang, Y. 2015. Find them home or abroad? The relative contribution of international
technology in-licensing to the 'indigenous innovation' in China. Long Range Planning, 48(3):
123-134.
Marcotte, C., & Niosi, J. 2000. Technology transfer to China: The issues of knowledge and learning.
Journal of Technology Transfer, 25: 43-57.
MacKinnon, D. P., Lockwood, C. M., Hoffman, J. M., West, S. G., & Sheets, V. 2002. A comparison
of methods to test mediation and other intervening variable effects. Psychological Methods, 7(1):
83.
Matusik, S. F., & Hill, C. W. L. 1998. The utilization of contingent work, knowledge creation, and
competitive advantage. Academy of Management Review, 23(4): 680-697.
McGrath, R. G., Macmillan, I. C., & Venkataraman, S. 1995. Defining and developing competence: A
strategic process paradigm. Strategic Management Journal, 16(4): 251-275.
Miller, D. J. 2006. Technological diversity, related diversification, and firm performance. Strategic
Management Journal, 27(7): 601-619.
Mowery, D., & Rosenberg, N. 1998. Paths of innovation: technological change in 20th century
America. Cambridge: Cambridge University Press.
Nellson, R. R. 1959. The simple economics of basic scientific research. Journal of Political Economy,
67: 297-306.
36
Nelson, R. R., & Winter, S. G. 1982. An evolutionary theory of economic change. Boston: Belknap
Press of Harvard University Press.
Newbert, S. L. 2008. Value, rareness, competitive advantage, and performance: a conceptual‐level
empirical investigation of the resource-based view of the firm. Strategic management journal,
29(7): 745-768.
Nieto, M. J., & Santamaría, L. 2007. The importance of diverse collaborative networks for the novelty
of product innovation. Technovation, 27(6/7): 367-377.
Nooteboom, B., Vanhaverbeke, W., Duysters, G., Gilsing, V., & van den Oord, A. 2007. Optimal
cognitive distance and absorptive capacity. Research Policy, 36: 1016-1034.
Ndofor, H. A., Sirmon, D. G., & He, X. 2011. Firm resources, competitive actions and performance:
investigating a mediated model with evidence from the in-vitro diagnostics industry. Strategic
Management Journal, 32(6): 640-657.
Ozman, M. 2007. Breadth and depth of main technology fields: an empirical investigation using patent
data. Science and Technology Policies Research Center Working Paper Series, 7(01) .
Pakes, A., & Griliches, Z. 1980. Patents and R&D at the firm level: A first report. Economics Letters,
5(4): 377-381.
Patel, P., & Pavitt, K. 1997. The technological competencies of the world's largest firms: Complex and
path-dependent, but not. Research Policy, 26(2): 141-156.
Penrose, E.T. 1959. The Theory of Growth of the Firm. Oxford University Press: Oxford, UK.
Peteraf, M. 1993. The cornerstones of competitive advantage: A resource-based view. Strategic
Management Journal, 14: 179-191.
Peteraf, M. A., Bergen, M. E. 2003. Scanning dynamic competitive landscapes: a market-based and
resource-based framework. Strategic Management Journal, 24: 1027-1041.
Prencipe, A. 2000. Breadth and depth of technological capabilities in CoPS: the case of the aircraft
engine control system. Research Policy, 29(7-8): 895-911.
Rosenkopf, L., & Nerkar, A. 2001. Beyond local search: Boundary-spanning, exploration, and impact
in the optical disk industry. Strategic Management Journal, 22(4): 287-306.
Rucker, D. D., Preacher, K. J., Tormala, Z. L., & Petty, R. E. 2011. Mediation analysis in social
psychology: Current practices and new recommendations. Social and Personality Psychology
Compass, 5(6): 359-371.
Schilke, O. 2014. Second-order dynamic capabilities: How do they matter? Academy of Management
Perspectives, 28(4): 368–380.
Schmidt, J., & Keil, T. 2013. What makes a resource valuable? Identifying the drivers of firm-
idiosyncratic resource value. Academy of Management Review, 38(2): 206–228.
Schreyögg, G., & Kliesch-Eberl, M. 2007. How dynamic can organizational capabilities be? Towards
a dual‐process model of capability dynamization. Strategic Management Journal, 28(9): 913-
933.
Sen, F., & Rubenstein, A. H. 1989. External technology and in-house R&D's facilitative role. Journal
of Product Innovation Management, 6(2): 123-138.
Shrout, P. E., & Bolger, N. 2002. Mediation in experimental and nonexperimental studies: New
procedures and recommendations. Psychological Methods, 7: 422-445.
Silverman, B. S. 1999. Technological resources and the direction of corporate diversification: Toward
an integration of the resource-based view and transaction cost economics. Management Science,
45(8): 1109-1124.
37
Sirmon, D. G., & Hitt, M. A. 2009. Contingencies within dynamic managerial capabilities:
interdependent effects of resource investment and deployment on firm performance. Strategic
Management Journal, 30(13): 1375-1394.
Singh, J. 2008. Distributed R&D, cross-regional knowledge integration and quality of innovative
output. Research Policy, 37(1): 77-96.
Sobel, M. E. 1982. Asymptotic confidence intervals for indirect effects in structural equation models.
Sociological methodology, 13(1982), 290-312. Sociological Methodology, 13: 290-312.
Stuart, T. E. 2000. Interorganizational alliances and the performance of firms: a study of growth and
innovation rates in high-technology industry. Strategic Management Journal, 21: 791-811.
Stuart, T. E., & Podolny, J. M. 1996. Local search and the evolution of technological capabilities.
Strategic Management Journal, 17: 21-38.
Sun, Y., & Du, D. 2010. Determinants of Industrial Innovation in China: Evidence From its Recent
Economic Census. Technovation, 30(9-10): 540-550.
Sydow, J., Schreyögg, G., & Koch, J. 2009. Organizational path dependence: Opening the black box.
Academy of Management Review, 34(4): 689-709.
Teece, D. J., Pisano, G., & Shuen, A. 1997. Dynamic capabilities and strategic management. Strategic
Management Journal, 18(7): 509-533.
Teece, D. J. 2007. Explicating dynamic capabilities: the nature and microfoundations of (sustainable)
enterprise performance. Strategic management journal, 28(13): 1319-1350.
Teece, D. J. 2014. The foundations of enterprise performance: Dynamic and ordinary capabilities in an
(economic) theory of firms. Academy of Management Perspectives, 28(4): 328–352.
Trajtenberg, M. 1990. A penny for your quotes: Patent citations and the value of innovations. Rand
Journal of Economics, 21(1): 172-187.
Tsai, K.-H., & Wang, J.-C. 2007. Inward technology licensing and firm performance: A longitudinal
study. R&D Management, 37(2): 151-160.
Tsai, K.-H., & Wang, J.-C. 2009. External technology sourcing and innovation performance in LMT
sectors: An analysis based on the Taiwanese technological innovation survey. Research Policy,
38(3): 518-526.
Tsai, K.-H., Hsieh, M.-H., & Hultink, E. J. 2011. External technology acquisition and product
innovativeness: The moderating roles of R&D investment and configurational context. Journal of
Engineering and Technology Management, 28(3): 184-200.
Vanhaverbeke, W., Duysters, G., & Noorderhaven, N. 2002. External technology sourcing through
alliances or acquisitions: An analysis of the application-specific integrated circuits industry.
Organization Science, 13(6): 714-733.
Wang, Q., & von Tunzelmann, N. 2000. Complexity and the functions of the firm: breadth and depth.
Research Policy, 29(7-8): 805-818.
Wang, Y., Zhou, Z., & Li-Ying, J. 2013. The impact of licensed knowledge attributes on innovation
performance of licensee firms: evidence from Chinese electronic industry. Journal of Technology
Transfer, 38 (5): 699–715.
Wang, Y., & Li-Ying, J. 2014. When does inward technology licensing facilitate firms' NPD
performance? A contingency perspective. Technovation , 34(1): 44-53.
Wang, Y., Jin, P., & Yang, C. 2015. Relations between the professional backgrounds of independent
directors in state-owned enterprises and corporate performance. International Review of
Economics & Finance. Online early view, doi: 10.1016/j.iref.2015.10.011.
West, J., & Bogers, M. 2014. Leveraging external sources of innovation: A review of research on open
innovation. Journal of Product Innovation Management, 31(4): 814-831.
38
Winter, S. G. 2003. Understanding dynamic capabilities. Strategic Management Journal, 24: 991-995.
Xue, L. 1997. A historical perspective of China's innovation system reform: A case study. Journal of
Engineering and Technology Management, 14(1): 67-81.
Zahra, S. A. 1996. Technology strategy and financial performance: Examining the moderating role of
the firm's competitive environment. Journal of Business Venturing, 11(3): 189-219.
Zahra, S. A., & George, G. 2002. Absorptive capacity: A review, reconceptualization and extension.
Academy of Management Review, 27(2): 185-203.
Zhang, J., & Baden-Fuller, C. 2010. The influence of technological knowledge base and
organizational structure on technology collaboration. Journal of Management Studies, 47(4):
679-704.
Zollo, M., & Winter, S. 2002. Deliberate learning and the evolution of dynamic capabilities.
Organization Science, 13: 339–351.
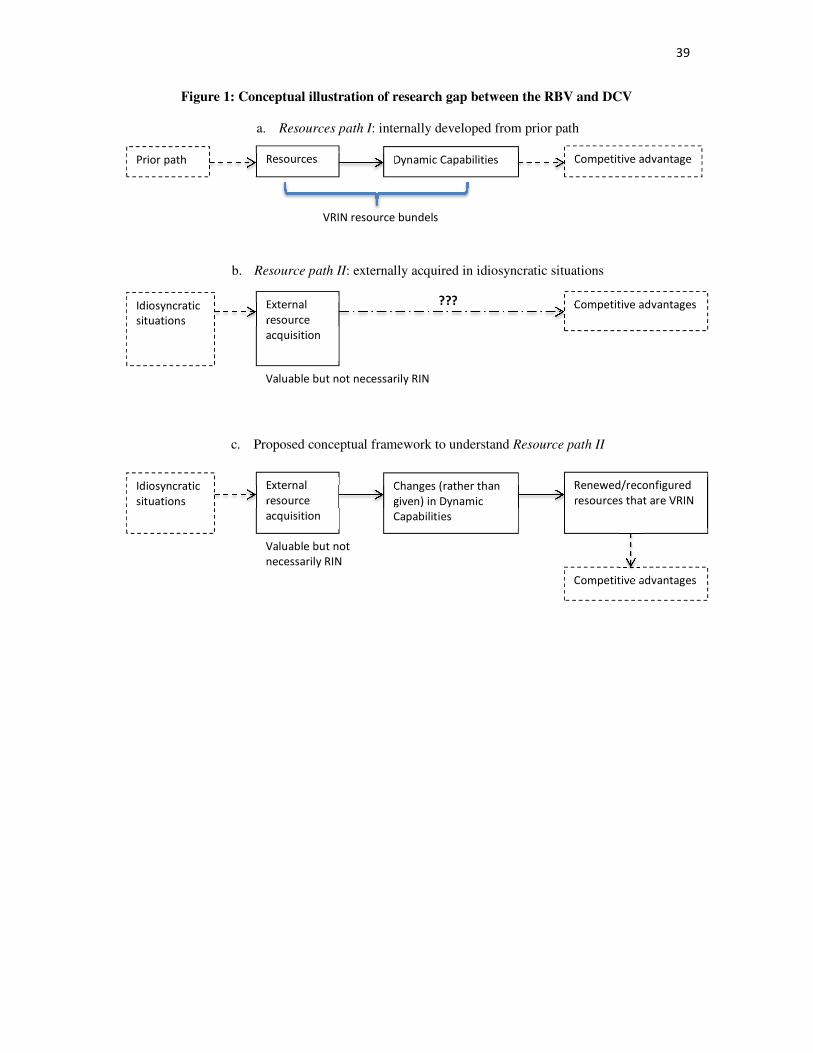
39
Figure 1: Conceptual illustration of research gap between the RBV and DCV
a. Resources path I: internally developed from prior path
b. Resource path II: externally acquired in idiosyncratic situations
c. Proposed conceptual framework to understand Resource path II
Prior path Resources Dynamic Capabilities Competitive advantage
VRIN resource bundels
Idiosyncratic
situations
External
resource
acquisition
Competitive advantages
Valuable but not necessarily RIN
???
Idiosyncratic
situations
External
resource
acquisition
Changes (rather than
given) in Dynamic
Capabilities
Renewed/reconfigured
resources that are VRIN
Valuable but not
necessarily RIN
Competitive advantages
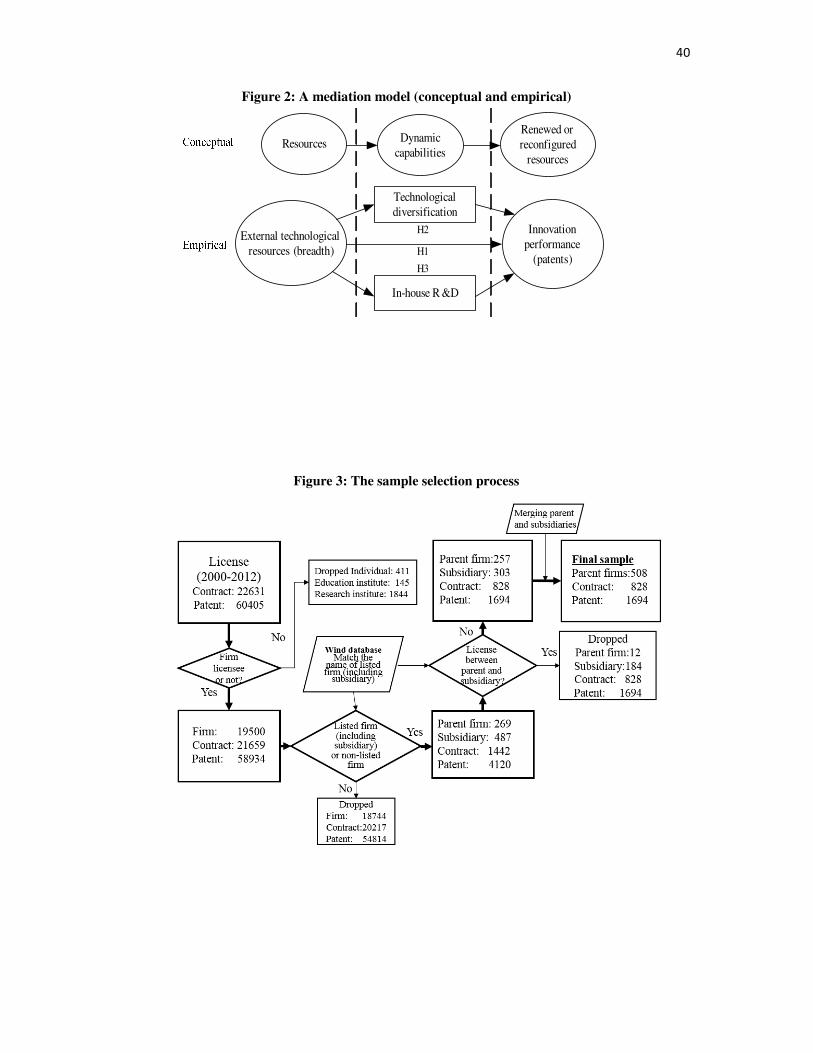
40
Figure 2: A mediation model (conceptual and empirical)
Figure 3: The sample selection process
Technological
diversification
In-house R &D
Resources
H1
Dynamic
capabilities
Renewed or
reconfigured
resources
External technological
resources (breadth)
Innovation
performance
(patents)
H2
H3
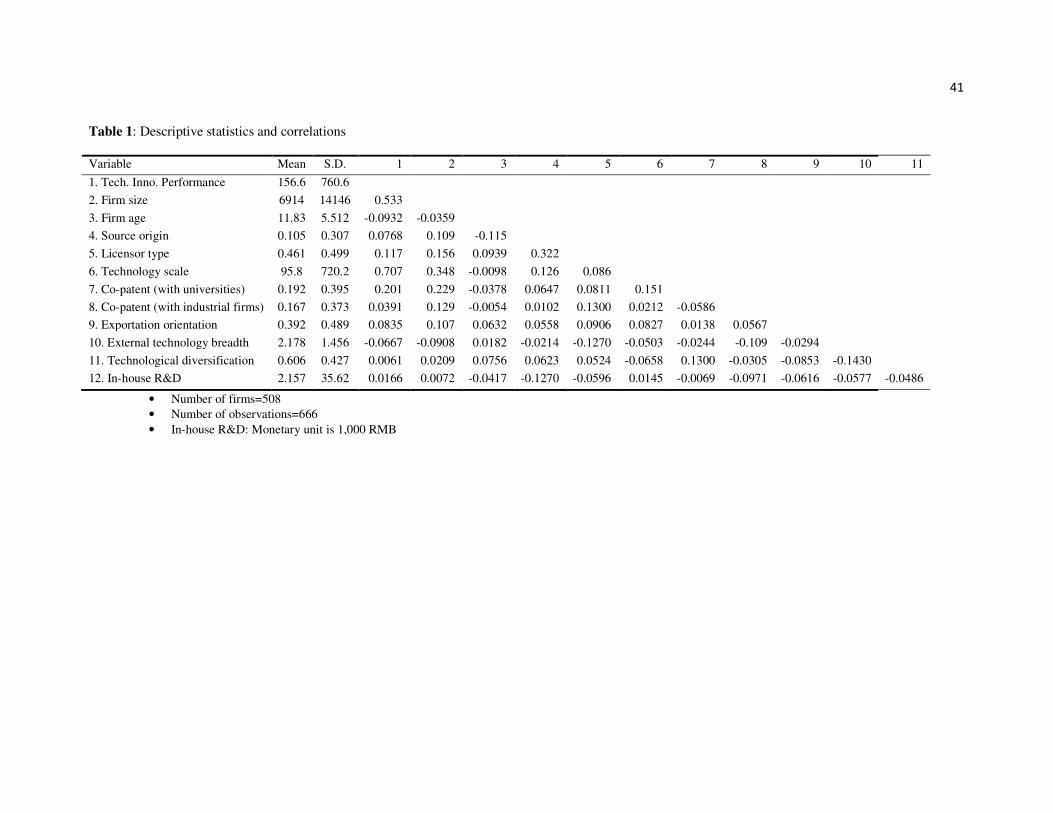
41
Table 1: Descriptive statistics and correlations
Variable Mean S.D. 1 2 3 4 5 6 7 8 9 10 11
1. Tech. Inno. Performance 156.6 760.6
2. Firm size 6914 14146 0.533
3. Firm age 11.83 5.512 -0.0932 -0.0359
4. Source origin 0.105 0.307 0.0768 0.109 -0.115
5. Licensor type 0.461 0.499 0.117 0.156 0.0939 0.322
6. Technology scale 95.8 720.2 0.707 0.348 -0.0098 0.126 0.086
7. Co-patent (with universities) 0.192 0.395 0.201 0.229 -0.0378 0.0647 0.0811 0.151
8. Co-patent (with industrial firms) 0.167 0.373 0.0391 0.129 -0.0054 0.0102 0.1300 0.0212 -0.0586
9. Exportation orientation 0.392 0.489 0.0835 0.107 0.0632 0.0558 0.0906 0.0827 0.0138 0.0567
10. External technology breadth 2.178 1.456 -0.0667 -0.0908 0.0182 -0.0214 -0.1270 -0.0503 -0.0244 -0.109 -0.0294
11. Technological diversification 0.606 0.427 0.0061 0.0209 0.0756 0.0623 0.0524 -0.0658 0.1300 -0.0305 -0.0853 -0.1430
12. In-house R&D 2.157 35.62 0.0166 0.0072 -0.0417 -0.1270 -0.0596 0.0145 -0.0069 -0.0971 -0.0616 -0.0577 -0.0486
• Number of firms=508
• Number of observations=666
• In-house R&D: Monetary unit is 1,000 RMB
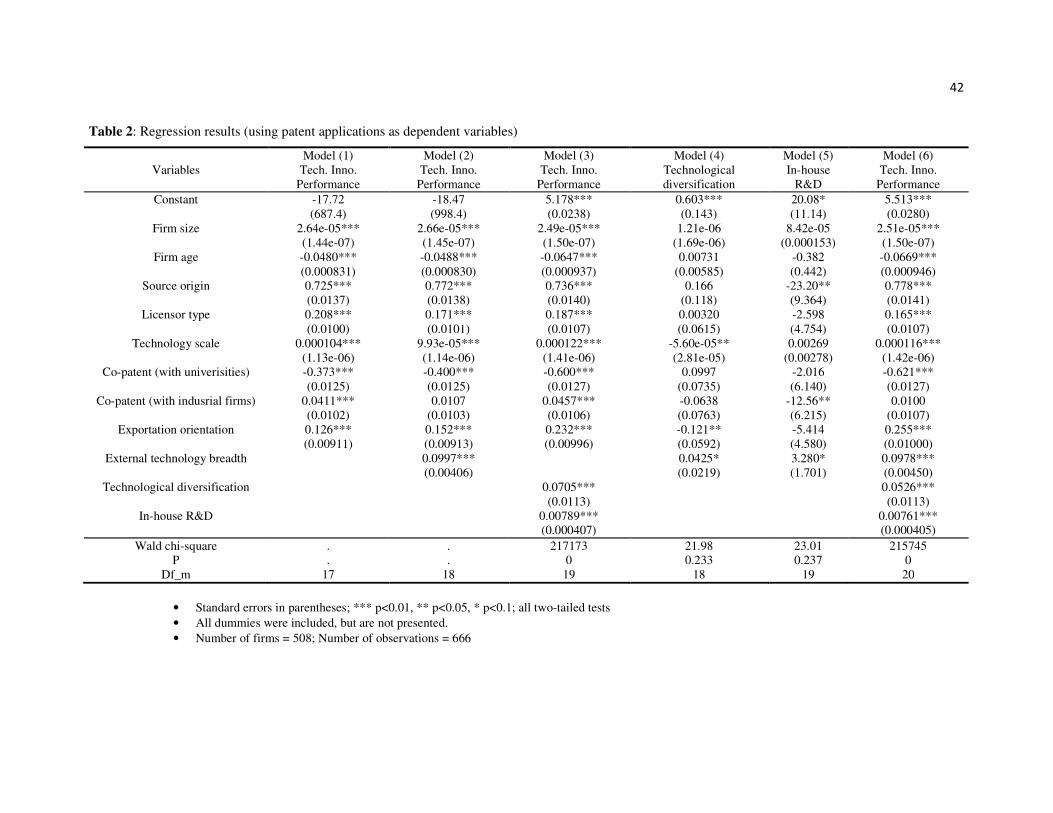
42
Table 2: Regression results (using patent applications as dependent variables)
Model (1) Model (2) Model (3) Model (4) Model (5) Model (6)
Variables Tech. Inno.
Performance
Tech. Inno.
Performance
Tech. Inno.
Performance
Technological
diversification
In-house
R&D
Tech. Inno.
Performance
Constant -17.72 -18.47 5.178*** 0.603*** 20.08* 5.513***
(687.4) (998.4) (0.0238) (0.143) (11.14) (0.0280)
Firm size 2.64e-05*** 2.66e-05*** 2.49e-05*** 1.21e-06 8.42e-05 2.51e-05***
(1.44e-07) (1.45e-07) (1.50e-07) (1.69e-06) (0.000153) (1.50e-07)
Firm age -0.0480*** -0.0488*** -0.0647*** 0.00731 -0.382 -0.0669***
(0.000831) (0.000830) (0.000937) (0.00585) (0.442) (0.000946)
Source origin 0.725*** 0.772*** 0.736*** 0.166 -23.20** 0.778***
(0.0137) (0.0138) (0.0140) (0.118) (9.364) (0.0141)
Licensor type 0.208*** 0.171*** 0.187*** 0.00320 -2.598 0.165***
(0.0100) (0.0101) (0.0107) (0.0615) (4.754) (0.0107)
Technology scale 0.000104*** 9.93e-05*** 0.000122*** -5.60e-05** 0.00269 0.000116***
(1.13e-06) (1.14e-06) (1.41e-06) (2.81e-05) (0.00278) (1.42e-06)
Co-patent (with univerisities) -0.373*** -0.400*** -0.600*** 0.0997 -2.016 -0.621***
(0.0125) (0.0125) (0.0127) (0.0735) (6.140) (0.0127)
Co-patent (with indusrial firms) 0.0411*** 0.0107 0.0457*** -0.0638 -12.56** 0.0100
(0.0102) (0.0103) (0.0106) (0.0763) (6.215) (0.0107)
Exportation orientation 0.126*** 0.152*** 0.232*** -0.121** -5.414 0.255***
(0.00911) (0.00913) (0.00996) (0.0592) (4.580) (0.01000)
External technology breadth 0.0997*** 0.0425* 3.280* 0.0978***
(0.00406) (0.0219) (1.701) (0.00450)
Technological diversification 0.0705*** 0.0526***
(0.0113) (0.0113)
In-house R&D 0.00789*** 0.00761***
(0.000407) (0.000405)
Wald chi-square . . 217173 21.98 23.01 215745
P . . 0 0.233 0.237 0
Df_m 17 18 19 18 19 20
• Standard errors in parentheses; *** p<0.01, ** p<0.05, * p<0.1; all two-tailed tests
• All dummies were included, but are not presented.
• Number of firms = 508; Number of observations = 666
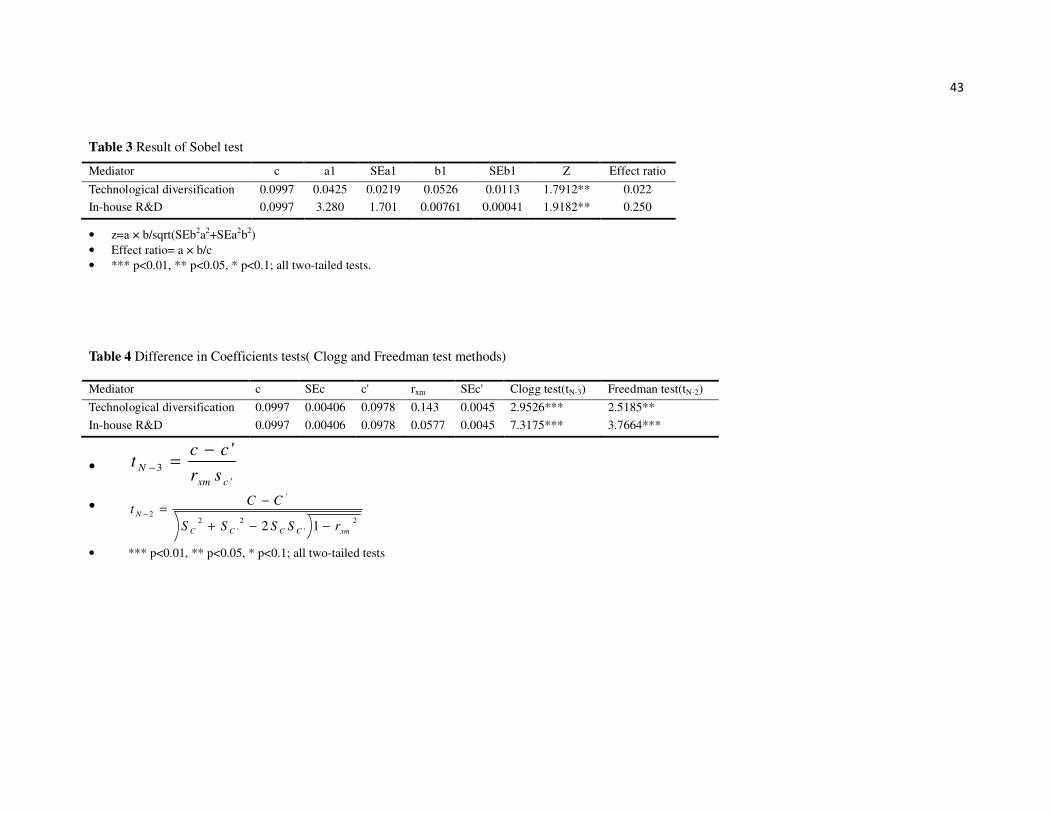
43
Table 3 Result of Sobel test
• z=a × b/sqrt(SEb2a2+SEa2b2)
• Effect ratio= a × b/c
• *** p<0.01, ** p<0.05, * p<0.1; all two-tailed tests.
Table 4 Difference in Coefficients tests( Clogg and Freedman test methods)
Mediator c SEc c' rxm SEc' Clogg test(tN-3) Freedman test(tN-2)
Technological diversification 0.0997 0.00406 0.0978 0.143 0.0045 2.9526*** 2.5185**
In-house R&D 0.0997 0.00406 0.0978 0.0577 0.0045 7.3175*** 3.7664***
• '
3
'
cxm
Nsr
cct
−=
−
• 2
'
2
'
2
'
2
12 xmCCCC
N
rSSSS
CCt
−−+
−=
−
• *** p<0.01, ** p<0.05, * p<0.1; all two-tailed tests
Mediator c a1 SEa1 b1 SEb1 Z Effect ratio
Technological diversification 0.0997 0.0425 0.0219 0.0526 0.0113 1.7912** 0.022
In-house R&D 0.0997 3.280 1.701 0.00761 0.00041 1.9182** 0.250
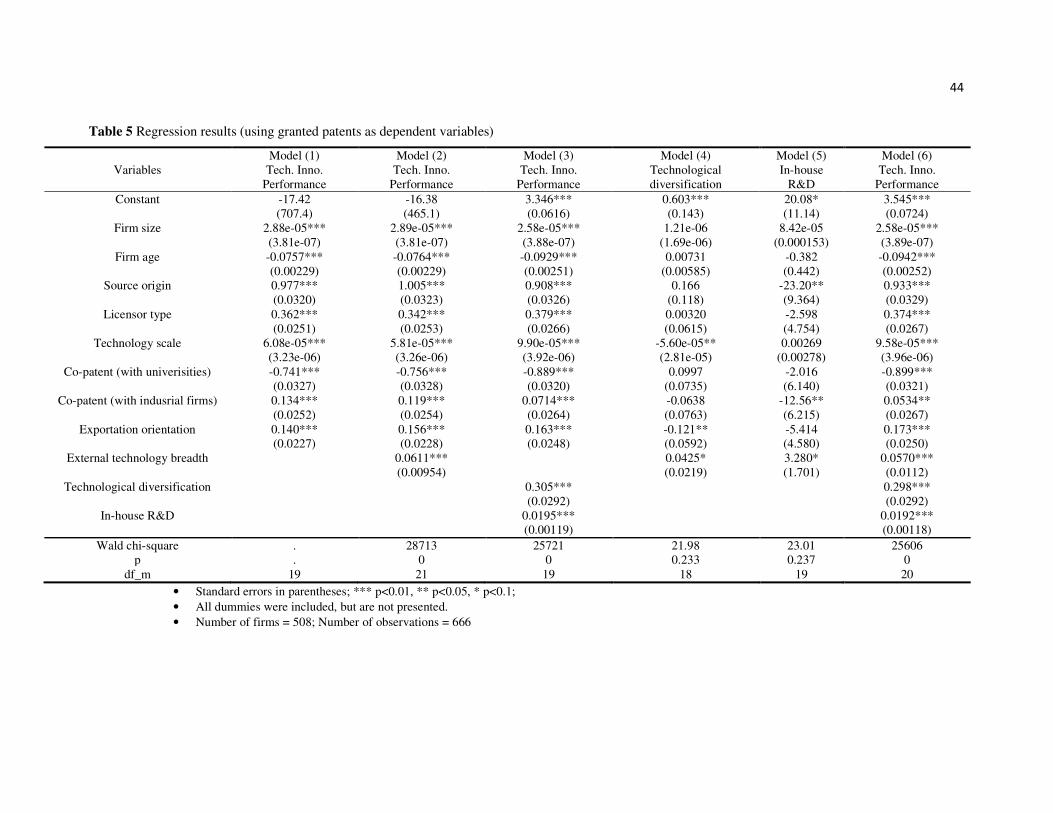
44
Table 5 Regression results (using granted patents as dependent variables)
Model (1) Model (2) Model (3) Model (4) Model (5) Model (6)
Variables Tech. Inno.
Performance
Tech. Inno.
Performance
Tech. Inno.
Performance
Technological
diversification
In-house
R&D
Tech. Inno.
Performance
Constant -17.42 -16.38 3.346*** 0.603*** 20.08* 3.545***
(707.4) (465.1) (0.0616) (0.143) (11.14) (0.0724)
Firm size 2.88e-05*** 2.89e-05*** 2.58e-05*** 1.21e-06 8.42e-05 2.58e-05***
(3.81e-07) (3.81e-07) (3.88e-07) (1.69e-06) (0.000153) (3.89e-07)
Firm age -0.0757*** -0.0764*** -0.0929*** 0.00731 -0.382 -0.0942***
(0.00229) (0.00229) (0.00251) (0.00585) (0.442) (0.00252)
Source origin 0.977*** 1.005*** 0.908*** 0.166 -23.20** 0.933***
(0.0320) (0.0323) (0.0326) (0.118) (9.364) (0.0329)
Licensor type 0.362*** 0.342*** 0.379*** 0.00320 -2.598 0.374***
(0.0251) (0.0253) (0.0266) (0.0615) (4.754) (0.0267)
Technology scale 6.08e-05*** 5.81e-05*** 9.90e-05*** -5.60e-05** 0.00269 9.58e-05***
(3.23e-06) (3.26e-06) (3.92e-06) (2.81e-05) (0.00278) (3.96e-06)
Co-patent (with univerisities) -0.741*** -0.756*** -0.889*** 0.0997 -2.016 -0.899***
(0.0327) (0.0328) (0.0320) (0.0735) (6.140) (0.0321)
Co-patent (with indusrial firms) 0.134*** 0.119*** 0.0714*** -0.0638 -12.56** 0.0534**
(0.0252) (0.0254) (0.0264) (0.0763) (6.215) (0.0267)
Exportation orientation 0.140*** 0.156*** 0.163*** -0.121** -5.414 0.173***
(0.0227) (0.0228) (0.0248) (0.0592) (4.580) (0.0250)
External technology breadth 0.0611*** 0.0425* 3.280* 0.0570***
(0.00954) (0.0219) (1.701) (0.0112)
Technological diversification 0.305*** 0.298***
(0.0292) (0.0292)
In-house R&D 0.0195*** 0.0192***
(0.00119) (0.00118)
Wald chi-square . 28713 25721 21.98 23.01 25606
p . 0 0 0.233 0.237 0
df_m 19 21 19 18 19 20
• Standard errors in parentheses; *** p<0.01, ** p<0.05, * p<0.1;
• All dummies were included, but are not presented.
• Number of firms = 508; Number of observations = 666