Embed Size (px)
Citation preview

How do Environmental Factors Affect Drivers’ Gaze and Head Movements?
Arash TavakoliVahid BalaliArsalan Heydarian
C S U T R A N S P O R T A T I O N C O N S O R T I U M
Project 2044 August 2021
transweb.sjsu.edu/csutc

Mineta Transportation Institute Founded in 1991, the Mineta Transportation Institute (MTI), an organized research and training unit in partnership with the Lucas College and Graduate School of Business at San José State University (SJSU), increases mobility for all by improving the safety, efficiency, accessibility, and convenience of our nation’s transportation system. Through research, education, workforce development, and technology transfer, we help create a connected world. MTI leads the Mineta Consortium for Transportation Mobility (MCTM) funded by the U.S. Department of Transportation and the California State University Transportation Consortium (CSUTC) funded by the State of California through Senate Bill 1. MTI focuses on three primary responsibilities:
Research
MTI conducts multi-disciplinary research focused on surface transportation that contributes to effective decision making. Research areas include: active transportation; planning and policy; security and counterterrorism; sustainable transportation and land use; transit and passenger rail; transportation engineering; transportation finance; transportation technology; and workforce and labor. MTI research publications undergo expert peer review to ensure the quality of the research.
Education and Workforce
To ensure the efficient movement of people and products, we must prepare a new cohort of transportation professionals who are ready to lead a more diverse, inclusive, and equitable transportation industry. To help achieve this, MTI sponsors a suite of workforce development and education opportunities. The Institute supports educational programs offered by the Lucas Graduate School of Business: a
Master of Science in Transportation Management, plus graduate certificates that include High-Speed and Intercity Rail Management and Transportation Security Management. These flexible programs offer live online classes so that working transportation professionals can pursue an advanced degree regardless of their location.
Information and Technology Transfer
MTI utilizes a diverse array of dissemination methods and media to ensure research results reach those responsible for managing change. These methods include publication, seminars, workshops, websites, social media, webinars, and other technology transfer mechanisms. Additionally, MTI promotes the availability of completed research to professional organizations and works to integrate the research findings into the graduate education program. MTI’s extensive collection of transportation-related publications is integrated into San José State University’s world-class Martin Luther King, Jr. Library.
__________________________________________________________________________________
Disclaimer
The contents of this report reflect the views of the authors, who are responsible for the facts and accuracy of the information presented herein. This document is disseminated in the interest of information exchange. MTI’s research is funded, partially or entirely, by grants from the California Department of Transportation, the California State University Office of the Chancellor, the U.S. Department of Homeland Security, and the U.S. Department of Transportation, who assume no liability for the contents or use thereof. This report does not constitute a standard specification, design standard, or regulation.

Report 21-23
How do Environmental Factors Affect Drivers’ Gaze and Head Movements?
Arash Tavakoli
Vahid Balali
Arsalan Heydarian
August 2021
A publication of the Mineta Transportation Institute Created by Congress in 1991
College of Business San José State University San José, CA 95192-0219

TECHNICAL REPORT DOCUMENTATION PAGE
1. Report No. 21–23
2. Government Accession No. 3. Recipient’s Catalog No.
4. Title and Subtitle How do Environmental Factors Affect Drivers’ Gaze and Head Movements?
5. Report Date August 2021
6. Performing Organization Code
7. Authors Arash Tavakoli Vahid Balali: 0000-0002-5553-7599 Arsalan Heydarian
8. Performing Organization Report CA-MTI-2044
9. Performing Organization Name and Address Mineta Transportation Institute College of Business San José State University San José, CA 95192-0219
10. Work Unit No.
11. Contract or Grant No. ZSB12017-SJAUX
12. Sponsoring Agency Name and Address State of California SB1 2017/2018Trustees of the California State University Sponsored Programs Administration 401 Golden Shore, 5th Floor Long Beach, CA 90802
13. Type of Report and Period Covered
14. Sponsoring Agency Code
15. Supplemental Notes
16. Abstract Studies have shown that environmental factors affect driving behaviors. For instance, weather conditions and the presence of a passenger have been shown to significantly affect the speed of the driver. As one of the important measures of driving behavior is the gaze and head movements of the driver, such metrics can be potentially used towards understanding the effects of environmental factors on the driver’s behavior in real-time. In this study, using a naturalistic study platform, videos have been collected from six participants for more than four weeks of a fully naturalistic driving scenario. The videos of both the participants’ faces and roads have been cleaned and manually categorized depending on weather, road type, and passen-ger conditions. Facial videos have been analyzed using OpenFace to retrieve the gaze direction and head movements of the driver. Results, overall, suggest that the gaze direction and head movements of the driver are affected by a combination of environmental factors and individual differences. Specifically, results depict the distracting effect of the passenger on some individuals. In addition, it shows that highways and city streets are the cause for maximum distraction on the driver’s gaze.
17. Key Words Driver Behaviors, Gaze, PersonalizedModeling, Environmental Factors, Human Factors
18. Distribution Statement No restrictions. This document is available to the public through The National Technical Information Service, Springfield, VA 22161.
19. Security Classif. (of this report) Unclassified
20. Security Classif. (of this page)Unclassified
21. No. of Pages 31
22. Price
Form DOT F 1700.7 (8-72)

Copyright © 2021
by Mineta Transportation Institute
All rights reserved.
DOI: 10.31979/mti.2021.2044
Mineta Transportation Institute College of Business
San José State University San José, CA 95192-0219
Tel: (408) 924-7560 Fax: (408) 924-7565
Email: [email protected]
transweb.sjsu.edu/research/2010

M I N E T A T R A N S P O R T A T I O N I N S T I T U T E iv
ACKNOWLEDGMENTS
I would like to thank the National Center for Transportation, Green Technology, and Education (TransGET) at the California State University Long Beach and the California State University Transportation Consortium (CSUTC). This report is in part based upon work supported by the CSUTC. Any opinions, findings, and conclusion or recommendations expressed in this report are those of the author and do not necessarily reflect the views of the CSUTC of other sponsors.

M I N E T A T R A N S P O R T A T I O N I N S T I T U T E
CONTENTS
Acknowledgments ...................................................................................................................... iv List of Figures ............................................................................................................................. vi List of Tables .............................................................................................................................. vii Executive Summary .................................................................................................................... 1 1. Introduction .......................................................................................................................... 2 2. Background Study ................................................................................................................. 4 3. Data Collection and Setup .................................................................................................... 7
3.1. Devices .......................................................................................................................... 7 3.2. Participants .................................................................................................................... 7
4. Analysis ................................................................................................................................. 8 5. Results and Discussion ......................................................................................................... 11 6. Conclusion and Future Work ............................................................................................... 19 Abbreviations and Acronyms ...................................................................................................... 20 Bibliography ............................................................................................................................... 21 About the Authors ...................................................................................................................... 24

M I N E T A T R A N S P O R T A T I O N I N S T I T U T E vi
LIST OF FIGURES
Figure 1. System Setup and Different Conditions ...................................................................... 8 Figure 2. OpenFace Data; (a) Gaze and Eye Landmark; (b) Face Landmark Locations in
2D and 3D ................................................................................................................... 10 Figure 3. Overall Graphs Depicting the Distribution and Variations on Groups of Passengers,
Weather, Road Type, and Participant Differences with Regards to Mean and Standard Deviation of Gaze Angle in X and Y Directions, and Standard Deviation of Head Movement in X and Y Directions. ................................................................. 12
Figure 4. (a) Interaction between Different Weather Conditions and Passenger Situation; (b) Interaction between Individual Differences and Weather Conditions (Right) ...... 15
Figure 5. (a) Interaction Between Individual Differences and Different Road Types with Respect to Standard Deviation of Gaze; (b) Movements of the Head in X-Direction ............. 16
Figure 6. Interaction between Individual Differences and Standard Deviation (a) and Mean (b) of Gaze in the X-Direction. ......................................................................... 17
M I N E T A T R A N S P O R T A T I O N I N S T I T U T E vii
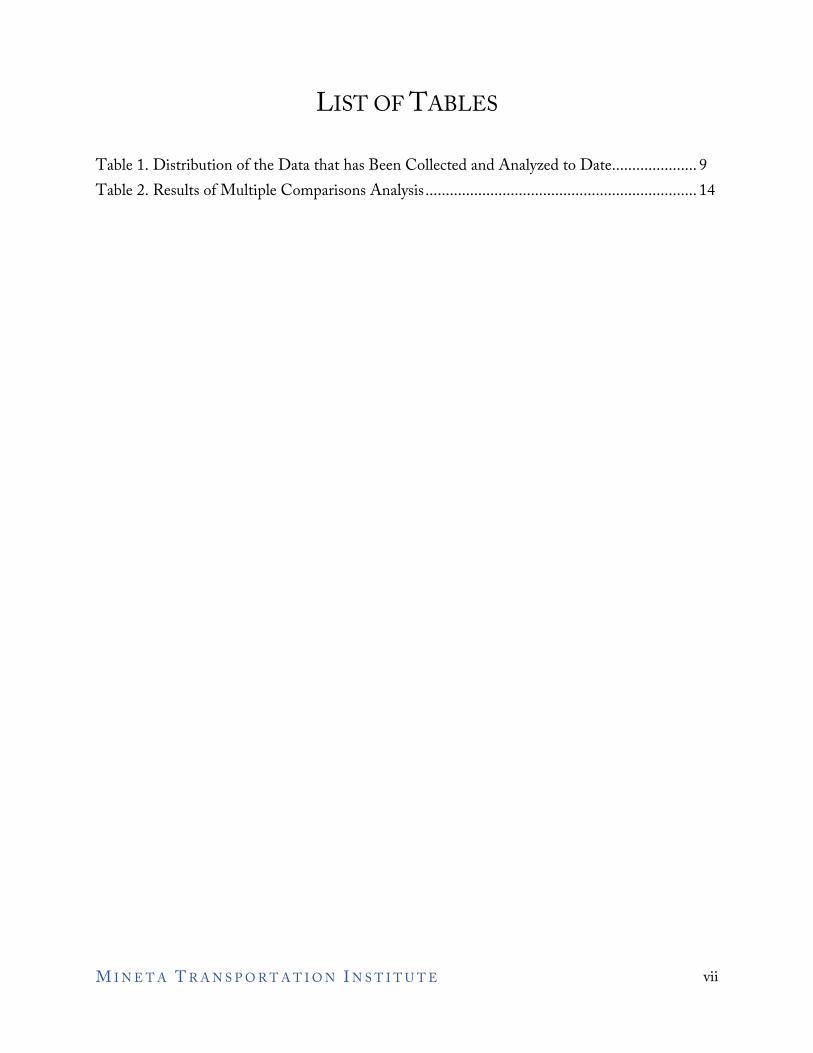
LIST OF TABLES
Table 1. Distribution of the Data that has Been Collected and Analyzed to Date ..................... 9 Table 2. Results of Multiple Comparisons Analysis ................................................................... 14

M I N E T A T R A N S P O R T A T I O N I N S T I T U T E 1
Executive Summary The acceptance of Autonomous Vehicles (AVs) in society is largely influenced by perceptions of comfort and a human-like driving experience for the user. AVs, in addition to safety, reliability, and resiliency, need to be able to respond to driver and passenger behaviors, needs, and preferences. These parameters are dynamic and prone to change with time. It is also important to consider other drivers, their perception of the AVs around them, and being able to predict their actions in different scenarios. To address such issues, one is first required to understand how different envi-ronmental factors (e.g., weather, traffic density, noise levels, road type, passenger, etc.) impact driver behavior and how this differ among individuals. Studies have shown that environmental factors affect driving behavior. For instance, weather conditions and the presence of a passenger have shown to significantly affect the speed of the driver. Among the important measures of driv-ing behavior are the gaze and head movements of the driver. Such metrics can be used towards understanding the effects of environmental factors on a driver’s behavior in real-time. This research proposal intends to assess the effects of basic environmental factors on driver gaze direction and head movements by comparing and contrasting the differences in each condition, individual dif-ferences among people, and the interplay between environmental factors and individual differ-ences. First, a dataset of participants driving in different scenarios is built. Then, participant gaze and head location are automatically detected using the state-of-the-art gaze detection software, OpenFace. Finally, using statistical data analysis, the effect of each factor on gaze and head move-ments is assessed and discussed among different individuals. The impact of a combination of en-vironmental factors and individual differences on the gaze direction and head movement of the driver are expected to be identified. Results specifically depict the distracting effect of the passenger on some individuals and also portray how highways and city streets can serve as distractions for the driver’s gaze.

M I N E T A T R A N S P O R T A T I O N I N S T I T U T E 2
1. Introduction Although Autonomous Vehicles (AV) are improving at a very fast rate, it is predicted that through shared autonomy, humans will be involved in driving decision making for the foreseeable future. Shared autonomy is a promising approach where the human driver is kept in the loop to enhance situational awareness, response time in unsafe conditions, and trust in AV. In principle, AV can act as an expert driver, deferring execution to the human user only in challenging scenarios. How-ever, deferring execution while the human driver is in a sub-optimal state (e.g., stressed, sleepy, intoxicated) can be hazardous. Thus, it is essential for AV to accurately assess and respond to the driver’s state and behavioral changes in real-time and according to each individual driver profile.
The driver’s gaze and head movements can potentially be affected by environmental conditions. These two parameters are significant indications of a driver’s distraction, inattention, and other driving-related behavior (Fletcher & Zelinsky, 2009). Previous studies have shown that the driver’s glance and gaze can be used as a measure in a multi-sensor real-time system for autonomous ve-hicles (Fridman et al., 2017). The effect of environmental factors (e.g. traffic density, road type, weather conditions, and passenger situation) on the driver’s gaze direction and head movements is important from two major aspects: (1) one could optimize the route selection around the user in a manner that takes into consideration the relevant factors; (2) the relevant factors can also be uti-lized to predict the state of the driver, specifically when using semi-autonomous vehicles. A work-ing example would involve a trip using an an AV with different levels of automation chosen based on weather conditions and the corresponding distraction level of the driver. Such information can be used in AVs to assess whether the driver is attentive. If the pattern of the gaze of the driver does not match the model of his/her gaze in rainy conditions, this could mean that the driver is inat-tentive on the road. This is important as AVs rely on drivers in the events of failure and efficient collaboration between AVs and the driver is crucial toward achieving a safer and joyful AV expe-rience (Fridman, n.d.). Thus, the vehicle should have an understanding of the current status of the driver as well as how the state of the driver changes in different conditions and the relevant factors responsible for these changes.
In this study, the goal is to understand the effects of three main environmental factors: (1) different weather conditions, (2) road types, and (3) the presence of a passenger on gaze direction, and head movements in a fully naturalistic and longitudinal driving scenario. In comparison to task engage-ment distractions, such factors can potentially affect the driver unconsciously and influence the driver’s behavioral metrics such as gaze direction. This study specifically targets the research ques-tions below:
1) Can the effects of the three environmental factors (weather condition, road type, and pres-ence of a passenger) on the driver’s gaze be detected automatically?

M I N E T A T R A N S P O R T A T I O N I N S T I T U T E 3
2) How do these factors affect the gaze direction and head movement of the driver?
3) Are there distinguished differences among individuals in gaze and head movement within different conditions? If so, can statistical models be identified for each driver?

M I N E T A T R A N S P O R T A T I O N I N S T I T U T E 4
2. Background Study Studies in the past have extensively considered the problems of estimating drivers’ gaze and head movements (Fletcher & Zelinsky, 2009), their relationships with drivers’ mood and behavior (Fridman et al., 2017); and building systems to warn the driver based on detections from gaze variation (Fridman, n.d.). Estimating gaze in the past has been done using both eye trackers (Lappi et al., 2017) and computer vision techniques (Fletcher et al., 2005; Fridman et al., 2016; Fridman et al., 2015; Vicente et al, 2015). Computer vision methods have used deep learning techniques such as Convolutional Neural Networks (CNNs) to estimate the region of the gaze of the driver (e.g., looking at the road, side, etc.). These studies have indicated that experienced drivers use gaze to obtain a visual preview of the road (Lappi, 2016). Such studies have mostly been concerned with safety issues such as predicting fatigue (Mandal et al., 2016), distraction (Kutila et al., 2007), drowsiness (Park et al., 2016), mental and cognitive workload (Reimer et al., 2018), and driver maneuvers (Lethaus & Rataj, 2007). For instance, it has been observed that drowsy drivers are more likely to look at their laps (Kuo et al., 2018). Another study has attempted to estimate the cognitive load on the driver by only using their glance regions (Reimer et al., 2018). Although some studies have looked at naturalistic scenarios in assessing the gaze direction of the driver (Lappi et al., 2017; Fridman et al., 2016; Fridman et al., 2015), most have been conducted in controlled lab environments using driving simulators. Among recent studies, one observational study indicates that the direction of a driver’s gaze direction follows a pattern that includes seven major laws of human gaze behavior (e.g. repeatable and stereotypical gaze patterns, gaze focused on task-relevant objects, etc.) that have been previously identified by (Lappi et al., 2017; Lappi, 2016). Using the correlation between gaze and driver’s state, many warning systems have been developed to recognize and prevent driver distraction (Fletcher & Zelinsky, 2009; Ahlstrom at al., 2013).
Studies have also depicted the effects of environmental factors such as weather conditions on driv-ing behavior metrics (e.g., speed). The effect of weather and geometric elements on driving be-havior has been observed and countermeasures to decrease the effects of adverse weather on high-way sections that encounter challenging geometrics have been considered (Shankar et al., 1995). Another study has indicated that the driver’s behavior is impacted by the general observable con-dition rather than weather forecasts (Kilpeläinen & Summala, 2007). Furthermore, studies have demonstrated the effect of the presence of a passenger on driving behavior with an existing asso-ciation between the presence of male passengers and risky driving behavior (Simons-Morton et al., 2005). This is supported by (Rhodes et al., 2015) demonstrating the increase in speed in a driving simulator when a simulated passenger is present.

M I N E T A T R A N S P O R T A T I O N I N S T I T U T E 5
Among the major driving metrics that could potentially be affected by such factors are the driver’s gaze and head movements. As these two parameters can be used towards understanding many of the driver’s states (Vora et al., 2017), it is important to assess the effects of environmental condi-tions on these two metrics. Studies have considered the effects of environmental factors such as traffic density on the gaze behavior of drivers. A recent study indicated the effect of the traffic situation on an intersection on attention allocation and following accidents, (Werneke & Vollrath, 2012) concluding that a simpler intersection has a greater number of accidents due to attention allocation problems of the gaze of the driver. Another study has depicted the effect of environment on the driver’s eye movement and how the driver attention gradually moves towards the surround-ing environment (Arakawa et al., 2006). Recent research has indicated the effects of environmental factors on the driver distraction and its consequences on his/her behavior. Specifically, the study looked at how road geometry affects the driver’s gaze, speed, and steering control. Furthermore, a recent study has shown the effect of driving contexts such as speed, car-following behavior, and oncoming vehicles on eye glance behavior (Tivesten & Dozza, 2014).
Although previous studies have mostly studied gaze behavior at a population level, they did not consider individual differences among people. Human behavior is dynamic and is based on spatial and temporal changes as well as individual attributes such as personality, psychological, and phys-iological states. As a result, the way drivers are “engaged” or “distracted” can dynamically be influ-enced by a single or combination of different environmental factors. The extent that each one of these factors can affect a driver’s engagement and distraction can vary on an event-specific situation and the driver’s characteristics. Among the studies that considered individualized differences in driving behaviors in general are (Linkov et al., 2019; Wang et al., 2018; Kong et al., 2013). Such studies have found that personality and attitude are predictors of risky driving (Kong et al., 2013). Furthermore, it has been depicted that extraversion and sensation-seeking are correlated with driv-ing more to the right side of the road and conscientiousness correlates with a lower mean speed (Linkov et al., 2019). With today’s AV technology, it is important that the vehicle not only un-derstand when a driver is distracted but also be supported by models of different drivers with dif-ferent characteristics and personalities. For instance, it has been shown that passengers can cause a distraction for drivers and affect risk-taking situations by causing peer-pressure (Shepherd et al., 2011). However, these studies do not indicate whether the presence of a passenger affects a driver’s behavior similarly or differently among different individuals? In fact, does that effect follow the same trend in differing cases of being in a country road compared to a city street? Studies have depicted that the peer-pressure effect decreases with age (Møller & Haustein, 2014). Similar to a factor such as age, how does the interplay of environmental factors and individual differences in-fluence our assessment of driving behavior?
Finally, recent improvements in the area of computer vision and machine learning have made it viable to perform many of the manual tasks in understanding human behavior, automatically. It is
M I N E T A T R A N S P O R T A T I O N I N S T I T U T E 6
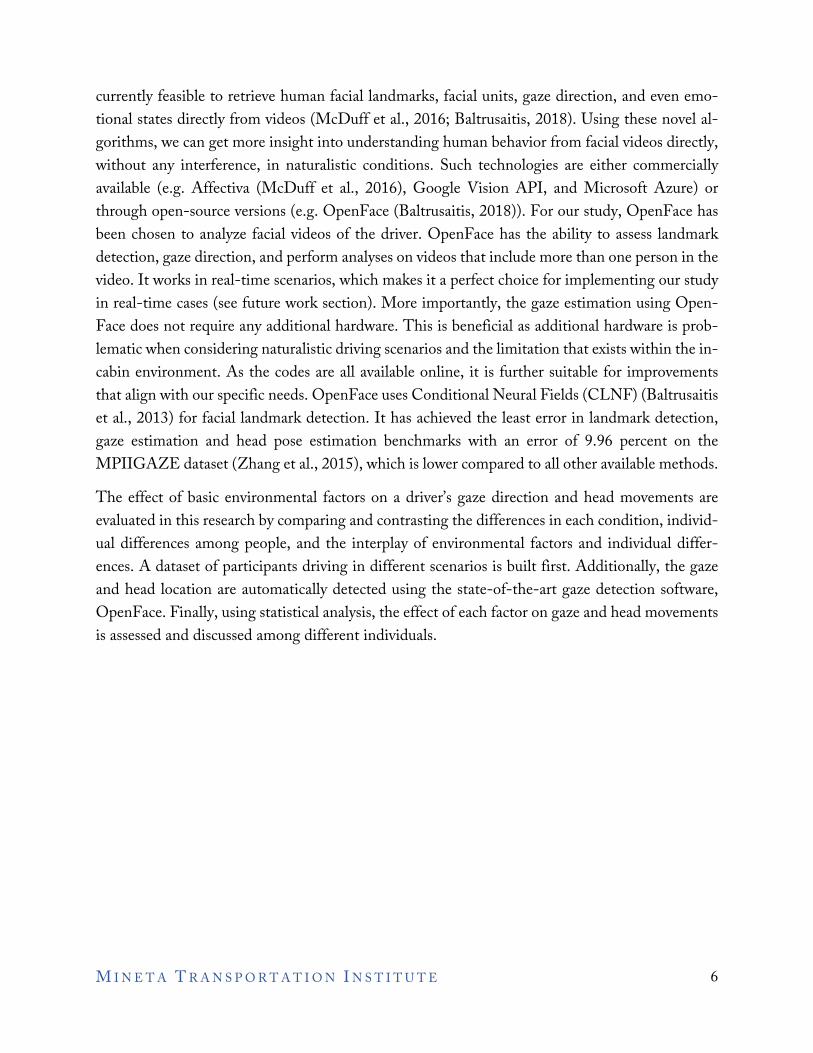
currently feasible to retrieve human facial landmarks, facial units, gaze direction, and even emo-tional states directly from videos (McDuff et al., 2016; Baltrusaitis, 2018). Using these novel al-gorithms, we can get more insight into understanding human behavior from facial videos directly, without any interference, in naturalistic conditions. Such technologies are either commercially available (e.g. Affectiva (McDuff et al., 2016), Google Vision API, and Microsoft Azure) or through open-source versions (e.g. OpenFace (Baltrusaitis, 2018)). For our study, OpenFace has been chosen to analyze facial videos of the driver. OpenFace has the ability to assess landmark detection, gaze direction, and perform analyses on videos that include more than one person in the video. It works in real-time scenarios, which makes it a perfect choice for implementing our study in real-time cases (see future work section). More importantly, the gaze estimation using Open-Face does not require any additional hardware. This is beneficial as additional hardware is prob-lematic when considering naturalistic driving scenarios and the limitation that exists within the in-cabin environment. As the codes are all available online, it is further suitable for improvements that align with our specific needs. OpenFace uses Conditional Neural Fields (CLNF) (Baltrusaitis et al., 2013) for facial landmark detection. It has achieved the least error in landmark detection, gaze estimation and head pose estimation benchmarks with an error of 9.96 percent on the MPIIGAZE dataset (Zhang et al., 2015), which is lower compared to all other available methods.
The effect of basic environmental factors on a driver’s gaze direction and head movements are evaluated in this research by comparing and contrasting the differences in each condition, individ-ual differences among people, and the interplay of environmental factors and individual differ-ences. A dataset of participants driving in different scenarios is built first. Additionally, the gaze and head location are automatically detected using the state-of-the-art gaze detection software, OpenFace. Finally, using statistical analysis, the effect of each factor on gaze and head movements is assessed and discussed among different individuals.

M I N E T A T R A N S P O R T A T I O N I N S T I T U T E 7
3. Data Collection and Setup A naturalistic driving study platform consisting of facial and road camera, wearable watches, and car CAN bus data logger was developed for this study. The overall view of the system is shown in Figure 1. This paper presents and discusses the results of the cameras outputs with respect to gaze and head movements.
3.1 Devices
In our platform, we have used a Vantrue N2 dual dash camera for collecting the road and facial videos. This camera was used as it could handle up to 256 GB of a video recording which is equal to almost 25 hours of collecting videos. On average, this is equal to two weeks of the driving scenario for a participant who drives 1.5 hours per day. A Samsung 256 GB SD card was used to store the videos in the camera. The camera has an internal clock that timestamps every video. The camera’s LCD was set to turn off after one minute to decrease the distraction of the driver and the Hawthorn effect. Hawthorn effect refers to the awareness of participants being studied and how this influences the research outcome (Stand, 2000).
3.2 Participants
For the pilot study, we have recruited nine participants including six males and three females. The subjects were provided informed consent prior to the study as required by the California State University Long Beach’s Institutional Review Board for Social and Behavioral Research (IRB-SBS). The cameras were placed in the participant's cars and they have been recorded for 4 weeks of driving until now. Once every two weeks, the data was unloaded from participants’ car and kept in an encrypted hard drive. The recruitment of the participants and collection of data is an on-going process. The results of this paper depict the analyzed data to date, which includes six par-ticipants, including four males and two females (the data for the other three participants are not yet fully collected).

M I N E T A T R A N S P O R T A T I O N I N S T I T U T E 8
4. Analysis From each participant, a joint set of road and facial videos were collected. The road videos were used for assessing the environmental condition in the driving scenario. The environmental condi-tions included road type, weather conditions, and presence of the passenger. Initially, the videos were manually annotated to be in the categories of road type, weather, and passenger conditions. The road types have been categorized to be in one of the categories of street driving, country roads, two-way two-lane highway, and two-way three-lane highway. The weather conditions have been defined to be in one of the categories of clear, cloudy, and rainy. The passenger condition includes either having a passenger or not. A view of each road types and weather conditions can be viewed in Figure 1. Detail of in-cabin setuo is shown in Figure 1(a). Different types of road (R) and weather conditions (W) have been tested and output of OpenFace on a sample shot from in-cabin analysis are shown.
Figure 1. System Setup and Different Conditions

M I N E T A T R A N S P O R T A T I O N I N S T I T U T E 9
Table 1 depicts the overall data that was collected in each condition. Both facial and road videos have been analyzed to be cleaned for cases that the driver was not driving or the camera was not in a correct angle.
Table 1. Distribution of the Data that has Been Collected and Analyzed to Date. Each column shows the cumulative video data measured in seconds.
Road Type (min)
Weather Type (min)
Passenger (min) Overall (min)
Par-tici-pant
City Country 2-lanes on each side
3-lanes on each side
Clear Cloudy Rainy No passenger
With passen-ger
1 503 35 255 10 254 488 60 587 216 803 2 167 80 168 574 546 380 13 636 352 988 3 187 55 52 8 195 31 75 83 218 301 4 428 25 542 157 430 596 125 776 375 1151 5 193 8 5 0 19 166 22 176 31 207 6 457 166 240 171 87 890 57 362 671 1034
The cleaned facial videos have been fed into OpenFace (Baltrusaitis, 2018), a state of the art open-source software for analyzing the facial action units, gaze direction and landmarks location. By feeding the facial videos of each participant into the OpenFace, as shown in Figure 2, the landmark for head and gaze direction angle have been retrieved. As a summary, facial landmarks are locations in the face that are of interest for recent computer vision applications in facial detection, facial emotional analysis, and etc. Gaze angle direction shows the angle that the person is looking at in both horizontal (X-direction) and vertical (Y-direction) axis. OpenFace gaze angle output is neg-ative in the X-direction if the participant is looking left to right, and similarly in the Y-direction if the participant is looking up to down. This output has been saved for each frame of the video in a CSV file associated with the video files. For videos that include a passenger, the videos have been fed into OpenFace for multi-face landmark detection module which takes into consideration mul-tiple faces with multiple IDs associated with them. After processing the videos by OpenFace, CSV outputs of each video have gone through a cleaning process. In the cleaning process, data with a confidence level below 85% have been ignored. It should be noted that having low confidence level in facial analysis can occur due to lighting conditions, camera movements, etc.
In general, for a large batch of collected video data, frames with low confidence level are negligible compared to the overall number of frames with high (>85%) confidence level. For videos involving a passenger, the outputs of passenger and driver have been separated using the fact that the driver’s head landmark lies on the right hand side of the frame implying that the location of the head

M I N E T A T R A N S P O R T A T I O N I N S T I T U T E 10
landmarks of the driver in pixel format should be more than half of the width of the frame. In this case, the width of the frame is 1920 pixels as the videos were recorded at full HD (High Defini-tion), 1080×1920, 30 fps (frame per second). For each facial video, the standard deviation value of gaze angle direction and head location in X and Y-directions and head location have been calcu-lated. It should be noted that head location has been estimated using the facial landmark of the bottom of the chin of the face of the participant.
Figure 2. OpenFace Data; (a) Gaze and Eye Landmark; (b) Face Landmark Locations in 2D and 3D
(a)
(b)
M I N E T A T R A N S P O R T A T I O N I N S T I T U T E 11
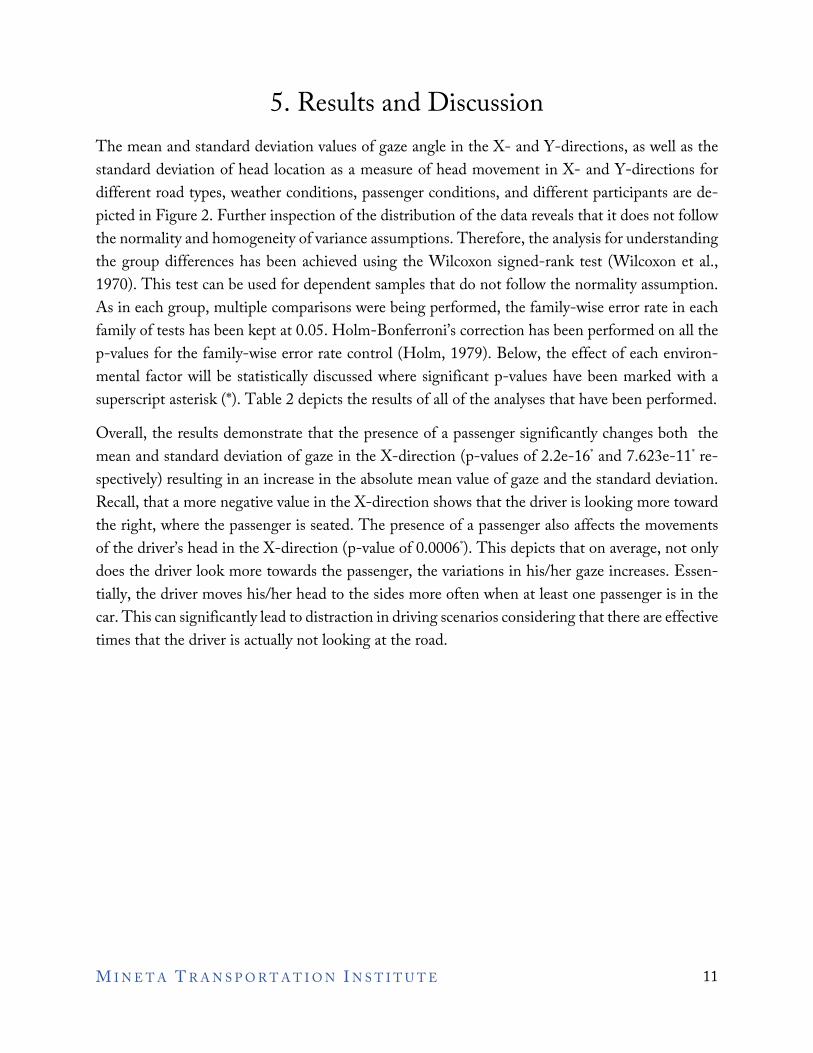
5. Results and Discussion The mean and standard deviation values of gaze angle in the X- and Y-directions, as well as the standard deviation of head location as a measure of head movement in X- and Y-directions for different road types, weather conditions, passenger conditions, and different participants are de-picted in Figure 2. Further inspection of the distribution of the data reveals that it does not follow the normality and homogeneity of variance assumptions. Therefore, the analysis for understanding the group differences has been achieved using the Wilcoxon signed-rank test (Wilcoxon et al., 1970). This test can be used for dependent samples that do not follow the normality assumption. As in each group, multiple comparisons were being performed, the family-wise error rate in each family of tests has been kept at 0.05. Holm-Bonferroni’s correction has been performed on all the p-values for the family-wise error rate control (Holm, 1979). Below, the effect of each environ-mental factor will be statistically discussed where significant p-values have been marked with a superscript asterisk (*). Table 2 depicts the results of all of the analyses that have been performed.
Overall, the results demonstrate that the presence of a passenger significantly changes both the mean and standard deviation of gaze in the X-direction (p-values of 2.2e-16* and 7.623e-11* re-spectively) resulting in an increase in the absolute mean value of gaze and the standard deviation. Recall, that a more negative value in the X-direction shows that the driver is looking more toward the right, where the passenger is seated. The presence of a passenger also affects the movements of the driver’s head in the X-direction (p-value of 0.0006*). This depicts that on average, not only does the driver look more towards the passenger, the variations in his/her gaze increases. Essen-tially, the driver moves his/her head to the sides more often when at least one passenger is in the car. This can significantly lead to distraction in driving scenarios considering that there are effective times that the driver is actually not looking at the road.

M I N E T A T R A N S P O R T A T I O N I N S T I T U T E 12
Figure 3. Overall Graphs Depicting the Distribution and Variations on Groups of Passengers, Weather, Road Type, and Participant Differences with Regards to Mean and Standard
Deviation of Gaze Angle in X And Y Directions, and Standard Deviation of Head Movement in X and Y Directions.

M I N E T A T R A N S P O R T A T I O N I N S T I T U T E 13
The effects of weather conditions have been considered for the standard deviation of gaze direction and head movements in both the X- and Y-directions. The results depict a significant difference when comparing clear weather to cloudy and rainy conditions. However, the data does not suggest a significant difference between the cloudy and rainy conditions for gaze in the X-direction. The analysis shows the p-values of 1.1E-06*, 3.2E-04*, and 3.9E-1 for pairwise comparison of clear versus cloudy, clear versus rainy, and cloudy versus rainy conditions, respectively. However, when considering the gaze in the Y-direction, the results are significantly different for all three weather conditions. The analysis shows p-values of 3.0E-03*, 3.0E-04*, and 1.6E-04* for pairwise com-parison clear versus cloudy, clear versus rainy, and cloudy versus rainy conditions, respectively. This may imply that when considering the effect of weather on gaze direction, the Y-direction may serve as a better metric for grouping the gaze behavior. More data is needed to confirm this obser-vation. The effect of weather on head location in X and Y directions follows the same trend as the gaze direction. The analysis shows p-values of 1.2E-09*, 1.2E-08*, and 3.2E-02* for pairwise comparison of clear versus cloudy, clear versus rainy, and cloudy versus rainy conditions, respec-tively in the X-direction, and p-values of 1.0E-04*, 3.8E-06*, and 2.2E-03* for pairwise compar-ison of clear versus cloudy, clear versus rainy, and cloudy versus rainy conditions respectively, in the Y-direction. This indeed suggests that not only do weather conditions affect a driver’s gaze, the effects vary in the X and Y-directions. The change in gaze direction and head movement due to weather can be due to the fact that clear weather generally has an uncomfortable glare induced on the window that might lead to variation in gaze and head movement for the driver. In addition, the fact that head location and gaze follow the same trend implies that the driver is even using his/her head to reach a comfortable zone of scanning the road in different road conditions.

M I N E T A T R A N S P O R T A T I O N I N S T I T U T E 14
Table 2. Results of Multiple Comparisons Analysis—Holm-Bonferonni P-Value Adjustment has been Applied.
Different road types significantly change the standard deviation of gaze direction in the X-direc-tion. The results suggest that all four different road types are in fact different in a pairwise com-parison of the standard deviation of gaze direction in the X-direction. The analysis shows p-values of 5.0E-04*, 2.2E-16*, 2.2E-16*, 5.8E-03*, 4.6E-12*, 8.7e-13* for pairwise comparison of groups city versus country, city versus two lanes highway, city versus three or more lanes highways, country versus two lanes highways, two lanes highway versus three or more lanes highway, respectively with respect to gaze in the X-direction. Inspecting variation in the standard deviation of gaze in the X-direction reveals that on average the standard deviation decreases from city streets to high-ways.
Considering the head movements in the X-direction, road types 0 and 1 (city streets versus country roads) are not significantly different, while both of them are different than all other road types. Altogether, the results suggest that two-way two-lane highways and two-way three-lane highways
Effect Family Comparison P-Value Adjusted p-value for using the family error rate
Significant at 0.05 level of familywise error rate?
Passenger - mean of gaze - x Effect of passenger on mean of gaze in x-direction 2.2E-16 2E-16 YESPassenger - SD of gaze - x Effect of passenger on standard deviation of gaze in x-direction 7.6E-11 8E-11 YES
Passenger - mean of gaze - y Effect of passenger on mean of gaze in y-direction 2.5E-08 3E-08 YESPassenger - SD of gaze - y Effect of passenger on standard deviation of gaze in y-direction 7.7E-01 8E-01 NOPassenger - SD of head - x Effect of passenger on Standard deviation of head in x-direction 5.7E-04 6E-04 YESPassenger - SD of head - y Effect of passenger on Standard deviation of head in y-direction 8.8E-01 9E-01 NO
Comparison of weather 0 and 1 on standard deviation of gaze direction in x 1.1E-06 3E-06 YESComparison of weather 0 and 2 on standard deviation of gaze direction in x 3.2E-04 6E-04 YESComparison of weather 1 and 2 on standard deviation of gaze direction in x 3.9E-01 4E-01 NOComparison of weather 0 and 1 on standard deviation of gaze direction in y 3.0E-03 6E-03 YESComparison of weather 0 and 2 on standard deviation of gaze direction in y 3.0E-04 9E-04 YESComparison of weather 1 and 2 on standard deviation of gaze direction in y 1.6E-02 2E-02 YESComparison of weather 0 and 1 on standard deviation of head in x 1.2E-09 4E-09 YESComparison of weather 0 and 2 on standard deviation of head in x 1.2E-08 2E-08 YESComparison of weather 1 and 2 on standard deviation of head in x 3.2E-02 3E-02 YESComparison of weather 0 and 1 on standard deviation of head in y 1.0E-04 2E-04 YESComparison of weather 0 and 2 on standard deviation of head in y 3.8E-06 1E-05 YESComparison of weather 1 and 2 on standard deviation of head in y 2.2E-03 2E-03 YESComparison of road 0 and 1 on standard deviation of gaze in x direction 5.0E-04 1E-03 YESComparison of road 0 and 2 on standard deviation of gaze in x direction 2.2E-16 1E-15 YESComparison of road 0 and 3 on standard deviation of gaze in x direction 2.2E-16 1E-15 YESComparison of road 1 and 2 on standard deviation of gaze in x direction 5.8E-03 6E-03 YESComparison of road 1 and 3 on standard deviation of gaze in x direction 4.6E-12 1E-11 YESComparison of road 2 and 3 on standard deviation of gaze in x direction 8.8E-13 4E-12 YESComparison of road 0 and 1 on standard deviation of gaze in y direction 8.1E-07 2E-06 YESComparison of road 0 and 2 on standard deviation of gaze in y direction 2.2E-16 1E-15 YESComparison of road 0 and 3 on standard deviation of gaze in y direction 2.2E-16 1E-15 YESComparison of road 1 and 2 on standard deviation of gaze in y direction 1.4E-02 1E-02 YESComparison of road 1 and 3 on standard deviation of gaze in y direction 8.6E-10 3E-09 YESComparison of road 2 and 3 on standard deviation of gaze in y direction 1.8E-11 7E-11 YESComparison of road 0 and 1 on standard deviation of head in x 7.6E-01 8E-01 NOComparison of road 0 and 2 on standard deviation of head in x 7.7E-11 2E-10 YESComparison of road 0 and 3 on standard deviation of head in x 2.2E-16 1E-15 YESComparison of road 1 and 2 on standard deviation of head in x 8.8E-03 2E-02 YESComparison of road 1 and 3 on standard deviation of head in x 7.2E-13 3E-12 YESComparison of road 2 and 3 on standard deviation of head in x 3.6E-16 2E-15 YESComparison of road 0 and 1 on standard deviation of head in y 6.2E-11 2E-10 YESComparison of road 0 and 2 on standard deviation of head in y 2.2E-16 1E-15 YESComparison of road 0 and 3 on standard deviation of head in y 2.2E-16 1E-15 YESComparison of road 1 and 2 on standard deviation of head in y 2.1E-01 2E-01 NOComparison of road 1 and 3 on standard deviation of head in y 7.6E-07 2E-06 YESComparison of road 2 and 3 on standard deviation of head in y 1.4E-08 4E-08 YES
Road - SD gaze - x
Road - SD gaze - y
Road - SD of head - x
Road - SD of head - y
Weather - SD - gaze - x
Weather - SD - gaze - y
Weather - SD of head - x
Weather - SD of head - y

M I N E T A T R A N S P O R T A T I O N I N S T I T U T E 15
demonstrate different variations with respect to head location in the X-direction. Together, afore-mentioned points mean that an average driver is more distracted in the city compared to highways, with his/her gaze and head movements correspondingly influenced in differing manner, due to different road conditions, differing landscapes and varying objects of distraction such as pedestri-ans, billboards, vegetation, etc. Although this difference is intuitively visible by looking at the sides (gaze and head movements in the X-direction), inspecting the gaze and head movement in the Y-direction reveals approximately the same results (see Table 1).
Considering the interaction between different factors, Figure 4(a) shows the standard deviation of gaze in different weather conditions in the presence or absence of a passenger. While clear weather presents significantly different gaze behavior in the X-direction compared to cloudy and rainy conditions (Std of gaze: clear<cloudy<rainy), the presence of a passenger changes the trend. Figure 3(a) depicts that when a passenger is present, cloudy weather has the least gaze standard deviation whereas when no passenger is present, the case is totally flipped. In addition, analyzing the re-sponse of different people under changing weather conditions reveals the individual differences in reaction to different weather conditions. For instance, Figure 4(b) depicts the standard deviation of gaze in X-direction under varying weather conditions. As it is depicted on the graph, two of the participants (#4 and #5) stay more focused when being in a rainy condition, whereas the other three react more distracted in a rainy condition. Thus, there is a participant factor that must be recognized.
Figure 4. (a) Interaction between Different Weather Conditions and Passenger Situation; (b) Interaction between Individual Differences and Weather Conditions (Right).
Note that the trend of the standard deviation of gaze is different when a passenger exists compared to when the driver is alone.
Analyzing the data under different road conditions for the standard deviation of gaze in the X-direction, also reveals that there are two different trends in how people react in different road conditions. As Figure 5(a) depicts, participants #2 and #3 tend to be more distracted in highways,

M I N E T A T R A N S P O R T A T I O N I N S T I T U T E 16
whereas, participants #4 and #6 tend to be less distracted in highways. Inspecting the head move-ments reveals that for participants #2 and #3, potential distraction is related to their gaze direction only and not their head movements, meaning that on average they keep their head more towards the road while moving their gaze to scan the surrounding environment. Moreover, participant #6 is likely to be more distracted in country roads due to the scenic environment (Figure 5(b)).
Figure 5. (a) Interaction between individual differences and different road types with respect to standard deviation of gaze; (b) movements of the head in x-direction.
Note that at the time of analysis for the current paper, there was no data available from participant #5 in two-way three-lane highways.
Considering the sole effect of a passenger on standard deviation of gaze in the X-direction and its interplay with individual differences, we find that the standard deviation of gaze angle increases for 5 participants. However, Figure 6(a) depicts that out of six participants, one of them (partici-pant #5) has less variation in gaze angle when a passenger is present. Although this could mean that this participant is more focused when a passenger is present, inspecting the mean value of gaze angle (Figure 6(b)) reveals that he/she is keeping his/her gaze more towards the passenger. This means that even if the driver is not moving his/her eyes significantly, he/she is, in fact, holding his/her gaze towards the passenger leading to a decrease for the variation in gaze. Further manual inspection of the videos reveals that this conclusion is in line with overall events in the videos of the participant.

M I N E T A T R A N S P O R T A T I O N I N S T I T U T E 17
Figure 6. Interaction between Individual Differences and Standard Deviation (a) and Mean (b) Of Gaze in the X-Direction.
This study considers the effect of different environmental factors on driver’s gaze and head move-ments in a fully naturalistic platform without any external interference. The first and most im-portant outcome is the viability of detection of factors that have been previously discussed in ex-perimental studies, in a fully naturalistic study. While individuals have differences in their gaze direction and head movements, on average the effect of environmental factors could be detected in each scenario. However, the results suggest that not only environmental factors affect the driver’s behavior, but there is an interplay between factors and individual differences. Thus, understanding the gaze of the driver requires an understanding of both environmental factors and individual char-acteristics that affect one’s gaze. In this study, we have only considered three such environmental factors. Other factors such as the presence of special vehicles (e.g., trucks), bikes, pedestrians, noise level, vegetation, number of passengers, destination, etc. need to be accounted for. As this was the first step towards such a study, the number of participants was lower than a regular experimental study. Having more participants might reveal more individual differences and preferences in dif-ferent conditions.
Another fundamental consideration is the fusion effect of gaze angle and head movement. As has been shown in the results section, these two together can lead to a better understanding the driver’s actions at any given moment. For instance, although head movements ,may not demonstrate a special increase, the gaze might actually reveal that the driver is looking to the sides more often. Another example would be moving the gaze with the head which increases the standard deviation in head movement but does not have an effect on gaze direction. Studies in the past have also indicated that an interplay exists between gaze and head movement. Although Fridman et al. (2016) and Lee et al. (2016) suggest that the driver head can be used as a substitute for the gaze direction in situations where the gaze cannot be predicted (Fridman et al., 2016; Lee et al., 2016), Fridman et al. (2015) depict that adding eye pose on top of head pose in special situations where

M I N E T A T R A N S P O R T A T I O N I N S T I T U T E 18
the head does not move a lot helps increase the accuracy of predicting where the driver is looking at (Fridman et al., 2015).
Moreover, the interaction between environmental factors and individualized differences brings up the concept of personalizing the services that are currently being offered in a generalized fashion as in the case of routing services. Analyzing the gaze direction data reveals that participants are highly affected by environmental factors. Studies have shown that gaze dispersion is highly corre-lated to mental workload. In fact, a recent study demonstrated that horizontal gaze dispersion is more sensitive to a driver’s mental workload than a weighted average between horizontal and ver-tical gaze dispersion (Wang et al., 2014). Considering the results of this study, one implication is that to better optimize for factors such as the mental workload, distraction, environmental condi-tions, and individual differences need to be considered when performing services such as route selection. For instance, routing services are currently enacted based on the fastest route possible. However, with this information, the routing can be potentially optimized for keeping the driver’s gaze on the road, based on weather, passenger condition, road type, etc. Furthermore, as such services have detailed information on traffic, weather, etc., it can potentially be transferred to other drivers. A simple example considers a driver whose attention is affected by trucks. When the rout-ing service can estimate the number of trucks in a specific route, it can take that into consideration to offer a personalized route for the user that can minimize said distraction, fatigue, etc.
This study also demonstrates that by using open-source vision-based software, models can be built to detect different patterns in gaze and following distractions. Considering that this work’s analysis has been done by open-source software available for nearly every operating system, the value of such analysis can be done in one’s car and help to build driving monitoring systems that can be implemented in real-time. This is extremely important when discussing AVs, as such vehicles, currently rely on the human in the event of failure. A proper understanding of the state of the driver can lead to better collaboration, trust, and outcome of using such semi-autonomous human-in-the-loop systems. In order for autonomous vehicles to have a better interaction with the driver, they need to first have an understanding of the driver’s current state, the factors that affect it, and the ability to make short-term future predictions. Consider a semi-AV that is entering a school zone on a rainy day and that relies on the human for the event of failure. Meanwhile, the driver is distracted, with data for that specific driver displaying his/her lack of concentration during rainy conditions. This can lead to a suggestion by the car to not take the route that passes through the school zone. Such a collaborative environment can heighten the trust between the driver and the semi-AV.

M I N E T A T R A N S P O R T A T I O N I N S T I T U T E 19
6. Conclusion and Future Work In this study, the effect of environmental factors on drivers’ gaze and head movement behavior have been discussed under a fully naturalistic driving scenario. A platform has been designed to collect videos from the road and in-cabin situations. Videos were analyzed using OpenFace to retrieve the gaze direction. Road videos were annotated to be in one of clear, cloudy, and rainy condition, as well as city, country road, two-way two-lane highways, and two-way three-lane high-ways. Results suggest that the driver’s gaze and head movements are highly affected by the com-bination of environmental factors as well as individual differences. The next steps in this study are: (1) gather more participants with a diverse demographic background to provide for data diversity, and variation in conditions (for instance taking into account snowy weather); (2) perform person-ality tests on each participant to build a metric for differences between individual choices that can lead to a better prediction in building models; (3) use questionnaires to assess the individual’s un-derstanding of their driving behavior and confirm it; (4) building models using machine learning applications to predict gaze direction that considers both environmental conditions and individual differences; and (5) feed those models into embedded systems, perform analysis in real-time using such systems, and design driver monitoring systems that work in real-time and consider environ-mental factors as well as individual preferences and differences.

M I N E T A T R A N S P O R T A T I O N I N S T I T U T E 20
Abbreviations and Acronyms AV Autonomous Vehicle
CLNF Conditional Neural Fields
CAN Controller Area Network
HD High Definition
HOG Histogram of Oriented Gradients
HR Heart Rate
IoT Internet of Things
NN Nearest Neighbor
RDD Random Digit Dialing
SVM Support Vector Machine

M I N E T A T R A N S P O R T A T I O N I N S T I T U T E 21
Bibliography Ahlstrom, C., K. Kircher, & A. Kircher. A Gaze-Based Driver Distraction Warning System and
Its Effect on Visual Behavior. IEEE Transactions on Intelligent Transportation Systems, Vol. 14, No. 2, 2013, pp. 965–973.
Arakawa, T., N. Matsuo, & M. Kinoshita. Trial Evaluation on Drivers’ Unfocused Attention Us-ing Gaze Analysis. Review of automotive engineering, Vol. 27, No. 2, 2006, p. 357.
Baltrusaitis, T., P. Robinson, & L.-P. Morency. Constrained Local Neural Fields for Robust Fa-cial Landmark Detection in the Wild. 2013.
Baltrusaitis, T. OpenFace: An Open Source Facial Behaviour Analysis Toolkit. Github, 2018.
Fletcher, L., G. Loy, N. Barnes, & A. Zelinsky. Correlating Driver Gaze with the Road Scene for Driver Assistance Systems. Robotics and Autonomous Systems, Vol. 52, No. 1, 2005, pp. 71–84.
Fletcher, L., & A. Zelinsky. Driver Inattention Detection Based on Eye Gaze—Road Event Cor-relation. The international journal of robotics research, Vol. 28, No. 6, 2009, pp. 774–801.
Fridman, L., J. Lee, B. Reimer, & T. Victor. Owl and Lizard: Patterns of Head Pose and Eye Pose in Driver Gaze Classification. 2015, pp. 308–314. https://doi.org/10.1049/iet-cvi.2015.0296.
Fridman, L., P. Langhans, J. Lee, & B. Reimer. Driver Gaze Region Estimation without Use of Eye Movement. IEEE Intelligent Systems, Vol. 31, No. 3, 2016, pp. 49–56. https://doi.org/10.1109/MIS.2016.47.
Fridman, L., H. Toyoda, S. Seaman, B. Seppelt, L. Angell, J. Lee, B. Mehler, & B. Reimer. What Can Be Predicted from Six Seconds of Driver Glances? 2017.
Fridman, L. Human-Centered Autonomous Vehicle Systems: Principles of Effective Shared Au-tonomy. arXiv preprint arXiv:1810.01835, 2018.
Holm, S. A Simple Sequentially Rejective Multiple Test Procedure. Scandinavian journal of sta-tistics, 1979, pp. 65–70.
Kilpeläinen, M., & H. Summala. Effects of Weather and Weather Forecasts on Driver Behaviour. Transportation research part F: traffic psychology and behaviour, Vol. 10, No. 4, 2007, pp. 288–299.
Kong, J., K. Zhang, & X. Chen. Personality and Attitudes as Predictors of Risky Driving Behav-ior: Evidence from Beijing Drivers. 2013.

M I N E T A T R A N S P O R T A T I O N I N S T I T U T E 22
Kuo, J., M. G. Lenné, M. Mulhall, T. Sletten, C. Anderson, M. Howard, S. Rajaratnam, M. Magee, & A. Collins. Continuous Monitoring of Visual Distraction and Drowsiness in Shift-Workers during Naturalistic Driving. Safety Science, 2018.
Kutila, M., M. Jokela, G. Markkula, & M. R. Rué. Driver Distraction Detection with a Camera Vision System. No. 6, 2007, pp. VI-201.
Lappi, O. Eye Movements in the Wild: Oculomotor Control, Gaze Behavior & Frames of Ref-erence. Neuroscience & Biobehavioral Reviews, Vol. 69, 2016, pp. 49–68.
Lappi, O., P. Rinkkala, & J. Pekkanen. Systematic Observation of an Expert Driver’s Gaze Strat-egy—an on-Road Case Study. Frontiers in psychology, Vol. 8, 2017, p. 620.
Lee, J., M. Muñoz, L. Fridman, T. Victor, B. Reimer, & B. Mehler. Investigating Drivers’ Head and Glance Correspondence. ArXiv:1602.07324, 2016, pp. 1–27.
Lethaus, F., & J. Rataj. Do Eye Movements Reflect Driving Manoeuvres? IET Intelligent Transport Systems, Vol. 1, No. 3, 2007, pp. 199–204.
Linkov, V., A. Zaoral, P. Řezáč, & C.-W. Pai. Personality and Professional Drivers’ Driving Be-havior. Transportation research part F: traffic psychology and behaviour, Vol. 60, 2019, pp. 105–110.
Mandal, B., L. Li, G. S. Wang, & J. Lin. Towards Detection of Bus Driver Fatigue Based on Robust Visual Analysis of Eye State. IEEE Transactions on Intelligent Transportation Sys-tems, Vol. 18, No. 3, 2016, pp. 545–557.
McDuff, D., A. Mahmoud, M. Mavadati, M. Amr, J. Turcot, & R. el Kaliouby. AFFDEX SDK: A Cross-Platform Real-Time Multi-Face Expression Recognition Toolkit. 2016.
Møller, M., & S. Haustein. Peer Influence on Speeding Behaviour among Male Drivers Aged 18 and 28. Accident Analysis and Prevention, 2014. https://doi.org/10.1016/j.aap.2013.11.009.
Park, S., F. Pan, S. Kang, & C. D. Yoo. Driver Drowsiness Detection System Based on Feature Representation Learning Using Various Deep Networks. 2016.
Reimer, B., B. Mehler, & W. T. Freeman. Cognitive Load Estimation in the Wild. No. 1, 2018, pp. 1–9. https://doi.org/10.1145/3173574.3174226.
Rhodes, N., K. Pivik, & M. Sutton. Risky Driving among Young Male Drivers: The Effects of Mood and Passengers. Transportation research part F: traffic psychology and behaviour, Vol. 28, 2015, pp. 65–76.
Shankar, V., F. Mannering, & W. Barfield. Effect of Roadway Geometrics and Environmental Factors on Rural Freeway Accident Frequencies. Accident Analysis & Prevention, Vol. 27, No. 3, 1995, pp. 371–389.

M I N E T A T R A N S P O R T A T I O N I N S T I T U T E 23
Shepherd, J. L., D. J. Lane, R. L. Tapscott, & D. A. Gentile. Susceptible to Social Influence: Risky “Driving” in Response to Peer Pressure. Journal of Applied Social Psychology, 2011. https://doi.org/10.1111/j.1559-1816.2011.00735.x.
Simons-Morton, B., N. Lerner, & J. Singer. The Observed Effects of Teenage Passengers on the Risky Driving Behavior of Teenage Drivers. Accident Analysis & Prevention, Vol. 37, No. 6, 2005, pp. 973–982.
Stand, J. The” Hawthorne Effect”-What Did the Original Hawthorne Studies Actually Show. Scand J Work Environ Health, Vol. 26, No. 4, 2000, pp. 363–367.
Tivesten, E., & M. Dozza. Driving Context and Visual-Manual Phone Tasks Influence Glance Behavior in Naturalistic Driving. Transportation Research Part F: Traffic Psychology and Be-haviour, 2014. https://doi.org/10.1016/j.trf.2014.08.004.
Vicente, F., Z. Huang, X. Xiong, F. De la Torre, W. Zhang, & D. Levi. Driver Gaze Tracking and Eyes off the Road Detection System. IEEE Transactions on Intelligent Transportation Systems, Vol. 16, No. 4, 2015, pp. 2014–2027.
Vora, S., A. Rangesh, & M. M. Trivedi. On Generalizing Driver Gaze Zone Estimation Using Convolutional Neural Networks. 2017.
Wang, Y., B. Reimer, J. Dobres, & B. Mehler. The Sensitivity of Different Methodologies for Characterizing Drivers’ Gaze Concentration under Increased Cognitive Demand. Trans-portation research part F: traffic psychology and behaviour, Vol. 26, 2014, pp. 227–237.
Wang, Y., W. Qu, Y. Ge, X. Sun, & K. Zhang. Effect of Personality Traits on Driving Style: Psychometric Adaption of the Multidimensional Driving Style Inventory in a Chinese Sample. PLoS ONE, 2018. https://doi.org/10.1371/journal.pone.0202126.
Werneke, J., & M. Vollrath. What Does the Driver Look at? The Influence of Intersection Char-acteristics on Attention Allocation and Driving Behavior. Accident Analysis and Prevention, 2012. https://doi.org/10.1016/j.aap.2011.09.048.
Wilcoxon, F., S. K. Katti, & R. A. Wilcox. Critical Values and Probability Levels for the Wilcoxon Rank Sum Test and the Wilcoxon Signed Rank Test. Selected tables in mathematical statis-tics, Vol. 1, 1970, pp. 171–259.
Zhang, X., Y. Sugano, M. Fritz, & A. Bulling. Appearance-Based Gaze Estimation in the Wild. 2015.

M I N E T A T R A N S P O R T A T I O N I N S T I T U T E 24
About the Authors Arash Tavakoli
Arash Tavakoli is a PhD candidate, Engineering Systems and Environment (ESE) at the LinkLab of the University of Virginia. He has earned his BSc and MSc in Civil Engineering from the Sharif University of Technology and Virginia Tech respectively. Arash’s research interest lies on the intersection of psychology, transportation engineering, and computer science. Specifi-cally, Arash implements psychological theories and experimental design together with affective computing and computer vision techniques to enhance human-autonomous vehicle interaction.
Vahid Balali
PI Vahid Balali, PhD, is an Assistant Professor in the Department of Civil Engineering and Construction Engineering Management at California State University Long Beach. Dr. Balali's research focuses on visual data sensing and analytics, virtual design and construction for civil in-frastructure and interoperable system integration, and smart cities in transportation for sustainable decision-making. He also has experience as a visual data analyst and developed a video-based con-struction resource tracking and action recognition for activity analysis of operators at Caterpillar. He has the knowledge, technical skills, and experience that are crucial to the successful completion of the proposed work. Dr. Vahid Balali has been named a recipient of the 2020 Early Academic Career Excellence Award by the California State University Long Beach. He was also selected as one of the Top 40 under 40 by the Consulting-Specifying-Engineer for the year 2017 and top young professional in California by the Engineering News Record (ENR) for the year 2016. He has received the 2014 second best poster award from the Construction Research Congress, and 2013 CMAA national capital chapter scholarship award. He is currently an associate member of ASCE and CMAA, committee member of the ASCE Data Sensing and Analysis and ASCE Visual Information Modeling and Simulation committees, and friend member of relevant TRB committees. He is also serving as a reviewer of several top-notch Journals. He is actively collabo-rating with industrial partners and is involved in professional and outreach activities.
Arsalan Heydarian
Dr. Arsalan Heydarian is an Assistant Professor in the Department of Engineering Systems and Environment at the University of Virginia and he's part of the UVA Cyber-physical systems lab, the LINK LAB. His research broadly focuses on user-centered design, construction, and operation of intelligent infrastructure with the objective of enhancing their sustainability, adaptability, and resilience. Dr. Heydarian received his PhD in Civil Engineering from the University of Southern California (USC), MSc in System Engineering from USC, and BSc and MSc in Civil Engi-neering from Virginia Tech.

MTI FOUNDER Hon. Norman Y. Mineta
MTI BOARD OF TRUSTEES Founder, Honorable Norman Mineta* Secretary (ret.), US Department of Transportation Chair, Will Kempton Retired Transportation Executive Vice Chair, Jeff Morales Managing Principal InfraStrategies, LLC Executive Director, Karen Philbrick, PhD* Mineta Transportation Institute San José State University Winsome Bowen Vice President, Project Development Strategy WSP David Castagnetti Co-Founder Mehlman Castagnetti Rosen & Thomas Maria Cino Vice President, America & U.S. Government Relations Hewlett-Packard Enterprise Grace Crunican** Owner Crunican LLC Donna DeMartino Managing Director Los Angeles-San Diego-San Luis Obispo Rail Corridor Agency
John Flaherty Senior Fellow Silicon Valley American Leadership Forum William Flynn * President & CEO Amtrak Rose Guilbault Board Member Peninsula Corridor Joint Power Board Ian Jefferies* President & CEO Association of American Railroads Diane Woodend Jones Principal & Chair of Board Lea & Elliott, Inc. David S. Kim* Secretary California State Transportation Agency (CALSTA) Therese McMillan Executive Director Metropolitan Transportation Commission (MTC) Abbas Mohaddes President & COO Econolite Group Inc. Stephen Morrissey Vice President – Regulatory and Policy United Airlines
Dan Moshavi, PhD* Dean Lucas College and Graduate School of Business, San José State University Toks Omishakin* Director California Department of Transportation (Caltrans) Takayoshi Oshima Chairman & CEO Allied Telesis, Inc. Greg Regan President Transportation Trades Department, AFL-CIO Paul Skoutelas* President & CEO American Public Transportation Association (APTA) Kimberly Slaughter CEO Systra USA Beverley Swaim-Staley President Union Station Redevelopment Corporation Jim Tymon* Executive Director American Association of State Highway and Transportation Officials (AASHTO) * = Ex-Officio ** = Past Chair, Board of Trustees
Directors Karen Philbrick, PhD Executive Director Hilary Nixon, PhD Deputy Executive Director Asha Weinstein Agrawal, PhD Education Director National Transportation Finance Center Director Brian Michael Jenkins National Transportation Security Center Director