Embed Size (px)
Citation preview
How do Foot Orthotic and Bracing Interventions Really Work?
A presentation linking clinical data with laboratory evidence to enhance patient care
Jeff Houck, PT, PhDDeborah A. Nawoczenski PT, PhD
Ithaca College – Rochester CenterMovement Analysis Laboratory and Center for Foot and Ankle Research
Rochester, NY
Christopher Neville, PT, PhDUpstate Medical University, Syracuse, NY
Smita Rao PT, PhDNew York University, New York, NY
Session Overview
• What motivated this session?– discordance between the severity of foot
pathology and functional status
– competing ideas of how foot orthotics/bracing interventions should be applied may lead to non-optimal management of foot pathologies
• What do we hope to achieve?– integration of laboratory based kinematic and
kinetic studies, combined with clinical data
– specific case studies will be used to motivate discussions of best care approaches
Session Evolution
• Discuss the ‘disconnect’ between foot function and foot pathology;
• Present current state of evidence regarding kinematic and kinetic mechanisms underlying orthotic/brace effectiveness;
• Using clinical laboratory data, discuss approaches and controversies of care related to orthotic interventions for selected foot pathologies.

DISCONNECT BETWEEN FOOT PATHOLOGY AND FUNCTION
Jeff Houck, PT, PhDAssociate ProfessorDepartment of Physical Therapy
Ithaca College
Key Points
• The Relationship between Foot Pathology and Patients’ self-reported function
“Does poor function accompany terrible lookin’ feet?”
• Evidence highlighting the Disconnect between Foot Pathology and Function
Prevalence of flat foot in preschool-aged children.
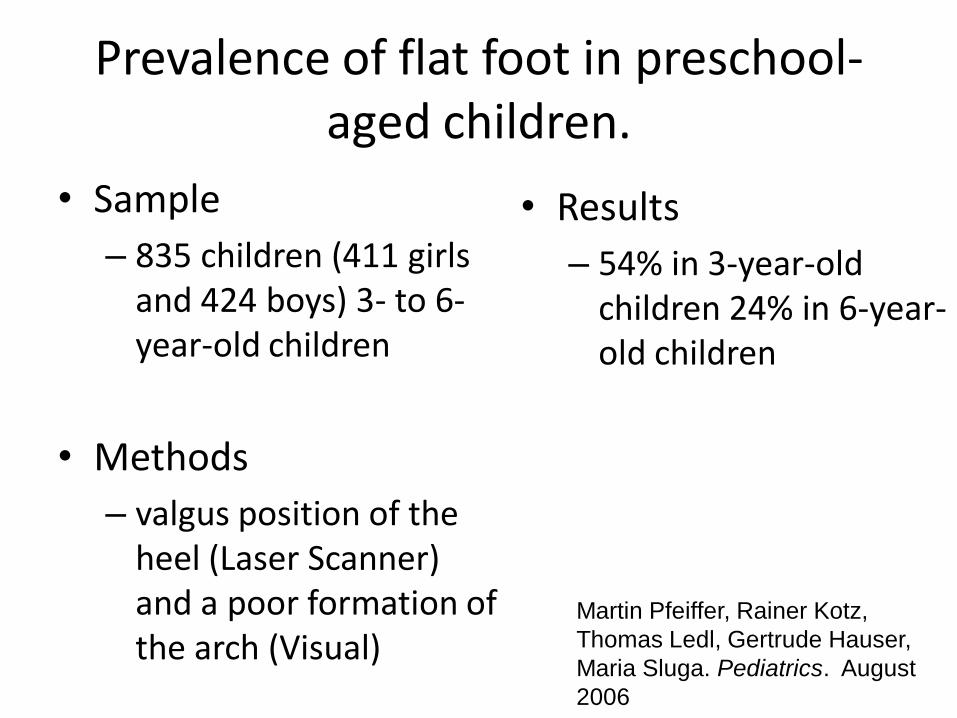
• Sample
– 835 children (411 girls and 424 boys) 3- to 6-year-old children
• Methods
– valgus position of the heel (Laser Scanner) and a poor formation of the arch (Visual)
• Results
– 54% in 3-year-old children 24% in 6-year-old children
Martin Pfeiffer, Rainer Kotz,
Thomas Ledl, Gertrude Hauser,
Maria Sluga. Pediatrics. August
2006
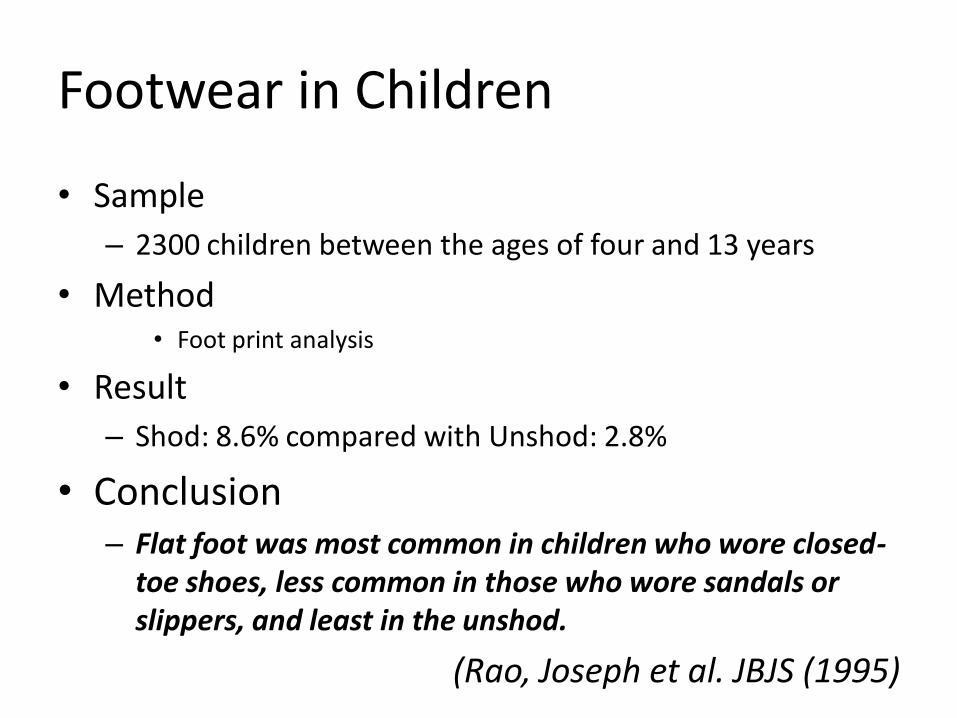
Footwear in Children
• Sample
– 2300 children between the ages of four and 13 years
• Method • Foot print analysis
• Result
– Shod: 8.6% compared with Unshod: 2.8%
• Conclusion– Flat foot was most common in children who wore closed-
toe shoes, less common in those who wore sandals or slippers, and least in the unshod.
(Rao, Joseph et al. JBJS (1995)
Summary (Flexible flatfoot –normal?)
• Flexible flatfoot decreases with maturity
– MLA reaches peak height @ 12-13 years old(Staheli,
1987)
– Medial fat pad may play a role (Mickle et al, J Ped Ortho, 2008)
• The overall prevalence of flexible flatfoot in adults is estimated at 8 - 20% depending on measurements used. (Benvenuti, 1995, Badlissi, 2005)
• Shoes worn less than 5-6 years old may influence flexible flatfoot (Rao,1992, Sachithanada, 1995)
Foot structure
• The poor association of foot structure and function is underscored by the range of foot posture found in non-painful feet
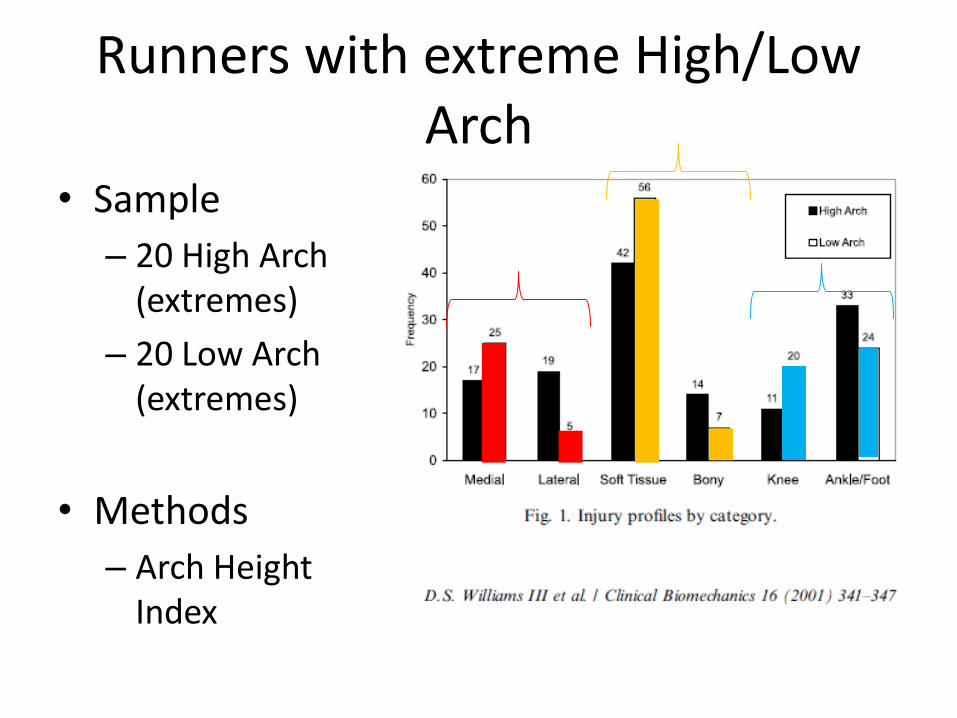
Runners with extreme High/Low Arch
• Sample
– 20 High Arch (extremes)
– 20 Low Arch (extremes)
• Methods
– Arch Height Index
Summary
• When foot postures are extreme and there is exposure to high loads
–Foot posture is associated with injury
Is foot pain associated with flatfoot (pes planus) in the Elderly?
(Badlissi et al, JAGS, 2005, Benvenuti et al, JAGS, 1995)
Benvenuti et al, JAGS, 1995
Association of IADL and Foot Problems
Summary• Pes planus is associated with foot pain • Foot problems mostly limit distance walking
activities • However, associations are weak
Implications
• Foot conditions in the elderly are common, however, pes planus is not closely linked to IADL’s
Case Example
• 67 y.o. female with intermittent pain right foot PTTD
• PMH: bilateral THR, CA survivor
• Function: Walking 1-2 miles with minimal sx’s
Influence on Orthotic/Brace Prescription
• Foot postures vary widely
– Flexible flatfoot as an example is a normal variant
– Questions the validity of targeting flatfoot
• Extreme foot postures appear more susceptible therefore orthotic/bracing indicated
• Elderly subjects may prefer exercise/orthotics/bracing in spite of severe deformity
Treatment based on individual
pathologies and client preferences
NOT on foot structure alone!
PROPOSED MECHANISMS OF ORTHOTIC/BRACING TREATMENT FOR FOOT PATHOLOGY (KINEMATICS VS. KINETICS)
Jeff Houck, PT, PhDAssociate ProfessorDepartment of Physical Therapy
Ithaca College
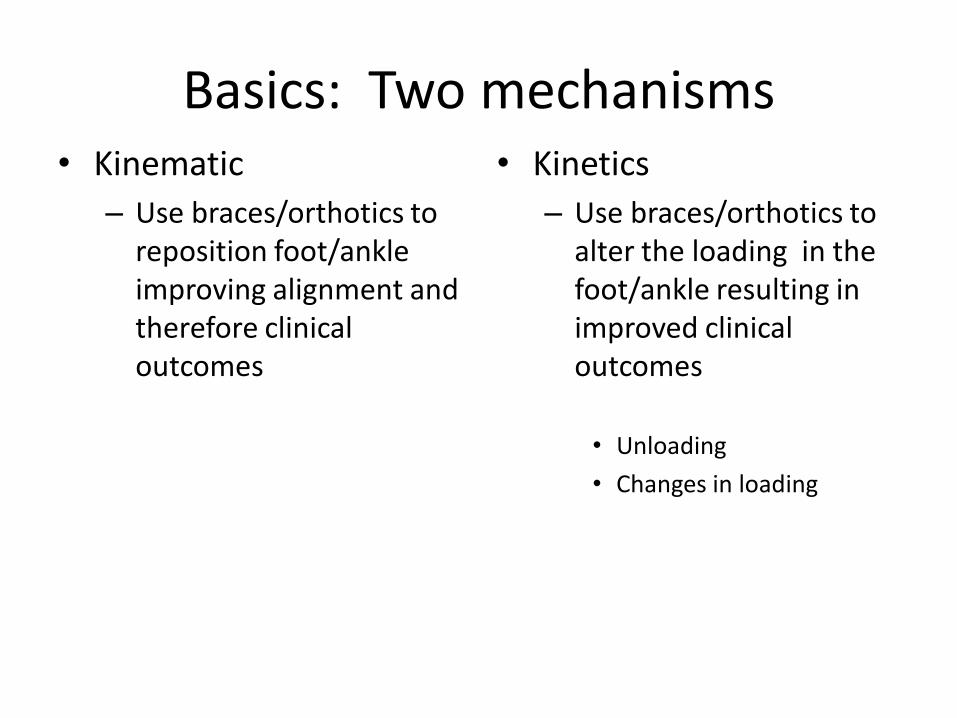
Basics: Two mechanisms• Kinematic
– Use braces/orthotics to reposition foot/ankle improving alignment and therefore clinical outcomes
• Kinetics
– Use braces/orthotics to alter the loading in the foot/ankle resulting in improved clinical outcomes
• Unloading
• Changes in loading
Review of Important Foot Ligaments
• Spring Ligament
• Long Plantar Ligament
• Lisfranc Ligament
• Plantarfascia
• Deltoid Ligament
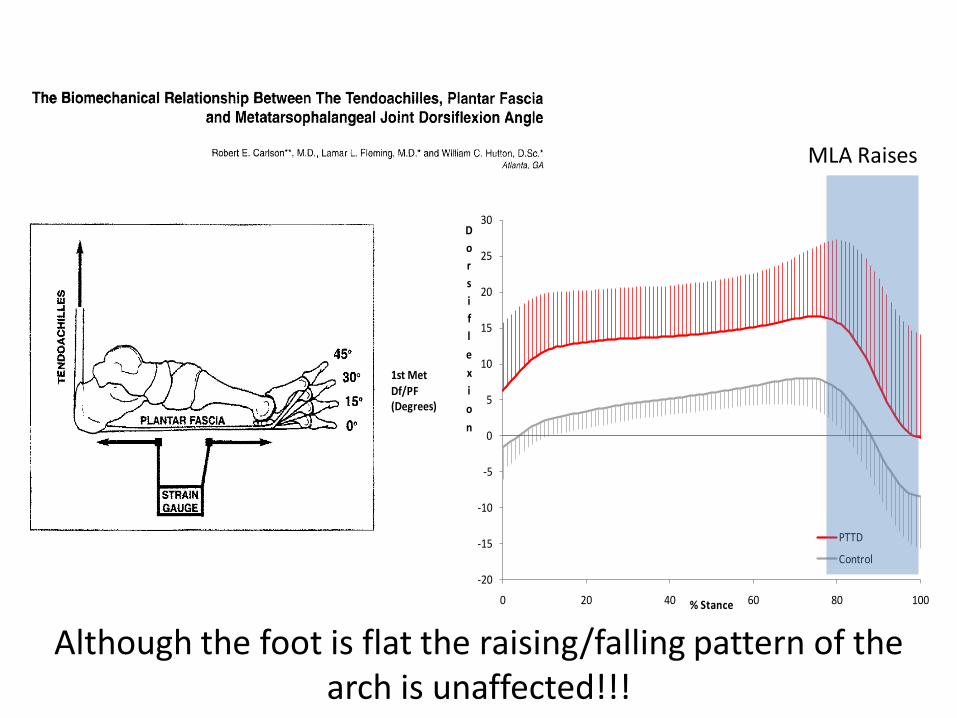
Plantarfascia - Windlass Mechanism
• Toe dorsiflexion tightens plantarfascia raising MLA
Radiographs - Static Alignment Lateral Talo-first metatarsal angle

Normal Abnormal
Forefoot Abduction
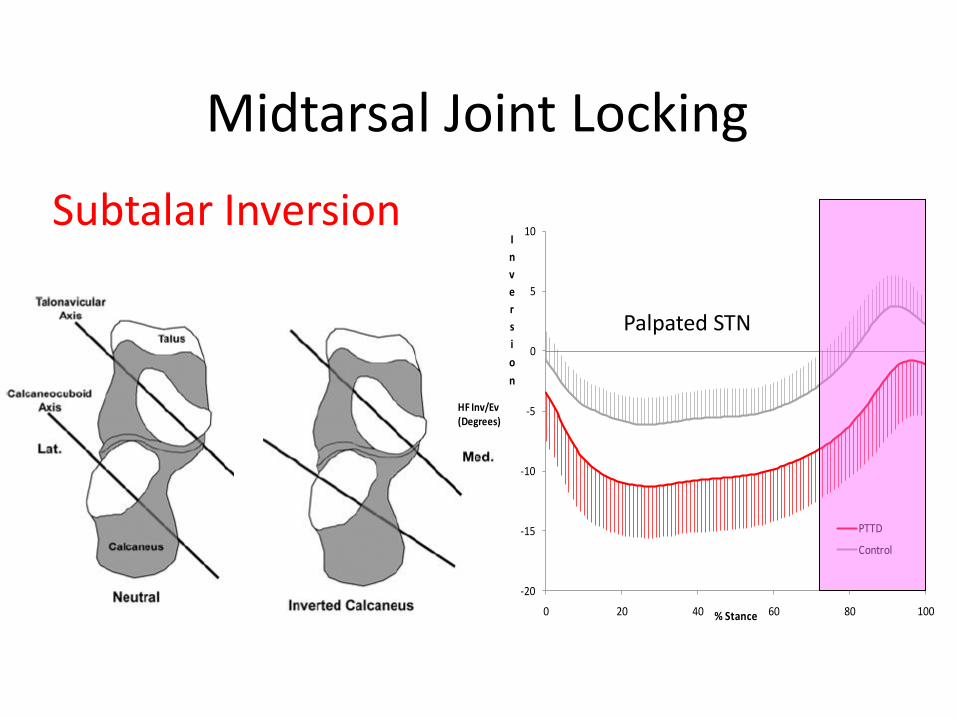
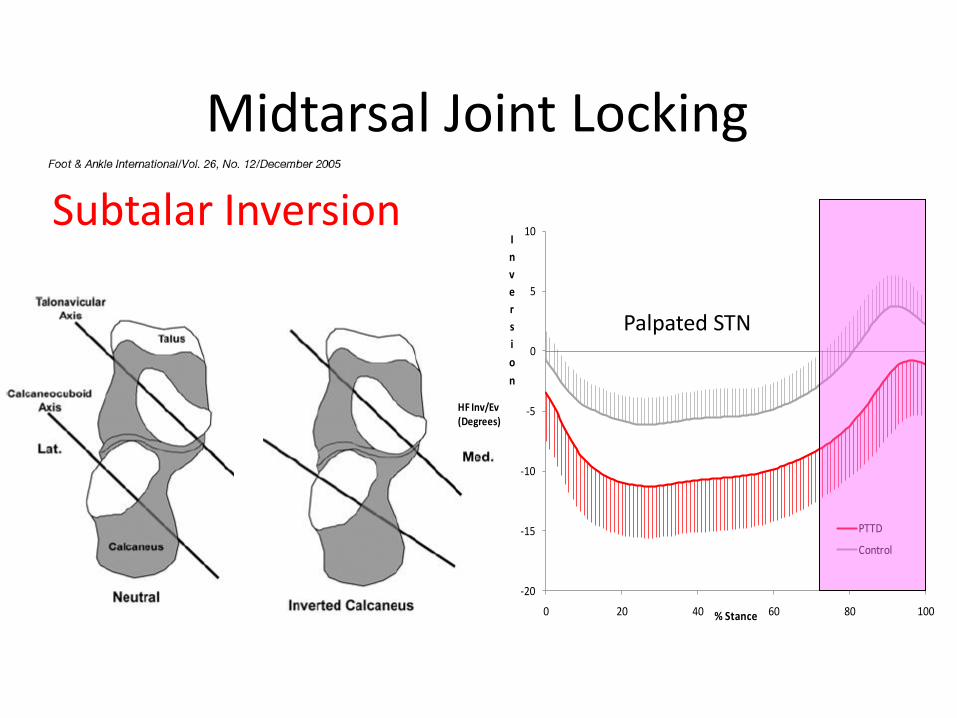
Midtarsal Joint Locking
Subtalar Inversion
-20
-15
-10
-5
0
5
10
0 20 40 60 80 100
I
n
v
e
r
s
i
o
n
% Stance
PTTD
Control
HF Inv/Ev (Degrees)
Palpated STN
Muscle Control

Are all these really happening at once?
Triceps Surae
Spring Ligament & Plantar fascia
MLA
PT (Oatis & Gage, 2001, Flemister et al, 2007)
Significance of other muscle (FDL, FHL, foot intrinsics)?(Fiolkowski et al, 2003, Hinterman et al, 1994)
Hindfoot Inversion = Boney stability
PASSIVEBlackwood et al, 2005
80 % of the power for walking comes from the ankle ?
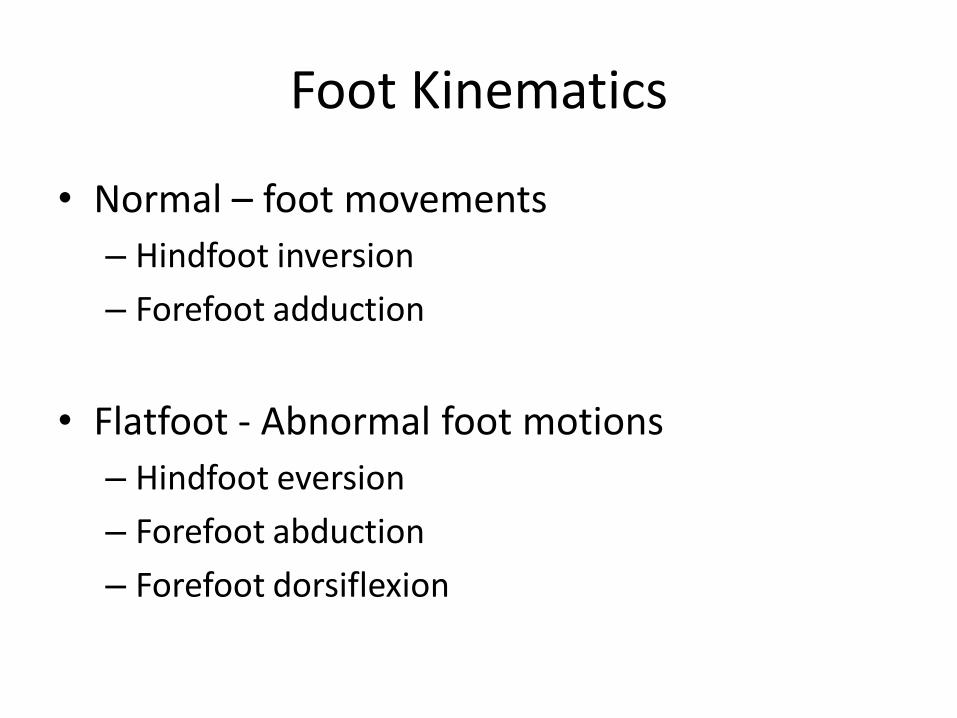
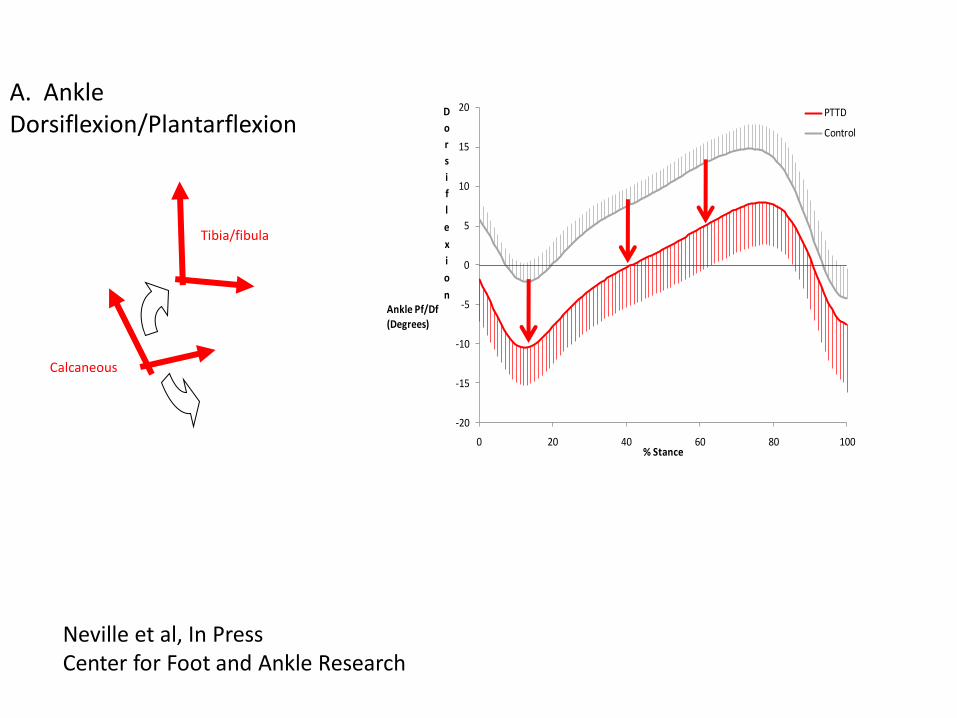
Foot Kinematics
• Normal – foot movements
– Hindfoot inversion
– Forefoot adduction
• Flatfoot - Abnormal foot motions
– Hindfoot eversion
– Forefoot abduction
– Forefoot dorsiflexion
-20
-15
-10
-5
0
5
10
15
20
0 20 40 60 80 100
D
o
r
s
i
f
l
e
x
i
o
n
% Stance
PTTD
Control
Ankle Pf/Df (Degrees)
A. Ankle Dorsiflexion/Plantarflexion
Tibia/fibula
Dorsiflexion
Calcaneous
Plantarflexion
Neville et al, In PressCenter for Foot and Ankle Research
-70
-60
-50
-40
-30
-20
-10
0
10
20
30
0 20 40 60 80 100
D
o
r
s
i
f
l
e
x
i
o
n
% Stance
PTTD
Control
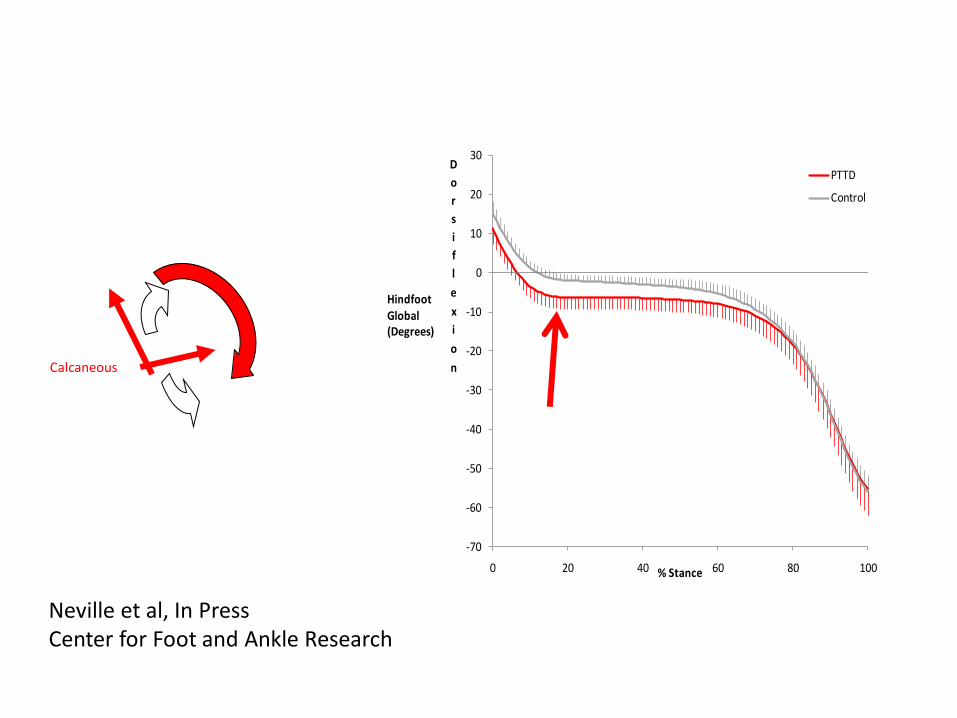
Hindfoot Global (Degrees)
Neville et al, In PressCenter for Foot and Ankle Research
Dorsiflexion
Calcaneous
Plantarflexion
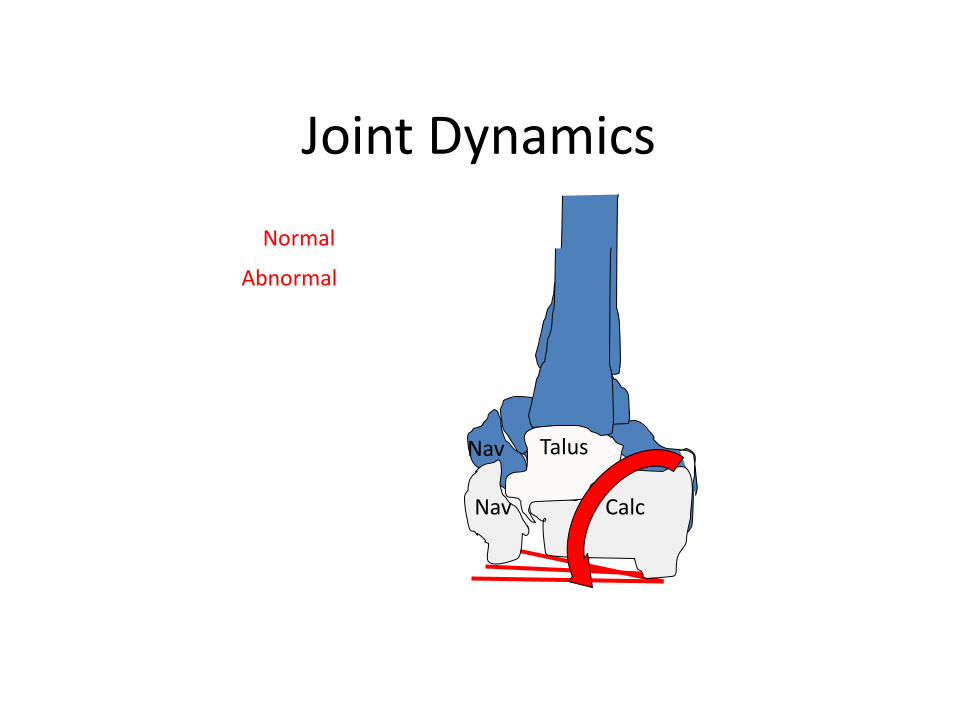
Joint Dynamics
Normal
Abnormal
Calc
Nav
Talus
Calc
CalcNav
Talus
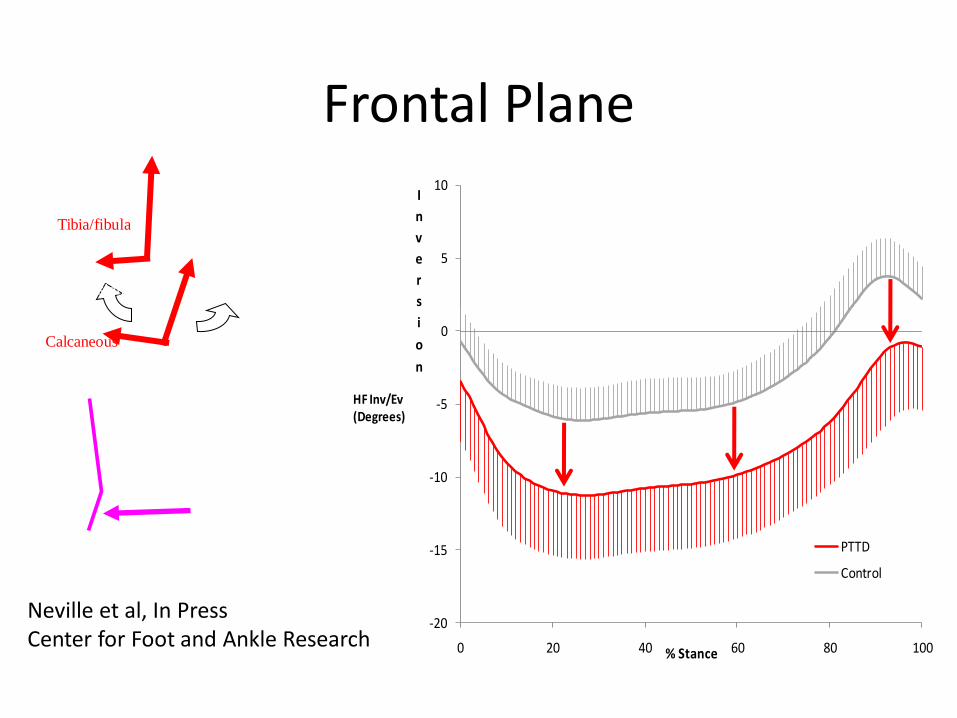
Frontal Plane
-20
-15
-10
-5
0
5
10
0 20 40 60 80 100
I
n
v
e
r
s
i
o
n
% Stance
PTTD
Control
HF Inv/Ev (Degrees)
Tibia/fibula
Eversion
Calcaneous
Neville et al, In PressCenter for Foot and Ankle Research
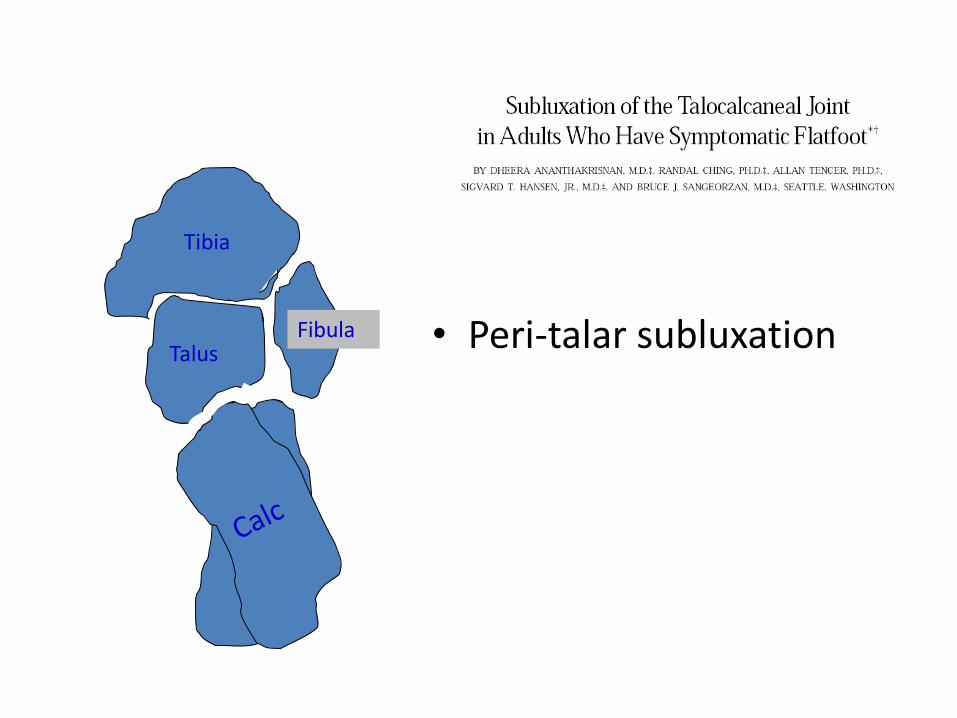
• Peri-talar subluxation
Frontal plane slice – CT scan
Calc
Talus
Tibia
Fibula
Midtarsal Joint Locking
Subtalar Inversion
-20
-15
-10
-5
0
5
10
0 20 40 60 80 100
I
n
v
e
r
s
i
o
n
% Stance
PTTD
Control
HF Inv/Ev (Degrees)
Palpated STN
-20
-15
-10
-5
0
5
10
15
20
25
30
0 20 40 60 80 100
D
o
r
s
i
f
l
e
x
i
o
n
% Stance
PTTD
Control
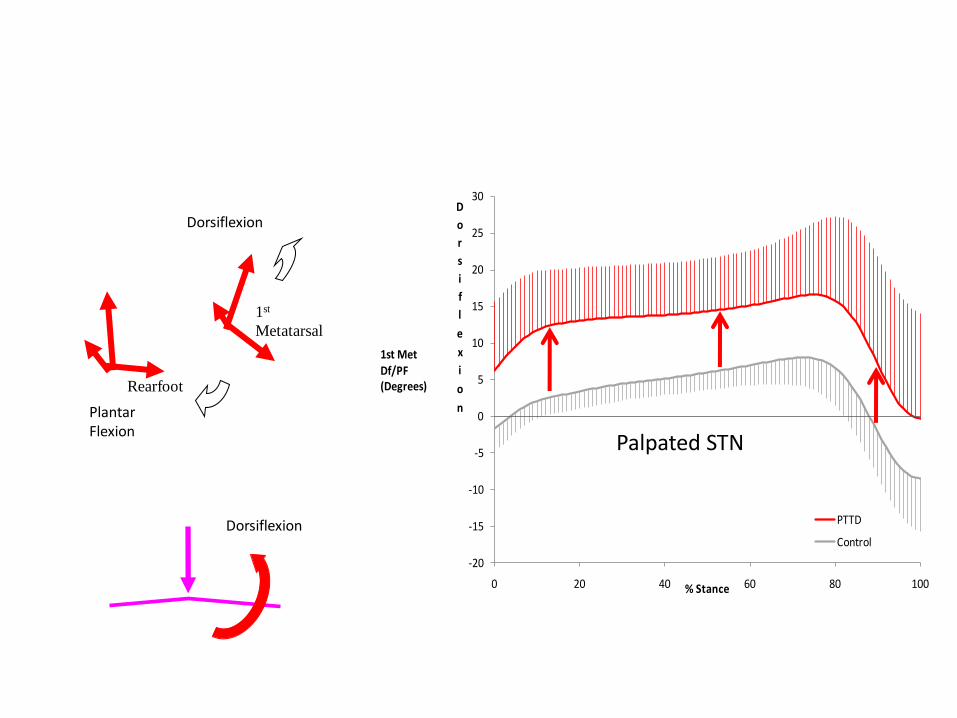
1st Met Df/PF (Degrees)
1st
Metatarsal
Rearfoot
Dorsiflexion
Plantar Flexion
Dorsiflexion
Palpated STN
-20
-15
-10
-5
0
5
10
15
20
25
30
0 20 40 60 80 100
D
o
r
s
i
f
l
e
x
i
o
n
% Stance
PTTD
Control
1st Met Df/PF (Degrees)
MLA Raises
Although the foot is flat the raising/falling pattern of the arch is unaffected!!!
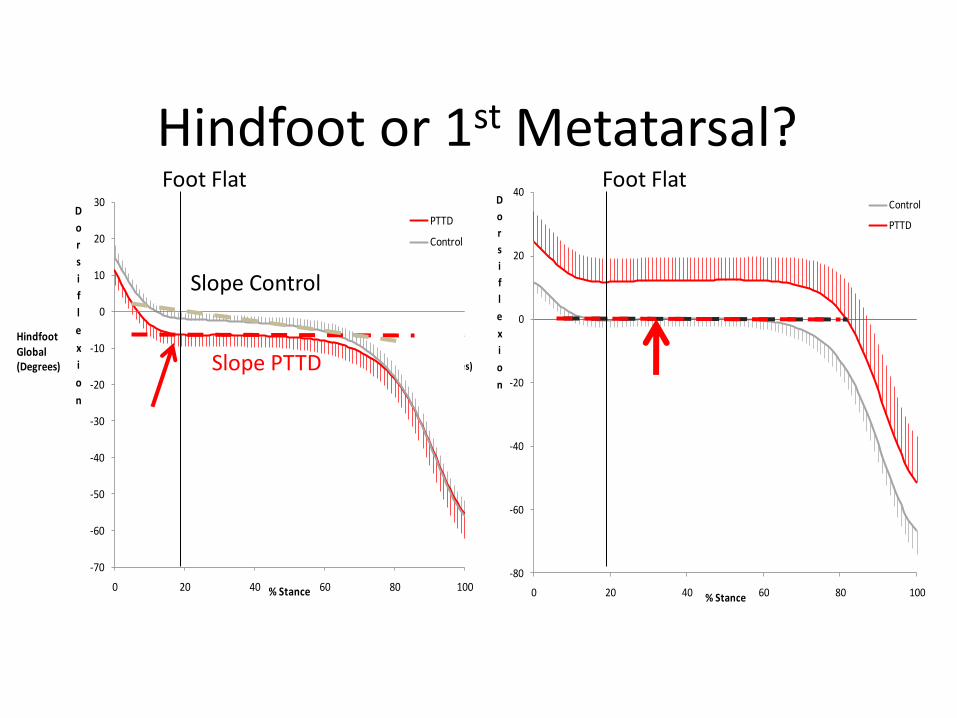
Hindfoot or 1st Metatarsal?
-80
-60
-40
-20
0
20
40
0 20 40 60 80 100
D
o
r
s
i
f
l
e
x
i
o
n
% Stance
Control
PTTD
1st METGlobal (Degrees)
-70
-60
-50
-40
-30
-20
-10
0
10
20
30
0 20 40 60 80 100
D
o
r
s
i
f
l
e
x
i
o
n
% Stance
PTTD
Control
Hindfoot Global (Degrees) Slope PTTD
Slope Control
Foot Flat Foot Flat
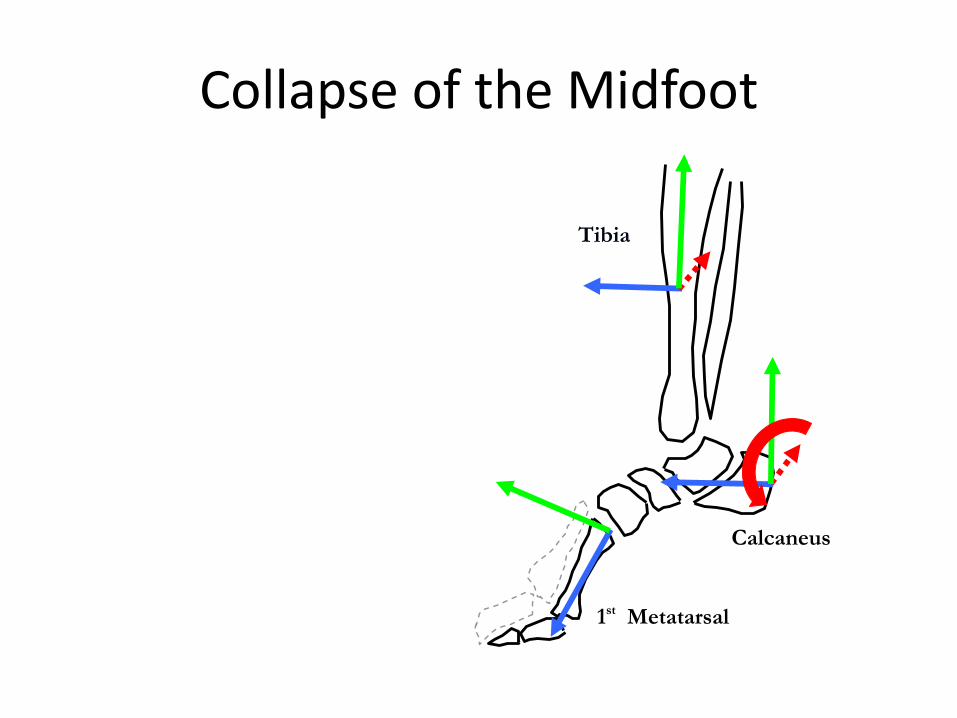
Collapse of the Midfoot
1st Metatarsal
Calcaneus
Tibia
Tibia
Calcaneus
1st Metatarsal
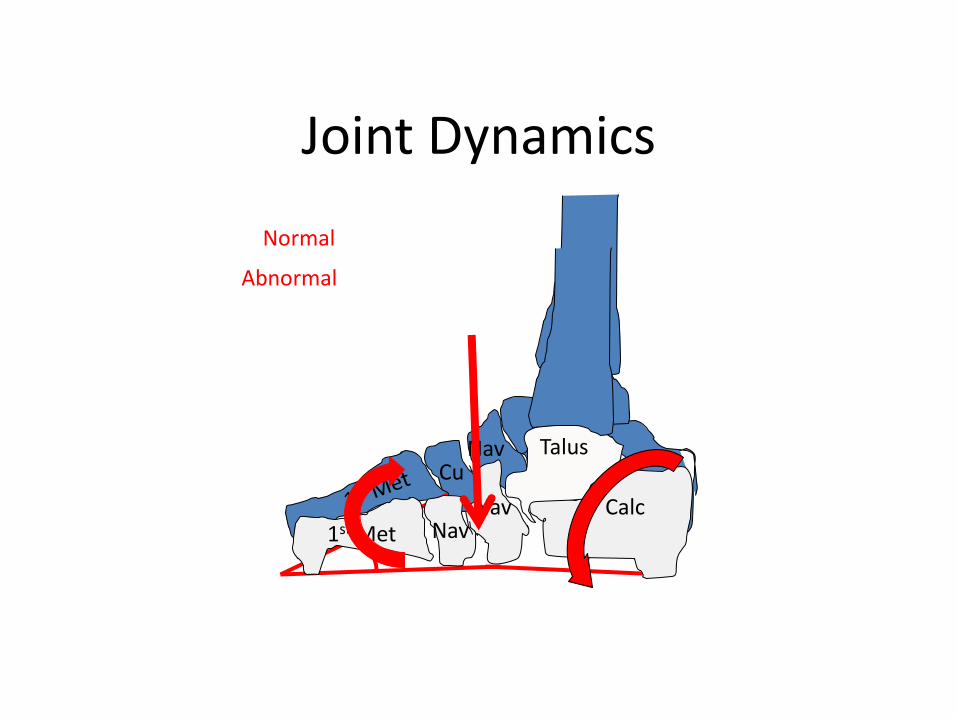
Joint Dynamics
Normal
Abnormal
Calc
Nav
Talus
Calc
CalcNav
TalusCu
1st Met Nav
Hindfoot Plantarflexion1st Metatarsal
Dorsiflexion
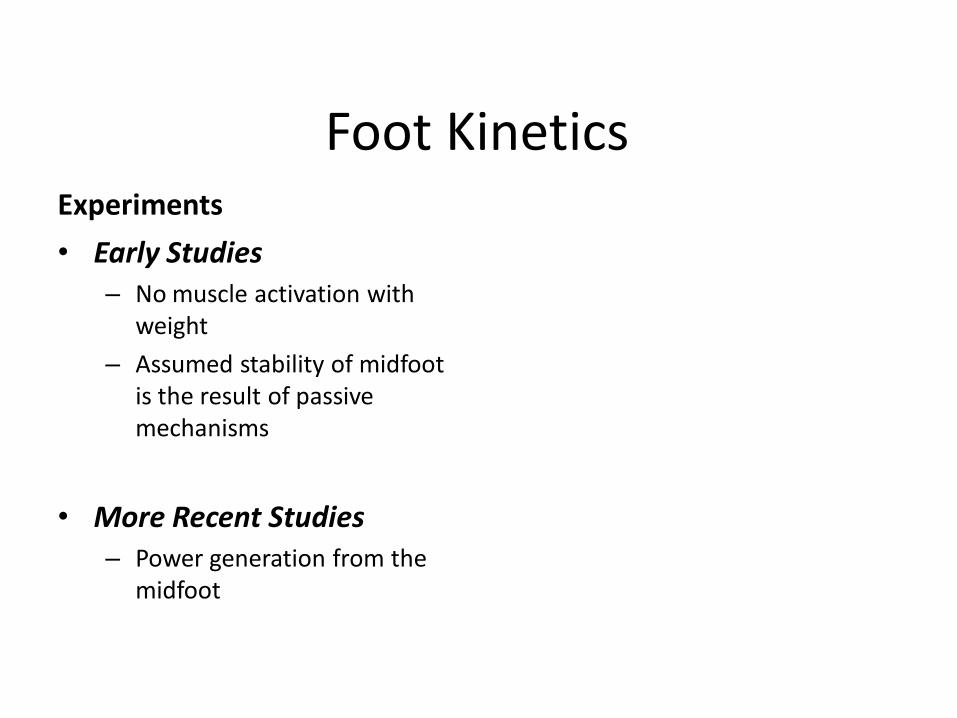
Foot KineticsExperiments
• Early Studies– No muscle activation with
weight
– Assumed stability of midfoot is the result of passive mechanisms
• More Recent Studies – Power generation from the
midfoot
Pressure Patterns
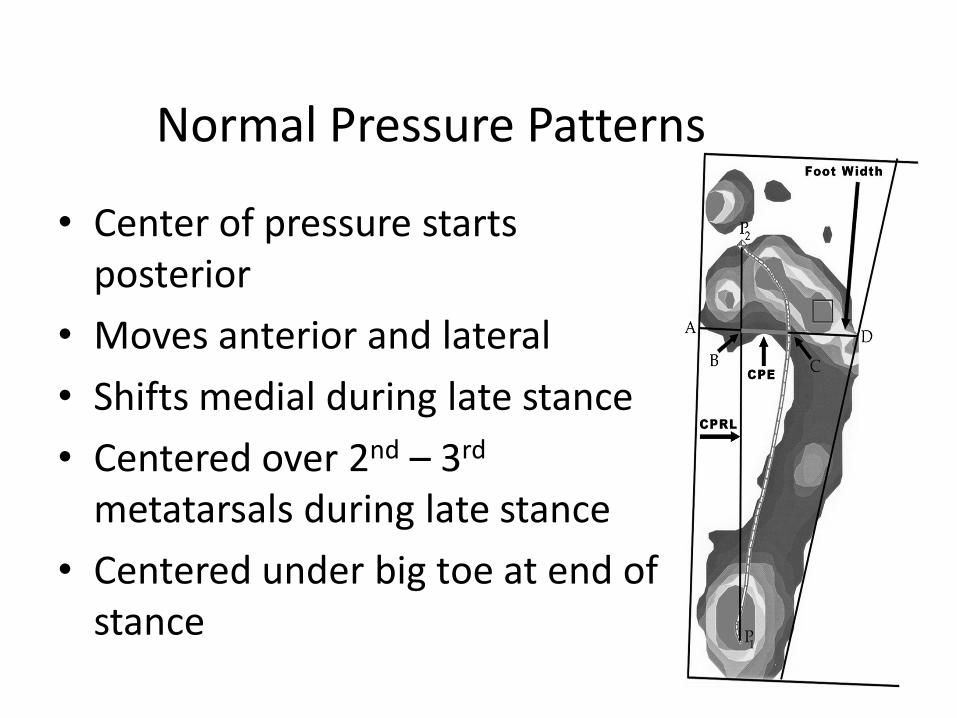
Normal Pressure Patterns
• Center of pressure starts posterior
• Moves anterior and lateral
• Shifts medial during late stance
• Centered over 2nd – 3rd
metatarsals during late stance
• Centered under big toe at end of stance
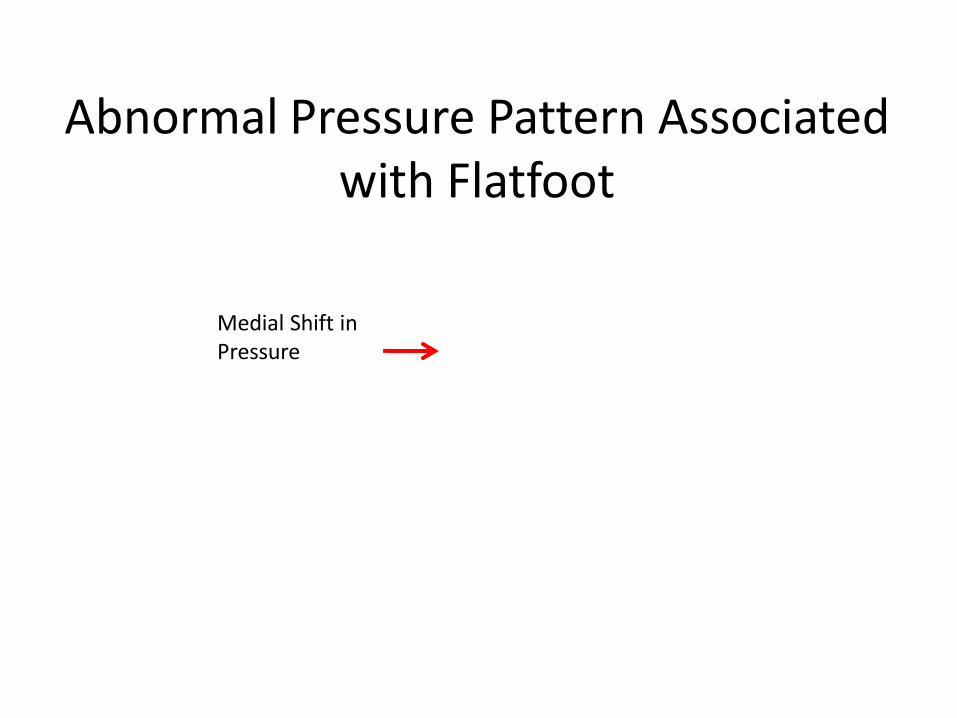
Abnormal Pressure Pattern Associated with Flatfoot
Medial Shift in Pressure
Clinical Goal
• Restore normal pressure patterns?
Off load pathology or restore load?
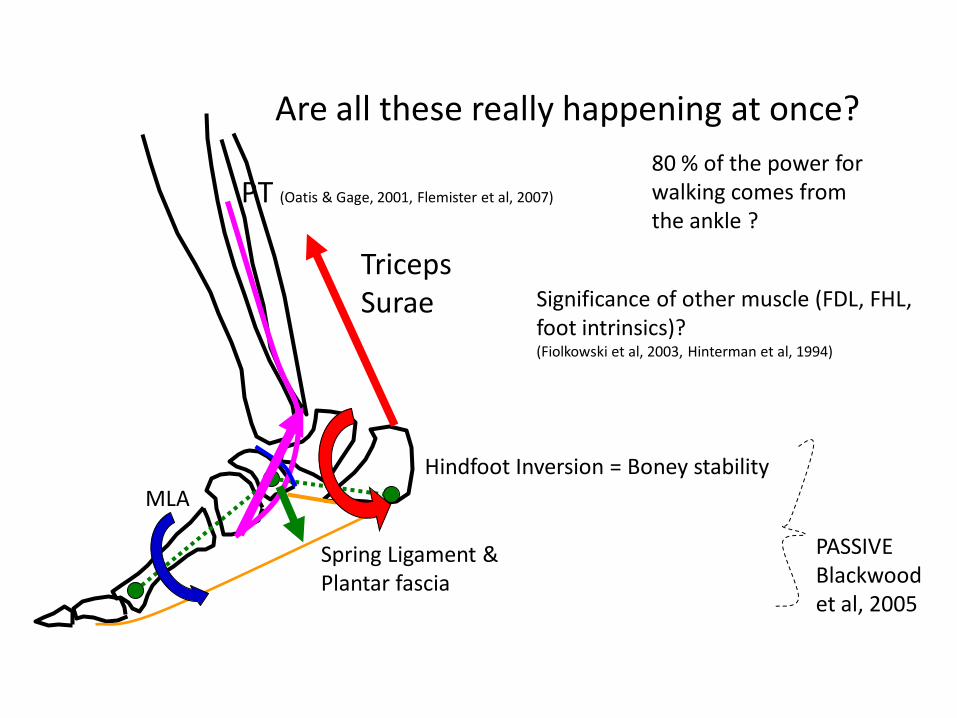
Are all these really happening at once?
Triceps Surae
Spring Ligament & Plantar fascia
MLA
PT (Oatis & Gage, 2001, Flemister et al, 2007)
Significance of other muscle (FDL, FHL, foot intrinsics)?(Fiolkowski et al, 2003, Hinterman et al, 1994)
Hindfoot Inversion = Boney stability
PASSIVEBlackwood et al, 2005
80 % of the power for walking comes from the ankle ?
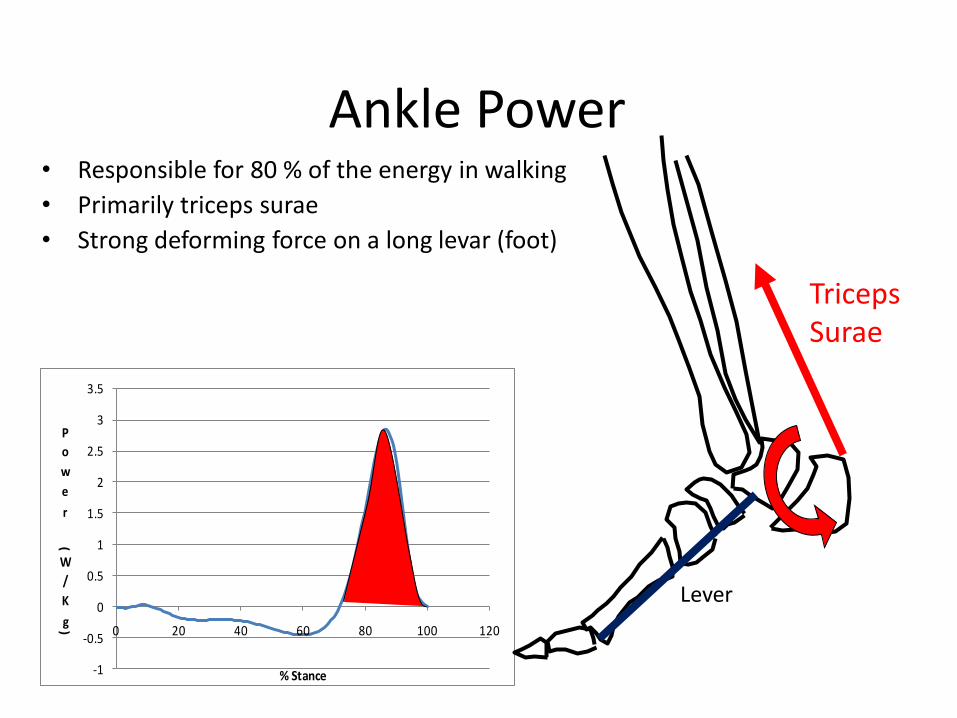
Ankle Power• Responsible for 80 % of the energy in walking
• Primarily triceps surae
• Strong deforming force on a long levar (foot)
-1
-0.5
0
0.5
1
1.5
2
2.5
3
3.5
0 20 40 60 80 100 120
P
o
w
e
r
(
W
/
K
g)
% Stance
Triceps Surae
Lever
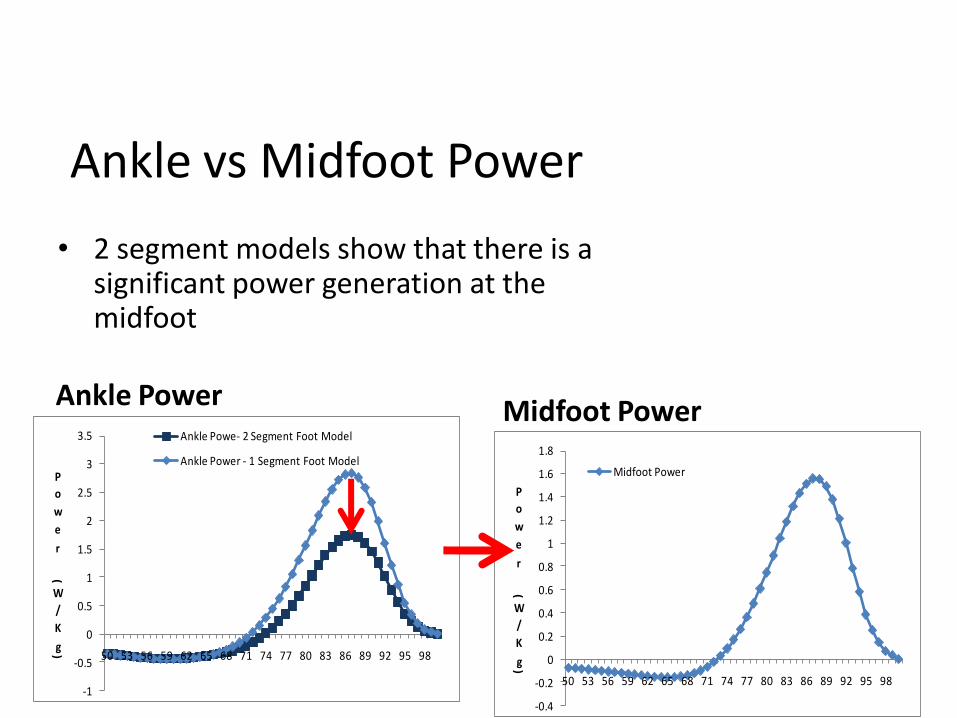
Ankle vs Midfoot Power
Ankle Power
• 2 segment models show that there is a significant power generation at the midfoot
Midfoot Power
-0.4
-0.2
0
0.2
0.4
0.6
0.8
1
1.2
1.4
1.6
1.8
50 53 56 59 62 65 68 71 74 77 80 83 86 89 92 95 98
P
o
w
e
r
(
W
/
K
g)
Midfoot Power
-1
-0.5
0
0.5
1
1.5
2
2.5
3
3.5
50 53 56 59 62 65 68 71 74 77 80 83 86 89 92 95 98
P
o
w
e
r
(
W
/
K
g)
Ankle Powe- 2 Segment Foot Model
Ankle Power - 1 Segment Foot Model
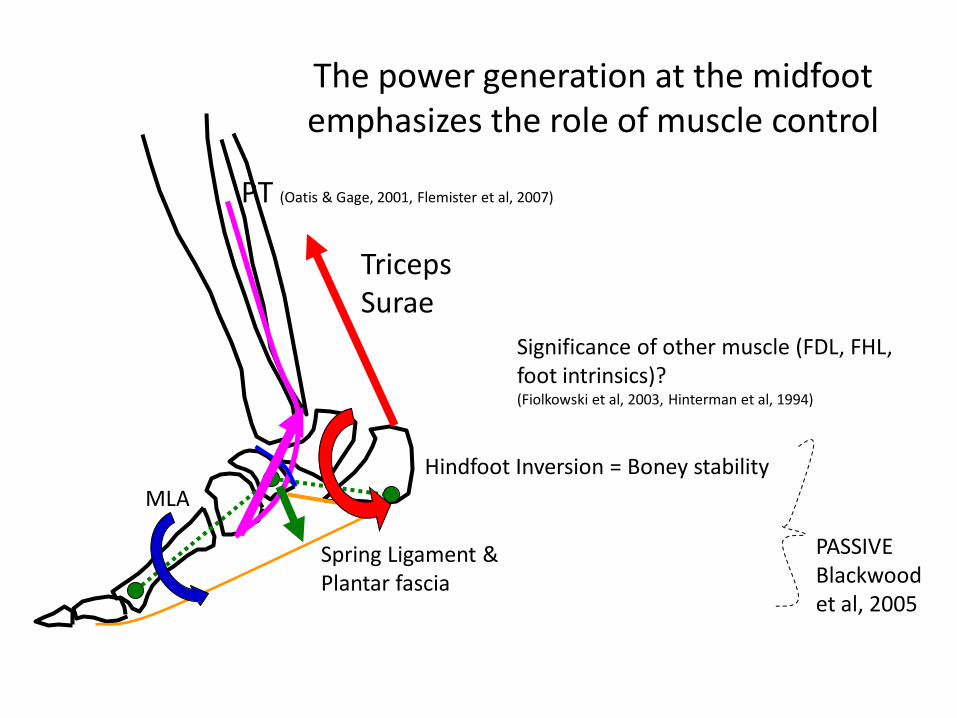
The power generation at the midfoot emphasizes the role of muscle control
Triceps Surae
Spring Ligament & Plantar fascia
MLA
PT (Oatis & Gage, 2001, Flemister et al, 2007)
Significance of other muscle (FDL, FHL, foot intrinsics)?(Fiolkowski et al, 2003, Hinterman et al, 1994)
Hindfoot Inversion = Boney stability
PASSIVEBlackwood et al, 2005
Midfoot Stability
• Normal foot – good alignment may multiply muscle forces, resulting in large power generations at the midfoot for propulsion
– Power generation at the midfoot is large
• Flatfoot deformity – The foot may be more dependent on muscle control because of the loss of alignment (which alters moment arms).
Clinically
• Altering kinetic patterns may be more important for the foot with midfoot stability than controlling kinematics!!
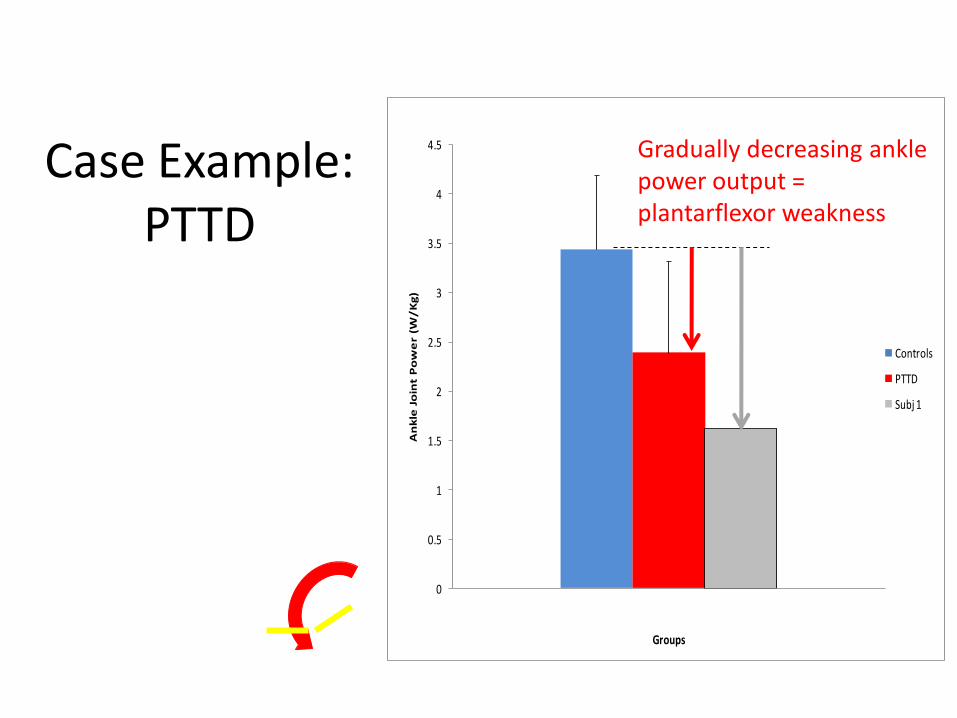
Case Example: PTTD
0
0.5
1
1.5
2
2.5
3
3.5
4
4.5
An
kle
Jo
int
Po
we
r (W
/K
g)
Groups
Controls
PTTD
Subj 1
Gradually decreasing ankle power output = plantarflexor weakness
Why do orthotics work?
• Lessons learned
– Patients may benefit from developing clinical models that combine kinematics and kinetics.
• Kinematic correction improves alignment – In some cases are we so restrictive that we are sacrificing
muscle control?
• Kinetic changes alter loading– Unloading
» In some cases are we targeting kinematics and causing kinetic changes?
» In other cases are we targeting kinematics when kinetics would be more effective?
– Alteration of loading patterns
Acknowledgements
“Working collaboratively to solve
patient centered biomechanics
problems”
Radiology Dr. Kwok
OrthopedicsDr. BaumhauerDr. FlemisterDr. Di Giovanni
RehabilitationDr. NawoczenskiDr. Rao
OrthoticsChris ConstantiniDan Sherwood
CLINICAL AND LABORATORY EVIDENCE:LESSONS FROM PATIENTS WITH HALLUXRIGIDUS
Deborah A. Nawoczenski PT, PhDIthaca College-Rochester CenterMovement Analysis Laboratory and Center for Foot and Ankle Research
Overview
• Background
– Etiology and pathology
• Clinical presentation
– Kinematic and Kinetic Adaptations
• Management Approaches
– Operative vs. Non Operative
• Lessons Learned

THE “GREAT” TOE
• 8 muscles impact 1st MTP function
– 6 directly insert on hallux
• 1st MTP dorsiflexion needed approximately 900 times/mile
• Joint forces 80-130% BW during normal walking speeds
• During quiet standing, great toe carries twice the amount of pressure as the other 4 toes combined
Oatis 2004; Hutton 1981
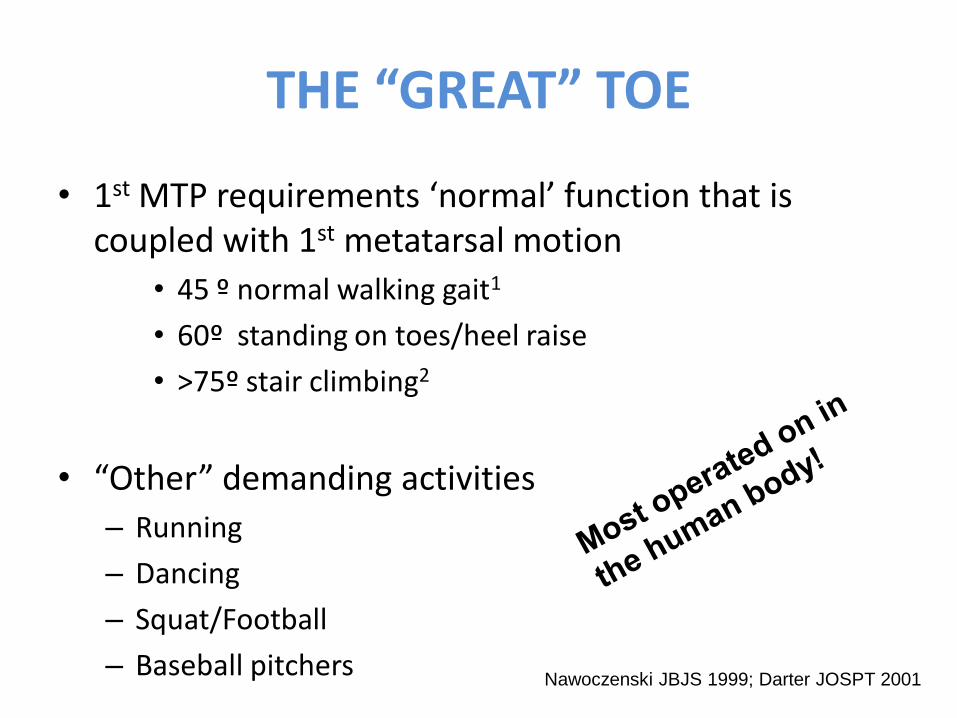
THE “GREAT” TOE
• 1st MTP requirements ‘normal’ function that is coupled with 1st metatarsal motion
• 45 º normal walking gait1
• 60º standing on toes/heel raise
• >75º stair climbing2
• “Other” demanding activities
– Running
– Dancing
– Squat/Football
– Baseball pitchersNawoczenski JBJS 1999; Darter JOSPT 2001
The Tar Heels News…..
Toe injury delays Lawson’s NCAA playDavid Ely, Senior Writer
Published: Friday, March 20, 2009
Updated: Friday, March 20, 2009
North Carolina‟s Ty Lawson is used to being in control.
As the lead guard in coach Roy Williams‟ high-octane attack, the
ball rarely leaves Lawson‟s hands when he‟s on the court.
So it‟s no surprise that Lawson felt out of sorts when his still-injured
toe forced him into spectator status during UNC‟s first-round win
against Radford.
“I was real stressed,” Lawson said after the game. “In the beginning
when they came back and it was like 13-11, I‟m like yelling out
there, „Come on guys, pick it up!‟

Toe becomes Thumb
• Replantation
Courtesy of University of Rochester Medical Center, Hand and Wrist Surgery
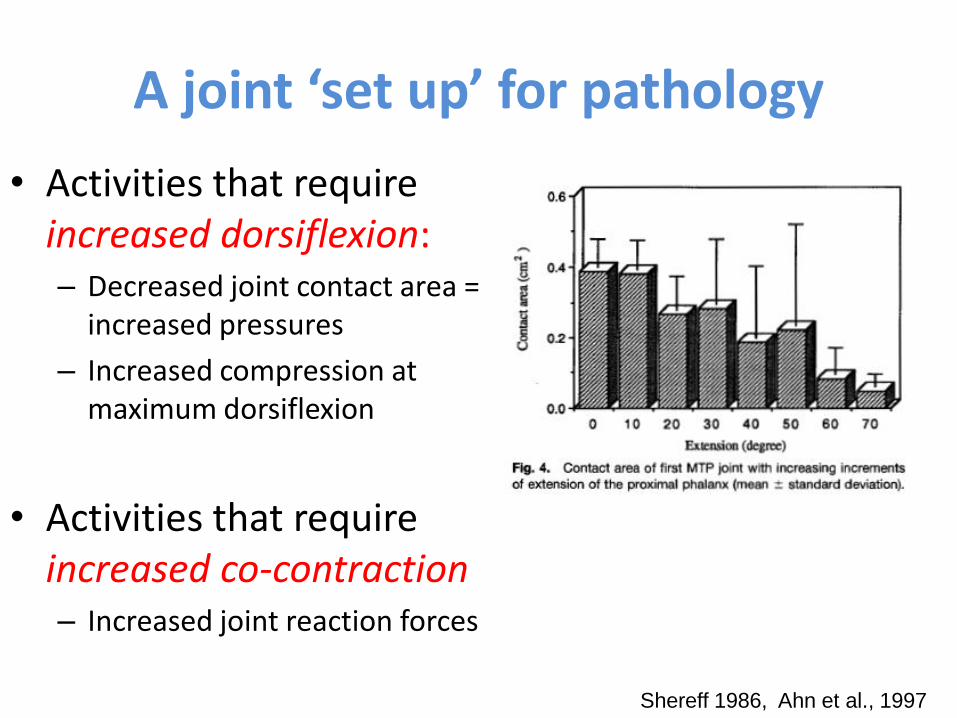
A joint ‘set up’ for pathology
• Activities that require increased dorsiflexion:– Decreased joint contact area =
increased pressures
– Increased compression at maximum dorsiflexion
• Activities that require increased co-contraction– Increased joint reaction forces
Shereff 1986, Ahn et al., 1997
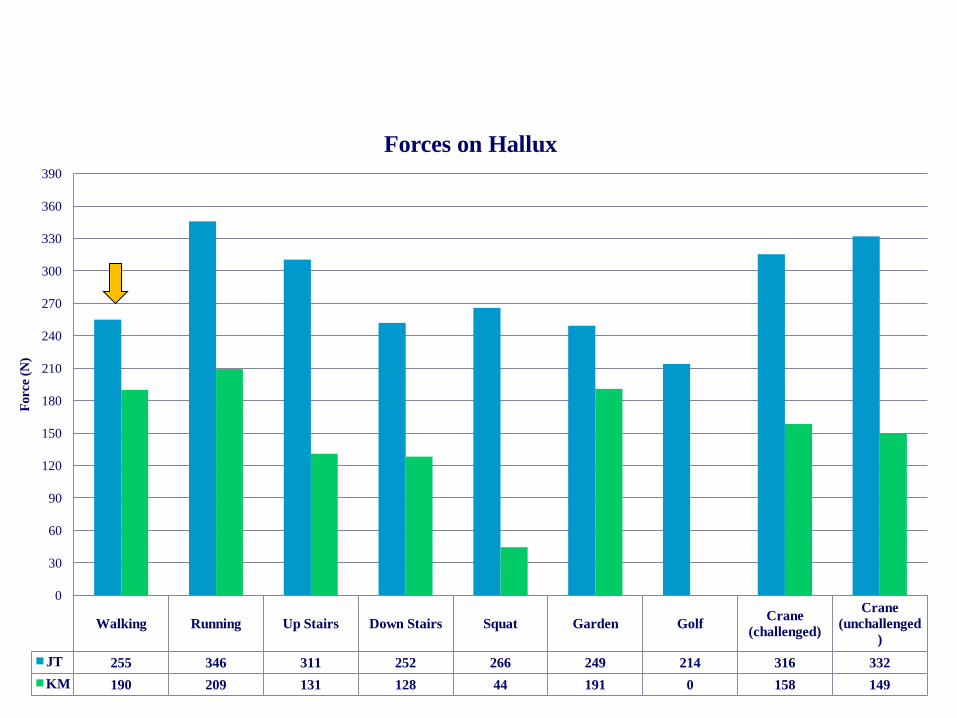
Walking Running Up Stairs Down Stairs Squat Garden GolfCrane
(challenged)
Crane
(unchallenged
)
JT 255 346 311 252 266 249 214 316 332
KM 190 209 131 128 44 191 0 158 149
0
30
60
90
120
150
180
210
240
270
300
330
360
390
Force (
N)
Forces on Hallux
1st MTP Joint Osteoarthritis
• Affects 35-60% of population over 65 years of age
• Degenerative changes
– Loss of articular cartilage
– Joint space narrowing
– Osteophyte formation
Van Saase 1989, Shereff and Baumhauer 1998, Couglin 2003
Hallux Rigidus
• Painful and insidious condition
• Affects 1 in 45 people over
the age of 50
– 2nd most common disorder
of the 1st MTP joint
– Women 60-70% of cases
– Bilateral 50% -80%
Shereff and Baumhauer 1998, Canesco et al., 2008,Zammit et al., 2009
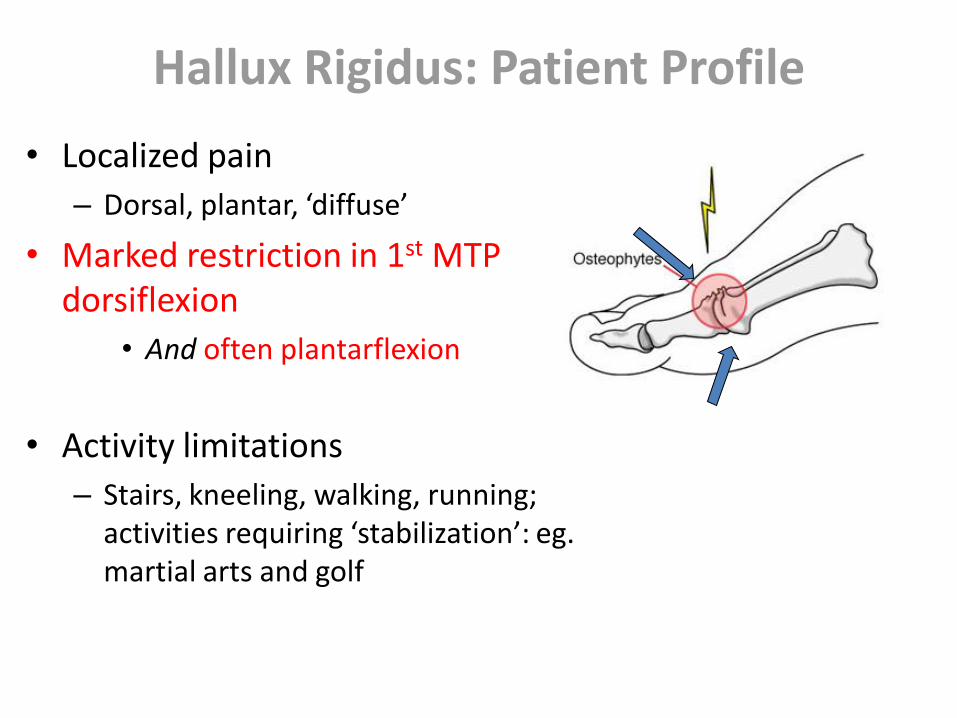
Hallux Rigidus: Patient Profile
• Localized pain
– Dorsal, plantar, ‘diffuse’
• Marked restriction in 1st MTP dorsiflexion
• And often plantarflexion
• Activity limitations
– Stairs, kneeling, walking, running; activities requiring ‘stabilization’: eg. martial arts and golf
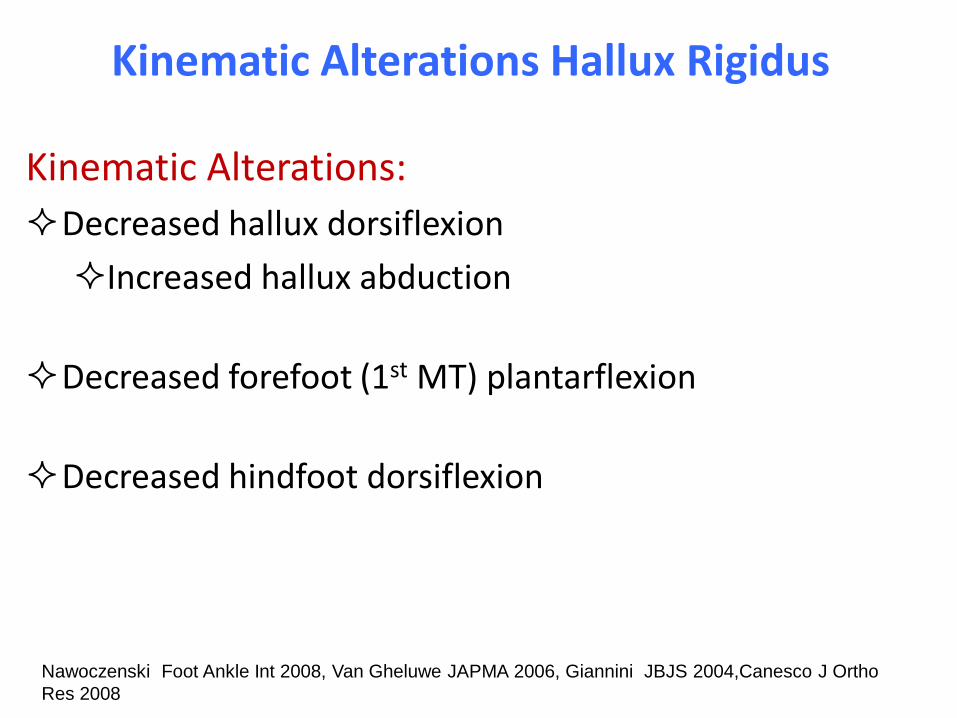
Kinematic Alterations Hallux Rigidus
Kinematic Alterations:
Decreased hallux dorsiflexion
Increased hallux abduction
Decreased forefoot (1st MT) plantarflexion
Decreased hindfoot dorsiflexion
Nawoczenski Foot Ankle Int 2008, Van Gheluwe JAPMA 2006, Giannini JBJS 2004,Canesco J Ortho
Res 2008
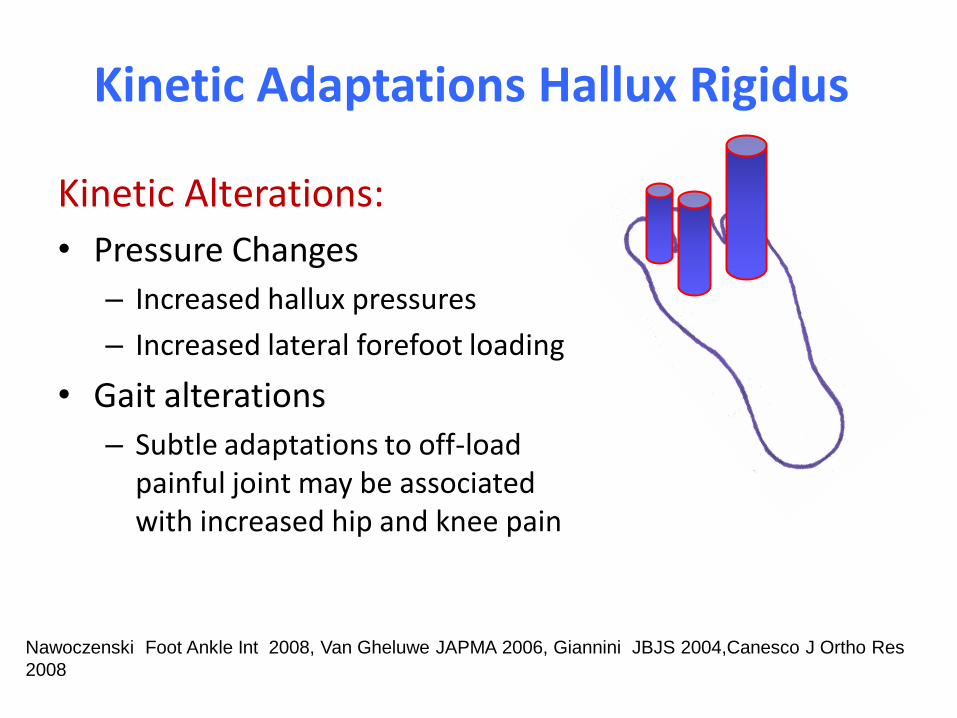
Kinetic Adaptations Hallux Rigidus
Kinetic Alterations:
• Pressure Changes
– Increased hallux pressures
– Increased lateral forefoot loading
• Gait alterations
– Subtle adaptations to off-load painful joint may be associated with increased hip and knee pain
Nawoczenski Foot Ankle Int 2008, Van Gheluwe JAPMA 2006, Giannini JBJS 2004,Canesco J Ortho Res
2008
Interventions: Operative
• Cheilectomy
• Most common surgical intervention for patients with grades I and II HR
• Goals:
• Remove osteophytes, loose bodies, and dorsal bone decrease pain
• Increase range of motion but joint mechanics not necessarily corrected
Surgical Outcomes
• Pain reduction1,2
• Activity limitations persist
– Not impressive changes in range of motion
• Equivocal as to whether normal kinematics and kinetics can be restored3,4
1Couglin J Bone Jt Surg 2003; 2Easley Foot Ankle Int 1999; 3Nawoczenski Foot Ankle Int
2008; 4 Shereff J Bone Jt.
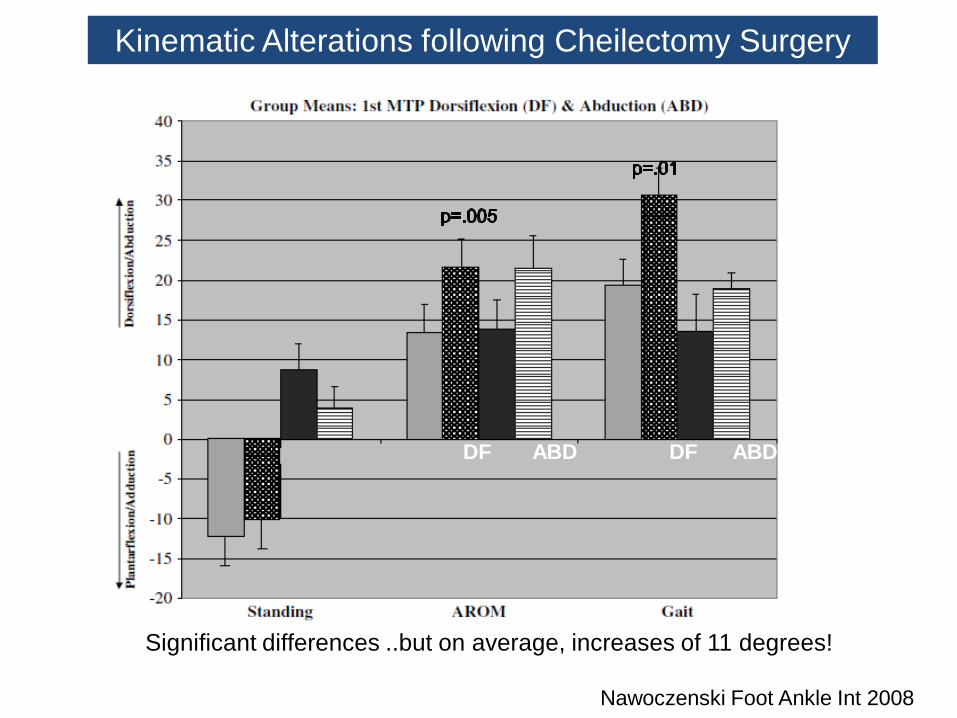
DF ABD DF ABD
Kinematic Alterations following Cheilectomy Surgery
Significant differences ..but on average, increases of 11 degrees!
Nawoczenski Foot Ankle Int 2008
Interventions: Non Operative
First line of intervention• Goals:
Reduce pain and local inflammation
Improve function
Intuitively….Prevent further trauma to joint by minimizing
dorsiflexion and decrease loading on the MTP joint
Non Operative Interventions
• Rest, activity modifications
• Protection from excessive dorsiflexion
• Footwear modifications
Stiff and/or rigid sole designs
Non Operative Management
Foot Orthoses Commonly prescribed
Little objective evidence to guide prescription for patients with HR!
Morton’s Extension Inserts
• Characteristic rigid extension of the footplate beneath the great toe
– ‘over the counter’
– incorporated into custom designs
• purportedly reduces pain and inflammation by decreasing motion and plantar loading patterns.
Is this true?
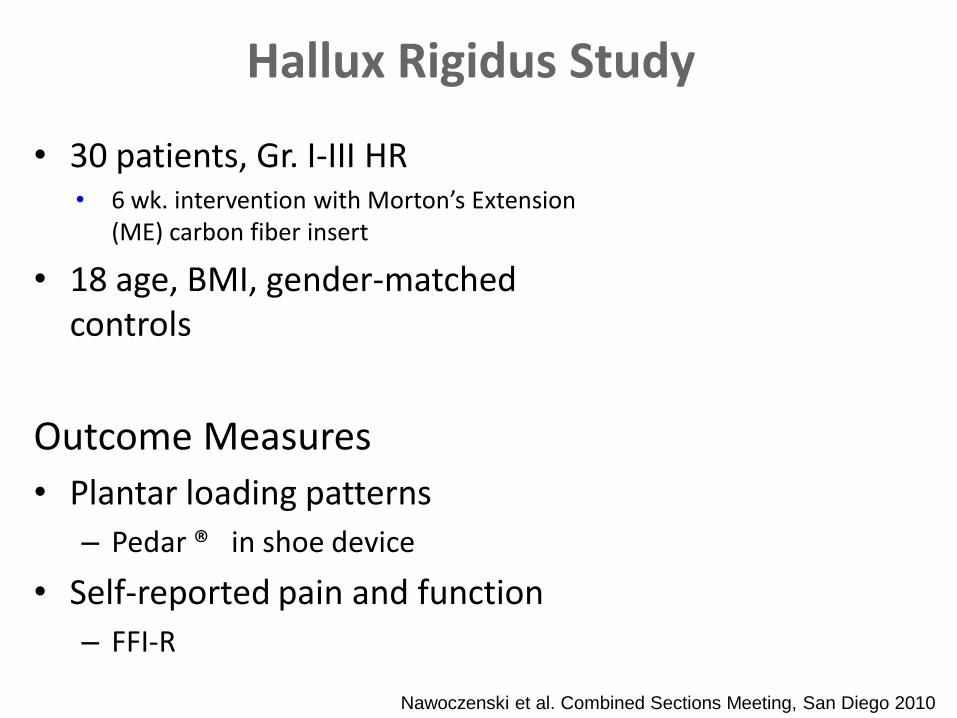
Hallux Rigidus Study
• 30 patients, Gr. I-III HR• 6 wk. intervention with Morton’s Extension
(ME) carbon fiber insert
• 18 age, BMI, gender-matched controls
Outcome Measures
• Plantar loading patterns
– Pedar ® in shoe device
• Self-reported pain and function
– FFI-R
Nawoczenski et al. Combined Sections Meeting, San Diego 2010
Hallux Rigidus Study
Outcome Measures
• Kinematic Alterations
– 1st MTP joint, 1st metatarsal, rearfoot
– Flock of Birds magnetic tracking device (Motion Monitor)
Nawoczenski et al. Combined Sections Meeting, San Diego 2010
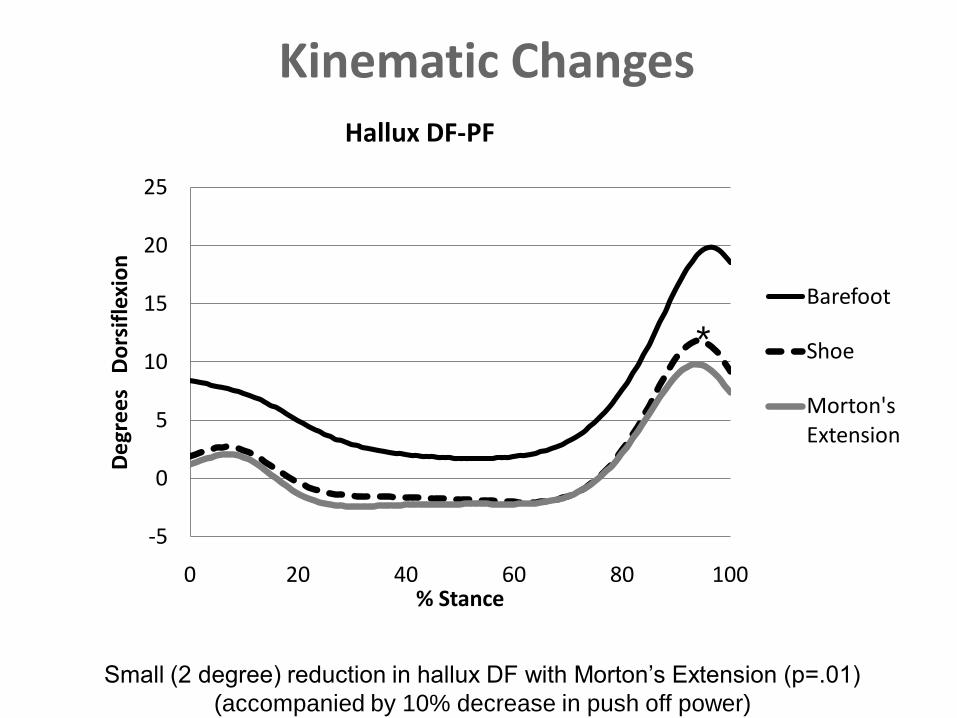
Kinematic Changes
-5
0
5
10
15
20
25
0 20 40 60 80 100
De
gre
es
Do
rsif
lexi
on
% Stance
Hallux DF-PF
Barefoot
Shoe
Morton's Extension
Small (2 degree) reduction in hallux DF with Morton‟s Extension (p=.01)
(accompanied by 10% decrease in push off power)
*
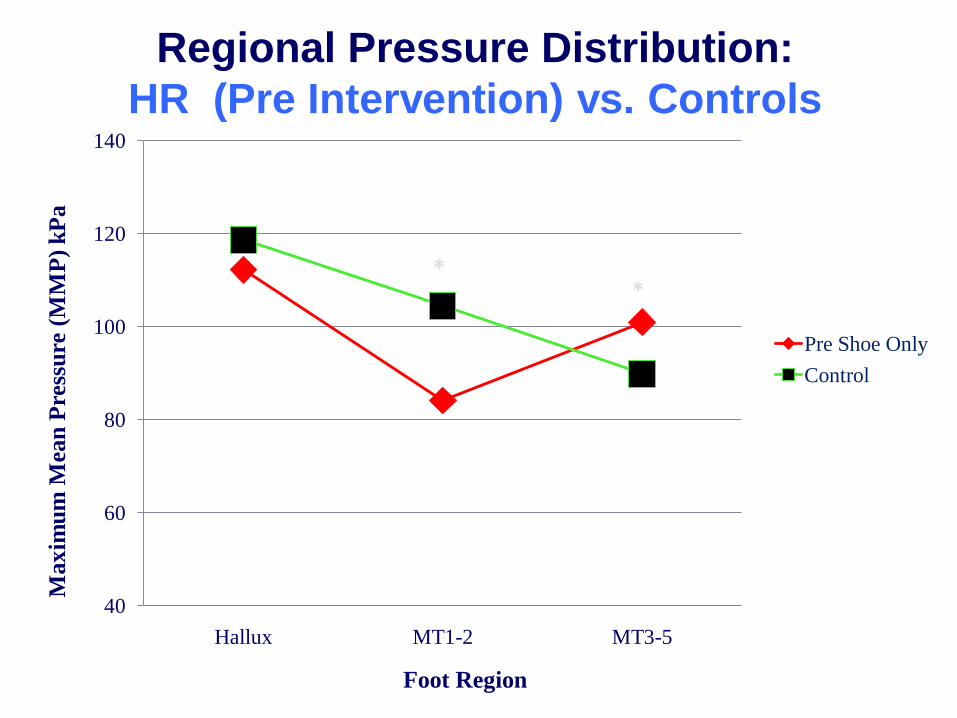
40
60
80
100
120
140
Hallux MT1-2 MT3-5
Max
imu
m M
ean
Pre
ssu
re (
MM
P)
kP
a
Foot Region
Pre Shoe Only
Control
Regional Pressure Distribution:
HR (Pre Intervention) vs. Controls
**
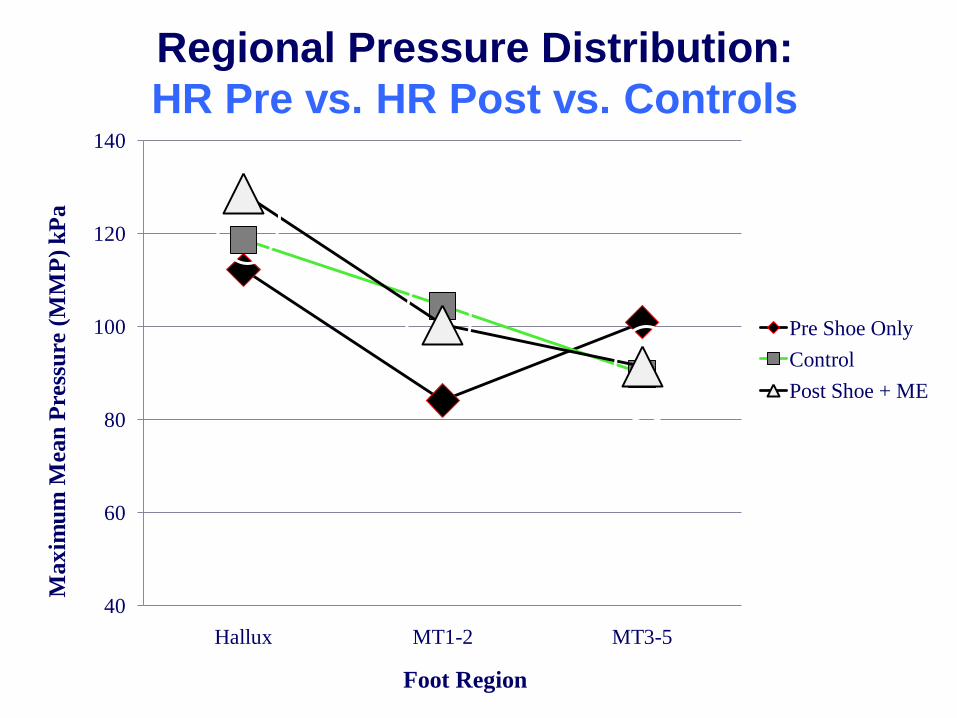
40
60
80
100
120
140
Hallux MT1-2 MT3-5
Max
imu
m M
ean
Pre
ssu
re (
MM
P)
kP
a
Foot Region
Pre Shoe Only
Control
Post Shoe + ME
Regional Pressure Distribution:
HR Pre vs. HR Post vs. Controls
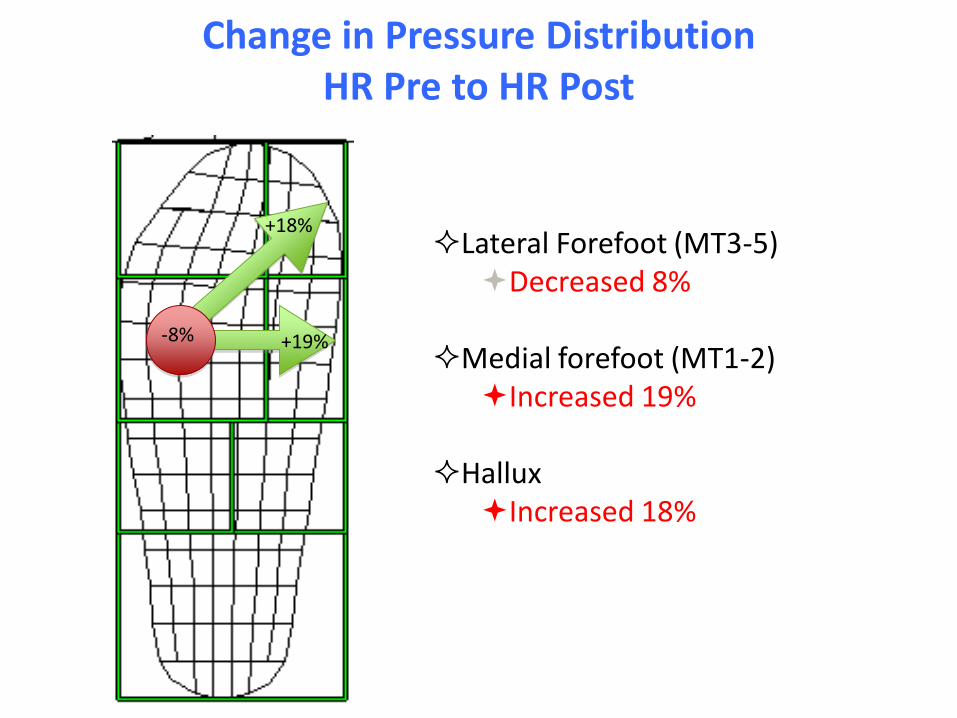
Change in Pressure Distribution HR Pre to HR Post
+19%
+18%
-8%
Lateral Forefoot (MT3-5)Decreased 8%
Medial forefoot (MT1-2)Increased 19%
HalluxIncreased 18%
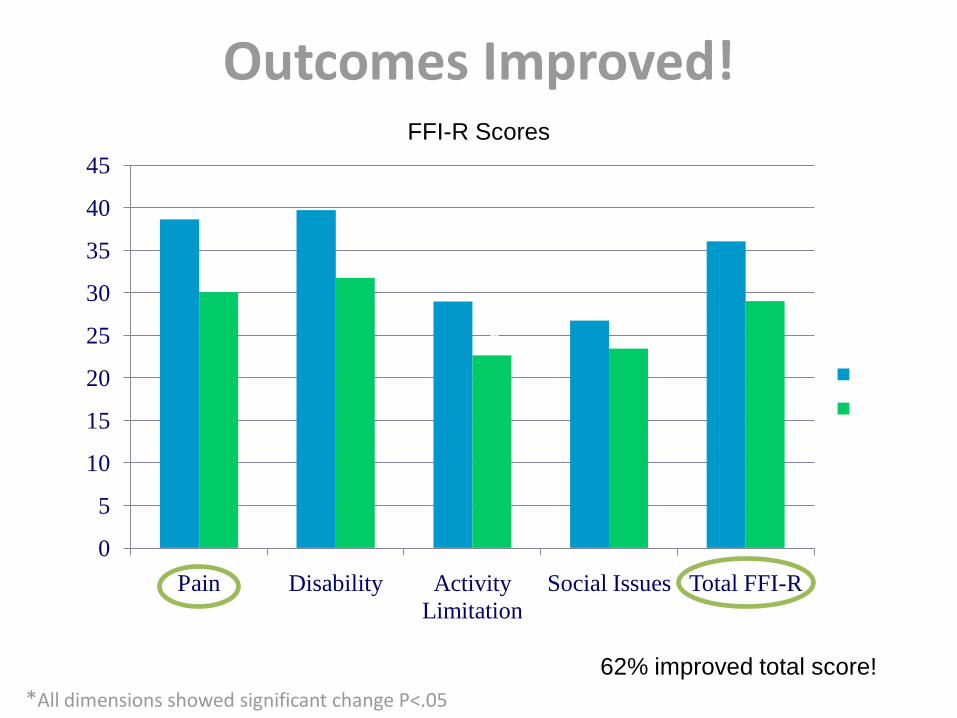
Outcomes Improved!
*All dimensions showed significant change P<.05
0
5
10
15
20
25
30
35
40
45
Pain Disability Activity
Limitation
Social Issues Total FFI-R
Pre
Post
* *
* *
*
62% improved total score!
FFI-R Scores
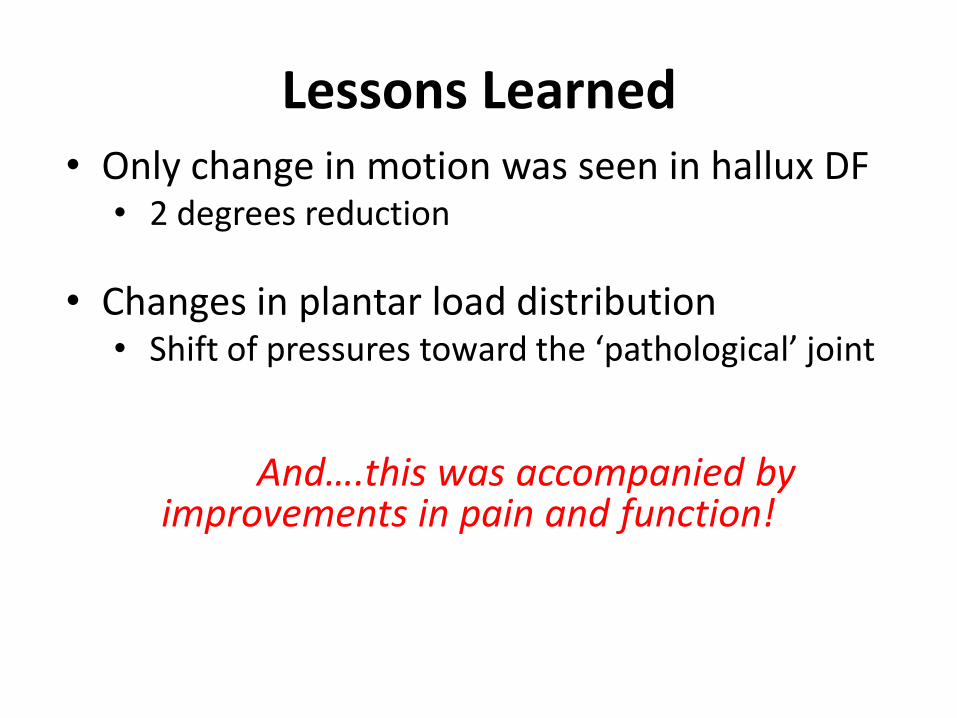
Lessons Learned• Only change in motion was seen in hallux DF
• 2 degrees reduction
• Changes in plantar load distribution• Shift of pressures toward the ‘pathological’ joint
And….this was accompanied by improvements in pain and function!
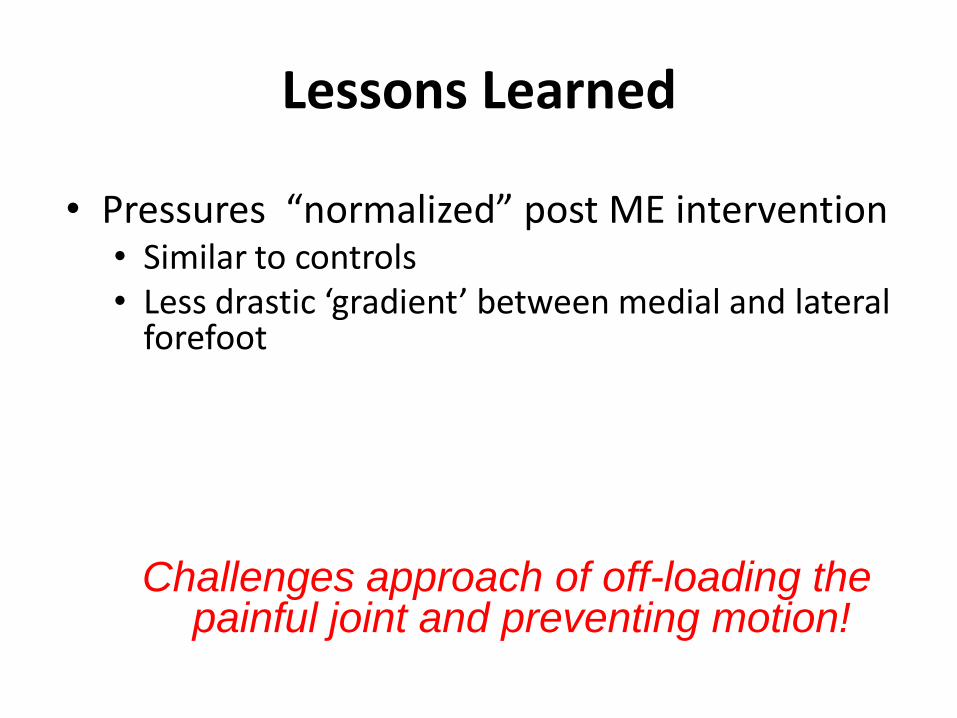
Lessons Learned
• Pressures “normalized” post ME intervention• Similar to controls• Less drastic ‘gradient’ between medial and lateral
forefoot
Challenges approach of off-loading the painful joint and preventing motion!
Lessons Learned
• May be alternative to surgery or extend function until surgery is indicated
• Inexpensive over-the-counter intervention
– Viable alternative to other conservative treatments
Limitations and Concerns
Short term follow up: 6 weeks
Long term effects of increasing pressure medially unknown
Acknowledgements
This project is supported in part by the American Orthopaedic Foot and Ankle Society
Special thanks to Josh Tome, Research Engineer, Judy Baumhauer, MD, and Kristin Morris DPT
CLINICAL AND LABORATORY EVIDENCE:LESSONS FROM PATIENTS WITH MIDFOOT ARTHRITIS
Smita Rao, PT, PhD
Assistant Professor
Department of Physical Therapy
New York University
Background
• Arthritis: One of the leading causes of disability
(CDC, 2007)
• Midfoot Arthritis: High potential for chronic
secondary disability
Incidence and Prevalence
• Midfoot Injuries– Alarming increase in incidence secondary to motor vehicle
trauma.
(Smith et al. 2005 )
– As many as 20% are missed or misdiagnosed.
(Goossens and De Stoop 1983 )
Background
• Surgical Management:
Challenging!Complex anatomy and functionDecreased pain Only modest improvements in function
(Teng and Pinzur, 2002)
• Complications following surgery – Non-union, broken screws and wound problems
– May necessitate further surgery involving revision, arthrodesis, hardware removal
.
Non-operative Management
• Primary aim of
treatment
– Provide pain relief
– Often attempted using shoe inserts.
• Custom-molded three-
quarter insert (3Q)
– Most common recommendation
• Patients continue to
report pain.
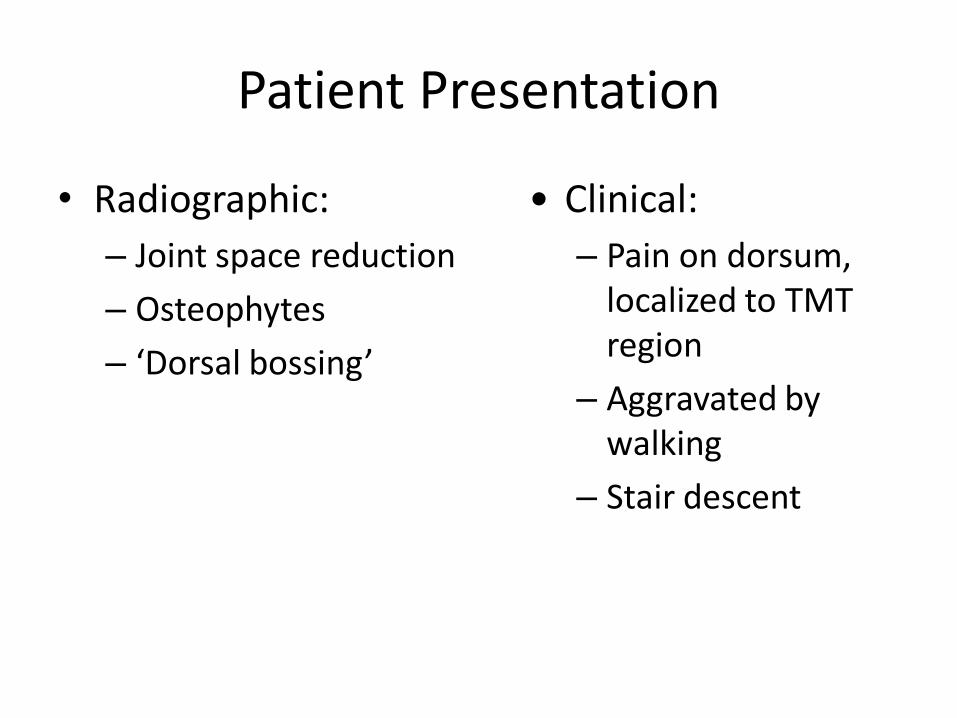
Patient Presentation
• Radiographic:
– Joint space reduction
– Osteophytes
– ‘Dorsal bossing’
• Clinical:
– Pain on dorsum, localized to TMT region
– Aggravated by walking
– Stair descent
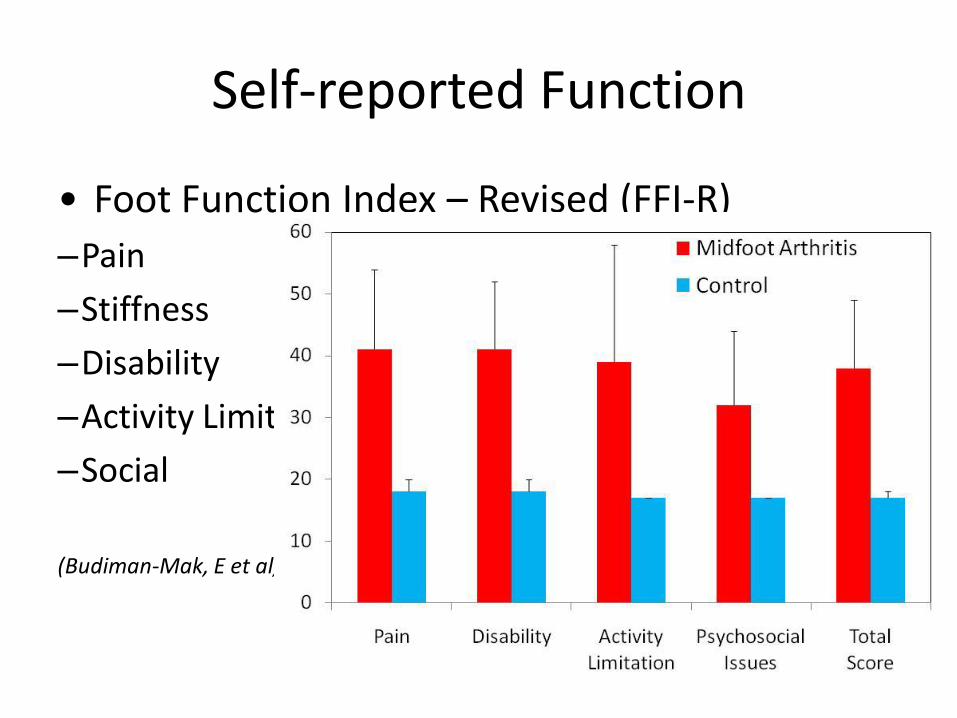
Self-reported Function
• Foot Function Index – Revised (FFI-R)
–Pain
–Stiffness
–Disability
–Activity Limitation
–Social
(Budiman-Mak, E et al, 2006)
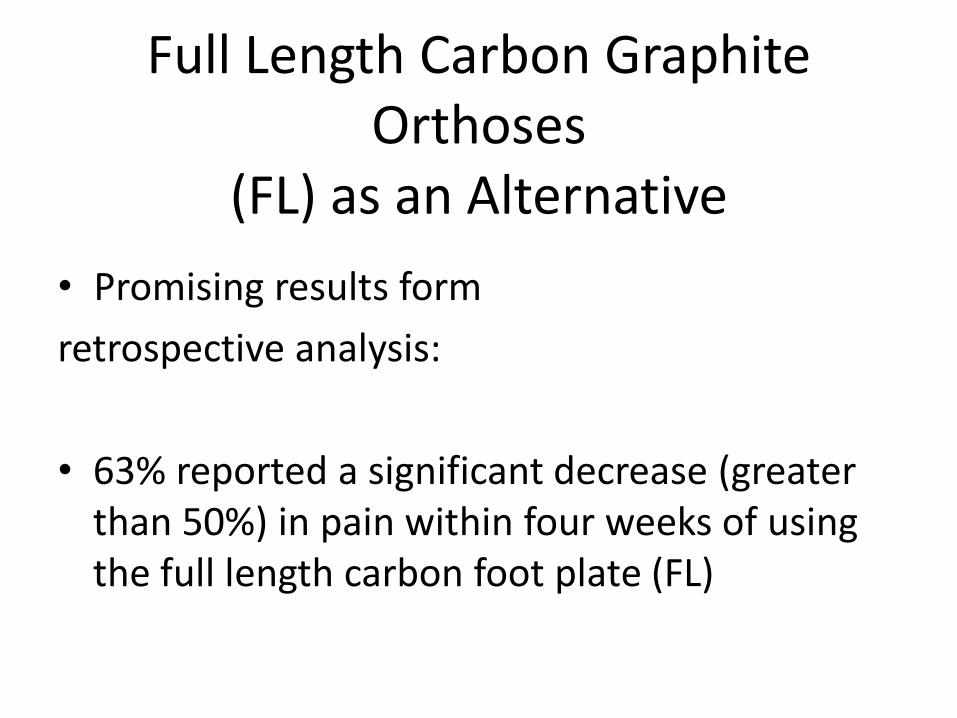
Full Length Carbon Graphite Orthoses
(FL) as an Alternative
• Promising results form
retrospective analysis:
• 63% reported a significant decrease (greater than 50%) in pain within four weeks of using the full length carbon foot plate (FL)
Outcomes
• Clinical Outcome Measures:
– FFI-R
– VAS
• Lab / Biomechanical Outcome Measures:
– Kinematics
– Plantar loading
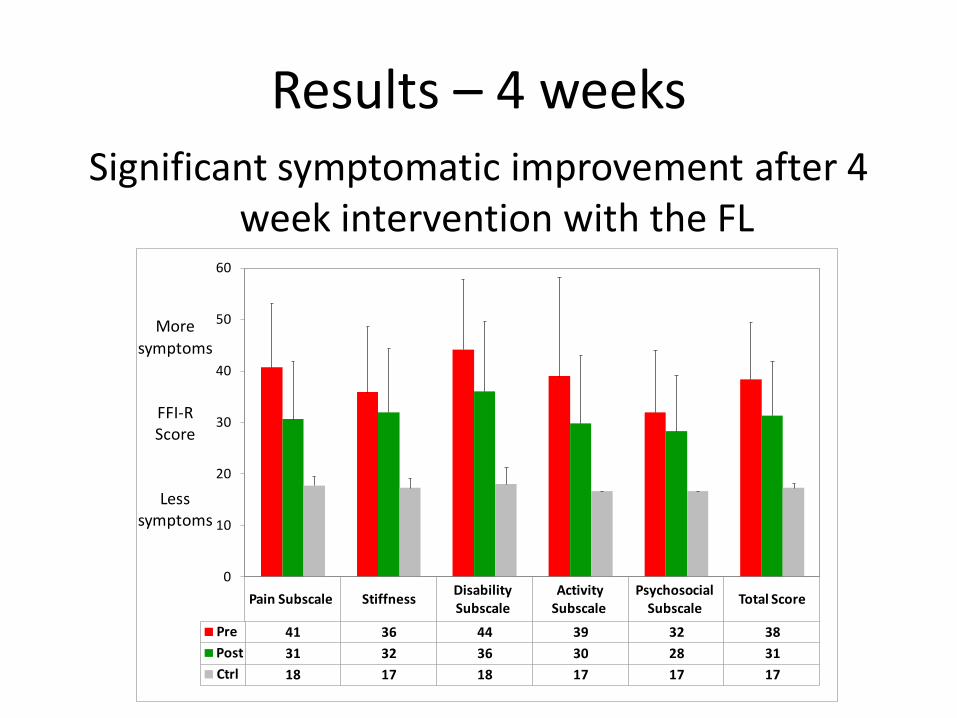
Results – 4 weeksSignificant symptomatic improvement after 4
week intervention with the FL
Pain Subscale StiffnessDisability Subscale
Activity Subscale
Psychosocial Subscale
Total Score
Pre 41 36 44 39 32 38
Post 31 32 36 30 28 31
Ctrl 18 17 18 17 17 17
0
10
20
30
40
50
60
More
symptoms
FFI-R Score
Less symptoms
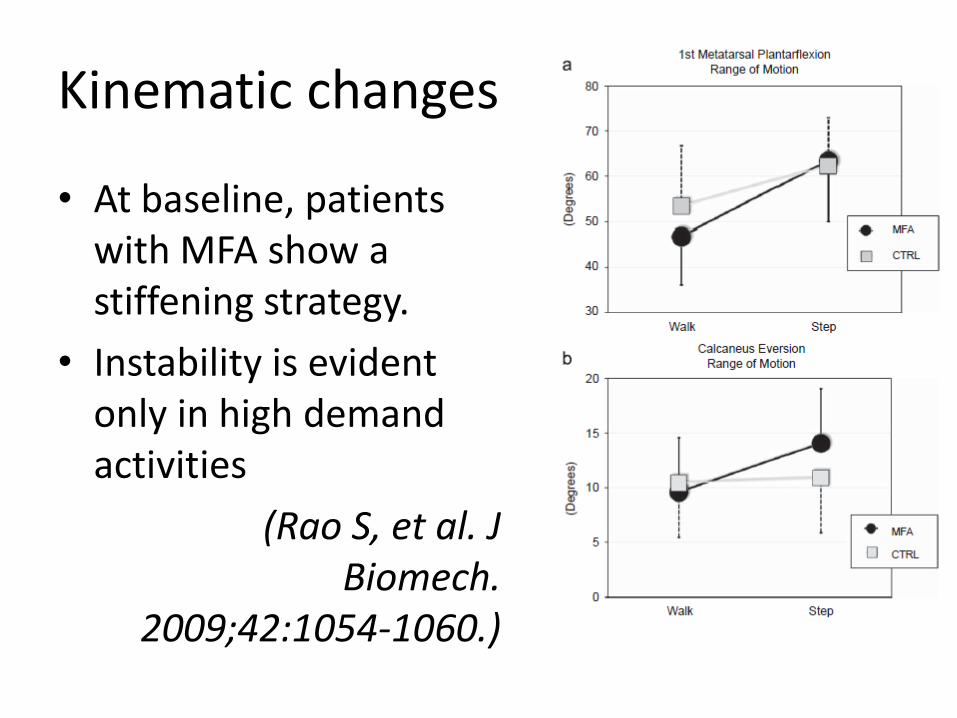
Kinematic changes
• At baseline, patients with MFA show a stiffening strategy.
• Instability is evident only in high demand activities
(Rao S, et al. J Biomech.
2009;42:1054-1060.)
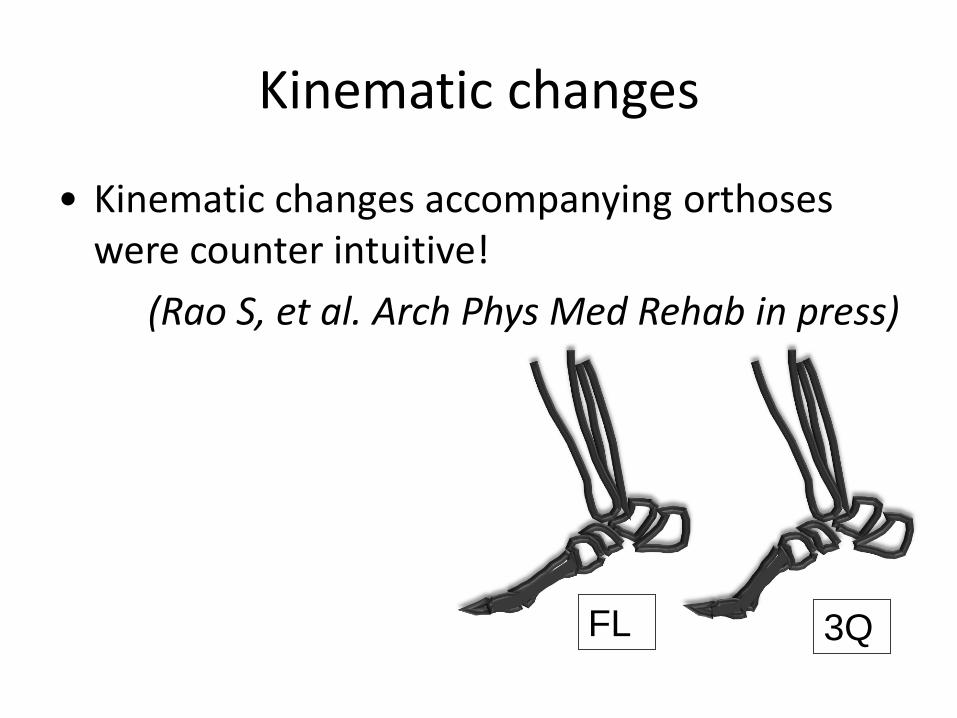
Kinematic changes
• Kinematic changes accompanying orthoses were counter intuitive!
(Rao S, et al. Arch Phys Med Rehab in press)
FL 3Q
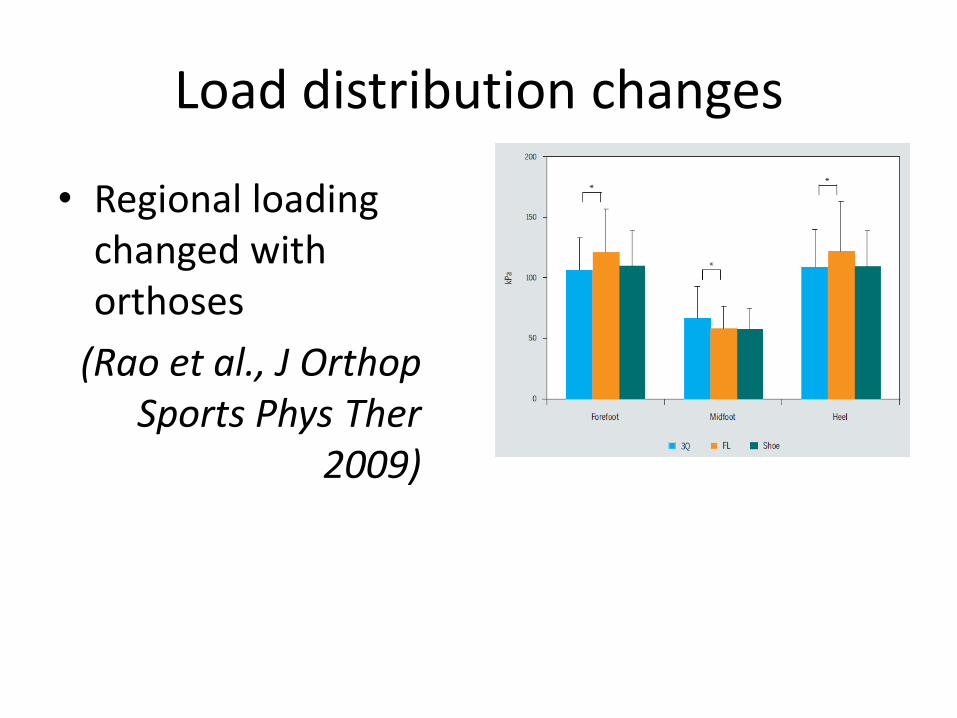
Load distribution changes
• Regional loading changed with orthoses
(Rao et al., J OrthopSports Phys Ther
2009)
Lessons learned
• Disconnect between foot pathology and function – low arched foot structure may be non-specific clinical finding
– INSTABILITY is a subtle but potentially important impairment in patients with early arthritis
• Orthoses may work by effecting load distribution (big effect size) and altering motion (small effect size)
Limitations and Caveats
• Larger sample sizes, longer term follow-up and clinical trial design indicated
• Homogenous sample = interesting, in and of itself, but may not be generalizeable to men (different BMI range) and activity demands.
Acknowledgements
AOFAS Research Grant
Arthritis Foundation
Josh Tome, engineer extraordinaire!
CLINICAL AND LABORATORY EVIDENCE:LESSONS FROM PATIENTS WITH POSTERIOR TIBIAL TENDON DYSFUNCTION
Christopher Neville PT, PhDUpstate Medical UniversityDepartment of Physical Therapy EducationInstitute for Human Performance – Motion Analysis Laboratory
• Who gets this problem?
– Recent prevalence data: 3.3% of women over 40 (~2.3 million cases in US)
• All experienced pain, experienced loss of function, and had evidence of foot deformity but all were undiagnosed
– ~80% of published samples are women
Kohls-Gatzoulis, J. 2009
What is the treatment?
• Surgical• Extensive attention on numerous surgical options
• Orthoses
– Numerous devices and styles available – no head-to-head comparisons.
• Biomechanical improvement in foot kinematics with UCBL
• 18 of 20 subjects (90%) demonstrated improvement in symptoms with Arizona
AFO.
Imhauser et al. 2002
Augustin et al. 2003
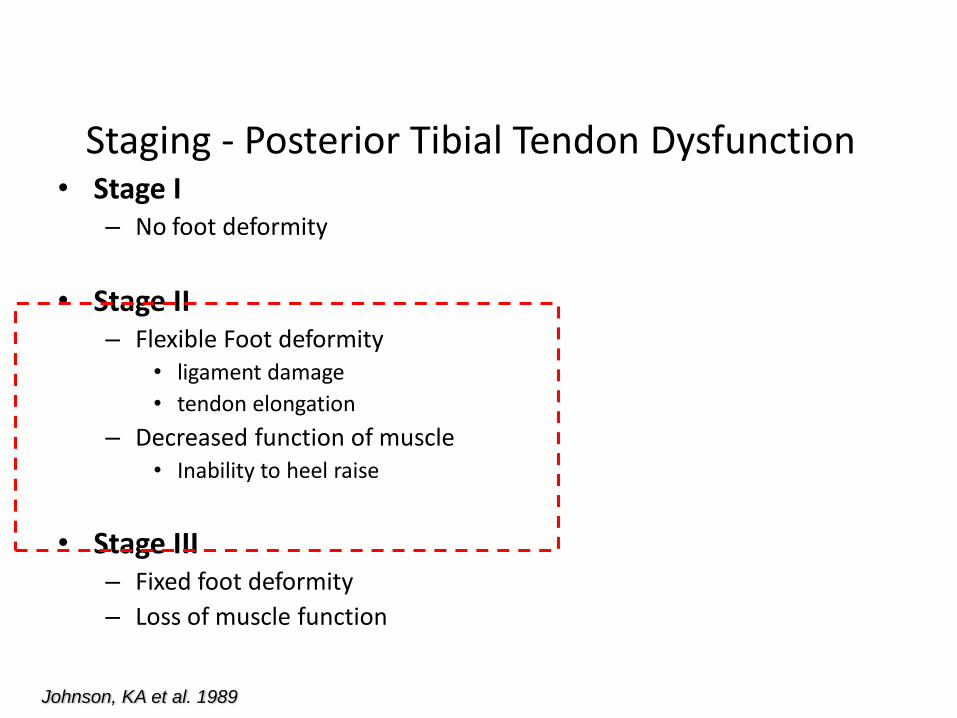
Staging - Posterior Tibial Tendon Dysfunction• Stage I
– No foot deformity
• Stage II– Flexible Foot deformity
• ligament damage
• tendon elongation
– Decreased function of muscle• Inability to heel raise
• Stage III– Fixed foot deformity
– Loss of muscle function
Johnson, KA et al. 1989
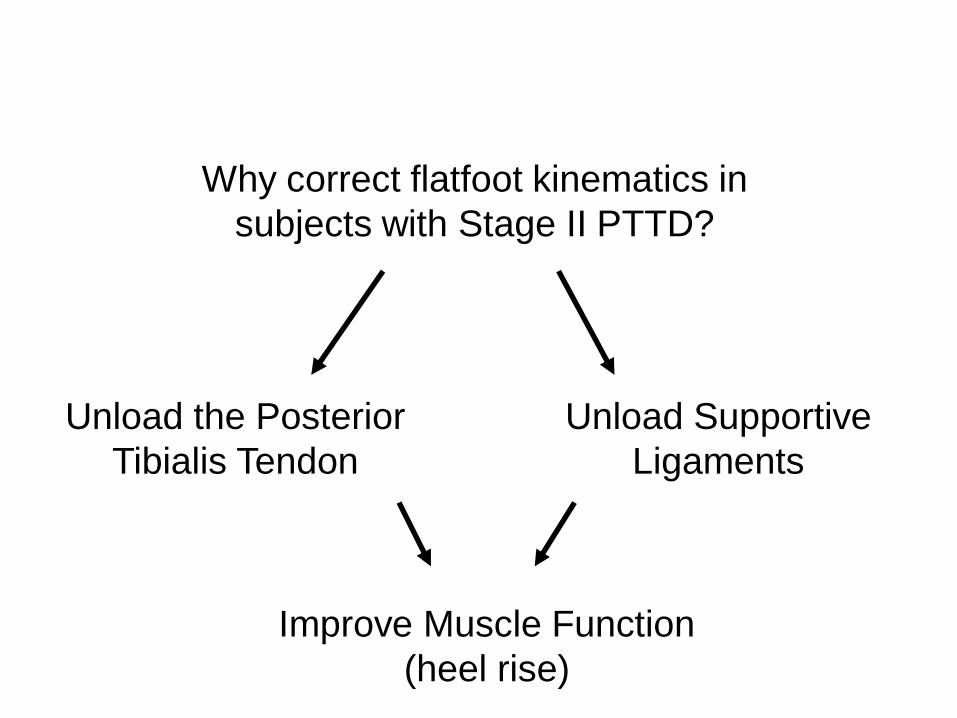
Why correct flatfoot kinematics in
subjects with Stage II PTTD?
Unload the Posterior
Tibialis Tendon
Unload Supportive
Ligaments
Improve Muscle Function
(heel rise)
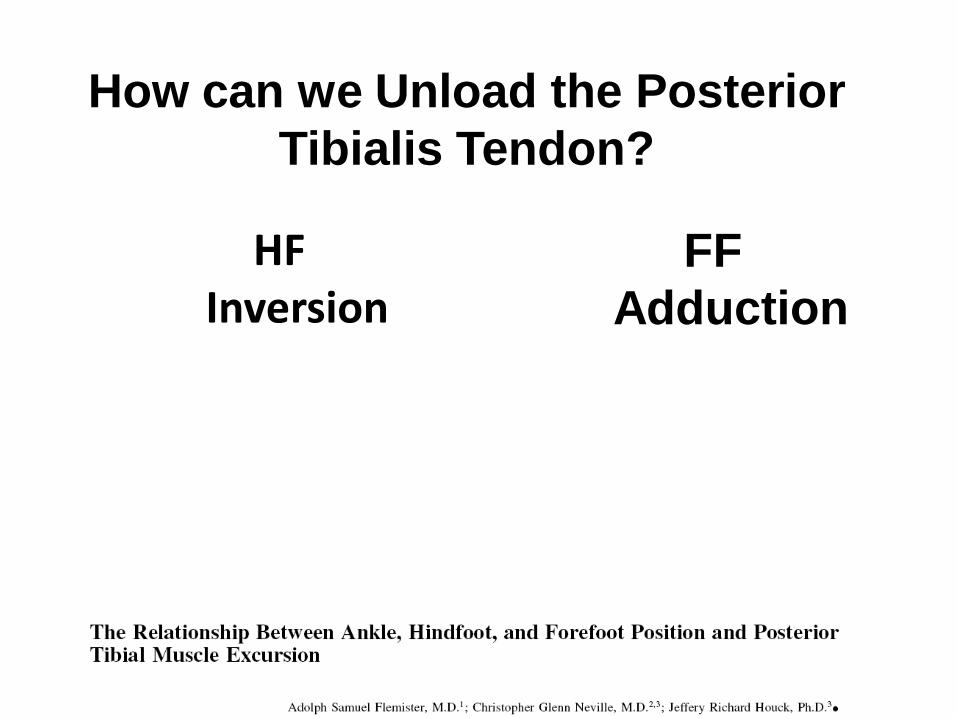
HF Inversion
FF
Adduction
How can we Unload the Posterior
Tibialis Tendon?

How can we Unload the Spring Ligament?
Sectioning of the Spring
Ligament and subsequent
plantar flexion of the talus
Jennings, M J Foot and Ankle Surgery, 2008
Raise the MLA
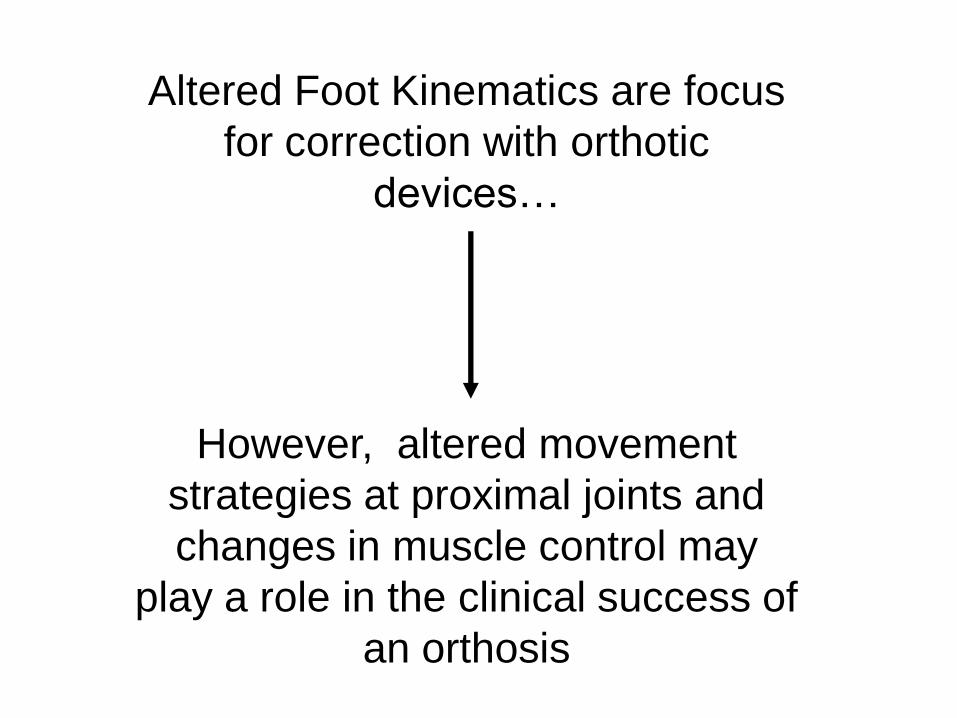
Altered Foot Kinematics are focus
for correction with orthotic
devices…
However, altered movement
strategies at proximal joints and
changes in muscle control may
play a role in the clinical success of
an orthosis
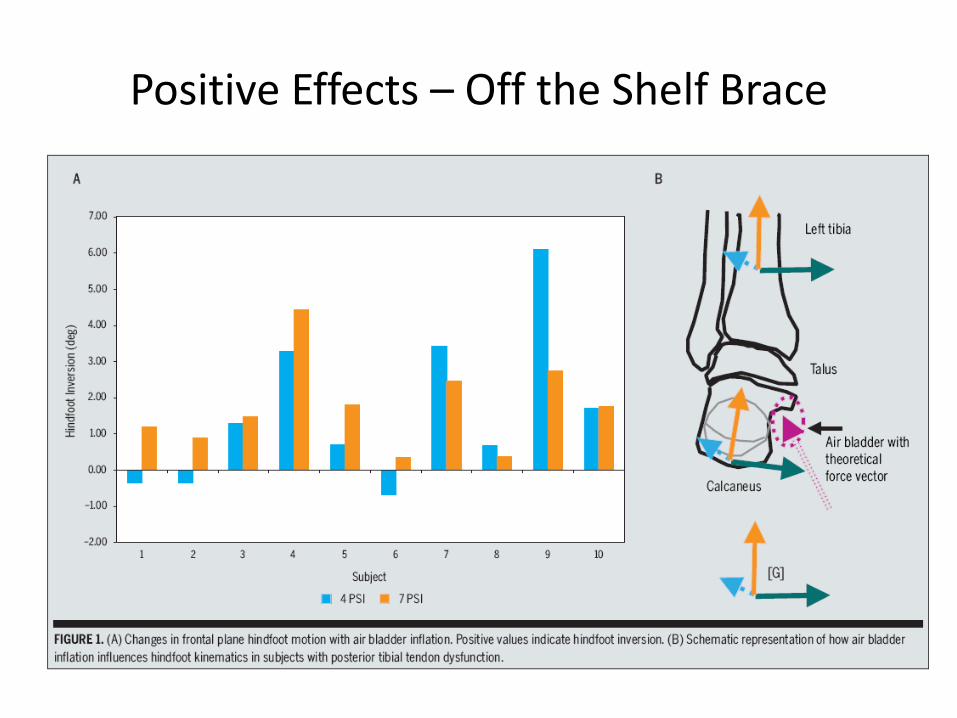
Positive Effects – Off the Shelf Brace
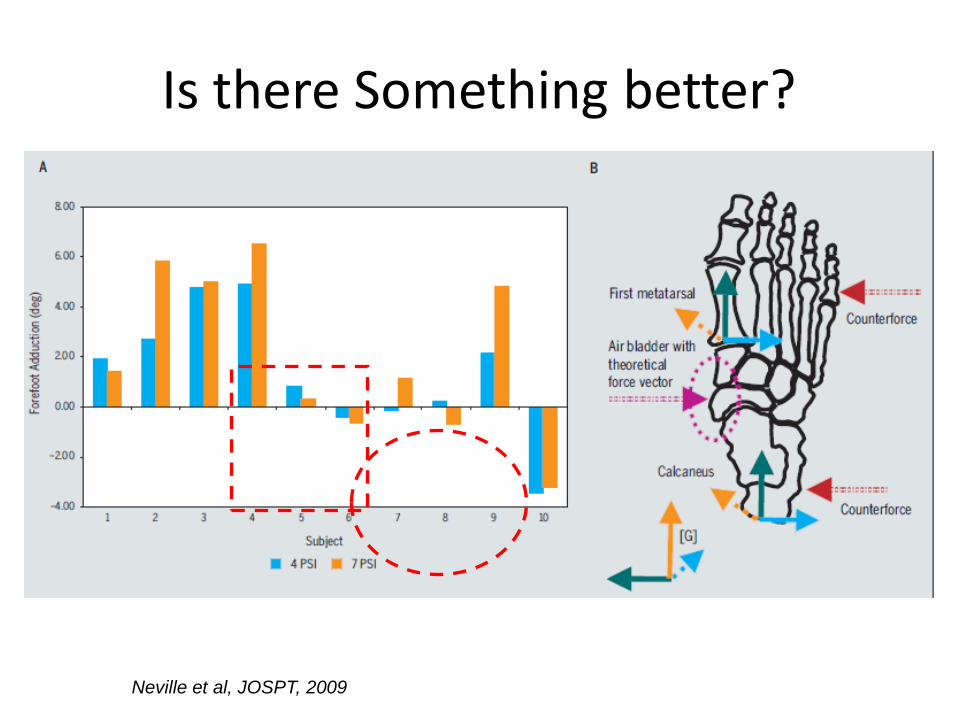
Is there Something better?
Neville et al, JOSPT, 2009
Need head-to-head comparisons of various brace designs!
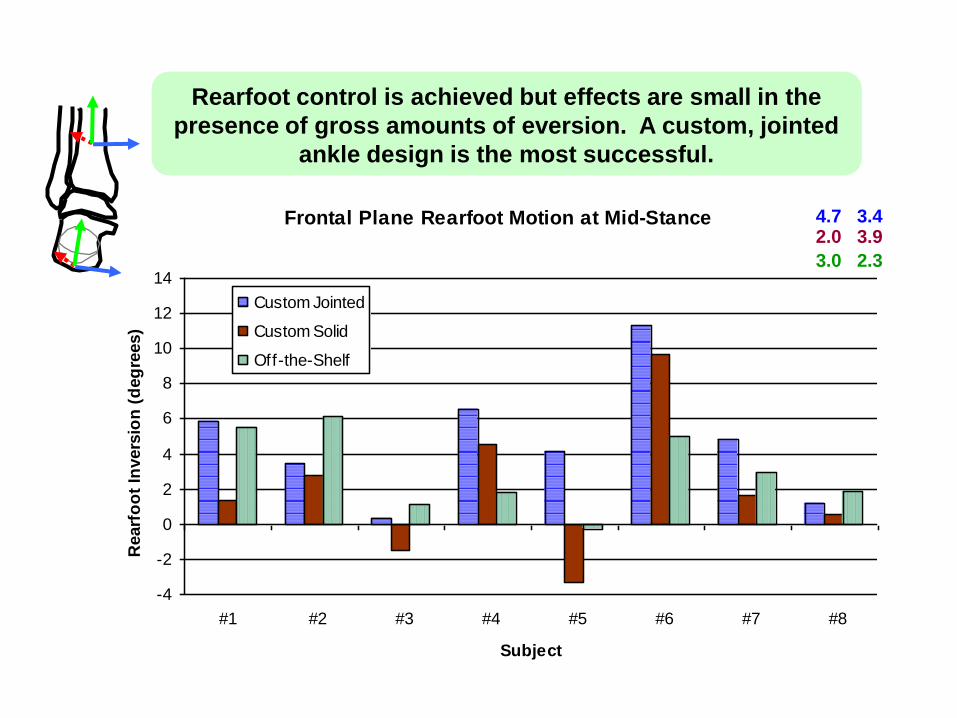
Frontal Plane Rearfoot Motion at Mid-Stance
-4
-2
0
2
4
6
8
10
12
14
#1 #2 #3 #4 #5 #6 #7 #8
Subject
Rearf
oo
t In
vers
ion
(d
eg
rees)
Custom Jointed
Custom Solid
Off-the-Shelf
4.7 3.42.0 3.9
3.0 2.3
Rearfoot control is achieved but effects are small in the
presence of gross amounts of eversion. A custom, jointed
ankle design is the most successful.
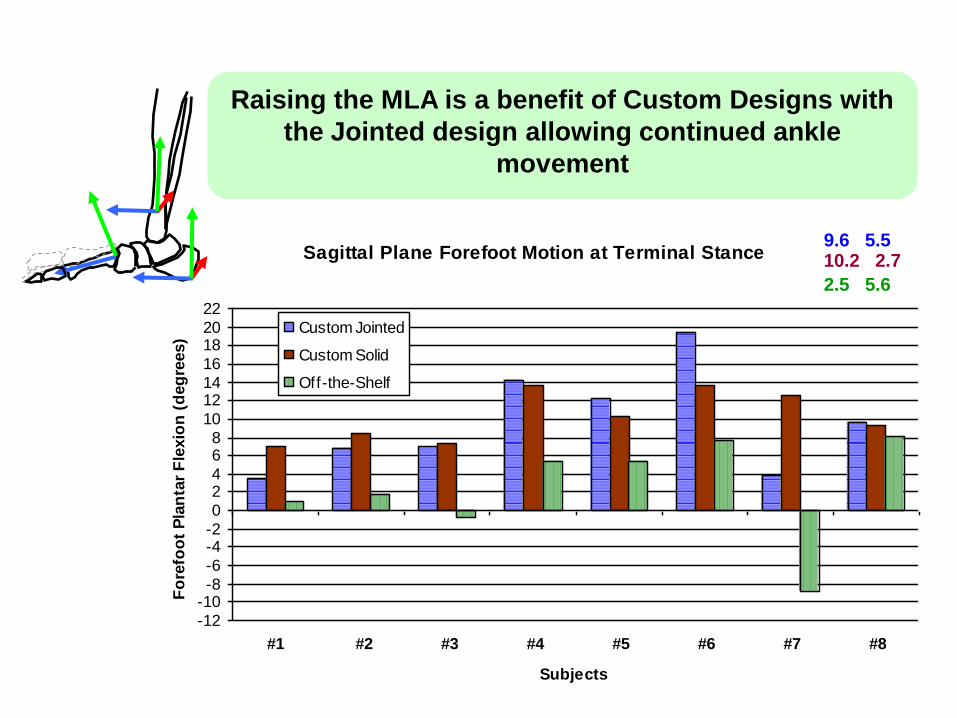
Sagittal Plane Forefoot Motion at Terminal Stance
-12
-10-8
-6
-4-2
0
24
68
10
1214
16
1820
22
#1 #2 #3 #4 #5 #6 #7 #8
Subjects
Fo
refo
ot
Pla
nta
r F
lexio
n (
deg
rees)
Custom Jointed
Custom Solid
Off-the-Shelf
9.6 5.510.2 2.7
2.5 5.6
Raising the MLA is a benefit of Custom Designs with
the Jointed design allowing continued ankle
movement
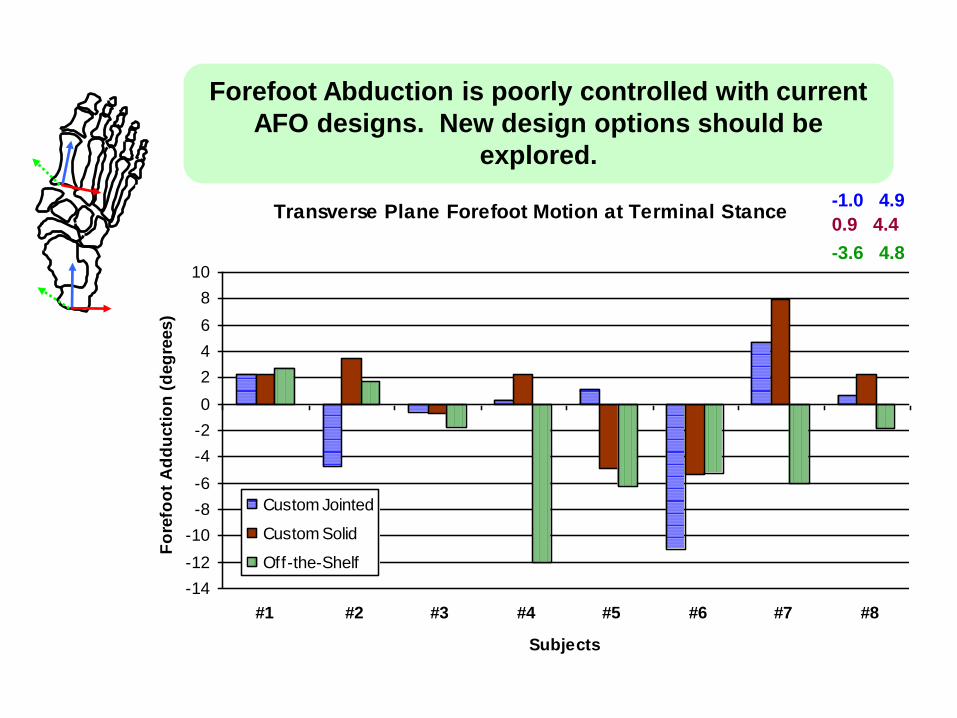
Transverse Plane Forefoot Motion at Terminal Stance
-14
-12
-10
-8
-6
-4
-2
0
2
4
6
8
10
#1 #2 #3 #4 #5 #6 #7 #8
Subjects
Fo
refo
ot
Ad
du
cti
on
(d
eg
rees)
Custom Jointed
Custom Solid
Off-the-Shelf
-1.0 4.9
0.9 4.4
-3.6 4.8
Forefoot Abduction is poorly controlled with current
AFO designs. New design options should be
explored.
Mechanisms
• Small corrections in kinematics in the presence of gross deviations….
Where are we Now?
• A jointed ankle design preserves ankle movement and may improve muscle function to control foot kinematics – HF inversion and raising the MLA.
• FF Abduction is poorly controlled!• A solid ankle design alters proximal joint
movement.
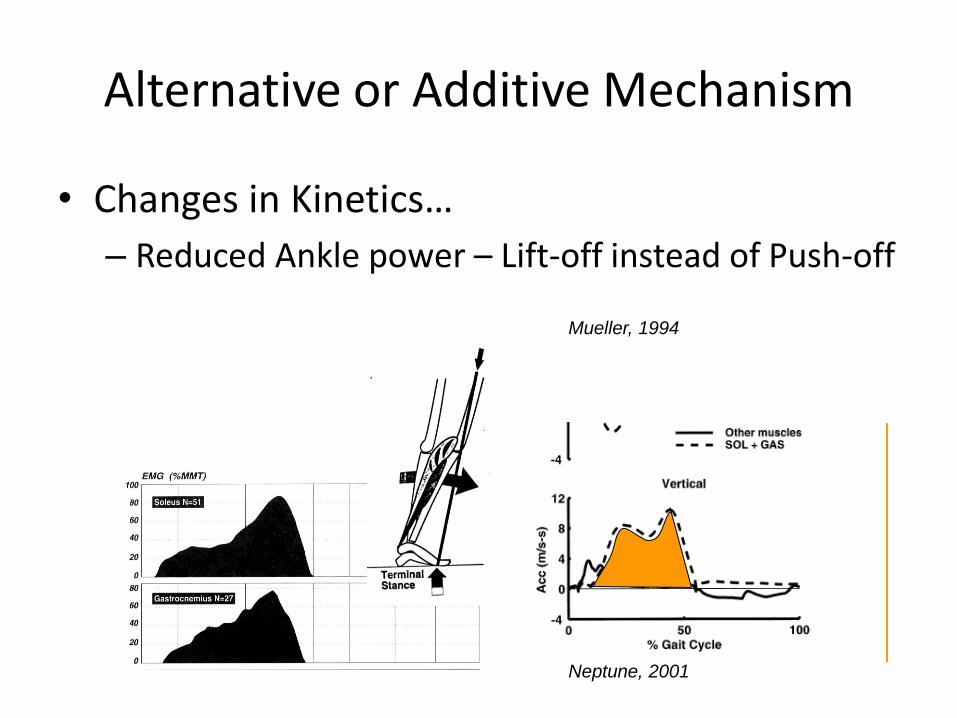
Alternative or Additive Mechanism
• Changes in Kinetics…
– Reduced Ankle power – Lift-off instead of Push-off
Neptune, 2001
Mueller, 1994
Ankle Joint Power Without Brace
-1
-0.5
0
0.5
1
1.5
0 10 20 30 40 50 60 70 80 90 100
Stance (%)
Po
wer
Gen
era
tio
n (
W/k
g)
Ankle Joint Power
-1
-0.5
0
0.5
1
1.5
0 10 20 30 40 50 60 70 80 90 100
Stance (%)
Po
wer
Gen
era
tio
n (
W/k
g)
Shoe
Custom Jointed
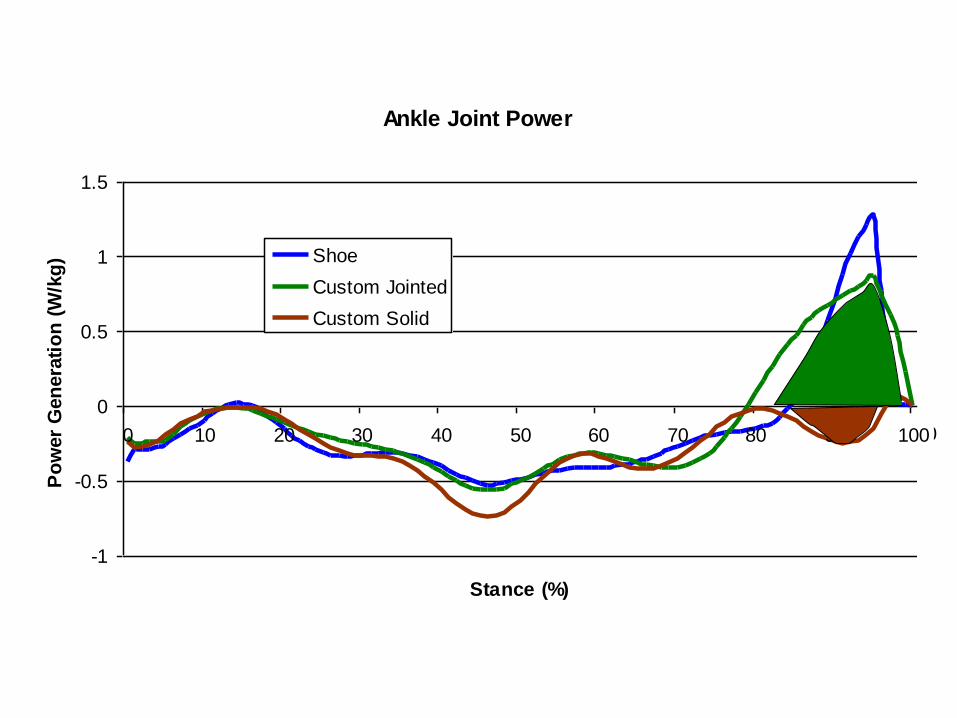
Ankle Joint Power
-1
-0.5
0
0.5
1
1.5
0 10 20 30 40 50 60 70 80 90 100
Stance (%)
Po
wer
Gen
era
tio
n (
W/k
g) Shoe
Custom Jointed
Custom Solid

• Hip Strategy
• Greater knee/ hip flexion
Mueller, et al, 1994
Lessons Learned
• Correction of foot kinematics is small in the presence of gross deviations.
• Jointed ankle designs may preserve muscle control.
• Need to improve control of forefoot abduction
• Altered movement patterns at proximal joints may also be an effect of solid ankle designs.
ESTABLISHING THE RATIONALE FOR NON-SPECIFIC FLATFOOT DEFORMITY
Deborah A. Nawoczenski PT, PhD
Ithaca College – Rochester Center
Movement Analysis Laboratory and Center for Foot and Ankle Research
Rochester, NY
Christopher Neville, PT, PhD
Upstate Medical University, Syracuse, NY
Multi-Modal Interventions
• Part I (Nawoczenski)
– Perspective
– Orthotic Effectiveness: Review of Mechanisms
– Considerations for passive and active approaches
• Part II (Neville)
– Background and Motivation for Multi-Modal Intervention
• Distal and Proximal
– Considerations for the non-specific flatfoot
Perspective: The Last Quarter Century
• The Orthotic “Boom”
– The “80s” and the running revolution
– The “Root” approach
• mechanical relationship between the subtalar joint (STJ) and the midtarsal joint
• a "criteria defining a normal foot“
• casting feet in a non-weight-bearing "STJ-neutral" position was a method of standardizing and comparing one foot to another

Perspective: The Last Quarter Century
• The Orthotic “Boom”
– Emergence of new materials for the orthotic industry.
• thermoformable plastics, acrylics, and urethanes
– Proliferation of orthotic fabrication laboratories
– Proliferation of continuing education seminars
A multi-billion dollar industry $$$
Orthotic Effectiveness
• Pain– 50-90% symptom relief
• Function• Kinematics
– Static and dynamic alignment– Movement alterations
• Small and non-systematic• Peak foot eversion, eversion velocity and total rearfoot
motion, coupling changes, dynamic arch height changes• Maximum foot inversion during 2nd part of stance
Nester 2003, Nigg 2003,, Nawoczenski 1998, Bellchamber 2000
Orthotic Effectiveness
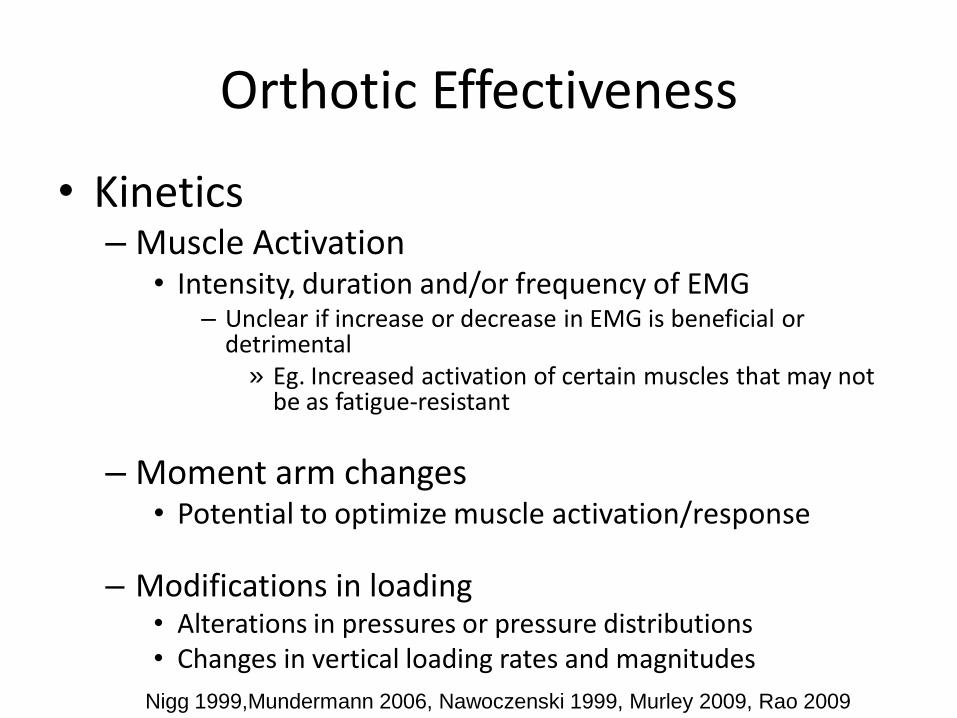
• Kinetics– Muscle Activation
• Intensity, duration and/or frequency of EMG– Unclear if increase or decrease in EMG is beneficial or
detrimental» Eg. Increased activation of certain muscles that may not
be as fatigue-resistant
– Moment arm changes• Potential to optimize muscle activation/response
– Modifications in loading• Alterations in pressures or pressure distributions• Changes in vertical loading rates and magnitudes
Nigg 1999,Mundermann 2006, Nawoczenski 1999, Murley 2009, Rao 2009
Orthotic Effectiveness
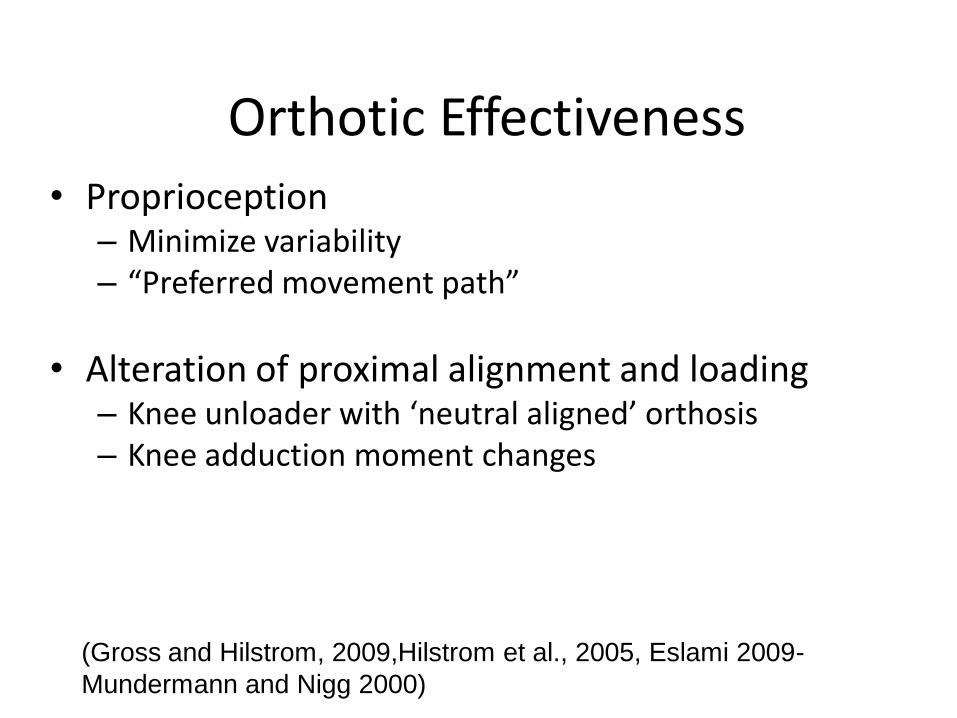
• Proprioception– Minimize variability– “Preferred movement path”
• Alteration of proximal alignment and loading– Knee unloader with ‘neutral aligned’ orthosis– Knee adduction moment changes
(Gross and Hilstrom, 2009,Hilstrom et al., 2005, Eslami 2009-
Mundermann and Nigg 2000)
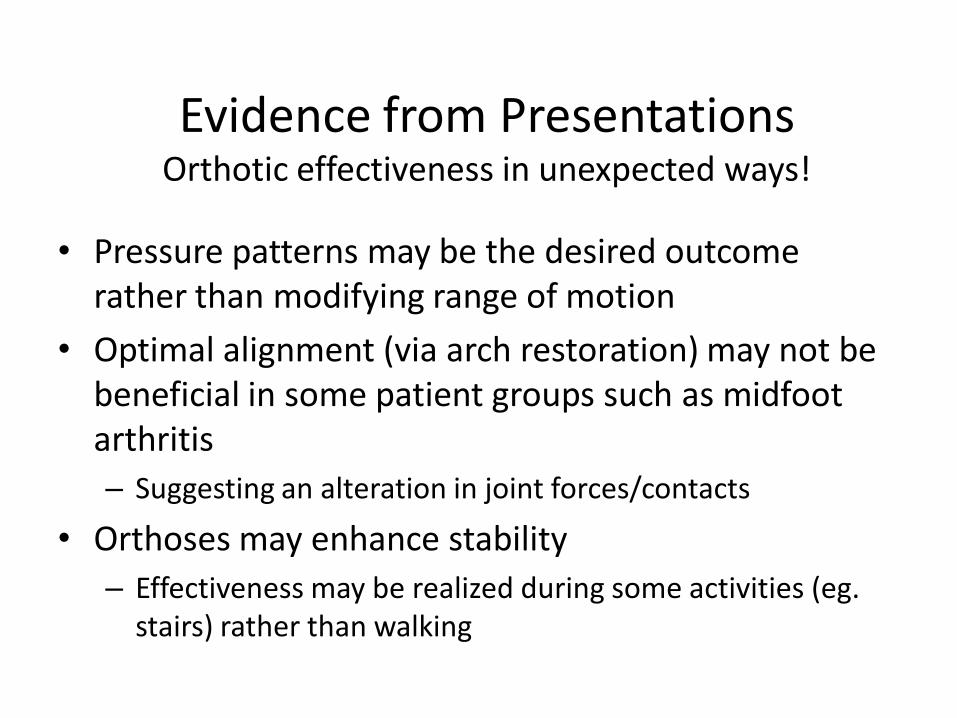
Evidence from PresentationsOrthotic effectiveness in unexpected ways!
• Pressure patterns may be the desired outcome rather than modifying range of motion
• Optimal alignment (via arch restoration) may not be beneficial in some patient groups such as midfoot arthritis
– Suggesting an alteration in joint forces/contacts
• Orthoses may enhance stability
– Effectiveness may be realized during some activities (eg. stairs) rather than walking
What is true….
• Subject specific and highly variable results
(Mundermann 2006, Murley 2009)
Do We Need Orthotics at All?Some say ‘no’!
• Using the footwear and barefoot running craze that supports nothing rigid on the foot
– Scan report and download
http://www.dailyfinance.com/story/do-running-shoes-make-us-run-the-risk-of-
injury/19309476/#
•Review injury patterns with shoes
Kerrigan 2009
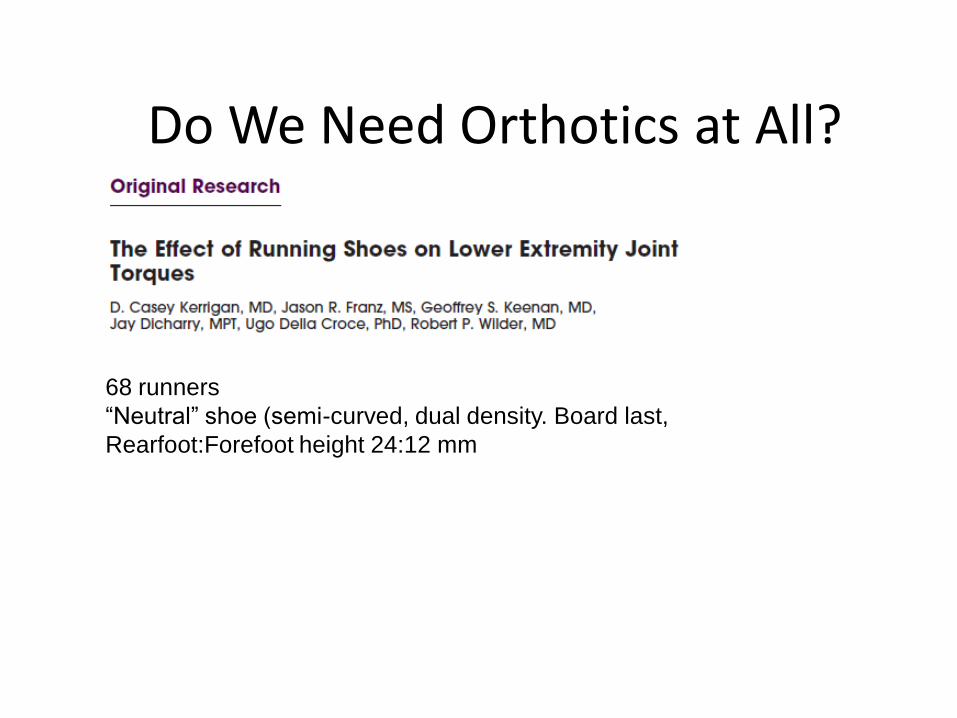
Do We Need Orthotics at All?
68 runners
“Neutral” shoe (semi-curved, dual density. Board last,
Rearfoot:Forefoot height 24:12 mm
Revisiting Clinical Management of Non Specific Flatfoot Deformity :
Is there an answer somewhere between distal and proximal control?
• Video – standing, correct hip rotation, then orthotics, stand with hip rotation again – do they improve
• Standing – sitting – can they restore the arch
– Are you working on increased plantarflexion of the 1st metatarsal.
• ‘Traditional’ approach may not be enough to prevent progression of the deformity or disease process
Is this 23 yo foot flat foot predestined to be this 56 yo foot with PTTD?
Videos and Stills of Bad Feet
Altering Foot Structure - Distal
• Correction of flatfoot deformity unloads soft tissue structures
Altering foot Structure - Proximal
• Coupling between the tibia and rearfoot
Nawoczenski, DA et al. 1998
Bellchamber et al. 2000

Hip control and rearfoot motion
• Predictors of maximum rearfoot position
– Max hip rotation
– Point in stance where peak hip internal rotation occcured
Knutzen, KM et al. 1994
Snyder, KR et al. 2009
Orthotics and Muscle Control
• Interplay between foot structure and muscle control
Nawoczenski, DA et al. 1998
Kulig, et al, 2005
Orthotics and Muscle Control
• Changes in foot structure may
– Alter muscle lines of pull
– Alter muscle’s mechanical effect by changing moment arms.
Interplay between Orthotics and Muscle Activation
• Should we strive for both alignment and muscle activation in our orthotic prescription process?
• Preserve what exists in the foot and not over-restrict motion…and focus on muscle activation and control
Other thoughts
• Are there ways to select foot types that may respond to ‘active’ intervention and improve foot function while still preserving the integrity of static structures?
– At earlier ages!!
Not just orthotic intervention – but multi-modal intervention
• Issues surrounding orthotic management
– Stress on soft tissues
– Muscle activity changing foot mechanics
• Foot and ankle muscle activation
• Activation of muscles proximal to the foot and ankle
Revisit Orthotic Intervention Strategies
Interplay between Orthotics and Muscle Activation
• Influence of orthotics in changing muscle moment arms

ROUND TABLE DISCUSSION