Embed Size (px)
Citation preview
HOW DO WE IMPROVE SCOTLAND’S CONNECTIVITY IN A GLOBAL MARKET?
Alf Baird
Head, Maritime Research Group
Napier Transport Research Institute
Globalization
• Division of labour = globalization• Ongoing relocation of manufacturing from US and
W. Europe to China• Worldwide economic growth:
• Increase in average incomes• Reduced cycle time for innovations• Decrease in unit prices of consumer goods• State-of-the-art buying behaviour• “Throw-away & buy-new” instead of repair• China boom
• Dramatic increases in global freight volumes
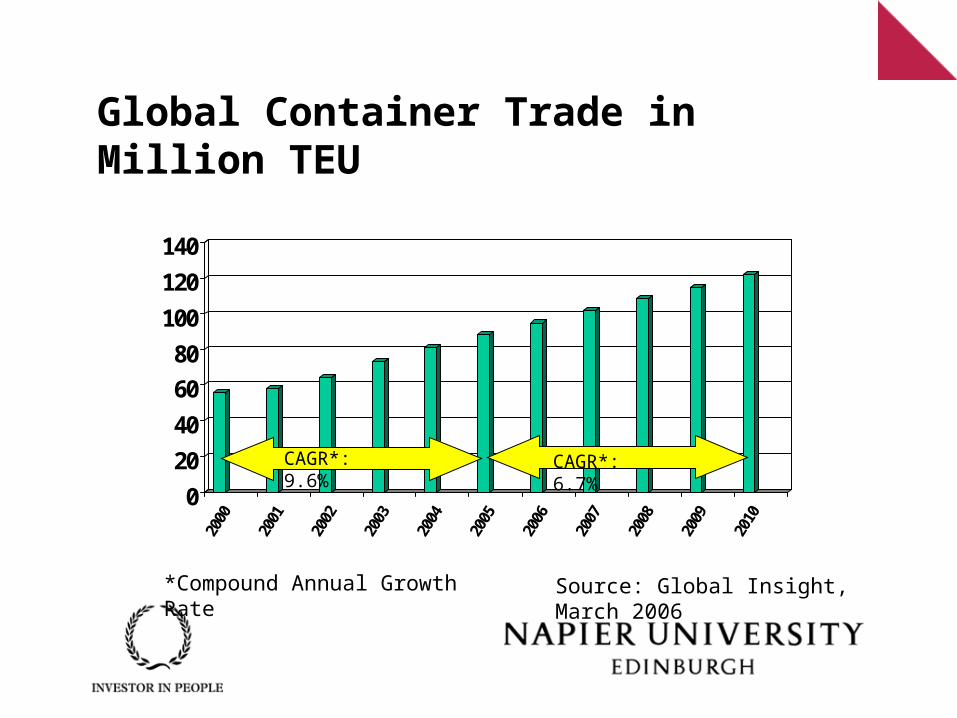
Global Container Trade in Million TEU
0
20
40
60
80
100
120
140
2000
2001
2002
2003
2004
2005
2006
2007
2008
2009
2010
*Compound Annual Growth Rate Source: Global Insight, March 2006
CAGR*: 9.6% CAGR*: 6.7%
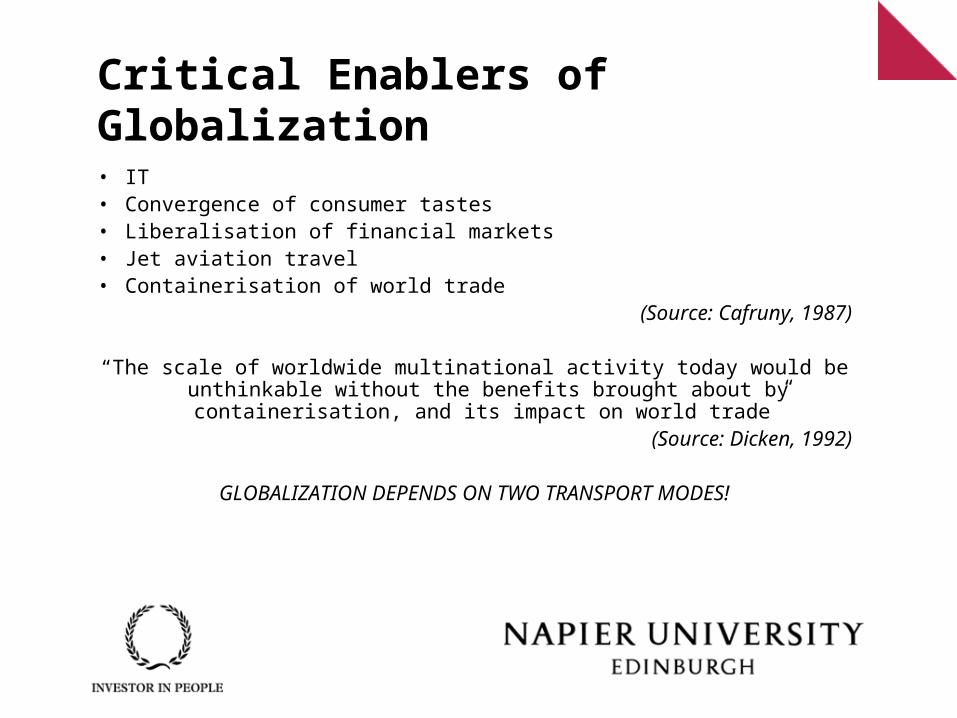
Critical Enablers of Globalization
• IT• Convergence of consumer tastes• Liberalisation of financial markets• Jet aviation travel• Containerisation of world trade
(Source: Cafruny, 1987)
“The scale of worldwide multinational activity today would be unthinkable without the benefits brought about by containerisation, and its impact on
world trade”(Source: Dicken, 1992)
GLOBALIZATION DEPENDS ON TWO TRANSPORT MODES!
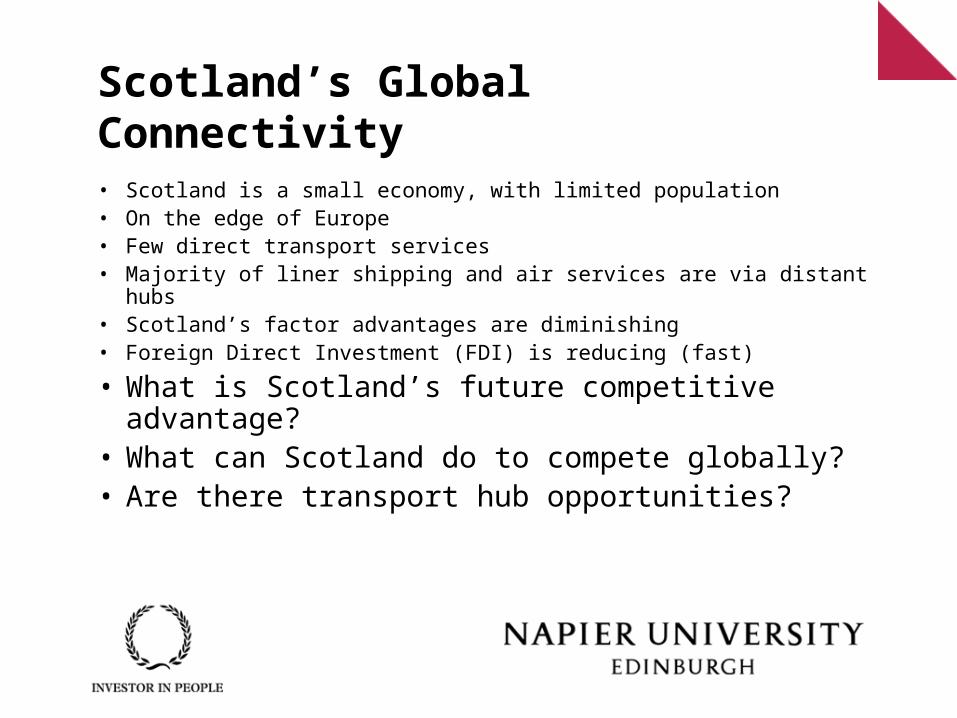
Scotland’s Global Connectivity
• Scotland is a small economy, with limited population• On the edge of Europe• Few direct transport services• Majority of liner shipping and air services are via distant hubs• Scotland’s factor advantages are diminishing• Foreign Direct Investment (FDI) is reducing (fast)
• What is Scotland’s future competitive advantage?• What can Scotland do to compete globally?• Are there transport hub opportunities?
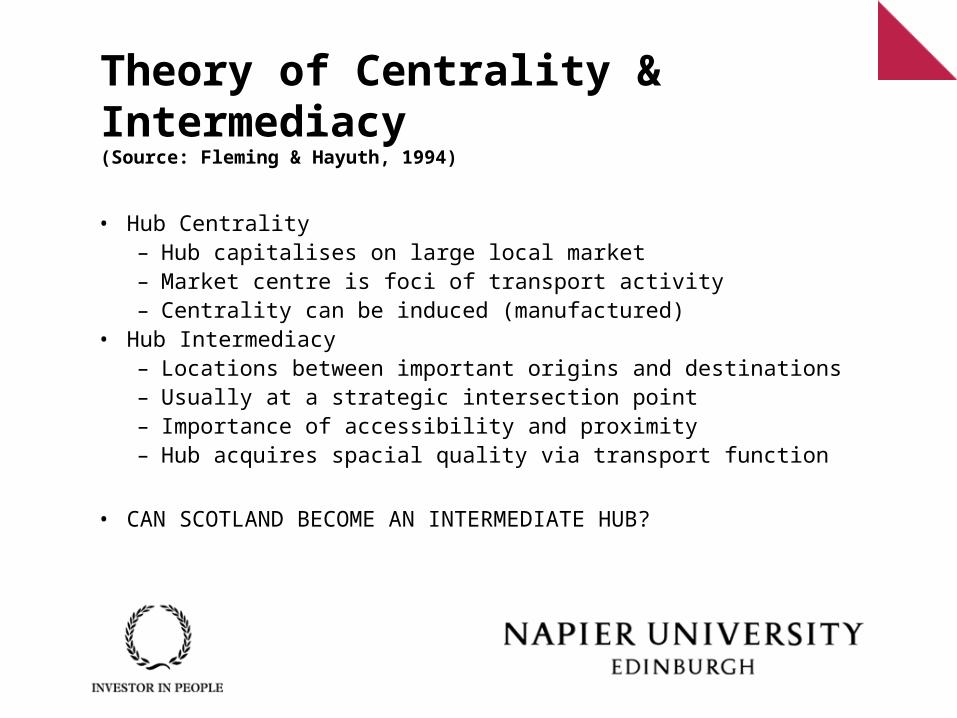
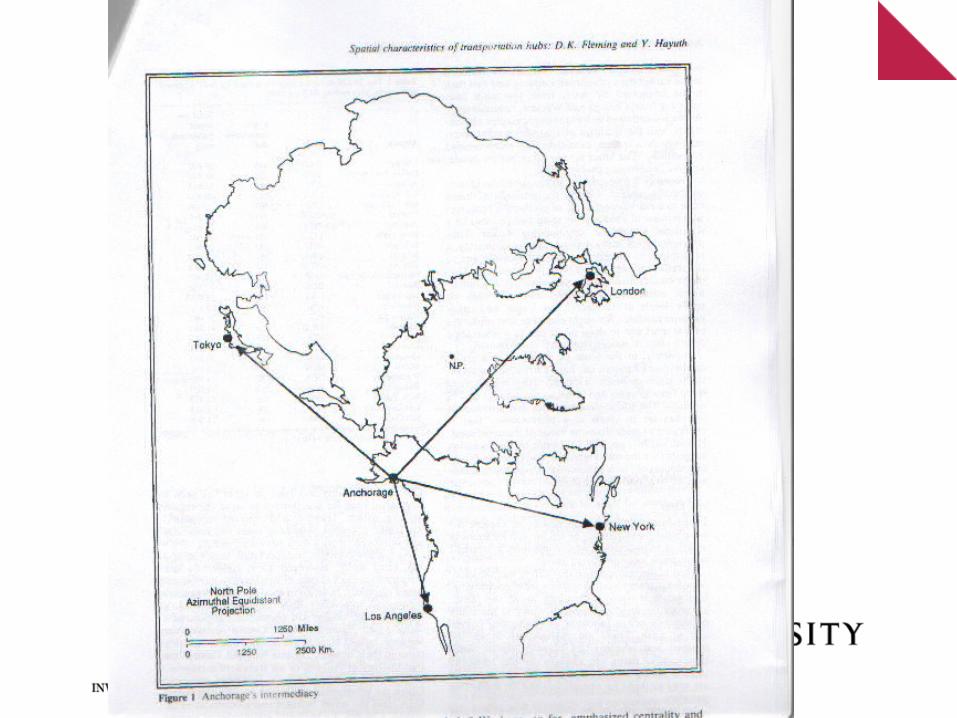
Theory of Centrality & Intermediacy(Source: Fleming & Hayuth, 1994)
• Hub Centrality– Hub capitalises on large local market– Market centre is foci of transport activity– Centrality can be induced (manufactured)
• Hub Intermediacy– Locations between important origins and destinations– Usually at a strategic intersection point– Importance of accessibility and proximity– Hub acquires spacial quality via transport function
• CAN SCOTLAND BECOME AN INTERMEDIATE HUB?
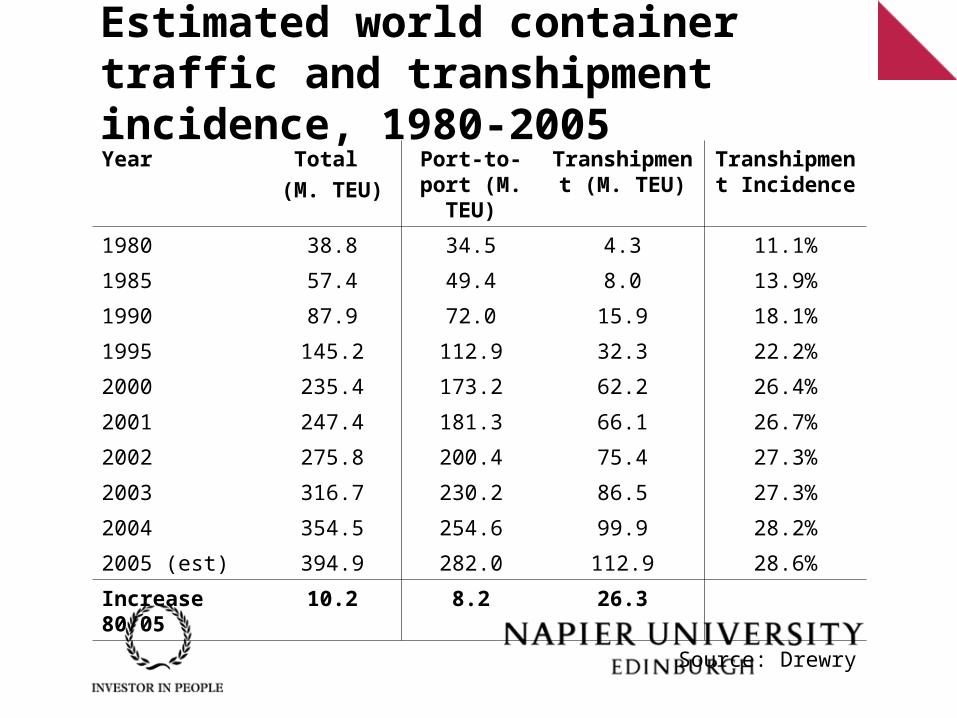
Estimated world container traffic and transhipment incidence, 1980-2005Year Total
(M. TEU)
Port-to-port (M. TEU)
Transhipment (M. TEU)
Transhipment Incidence
1980 38.8 34.5 4.3 11.1%
1985 57.4 49.4 8.0 13.9%
1990 87.9 72.0 15.9 18.1%
1995 145.2 112.9 32.3 22.2%
2000 235.4 173.2 62.2 26.4%
2001 247.4 181.3 66.1 26.7%
2002 275.8 200.4 75.4 27.3%
2003 316.7 230.2 86.5 27.3%
2004 354.5 254.6 99.9 28.2%
2005 (est) 394.9 282.0 112.9 28.6%
Increase 80/05 10.2 8.2 26.3
Source: Drewry
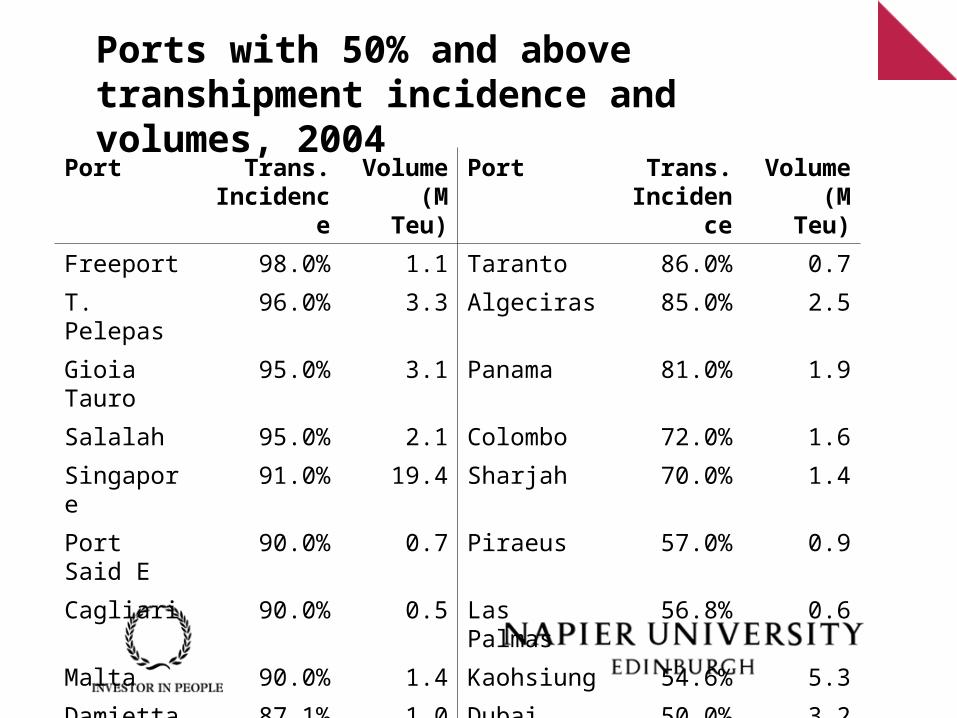
Ports with 50% and above transhipment incidence and volumes, 2004
Port Trans. Incidence
Volume (M Teu)
Port Trans. Incidence
Volume (M Teu)
Freeport 98.0% 1.1 Taranto 86.0% 0.7
T. Pelepas 96.0% 3.3 Algeciras 85.0% 2.5
Gioia Tauro 95.0% 3.1 Panama 81.0% 1.9
Salalah 95.0% 2.1 Colombo 72.0% 1.6
Singapore 91.0% 19.4 Sharjah 70.0% 1.4
Port Said E 90.0% 0.7 Piraeus 57.0% 0.9
Cagliari 90.0% 0.5 Las Palmas 56.8% 0.6
Malta 90.0% 1.4 Kaohsiung 54.6% 5.3
Damietta 87.1% 1.0 Dubai 50.0% 3.2
Kingston 86.0% 1.0 Port Klang 50.0% 2.6
Issues to do with ‘Centrality Hubs’
• Protectionism/state aid (hubs are economic ‘engines’)• High capital cost (of new capacity) and high operating cost• Centrality hubs tend to also become intermediate hubs• Diseconomies of scale
– Congestion– Cost of delay– Pollution– Added risks
• Peripheral markets like Scotland depend on such hubs!• Sustainability?
Amsterdam Schiphol Airport
• 6 runways and plans for a 7th
• 42.5m passengers (2004), no. 4 in Europe• World’s lowest airport (-3m elevation)• Operated by state-owned Schiphol Group:
– 75.8% Ministry of Finance– 21.8% City of Amsterdam– 2.4% City of Rotterdam
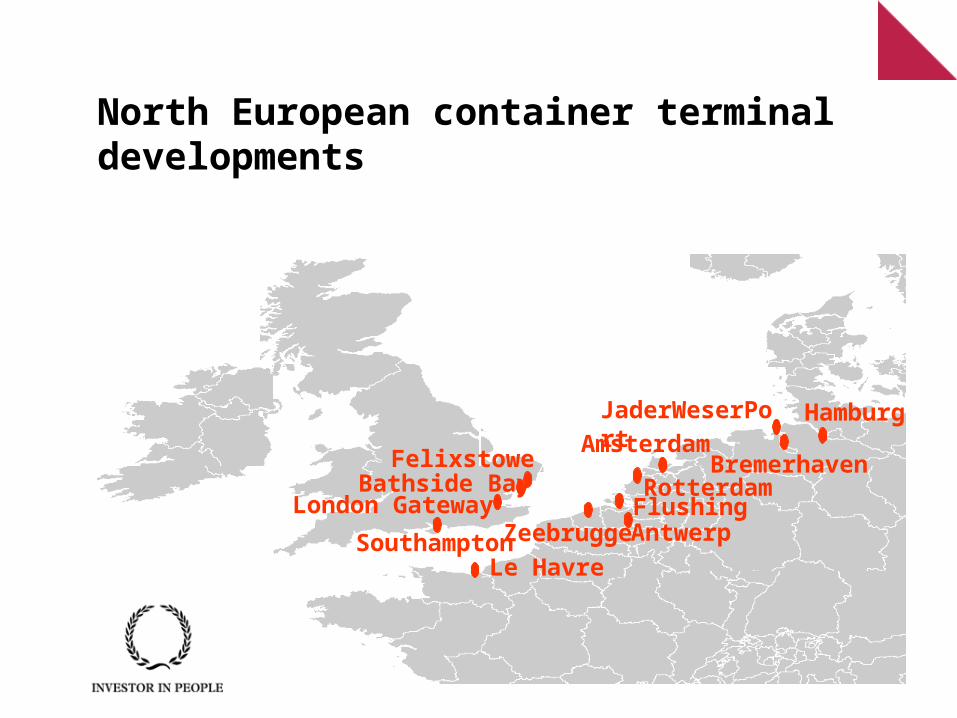
North European container terminal developments
JaderWeserPort
Bremerhaven
Hamburg
Zeebrugge
Antwerp
Amsterdam
Rotterdam Flushing
Felixstowe Bathside Bay
London Gateway
Southampton
Le Havre
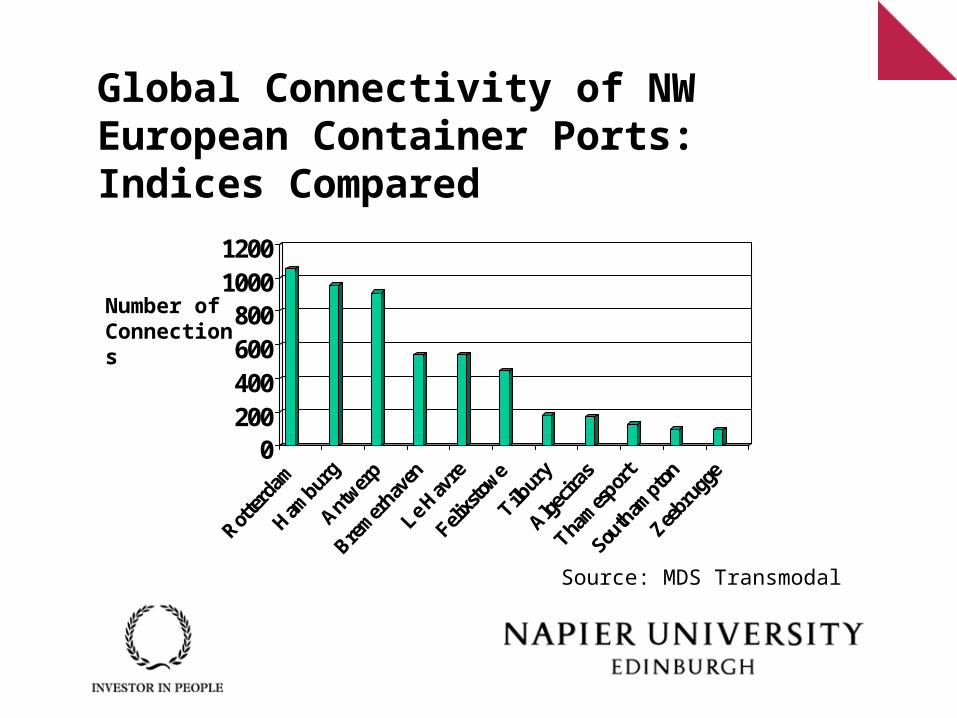
Global Connectivity of NW European Container Ports: Indices Compared
0200400600800
10001200
Source: MDS Transmodal
Number of Connections
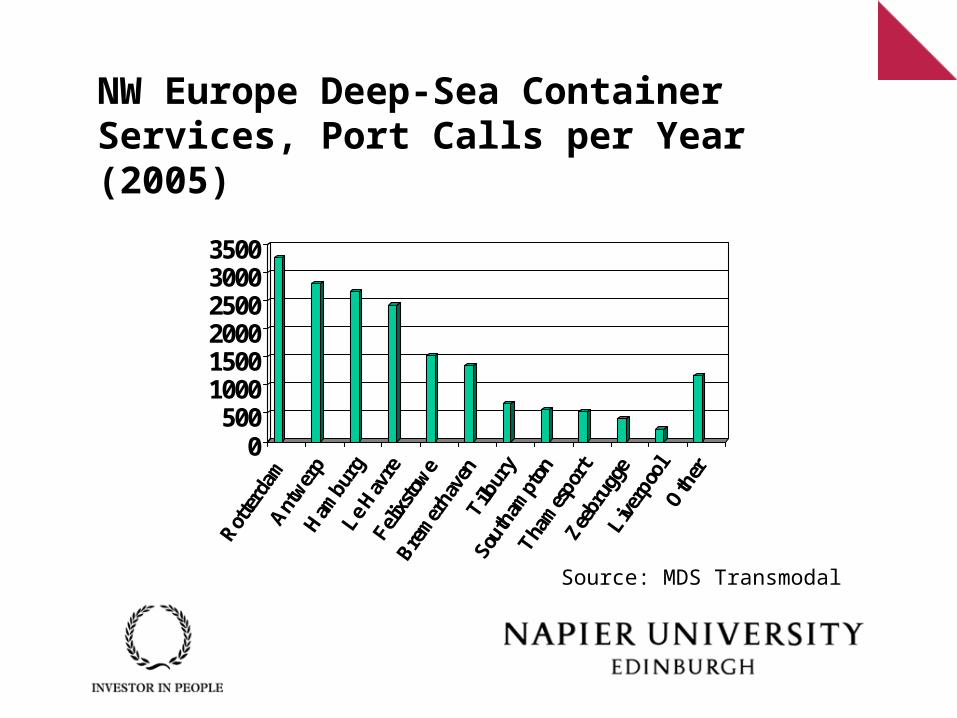
NW Europe Deep-Sea Container Services, Port Calls per Year (2005)
0500
100015002000250030003500
Source: MDS Transmodal
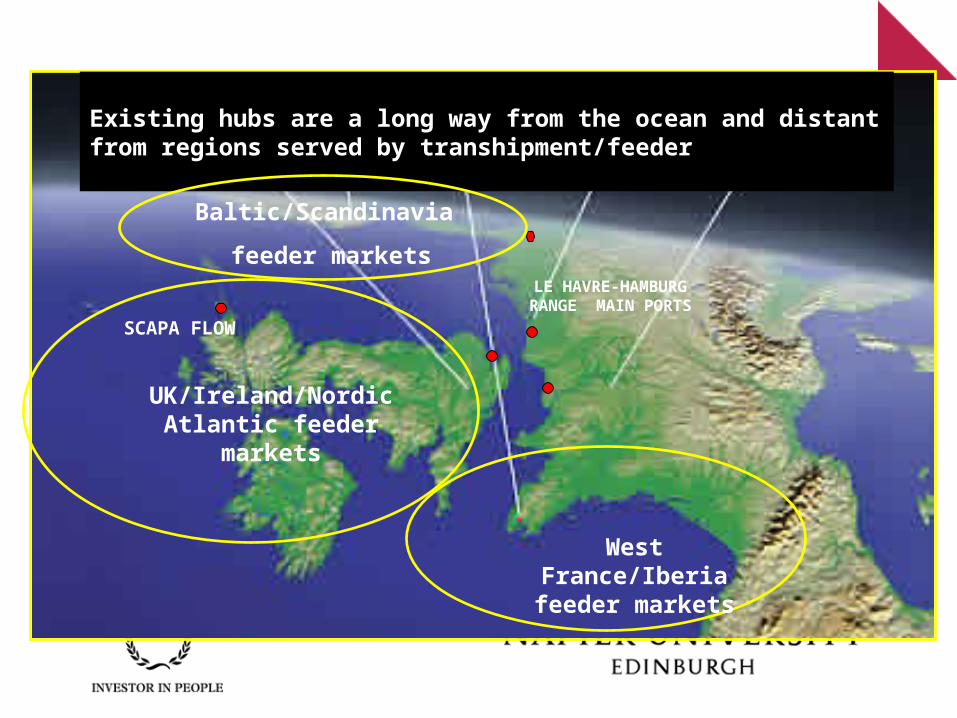
SCAPA FLOW
LE HAVRE-HAMBURG RANGE MAIN PORTS
Existing hubs are a long way from the ocean and distant from regions served by transhipment/feeder
West France/Iberia feeder markets
UK/Ireland/Nordic Atlantic feeder markets
Baltic/Scandinavia
feeder markets
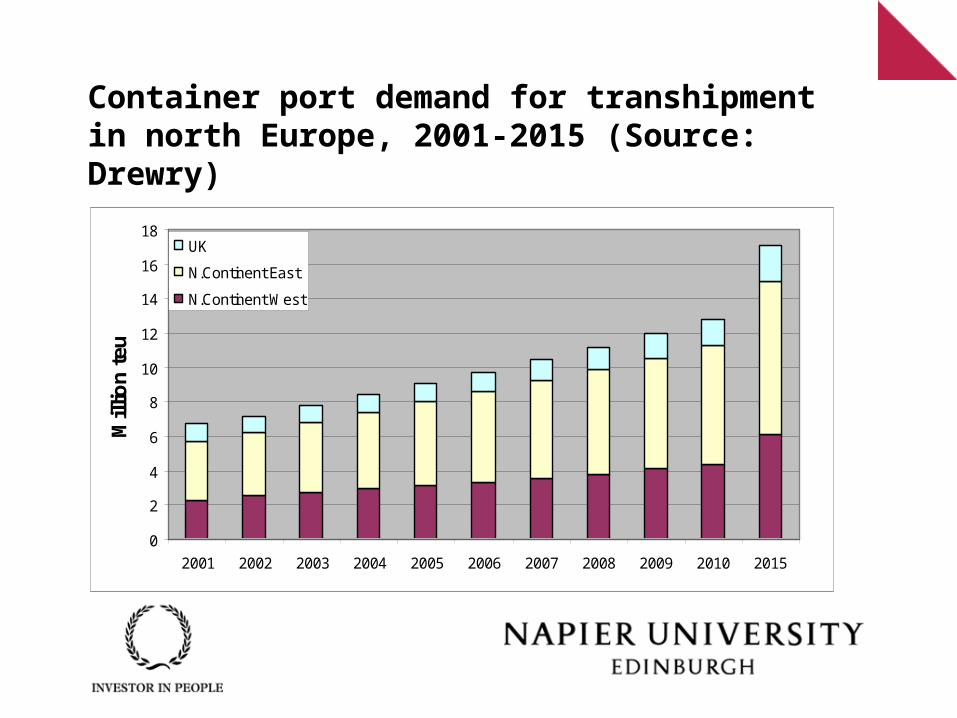
Container port demand for transhipment in north Europe, 2001-2015 (Source: Drewry)
0
2
4
6
8
10
12
14
16
18
2001 2002 2003 2004 2005 2006 2007 2008 2009 2010 2015
Mill
ion
teu
UK
N.Continent East
N.Continent West
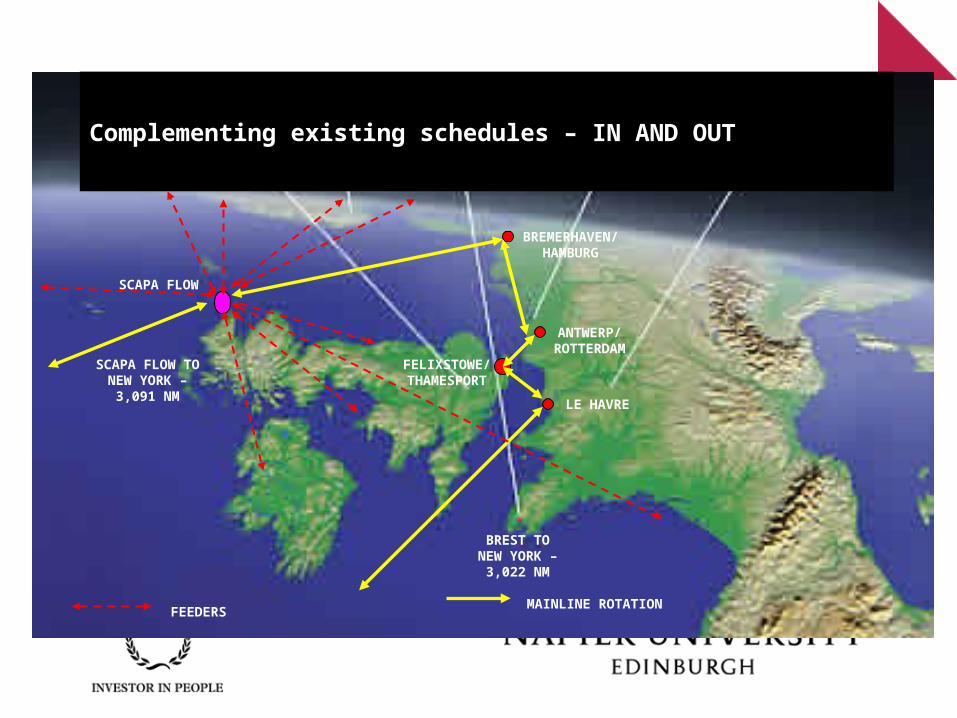
SCAPA FLOW
ANTWERP/ROTTERDAM
FELIXSTOWE/THAMESPORT
Complementing existing schedules – IN AND OUT
BREMERHAVEN/HAMBURG
LE HAVRE
FEEDERSMAINLINE ROTATION
SCAPA FLOW TO NEW YORK –
3,091 NM
BREST TO NEW YORK –
3,022 NM
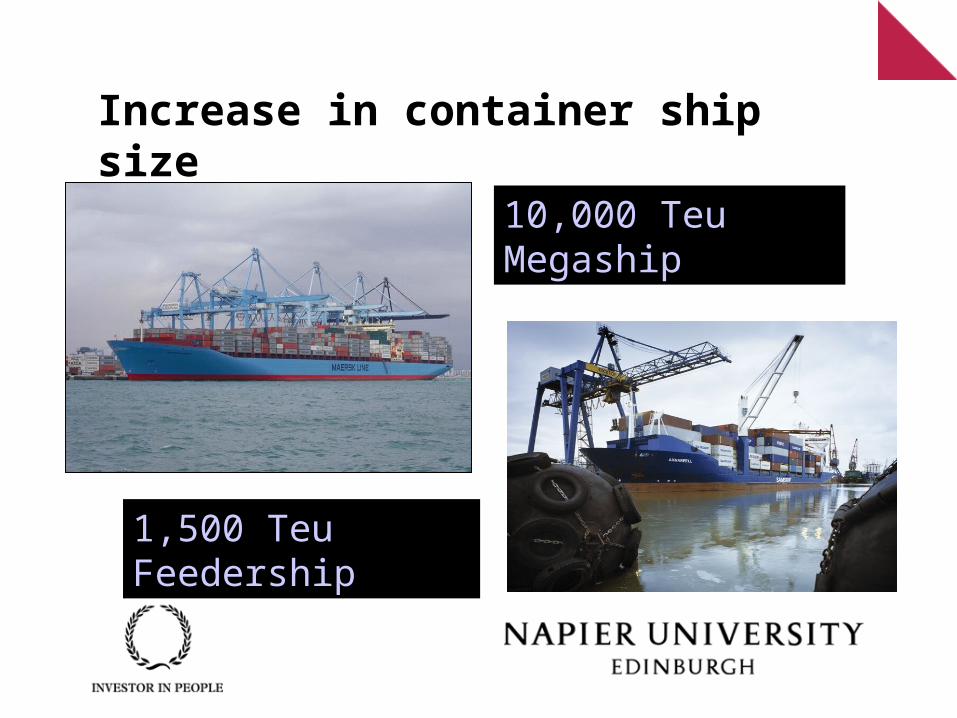
Increase in container ship size
10,000 Teu Megaship
1,500 Teu Feedership
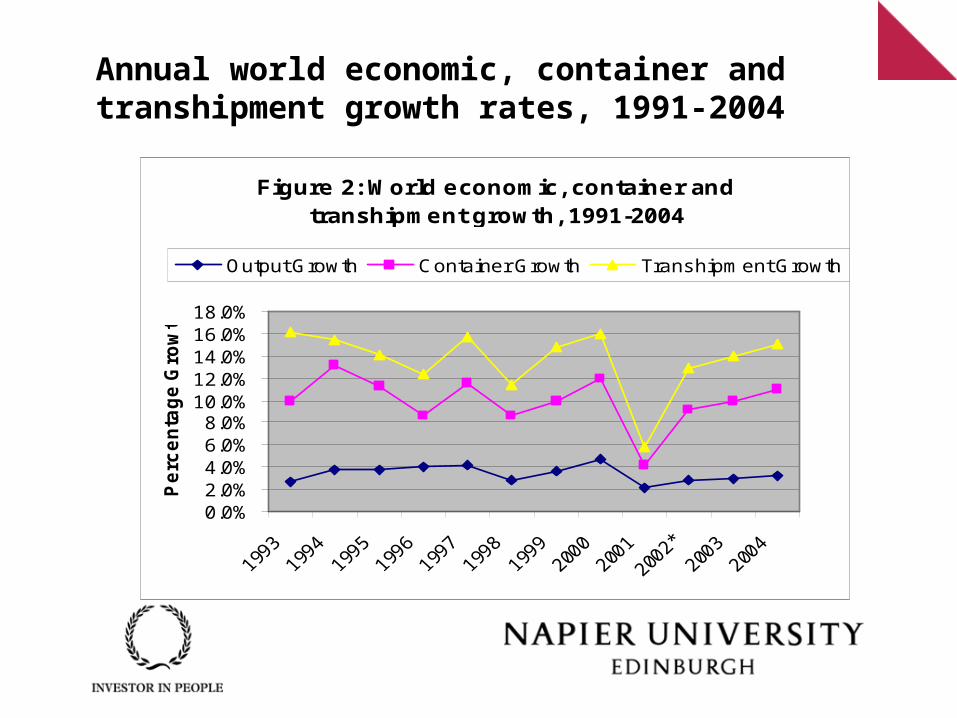
Annual world economic, container and transhipment growth rates, 1991-2004
Figure 2: World economic, container and transhipment growth, 1991-2004
0.0%2.0%4.0%6.0%8.0%
10.0%12.0%14.0%16.0%18.0%
Pe
rce
nta
ge
Gro
wth
Output Growth Container Growth Transhipment Growth
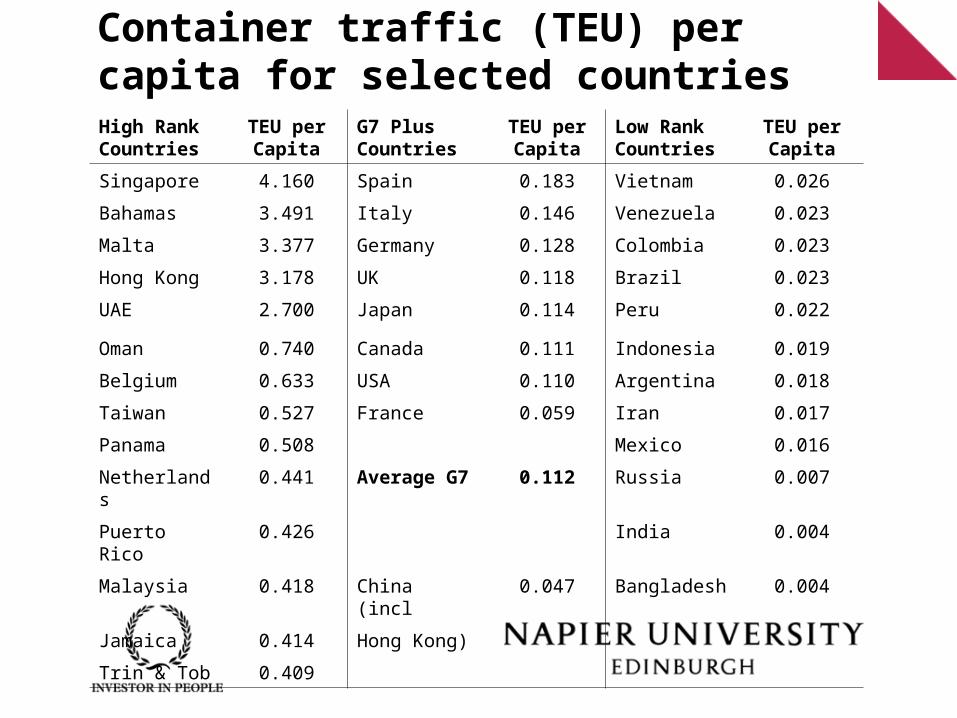
Container traffic (TEU) per capita for selected countriesHigh Rank Countries
TEU per Capita
G7 Plus Countries
TEU per Capita
Low Rank Countries
TEU per Capita
Singapore 4.160 Spain 0.183 Vietnam 0.026
Bahamas 3.491 Italy 0.146 Venezuela 0.023
Malta 3.377 Germany 0.128 Colombia 0.023
Hong Kong 3.178 UK 0.118 Brazil 0.023
UAE 2.700 Japan 0.114 Peru 0.022
Oman 0.740 Canada 0.111 Indonesia 0.019
Belgium 0.633 USA 0.110 Argentina 0.018
Taiwan 0.527 France 0.059 Iran 0.017
Panama 0.508 Mexico 0.016
Netherlands 0.441 Average G7 0.112 Russia 0.007
Puerto Rico 0.426 India 0.004
Malaysia 0.418 China (incl 0.047 Bangladesh 0.004
Jamaica 0.414 Hong Kong)
Trin & Tob 0.409
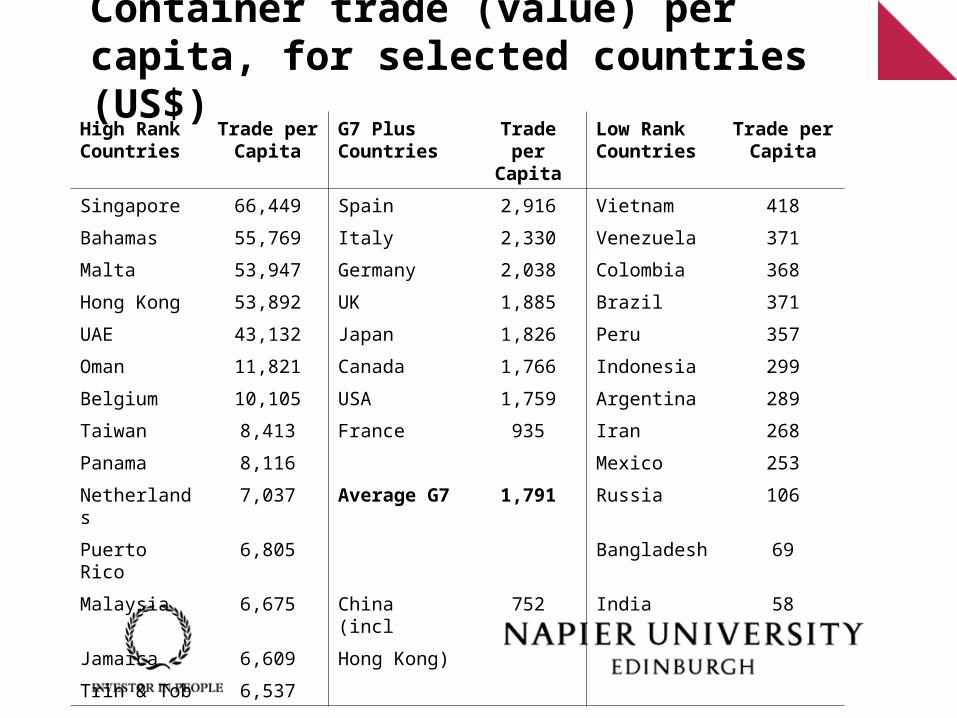
Container trade (value) per capita, for selected countries (US$)
High Rank Countries
Trade per Capita
G7 Plus Countries
Trade per Capita
Low Rank Countries
Trade per Capita
Singapore 66,449 Spain 2,916 Vietnam 418
Bahamas 55,769 Italy 2,330 Venezuela 371
Malta 53,947 Germany 2,038 Colombia 368
Hong Kong 53,892 UK 1,885 Brazil 371
UAE 43,132 Japan 1,826 Peru 357
Oman 11,821 Canada 1,766 Indonesia 299
Belgium 10,105 USA 1,759 Argentina 289
Taiwan 8,413 France 935 Iran 268
Panama 8,116 Mexico 253
Netherlands 7,037 Average G7 1,791 Russia 106
Puerto Rico 6,805 Bangladesh 69
Malaysia 6,675 China (incl 752 India 58
Jamaica 6,609 Hong Kong)
Trin & Tob 6,537
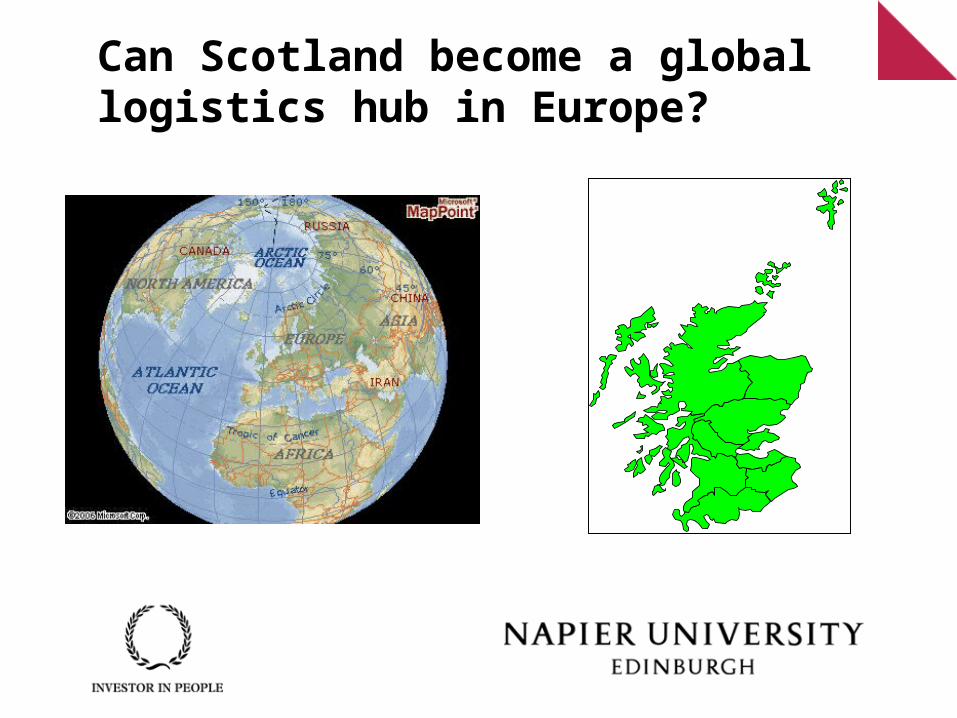
Can Scotland become a global logistics hub in Europe?
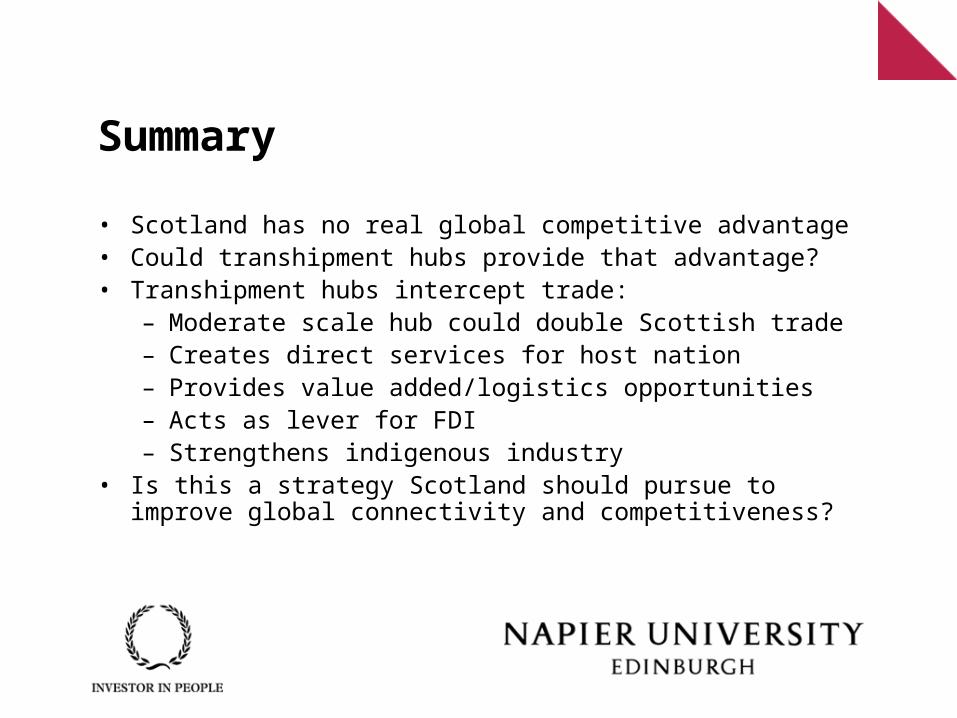
Summary
• Scotland has no real global competitive advantage• Could transhipment hubs provide that advantage?• Transhipment hubs intercept trade:
– Moderate scale hub could double Scottish trade– Creates direct services for host nation– Provides value added/logistics opportunities– Acts as lever for FDI– Strengthens indigenous industry
• Is this a strategy Scotland should pursue to improve global connectivity and competitiveness?
Thank You
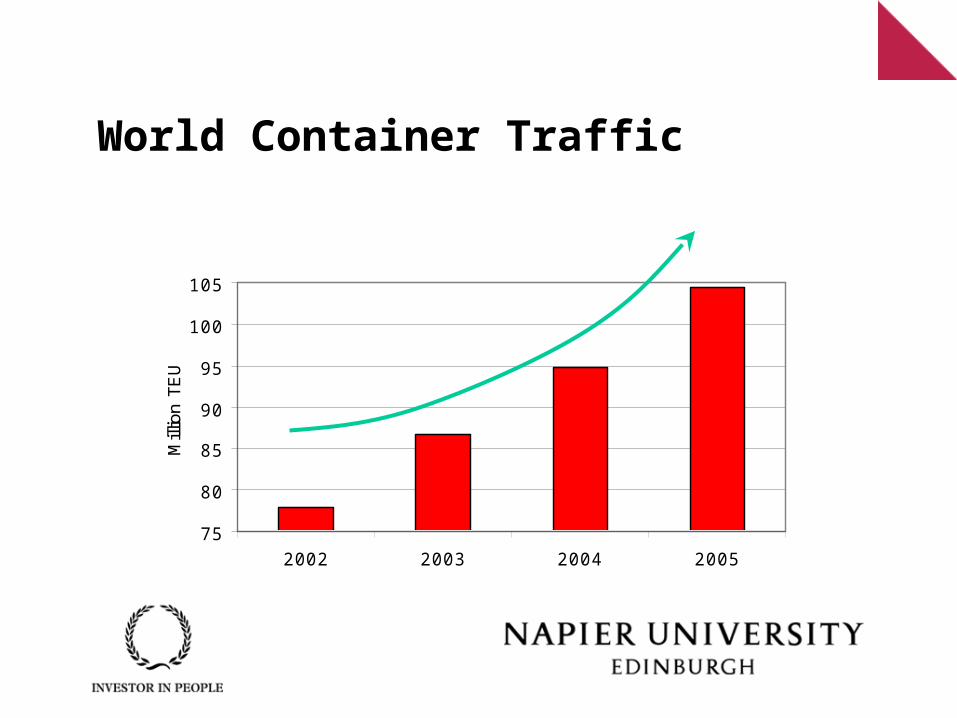
World Container Traffic
75
80
85
90
95
100
105
2002 2003 2004 2005
Mill
ion
TE
U
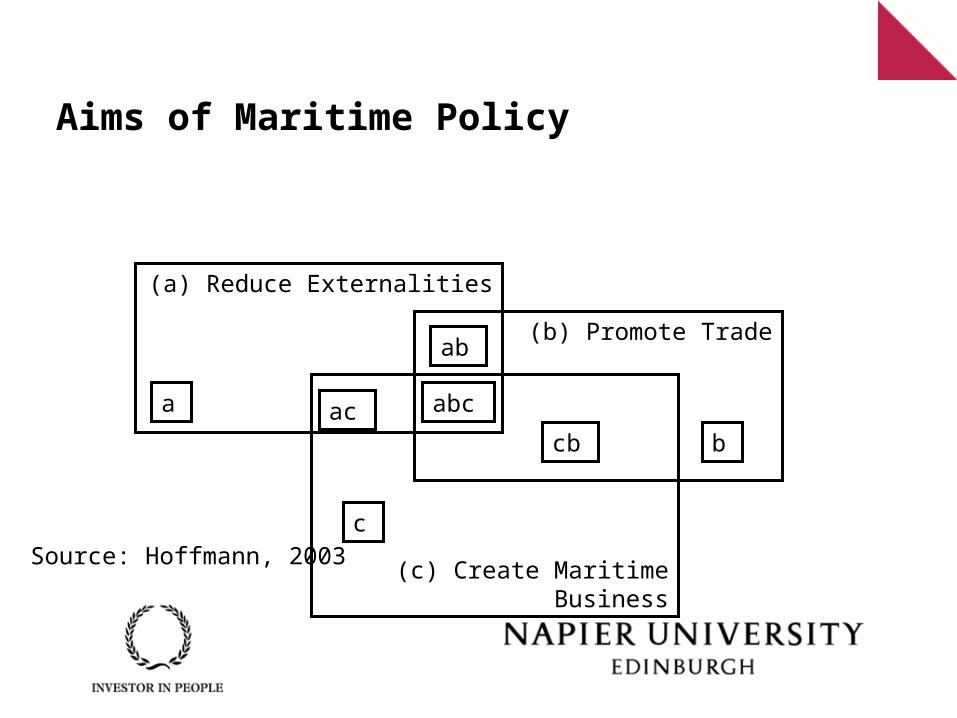
Aims of Maritime Policy
(a) Reduce Externalities
(b) Promote Trade
(c) Create Maritime Business
a ac
c
abc
cb b
ab
Source: Hoffmann, 2003
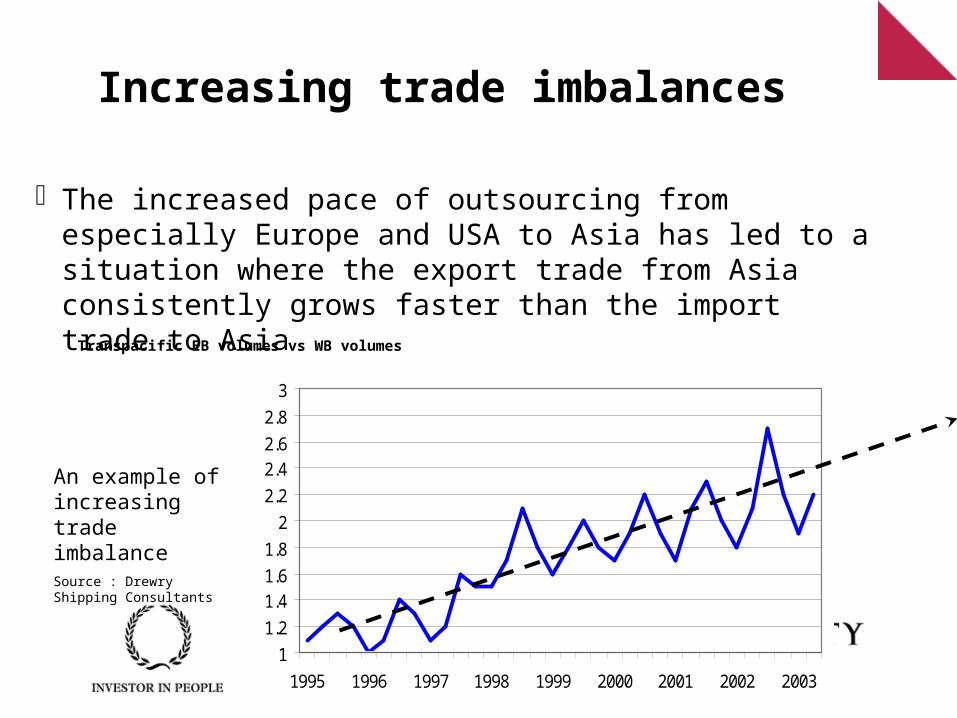
Increasing trade imbalances
The increased pace of outsourcing from especially Europe and USA to Asia has led to a situation where the export trade from Asia consistently grows faster than the import trade to Asia
Transpacific EB volumes vs WB volumes
An example of increasing trade imbalance Source : Drewry Shipping Consultants
1
1.2
1.41.6
1.8
2
2.2
2.42.6
2.8
3
1995 1996 1997 1998 1999 2000 2001 2002 2003
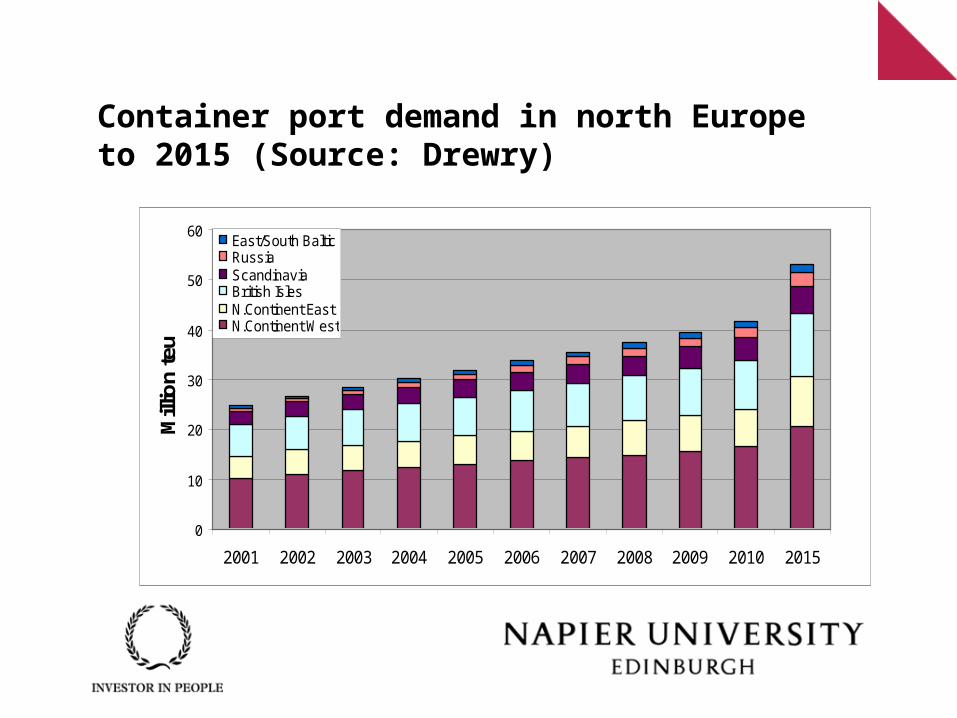
Container port demand in north Europe to 2015 (Source: Drewry)
0
10
20
30
40
50
60
2001 2002 2003 2004 2005 2006 2007 2008 2009 2010 2015
Mill
ion
teu
East/South BalticRussiaScandinaviaBritish IslesN.Continent EastN.Continent West