Embed Size (px)
Citation preview

Annals of Applied Biology ISSN 0003-4746
R E S E A R C H A R T I C L E
How do weeds differ in their response to the timing of tillage?A study of 61 species across the northeastern United StatesS. Cordeau1,2 , R.G. Smith3, E.R. Gallandt4, B. Brown4, P. Salon5, A. DiTommaso2 & M.R. Ryan2
1 Agroécologie, AgroSup Dijon, INRA, University Bourgogne Franche-Comté, Dijon, France2 School of Integrative Plant Science, Cornell University, Soil and Crop Sciences Section, Ithaca, NY, USA3 Department of Natural Resources and the Environment, University of New Hampshire, Durham, NH, USA4 School of Food and Agriculture, University of Maine, Orono, ME, USA5 USDA-NRCS Soil Health Division, Big Flats Plant Materials Center, Corning, NY, USA
KeywordsCommunity assembly theory; disturbance;germination; seedbank dynamics; seedlingrecruitment; trait; weed ecology.
CorrespondenceM.R. Ryan, School of Integrative Plant Science,Cornell University, Soil and Crop SciencesSection, Ithaca, NY 14853, USA. Email:[email protected]
Received: 3 August 2016; revised versionaccepted: 14 June 2017.
doi:10.1111/aab.12377
Abstract
Previous research has demonstrated that the season in which soil is tilled (springversus fall) can strongly influence weed community assembly and subsequentspecies composition and abundance in annual cropping systems. Despite thisunderstanding, it is unknown whether finer-scale, within-season variation inthe timing of tillage has similar impacts on weed community assembly. Weconducted an experiment on four research farms across the northeastern USAto test the effects of tillage timing on weed emergence periodicity. Soil was tilledat 12 different times that were 2 weeks apart from 29 April to 30 September(the entire growing season) and the composition and abundance of the weedseedlings that emerged was measured 6 weeks later. Weed species clusteredinto three tillage timing groups at the two New York locations and clustered intofive tillage timing groups at the New Hampshire and Maine locations. Individualspecies associated with each window of tillage time varied by location. No singletrait or combination of traits were consistently associated with species-by-tillagetime groupings across locations; however, within each location several traitswere associated with particular groups of species, including: (a) seed length,(b) seed weight, (c) cotyledon type, (d) life span, (e) ploidy level and (f)photosynthetic pathway. These results suggest that fine-scale variation in thetiming of tillage can lead to predictable changes in the species composition andtrait distribution of weed communities in annually tilled agroecosystems.
Introduction
Despite pervasive use of herbicides, weeds remain a majorbiotic factor limiting crop yield. Innovative and economi-cally viable cropping systems need to be designed to limitthe negative environmental and ecological impacts ofboth weeds and excessive herbicide inputs on agroecosys-tems. The transition from primarily herbicide-based tomore integrated or ecologically based weed managementstrategies requires a more in-depth understanding of thebiology and ecology of weeds (Mortensen et al., 2000;Petit et al., 2015). Similarly, greater knowledge of howfarming practices individually or in combination influ-ence weed communities and their assembly is required(Van Acker, 2009).
Booth & Swanton (2002) suggest that community
assembly theory (Keddy, 1992) provides a logical frame-
work for understanding how weed communities change
in response to management practices. Under this frame-
work, a weed community assembles from a local species
pool, i.e. the soil-seedbank, by passing through a series
of filters that either favour or disfavour particular species
based on their traits (Booth & Swanton, 2002). These
filters include management practices, e.g. tillage, her-
bicide application, physical weed control, harvest and
post-harvest activities, which negatively or positively
affect the establishment, growth and reproduction of
weed species (Booth & Swanton, 2002). Species with
traits poorly adapted to tolerate specific filters operating
Ann Appl Biol (2017) 1© 2017 Association of Applied Biologists
Weed response to timing of tillage S. Cordeau et al.
within the agroecosystem are less likely to occur withinthe community in comparison with species having traitsthat allow them to avoid or escape these filters. Forexample, herbicides effectively filter from the communitythose species that are susceptible to the active ingredient,resulting in weed communities made up of species or bio-types that are capable of avoiding or tolerating injury fromthe herbicide (Owen, 2008).
Previous research has demonstrated that a primarydriver of weed community assembly at the field scaleis the crop type (Fried et al., 2008), largely because thisdetermines the type and timing of associated assem-bly filters (Smith & Gross, 2007). In spring-sown crops,associated filters such as primary tillage, herbicide appli-cation or crop canopy closure occur early in the grow-ing season, while in fall-sown crops, these filters operatelater in the growing season or early in the next growingseason.
Weed species differ in their phenology, seed germi-nation requirements, periodicity and duration of ger-mination, and response to secondary soil disturbance(Guillemin et al., 2013; Cordeau et al., 2015). Conse-quently, whereas primary tillage can be a strong driverof seedbank dynamics (Bàrberi & Lo Cascio, 2001; Sos-noskie et al., 2006) and can determine the composition ofthe weed community emerging later in the crop (Schutteet al., 2014), the interaction between the timing of tillageand the specific traits of individual weed species withregard to their emergence periodicity and other germi-nation behaviours suggests that the seasonal timing oftillage should also be a strong weed community assem-bly filter (Smith, 2006; Ryan et al., 2010). Indeed, previ-ous research indicates that fall tillage generally stimulatesgermination of winter annual or biennial species, whilespring tillage stimulates germination of summer annualand biennial species, resulting in weed communities thatdiffer in species composition and abundance based on theseason of tillage (Smith, 2006).
Weed ecology research has provided a general under-standing of how some weed species respond to the tim-ing of tillage (Crawley, 2004; Smith, 2006; Schutte et al.,2014). Previous studies have investigated the effects oftillage on one or a few weed species (Sharma, 1983; Stahlet al., 1999; Chauhan et al., 2006a). However, becausespecies pools, climate, soil and cropping systems differamong regions, it is not known whether results can beextrapolated outside the area where the research wasperformed. Although the abundance and composition ofspecies pools may vary across cropping regions, the traitsupon which filters operate likely do not. We thereforecontend that a trait-based functional group approach isnecessary to improve our understanding of the effect oftillage on weed emergence (Gardarin et al., 2010) and the
timing of tillage on weed community filtering (Smith,2006).
Previous research has demonstrated that broad-scaledifferences in the timing of tillage (i.e. spring versusautumn) can lead to species filtering, but it is unknownhow finer-scale variation in the timing of tillage (i.e. dif-ferences in tillage time on the order of weeks and months)affects assembly process or the traits upon which suchdisturbance-based filtering might act. The objectives ofthe present study were to (a) quantify the shift in weedcommunities induced by different timings of tillage (interms of presence–absence and abundance) and (b) anal-yse individual weed species responses to tillage timing inorder to identify groups of species that respond similarly(cluster analysis) based on their ecological traits.
Materials and methods
Experimental locations
This multisite experiment was carried out from lateApril to late September 2013, at four locations acrossthe northeastern USA. The four sites were (a) NRCS BigFlats Plants Material Center in Big Flats, NY, (42.16∘N,76.89∘W; hereafter ‘Big Flats’), (b) Cornell UniversityMusgrave Research Farm in Aurora, NY, (42.73∘N,76.66∘W; hereafter ‘Musgrave’), (c) the University ofNew Hampshire Woodman Horticultural Research Farmin Durham, NH (43.15∘N, 70.94∘W; hereafter ‘Wood-man’) and (d) the University of Maine Rogers FarmForage and Crop Research Facility in Stillwater, ME(44.93∘N, 68.69∘W; hereafter ‘Rogers’). The four loca-tions varied in soil and climate conditions (AppendixS1). The soil was dominated by Unadilla silt loam at BigFlats, Lima silt loam at Musgrave, Charlton fine sandyloam at Woodman, and Lamoine silt loam at Rogers. Thecumulative growing degree days (GDD, base 0∘C) weregenerally similar across the sites (Appendix S1) and thetotal GDD from 29 April to 30 September did not differmuch between sites (i.e. 2795∘C at Big Flats, 2809∘C atMusgrave, 2859∘C at Woodman and 2527∘C at Rogers).The daily rainfall patterns were also very similar betweenthe sites (Appendix S1). Previous crops grown on theexperimental sites were cereal rye at Big Flats, wheatat Musgrave, mixed greens at Woodman and a greenmanure mixture of millet (Panicum miliaceum L.) andSudangrass (Sorghum bicolor (L.) Moench) at Rogers.
Experimental treatments
A total of 12 tillage timings (i.e. treatments) were com-pared using a randomised complete block design withfour replications, except at Woodman where five replica-tions were used. Soil was tilled in a different plot every
2 Ann Appl Biol (2017)© 2017 Association of Applied Biologists
S. Cordeau et al. Weed response to timing of tillage
2 weeks starting on 29 April. The last tillage date was30 September, except at the Rogers site where the lasttreatment occurred on 16 September (11 timings). Atall sites, soil was kept undisturbed before and after soiltillage. No other management practices other than tillagewere implemented at the sites, except at the Musgravesite where glyphosate (340 g a.i. ha−1) was applied atthe start of the experiment to suppress crop volunteers.Glyphosate is a systemic foliar applied herbicide with nosoil residual activity and so had no effect on weeds emerg-ing later in the experiment at the Musgrave site. Plotsmeasured 1.5×3.0 m2. Tillage was carried out using arototiller (15 cm depth) at all sites.
Weed sampling
Weeds were quantified in a total of 196 plots. Becauseof technical problems one replicate plot was not sampledon 27 May at the Rogers site, and one replicate plot on 16September and two replicate plots on 30 September at theBig Flats site. All plots were sampled for emerged weedssix weeks after the tillage operation. We assume that thissampling timing allowed maximum emergence of weedseedlings while minimising the potential for competitiveexclusion. Weed seedlings in each plot were identifiedand counted within a randomly placed 0.5 m2 quadratwithin the centre of each plot and then converted to thenumber of plants or stems (for perennials) m−2. Most ofthe species were identified at the species level and namedby their EPPO code (http://eppt.eppo.org/). Some of theplants could only be identified at the genus or familylevel. Plants that could not be completely identified weredesignated with the prefix UNK (“unknown”) and kept inthe dataset for calculating weed species richness and totalabundance. The species list is provided in Appendix S2.Crop volunteers (Brassica napus L., Brassica rapa L., Secale
cereale L., Triticum aestivum L.) and tree saplings (Populus
spp.) were removed from the datasets because they arenot considered pests of concern.
Data analysis
Non-metric multidimensional scaling (NMDS) ordinationwas performed using the overall dataset (i.e. all sites,N = 196 plots), with the Vegan package (Oksanen et al.,
2010) in R software (R Core Team, 2015). NMDS wasselected because it circumvents the horseshoe effect bymaximising the “rank order correlation” instead of the lin-ear correlation of the distance measurements themselves.The NMDS was done with a Wisconsin double standardi-sation of the data – i.e. normalising taxa to percent abun-dance and then normalising abundances to the maximumfor each species. We selected the most frequent species in
the overall dataset with a 5% cut-off (i.e. more than nineoccurrences over the 196 plots). The NMDS was ordinatedin three dimensions (after checking that the final stressvalue was around 0.1), with 1000 as the maximum num-ber of random starts in search of a stable solution.
Shift in species occurrence
All analyses were carried out separately by location. Weselected the most frequent weed species, with a 5%cut-off in each ‘by-location sub-dataset’, because somespecies were frequent only in a few locations. Seriations(Brower & Kyle, 1988) were performed with the Past soft-ware version 2.17c (Hammer et al., 2001) on the ‘species(presence–absence)-by-tillage date’ matrix for each loca-tion, constraining the reorder only on rows (species), withcolumns remaining fixed and chronologically ordered(based on timing of tillage). Monte Carlo simulation wasused to generate and seriate 30 random matrices withthe same number of occurrences within each taxon; thesewere then compared to the original matrix.
Overlap of emergence periodicity patterns
The probability of emergence of weed species at eachtillage timing was plotted with violin plots with theggplot2 package (Wickham, 2009). Violin plots representthe kernel density curve (probability of occurrence)for each species in each location. Violin plots wereordered according to the earliest timing the speciesoccurred. Within location, we computed the overlapratio between kernel distributions of species with theoverlapTrue function of the overlap package (Ridout &Linkie, 2009), which generated a coefficient of overlap-ping for each couple of species distributions f (x) and g(x),as Δ (f , g).
A distance matrix using the distance (D) wascomputed as
D = 1 − Δ (f , g)
where D represents a dissimilarity index in emergenceperiodicity. The parameter D varies from 0, when bothspecies emerged at the same dates with the same abun-dance at each date, to 1 when the timing of emer-gence during the sample periods never matched. Finally,a hierarchical cluster analysis (HCA) on the distancematrix of overlap was performed to identify clear andnon-redundant groups of species with the use of den-drograms, plotted with the ggplot2 (Wickham, 2009)and ggdendro (de Vries & Ripley, 2013) packages. Weedspecies clustered into the same group displayed similaremergence periodicity patterns.
Ann Appl Biol (2017) 3© 2017 Association of Applied Biologists
Weed response to timing of tillage S. Cordeau et al.
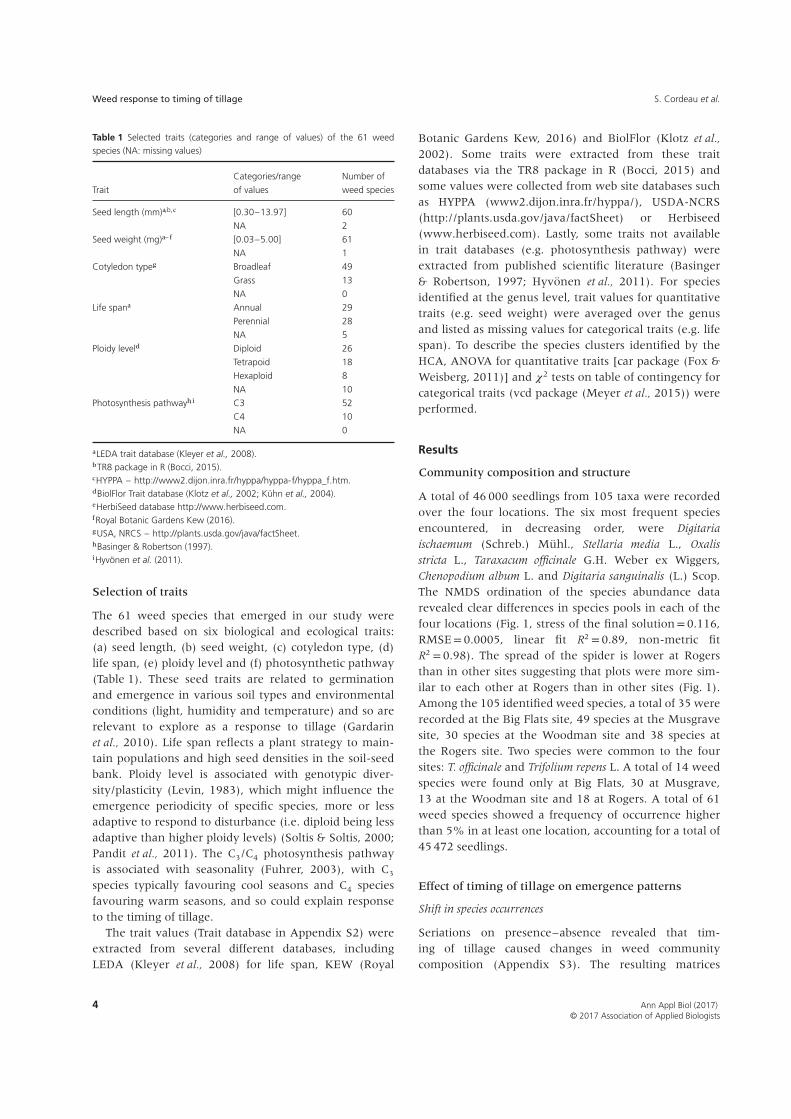
Table 1 Selected traits (categories and range of values) of the 61 weedspecies (NA: missing values)
Trait
Categories/range
of values
Number of
weed species
Seed length (mm)a,b,c [0.30–13.97] 60
NA 2
Seed weight (mg)a– f [0.03–5.00] 61
NA 1
Cotyledon typeg Broadleaf 49
Grass 13
NA 0
Life spana Annual 29
Perennial 28
NA 5
Ploidy leveld Diploid 26
Tetrapoid 18
Hexaploid 8
NA 10
Photosynthesis pathwayh,i C3 52
C4 10
NA 0
aLEDA trait database (Kleyer et al., 2008).bTR8 package in R (Bocci, 2015).cHYPPA – http://www2.dijon.inra.fr/hyppa/hyppa-f/hyppa_f.htm.dBiolFlor Trait database (Klotz et al., 2002; Kühn et al., 2004).eHerbiSeed database http://www.herbiseed.com.fRoyal Botanic Gardens Kew (2016).gUSA, NRCS – http://plants.usda.gov/java/factSheet.hBasinger & Robertson (1997).iHyvönen et al. (2011).
Selection of traits
The 61 weed species that emerged in our study weredescribed based on six biological and ecological traits:(a) seed length, (b) seed weight, (c) cotyledon type, (d)life span, (e) ploidy level and (f) photosynthetic pathway(Table 1). These seed traits are related to germinationand emergence in various soil types and environmentalconditions (light, humidity and temperature) and so arerelevant to explore as a response to tillage (Gardarinet al., 2010). Life span reflects a plant strategy to main-tain populations and high seed densities in the soil-seedbank. Ploidy level is associated with genotypic diver-sity/plasticity (Levin, 1983), which might influence theemergence periodicity of specific species, more or lessadaptive to respond to disturbance (i.e. diploid being lessadaptive than higher ploidy levels) (Soltis & Soltis, 2000;Pandit et al., 2011). The C3/C4 photosynthesis pathwayis associated with seasonality (Fuhrer, 2003), with C3
species typically favouring cool seasons and C4 speciesfavouring warm seasons, and so could explain responseto the timing of tillage.
The trait values (Trait database in Appendix S2) wereextracted from several different databases, includingLEDA (Kleyer et al., 2008) for life span, KEW (Royal
Botanic Gardens Kew, 2016) and BiolFlor (Klotz et al.,
2002). Some traits were extracted from these traitdatabases via the TR8 package in R (Bocci, 2015) andsome values were collected from web site databases suchas HYPPA (www2.dijon.inra.fr/hyppa/), USDA-NCRS(http://plants.usda.gov/java/factSheet) or Herbiseed(www.herbiseed.com). Lastly, some traits not availablein trait databases (e.g. photosynthesis pathway) wereextracted from published scientific literature (Basinger& Robertson, 1997; Hyvönen et al., 2011). For speciesidentified at the genus level, trait values for quantitativetraits (e.g. seed weight) were averaged over the genusand listed as missing values for categorical traits (e.g. lifespan). To describe the species clusters identified by theHCA, ANOVA for quantitative traits [car package (Fox &Weisberg, 2011)] and 𝜒2 tests on table of contingency forcategorical traits (vcd package (Meyer et al., 2015)) wereperformed.
Results
Community composition and structure
A total of 46 000 seedlings from 105 taxa were recordedover the four locations. The six most frequent speciesencountered, in decreasing order, were Digitaria
ischaemum (Schreb.) Mühl., Stellaria media L., Oxalis
stricta L., Taraxacum officinale G.H. Weber ex Wiggers,Chenopodium album L. and Digitaria sanguinalis (L.) Scop.
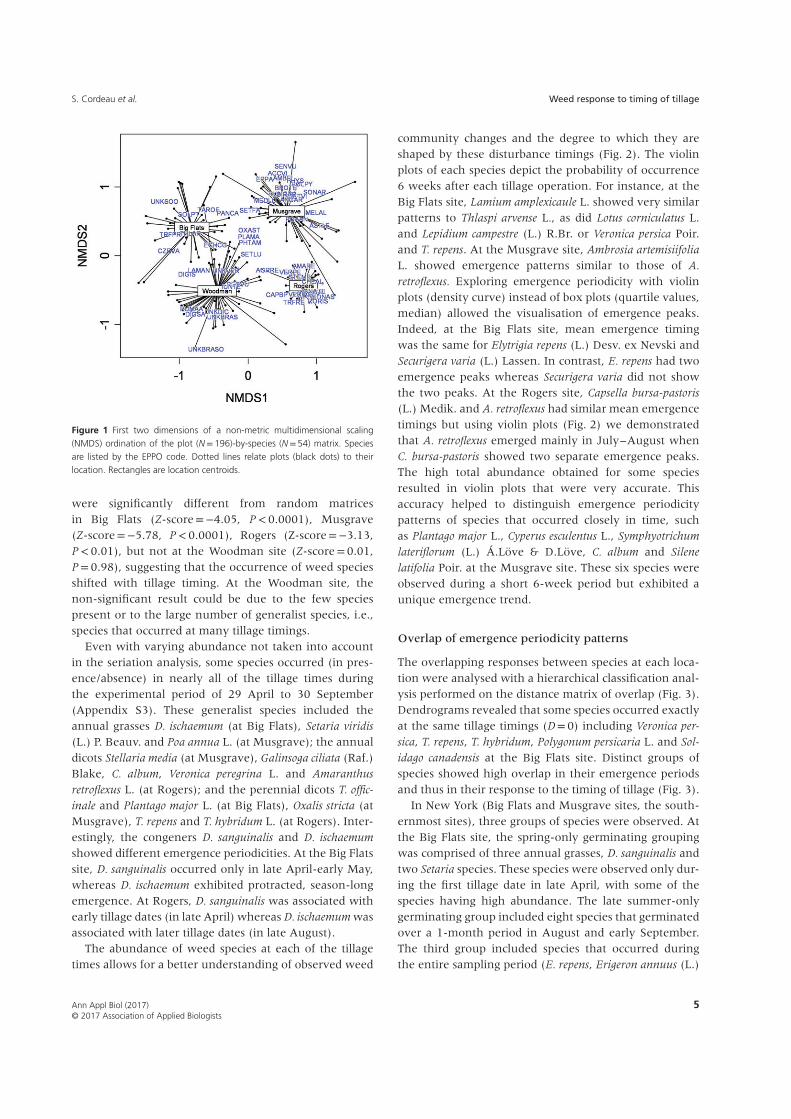
The NMDS ordination of the species abundance datarevealed clear differences in species pools in each of thefour locations (Fig. 1, stress of the final solution= 0.116,RMSE= 0.0005, linear fit R2 = 0.89, non-metric fitR2 = 0.98). The spread of the spider is lower at Rogersthan in other sites suggesting that plots were more sim-ilar to each other at Rogers than in other sites (Fig. 1).Among the 105 identified weed species, a total of 35 wererecorded at the Big Flats site, 49 species at the Musgravesite, 30 species at the Woodman site and 38 species atthe Rogers site. Two species were common to the foursites: T. officinale and Trifolium repens L. A total of 14 weedspecies were found only at Big Flats, 30 at Musgrave,13 at the Woodman site and 18 at Rogers. A total of 61weed species showed a frequency of occurrence higherthan 5% in at least one location, accounting for a total of45 472 seedlings.
Effect of timing of tillage on emergence patterns
Shift in species occurrences
Seriations on presence–absence revealed that tim-ing of tillage caused changes in weed communitycomposition (Appendix S3). The resulting matrices
4 Ann Appl Biol (2017)© 2017 Association of Applied Biologists
S. Cordeau et al. Weed response to timing of tillage
Figure 1 First two dimensions of a non-metric multidimensional scaling(NMDS) ordination of the plot (N=196)-by-species (N=54) matrix. Speciesare listed by the EPPO code. Dotted lines relate plots (black dots) to theirlocation. Rectangles are location centroids.
were significantly different from random matricesin Big Flats (Z-score=−4.05, P<0.0001), Musgrave(Z-score=−5.78, P<0.0001), Rogers (Z-score=−3.13,P< 0.01), but not at the Woodman site (Z-score=0.01,P= 0.98), suggesting that the occurrence of weed speciesshifted with tillage timing. At the Woodman site, thenon-significant result could be due to the few speciespresent or to the large number of generalist species, i.e.,species that occurred at many tillage timings.
Even with varying abundance not taken into accountin the seriation analysis, some species occurred (in pres-ence/absence) in nearly all of the tillage times duringthe experimental period of 29 April to 30 September(Appendix S3). These generalist species included theannual grasses D. ischaemum (at Big Flats), Setaria viridis(L.) P. Beauv. and Poa annua L. (at Musgrave); the annualdicots Stellaria media (at Musgrave), Galinsoga ciliata (Raf.)Blake, C. album, Veronica peregrina L. and Amaranthusretroflexus L. (at Rogers); and the perennial dicots T. offic-inale and Plantago major L. (at Big Flats), Oxalis stricta (atMusgrave), T. repens and T. hybridum L. (at Rogers). Inter-estingly, the congeners D. sanguinalis and D. ischaemumshowed different emergence periodicities. At the Big Flatssite, D. sanguinalis occurred only in late April-early May,whereas D. ischaemum exhibited protracted, season-longemergence. At Rogers, D. sanguinalis was associated withearly tillage dates (in late April) whereas D. ischaemum wasassociated with later tillage dates (in late August).
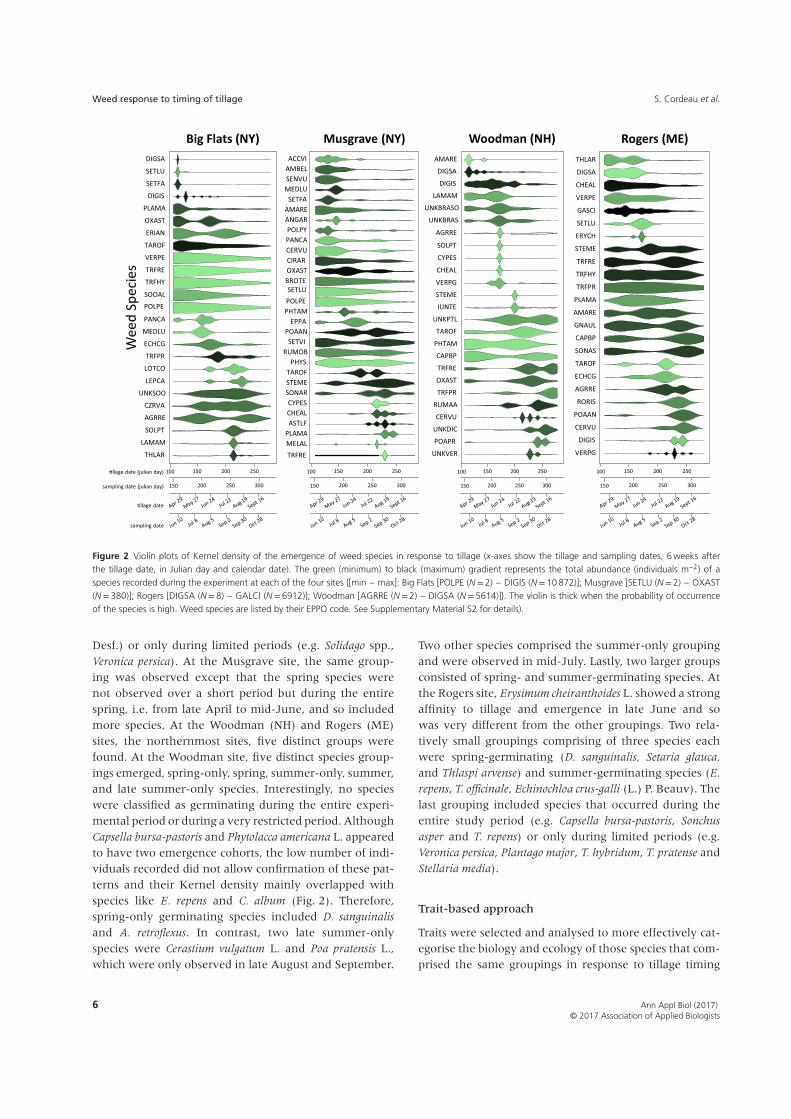
The abundance of weed species at each of the tillagetimes allows for a better understanding of observed weed
community changes and the degree to which they areshaped by these disturbance timings (Fig. 2). The violinplots of each species depict the probability of occurrence6 weeks after each tillage operation. For instance, at theBig Flats site, Lamium amplexicaule L. showed very similarpatterns to Thlaspi arvense L., as did Lotus corniculatus L.and Lepidium campestre (L.) R.Br. or Veronica persica Poir.and T. repens. At the Musgrave site, Ambrosia artemisiifolia
L. showed emergence patterns similar to those of A.
retroflexus. Exploring emergence periodicity with violinplots (density curve) instead of box plots (quartile values,median) allowed the visualisation of emergence peaks.Indeed, at the Big Flats site, mean emergence timingwas the same for Elytrigia repens (L.) Desv. ex Nevski andSecurigera varia (L.) Lassen. In contrast, E. repens had twoemergence peaks whereas Securigera varia did not showthe two peaks. At the Rogers site, Capsella bursa-pastoris
(L.) Medik. and A. retroflexus had similar mean emergencetimings but using violin plots (Fig. 2) we demonstratedthat A. retroflexus emerged mainly in July–August whenC. bursa-pastoris showed two separate emergence peaks.The high total abundance obtained for some speciesresulted in violin plots that were very accurate. Thisaccuracy helped to distinguish emergence periodicitypatterns of species that occurred closely in time, suchas Plantago major L., Cyperus esculentus L., Symphyotrichum
lateriflorum (L.) Á.Löve & D.Löve, C. album and Silene
latifolia Poir. at the Musgrave site. These six species wereobserved during a short 6-week period but exhibited aunique emergence trend.
Overlap of emergence periodicity patterns
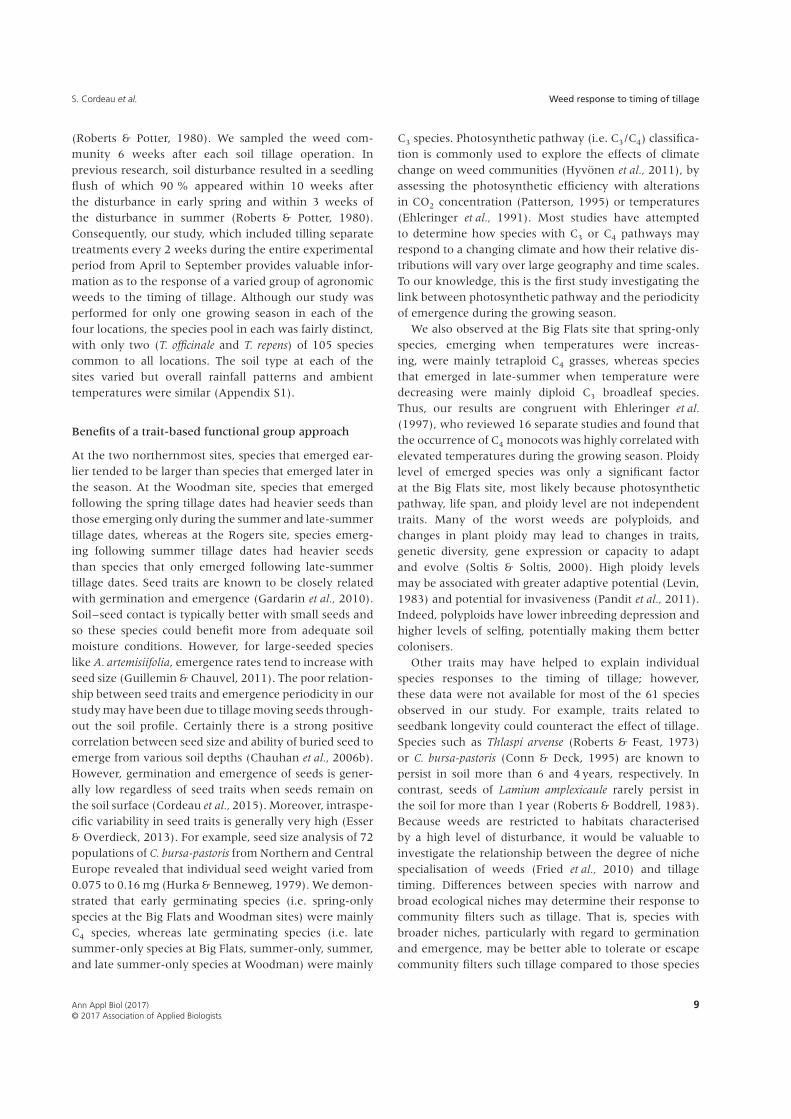
The overlapping responses between species at each loca-tion were analysed with a hierarchical classification anal-ysis performed on the distance matrix of overlap (Fig. 3).Dendrograms revealed that some species occurred exactlyat the same tillage timings (D=0) including Veronica per-
sica, T. repens, T. hybridum, Polygonum persicaria L. and Sol-
idago canadensis at the Big Flats site. Distinct groups ofspecies showed high overlap in their emergence periodsand thus in their response to the timing of tillage (Fig. 3).
In New York (Big Flats and Musgrave sites, the south-ernmost sites), three groups of species were observed. Atthe Big Flats site, the spring-only germinating groupingwas comprised of three annual grasses, D. sanguinalis andtwo Setaria species. These species were observed only dur-ing the first tillage date in late April, with some of thespecies having high abundance. The late summer-onlygerminating group included eight species that germinatedover a 1-month period in August and early September.The third group included species that occurred duringthe entire sampling period (E. repens, Erigeron annuus (L.)
Ann Appl Biol (2017) 5© 2017 Association of Applied Biologists
Weed response to timing of tillage S. Cordeau et al.
Figure 2 Violin plots of Kernel density of the emergence of weed species in response to tillage (x-axes show the tillage and sampling dates, 6 weeks afterthe tillage date, in Julian day and calendar date). The green (minimum) to black (maximum) gradient represents the total abundance (individuals m−2) of aspecies recorded during the experiment at each of the four sites {[min – max]: Big Flats [POLPE (N=2) – DIGIS (N=10 872)]; Musgrave [SETLU (N=2) – OXAST(N=380)]; Rogers [DIGSA (N=8) – GALCI (N=6912)]; Woodman [AGRRE (N=2) – DIGSA (N=5614)]}. The violin is thick when the probability of occurrenceof the species is high. Weed species are listed by their EPPO code. See Supplementary Material S2 for details).
Desf.) or only during limited periods (e.g. Solidago spp.,Veronica persica). At the Musgrave site, the same group-ing was observed except that the spring species werenot observed over a short period but during the entirespring, i.e. from late April to mid-June, and so includedmore species. At the Woodman (NH) and Rogers (ME)sites, the northernmost sites, five distinct groups werefound. At the Woodman site, five distinct species group-ings emerged, spring-only, spring, summer-only, summer,and late summer-only species. Interestingly, no specieswere classified as germinating during the entire experi-mental period or during a very restricted period. AlthoughCapsella bursa-pastoris and Phytolacca americana L. appearedto have two emergence cohorts, the low number of indi-viduals recorded did not allow confirmation of these pat-terns and their Kernel density mainly overlapped withspecies like E. repens and C. album (Fig. 2). Therefore,spring-only germinating species included D. sanguinalis
and A. retroflexus. In contrast, two late summer-onlyspecies were Cerastium vulgatum L. and Poa pratensis L.,which were only observed in late August and September.
Two other species comprised the summer-only groupingand were observed in mid-July. Lastly, two larger groupsconsisted of spring- and summer-germinating species. Atthe Rogers site, Erysimum cheiranthoides L. showed a strongaffinity to tillage and emergence in late June and sowas very different from the other groupings. Two rela-tively small groupings comprising of three species eachwere spring-germinating (D. sanguinalis, Setaria glauca,
and Thlaspi arvense) and summer-germinating species (E.
repens, T. officinale, Echinochloa crus-galli (L.) P. Beauv). Thelast grouping included species that occurred during theentire study period (e.g. Capsella bursa-pastoris, Sonchus
asper and T. repens) or only during limited periods (e.g.Veronica persica, Plantago major, T. hybridum, T. pratense andStellaria media).
Trait-based approach
Traits were selected and analysed to more effectively cat-egorise the biology and ecology of those species that com-prised the same groupings in response to tillage timing
6 Ann Appl Biol (2017)© 2017 Association of Applied Biologists

S. Cordeau et al. Weed response to timing of tillage
Figure 3 Dendrograms of the distance in overlap (y-axis) of the kernel distribution of the weed species emergence periods at the four experimental sites overtime. Weed species are named by their EPPO code (See Supplementary Material S2 for details). Species were grouped (colours) by cutting the dendrograms(dashed red line). Spring-only, summer-only and late summer-only refer to species emerging only (100% of the emergence) at one or two particular timings inspring, summer and late-summer respectively, whereas spring and summer refer to species emerging mainly (i.e. peak of emergence) but not exclusively duringthese periods.
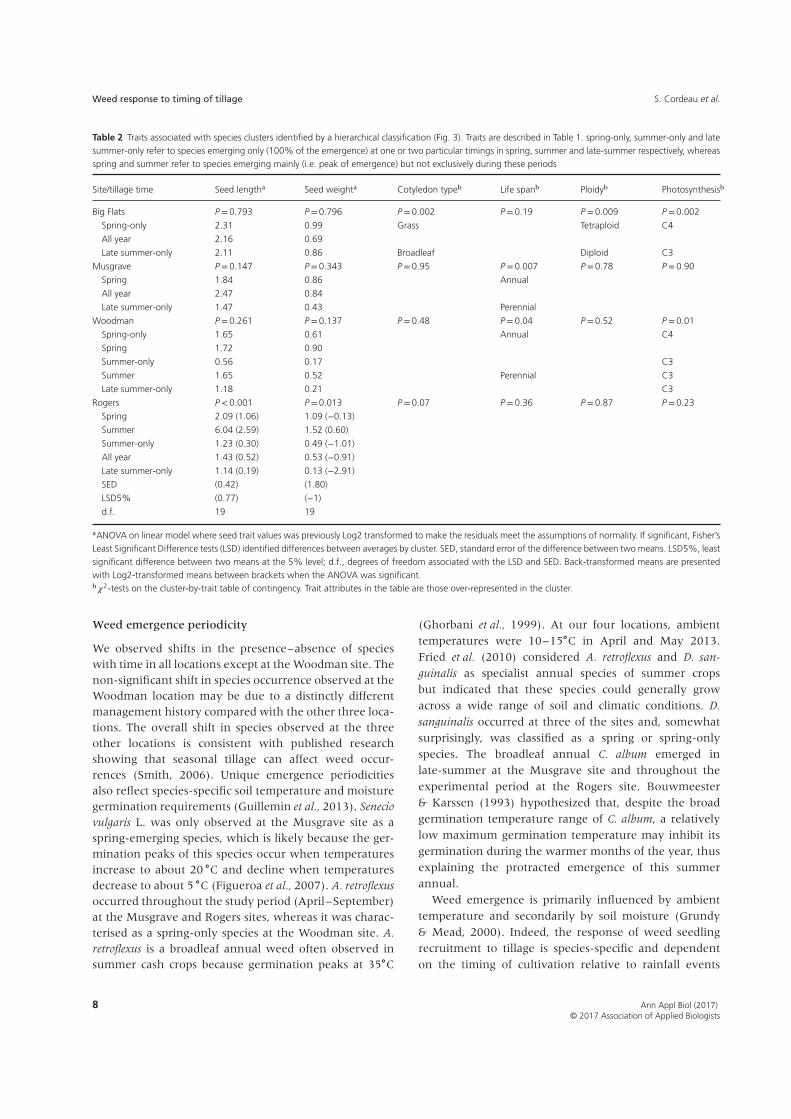
(Table 2). Based on the overall trait database, categor-ical traits were independent [𝜒2 tests: Life span/ploidy(P=0.13); life span/photosynthesis (P=0.09); photosyn-thesis/ploidy (P=0.08)]. At the Big Flats site, seed traitsdid not differ between groups. Species only emergingfollowing spring tillage times were mainly tetraploid,C4 grasses, whereas species that emerged only afterlate-summer tillage times were mainly diploid, C3 dicots.Based only on species presence at the Big Flats site, cat-egorical traits were dependent (𝜒2 tests: Life span/ploidy(P=0.39); life span/photosynthesis (P=0.03); photosyn-thesis/ploidy (P=0.02)). That is, the C3 species presentwere all perennials and all diploids. At the Musgravesite, life span was the only useful trait in describing thespecies groupings. Spring species were primarily annu-als whereas late summer-only species were perennial. Atthe Woodman site, spring species had larger and heav-ier seeds than late summer-only species. In addition,
spring-only species were mainly C4 annuals whereassummer species were C3 perennials. All summer groups(i.e. summer, summer-only, late summer-only) weremainly comprised of C3 species. At the Rogers site, sum-mer species had longer seeds than the other groups,and seeds of the spring species and summer specieswere heavier seeds of the late summer-only species(Table 2).
Discussion
Our study identified responses of 61 weed species to thetiming of tillage across the northeastern USA. Some ofthese species are considered major agronomic weeds inmaize and soybean cropping systems, including Abutilontheophrasti Medik., Setaria faberi, S. viridis, S. pumila, A.artemisiifolia, Amaranthus spp. and C. album (Forcella et al.,1997).
Ann Appl Biol (2017) 7© 2017 Association of Applied Biologists
Weed response to timing of tillage S. Cordeau et al.
Table 2 Traits associated with species clusters identified by a hierarchical classification (Fig. 3). Traits are described in Table 1. spring-only, summer-only and latesummer-only refer to species emerging only (100% of the emergence) at one or two particular timings in spring, summer and late-summer respectively, whereasspring and summer refer to species emerging mainly (i.e. peak of emergence) but not exclusively during these periods
Site/tillage time Seed lengtha Seed weighta Cotyledon typeb Life spanb Ploidyb Photosynthesisb
Big Flats P =0.793 P =0.796 P =0.002 P =0.19 P =0.009 P =0.002
Spring-only 2.31 0.99 Grass Tetraploid C4
All year 2.16 0.69
Late summer-only 2.11 0.86 Broadleaf Diploid C3
Musgrave P =0.147 P =0.343 P =0.95 P =0.007 P =0.78 P =0.90
Spring 1.84 0.86 Annual
All year 2.47 0.84
Late summer-only 1.47 0.43 Perennial
Woodman P =0.261 P =0.137 P =0.48 P =0.04 P =0.52 P =0.01
Spring-only 1.65 0.61 Annual C4
Spring 1.72 0.90
Summer-only 0.56 0.17 C3
Summer 1.65 0.52 Perennial C3
Late summer-only 1.18 0.21 C3
Rogers P <0.001 P =0.013 P =0.07 P =0.36 P =0.87 P =0.23
Spring 2.09 (1.06) 1.09 (−0.13)
Summer 6.04 (2.59) 1.52 (0.60)
Summer-only 1.23 (0.30) 0.49 (−1.01)
All year 1.43 (0.52) 0.53 (−0.91)
Late summer-only 1.14 (0.19) 0.13 (−2.91)
SED (0.42) (1.80)
LSD5% (0.77) (−1)
d.f. 19 19
aANOVA on linear model where seed trait values was previously Log2 transformed to make the residuals meet the assumptions of normality. If significant, Fisher’sLeast Significant Difference tests (LSD) identified differences between averages by cluster. SED, standard error of the difference between two means. LSD5%, leastsignificant difference between two means at the 5% level; d.f., degrees of freedom associated with the LSD and SED. Back-transformed means are presentedwith Log2-transformed means between brackets when the ANOVA was significant.b𝜒2-tests on the cluster-by-trait table of contingency. Trait attributes in the table are those over-represented in the cluster.
Weed emergence periodicity
We observed shifts in the presence–absence of specieswith time in all locations except at the Woodman site. Thenon-significant shift in species occurrence observed at theWoodman location may be due to a distinctly differentmanagement history compared with the other three loca-tions. The overall shift in species observed at the threeother locations is consistent with published researchshowing that seasonal tillage can affect weed occur-rences (Smith, 2006). Unique emergence periodicitiesalso reflect species-specific soil temperature and moisturegermination requirements (Guillemin et al., 2013). Seneciovulgaris L. was only observed at the Musgrave site as aspring-emerging species, which is likely because the ger-mination peaks of this species occur when temperaturesincrease to about 20 ∘C and decline when temperaturesdecrease to about 5 ∘C (Figueroa et al., 2007). A. retroflexusoccurred throughout the study period (April–September)at the Musgrave and Rogers sites, whereas it was charac-terised as a spring-only species at the Woodman site. A.retroflexus is a broadleaf annual weed often observed insummer cash crops because germination peaks at 35∘C
(Ghorbani et al., 1999). At our four locations, ambienttemperatures were 10–15∘C in April and May 2013.Fried et al. (2010) considered A. retroflexus and D. san-
guinalis as specialist annual species of summer cropsbut indicated that these species could generally growacross a wide range of soil and climatic conditions. D.
sanguinalis occurred at three of the sites and, somewhatsurprisingly, was classified as a spring or spring-onlyspecies. The broadleaf annual C. album emerged inlate-summer at the Musgrave site and throughout theexperimental period at the Rogers site. Bouwmeester& Karssen (1993) hypothesized that, despite the broadgermination temperature range of C. album, a relativelylow maximum germination temperature may inhibit itsgermination during the warmer months of the year, thusexplaining the protracted emergence of this summerannual.
Weed emergence is primarily influenced by ambienttemperature and secondarily by soil moisture (Grundy& Mead, 2000). Indeed, the response of weed seedlingrecruitment to tillage is species-specific and dependenton the timing of cultivation relative to rainfall events
8 Ann Appl Biol (2017)© 2017 Association of Applied Biologists
S. Cordeau et al. Weed response to timing of tillage
(Roberts & Potter, 1980). We sampled the weed com-munity 6 weeks after each soil tillage operation. Inprevious research, soil disturbance resulted in a seedlingflush of which 90 % appeared within 10 weeks afterthe disturbance in early spring and within 3 weeks ofthe disturbance in summer (Roberts & Potter, 1980).Consequently, our study, which included tilling separatetreatments every 2 weeks during the entire experimentalperiod from April to September provides valuable infor-mation as to the response of a varied group of agronomicweeds to the timing of tillage. Although our study wasperformed for only one growing season in each of thefour locations, the species pool in each was fairly distinct,with only two (T. officinale and T. repens) of 105 speciescommon to all locations. The soil type at each of thesites varied but overall rainfall patterns and ambienttemperatures were similar (Appendix S1).
Benefits of a trait-based functional group approach
At the two northernmost sites, species that emerged ear-lier tended to be larger than species that emerged later inthe season. At the Woodman site, species that emergedfollowing the spring tillage dates had heavier seeds thanthose emerging only during the summer and late-summertillage dates, whereas at the Rogers site, species emerg-ing following summer tillage dates had heavier seedsthan species that only emerged following late-summertillage dates. Seed traits are known to be closely relatedwith germination and emergence (Gardarin et al., 2010).Soil–seed contact is typically better with small seeds andso these species could benefit more from adequate soilmoisture conditions. However, for large-seeded specieslike A. artemisiifolia, emergence rates tend to increase withseed size (Guillemin & Chauvel, 2011). The poor relation-ship between seed traits and emergence periodicity in ourstudy may have been due to tillage moving seeds through-out the soil profile. Certainly there is a strong positivecorrelation between seed size and ability of buried seed toemerge from various soil depths (Chauhan et al., 2006b).However, germination and emergence of seeds is gener-ally low regardless of seed traits when seeds remain onthe soil surface (Cordeau et al., 2015). Moreover, intraspe-cific variability in seed traits is generally very high (Esser& Overdieck, 2013). For example, seed size analysis of 72populations of C. bursa-pastoris from Northern and CentralEurope revealed that individual seed weight varied from0.075 to 0.16 mg (Hurka & Benneweg, 1979). We demon-strated that early germinating species (i.e. spring-onlyspecies at the Big Flats and Woodman sites) were mainlyC4 species, whereas late germinating species (i.e. latesummer-only species at Big Flats, summer-only, summer,and late summer-only species at Woodman) were mainly
C3 species. Photosynthetic pathway (i.e. C3/C4) classifica-tion is commonly used to explore the effects of climatechange on weed communities (Hyvönen et al., 2011), byassessing the photosynthetic efficiency with alterationsin CO2 concentration (Patterson, 1995) or temperatures(Ehleringer et al., 1991). Most studies have attemptedto determine how species with C3 or C4 pathways mayrespond to a changing climate and how their relative dis-tributions will vary over large geography and time scales.To our knowledge, this is the first study investigating thelink between photosynthetic pathway and the periodicityof emergence during the growing season.
We also observed at the Big Flats site that spring-onlyspecies, emerging when temperatures were increas-ing, were mainly tetraploid C4 grasses, whereas speciesthat emerged in late-summer when temperature weredecreasing were mainly diploid C3 broadleaf species.Thus, our results are congruent with Ehleringer et al.(1997), who reviewed 16 separate studies and found thatthe occurrence of C4 monocots was highly correlated withelevated temperatures during the growing season. Ploidylevel of emerged species was only a significant factorat the Big Flats site, most likely because photosyntheticpathway, life span, and ploidy level are not independenttraits. Many of the worst weeds are polyploids, andchanges in plant ploidy may lead to changes in traits,genetic diversity, gene expression or capacity to adaptand evolve (Soltis & Soltis, 2000). High ploidy levelsmay be associated with greater adaptive potential (Levin,1983) and potential for invasiveness (Pandit et al., 2011).Indeed, polyploids have lower inbreeding depression andhigher levels of selfing, potentially making them bettercolonisers.
Other traits may have helped to explain individualspecies responses to the timing of tillage; however,these data were not available for most of the 61 speciesobserved in our study. For example, traits related toseedbank longevity could counteract the effect of tillage.Species such as Thlaspi arvense (Roberts & Feast, 1973)or C. bursa-pastoris (Conn & Deck, 1995) are known topersist in soil more than 6 and 4 years, respectively. Incontrast, seeds of Lamium amplexicaule rarely persist inthe soil for more than 1 year (Roberts & Boddrell, 1983).Because weeds are restricted to habitats characterisedby a high level of disturbance, it would be valuable toinvestigate the relationship between the degree of nichespecialisation of weeds (Fried et al., 2010) and tillagetiming. Differences between species with narrow andbroad ecological niches may determine their response tocommunity filters such as tillage. That is, species withbroader niches, particularly with regard to germinationand emergence, may be better able to tolerate or escapecommunity filters such tillage compared to those species
Ann Appl Biol (2017) 9© 2017 Association of Applied Biologists
Weed response to timing of tillage S. Cordeau et al.
with relatively narrow ecological niches. Similarly, theseasonal emergence patterns of weeds often closely reflecttheir affinity to the timing of planting of specific crops.Consequently, spring–summer-emerging species shouldexhibit a high affinity for summer cash crops like maize(Vidotto et al., 2016), soybean or sunflower (Fried et al.,
2009) whereas, late-summer or early-winter emergingspecies should show high affinity for fall-sown crops suchas oilseed rape (Smith, 2006; Fried et al., 2015) or wintercereals.
Using this knowledge for integrated weedmanagement
The importance of predicting weed emergence has beenrecognised for many years and several studies have beenconducted to model weed emergence (Myers et al., 2004).The use of such models to guide weed managementdecisions can reduce herbicide use and weed control costscompared with standard management practices (Forcellaet al., 2000). In maize and soybean cropping systems, thetiming of weed control is particularly important becausethe efficacy of post-emergence herbicide control can bedependent on the composition and growth stage of theweed community.
The violin weed emergence plots we developed basedon kernel distributions of weed emergence over timecould be used as an extension tool. Farmers and extensioneducators could use this type of information to select thebest timing for mechanical or chemical control (Masinet al., 2011). Data such as these could help farmers betteranticipate which species are likely to emerge based on thetiming of their tillage operations (Masin et al., 2014).
We demonstrated that timing of soil disturbance is amajor driver of weed emergence patterns. Previous stud-ies have demonstrated that weed species may responddifferently to tillage. If the tillage regime is altered, i.e.moving from inversion to non-inversion tillage, the weedcommunity will respond accordingly. The emergence ofLolium rigidum Gaudin, Galium tricornutum Dandy andRaphanus raphanistrum L. seedlings is known to be higherunder minimum tillage than under no-till (Chauhan et al.,
2006b). In contrast, seedling emergence of Sonchus oler-
acea L., Vulpia bromoides (L.) Grey, Malva parviflora andRapistrum rugosum (L.) all are known to be higher underno-till systems (Chauhan et al., 2006b). Some species suchas Avena fatua L. are not influenced by the tillage system(Chauhan et al., 2006b).
The timing of primary tillage could be combined withother practices to increase the efficacy of weed man-agement (Hearherly et al., 1990), and these effects arelikely to depend on the conditions of the soil. Underwet conditions, seedbed preparation can sometimes be
delayed, particularly in clay soils, and this may influencethe composition and abundance of the weed community(Hearherly et al., 1990). Consequently, our study providesvaluable information as to the type and abundance ofweeds that may emerge if tillage is delayed and this may,in turn, influence in-crop mechanical and herbicidalcontrol of weeds (Buhler & Gunsolus, 1996).
Long-term management implies that the soil-seedbankbe targeted since seeds of many agricultural weed speciesare long-lived in soil. Two mechanical approaches that canreduce the weed seedbank include tillage prior to plant-ing (Pekrun & Claupein, 2006) and use of a stale seedbed(Rasmussen, 2004; Schutte et al., 2014). These practicesstimulate germination of weed seeds, and kill the result-ing seedlings thus decreasing seed levels in the soil. How-ever, since we demonstrated in this study that weeds canemerge late in the season or have prolonged germinationwindows, additional seedling emergence can be expectedfollowing crop planting especially after soil disturbanceevents such as cultivation (Schutte et al., 2014).
Conclusions
This study assessed the individual response of 61 species tothe timing of tillage in four locations across the northeast-ern USA. We found that even with different species pools,similar weed response patterns were observed across thelocations. We identified weed clusters that responded sim-ilarly to the timing of tillage using calculated overlap ratesof emergence kernel densities of weeds. Weed communityassembly theory was used to identify traits and combina-tions of traits of species responsive to the timing of tillage.Spring-emerging species that responded to increasingambient temperatures tended to be C4 tetraploid annualgrasses with large seeds, whereas late-summer-emergingspecies that responded to decreasing ambient tempera-tures tended to be C3 diploid perennial broadleaf specieswith relatively small seed sizes. Our findings could helpguide farmers better anticipate how particular types ofweeds are likely to respond to the timing of major soil dis-turbances such as tillage. In terms of managing particularspecies, additional research is needed to understand if thepatterns that we observed are consistent over time andto what extent such information can be used to improvemanagement.
Acknowledgements
This work was supported by a joint research and exten-sion project funded by the Cornell University AgriculturalExperiment Station (Hatch funds) and Cornell Cooper-ative Extension (Smith Lever funds) received from theNational Institute of Food and Agriculture (NIFA) U.S.
10 Ann Appl Biol (2017)© 2017 Association of Applied Biologists
S. Cordeau et al. Weed response to timing of tillage
Department of Agriculture (Project: 2013–14-425). This
work was also supported by the Maine Agriculture
and Forestry Experiment Station, French ANR COSAC
(ANR-14-CE18–0007), the Burgundy Region in France
(FABER project Couv’Herbi). The authors acknowledge
field assistance from Paul Stachowski, Scott Morris,
Meredith Ward, Christopher Pelzer, Kristine Averill and
Nicholas Warren. The authors thank David A. Mortensen
(The Pennsylvania State University, University Park, PA,
USA) for input on the experimental design and Fab-
rice Dessaint and Benoit Ricci (INRA, UMR1347 Agro-
écologie, Dijon, France) for valuable discussions on data
analysis. The authors also acknowledge the anonymous
reviewers and the statistical editor for their feedback that
helped to improve the quality of the manuscript.
References
Bàrberi P., Lo Cascio B. (2001) Long-term tillage and crop
rotation effects on weed seedbank size and composition.
Weed Research, 41, 325–340.
Basinger M.A., Robertson P.A. (1997) Vascular flora of an
old-growth forest remnant in the Ozark hills of south-
ern Illinois – updated results. Transactions of the Illinois State
Academy of Science, 90, 1–20.
Bocci G. (2015) TR8: an R package for easily retrieving plant
species traits. Methods in Ecology and Evolution, 6, 347–350.
Booth B.D., Swanton C.J. (2002) Assembly theory applied to
weed communities. Weed Science, 50, 2–13.
Bouwmeester H.J., Karssen C.M. (1993) Seasonal periodicity
in germination of seeds of Chenopodium album L. Annals of
Botany, 72, 463–473.
Brower J.C., Kyle K.M. (1988) Seriation of an original data
matrix as applied to palaeoecology. Lethaia, 21, 79–93.
Buhler D.D., Gunsolus J.L. (1996) Effect of date of preplant
tillage and planting on weed populations and mechanical
weed control in soybean (Glycine max). Weed Science, 44,
373–379.
Chauhan B.S., Gill G., Preston C. (2006a) Influence of tillage
systems on vertical distribution, seedling recruitment and
persistence of rigid ryegrass (Lolium rigidum) seed bank.
Weed Science, 54, 669–676.
Chauhan B.S., Gill G., Preston C. (2006b) Seedling recruit-
ment pattern and depth of recruitment of 10 weed species
in minimum tillage and no-till seeding systems. Weed Sci-
ence, 54, 658–668.
Conn J.S., Deck R.E. (1995) Seed viability and dormancy of
17 weed species after 9.7 years of burial in Alaska. Weed
Science, 43, 583–585.
Cordeau S., Guillemin J.-P., Reibel C., Chauvel B. (2015)
Weed species differ in their ability to emerge in no-till
systems that include cover crops. Annals of Applied Biology,
166, 444–455.
Crawley M. (2004) Timing of disturbance and coexistence
in a species-rich ruderal plant community. Ecology, 8,
3277–3288.
Ehleringer J.R., Sage R.F., Flanagan L.B., Pearcy R.W. (1991)
Climate change and the evolution of C4 photosynthesis.
Trends in Ecology & Evolution, 6, 95–99.
Ehleringer R.J., Cerling E.T., Helliker R.B. (1997) C4 pho-
tosynthesis, atmospheric CO2, and climate. Oecologia, 112,
285–299.
Esser G., Overdieck D. (2013) Modern Ecology: Basic and
Applied Aspects. Amsterdam, Netherlands: Elsevier.
Figueroa R., Doohan D., Cardina J., Harrison K. (2007)
Common groundsel (Senecio vulgaris) seed longevity and
seedling emergence. Weed Science, 55, 187–192.
Forcella F., Wilson R.G., Dekker J., Kremer R.J., Cardina J.,
Anderson R.L., Alm D., Renner K.A., Harvey R.G., Clay S.,
Buhler D.D. (1997) Weed seed bank emergence across the
Corn Belt. Weed Science, 45, 67–76.
Forcella F., Arnold R.L.B., Sanchez R., Ghersa C.M. (2000)
Modeling seedling emergence. Field Crops Research, 67,
123–139.
Fox J., Weisberg S. (2011) An {R} Companion to Applied Regres-
sion. 2nd edn. Thousand Oaks, CA, USA: Sage URL http://
socserv.socsci.mcmaster.ca/jfox/Books/Companion.
Fried G., Norton L.R., Reboud X. (2008) Environmental and
management factors determining weed species composi-
tion and diversity in France. Agriculture, Ecosystems and Envi-
ronment, 128, 68–76.
Fried G., Chauvel B., Reboud X. (2009) A functional analysis
of large-scale temporal shifts from 1970 to 2000 in weed
assemblages of sunflower crops in France. Journal of Vege-
tation Science, 20, 49–58.
Fried G., Petit S., Reboud X. (2010) A specialist-generalist
classification of the arable flora and its response to changes
in agricultural practices. BMC Ecology, 10, 20.
Fried G., Chauvel B., Reboud X. (2015) Weed flora shifts
and specialisation in winter oilseed rape in France. Weed
Research, 55, 514–524.
Fuhrer J. (2003) Agroecosystem responses to combinations
of elevated CO2, ozone, and global climate change. Agricul-
ture, Ecosystems & Environment, 97, 1–20.
Gardarin A., Dürr C., Colbach N. (2010) Effects of seed
depth and soil aggregates on the emergence of weeds with
contrasting seed traits. Weed Research, 50, 91–101.
Ghorbani R., Seel W., Leifert C. (1999) Effects of environ-
mental factors on germination and emergence of Amaran-
thus retroflexus. Weed Science, 47, 505–510.
Grundy A.C., Mead A. (2000) Modelling weed emergence
as a function of meteorological records. Weed Science, 48,
594–603.
Guillemin J.-P., Chauvel B. (2011) Effects of the seed weight
and burial depth on the seed behavior of common ragweed
(Ambrosia artemisiifolia). Weed Biology and Management, 11,
217–223.
Ann Appl Biol (2017) 11© 2017 Association of Applied Biologists
Weed response to timing of tillage S. Cordeau et al.
Guillemin J.P., Gardarin A., Granger S., Reibel C.,
Munier-Jolain N., Colbach N. (2013) Assessing poten-
tial germination period of weeds with base temperatures
and base water potentials. Weed Research, 53, 76–87.
Hammer Ø., Harper D.A.T., Ryan P.D. (2001) PAST: paleon-
tological statistics software package for education and data
analysis. Palaeontologia Electronica, 4, 1–9.
Hearherly L., Elmore C., Wesley R. (1990) Weed control and
soybean response to preplant tillage and planting time. Soil
and Tillage Research, 17, 199–210.
Hurka H., Benneweg M. (1979) Patterns of seed size vari-
ations in populations of the common weed Capsella
bursa-pastoris (Brassicaceae). Biologisches Zentralblatt, 98,
699–709.
Hyvönen T., Glemnitz M., Radics L., Hoffmann J. (2011)
Impact of climate and land use type on the distribution of
Finnish casual arable weeds in Europe. Weed Research, 51,
201–208.
Keddy P.A. (1992) Assembly and response rules: two goals for
predictive community ecology. Journal of Vegetation Science,
3, 157–164.
Kleyer M., Bekker R., Knevel I., Bakker J., Thompson K.,
Sonnenschein M., Poschlod P., Van Groenendael J., Klimeš
L., Klimešová J. (2008) The LEDA Traitbase: a database of
life-history traits of the northwest European flora. Journal
of Ecology, 96, 1266–1274.
Klotz S., Kühn I., Durka W. (2002) BIOLFLOR - Eine
Datenbank zu biologisch-ökologischen Merkmalen der
Gefäßpflanzen in Deutschland. Schriftenreihe für Vegeta-
tionskunde, 38 - Bonn: Bundesamt für Naturschutz.
Kühn I., Durka W., Klotz S. (2004) BiolFlor – a new
plant-trait database as a tool for plant invasion ecology.
Diversity and Distributions, 10, 363–365.
Levin D.A. (1983) Polyploidy and novelty in flowering
plants. The American Naturalist, 122, 1–25.
Masin R., Vasileiadis V.P., Loddo D., Otto S., Zanin G. (2011)
A single-time survey method to predict the daily weed
density for weed control decision-making. Weed Science, 59,
270–275.
Masin R., Loddo D., Gasparini V., Otto S., Zanin G. (2014)
Evaluation of weed emergence model AlertInf for maize in
soybean. Weed Science, 62, 360–369.
Meyer D., Achim Z. A., Hornik K. (2015) vcd: Visualizing
Categorical Data. R package version 1.4-1.
Mortensen D.A., Bastiaans L., Sattin M. (2000) The role of
ecology in the development of weed management systems:
an outlook. Weed Research, 40, 49–62.
Myers M.W., Curran W.S., VanGessel M.J., Calvin D.D.,
Mortensen D.A., Majek B.A., Karsten H.D., Roth G.W.
(2004) Predicting weed emergence for eight annual
species in the northeastern United States. Weed Science, 52,
913–919.
Oksanen J., Blanchet F.G., Kindt R., Legendre P., O’Hara
R.B., Simpson G.L., Solymos P., Stevens M.H.H., Wagner H.
(2010) Vegan: Community Ecology Package. In R package
version 1.17-2.
Owen M.D. (2008) Weed species shifts in
glyphosate-resistant crops. Pest Management Science, 64,
377–387.
Pandit M.K., Pocock M.J., Kunin W.E. (2011) Ploidy influ-
ences rarity and invasiveness in plants. Journal of Ecology,
99, 1108–1115.
Patterson D.T. (1995) Weeds in a changing climate. Weed
Science, 43, 685–701.
Pekrun C., Claupein W. (2006) The implication of stubble
tillage for weed population dynamics in organic farming.
Weed Research, 46, 414–423.
Petit S., Munier-Jolain N., Bretagnolle V., Bockstaller C.,
Gaba S., Cordeau S., Lechenet M., Mézière D., Colbach N.
(2015) Ecological intensification through pesticide reduc-
tion: weed control, weed biodiversity and sustainability in
arable farming. Environmental Management, 56, 1078–1090.
R Core Team (2015) R: A Language and Environment for Statisti-
cal Computing. Vienna, Austria: R Foundation for Statistical
Computing.
Rasmussen I.A. (2004) The effect of sowing date, stale
seedbed, row width and mechanical weed control on
weeds and yields of organic winter wheat. Weed Research,
44, 12–20.
Ridout M.S., Linkie M. (2009) Estimating overlap of daily
activity patterns from camera trap data. Journal of Agricul-
tural, Biological, and Environmental Statistics, 14, 322–337.
Roberts H.A., Boddrell J.E. (1983) Seed survival and period-
icity of seedling emergence in ten species of annual weeds.
Annals of Applied Biology, 102, 523–532.
Roberts H.A., Feast P.M. (1973) Emergence and longevity of
seeds of annual weeds in cultivated and undisturbed soil.
Journal of Applied Ecology, 10, 133–143.
Roberts H.A., Potter M.E. (1980) Emergence patterns of
weed seedlings in relation to cultivation and rainfall. Weed
Research, 20, 377–386.
Royal Botanic Gardens Kew (2016) Seed Information Database
(SID), Version 7.1. URL http://data.kew.org/sid/ (February
2016).
Ryan M.R., Smith R.G., Mirsky S.B., Mortensen D.A., Seidel
R. (2010) Management filters and species traits: weed com-
munity assembly in long-term organic and conventional
systems. Weed Science, 58, 265–277.
Schutte B.J., Tomasek B.J., Davis A.S., Andersson L., Benoit
D.L., Cirujeda A., Dekker J., Forcella F., Gonzalez-Andujar
J.L., Graziani F., Murdoch A.J., Neve P., Rasmussen I.A.,
Sera B., Salonen J., Tei F., Tørresen K.S., Urbano J.M.
(2014) An investigation to enhance understanding of the
stimulation of weed seedling emergence by soil distur-
bance. Weed Research, 54, 1–12.
Sharma M.P. (1983) Effect of fall and spring tillage on
wild oat germination. Canadian Journal of Plant Science, 63,
561–562.
12 Ann Appl Biol (2017)© 2017 Association of Applied Biologists

S. Cordeau et al. Weed response to timing of tillage
Smith R.G. (2006) Timing of tillage is an important filteron the assembly of weed communities. Weed Science, 54,705–712.
Smith R.G., Gross K.L. (2007) Assembly of weed communi-ties along a crop diversity gradient. Journal of Applied Ecol-
ogy, 44, 1046–1056.Soltis P.S., Soltis D.E. (2000) The role of genetic and genomic
attributes in the success of polyploids. Proceedings of the
National Academy of Sciences of the United States of America, 97,7051–7057.
Sosnoskie L.M., Herms N.P., Cardina J. (2006) Weed seed-bank community composition in a 35-yr-old tillage androtation experiment. Weed Science, 54, 263–273.
Stahl L.A.B., Johnson G.A., Wyse D.L., Buhler D.D., Gun-solus J.L. (1999) Effect of tillage on timing of Setaria spp.emergence and growth. Weed Science, 47, 563–570.
Van Acker R. (2009) Weed biology serves practical weedmanagement. Weed Research, 49, 1–5.
Vidotto F., Fogliatto S., Milan M., Ferrero A. (2016)Weed communities in Italian maize fields as affected
by pedo-climatic traits and sowing time. European Journal
of Agronomy, 74, 38–46.de Vries A., Ripley B. (2013) ggdendro: tools for extracting
dendrogram and tree diagram plot data for use with ggplot.URL https://cran.r-project.org/web/packages/ggdendro/.
Wickham H. (2009) ggplot2: Elegant Graphics for Data Analysis.New York, NY, USA: Springer.
Supporting Information
Additional Supporting Information may be found in theonline version of this article:
Appendix S1. Soil and climate conditions of the fourlocations.
Appendix S2. Trait database of the 61 most frequentweed species recorded across the four sites.
Appendix S3. Shift in the presence–absence of weedspecies with the timing of tillage.
Ann Appl Biol (2017) 13© 2017 Association of Applied Biologists