Embed Size (px)
Citation preview
EQuIP RUBRIC FOR SCIENCE EVALUATION
How Does Changing an Ecosystem Affect
What Lives There?
DEVELOPER: OpenSciEd
GRADE: 7 | DATE OF REVIEW: August 2021
Ecosystem Dynamics
2
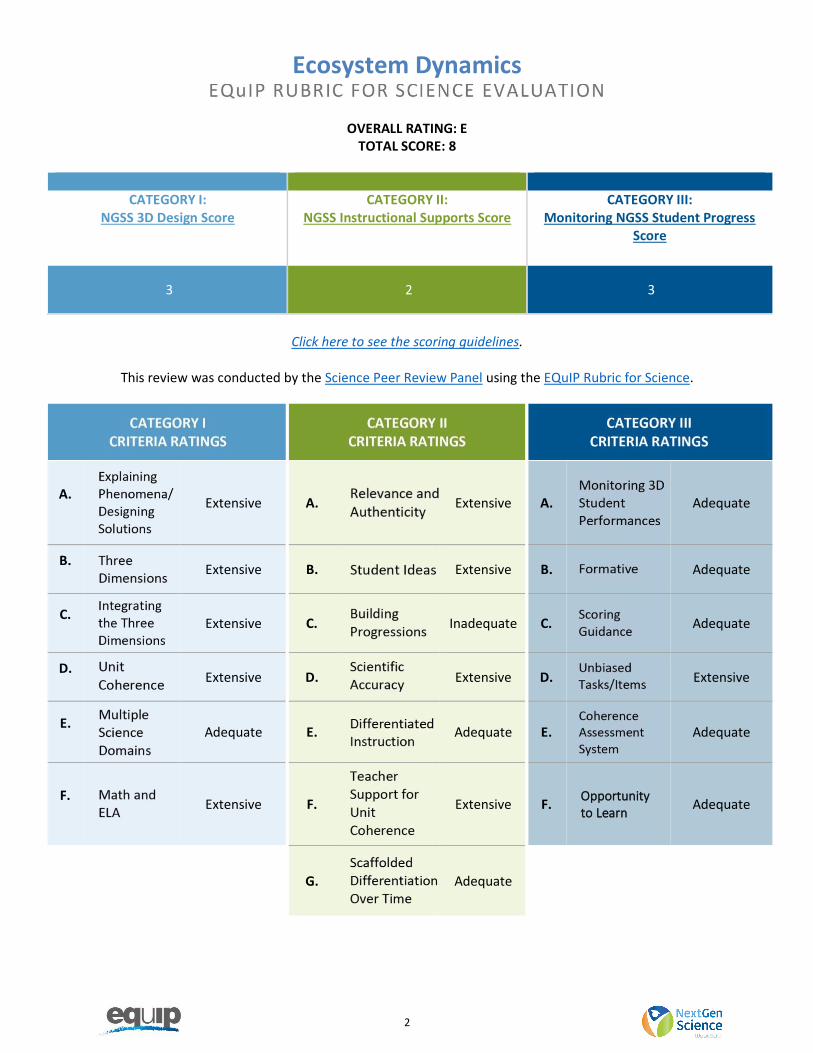
OVERALL RATING: E TOTAL SCORE: 8
CATEGORY I: NGSS 3D Design Score
CATEGORY II: NGSS Instructional Supports Score
CATEGORY III: Monitoring NGSS Student Progress
Score
3 2 3
Click here to see the scoring guidelines.
This review was conducted by the Science Peer Review Panel using the EQuIP Rubric for Science.
A.
Extensive A.
Extensive A.
Adequate
B.
Extensive B.
Extensive B.
Adequate
C.
Extensive C.
Inadequate C.
Adequate
D.
Extensive D.
Extensive D.
Extensive
E.
Adequate E.
Adequate E.
Adequate
F.
Extensive F.
Extensive F. Opportunity to Learn
Adequate
G.
Adequate
Ecosystem Dynamics
3
Summary Comments
Thank you for your commitment to students and their science education. NextGenScience is glad to
partner with you in this continuous improvement process. The unit is strong in several areas, including
engaging students in three-dimensional learning that focuses on a real-world phenomenon/problem. In
addition, students regularly use the Progress Tracker to keep track of their learning throughout the unit
and the targeted DCI, SEP, and CCC elements match closely with lesson activities, tasks, and
assessments. The unit materials also provide detailed explanations for the learning sequence and
provide teacher support for unit coherence. Importantly, attention to equity and cultural concerns is
apparent.
During revisions, the reviewers recommend paying close attention to the following areas:
• Teacher Feedback. Consider including more frequent opportunities throughout the unit for
students to receive written and oral feedback from teachers and use the feedback to improve
their understanding of the phenomenon and problem.
• Building Progressions for CCCs and SEPs. Consider explicitly stating the expected level of prior
proficiency students should have in all the targeted CCCs and SEPs and how the development
will progress throughout the unit. A clear description would be helpful to show how students
are expected to gain independence with the elements of the CCCs and SEPs and how supports
or scaffolds will be reduced over time.
• Grade-level Elements. Consider providing grade-level elements and the portion(s) of the
element being developed or assessed for each of the three dimensions and how student
independence with each element is increasing and scaffolded support is decreasing over time.
• Rubrics Performance Levels. Consider including more rubrics for the formative assessments. For
formative and summative assessments, providing three-dimensional criteria, descriptions of
performance levels, and sample student responses for each performance level would be helpful.
Note that in the feedback below, black text is used for either neutral comments or evidence the
criterion was met, and purple text is used as evidence that doesn’t support a claim that the criterion was
met. The purple text in these review reports is written directly related to criteria and is meant to point
out details that could be possible areas where there is room for improvement. Not all purple text lowers
a score; much of it is too minor to affect the score. For example, even criteria rated as Extensive could
have purple text that is meant to be helpful for continuous improvement processes. In these cases, the
criterion was met. The purple text is simply not part of the argument for that Extensive rating.
Ecosystem Dynamics
4
CATEGORY I
Ecosystem Dynamics
5
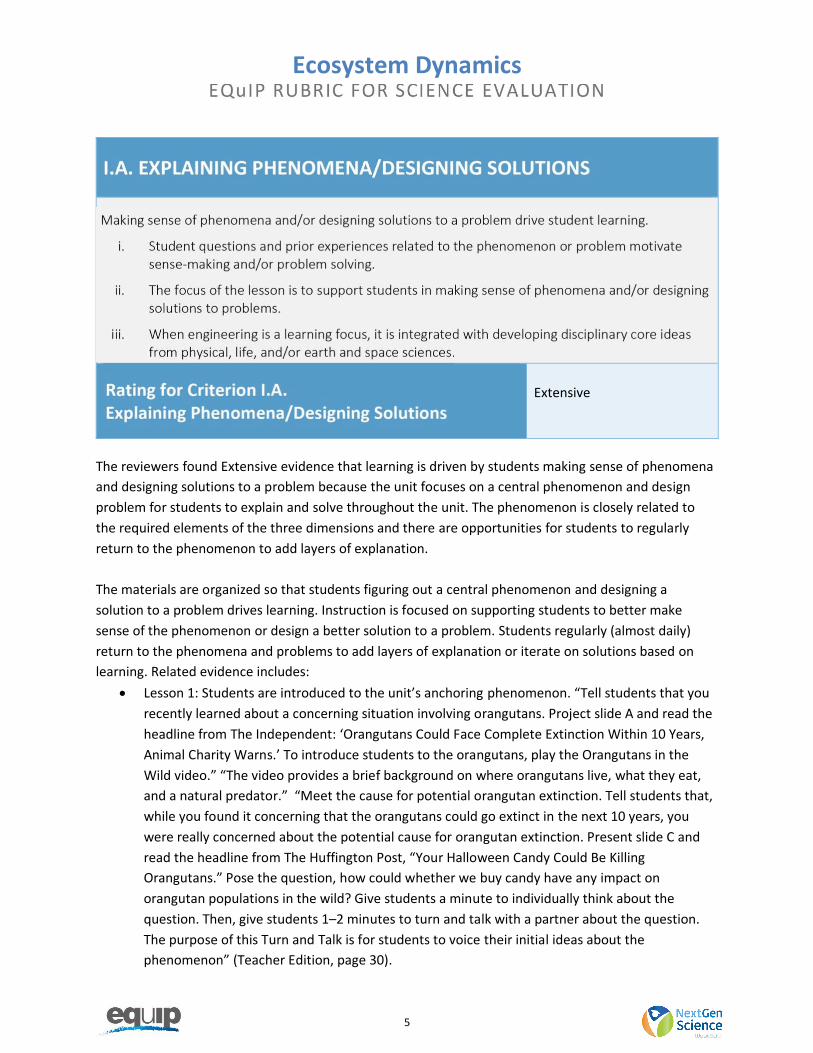
Extensive
The reviewers found Extensive evidence that learning is driven by students making sense of phenomena
and designing solutions to a problem because the unit focuses on a central phenomenon and design
problem for students to explain and solve throughout the unit. The phenomenon is closely related to
the required elements of the three dimensions and there are opportunities for students to regularly
return to the phenomenon to add layers of explanation.
The materials are organized so that students figuring out a central phenomenon and designing a
solution to a problem drives learning. Instruction is focused on supporting students to better make
sense of the phenomenon or design a better solution to a problem. Students regularly (almost daily)
return to the phenomena and problems to add layers of explanation or iterate on solutions based on
learning. Related evidence includes:
• Lesson 1: Students are introduced to the unit’s anchoring phenomenon. “Tell students that you
recently learned about a concerning situation involving orangutans. Project slide A and read the
headline from The Independent: ‘Orangutans Could Face Complete Extinction Within 10 Years,
Animal Charity Warns.’ To introduce students to the orangutans, play the Orangutans in the
Wild video.” “The video provides a brief background on where orangutans live, what they eat,
and a natural predator.” “Meet the cause for potential orangutan extinction. Tell students that,
while you found it concerning that the orangutans could go extinct in the next 10 years, you
were really concerned about the potential cause for orangutan extinction. Present slide C and
read the headline from The Huffington Post, “Your Halloween Candy Could Be Killing
Orangutans.” Pose the question, how could whether we buy candy have any impact on
orangutan populations in the wild? Give students a minute to individually think about the
question. Then, give students 1–2 minutes to turn and talk with a partner about the question.
The purpose of this Turn and Talk is for students to voice their initial ideas about the
phenomenon” (Teacher Edition, page 30).
Ecosystem Dynamics
6
• Lesson 2: Students begin to understand the problem, which involves humans altering the
biosphere in ways that negatively impact orangutans. “Purpose of the discussion: To realize that
humans depend on the land and the biosphere to get what we need, specifically to grow crops,
and palm oil is more efficient in terms of land use than other vegetable oil crops. This is part of
why its production is increasing and why it is not realistic to stop growing it. Listen for students’
ideas: All oils can be used for food or in other products. All oils come from plants grown as
crops, and those crops need land to grow. To farm or grow crops, we need to clear land, which
means cutting down native forests or grasslands. Palm oil uses less land and produces more oil,
so it is more efficient than other oils” (Teacher Edition, page 58).
• Lesson 3: “Set up the Progress Tracker for an individual reflection. Explain to students that we
want to take some individual time to capture what we have figured out regarding the locations
that meet the growing conditions of oil palm plants compared to tropical rainforest locations.
Have students turn to the Progress Tracker section in their science notebooks. Use slide H to
guide students to write and draw what they have figured out about the lesson question, Can we
grow palm oil somewhere else so that we’re not cutting down tropical rainforests? … Say, so
what did we figure out today? Call on 1-2 students to share” (Teacher Edition, page 73).
• Lesson 11: Students update their model that was first developed in Lesson 1 based on the unit
phenomenon. They add new information about palm oil farms and how they relate to orangutan
populations. “Introduce the modeling task….Explain that students are going to receive more
information about these populations and work in their small groups to develop a system model
for the oil palm system” (Teacher Edition, page 189).
• Lesson 17: “Construct an explanation about how your farm meets the goal for the design task. a.
Identify 2 features of your design that worked (met the criteria). b. Explain why each feature
supports people, orangutans, or both. c. Construct an explanation about how your group farm
meets the goals for the design task. Explain how or why combining the features above
benefitted both people and orangutans at the same time. Remember to use science ideas our
class figured out in your explanation. You can also use data from the simulation in your
explanation” (Student Edition, page 62).
The phenomena and problems used in the unit closely match the targeted scope of student learning.
Listed under Criterion I.B are the targeted DCI elements of the three dimensions that are identified in
the unit materials and that help students explain the unit phenomenon of orangutan populations and
redesigning a palm oil farm to support orangutans and people, along with the lessons in which these
DCIs are addressed.
Student questions or prior experiences related to the phenomena and problems consistently create a
need for the students to engage in learning throughout the materials. Materials provide structured
support for teachers to draw out student questions and prior experiences related to the phenomenon
and problem and to use these connections to motivate student learning when each new phenomenon
and problem is introduced. Students have frequent opportunities to feel as if they are driving the
learning sequence. Related evidence includes:
Ecosystem Dynamics
7
• Lesson 1: “After students have had a chance to review their resources, ask them to generate a
list of questions about the case of the orangutans and oil palm, along with the other related
cases. Students should record their questions on sticky notes—one question per sticky note.
They should write their questions out big and bold—so everyone can see them clearly. Give
students several minutes to populate their sticky notes with questions. In order to generate a
diverse array of questions, it helps to have students think carefully about the case of the
orangutans and oil palm, along with other related phenomena. If time permits, have students
share questions with a partner. Ask students to share their questions with a partner to ensure
that the questions are clear and productive for the phenomena. The partners should act as
critical peers and ask clarifying questions if they don’t understand something. Each student can
edit their questions before sharing them with the whole class” (Teacher Edition, page 45).
• Lesson 1: “Brainstorm ideas for data and information we need. Now that the class has created
a DQB, tell students that it is time to really dig into the hard work of figuring out what is going
on! Stay in the Scientists Circle to brainstorm ideas for the data and information we need.
Present slide V and ask students, What kinds of information or data do we need to figure out
the answers to our questions? Prompt students to use the categories of questions from the
DQB to identify the data and information that would help them answer the category of
questions. Have students turn and talk about their ideas before sharing with the whole group.
Assign each small group a category of questions. Have small groups share out their ideas with
the whole group. Make sure that all groups get to share at least a few ideas. Make a class
record of the ideas for future investigations and data we need. You may also want to prompt
students to keep a record of proposed investigations in their science notebooks” (Teacher
Edition, page 48). “Direct students’ attention to the DQB and display slide W. Say, We asked a
lot of really good questions on our DQB! Which of these questions or clusters of questions do
you think we should investigate first to help us understand the problem? Allow students to
propose which questions they would like to pursue first” (Teacher Edition, page 49).
• Lesson 6: “Revisit and add to the Driving Question Board. Say, So we think we’re going to be
able to tackle this problem and design a solution: We can design palm farms that support the
humans who depend on them, while also protecting orangutan and tiger populations. But I
know we still have questions…There’s a lot we need to figure out to design a palm farm system
that is more stable for the organisms that once lived there. Let’s take a couple of minutes to
write our questions so that they’ll be clear to others when we want to get them organized.
Display slide E. Give students 2–3 minutes to individually record 1–2 new questions that, if
answered, would help them design a better palm farm. Use the following prompts, as needed,
to help students generate questions. What questions do you have about palm farms or the
animals and plants that live there? What will we need to investigate in order to solve this
problem? What else do we need to know to refine our criteria and constraints? Display slide F
and facilitate another sharing of questions to place on the DQB. Help the class organize these
questions as they are shared” (Teacher Edition, page 106).
• Lesson 16: “Remind students of the lesson question. Say, ‘Throughout this unit some of you
were curious about whether we can do things better. A few of you posted questions to our
Driving Question Board related to what we’re trying to come to consensus about now.’
Ecosystem Dynamics
8
Example questions might include: What can we do to save the rainforest from being cut down?
What could humans do to help the orangutan and still make food? What can we do to stop
destroying the environment? What can we do to stop these things? What if the workers of the
industry tried to farm that wouldn’t harm or destroy the forests? Can we farm food and not
destroy the natural environment? If time permits, ask the students who authored these
questions to share what they were wondering about when they posed the questions” (Teacher
Edition, page 253).
Engineering to Learn Science
Grade-appropriate science ideas (DCIs) are necessary for students to solve the engineering problem and
the way that the materials support students to engage in the engineering design process results in
students demonstrating new understanding of the targeted science DCIs. For example, in Lesson 6:
“Build a Better Palm Farm: We understand that oil palm is an efficient crop and brings Indonesian
farmers a good income to support their families. We need to figure out what we could do to protect the
tropical rainforest and still give farmers an income. Make sure you have a copy of Palm Farm Designs. 5.
Work with the class to complete Part 1: Define the Problem and set a goal. What would we add to or
change about the problem? What goal can we set for living things in the ecosystem and for farmers? 6.
Complete Part 2: Define the Criteria and Constraints. What will we measure to see if we are successful?
Are there limitations on what we can design? If so, what are they? What tests can we run to see if our
designs meet the criteria and constraints?” (Student Edition, page 21). Science DCIs required to solve
this problem are the targeted elements of LS2.A, LS2.C, LS4.D, and ESS3.C (see evidence in Criterion I.B).
Suggestions for Improvement
Consider finding opportunities in which question probes provided to teachers could be altered to
promote student-generated questions. For example:
• In Lesson 1, the teacher currently provides the driving question: “Before we started thinking
about these related experiences, we were trying to figure out ‘How could buying candy affect
orangutan populations in the wild? ‘Now, in light of this broader set of things we are wondering
about, it seems like we need to modify our question a bit. Perhaps something like, ‘How does
changing an ecosystem affect what lives there?’ Record this new question at the top of the
DQB” (Teacher Edition, page 45). This question could be rephrased to be more student-driven.
For example, the teacher could prompt something like: “Now, in light of this broader set of
things we are wondering about, how could we modify our question a bit?”
• In Lesson 3, the initial ‘wonder’ statement currently comes from the teacher: “So if its better
than other crops for oil, it makes me wonder could we grow it somewhere else. And some of
you were curious about this too. Let’s take a look at some of your questions from the DQB. Ask
for one or two students who had a question in this category to share their thoughts about their
question” (Teacher Edition, page 68). This discussion could be rephrased so the teacher
highlights the student questions first. For example, it could say something like “looking at our
DQB, many of you have questions about where the oil palms grow and if they can be grown
somewhere else.”
Ecosystem Dynamics
9
Extensive
The reviewers found Extensive evidence that the materials give students opportunities to build
understanding of grade-appropriate elements of the three dimensions because students use and
develop grade-level elements of the three dimensions as they figure out the anchoring phenomenon.
Science and Engineering Practices (SEPs) | Rating: Extensive
The reviewers found extensive evidence that students have opportunities to use or develop the SEPs in
this unit because there is extensive engagement in multiple SEPs, students use key grade-appropriate
elements in service of making sense of a phenomenon and designing solutions to problems, and the unit
materials provide support for students to develop the SEP skills. There is also a close match between the
elements claimed and evidence.
Asking Questions and Defining Problems
• Ask questions that arise from careful observation of phenomena, models, or unexpected results,
to clarify and/or seek additional information.
o Lesson 1: “After students have had a chance to review their resources, ask them to
generate a list of questions about the case of the orangutans and oil palm, along with
the other related cases….In order to generate a diverse array of questions, it helps to
have students think carefully about the case of the orangutans and oil palm, along with
other related phenomena. If time permits, have students share questions with a
partner. Ask students to share their questions with a partner to ensure that the
questions are clear and productive for the phenomena. The partners should act as
critical peers and ask clarifying questions if they don’t understand something. Each
student can edit their questions before sharing them with the whole class” (Teacher
Edition, page 45).
o Lesson 1: Support is provided for developing students’ questioning skills by utilizing the
CCCs. “Encourage students to use the crosscutting concepts of Cause and Effect or
Systems and System Models to help develop questions. You may wish to provide Cause
and Effect sentence starters such as: In the ecosystem, how did ____ cause ____? How
Ecosystem Dynamics
10
do ____ and ____ work together to affect ____? How does ____ affect ____ and _____?
What would be the effect if ____? What feedback loops are causing this system to
_____? How can a small change to ___ have a big effect on ____?” (Teacher Edition,
page 46).
o Lesson 5: Students revisit the Driving Question Board (DQB) and teachers are told to
listen for “new questions about changes in the local ecosystem that may map to the
questions students originally asked about palm oil (e.g., questions about the decline of a
local species that may map to questions about orangutans)” and “questions about a
pattern of change that relates to both the tropical rainforest ecosystem (in the case of
oil palm farms) and students’ local ecosystem” (Teacher Edition, page 331).
o Lesson 6: “Revisit and add to the Driving Question Board. Say, So we think we’re going
to be able to tackle this problem and design a solution: We can design palm farms that
support the humans who depend on them, while also protecting orangutan and tiger
populations. But I know we still have questions…There’s a lot we need to figure out to
design a palm farm system that is more stable for the organisms that once lived there.
Let’s take a couple of minutes to write our questions so that they’ll be clear to others
when we want to get them organized. Display slide E. Give students 2–3 minutes to
individually record 1–2 new questions that, if answered, would help them design a
better palm farm. Use the following prompts, as needed, to help students generate
questions. What questions do you have about palm farms or the animals and plants that
live there?” (Teacher Edition, page 106)
• Ask questions to clarify and/or refine a model, an explanation, or an engineering problem.
o Lesson 1: “Remind students that we are going to try to capture all of our questions
about what is going on with the orangutans and the oil palm, along with all of the
related cases, so we can use our questions to guide our investigation into what is going
on. To do this, we are going to build a DQB” (Teacher Edition, page 45).
o Lesson 3: “Return to the DQB. Say, It seems like the only places to plant this oil palm
tree are where tropical rainforests also grow. Some of you had questions about how
people could cut down tropical rainforests to grow this plant when it hurts animals. I’m
wondering what your current thinking is about these questions” (Teacher Edition, page
73).
o Lesson 5: “Generate new questions to add to the DQB. Add a new section to the DQB for
questions about changes in the local ecosystem and how those changes impact local
populations. The questions can be recorded on Part 4 of students’ handouts, too, or
simply added to the DQB” (Teacher Edition, page 97).
o Lesson 6: “Give students 2–3 minutes to individually record 1–2 new questions that, if
answered, would help them design a better palm farm. Use the following prompts, as
needed, to help students generate questions. What questions do you have about palm
farms or the animals and plants that live there? What will we need to investigate in
order to solve this problem? What else do we need to know to refine our criteria and
constraints?” (Teacher Edition, page 106).
Ecosystem Dynamics
11
• Define a design problem that can be solved through the development of an object, tool, process,
or system and includes multiple criteria and constraints, including scientific knowledge that may
limit possible solutions.
o Lesson 3: “Say, Now that we have mapped out the locations where oil palms grow and
compared these areas with locations of tropical rainforests, let’s talk about our
understanding of what this means in terms of the needs of oil palm trees and tropical
rainforests.” (Teacher Edition, page 70). “Then say, Let’s go back to some of the
questions on our DQB and your ideas about planting oil palm in other places. Now that
we know more information, how does this change the problem for you? What new
ideas do you have about how to solve this problem? Listen for students’ ideas: We can’t
stop using oil palm because it’s better than other stuff, and we can’t plant it somewhere
else without probably cutting down forests” (Teacher Edition, page 72).
o Lesson 6: Using student questions from the DQB that they have answered, students
work to identify the main problems affecting the ecosystem. “Discuss as a whole group
to define the problem and move DQB questions we have answered. Bring students
together so that they can see the DQB and new sticky notes. Say, Let’s see if we can
summarize our ideas to more clearly define the problem. Work together to summarize
what the class has figured out. As ideas are discussed, move the questions we think we
can now answer to a new space (e.g., a chart paper titled “Questions We Have
Answered”), with the sticky notes for what the class has figured out next to the
appropriate questions. Anticipated ideas include the following: We can’t use another oil-
-oil palm is more efficient. We can’t grow it somewhere else--it will be bad everywhere.
Farmers need to earn an income. People need food, which often has palm oil in it. When
the land is cleared to plant oil palm, orangutan and tiger populations decrease. So, we
need to keep the orangutan population the same or higher, and the farmers still need to
make enough money to support their families. What about constraints that might limit
what we can design? Summarize the problem and set the stage for the design
challenge” (Teacher Edition, page 103).
Students begin to design a better palm farm identifying the criteria and constraints of their designs.
Developing and Using Models
• Develop and/or revise a model to show the relationships among variables, including those that
are not observable but predict observable phenomena.
o Lesson 1: “Work with a thought partner to develop an initial model. Project slide P and
refer students to Develop an Initial Model: Candy and Orangutans. Assemble students
into pairs to develop an initial model to answer the question, “How could buying candy
with palm oil affect orangutan populations and other populations in the wild?” Students
should develop their own models but can talk things through with their thought
partners. Partners do not need to co-construct the same initial model, but they can if
they want. Keep the following visible to students: The question on slide O, “How could
buying candy with palm oil affect orangutan populations and other populations in the
Ecosystem Dynamics
12
wild?”, the chart with a list of things that cause living things to increase or decrease, the
chart with agreed-upon components, and the chart with agreed-upon conventions for
representing interactions Before students begin modeling, prompt students to think
about cause-and-effect relationships as they develop their initial models. As students
develop their initial models, circulate to encourage students to use the agreed-upon
conventions” (Teacher Edition, page 40).
• Develop and/or use a model to predict and/or describe phenomena.
o Lesson 1: “Review the question we want the model to help us answer. Show slide O. The
purpose of developing an initial model is to answer the question, How could buying
candy with palm oil affect orangutan populations and other populations in the wild?
Say, OK, so they’re cutting down rainforests and planting oil palm trees. How could that
be causing orangutan numbers to change? And what about all of these other organisms
that are also changing? We’re going to try to explain as much as we know about this,
but, first, let’s decide what to include in our models. First, identify what we already
know about what causes lead to the effect of increases and decreases in the number of
living things that are living in an area. Have students make a chart in their notebooks
and generate lists of things that could cause a population to go up or down. Have them
label their charts with “Causes” in the left-hand column and “Effect” in the top row”
(Teacher Edition, page 38). “Next, lead a discussion to help students identify which
components would be important to identify in the model. On chart paper, develop an
initial list of the living and nonliving things in the ecosystem that we know about right
now” (Teacher Edition, page 39).
o Lesson 11: “Introduce the modeling task. Display slide B. Preview the instructions with
students. Explain that students are going to receive more information about these
populations and work in their small groups to develop a system model for the oil palm
system. Review with students what a system model represents using the conventions
your class agreed upon in Lesson 1. For example: Components or parts of the system
may be represented by a box. In this case, students determine that a box is often a
population in the system. Interactions between components (or populations) may be
represented by a line between boxes. Raise the issue that there are different ways
populations could interact. Ask students to share what they know right now about ways
populations interact” (Teacher Edition, page 189). Students use these models to make
predictions. “To elevate the concepts of Systems and Systems Models, additional
prompts could include: What would happen in this system if you increased [component
of the system]? What would happen in this system if you decreased [component of the
system]? How do you think [component] would respond to [change in another
component of the system]?” (Teacher Edition, page 196).
Planning and Carrying Out Investigations
• Collect data to produce data to serve as the basis for evidence to answer scientific questions or
test design solutions under a range of conditions.

Ecosystem Dynamics
13
o Lesson 8: “Students carry out experiments in a simulated space and may not view these
as ‘lab experiments.’ Use this opportunity to broaden students’ understanding of
different ways that scientists investigate the world, particularly through the use of
computer simulations that allow multiple scenarios and trials to be run. It’s important to
also share that computer simulations are based on estimates from field data, so at some
point research on orangutans in their real environment was used to create the
computer model” (Teacher Edition, page 130).
o Lesson 9: “Experiment 1: Births and Deaths with Normal Fruit Availability: Run the
Experiment. 3. Record the population results. For each trial, record the population low,
high, average, total number of births, and total number of deaths. 4. Record the
population size line graph. Using a different color for each trial, sketch the orangutan
population size versus time line graph. Label each trial color by placing a dot next to the
trial in the chart above. Make sense of the data from Experiment 1. Make Sense: 5.
What claims can you make about the question ‘What will happen to the orangutan
population if we add births and deaths to our simulation with normal fruit availability?’”
(Handout: Would planting more rainforest fruit trees help the orangutan population
increase?, page 1). Students repeat the same steps for Experiment 2: Increased
Rainforest Fruit Trees and Experiment 3: Smallest Percentage of Fruit Trees To Support
an Orangutan Population.
Mathematics and Computational Thinking
• Apply mathematical concepts and/or processes (e.g., ratio, rate, percent, basic operations,
simple algebra) to scientific and engineering questions and problems.
o Lesson 7: “Introduce the idea of calculating the ratio of orangutans to land area. Say,
It’s hard to compare the orangutan populations in each park because the areas are so
different. We think the protected areas that are larger have more orangutans than
smaller areas. But that may just be because there is more space for them to live. So is
the Leuser Ecosystem orangutan population larger because the area is just bigger? How
can we standardize the area so that we can compare the different parks? Project slide
H and have students share some ideas. Listen for ideas related to division, fractions,
ratios, and density…Introduce the idea of calculating the ratio of orangutans to land
area. Project slide I. If students have not already brought up the idea, introduce the
concept of dividing the population number of orangutans by the total area as a way to
compare the different populations. Add the areas to the population chart under the
park or preserve name. Have students practice a calculation together. Have students
calculate the number of orangutans in 1 km in the Leuser Ecosystem in 1993 and, with
a partner, discuss what the number means. Then, have students share out,
emphasizing that the number means that only 1-2 orangutans live in a 1 square
kilometer area in the Leuser Ecosystem… Emphasize that they are not just calculating
how many orangutans typically live in healthy tropical rainforests but calculating how
many can live in a given area of healthy tropical rainforest, like 1 km. Ask students how
they could change their question to reflect this new focus on area (e.g., How many
Ecosystem Dynamics
14
orangutans live in a given area of tropical rainforest?). Explain that this more focused
question will help them better compare the number of orangutans in each protected
area” (Teacher Edition, page 118).
• Apply concepts of statistics and probability (including mean, median, mode, and variability) to
analyze and characterize data, using digital tools when feasible.
o Lesson 8: “Using the prompts under “Run the Experiment”: a. Record the ending
energy for your orangutan. b. Record the minimum, maximum, and average energy for
the population of orangutans. c. Construct and record a class histogram” (Student
Edition, page 29).
• Use mathematical representations to describe and/or support scientific conclusions and design
solutions.
o Lesson 8: “Record the results from the experiment. At the end of the experiment, have
students record their individual results on the handout. Next, have students record the
population results. Create a class histogram. Use the same process to create a class
histogram that you used in Experiment A…Have students add their sticky notes to the
histogram according to the energy of their orangutans…Lead a class discussion to
reflect on the findings” (Teacher Edition, page 138).
o Lesson 9: “Record the population results. For each trial, record the population low,
high, average, total number of births, and total number of deaths. Record the
population size line graph. Using a different color for each trial, sketch the orangutan
population size versus time line graph. Label each trial color by placing a dot next to
the trial in the chart above. Record the population results. For each trial, record the
population low, high, average, total number of births, and total number of deaths. Why
did the population size fluctuate? What claims can you make about the question
“Would planting more fruit trees help the orangutan population increase?” Why can
you make this claim? What is your evidence?” (Lesson 9 Student Handout, page 1).
o Lesson 10: “Direct students to the directions at the bottom of their case study. Say,
One way that we can look for how the population changed is by using the graph of
population versus time at the bottom of each case study. On that graph, you should
circle the sections of the graph that show a decreasing pattern in the population in red.
Then, you should circle the sections of the graph that show an increasing pattern in the
population in blue. Be sure to also add words or labels to the graph to describe what
was happening to that population’s resources during those times. Draw students’
attention to the axes of the graphs. Point out that the y-axis shows the population of
an organism, and that the further up we go on the axis, the more of that organism are
in the population. Since the x-axis is time, the graph shows how the population changes
over time. When the population goes from a lower number to a higher number, we call
that “increasing,” and it’s marked on the graph by sections with a positive slope. When
the population goes from a higher number to a lower number, we call that
“decreasing,” and we can see this pattern on the graph in regions with a negative
slope” (Teacher Edition, page 173).
Ecosystem Dynamics
15
Constructing Explanations and Designing Solutions
• Apply scientific ideas, principles, and/or evidence to construct, revise and/or use an explanation
for real world phenomena, examples, or events.
o Lesson 10: “4. Write an explanation to answer the question: Why did the change in the
farming practices after 1990 affect the monarch butterfly population?” (Assessment:
Monarch Butterflies on the Shortgrass Prairie, page 5).
o Lesson 10: Students compare different organisms and how populations fluctuate due
to changes in the environment. They develop a generalized model to describe the
relationship between population size and available resources. “By analyzing patterns
across these cases, students will generalize their model for population change to
explain that the population size (of any organism) depends on the availability of
resources that organisms need to survive and reproduce. Students also extend these
ideas to a related phenomenon of monarch butterflies and milkweed availability on the
prairie” (Teacher Edition, page 170).
• Apply scientific ideas or principles to design, construct, and/or test a design of an object, tool,
process, or system.
o Lesson 17: “Project slide D and have students circle their assigned area and role on the
How can we redesign the way land is used in Indonesia to support orangutans and
people at the same time? handout. Have students work individually to plan ways to
redesign your area of the land. Students should use the space on the handout to sketch
and describe a redesign plan for their assigned area. As students plan, you may wish to
have them revisit the Goal from Part 1 and the Criteria and Constraints from Part 2.
Students may also wish to revisit their copy of Summarizing ways to grow food as a
reference for the approaches they might take. After developing a redesign plan, have
students identify the features of their redesign and explain why they think the features
they proposed will support people, orangutans, or both. Students should record their
ideas on the How can we redesign the way land is used in Indonesia to support
orangutans and people at the same time?” (Teacher Edition, page 271).
Engaging in Argument from Evidence
• Construct, use, and/or present an oral and written argument supported by empirical evidence
and scientific reasoning to support or refute an explanation or a model for a phenomenon or a
solution to a problem.
o Lesson 2: Students make claims to the question “Is there a substitute for palm oil?”
“Have students share arguments based on the evidence they have gathered from the
readings and infographics to answer the question ‘Is there a substitute for palm oil?’’’
(Teacher Edition, page 58).
o Lesson 13: “Below are three claims that people make about releasing the beetle in
Mormon Mesa and St. George. Claim A: Introducing the tamarisk beetle is bad for the
willow flycatcher in both locations. Claim B: Introducing the tamarisk beetle is bad for
the willow flycatcher in Mormon Mesa, but good in St. George. Claim C: Introducing the
tamarisk beetle is bad in the short-term for the flycatcher population, but will be good
Ecosystem Dynamics
16
in the long-term. 5. Circle the claim you agree with most. 6. Write an argument to
support the claim. Use data from the data tables and scientific reasoning to construct a
convincing argument” (Assessment: Southwestern Willow Flycatcher, page 4).
o Lesson 18: “Argument for the Best Redesign of Land: 1. Make a claim to answer the
question, If you could make one recommendation to redesign the land in Indonesia to
support people and orangutans, what would you recommend and why? My
recommendation would be: 2. Write a convincing argument to support your claim.
Your argument should include: Evidence from the simulation, including orangutan
population size and income for the designs using this feature. You may want to include
orangutan population size and income for the other designs and the baseline data
comparisons. Include evidence from other investigations, too. Scientific reasoning that
draws upon the science ideas we’ve figured out. Trade-offs that are important to know
about” (Handout: Argument for the Best Redesign of Land, page 1).
Disciplinary Core Ideas (DCIs) | Rating: Extensive
The reviewers found extensive evidence that students have the opportunity to use or develop the DCIs
in this unit because there are sufficient DCI elements addressed, there is a close match between the
DCIs claimed and those that are addressed throughout the unit, and students use the DCIs in service of
making sense of the unit phenomenon.
LS2.A: Interdependent Relationships in Ecosystems
• Organisms, and populations of organisms, are dependent on their environmental interactions
both with other living things and with non-living factors.
o Lesson 3: “Prompt students to read the almanac entry and highlight or underline what
the plant specifically needs to grow. Discuss oil palm’s needs to add specifics to a class
chart. Bring students back to the whole group. Near the class list of plant needs, add
the new information about specific oil palm plant needs. Use a different color to
represent what we learned from the reading. Consider labeling these as “nonliving
factors” just below the title “Oil palm needs” on the chart paper” (Teacher Edition,
page 69).
o Lesson 8: Students use computer simulations to consider ways orangutans interact
with other factors in their environment and why they need so much forest space. “The
simulation includes four main components: (1) orangutans, (2) rainforest fruit trees
(e.g., fig, durian, and other rainforest fruits), (3) termites, and (4) non-fruiting
rainforest trees. The images show how the icons used in the simulation map to their
counterparts in a real ecosystem. Prompt students to consider the ways in which
orangutans interact with the other components in the ecosystem (termites, rainforest
non-fruit trees, and rainforest fruit trees)” (Teacher Edition, page 129).
o Lesson 10: “With your class, discuss the following: a. What resource would be for the
monarchs like the rainforest trees are for orangutans? 11. Turn and talk with a partner:
a. How are the monarch butterflies and the milkweed connected in this ecosystem? b.
How does this relationship compare to other examples from our table of organisms and
Ecosystem Dynamics
17
resources? How is it similar? How is it different?” (Student Edition, page 40). “How did
the amount of this resource change? The amount of milkweed has gone down over
time because people are planting farms where there used to be prairies. Overall, how
did the population of this organism change? The number of monarchs has decreased
over time because they don’t have as much milkweed for food and to lay their eggs”
(Teacher Edition, page 181).
o Lesson 12: Students read an interview about a researcher who studies orangutans and
their interactions within the ecosystem. “In the tropical rainforest, dung beetles roll the
orangutan feces into balls in order to move it. They then bury it, which means they’re
burying the seeds, too. So, at first, the seeds are dispersed by orangutans. Then, dung
beetles help “disperse” and “plant” them in the soil” (Student Edition, page 116).
“Purpose of this discussion: To conclude that orangutans have a special role to disperse
fruit seeds in the tropical rainforest. The seeds, which become new plants, are
important for many tropical rainforest populations. Fruit trees depend on orangutans
to disperse their seeds” (Teacher Edition, page 208).
• In any ecosystem, organisms and populations with similar requirements for food, water,
oxygen, or other resources may compete with each other for limited resources, access to which
consequently constrains their growth and reproduction.
o Lesson 2: Students compare different types of soil. “By comparing across three
different cases, students see patterns in how converting native plant communities to
agriculture for food production causes similar problems for animals in different
ecosystems. They recognize and define this pattern as a problem across multiple
systems, and one that affects the populations that live there” (Teacher Edition, page
59).
o Lesson 8: Students conduct a simulation to examine what happens to orangutans when
there are fewer fruit trees where they live. “Lead a class discussion to reflect on the
findings. Project the discussion prompts on slide J. Start by focusing on the extremes—
orangutans that were very successful at getting food and orangutans that were not
very successful at getting food. Select one student watching an orangutan in each
category to share their observations. Then progress to the orangutans who were
moderately successful at getting food… Which orangutans were least successful at
finding food? What prevented your orangutan from finding food? There weren’t many
fruit trees around my orangutan, so my orangutan had to travel a long distance to find
fruit trees. There were a lot of other orangutans around my orangutan, and they kept
stealing my orangutan’s food!” (Teacher Edition, page 136). “Generate a
representation of what we figured out. During the discussion, generate a shared class
representation to represent competition between individual orangutans with fewer
fruit trees. An example representation has been provided. It is important to show two
orangutans competing for a limited resource. Under conditions with limited resources
(e.g., fewer rainforest fruit trees), there is more competition between individual
orangutans” (Teacher Edition, page 139).
Ecosystem Dynamics
18
o Lesson 9: Students use simulations to figure out what happens to an orangutan
population when there is a consistent and then a lower number of fruit trees available.
“It is important that there is some competition between individuals, but it will stay
about the same with normal fruit availability. As resources become slightly more or less
plentiful, there will be small increases or decreases in the population sizes. These
increases and decreases are called fluctuations. In this experiment, it is important to
emphasize that the small ups and downs that we see are due to very small changes in
resource availability” (Teacher Edition, page 155).
• Growth of organisms and population increases are limited by access to resources.
o Lesson 8: Students conduct population experiments using a computer simulation to
examine the orangutan population with normal, fewer, or more fruit trees available.
“Summarize the previous experiments by saying, In our first experiment, we figured
out that orangutans need a lot of space because they compete for food resources. In
our second experiment, we figured out that when there are fewer fruit trees,
orangutans struggle to find food even though they can eat termites. This increases
competition between orangutans in the population. Now let’s investigate what might
happen if we increase the number of fruit trees in the environment” (Teacher Edition,
page 140). “Suggested Prompts: When there were more fruit trees, what happened to
the energy of individuals? The population? Sample student response: The energy of
individual orangutans and the orangutan population as a whole went up drastically.
This is because orangutans were easily able to access fruit trees and didn’t have to
compete with one another for limited resources” (Teacher Edition, page 141).
o Lesson 9: “Generate a representation of what we figured out. During the discussion,
generate a shared class representation to represent fluctuations in population size with
normal fruit availability. An example representation has been provided. It is important
that there is some competition between individuals, but it will stay about the same
with normal fruit availability. As resources become slightly more or less plentiful, there
will be small increases or decreases in the population sizes. These increases and
decreases are called fluctuations. In this experiment, it is important to emphasize that
the small ups and downs that we see are due to very small changes in resource
availability” (Teacher Edition, page 155).
o Lesson 10: “Introduce the resource change case studies. Arrange students into four or
eight small groups, depending on the size of the class. Give each student in each group
1 copy of the group’s assigned case study from Case Study Cards. Case assignments can
be driven partly by student choice, but make certain each case is taken up by a group”
(Teacher Edition, page 172). “Explain to students that each group has a different case
study of an example where there was a change in the amount of resources that an
organism needed” (Teacher Edition, page 173).
o Lesson 11: “Let’s summarize what we figured out using an if/then statement like we’ve
done before. If ___ resource changes, then what happens to prey? And predators?
Why? Sample student response: If there is a lot of oil palm [resource], then prey and
predators increase because they have a lot of food. If there is unlimited food for
Ecosystem Dynamics
19
everyone [resources], then prey and predators can increase at the same time because
there is nothing to stop their populations from increasing” (Teacher Edition, page 192).
• Similarly, predatory interactions may reduce the number of organisms or eliminate whole
populations of organisms. Mutually beneficial interactions, in contrast, may become so
interdependent that each organism requires the other for survival. Although the species
involved in these competitive, predatory, and mutually beneficial interactions vary across
ecosystems, the patterns of interactions of organisms with their environments, both living and
non-living, are shared.
o Lesson 12: Students read an interview about a researcher who studies orangutans and
their interactions within the ecosystem. “In the tropical rainforest, dung beetles roll the
orangutan feces into balls in order to move it. They then bury it, which means they’re
burying the seeds, too. So, at first, the seeds are dispersed by orangutans. Then, dung
beetles help “disperse” and “plant” them in the soil” (Student Edition, page 116).
“Purpose of this discussion: To conclude that orangutans have a special role to disperse
fruit seeds in the tropical rainforest. The seeds, which become new plants, are
important for many tropical rainforest populations. Fruit trees depend on orangutans
to disperse their seeds” (Teacher Edition, page 208).
o Lesson 11: “Can someone summarize a few things we figured out? Snakes do eat rats;
they are a predator of rats Snake, rat, and pig populations can increase at the same
time because there are a lot of resources for them in the oil palm system. And why do
we think these populations do not increase in the tropical rainforest? There are more
predators. There are fewer resources, or cutting down the rainforest is causing it to
have fewer resources. There is more competition for resources” (Teacher Edition, page
194). “Transition to explaining why snakes and rats are not increasing, and record a
class consensus model. Display slide K. Say, Let’s return to our question about why rat
and snake populations are not increasing a whole lot in the tropical rainforest. We had
some ideas about resources or food, predators, and competition. Did you notice any
evidence that these ideas might help explain why they are not increasing?” (Teacher
Edition, page 196).
o The part of the DCI element about mutually beneficial interactions, in contrast, may
become so interdependent that each organism requires the other for survival is not
thoroughly covered in the unit.
LS2.C: Ecosystem Dynamics, Functioning, and Resilience
• Ecosystems are dynamic in nature; their characteristics can vary over time. Disruptions to any
physical or biological component of an ecosystem can lead to shifts in all its populations.
o Lesson 13: “Broaden to related experiences that we know about. Display slide B. Give
students time to turn and talk about related experiences, cases, and stories they know
about where a plant in an ecosystem experienced a big change, like dying off. Have
students think about whether it had a big or small impact in the ecosystem” (Teacher
Edition, page 216). “Introduce and define the term ‘disruption’. Say, What you are
describing with these changes to ecosystems are called disruptions. They are things
Ecosystem Dynamics
20
that happen that change the ecosystem” Students update their rainforest system
model to include different scenarios that might affect the ecosystem. “Others thought
it might be small impacts. What could cause a small change to the fruit trees where
only a few of them are impacted? “Brainstorm scenarios where these kinds of
disruptions could affect the fruit trees in the rainforest.” (Teacher Edition, page 217).
“Say, We just figured out that different things could cause both big and small
disruptions in the rainforest. We looked at how a drought and a disease would affect
rainforest plants and then the system as a whole. Oil palm is growing right next to the
forest. How would disruptions like these affect the oil palm?” (Teacher Edition, page
219).
o Lesson 15: Students read three different approaches to farming on how to prevent
disruptions in the system. “Problematize which approaches are best for people. Have
students discuss what would happen in each of these cases if there was a disruption,
such as a disease that kills their plants or a pest that eats their crops. Have your
students consider if people would continue to make an income and if this is the benefit
that really matters. Suggested prompts: How did people benefit from the approach to
growing food that you investigated? Would people continue to make an income if
there was a disease or pest problem?” (Teacher Edition, page 244).
o Lesson 16: Students synthesize information about different approaches to growing
food to identify connections between disruptions and the stability of designed and
natural ecosystems. “Regroup in expert groups to prepare for jigsaw. Give students five
minutes to work with their groups from Lessons 14 and 15 to review their notes and
prepare to share what they learned about their approach to growing food with other
groups. It may be helpful for students to have access to the readings from Lesson 14
(Diversified farming in Costa Rica, Sustainable palm oil in Indonesia, and Customary
Forests in Indonesia) and the StoryMaps from Lesson 15 (Diversified Farming,
Sustainable Palm Oil and Prairie Strips, The Customary Forest of Laman Satong)”
(Teacher Edition, page 251). “What to look/listen for: Students communicating to their
peers how approaches to growing food can support plants and animals in natural and
designed systems. Listen for students to connect specific ecosystem services people
receive (or not) through farming practices to sudden or gradual disruptions” (Teacher
Edition, page 252).
• Biodiversity describes the variety of species found in Earth’s terrestrial and oceanic ecosystems.
The completeness or integrity of an ecosystem’s biodiversity is often used as a measure of its
health.
o Lesson 13: “Purpose of the discussion: (1) to explicitly name that the rainforest has a
biodiverse plant compared to the oil palm system, and (2) agree that more biodiverse
systems may be able to better handle small disruptions, (3) to agree that less
biodiverse systems are more at risk of disruptions. Listen for students to suggest the
following: There are more total plants and more kinds of plants in the rainforest system
compared to the oil palm system. There are more overall populations and connections
in the rainforest system compared to the oil palm system. When a disruption occurs,
Ecosystem Dynamics
21
the rainforest system as a whole can be mostly OK because there are other resources
that populations can eat and use. When there is a disruption that affects the oil palm
crop directly (disease, drought) in the monocrop farm, all of the populations in the
system are affected because they all rely on oil palm” (Teacher Edition, page 220).
“Define biodiversity and monocrop. Say, We are noticing that the rainforest system has
a lot more populations and connections between them compared to the oil palm
system. The oil palm system is mostly just 1 kind of plant we grow for food. We have
two words that may be useful to us in describing the kinds of systems - biodiversity and
monocrop. Work with your class to co-construct a definition of biodiversity in the
context of the rainforest (i.e., biodiverse) and the oil palm (i.e., lacking biodiversity)”
(Teacher Edition, page 221).
o Lesson 14: In the reading selection Diversified Farming in Costa Rica, “Rodolfo and his
team are collecting biodiversity data at their diversified farm and a monocrop oil palm
farm. They found that the diversified farm has fewer rodents, like rats, than the
monocrop farms. They also found many more types of birds, bats, and beetles in the
diversified farm. The birds and bats eat pests like caterpillars. The beetles eat dead
plant material and return nutrients to the soil. Both farms produce the same amount of
oil palm” (Student Edition, page 121).
LS4.D: Biodiversity and Humans
• Changes in biodiversity can influence humans’ resources, such as food, energy, and medicines,
as well as ecosystem services that humans rely on—for example, water purification and
recycling.
o Lesson 15: Students read about ways to support plants and animals in farming
practices while benefitting humans at the same time. “Project slide D and remind
students that the question we are trying to answer is “How can people benefit from
growing food in ways that support plants and animals in the natural ecosystem?”
Students will work in their Lesson 14 groups. Assign each group the StoryMap that
matches the approach they read about in Lesson 14 (diversified farming, sustainable
palm oil, or customary forests)” (Teacher Edition, page 242). “Share and synthesize
benefits people receive from each approach to growing food. Have students add a
column on the right-side of the table they used in Lesson 14, Summarizing ways to
grow food. Label the column “Benefits People Receive”. Give students 10 minutes to
synthesize the important ideas about benefits people receive that they learned from
their StoryMap. Have students take notes in the “Benefits People Receive” column on
summarizing ways to grow food and have students add ideas from their group that
they want to discuss when they get into mixed groups in Lesson 16” (Teacher Edition,
page 243).
ESS3.C: Human Impacts on Earth Systems
• Human activities have significantly altered the biosphere, sometimes damaging or destroying
natural habitats and causing the extinction of other species. But changes to Earth’s
Ecosystem Dynamics
22
environments can have different impacts (negative and positive) for different living things (MS-
ESS3-3).
o Lesson 2: Students begin to understand the problem which involves humans altering
the biosphere in ways that negatively impact orangutans. “Purpose of the discussion:
To realize that humans depend on the land and the biosphere to get what we need,
specifically to grow crops, and palm oil is more efficient in terms of land use than other
vegetable oil crops. This is part of why its production is increasing and why it is not
realistic to stop growing it. Listen for students’ ideas: All oils can be used for food or in
other products. All oils come from plants grown as crops, and those crops need land to
grow. To farm or grow crops, we need to clear land, which means cutting down native
forests or grasslands. Palm oil uses less land and produces more oil, so it is more
efficient than other oils” (Teacher Edition, page 58).
o Lesson 5: Students explore their own schoolyard community to examine how humans
have affected the area over time and they connect this to the orangutan habitat
phenomenon. “Discuss and examine photographs of the area before major human
disturbance. Bring the students back together for a whole-class discussion. Ask the
following questions from Part 2 of students’ handouts. How did people change the land
where you live? Why do you think people made these changes to the land where you
live?)” (Teacher Edition, page 91). “Frame the outdoor observation activity. Display
slide C. Say, Oil palm farms have created a lot of change in the Indonesian ecosystems.
But we’ve identified that our own community has changed the ecosystem in various
ways too” (Teacher Edition, page 92).
o Lesson 14: “Co-create the lesson question and set a purpose for reading: Discuss a
lesson question similar to: Are there ways people can grow food without harming the
rainforest? Set answering this question as a purpose for reading. Students will each
explore one approach that will help them answer this question” (Teacher Edition, page
234). One of the articles that students read is Diversified Farming in Costa Rica about
how to farm palm oil while supporting populations within the ecosystem. “Diversified
farming and populations in ecosystems Rodolfo and his team are collecting biodiversity
data at their diversified farm and a monocrop oil palm farm. They found that the
diversified farm has fewer rodents, like rats, than the monocrop farms. They also found
many more types of birds, bats, and beetles in the diversified farm. The birds and bats
eat pests like caterpillars. The beetles eat dead plant material and return nutrients to
the soil. Both farms produce the same amount of oil palm” (Student Edition, page 121).
o Lesson 17: One of the lesson-level learning targets for Lesson 17 is “17.B Apply ideas
about ways of growing food to design a better way to use the land to minimize human
impact on orangutan populations” (Teacher Edition, page 259). “Project slide D and
have students circle their assigned area and role on the How can we redesign the way
land is used in Indonesia to support orangutans and people at the same time? handout.
Have students work individually to plan ways to redesign your area of the land.
Students should use the space on the handout to sketch and describe a redesign plan
for their assigned area. As students plan, you may wish to have them revisit the Goal
Ecosystem Dynamics
23
from Part 1 and the Criteria and Constraints from Part 2. Students may also wish to
revisit their copy of Summarizing ways to grow food as a reference for the approaches
they might take” (Teacher Edition, page 271).
ETS1.A: Defining and Delimiting Engineering Problems
• The more precisely a design task’s criteria and constraints can be defined, the more likely it is
that the designed solution will be successful. Specification of constraints includes consideration
of scientific principles and other relevant knowledge that are likely to limit possible solutions.
o Lesson 17: “Redesign Challenge - Parts A and B: Revise and Add to Our Definition of the
Problem and Our Criteria and Constraints 9. Obtain a copy of the handout, How can we
redesign the way land is used in Indonesia to support orangutans and people at the
same time? You will use this handout throughout the redesign challenge. Attach the
pages to your notebook. 10. Part A - Read the problem summary statement on the
handout. Edit or add to it based on the progress you have made since we last defined
the problem. Discuss your revisions and additions with your class. 11. Part B - Review
the Criteria and Constraints your class identified in Lessons 1 and Lesson 6. Review your
copy of the handout, Palm Farm Designs from Lesson 6. Revise and add to your list of
criteria and constraints. Discuss your revisions and additions with your class. Your
teacher will keep a record of your revisions on chart paper. 12. Part C - Follow the steps
outlined in the handout and on the slides, to gather baseline data from the computer
simulation to further refine the criteria and constraints. Record the baseline data on
the handout, How can we redesign the way land is used in Indonesia to support
orangutans and people at the same time? 13. Further refine your criteria and
constraints according to what you found when you gathered baseline data” (Student
Edition, page 60). “As the class revises the criteria and constraints, use this opportunity
to specifically emphasize engineering DCI ETS1.A: Defining and Delimiting Engineering
Problems: “The more precisely a design task’s criteria and constraints can be defined,
the more likely it is that the designed solution will be successful. Specification of
constraints includes consideration of scientific principles and other relevant knowledge
likely to limit possible solutions.” Summarize the key revisions to the criteria and
constraints. Verbalize the key changes that the class made to the criteria and
constraints. Observe, out loud, that we only added one new constraint. Otherwise, we
made our original drafts of criteria and constraints more precise to help us solve the
design problem” (Teacher Edition, page 269).
o Lesson 18: “Elicit ideas for how to compare designs. Display slide A. Say, Given our
design task, what do we need to pay attention to in order to evaluate the designs
fairly? Listen for students to suggest ideas related to: criteria and constraints, such as
The orangutan population size. Whether the orangutan population size increased
and/or stayed stable. The income level for each area. Where the income level for each
area was equal or ‘fair’” (Teacher Edition, page 282). Students then evaluate each
other’s designs and organize their findings in a chart based on the following: “Criteria
results, How well did the design meet the criteria and constraints?, What design
Ecosystem Dynamics
24
features do I like?, What are the trade-offs?, and What wonderings do I have about the
design?” (Teacher Edition, page 282).
Crosscutting Concepts (CCCs) | Rating: Extensive
The reviewers found extensive evidence that students have the opportunity to use or develop the CCCs
in this unit because there is a sufficient amount of CCCs that students are engaged in throughout the
unit, the CCCs claimed are closely matched to those addressed in the unit, and students use the CCCs to
make sense of the unit phenomenon. Students are also supported in developing competence in specific
CCC elements.
Cause and Effect
• Cause and effect relationships may be used to predict phenomena in natural or designed
systems.
o Lesson 1: “First, identify what we already know about what causes lead to the effect of
increases and decreases in the number of living things that are living in an area. Have
students make a chart in their notebooks and generate lists of things that could cause a
population to go up or down” (Teacher Edition, page 43).
o Lesson 1: “Encourage students to use the crosscutting concepts of Cause and Effect or
Systems and System Models to help develop questions” (Teacher Edition, page 46).
o Lesson 10: Students read several case studies and make comparisons based on patterns
regarding how the amount of the resource changed to the change in population. “What
to look/listen for: (1) Students using the structure of different data representations
(graphs, tables, maps) to identify patterns of stability and change in population and
resource availability. (2) Students connecting these patterns of change to textual
evidence as a means of establishing a cause-and-effect relationship between resource
availability and population size, using mechanisms they have discussed in prior lessons
for how changes to ecosystem factors cause changes to the amount of organisms an
ecosystem can sustain” (Teacher Edition, page 175).
o Lesson 13: “Say, So we’re noticing that people tend to like single plants because of the
look or ease of caring for them, but what did we learn yesterday about the potential
problems this could have for biodiversity? Summarize key ideas using cause-and-effect
sentence structures. On a class chart or whiteboard space, record important summary
ideas as a class. Focus on ideas about how the diversity of plants in a system makes the
system ‘healthier’ or more resilient to some disruptions” (Teacher Edition, page 223).
“This is a real case with a real debate happening among scientists and community
members. We’re going to work on this case together to understand what is happening
in this new place, then you’ll have a chance to apply these ideas on your own...What do
you predict will happen to the system with this new beetle?” (Teacher Edition, page
224).
Systems and System Models
Ecosystem Dynamics
25
• Models can be used to represent systems and their interactions—such as inputs, processes, and
outputs—and energy, matter, and information flows within systems.
o “In this sketch, one component (candy) is connected with a second component
(orangutan) by a line and a question mark. Throughout the first lesson set, this initial
model will be progressively developed. The class will work together to include additional
components and to agree upon ways to depict interactions between them” (Teacher
Edition, page 30). Students are supported in using Systems and System Models to
consider their questions about the phenomenon in a deeper way. “Systems and System
Models sentence starters may include: What are the key parts of ____? How do the
parts ____, _____, and ____ work together? What would happen in this system if you
____?” (Teacher Edition, page 46). Note that evidence of student performance related
to the claimed element was at the 3–5 level rather than the claimed middle school level.
o Lesson 11: “Introduce the modeling task. Display slide B. Preview the instructions with
students. Explain that students are going to receive more information about these
populations and work in their small groups to develop a system model for the oil palm
system. Review with students what a system model represents using the conventions
your class agreed upon in Lesson 1. For example: Components or parts of the system
may be represented by a box. In this case, students determine that a box is often a
population in the system. Interactions between components (or populations) may be
represented by a line between boxes….Agree upon colors to use for different kinds of
interactions…” (Teacher Edition, page 189). “Have students add their ideas about
resource availability to explain why rats and snakes could increase at the same time.
With at least 5 minutes remaining, display slide C. Remind students that here they are
trying to explain the simultaneous increase in rats and snakes. Prompt students to use
the resource availability model from Lesson 10 to try to explain this increase. Direct
them to use a new dry erase marker color to add: A label to the resource box Big or little
up or down arrows to the resource box Big or little up or down arrows to the population
boxes” (Teacher Edition, page 190).
• Models are limited in that they only represent certain aspects of the system under study.
o Lesson 8: “Compare the components and interactions in the simulation to a real
ecosystem. Present slide D and say, Computer simulations are one way of helping us
think about what is happening in real ecosystems. Simulations allow us to speed up time
and eliminate some complicating variables, but they also have limitations. Identifying
the strengths and limitations of our simulation will help us think about how this
simulation will be useful in helping us make sense of what is happening in a real
ecosystem. Let’s start by considering how our simulation is a good representation of a
real ecosystem and then consider how it might be a limited representation of a real
ecosystem. Prompt students to recreate the table on slide D in their science notebooks.
Then give students time to individually jot down their ideas about how the simulation is
a good representation of or a limited representation of a real ecosystem” (Teacher
Edition, page 130).
Ecosystem Dynamics
26
o Lesson 11: “’How is this model limited compared to the real ecosystem?’ Sample
student response: We only have a few things in our system models, but in the real
world, there are a lot more plants and animals” (Teacher Edition, page 198). “Use this
opportunity to discuss the limitations of the two system models. Both models are overly
simplified compared to the real systems that they represent. Yet the rainforest system
model may still feel quite complicated and messy, even with only a few populations
represented. Engage your students in thinking about how complicated it may be to trace
all the interactions—such as competition and prediction--in the real system. Pose
questions to students about how models, even if they are limited, can be useful for
understanding the relationships in ecosystems (e.g., Even though we don’t have
everything represented here, how is this model useful for our thinking? What might we
want to be careful about while drawing conclusions?)” (Teacher Edition, page 196).
• Systems may interact with other systems; they may have sub-systems and be a part of larger
complex systems.
o Lesson 11: Students create two models — an oil palm system model and a rain forest
system model and compare the two including how some components interact with both
systems. “Purpose of the discussion: To establish that there are similar predation and
competition relationships in both systems, but the rainforest system is much more
complex, with more populations and more interactions compared to the oil palm
system. Listen for: When there is competition between populations for the same
resource, like in the tropical rainforest, it keeps numbers from increasing too much. The
tropical rainforest is a lot more complex than the oil palm farm, with a lot more plants
and animals interacting with each other. There is only one kind of plant in the oil palm
farm, but there are many kinds of plants in the tropical rainforest. Populations interact
for more than resources (like shelter and safety). If one population (like orangutans)
were to go extinct, then this could cause changes to other populations because
everything is connected” (Teacher Edition, page 197).
Stability and Change
• Small changes in one part of a system might cause large changes in another part.
o Lesson 6: “The crosscutting concept of stability and change is used to think about how
to design a palm system that is more stable for orangutans over time. Students pose
questions and consider ideas for how small changes, such as adding more tropical
rainforest trees to the palm farm, might help keep orangutan populations stable”
(Teacher Edition, page 102).
o Lesson 8: Students conduct population experiments using a computer simulation to
examine the orangutan population with normal, fewer, or more fruit trees available.
“Now let’s investigate what might happen if we increase the number of fruit trees in the
environment” (Teacher Edition, page 140). “Suggested Prompts: When there were more
fruit trees, what happened to the energy of individuals? The population? Sample
student response: The energy of individual orangutans and the orangutan population as
a whole went up drastically. This is because orangutans were easily able to access fruit
Ecosystem Dynamics
27
trees and didn’t have to compete with one another for limited resources” (Teacher
Edition, page 141).
o Lesson 9: Students collect data from simulations. “Throughout this lesson, monitor how
students use the lens of stability and change to make sense of the data they have
collected from the simulated and the line graph representations. Listen carefully to how
they talk about changes in one part of the system (fruit availability, independent
variable) and outcomes in another part of the system (orangutan population).
Encourage students to use data from their investigations to draw conclusions about
resource availability, orangutan growth, survival, and reproduction, and orangutan
population sizes over time” (Teacher Edition, page 160).
o Lesson 12: “When students participate in the Building Understandings Discussion, cue
your students to see through the lens of Stability and Change as they consider whether
the loss of one seed disperser population among other seed dispersers in the tropical
rainforest matters to the overall rainforest system (e.g., if seemingly small changes in
one part of the system could lead to larger changes throughout the whole system).
Suggested prompts are provided to support students to use this crosscutting concept as
they share their claims” (Teacher Edition, page 204).
o Lesson 12: “Have each group share their claims while other groups pose questions.
Display slide J. Say, Remember we are looking at what could happen if orangutans go
extinct. Based on Andrea’s current research, what claims can we start to make?”
(Teacher Edition, page 208). “Support your students in using a Stability and Change lens
during this discussion, by adding probing questions like the ones below: How might this
system be affected in the short term by the loss of the orangutans? How might this
system be affected in the long term by the loss of the orangutans? How might this
system be affected by a change in the seed dispersal throughout the tropical rainforest?
Is the loss of the orangutan disruptive enough to affect the whole system? Why or why
not?” (Teacher Edition, page 208).
o Lesson 13: “Ask partners to share how they modeled the scenarios and their prediction
for impacts on the system as a whole. As the class discusses each scenario, use sticky
notes, paper squares, or chips to cover up the population that is affected. What did we
predict would happen if there was a disease with durian fruit? What if this disease was
with figs? Let’s think about this in terms of the connections to other things. What can
we summarize about likely outcomes of a disruption if the thing most disrupted is only
connected to a few other parts of the system? To a lot of parts of the system? Sample
student response: If there are only a few connections, then the outcomes may not be as
bad. Animals may eat other fruits so if they lose 1 food source, it’s going to be OK. If the
thing that is disrupted has a lot of connections then a lot of populations are going to be
affected if that part of the system has a problem” (Teacher Edition, page219).
• Systems in dynamic equilibrium are stable due to a balance of feedback mechanisms.
o Lesson 9: “Generate a representation of what we figured out. During the discussion,
generate a shared class representation to represent fluctuations in population size with
Ecosystem Dynamics
28
normal fruit availability. An example representation has been provided. It is important
that there is some competition between individuals, but it will stay about the same with
normal fruit availability. As resources become slightly more or less plentiful, there will
be small increases or decreases in the population sizes. These increases and decreases
are called fluctuations. In this experiment, it is important to emphasize that the small
ups and downs that we see are due to very small changes in resource availability”
(Teacher Edition, page 155). “Differentiate between “normal” fluctuations in healthy
populations and fluctuations that are not normal. Point out that the orangutan
populations in each ecosystem seemed to be healthy, even though each ecosystem
supported a different number of orangutans per square kilometer. Say, I wonder, why
would each of these populations be considered healthy, while others might not be? In
the following discussion, help students see that healthy populations fluctuate, but
generally tend to fluctuate around the same average size. Populations that may not be
considered healthy might also fluctuate, but the average size of the population is likely
dropping. Have students described the line graphs they saw in Experiments 2 and 3 that
reflect healthy fluctuation and an unstable pattern” (Teacher Edition, page 163).
Teachers are provided with a sentence starter to help students describe cause and
effect relationships, "What feedback loops are causing this system to___." However,
that is the only time "feedback" is used explicitly.
• Explanations of stability and change in natural or designed systems can be constructed by
examining the changes over time and forces at different scales, including the atomic scale.
o Lesson 9: Students used simulation results to "to represent fluctuations in population
size with normal fruit availability” and “fluctuations in population size when the
percentage of fruit trees decreases” (Teacher Edition, page 155). Students use
simulation results to explain “healthy populations fluctuate, but generally tend to
fluctuate around the same average size. Populations that may not be considered healthy
might also fluctuate, but the average size of the population is likely dropping. Have
students described the line graphs they saw in Experiments 2 and 3 that reflect healthy
fluctuation and an unstable pattern” (Teacher Edition, page 163).
o Lesson 11: Students use simulations of population changes over time to explain how
environmental factors, such as food, change the stability of an ecosystem. “You will
work in groups to develop a system model for an oil palm farm… Draw the interactions
between populations: Start with food. Then add other kinds of interactions. Use the
agreed-upon colors. Pick a new color to represent what is changing in the system…
Discuss the question ‘How could a change in resources be related to changes in the rat,
snake, and pig populations?’” (Student Edition, page 41). “Use the same conventions
and process that your group used for the Oil Palm System Model... Discuss with your
class: What is similar between the oil palm system and rainforest system? What is
different? How are our system models limited?” (Student Edition, page 42).
Suggestions for Improvement
Science and Engineering Practices
Ecosystem Dynamics
29
• The materials claim six SEPs as being “focal.” Since students use and develop some elements
more than others and assessments are aligned to some elements more clearly than others,
consider defining the word “focal” and/or identify those elements that are used, developed, and
assessed less often with another label.
Disciplinary Core Ideas
• Consider adding a chart like the one on pages 17–18 for each lesson to provide clear guidance to
teachers about elements being used and developed.
• Consider including the specific DCI elements addressed at the beginning of each lesson.
Currently, the Building Toward NGSS section for each lesson lists all the unit performance
expectations and not the ones focused on in each lesson.
Crosscutting Concepts
• Consider adding opportunities for students to explicitly think about their use of specific
elements of the Stability and Change CCC.
• In Lesson 12, the teacher is currently given the suggestion: “When students participate in the
Building Understandings Discussion, cue your students to see through the lens of Stability and
Change as they consider whether the loss of one seed disperser population among other seed
dispersers in the tropical rainforest matters to the overall rainforest system” (Teacher Edition,
page 204). The suggestion to “cue your students” could be modified to place the students as the
drivers of their own learning with a suggestion such as “ask your students what lens they should
use as they investigate how the loss of one seed disperser population... could lead to a larger
change throughout the whole system.”
Extensive
The reviewers found Extensive evidence that student performances integrate elements of the three
dimensions in service of figuring out phenomena and designing solutions to problems because there are
numerous events where students are expected to figure something out or solve part of a problem in a
way that requires a grade-appropriate element of each of the three dimensions working together.
Evidence of the three dimensions used to explain the unit phenomenon include the following:
• Lesson 1: Students work to develop an initial model that can help them explain why orangutan
populations are decreasing at the same time as oil palm tree populations are increasing. When
developing initial models, students are asked to think about the individual components of the
Ecosystem Dynamics
30
ecosystem (e.g., oil palm trees, orangutans, tigers, etc.) and the interactions among those
components. This leads them to think about the ecosystem as a system of interacting
components. Students use their model to explain the phenomena by considering the cause-
and-effect relationships driving the interactions among the parts of the system. “First, identify
what we already know about what causes lead to the effect of increases and decreases in the
number of living things that are living in an area. Have students make a chart in their notebooks
and generate lists of things that could cause a population to go up or down. Have them label
their charts with “Causes” in the left-hand column and “Effect” in the top row. Students may
work with a partner to generate their lists. You may wish to provide an example to help
students get started” (Teacher Edition, page 38). “Next, lead a discussion to help students
identify which components would be important to identify in the model. On chart paper,
develop an initial list of the living and nonliving things in the ecosystem that we know about
right now…Agree on how we could represent what is happening to each component. Show
students how to indicate whether a component is going up, going down, staying the same, or if
they are uncertain. Next, agree on how we could represent the interaction between two
components” (Systems and System Models). “Select two components as an example—the
palm kernel and the rats. Show that we can represent an interaction between the two
components by drawing a line or an arrow and writing a quick explanation about the
interaction, which could draw from what we know about what leads populations to increase or
decrease” (Teacher Edition, page 39). “Work with a thought partner to develop an initial
model. Project slide P and refer students to Develop an Initial Model: Candy and Orangutans.
Assemble students into pairs to develop an initial model to answer the question, ‘How could
buying candy with palm oil affect orangutan populations and other populations in the wild?’”
(LS2.A: Interdependent Relationships in Ecosystems). “Students should develop their own
models but can talk things through with their thought partners. Partners do not need to co-
construct the same initial model, but they can if they want. Before students begin modeling,
prompt students to think about cause-and-effect relationships as they develop their initial
models” (Cause and Effect). “As students develop their initial models” (Developing and Using
Models), “circulate to encourage students to use the agreed-upon conventions” (Teacher
Edition, page 40).
• Lesson 9: “Use mathematical representations to draw conclusions about trends in orangutan
population sizes over time, depending upon resource availability. Record the population
results. For each trial, record the population low, high, average, total number of births, and
total number of deaths. Record the population size line graph” (Using Mathematics and
Computational Thinking). “Using a different color for each trial, sketch the orangutan
population size versus time line graph. Label each trial color by placing a dot next to the trial in
the chart above. Record the population results. For each trial, record the population low, high,
average, total number of births, and total number of deaths. Why did the population size
fluctuate? What claims can you make about the question “Would planting more fruit trees help
the orangutan population increase?” Why can you make this claim? What is your evidence?”
(Lesson 9 Student Handout, page 1). “Generate a representation of what we figured out.
During the discussion, generate a shared class representation to represent fluctuations in
Ecosystem Dynamics
31
population size with normal fruit availability” (LS2.A: Interdependent Relationships in
Ecosystems) (Stability and Change). “An example representation has been provided. It is
important that there is some competition between individuals, but it will stay about the same
with normal fruit availability. As resources become slightly more or less plentiful, there will be
small increases or decreases in the population sizes. These increases and decreases are called
fluctuations. In this experiment, it is important to emphasize that the small ups and downs that
we see are due to very small changes in resource availability” (Teacher Edition, page 155).
“Differentiate between “normal” fluctuations in healthy populations and fluctuations that are
not normal. Point out that the orangutan populations in each ecosystem seemed to be healthy,
even though each ecosystem supported a different number of orangutans per square
kilometer. Say, I wonder, why would each of these populations be considered healthy, while
others might not be? In the following discussion, help students see that healthy populations
fluctuate, but generally tend to fluctuate around the same average size. Populations that may
not be considered healthy might also fluctuate, but the average size of the population is likely
dropping. Have students described the line graphs they saw in Experiments 2 and 3 that reflect
healthy fluctuation and an unstable pattern” (Teacher Edition, page 163) (Stability and
Change).
• Lesson 11: “Explain that students are going to receive more information about these
populations and work in their small groups to develop a system model for the oil palm system.
Review with students what a system model represents using the conventions your class agreed
upon in Lesson 1. For example: Components or parts of the system may be represented by a
box. In this case, students determine that a box is often a population in the system.
Interactions between components (or populations) may be represented by a line between
boxes. Raise the issue that there are different ways populations could interact. Ask students to
share what they know right now about ways populations interact” (Teacher Edition, page 189).
“Have students add their ideas about resource availability to explain why rats and snakes could
increase at the same time…Remind students that here they are trying to explain the
simultaneous increase in rats and snakes (LS2.A: Interdependent Relationships in Ecosystems).
Prompt students to use the resource availability model from Lesson 10 to try to explain this
increase.” (Teacher Edition, page 190). “So we were wondering why these populations are not
increasing in the rainforest, and we have a few ideas as to why. We’re going to check our
thinking today by developing a system model for the tropical rainforest, similar to what we did
previously for oil palm” (Teacher Edition, page 194) (Developing and Using Models).
“Transition to explaining why snakes and rats are not increasing, and record a class consensus
model. Display slide K. Say, Let’s return to our question about why rat and snake populations
are not increasing a whole lot in the tropical rainforest. We had some ideas about resources or
food, predators, and competition. Did you notice any evidence that these ideas might help
explain why they are not increasing?” (Teacher Edition, page 196). “Purpose of the discussion:
To establish that there are similar predation and competition relationships in both systems, but
the rainforest system is much more complex, with more populations and more interactions
compared to the oil palm system” (Teacher Edition, page 197) (Systems and System Models).
Ecosystem Dynamics
32
Suggestions for Improvement
• Additional information about the integration of the dimensions at the element level, like that
provided in the scoring guidance document accompanying the “Monarch Butterflies on the
Shortgrass Prairie” assessment, would further strengthen this category.
Extensive
The reviewers found Extensive evidence that lessons fit together coherently to target a set of
performance expectations because all the lesson themes and content are sequenced coherently and
explicitly from the student’s perspective. Each lesson builds directly on prior lessons and makes the links
between lessons explicit to the students. Students have regular opportunities to engage in asking
questions based on what they have learned so far in the unit and revisit their questions in subsequent
lessons. Unit materials also support students in developing proficiency in the targeted performance
expectations.
Each lesson builds directly on prior lessons and makes the links between lessons explicit to the students.
As students move through the unit, part of what they figure out is used as the next question(s) to
pursue. Students also have regular opportunities to engage in asking questions based on what they have
learned so far in the unit and revisit their questions in subsequent lessons. Evidence includes:
• Lesson 1: At the end of Lesson 1 students determine what information they need to answer
their questions from the DQB. “Brainstorm ideas for data and information we need… Discuss
what questions to investigate next. Conclude the lesson by working with students to determine
your next steps…Direct students’ attention to the DQB and display slide W. Say, we asked a lot
of really good questions on our DQB! Which of these questions or clusters of questions do you
think we should investigate first to help us understand the problem? Allow students to propose
which questions they would like to pursue first.” (Teacher Edition, page 49).
Ecosystem Dynamics
33
• Lesson 2: At the end of the lesson: “Revisit the DQB to navigate to the next lesson….Say, It
seems like palm oil is the most efficient oil and is a better ingredient than other oils. So the
problem is more complicated, and it’s unlikely that palm oil will go away. Let’s revisit our DQB to
see what other questions we had about palm oil. Give students a minute to review questions on
the DQB and then take suggestions for future possible questions from the class. If no one brings
up questions about trying to grow palm oil somewhere else, prompt students with “If palm oil is
not going away, could we grow palm oil somewhere else to avoid cutting down the tropical
rainforest and hurting orangutans?” Have students share initial ideas about the next lesson
question: ‘Could we grow palm oil somewhere else so we’re not cutting down tropical
rainforests?’” (Teacher Edition, page 62).
• Lesson 3: The lesson starts with “Set the purpose for the lesson using questions from the DQB.
Display slide A. Have the Driving Question Board (DQB) visible to students. Stand near the DQB
and say, Yesterday we figured out palm oil was a better ingredient than alternatives. Can
someone remind us of why it was better than the alternatives?” (Teacher Edition, page 68).
• Lesson 5: The lesson ends with “Say, We’re going to continue to need land for humans, and we
know this will further change the ecosystem. What if we add another question to our mission to
try and figure out better ways to use the land? What about adding the question, “How can we
use land in ways that work for humans and other living things?” See if students want to make
changes to this question before posting it to the DQB and a second unit driving question”
(Teacher Edition, page 98).
• Lesson 6: The lesson begins with “Say, Over the past several lessons, we have figured out that
changing the land can impact living things. We were left wondering how we can use the land in
ways that work for both people and other living things. Let’s return to the palm oil problem and
think about what we have figured out about the problem that makes it more complicated than
we originally thought. Prompt partners to discuss the following question: What is one new thing
we have learned about this problem, and how did it make the problem more complicated to
solve?” (Teacher Edition, page 103)
• Lesson 6: “Let’s take stock of what we have figured out and see if we can more clearly define the
problem. Display slide B. Ask students to work with a partner and use their Progress Trackers
from their science notebooks to go through each lesson and identify what we figured out. Ask
students to record each idea we figured out on separate sticky notes. Discuss as a whole group
to define the problem and move DQB questions we have answered. Bring students together so
that they can see the DQB and new sticky notes. Say, Let’s see if we can summarize our ideas to
more clearly define the problem. Work together to summarize what the class has figured out. As
ideas are discussed, move the questions we think we can now answer to a new space (e.g., a
chart paper titled ‘Questions We Have Answered’), with the sticky notes for what the class has
figured out next to the appropriate questions” (Teacher Edition, page 103).
• Lesson 10: “What questions on our DQB do we still need to answer about these populations?
Say, In the next lesson, let’s revisit some of the questions we had about these other populations
to see what we might be able to explain now, or what we still don’t quite understand” (Teacher
Edition, page 182).
Ecosystem Dynamics
34
The Unit Overview lists “Building Toward NGSS Performance Expectations” (Teacher Edition, page 1) and
the evidence listed in Criterion I.B outlines full coverage of each element.
Suggestions for Improvement
N/A
Adequate
The reviewers found adequate evidence that links are made across the science domains when
appropriate because there are some connections between the life sciences and Earth and space sciences
domains in order for students to explain the unit phenomenon.
Related evidence includes:
• The unit materials focus on three life sciences DCIs and one Earth and space sciences DCI. All
these DCIs support one another as they focus on ecosystems, changes in ecosystems, and how
those changes affect living things.
• It is not evident that the unit materials clearly convey to students how ideas from the life and
Earth sciences domains work together to explain the phenomenon and design the solution to
the problem.
• It is not evident that grade-appropriate elements of crosscutting concepts are explicitly used to
make connections across science domains.
Suggestions for Improvement
• Consider including guidance for ways teachers can make the connections between scientific
concepts from life, Earth, or physical sciences more explicit to students. For example, the class
could discuss why the phenomenon and redesign of the palm oil farm requires both life and
Earth sciences, and why understanding an orangutan energy and energy transfer requires both
life and physical sciences.
Ecosystem Dynamics
35
• Consider providing guidance on ways students could connect the crosscutting concepts across
science domains so students can see the importance of the CCCs as tools that can be used to
make sense of concepts in all science domains.
Extensive
The reviewers found extensive evidence that the materials provide grade-appropriate connections to
the Common Core State Standards (CCSS) in mathematics, English language arts (ELA), history, social
studies, or technical standards because the unit materials provide the mathematics and ELA standards
that are used in the unit. The unit also provides multiple ways for students to use reading, writing,
speaking, and listening skills to make sense of the unit phenomenon.
Materials explicitly state mathematics and ELA standards that are used in the unit. For example:
• Supporting Students in Making Connections in ELA sections are included in several lessons. For
example:
o Lesson 11: “CCSS.ELA-Literacy.RST.6-8.7 Integrate quantitative or technical information
expressed in words in a text with a version of that information expressed visually (e.g., in a
flowchart, diagram, model, graph, or table). In order for students to develop their system
models, they must decipher technical information from a text that describes populations in
each system and how those populations interact with one another. Students transfer that
information to a graphical representation, or system model, using the agreed-upon
modeling conventions to show components and interactions in the system. They layer on
information about resource and population changes in the model” (Teacher Edition, page
199).
o Lesson 18: “CCSS.ELA-Literacy.SL.7.4: Present claims and findings, emphasizing salient points
in a focused, coherent manner with pertinent descriptions, facts, details, and examples; use
appropriate eye contact, adequate volume, and clear pronunciation. Students will present
their best designs to their peers and make claims about what works well in the designs given
the criteria and constraints. CCSS.ELA-Literacy.SL.7.3: Delineate a speaker's argument and
specific claims, evaluating the soundness of the reasoning and the relevance and sufficiency
of the evidence. During the Consensus Discussion and during peer feedback, students will
need to listen to arguments made by their classmates to determine the claims made and
Ecosystem Dynamics
36
whether there is sufficient evidence and sound reasoning to support the claims” (Teacher
Edition, page 291).
o Lesson 3: “CCSS.ELA-Literacy.SL.7.1: Engage effectively in a range of collaborative
discussions (one-on-one, in groups, and teacher-led) with diverse partners on grade 7 topics,
texts, and issues, building on others' ideas and expressing their own clearly. Students will
have opportunities to engage in both small group and whole-group discussion to answer
their questions about whether planting oil palm elsewhere is an option” (Teacher Edition,
page 74).
o Lesson 8: “CCSS.Math.Content.6.SP.A.2 Understand that a set of data collected to answer a
statistical question has a distribution which can be described by its center, spread, and
overall shape. CCSS.Math.Content.6.SP.B.4 Display numerical data in plots on a number line,
including dot plots, histograms, and box plots. CCSS.Math.Content.6.SP.B.5.c Giving
quantitative measures of center (median and/or mean) and variability (interquartile range
and/or mean absolute deviation), as well as describing any overall pattern and any striking
deviations from the overall pattern with reference to the context in which the data were
gathered. CCSS.Math.Content.7.SP.A.1 Understand that statistics can be used to gain
information about a population by examining a sample of the population; generalizations
about a population from a sample are valid only if the sample is representative of that
population. In this lesson, students dive deeply into the mathematical concepts of central
tendency and range. Students primarily engage with the math concepts they developed in
6th grade. Students use data from simulations to identify ranges (maximum and minimum)
and means (average) for the orangutan populations, with respect to the energy they obtain
from their environment. Use this opportunity to help students understand that
measurements such as mean and range are useful measurements when looking at larger
groups of things (e.g., populations of orangutans). This will push your students into 7th
grade statistical math concepts. Students also construct class histograms. By constructing
the histogram, students are building mathematical ideas related to graphing data--in this
case, how data from individuals will map to graphs for populations. The transition between
individual outcomes and population outcomes is a focus of students’ make-sense questions.
Students learn that this transition also influences the kinds of conclusions we can draw from
graphs” (Teacher Edition, page 145).
Students use reading skills to develop understanding and explanations of the scientific concepts,
phenomena, or results. This purpose is often made explicit to students. Reading materials also go
beyond textbooks. Related evidence includes:
• Lesson 1: “Introduce the reading. Project slide N and say, I have a short reading about the oil
palm trees and how they are grown and used for palm oil. There may be more information in
the reading about the problem we discussed yesterday.” (Teacher Edition, page 37).
• Lesson 2: Prior to reading “Soybean Farms in the Midwest” or “Canola Farms in Canada”
materials suggest to “Introduce a pre-reading strategy. Tell students that you have some short
readings about these two kinds of oil. Ask students to define the purpose of this reading. Listen
for students to suggest the following: To learn more about soybean and canola oils, and
Ecosystem Dynamics
37
compare them to palm oil To find out if there is a substitute for palm oil that is a better choice”
(Teacher Edition, page 57).
• Lesson 3: “Students should be able to read the farmer’s almanac entry to identify the specific
growing conditions for the oil palm plant” (Teacher Edition, page 74).
• Lesson 5: “Apps are available to use in addition to the outdoor activity.” “Students can explore
iNaturalist to make observations of local plant and animal life that have been uploaded in your
area by community members” (Teacher Edition, page 89).
• Lesson 7: “Students read and gather information from an interactive, web-based text that
provides multi-faceted details about a specific geographic area. “Prepare to explore the
StoryMap. Say, Now that we know how scientists collect data about orangutans, let’s explore
some of the data on orangutan numbers that have been generated by these scientists. Project
slide D and remind students that the question we are trying to answer is “How many
orangutans typically live in the tropical rainforest?” Open the Orangutans in Protected Areas of
Borneo and Sumatra StoryMap from https://tinyurl.com/orangutanstorymap. Review a process
for students to explore the StoryMap. One process might include that students read the
StoryMap once, and then discuss with their partner what information is important to record
and how to best organize the information. Then, students read the StoryMap a second time,
documenting important information in their science notebooks. Update slide D to reflect the
process you want students to use” (Teacher Edition, page 113).
• Lesson 10: “Introduce the resource change case studies. Arrange students into four or eight
small groups, depending on the size of the class. Give each student in each group 1 copy of the
group’s assigned case study from Case Study Cards. Case assignments can be driven partly by
student choice, but make certain each case is taken up by a group” (Teacher Edition, page 172).
“Explain to students that each group has a different case study of an example where there was
a change in the amount of resources that an organism needed. Point out to students that each
case study has words, images, and graphs. Direct students to highlight and label important
information as they read. Ask students to identify what each group should look for as they read
and analyze their case study” (Teacher Edition, page 173).
• Lesson 11: Students read case studies and apply learning to a system model. “In order for
students to develop their system models, they must decipher technical information from a text
that describes populations in each system and how those populations interact with one
another. Students transfer that information to a graphical representation, or system model,
using the agreed-upon modeling conventions to show components and interactions in the
system. They layer on information about resource and population changes in the model.”
(Teacher Edition, page 199).
• Lesson 12: “Introduce students to Andrea Blackburn, who studies the orangutans’ role in the
tropical rainforest ecosystem. Have students read about Andrea and her research” (Teacher
Edition, page 202). “Pass out 1 copy of the Interview with a Scientist Studying Orangutans
reference sheet to each student. Give students about 5 minutes to read on their own about
Andrea Blackburn and her research questions and methods, or read together as a class”
(Teacher Edition, page 206).
Ecosystem Dynamics
38
Students use writing skills to explain and communicate their understanding of the scientific concepts,
phenomena, or results. Writing assignments are varied in structure and purpose. Related evidence
includes:
• Lesson 5: “A Progress Tracker entry would be valuable if time permits (see slide L). Remind
students of the lesson question, How have changes in our community affected what lives here?
Encourage them to write and draw what they have figured out about the lesson question in
their science notebooks” (Teacher Edition, page 98).
• Lesson 13: “This assessment encourages students to demonstrate their understanding of key
skills and concepts from the unit so far through multiple modalities, including analyzing…data
and writing arguments to support claims. Some students may benefit from using multiple
modalities to share their thinking for any or all of the questions on this assessment. In each case,
encouraging students to use multiple modalities to share their thinking creates a clear,
accessible, equitable pathway for all students to demonstrate proficiency. Sharing orally may be
particularly beneficial for some students” (Teacher Edition, page 226).
Students have multiple opportunities for speaking and listening (to peers) in a variety of formats and
scenarios. For example:
• Lesson 7: “Discuss the lesson question in small groups. Project slide M. Bring students together
to discuss the new overarching lesson question: “How many orangutans live in a given area?”
They should also discuss a related question: “Why is it important to think about the number of
orangutans per area?” Have students discuss these questions with a partner first and then share
their ideas with the whole class. Have students discuss why we could not answer the original
lesson question” (Teacher Edition, page 121).
• Lesson 10: “Facilitate A Consensus Discussion: When students are ready, have them share their
ideas with the class. Lead a discussion to help students find patterns across their different case
studies” (Teacher Edition, page 177).
• Lesson 18: “Peer Feedback and Revisions: With a partner 21. Present your argument to a peer
for about 1 minute. 22. Listen to feedback about what to add or change to make it more
convincing for about 1 minute. 23. Then, switch and repeat for the other partner’s argument”
(Student Edition, page 68).
Literacy skills expected are not above grade level. For example:
• Lesson 14: “Universal Design for Learning: Note that while the scientific information in each of
these readings is equally rigorous, they are written at different reading levels to support
differentiation. Consider grouping students strategically so that students who need more
support with scientific texts are distributed among mixed-expertise groups assigned readings of
grade-level complexity, while students who are looking for a challenge are in groups assigned
readings at a higher level. Readings increase in difficulty: Summarizing ways to grow food -
Flesch-Kincaid Grade Level 6.1 Diversified farming in Costa Rica - Flesch-Kincaid Grade Level 7.4
Sustainable palm oil in Indonesia - Flesch-Kincaid Grade Level 8.7” (Teacher Edition, page 233).
• Lesson 15: “Universal Design for Learning: Similar to the readings in Lesson 14, the scientific
information in each StoryMap is equally rigorous, but the printed text is written at three
Ecosystem Dynamics
39
different reading levels to support differentiation. https://arcg.is/1rHr4y - Flesch-Kincaid Grade
Level 6.3 https://arcg.is/180vXT - Flesch-Kincaid Grade Level 7.5 https://arcg.is/1yayrC - Flesch-
Kincaid Grade Level 8.4” (Teacher Edition, page 242).
• Teacher Background provides “Guidance for Developing Your Word Wall.” The guidance
includes “words we earn”, “words we encounter”, and “words from previous unit” for each
lesson. Teachers are reminded “The words we earn and words we encounter in this unit are
listed in this document and in each lesson to help prepare and to avoid introducing a word
before students have earned it. They are not intended as a vocabulary list for students to study
before a lesson, as that would undermine the authentic and lasting connection students can
make with these words when they are allowed to experience them first as ideas they’re trying to
figure out” (Teacher Edition, page 23).
Wherever a reasonable match exists to the science or engineering subject matter (e.g., where
mathematics could aid in sense-making or problem solving), mathematics concepts are explicitly
incorporated into lessons such that students use them to explain or help understand the scientific
concepts, phenomena, or results. The mathematics connections are not above grade level. Related
evidence includes:
• Lesson 7: “Introduce the idea of calculating the ratio of orangutans to land area. Say, It’s hard
to compare the orangutan populations in each park because the areas are so different. We
think the protected areas that are larger have more orangutans than smaller areas. But that
may just be because there is more space for them to live. So is the Leuser Ecosystem orangutan
population larger because the area is just bigger? How can we standardize the area so that we
can compare the different parks? Project slide H and have students share some ideas. Listen for
ideas related to division, fractions, ratios, and density. How many orangutans do you think we
would find in 1 km in each of these parks? How can we determine this? Sample student
responses: Not sure. Divide the number of orangutans by the amount of space for each area.
Introduce the idea of calculating the ratio of orangutans to land area” (Teacher Edition, page
118).
• Lesson 8: “Record the results from the experiment. At the end of the experiment, have
students record their individual results on the handout. Next, have students record the
population results. Create a class histogram. Use the same process to create a class histogram
that you used in Experiment A. Pass out one sticky note per orangutan (for a total of 15 sticky
notes). Use one of the blank axes that you prepared prior to class. Have students add their
sticky notes to the histogram according to the energy of their orangutans. After generating the
class histogram, prompt students to sketch the histogram in their science notebooks in the
space indicated under “Results” for Experiment B. Lead a class discussion to reflect on the
findings. Project the discussion prompts on slide M. Prompt students to consider the ways in
which the orangutans’ diet changes when there are fewer fruit trees and how that might be
related to the orangutans’ chance for survival” (Teacher Edition, page 138).
• Lesson 9: Students are prompted to “record the population results. For each trial, record the
population low, high, average, total number of births, and total number of deaths. Record the
population size line graph. Using a different color for each trial, sketch the orangutan
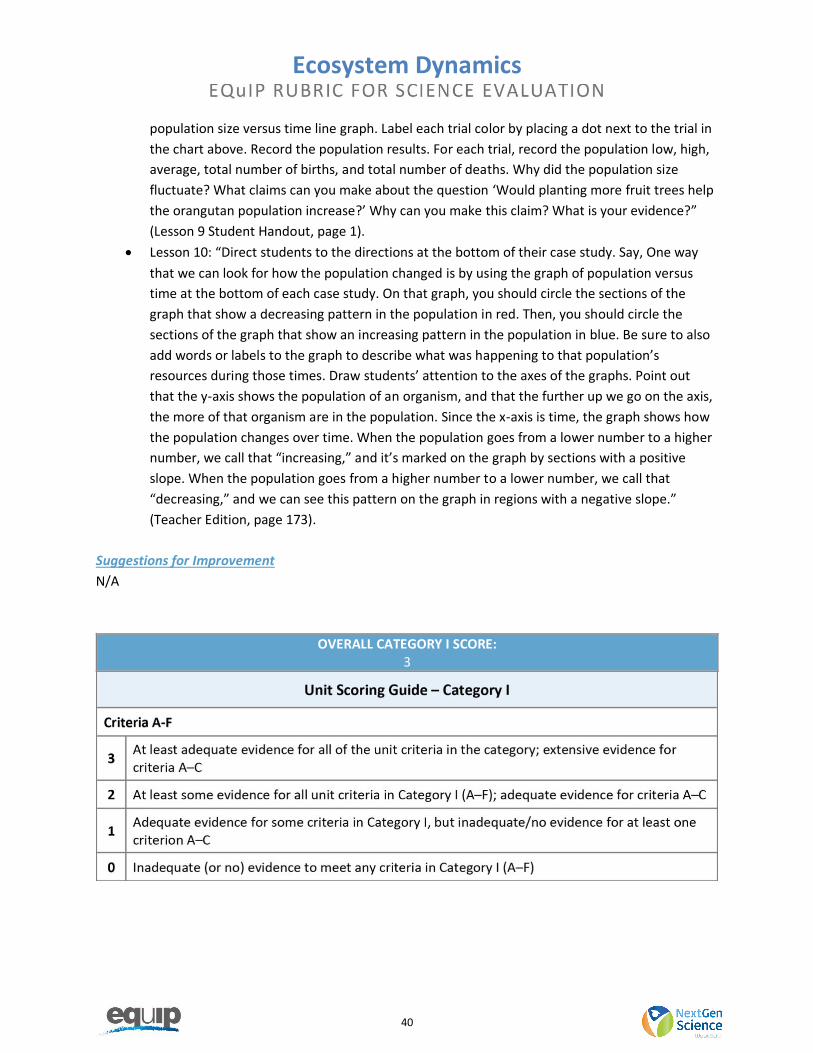
Ecosystem Dynamics
40
population size versus time line graph. Label each trial color by placing a dot next to the trial in
the chart above. Record the population results. For each trial, record the population low, high,
average, total number of births, and total number of deaths. Why did the population size
fluctuate? What claims can you make about the question ‘Would planting more fruit trees help
the orangutan population increase?’ Why can you make this claim? What is your evidence?”
(Lesson 9 Student Handout, page 1).
• Lesson 10: “Direct students to the directions at the bottom of their case study. Say, One way
that we can look for how the population changed is by using the graph of population versus
time at the bottom of each case study. On that graph, you should circle the sections of the
graph that show a decreasing pattern in the population in red. Then, you should circle the
sections of the graph that show an increasing pattern in the population in blue. Be sure to also
add words or labels to the graph to describe what was happening to that population’s
resources during those times. Draw students’ attention to the axes of the graphs. Point out
that the y-axis shows the population of an organism, and that the further up we go on the axis,
the more of that organism are in the population. Since the x-axis is time, the graph shows how
the population changes over time. When the population goes from a lower number to a higher
number, we call that “increasing,” and it’s marked on the graph by sections with a positive
slope. When the population goes from a higher number to a lower number, we call that
“decreasing,” and we can see this pattern on the graph in regions with a negative slope.”
(Teacher Edition, page 173).
Suggestions for Improvement
N/A
OVERALL CATEGORY I SCORE: 3
Ecosystem Dynamics
41
CATEGORY II
Ecosystem Dynamics
42
Extensive
The reviewers found extensive evidence that the materials engage students in authentic and meaningful
scenarios that reflect the real world because the phenomenon, problem, and classroom activities used
are engaging to students and reflect grade-appropriate, real-world scenarios that students authentically
want to figure out or solve. Students are provided with opportunities to experience the phenomena as
directly as possible and connect learning to home and neighborhood.
Students are provided with opportunities to experience phenomena as directly as possible, and
suggestions are provided to make the activities and phenomena more relevant for students. For
example:
• Lesson 1: Students are provided with a headline “Orangutans Could Face Complete Extinction
Within 10 Years, Animal Charity Warns.” This headline is followed by a video of orangutans and
information on an “Orangutan reference card” (Teacher Edition, page 30).
• Lesson 1: “If you are teaching this unit around a particular holiday event (Halloween, Valentine’s
Day, etc.), situate the candy topic around the holiday to increase relevance for students”
(Teacher Edition, page 30).
• Lesson 2: Video “Malaysian Palm Oil - From Tree to Table” shows Malaysia oil palm trees, palm
kernels, and extraction of palm oil. “Spend about 2-3 minutes sharing students’ observations
about the video and discuss how this process is similar to or different from those you learned
about in the previous Maple Syrup Unit” (Teacher Edition, page 56).
• Lesson 4: Video “Agriculture-Palm Oil Farming” shows and describes the use of palm oil, map of
Indonesia’s oil palms, changes to environment, and people who harvest and depend upon the
harvesting of palm oil and care for the environment. “Tell students that the class is going to
watch a short video in which a few of these farmers are interviewed about how the opportunity
to grow oil palms has affected their lives and the lives of their families” (Teacher Edition, page
80).
Ecosystem Dynamics
43
• Lesson 5: Students go outside of their school to identify how humans have changed the
ecosystem around their building. “We’re going to make some additional observations around
the school to get a sense of the changes that have occurred here and the living things that are
still present or not present in our area” (Teacher Edition, page 92).
• Lesson 7: Students watch the video “Trialing Thermal Imaging Technology to Monitor
Orangutan.” In the video, Serge Wich, a primatologist shares how he detects the size of
orangutan populations. Students watch orangutans in their natural habitat with infrared
detection being used to count the number of orangutans. (Teacher Edition, page 111).
• Lesson 15: StoryMaps “include text and video interviews with people who explain how they
benefit from growing food in ways that differ from monocropping” (Teacher Edition, page 238).
The phenomenon and classroom activities used are engaging to students and reflect real-world
scenarios that students authentically want to figure out. For example:
• Unit Overview: “The palm oil problem was chosen for this unit after reviewing interest survey
results from middle school students, consulting with several external advisory panels, and
piloting in middle school classrooms. It was chosen for the following reasons: The palm oil
problem provides a rich context for students to engage with all the Disciplinary Core Ideas (DCIs)
that are bundled with the Performance Expectations of the unit, and to do so in compelling
ways. Agricultural practices and biodiversity are not always at odds with each other, but there is
a real tension between the monocrop farming methods today and maintaining biodiverse
systems. This tension sets students up for authentic problem-solving and design tasks, keeping
in mind different perspectives on the issue and different possible solutions. Protecting the
rainforest and the orangutan is a natural inclination for young people” (Teacher Edition, page
15).
• Lesson 4: “Come to an agreement as a class that it would be helpful to hear from some real
farmers and see what their reasons are for cutting down tropical rainforests to make room to
grow oil palms. grow oil palm was to ask some of them directly. Display slide B. Tell students
that the class is going to watch a short video in which a few of these farmers are interviewed
about how the opportunity to grow oil palms has affected their lives and the lives of their
families. Ask students to record noticings and wonderings from the video in their science
notebooks” (Teacher Edition, page 79).
• Lesson 8: Support is provided to develop this SEP and to help students build an understanding of
the many ways scientists investigate the world. “Students carry out experiments in a simulated
space and may not view these as “lab experiments.” Use this opportunity to broaden students’
understanding of different ways that scientists investigate the world, particularly through the
use of computer simulations that allow multiple scenarios and trials to be run. It’s important to
also share that computer simulations are based on estimates from field data, so at some point
research on orangutans in their real environment was used to create the computer model”
(Teacher Edition, page 130).
• Lesson 18: “Convene the whole class to begin the Consensus Discussion. Encourage students to
first make claims about how the designs worked for people, for orangutans, or both. After 5
Ecosystem Dynamics
44
minutes, transition to a discussion of trade-offs (slide E) and close out the discussion by
considering these designs in the real-world” (Teacher Edition, page 284).
Students have multiple opportunities to connect the phenomena they figure out or problems they solve
to their own prior experiences, community, or culture. For example:
• Lesson 1: “What other products do you think might include palm oil? Where could you look in
your home, at school, or in your neighborhood to find such products (so you can check the
ingredient lists)? Assign the palm oil scavenger hunt. Say, It sounds like we have some searching
to do! Spend some time looking for these products in your home, school, or community. You
don’t need to move the product or bring it to class—just take a look at the ingredient list.
Document what you find in your science notebooks” (Teacher Edition, page 35).
• Lesson 1: “Have students locate their home learning on related phenomena. Project slide S and
have students take out their home learning from the previous day. Remind students that they
were asked to think about other examples where changing one component in an ecosystem
caused other components to also change. Have students share their ideas with a partner. After a
few moments, have students share their ideas with the whole class. Accept all student
responses. Try to draw out a wide variety of related phenomena. Encourage students to
consider how the related phenomena are similar to or different from the case of the orangutans
and the oil palms. Keep a public record of the related phenomena. You may also want to prompt
students to keep a record of the related phenomena in their science notebooks” (Teacher
Edition, page 45).
• Lesson 5: “Share students’ home learning experiences in small groups. Display slide A. Say, We
were wondering what kinds of environmental changes an Indonesian farmer might observe in
our community if they were to visit our area, along with whether these changes affect living
things. Let’s see what kinds of information you were able to gather and document in your
murals. Ask students to retrieve their home learning How have people changed the land where
we live? handout, and arrange students in groups of 3. Give students about 5 minutes to share
Part 1 of their murals with each other. As students discuss, encourage them to share their
sources of information, such as family members they spoke with, books they consulted, or
internet searches they conducted” (Teacher Edition, page 91).
• Lesson 5: Students explore their own schoolyard community to examine how humans have
affected the area over time and they connect this to the orangutan habitat phenomenon.
“Discuss and examine photographs of the area before major human disturbance….Ask the
following questions from Part 2 of students’ handouts. How did people change the land where
you live? Why do you think people made these changes to the land where you live?)” (Teacher
Edition, page 91). “Frame the outdoor observation activity. Display slide C. Say, Oil palm farms
have created a lot of change in the Indonesian ecosystems. But we’ve identified that our own
community has changed the ecosystem in various ways too. We’re going to make some
additional observations around the school to get a sense of the changes that have occurred here
and the living things that are still present or not present in our area….Encourage students to
notice land-use change around their school, and to use the term, if needed, to describe changes
they observe” (Teacher Edition, page 92).
Ecosystem Dynamics
45
• Lesson 13: “Assign students to notice at home and school where we have biodiverse plant
communities and plant communities more like monocrop in their lives. Display slide K. Assign
students to be more aware and notice plants in their lives. Ask them to identify examples of
where they see biodiverse plants or plants more like monocrops. They can photo document
these examples to share with the class. If your students need help getting started, you may want
to brainstorm a few ideas as a class. Ask students, Where do we have plants around our school,
home, and communities? Listen for examples like: lawns and landscaping at home or school,
plants in front of buildings, trees planted along a street, no trees at all—just concrete or
pavement, gardens, a schoolyard, parks, river trails, fields near our school. Have students turn
and talk about their home learning. Display slide L. Allow students 1–2 minutes to share what
they noticed in their communities, responding to the first two prompts on the slide. Where did
you observe biodiverse plants? Where did you observe plants like a monocrop (or single plants
of the same kind)?” (Teacher Edition, page 222).
• Lesson 14: “Customary Forests are one approach to cultivating food that students explore in this
lesson. This involves intentionally tending plants and animals in the forest for food, medicine,
and crafts. It is a way of life for indigenous peoples around the world. People are deeply
integrated into and part of the natural world. Tending the wild requires deep ecological
knowledge and wisdom that is distinct from western science. It continues to be practiced today,
especially in places where indigenous communities have land rights and tribal sovereignty. If you
have students from indigenous communities, give them an opportunity to share their
culturaland ecological knowledge. If you don’t, this is an opportunity to highlight indigenous
peoples in our communities, practicing their ways of life. Resources to learn more about
traditional ecological knowledge: https://www.pbs.org/show/tending-wild/
https://www.sciencemag.org/news/2021/04/pacific-northwest-s-forest-gardens-were-
deliberately-planted-indigenous-people” (Teacher Edition, page 234).
Options based upon student interest are included in unit materials. For example:
• Two options are provided to extend student’s learning beyond Lesson 18, based upon time and
student interest. “Decision point: Do my students want to raise awareness about palm oil or do
they want to apply ideas to new context?” (Teacher Edition, page 16). “You and your students
have a choice about how to end the unit, with options to raise awareness about the problem or
apply science ideas to a local problem in their community” (Teacher Edition, page 17).
• Lesson 10: Students test learning and look for patterns between fluctuating orangutan
populations and another organism. “There are seven case studies available to use. Consider
choosing four cases based on your student’s interests and what’s most relevant to them.” A
Population Case Template is included if teachers “would like to create a case for a local
population or for a population of particular interest to your students” (Teacher Edition, page
169).
• Lesson 14: Students brainstorm ways to grow food that supports plant and animal populations.
“This is an opportunity to leverage students' prior knowledge and experiences with different
approaches to growing food. Prompt students for different kinds of farming approaches they are
Ecosystem Dynamics
46
familiar with as well as smaller scale gardening approaches that might apply to larger farming
operations” (Teacher Edition, page 233).
Suggestions for Improvement
• Consider expanding on choices based upon student interest and connections to home and
community for all students.
Extensive
The reviewers found extensive evidence that the materials provide students with opportunities to both
share their ideas and thinking and respond to feedback on their ideas because the materials provide
supports for teachers to act as the expert facilitator and elicit student ideas, students have opportunities
to share ideas with peers to improve their own thinking, and some supports for feedback and
opportunities for students to reflect on and reply to feedback are provided. However, feedback and
opportunities for students to reflect on the feedback is concentrated near the end of the unit versus
throughout the unit.
Student artifacts include elaborations, reasoning, and reflection and show how students’ reflective
thinking changes over time. For example:
• Lesson 2: “Set up the Progress Tracker for an individual reflection. Explain to students that we
want to take some individual time to capture what we have figured out from our reading about
different types of oils. Have students turn to the Progress Tracker section in their notebooks.
Use slide K to guide students in drawing a T-chart on the first page of this section and to
complete the two columns, filling in the lesson question: “Is there a substitute for palm oil?”
This should be followed by their response. Give students 3–5 minutes to quietly update their
Progress Trackers, using words and drawings to show what they have figured out about
possible palm oil substitutes. Ask students to draw a line underneath their responses when
they are done. Prompt students to identify and use any patterns from the readings they have
reviewed” (Teacher Edition, page 61). Students update their Progress Tracker with their new
learning in Lessons 3–5, 7–9, 11, 14–16, and 18.
• Lesson 8: “Using the boxes under “Make Sense,” circle a claim, provide data to support your
claim, and record factors contributing to the outcomes for your individual orangutan and the
population of orangutans. With your class, discuss the following questions: a. What claim can
you now make about why orangutans need so much forest space? b. What claim can you now
Ecosystem Dynamics
47
make about how changing the percentage of fruit trees in the tropical rainforest (independent
variable) affected individual orangutan energy and the orangutan population as a whole
(dependent variable)?” (Student Edition, page 30).
• Lesson 11: “When the groups complete their models, direct them to place their group’s model
in a designated location with other groups’ models. They should be lined up in a row, to make
for easy comparisons across all group models…Give students time to examine other models.
Ask students to examine the group models for about 1–2 minutes and jot down their noticings.
Facilitate a sharing of noticings across tropical rainforest system models. Display slide J, which
includes initial discussion prompts” (Teacher Edition, page 195).
• Lesson 16: “Ask students to rank the approaches to growing food for animals and plants. Give
students 1–2 minutes to review their jigsaw handout (Summarizing ways to grow food) and to
decide which approach to growing food they think is best for animals and plants. Have them
also consider which approach they think is second and third best. Choose which color sticky
note you would like students to use for the “best” option, the second best option, and the third
best. You may want students to mark these with a large “1”, “2”, and “3” drawn in dark marker.
When ready, invite students to place their sticky notes in the appropriate rows of the “animal
and plants” column. Repeat this procedure for “people”” (Teacher Edition, page 253).
“Facilitate discussion about trade-offs. Say, It looks like some approaches were ranked
differently for people than for animals and plants. Let’s talk about why we ranked approaches
the way that we did. Display slide H. Call on students to clarify their claims about which way of
growing food is best, using evidence from the jigsaw activity. Foster cross-talk between
students, continuing to encourage students to cite evidence and ask clarifying questions of
their peers using the provided prompts in the “What to do” assessment guidance” (Teacher
Edition, page 255).
• Lesson 17: “Optimize the redesign solution (Part G). Display slide O with the instructions.
Students should begin the process by reviewing the feedback they received and recording their
key takeaways on Part G of their How can we redesign the way land is used in Indonesia to
support orangutans and people at the same time? handout. Next, students should discuss their
redesign with their group. Finally, students should work with their group to optimize the
design. Once students have optimized their design, prompt them to reflect on the process
using the prompt on the slide and in the handout: Review your experiment and trial history.
What were some key adjustments you made in your optimized redesign? How did the
adjustments help the orangutans, the people, or both?” (Teacher Edition, page 273).
Supports are provided to guide teacher or peer feedback to students based on student performance. For
example:
• Lesson 1: “Peer or Teacher Feedback: Provide feedback to another student using the following
table. Is the question open ended? Yes or no? Feedback and/or suggested revision Does the
information or data in question #5 help answer the question? Does the question help the
student achieve their purpose for asking the question?” (Teacher Edition, page 352).
• Lesson 17: “Evaluate draft solutions (Part F). Display slide N with the instructions. Explain that
students are going to have the opportunity to evaluate the solutions proposed by at least two
Ecosystem Dynamics
48
other groups. The purpose of this activity is to check the proposed solutions against the criteria
and constraints, to provide constructive feedback to peers, and to get ideas and learn from one
another’s solutions. Students will view the solutions designed by at least two other groups and
evaluate the solutions using the prompts on slide N and in Part F of their How can we redesign
the way land is used in Indonesia to support orangutans and people at the same time? handout.
Students should work individually to reflect on the design and then convene with their group to
determine some feedback to give to the group that they are reviewing. Students should record
their feedback on a sticky note” (Teacher Edition, page 273).
• Lesson 17: “Teacher Reference: Teacher Feedback on Land Redesign Projects: Strategies for
providing feedback: Before providing feedback, view the work students are doing on the
computer simulation and the current status of their design. Listen carefully to group
conversations to get a sense of the tradeoffs students are considering. When you feel ready to
provide feedback, consider the following strategies: Provide verbal feedback: Use sticky notes to
record feedback and leave the sticky note feedback with the group. Have students copy a
screenshot of a design and the associated code into the Design Solutions Slide Deck. Leave
feedback directly in the slide deck or send an electronic message to group members. Sentence
frames for providing feedback the following sentence frames are intended as guides to help you
frame your feedback. Each sentence frame begins with something that you notice about the
design and concludes with something that you wonder about the design. I appreciate how you
__. I wonder how __ might work. I see you are thinking about __. What do you think might
happen if you try I hear some agreement/disagreement on __. How might you test your ideas?...
Examples of helpful feedback: The following examples are intended as guides for useful
feedback. I appreciate how you are working to diversify your land use. I notice you doing it in
Area A where you added customary forests and other crops. I wonder how laying out the
diversified forests differently might impact the orangutan population. I see that you are thinking
about working together to create large areas of rainforest and customary forest. What do you
think might happen if you try moving that larger area of forest from the right side of the
simulation to the left side of the simulation? I hear some disagreement whether adding other
crops might work the same, better, or worse than adding customary forest. How might you test
your ideas? I noticed that you added more oil palm farms in Area C. Can you explain what
influenced your decision?” (Teacher Edition, page 385).
• Lesson 19: “Giving Feedback to Peers: This tool was inspired by the Sticky Note Feedback
resource originally developed by Ambitious Science Teaching at:
https://ambitiousscienceteaching.org/sticky-note-student-feedback/. Feedback needs to be
specific and actionable. For feedback to be productive, it needs to be related to science ideas
and provide suggestions for improvement. Here are some examples of productive feedback:
‘Your model shows that the sound source changes position when it is hit. I think you should add
detail about how the sound source moves back and forth after it is hit.’ ‘You said that the drum
moves when it makes a sound, but the table doesn’t move when it makes a sound. We disagree
and suggest reviewing the observation data from the laser investigation.’ Here are some
examples of nonproductive feedback that does not help other students improve: ‘I like your
drawing.’ ‘Your poster is really pretty.’ ‘I agree with everything you said.’ How to Give Feedback:
Ecosystem Dynamics
49
Your feedback should give ideas for specific changes or additions the person or group can make.
Use the sentence starters below if you need help writing feedback. ‘The poster said __. We
disagree because __. We think you should change __’” (Teacher Edition, page 404).
• Teacher feedback and support for teacher feedback occur towards the end of the unit (Lesson
17) and not throughout most of the earlier lessons, as the Lesson 1 prompts are for either peer
or teacher feedback. Therefore, if teachers choose to use the Lesson 1 prompts as peer
feedback only, students will have very little time to learn from and apply teacher feedback
during the unit.
Students are provided with opportunities to share and revise thinking based upon peer feedback. For
example:
• Lesson 1: Students “generate a list of questions about the case of the orangutans and oil palm
along with the other related cases.” They are asked to share their questions with a partner. “The
partners should act as critical peers and ask clarifying questions if they don’t understand
something. Each student can edit their questions before sharing them with the whole class”
(Teacher Edition, page 45).
• Lesson 6: “Have students talk with a partner about the goal of our palm farm design. Give each
pair a chance to share their idea with another pair before eliciting ideas from the whole group.
The goal needs to focus on both the needs of tropical rainforest plants and animals and the
needs of farmers” (Teacher Edition, page 104).
• Lesson 7: When reviewing a StoryMap used to determine orangutan populations in different
areas “Review a process for students to explore the StoryMap. One process might include that
students read the StoryMap once, and then discuss with their partner what information is
important to record and how to best organize the information. Then, students read the
StoryMap a second time, documenting important information in their science notebooks.
Update slide D to reflect the process you want students to use” (Teacher Edition, page 113).
• Lesson 9: Students work in pairs as they use computer simulations to investigate “What will
happened to the orangutan population if we add births and deaths to our simulation?” “Having
students share one computer between two students, as opposed to having each student work
independently, will help generate more dialogue between students as they plan, observe,
gather data from, and analyze their experiments. When carefully structured, such peer
cooperation can significantly increase the available support for sustained engagement. Consider
having students alternate who “drives” the computer for each trial or each experiment, so that
each student is actively participating in the process” (Teacher Edition, page 152). “After running
the experiment, students should work on the “Make Sense” section of the handout in pairs.
Students should use one color of pen or pencil to indicate the ideas that they came up with, and
use a second color of pen or pencil to expand upon their thinking once they discuss with their
partner and the class” (Teacher Edition, page 154).
• Lesson 11: Students create system models for the oil palm system. They compare models and
identify similarities and differences between the models. “Give students time to examine other
models.” Use the prompts on the slide to guide the discussion. As the class agrees upon what is
happening in the system and how populations interact, record a class consensus Oil Palm
Ecosystem Dynamics
50
System Model. This can be recorded on the whiteboard, chart paper, or piece of paper projected
using the document camera. Alternatively, choose to work with one group’s model (Teacher
Edition, page 192). If the teacher chooses the alternatives here, working with one group’s
model, thinking from all students will not be represented in the consensus model.
Suggestions for Improvement
• Consider adding more supports to guide teacher feedback earlier and consistently throughout
the unit. In addition, supporting teachers with suggestions for how to provide feedback would
be helpful.
• Consider providing more opportunities for students to reflect on and respond to the feedback
that is given.
Inadequate
The reviewers found inadequate evidence that the materials identify and build on students’ prior
learning in all three dimensions because although the unit materials provide a clear description of the
prior proficiencies students should have in DCIs, prior proficiency in SEPs and CCCs is not explicit and
there is limited support for teachers to clarify potential alternative conceptions they (or their students)
may have while building towards students’ three-dimensional learning.
The materials explicitly state the expected level of prior proficiency students should have in the DCIs and
learning progresses logically throughout the materials. However, there is limited evidence in the
materials to show expected level of prior proficiency in the SEPs and CCCs. Related evidence includes:
• Teacher Background Knowledge: “This unit is designed to be taught after the Maple Syrup Unit
in the OpenSciEd Scope and Sequence. As such, it can leverage ideas about food webs,
producers, consumers, and interactions between these organisms in an ecosystem. Other prior
engineering design focused unit, such as the [materia:th.n] [SIC] unit, [materia:nh.n] unit, and
[materia:cb.n] unit, will allow students to leverage what they know about criteria, constraints,
iterative design cycles, stakeholders, and optimizing designs. This unit is designed to be taught
prior to OpenSciEd 7.6 (the (material.er.n) unit), which focuses on natural water resources,
Ecosystem Dynamics
51
changing precipitation and climate, and human impacts. The two units together share
Performance Expectation MS-ESS3-3 and its corresponding DCIs (ESS3.C Human Impacts on
Earth Systems). There are no modifications to make to this unit but an awareness that Units 7.5
and 7.6 are closely connected is important” (Teacher Edition, page 20).
• Teacher Background Knowledge: “Population thinking. Students will be familiar with thinking
about how individual organisms act in their ecosystem to meet their needs for food, water, and
shelter. A new idea that students build in middle-school science is population thinking, moving
beyond thinking about individual organisms or small groups of organisms to populations over a
larger land area and over time. Students may still view organisms represented in a food web as
an individual actor…Interactions in an ecosystem. Students will bring prior ideas about food
chains and food webs to this unit from the Maple Syrup Unit unit and previous elementary
science learning. This prior knowledge could include consumers-producers and predator-prey
relationships from 5th grade. Students will readily identify producers and consumers,
particularly if they have completed the Maple Syrup Unit unit. From the 5th grade units, they
should be able to identify predators as consumers that eat other animals. Students will be
limited to thinking about individual organisms involved in these relationships (e.g., deer eats
grass, wolf eats deer)…Students may bring the idea that the connections between populations
go in one direction, often from food source to food consumer…Changes to ecosystem
components: It is expected that students’ initial explanations to how populations respond to
changes in their ecosystem involve animals finding new food sources or finding new homes by
“migrating” to another place. This makes sense for human populations (among a few others)
who have been able to live in a wide variety of environmental conditions and change food
sources if one type of food becomes scarce. For this reason, students may not realize that many
organisms are so interconnected with their system and adapted to the environmental conditions
of the ecosystem in which they live that moving to new locations or changing food sources is not
an option…Competition for resources: Students will bring an understanding that animals
compete for resources, but they might not have thought about within population competition
(e.g., between orangutans) or between population competition (e.g., orangutans and
hornbills)…Engineering design: Students will know about criteria and constraints from
elementary science and previous OpenSciEd units (the Cup Design Unit unit, Tsunami Unit unit,
and Homemade Heater Unit unit). This unit, particularly Lesson 6 assumes students will have a
background understanding of criteria and constraints for design challenges. Planning
investigations: Students will know about independent and dependent variables from elementary
science and previous OpenSciEd units (e.g., (the Cup Design Unit unit, Storms Unit unit, Tsunami
Unit unit, and Homemade Heater Unit unit, among other units). Lesson 8 assumes students have
this previous knowledge and we extend their understanding of these concepts as we apply them
to testing investigations using a computer model” (Teacher Edition, page 20). This description
includes one reference to prior learning in the SEPs but focuses mostly on the DCIs.
• The unit lists Grade 6 mathematics CCSS as required prior learning. For example, “During Lesson
Set 2, students will engage in population thinking, rate and ratio reasoning, and encounter many
graphical representations of data (e.g., line graphs, histograms) that they will need to interpret.
They will calculate ratios in Lesson 7, create histograms together in Lesson 8, and interpret
Ecosystem Dynamics
52
single data points in a distribution during both Lessons 8 and 9. Students will also work with the
concept of ‘trend’ in Lessons 9 and 10. Prerequisite math concepts that may be helpful include:
CCSS.Math.Content.6.RP.A.1 Understand the concept of a ratio and use ratio language to
describe a ratio relationship between two quantities. CCSS.Math.Content.6.RP.A.2 Understand
the concept of a unit rate a/b associated with a ratio a:b with b ≠ 0, and use rate language in the
context of a ratio relationship” (Teacher Edition, page 21).
• Lesson 1: “This unit directly builds off of the OpenSciEd Unit 7.4: Where does food come from,
and where does it go next? (Maple Syrup Unit) unit. This unit does not build an understanding of
food webs, so students should come in with that previous knowledge. This unit will reinforce the
concept of food webs in a new context, particularly in Lesson 11” (Teacher Edition, page 29).
• Lesson 1: “Supporting Students In Developing And Using Cause And Effect: At the middle school
grade-band, students build on their previous understanding of cause and effect to include the
idea that there can be multiple causes leading to the same effect. In this discussion, students
build on a prior scaffold in which they identified potential causes, and work to trace, in the
model, how each cause might contribute to the same effect” (Teacher Edition, page 42). This
description provides guidance on expected prior proficiency for one of the (unclaimed) CCC
elements, but there is not a description of how students are supported to develop the CCCs in
the unit, building from prior proficiencies.
• Lesson 7: “Where are We Going: At the start of this lesson, students may use language about
the “numbers of orangutans” their design needs to support. As students explore the StoryMap,
they start to notice different geographic areas within which orangutans live (e.g., four different
parks that are very far apart). After this exploration, students will transition from talking about
numbers of orangutans to thinking about populations living in specific geographic areas. Moving
from thinking about individual organisms to many orangutans is an important conceptual shift
that is the focus of this lesson. In the StoryMap, students will observe some data about
orangutan populations in four different geographic areas and will notice that the populations
fluctuate a little. This idea is introduced in this lesson briefly but will be intentionally developed
in Lesson 9 when students engage with a computer simulation that shows orangutan
populations over a 5-year time period. Students in this grade band are developing an
understanding of ratios as a means to compare quantities, as well as to compare a part to a
whole. In grade 6 under Common Core, they learn to define and calculate ratios, a skill that they
apply in this lesson to figure out how many orangutans live in a given area, as well as to find
equivalent ratios and use these comparisons to describe relationships (like the one between the
number of orangutans and the size of an area). Using ratios in this specific scenario underscores
to students that there is a relationship between orangutans and land area that scales as land
area increases, which is an understanding that supports students in figuring out that the number
of organisms that can survive in an area depends on the amount and availability of resources
(i.e., land)” (Teacher Edition, page 112). This is an example of teachers being supported with
information about the expected level of student proficiency in each of the two of the three
dimensions (DCI – LS2.A, SEP – Using Mathematics and Computational Thinking) along with
some limited reference to the proficiency with CCC – Patterns.
Ecosystem Dynamics
53
• Lesson 11: When students are figuring out how both a predator (snake) and prey (rat)
population can increase when resources are abundant, the teacher is told “This lesson builds on
5th grade DCIs: ‘Organisms are related in food webs, in which some animals eat plants for food
and other animals eat the animals that eat plants.’ Organisms can survive only in environments
in which their particular needs are met. This lesson extends students’ understanding by moving
beyond food webs to add other interactions between populations and to compare the
components and interactions of two different systems. Students also extend their
understanding that some populations can survive in different ecosystems, while other
populations are more dependent on one system or one component of the system and,
therefore, cannot flexibly move between systems. This lesson should set students up for deeper
learning about carrying capacity and limiting factors that they will engage with in high school
biology” (Teacher Edition, page 188).
Some support is provided to teachers to clarify potential alternate conceptions that they (or their
students) may have while building toward students’ three-dimensional learning. For example:
• Lesson 1: “After discussing in pairs, have students share their ideas with the class. If students
don’t know much about the system, they may think that orangutans need oil palm trees to
survive—so when they cut down oil palm trees, orangutans lose their habitat. In this case,
students might predict that when oil palm decreases, the orangutan population decreases. Press
students to provide ideas for evidence that they would need to support their predictions. In
most cases, we would need evidence about the palm trees and orangutans over time. Tell
students that you anticipated that they might ask for that data, so you were able to find
information about the oil palm and orangutans over time. Say, It seems like we need to pay
attention to the oil palm trees and orangutans over time. Let’s take a look at some data about
orangutan populations and oil palms.” (Teacher Edition, page 33).
• Lesson 2: “Universal Design for Learning: Students may not realize that “vegetable oil” is often
made from soybean, canola, sunflower, or a mixture of several different kinds of oil. They also
may not realize that these oils are found in many of the foods they eat. Prompt students to look
at the ingredients list on vegetable oils and other processed foods that they have at home and
report back to share if they contain soybean, canola, palm, sunflower, or any other oil” (Teacher
Edition, page 56).
• Lesson 8: “Students carry out experiments in a simulated space and may not view these as “lab
experiments.” Use this opportunity to broaden students’ understanding of different ways that
scientists investigate the world, particularly through the use of computer simulations that allow
multiple scenarios and trials to be run. It’s important to also share that computer simulations
are based on estimates from field data, so at some point research on orangutans in their real
environment was used to create the computer model” (Teacher Edition, page 130).
Suggestions for Improvement
• Consider providing a description of all the expected prior learning in the CCCs and SEPs like that
found in the “Where are We Going” section of Lesson 7, although more explicit guidance would
be helpful to teachers in that particular lesson related to CCC prior learning and progression.
Ecosystem Dynamics
54
• Consider adding a clear description to explain how students’ skills and use of the SEPs and CCCs
will build over time during the unit.
• Consider adding more information about potential misconceptions and supports to address
them.
Extensive
The reviewers found extensive evidence that the materials use scientifically accurate and grade-
appropriate scientific information because the unit materials frequently draw on scientists in the field
and real-world research data to help students make sense of a real-world phenomenon.
All science ideas and representations included in the materials — related to all three dimensions and
content that is not included in the three dimensions of the standards — are accurate. Related evidence
includes:
• Lesson 2: “We use palm oil in reference to the product or ingredient and oil palm in reference to
the trees. People in the industry tend to distinguish between the two, while the popular press
and media mostly use only the term palm oil. The distinction between the two terms may be
difficult for your students and particularly challenging for your emergent multilingual learners.
Use this conversation as an intentional moment to build students’ understanding of these two
terms and to clarify vocabulary (representation), which students encountered in Lesson 1 and
will continue to encounter frequently in this unit” (Teacher Edition, page 55).
• Lesson 5: A minor note: the term “natural kinds” is introduced in this lesson but is not revisited
later in the unit. It is also not a term that is often used at the secondary or college levels.
• Lesson 12: “Introduce students to Andrea Blackburn. Display slide B. Say, I found a scientist who
is currently researching orangutans in one of Indonesia’s National Parks. It’s one of the
protected areas that we explored in an earlier class: Gunung Palung National Park. The scientists
there have been tracking and recording data from the orangutans for years. Let’s take a look at
her research to see what she’s studying about orangutans and how this could help us answer
our questions. Read more about Andrea Blackburn’s work” (Teacher Edition, page 12).
• Lesson 13: “Introduce the southwestern willow flycatcher case. Say, This new case comes from
North America. This is a real case with a real debate happening among scientists and community
members. We’re going to work on this case together to understand what is happening in this
new place, then you’ll have a chance to apply these ideas on your own. Display slide N. Read the
Ecosystem Dynamics
55
background information about the southwestern willow flycatcher. Then display slide O and
read about the trees it uses for nests. Pause to share what students notice from the two system
models” (Teacher Edition, page 224).
Suggestions for Improvement
• Consider removing the term “natural kinds” in Lesson 5 or revisiting and strengthening its use
beyond its introduction in Lesson 5.
Adequate
The reviewers found Adequate evidence that the materials provide guidance for teachers to support
differentiated instruction. Numerous activities provide suggested supports for struggling students,
students with disabilities, multilingual learners, and for struggling readers. However, differentiation
strategies are generalized for multilingual learners, learners with special needs, learners who read well
below grade level, and struggling students and are limited for students who have already met the
performance expectations or one of the targeted elements of the three dimensions.
The materials provide some reading, writing, listening, or speaking alternatives (e.g., translations,
picture support, graphic organizers, non-linguistic, etc.) for English learners, learners with special needs,
or learners who read well below grade level. Support (e.g., related phenomena, multiple modalities) is
provided for students who are struggling to meet the performance expectations for any one of the three
dimensions. Related evidence includes:
• Lesson 1: “Universal Design for Learning: The readability checks for this reading place it at a 7th
grade level (i.e., Flesch-Kincaid: 7.5). Students who read below grade level could benefit from
more support to decode text, clarify vocabulary, and highlight big ideas during the reading
(representation). Consider using partner reading, small group reading with you, or whole-class
Ecosystem Dynamics
56
reading. Spend more time previewing the purpose of the text and encouraging students to note
words they do not understand. Include more frequent checks on comprehension as they read.
Pause after each paragraph to summarize the main idea from the paragraph and to discuss any
words or phrases that were difficult to understand” (Teacher Edition, page 37).
• Lesson 1: “Universal Design for Learning: Using a key can be beneficial to all students for clearly
understanding symbols in the model, but these kinds of graphical representations of ideas can
also embody representations of key concepts and processes, and support students in using
multiple modalities for meaning-making, which is a powerful tool for equitable participation.
Encourage students to develop their models using both linguistic resources and multiple
modalities when expressing their ideas and reasoning” (Teacher Edition, page 39).
• Lesson 1: “Asking questions in everyday language allows students to share their thinking or
experiences, even if they do not have the appropriate scientific vocabulary yet. This is helpful for
emergent multilingual students because by not requiring scientific words at the onset, you do
not limit their participation in classroom discourse.” (Teacher Edition, page 45)
• Lesson 7: “Universal Design for Learning: Some students may benefit from a scaffolded
approach to the StoryMap investigation. To support representation, consider using strategies to
guide students’ information processing of the data in the StoryMap. For example: Co-construct a
process for working through the StoryMap, then proceed through each step in a “chunk”. Use an
explicit prompt at each step to guide students’ analysis of the data in that moment. For
example, if students are struggling to identify what information to record in their notebooks,
remind them of what we are trying to figure out (“How many orangutans typically live in the
tropical rainforest?”). Model for students the analysis of one location in the StoryMap, then let
students work in small groups to analyze another location following a similar procedure. Allow
students to choose whether they want to explore the data using the interactive StoryMap or
prefer the handout alternatives provided in the Student Edition” (Teacher Edition, page 113).
• Lesson 8: “Options to support students in accessing the simulation: Run the simulation on the
slowest setting first so students can follow their orangutan and get a sense of what the visual is
representing. Have students talk with a partner between trials to discuss what they are noticing.
For learners with visual disabilities, provide a spoken description of what is happening with the
orangutans in the simulation. Provide a link to the simulation so that students can watch more
closely and adjust the speed as needed” (Teacher Edition, page 134).
• Lesson 9: “If students are struggling to understand how a population can remain stable yet still
fluctuate, consider demonstrating the concept using a cereal box with a bag of coins in the box.
Push slightly on the side of the box, temporarily disrupting the box. Then, let go. The box will
wobble back and forth until it reaches its stable state. In this analogy, the box is still stable, even
though a minor disruption caused small fluctuations in the box. Another option is to use a
dropper to drop water into a dish. The drops of water create a ripple that eventually settles out.
Using the water dropper approach may be more analogous to the upward and downward wave
motion of the population graphs” (Teacher Edition, page 156).
• Lesson 10: “Monarch Butterflies on the Shortgrass Prairie”. “This assessment encourages
students to demonstrate their understanding of key skills and concepts from the unit so far
through multiple modalities, including writing to explain and drawing models. Some students
Ecosystem Dynamics
57
may benefit from using multiple modalities to illustrate their thinking for any or all of the
questions on this assessment. You may consider allowing some students to present their
answers verbally with you or with another student acting as a scribe to record their thinking on
paper. Some students may benefit from using gestures, images, or manipulatives to support
their explanations, as opposed to written text. In each case, encouraging students to use
multiple modalities to show their thinking creates a clear, accessible, equitable pathway for all
students to demonstrate proficiency” (Teacher Edition, page 180).
• Lesson 11: When developing a system model “When you decide on representation conventions,
(1) choose a colorblind-friendly palette, such as black, blue, orange, and brown, and avoid red
and green together and/or (2) add labels to the lines (e.g., food, shelter, safety)” (Teacher
Edition, page 189).
• Lesson 12: “Extension Opportunity: To deepen students’ understanding of mutually beneficial
relationships, extend these ideas to other cases students know about or ones relevant in their
community (e.g., squirrels and acorns, birds and seeds, humans spreading seeds). This kind of
extension could benefit high-interest learners, those who have shown mastery of the current
lesson content, and/or all your students, to increase their understanding of the lesson’s
relevance. If you choose to extend this lesson, add 1 class period” (Teacher Edition, page 210).
This is the only provided extension opportunity for students who have high interest or are
already meeting expectations in the unit.
• Lesson 13: “This assessment encourages students to demonstrate their understanding of key
skills and concepts from the unit so far through multiple modalities, including analyzing…data
and writing arguments to support claims. Some students may benefit from using multiple
modalities to share their thinking for any or all of the questions on this assessment. In each case,
encouraging students to use multiple modalities to share their thinking creates a clear,
accessible, equitable pathway for all students to demonstrate proficiency. Sharing orally may be
particularly beneficial for some students” (Teacher Edition, page 226). The following are
prompts from this assessment. “What observations and patterns do you notice in the types of
trees the flycatcher used for nests? Scientists disagree about whether releasing the beetle was a
good or bad thing. Below are three claims that people make about releasing the beetle in
Mormon Mesa and St. George. Claim A: Introducing the tamarisk beetle is bad for the willow
flycatcher in both locations. Claim B: Introducing the tamarisk beetle is bad for the willow
flycatcher in Mormon Mesa, but good in St. George. Claim C: Introducing the tamarisk beetle is
bad in the short-term for the flycatcher population, but will be good in the long-term. 5. Circle
the claim you agree with most. 6. Write an argument to support the claim. Use data from the
data tables and scientific reasoning to construct a convincing argument” (Lesson 13 Assessment,
page 4).
• Lesson 14: “Universal Design for Learning: Note that while the scientific information in each of
these readings is equally rigorous, they are written at different reading levels to support
differentiation. Consider grouping students strategically so that students who need more
support with scientific texts are distributed among mixed-expertise groups assigned readings of
grade-level complexity, while students who are looking for a challenge are in groups assigned
readings at a higher level. Readings increase in difficulty: Summarizing ways to grow food -
Ecosystem Dynamics
58
Flesch-Kincaid Grade Level 6.1Diversified farming in Costa Rica - Flesch-Kincaid Grade Level 7.4
Sustainable palm oil in Indonesia - Flesch-Kincaid Grade Level 8.7” (Teacher Edition, page 233).
• Lesson 19: “Supporting Emerging Multilingual Students: This could be an opportunity to
highlight the benefits of multilingual communication in our global world because expressing
ideas across many languages can help reach larger and broader audiences. This would also be
particularly beneficial if the stakeholder group(s) speak a primary language other than English.
Consider encouraging your emerging multilingual students—who feel comfortable doing so—to
develop a communication project that includes key messaging about the orangutan and palm oil
problem in multiple languages” (Teacher Edition, page 309).
Consideration and suggestions are provided for situations where resources are limited.
• Lesson 5: During the activity that requies students to visit the outdoors, alternative learning
opportunities are provided for those without access to the outdoors. “If the outdoor activity is
not available to you, these apps can be used to replace it..” “Students can explore iNaturalist to
make observations of local plant and animal life that have been uploaded in your area by
community members.” “The Seek app is the kid-friendly flora and fauna identification tool
developed by iNaturalist and may be more appropriate for student use. There is no login
required. Seek is a fun way to get families involved in student learning too.” “Students can use
Google Earth to make observations of land-use change in their community. Visit Google Earth
ahead of time to see what options are available for your community, such as street view”
(Teacher Edition, page 89).
• Lesson 7: When computers are used to review StoryMap, alternative suggestions are provided if
not all students have access to individual computers. “If you do not have enough computers for
students to work in groups of 2–3, there are three alternative ways to facilitate this activity: (1)
project the StoryMap for the whole class to investigate together, (2) have students use personal
phones or tablets to view the StoryMap, or (3) use paper versions of the materials. See the
preparation section of this lesson for more information” (Teacher Edition, page 114).
Suggestions for Improvement
• Consider adding more opportunities for students who are high interest or already meeting
learning expectations.
• Extension activities are often framed “if there is time.” Consider rephrasing this to something
like “if there is time or if student(s) would benefit from extension opportunities.”
• Supports for emerging multilingual learners, students with special needs, students who read
well below grade level, and struggling students are often grouped together. Consider specifying
individual needs of students and how the scaffolds support specific student needs where
feasible.

Ecosystem Dynamics
59
Extensive
The reviewers found extensive evidence that the materials support teachers in facilitating coherent
student learning experiences over time because there are connections between what is learned in one
lesson and the learning goals of the next lesson. Teacher support is provided to revisit the DQB and
opportunities for students to ask new questions. There is also teacher support for using the Progress
Tracker to help students identify what they have figured out.
Frequent guidance or tools are provided to teachers to support linking student engagement across
lessons. For example:
• The “Teacher Background Knowledge” section includes big ideas for student sense-making: “This
unit is guided by two big ideas to help us explain how ecosystems function: (1) When a
component of an ecosystem (e.g., population or abiotic factor) changes, there are changes to
the whole ecosystem because of the interactions between components and (2) when an
ecosystem has more components and more interactions between components, the ecosystem is
more resilient to disruption. In this unit, students will develop, refine, and apply models to
explain how one population, orangutans, are threatened by an increasing number of oil palm
farms in Indonesia.” (Teacher Edition, page 15).
• Lesson 6: All lessons in the unit begin by listing an overview of the previous lesson, the current
lesson, and the next lesson. For example: “PREVIOUS LESSON: We shared our murals and made
observations outdoors. We shared what we noticed about patterns in plant and animal life
around our school, and we hypothesized about how these patterns related to changes to the
land. We revised our model and added questions to the DQB about our local community. Given
that agriculture and human communities are not going away and are still expanding, we
wondered how humans could use the land in better ways to benefit ourselves and other
organisms. THIS LESSON: We reflect on what we have figured out to define the problems
associated with palm oil farms. We think about how we can design a better palm farm system
that will support both the farmers and the orangutan and tiger populations. We use what we
learn to co-construct criteria and constraints to guide our design decisions. We revisit our
Driving Question Board to add new questions that will help us design a system that is more
stable and will help us refine our criteria and constraints. NEXT LESSON We will wonder about
the typical number of orangutans and will examine a StoryMap showing the number of
orangutans in four protected tropical rainforest areas. We will notice some fluctuation and that
Ecosystem Dynamics
60
larger areas have larger populations. We will calculate the ratio of orangutans to land area. We
will also make predictions that this ratio is based on food availability and brainstorm how to test
our ideas in a simulation” (Teacher Edition, page 99).
Guidance and support are provided for how to recognize what students figure out in a lesson, what
questions are left unanswered, and what new questions could be answered in the next investigation.
Throughout the unit, teacher guidance and strategies are provided to ensure that students see their
learning in all three dimensions as coherently linked to the progress they make toward explaining
phenomena or designing solutions to problems. For example:
• Lesson 2: “Set up the Progress Tracker for an individual reflection. Explain to students that we
want to take some individual time to capture what we have figured out from our reading about
different types of oils. Have students turn to the Progress Tracker section in their notebooks.
Use slide K to guide students in drawing a T-chart on the first page of this section and to
complete the two columns, filling in the lesson question: “Is there a substitute for palm oil?”
This should be followed by their response. Give students 3–5 minutes to quietly update their
Progress Trackers, using words and drawings to show what they have figured out about possible
palm oil substitutes” (Teacher Edition, page 61).
• Lesson 5: “Display slide J. Give students about a minute to jot down a question (or 2) with a
partner. Have 1 partner post to the DQB, and encourage students to post their questions near
similar questions. As students post their new questions, share some of the questions aloud. As
students share more questions, cluster the questions into related groups. As students share,
prompt them to consider how learning more about palm oil in Indonesia might help them
understand local change and vice versa…” (Teacher Edition, page 97).
• Lesson 6: “Generate next steps. Display slide G and focus students on the criteria they listed on
the design handout and the questions they just generated. Say, We have questions about
orangutans and what constitutes a “good number” of orangutans. What information would help
us answer this question and help us refine our criteria? Allow students to make suggestions for
additional information that we need to learn about orangutans (and tigers) that would help with
their designs. Listen for ideas such as researching how many orangutans live in tropical
rainforests or how many orangutans were in the tropical rainforest before farmers cut down the
trees. Say, Let’s start here next to see if we can get a sense for what we need to aim for as a
good number of orangutans on our redesigned palm farms” (Teacher Edition, page 107).
• Lesson 18: “Display the Driving Questions Board, which includes a section of “Questions We
Answered” from Lesson 6. Since Lesson 6 we’ve answered more clusters of questions, but we
have not explicitly named all the new questions we’ve answered. Now is the time to do that.
Make sure consensus models from the unit are visible to all, too. Review and share the
questions that students think we have answered. Present slide N and have students mark on the
class DQB with sticky dots the questions that they think we have made progress on. Look for
patterns using the sticky dots. Focus on the questions that have the most number of sticky dots.
Discuss as a class the questions that the class can now answer” (Teacher Edition, page 289).
Learning Plan Snapshots provide navigation guidance for the teacher.
Ecosystem Dynamics
61
• Lesson 2: “Navigation: Revisit the DQB and navigate the class toward the Lesson 3 question: ‘Can
we grow oil palm trees somewhere else so we’re not cutting down tropical rainforests?’”
(Teacher Edition, page 52).
• Lesson 5: “Navigation: Elicit students’ ideas about what could be done differently to support
both humans and other living things, and add a new unit driving question” (Teacher Edition,
page 88).
• Lesson 8: “Navigation: Establish the purpose of the lesson by reviewing our ideas about why
orangutans need so much space and how we might test our ideas in a computer simulation”
(Teacher Edition, page 126).
Lessons include “Where We Are Going and NOT Going” information. For example, Lesson 2 says:
“Where We Are Going: This lesson has three important purposes: (1) Within this unit storyline, this
lesson serves to answer some of students’ initial questions from Lesson 1 (“Is there a substitute for palm
oil?”), while also further complicating the problem for them. Through this lesson, students realize that
all oils come from plants, and farming these plants requires the clearing of native tropical rainforests or
grasslands for space. Thus, using another oil would just harm a different ecosystem and the animals that
live there. (2) This lesson also serves to complicate the problem, with students realizing that palm oil is
the most efficient oil to grow because it requires the least amount of land, so the problem of clearing
tropical rainforests for palm oil is likely not going away. Using a substitute oil is not a quick-and-easy
solution. Students start to realize that solutions may be limited. (3) A new element for middle school is
the integration of patterns to help identify cause-and-effect relationships. Students will be using the
element of patterns as a lens for making sense across the three cases of vegetable oil that they will
investigate in the lesson.” “Where We Are NOT Going: Management of land use is a key idea that will be
built throughout this unit, and Lesson 2 serves as an initial introduction to this idea. In Lesson 5,
students will broaden their understanding of this problem beyond just farming plants for oil to land use
in our communities (e.g., clearing land for livestock and/or clearing land for neighborhoods and
communities). Anticipate this concept broadening to a discussion of land-use change in your local
community or communities, but avoid touching on local problems until Lesson 5” (Teacher Edition, page
54).
Suggestions for Improvement
N/A
Adequate
Ecosystem Dynamics
62
The reviewers found adequate evidence that the materials support teachers in helping students engage
in the practices as needed and gradually adjust supports over time because teacher supports are
provided that help all students build understanding and proficiency in SEPs. Scaffolding is reduced over
time; however, support could be strengthened by explicitly identifying how the scaffolds are reduced
over time and at the element level.
Teacher supports are provided to help all students (including those with special needs and abilities)
explicitly build an understanding and proficiency in the SEPs over time through a variety of approaches
over the course of the unit. However, some guidance is general and does not specifically target a grade-
level appropriate SEP element. Related evidence includes:
• Teacher Handbook: “OpenSciEd units specifically include differentiation strategies in the
following sections of the units: Teacher background knowledge, the lesson-level “Where we are
going” and “Where we are not going” sections, and the assessment overview and guidance
tables. These sections provide teachers with information about adapting the content, process,
or product of the lessons. Teachers can also find differentiation guidance within the Learning
Plans in three particular types of callouts: Equity callouts focus on moments in instruction in
which a certain population may benefit from a particular strategy, for example, supporting
language development for emergent multilingual learners, providing extended learning
opportunities or readings for students with high interest, providing specific strategies for
students with special learning needs. Alternate Activity callouts provide guidance to teachers
about going further or streamlining activities based on student progress and/or completing
different learning activities. These can be particularly helpful for students with high interest or
for students or classrooms that need to modify the unit based on availability of time or access to
resources. Additional Guidance callouts provide more specific instructions to teachers about
how to make a learning activity successful based on their students’ needs. The callout boxes
provide a variety of instructions to modify the timing, grouping, or resources for a particular
activity. The UDL guidelines informed the design of the OpenSciEd instructional materials to
minimize barriers and create pathways for diverse learners. Diverse learners include those who
are culturally and linguistically diverse, have a disability, are emerging multilingual learners
(EMLs) and/or are considered gifted and talented. Each individual student can be recognized as
part of multiple groups and has unique characteristics specific to that individual. The routines
and strategies built into the units create different pathways for individual students.
Furthermore, the callout boxes provide additional strategies teachers can use to adapt activities
and modify the units to better meet the needs and leverage the resources of their specific
learners” (Teacher Handbook, page 33).
• Lesson 1: “Supporting Students in Developing and Using Cause and Effect: In this initial modeling
discussion, frame the potential model components as “causes” and “effects.” This helps
students to begin thinking about cause-and-effect relationships and makes it clear that often,
there is more than one cause for a particular effect. Students will build on this scaffold as they
further consider cause-and-effect relationships when they develop their initial model” (Teacher
Edition, page 38).
Ecosystem Dynamics
63
• Lesson 1: “Teacher Reference 3: Asking Question Tool—Open/Closed Questions 1. What
question are you working on? 2. What is the purpose of your question? Circle one of the reasons
below or write in your reason. Here are some reasons why people ask questions in science: We
don't understand how a phenomenon (or a part of the phenomenon) works, We have a
disagreement (in our model or with someone’s explanation or argument), We need to test an
idea we have… Closed-ended and Open-ended Questions: Questions that can be answered with
“Yes” or “No” or with a single word are closed-ended questions. Asking open-ended questions
gives you space to figure out more things. Scientific questions are open-ended questions. 3. Is
your question closed-ended or open-ended? Circle one. Closed-ended (complete step #4) Open-
ended (skip to step #5) 4. Revise your question to make it an open-ended question. Think about
what you want to explain about the phenomenon. Try using How does... Why does… What
happens when… What happens if…What is the difference between ___ and ___? Write your
revised question” (Teacher Edition, page 351).
• Lesson 8: “Attending to Equity: Consider including any of the following options to support
students in accessing the simulation: Run the simulation on the slowest setting first so students
can follow their orangutan and get a sense of what the visual is representing. Have students talk
with a partner between trials to discuss what they are noticing. For learners with visual
disabilities, provide a spoken description of what is happening with the orangutans in the
simulation. Provide a link to the simulation so that students can watch more closely and adjust
the speed as needed” (Teacher Edition, page 134).
Teacher-provided scaffolding is provided. However, it is not clearly reduced over time for all targeted
SEP elements as students are expected to be more and more independent in their use of the elements
over the course of the unit.
• Lesson 1: “The sketch similar to the diagram on slide D (Initial Ideas Diagram—Version 1) serves
as a scaffold to develop an ecosystem model. In this sketch, one component (candy) is
connected with a second component (orangutan) by a line and a question mark. Throughout the
first lesson set, this initial model will be progressively developed. The class will work together to
include additional components and to agree upon ways to depict interactions between them”
(Teacher Edition, page 30). “The revised diagram (Initial Ideas—Version 2) is the second scaffold
in model development in this lesson. This revised diagram incorporates two additional
components (palm oil and oil palm trees) and includes an initial way to articulate the
relationships between the components (e.g., “an ingredient in,” “a substance from,” and
“overlap in where these are found”). Later in this lesson, students will work to add even more
components and interactions between components to their models. Then, in Lesson 7, students
will further build upon this scaffold as they develop the modeling convention that boxes will
stand for a group of organisms of plants and animals (i.e., populations) and lines between the
boxes represent a connection. Use this opportunity to model for students how to include a new
component of the system, connection and interaction between components (line), and a
description of the connection (text written on or near the line between two boxes)” (Teacher
Edition, page 31).
Ecosystem Dynamics
64
• Lesson 18: “Assessment Opportunity: Building towards 18.B Construct an argument grounded in
evidence and scientific reasoning to recommend a design solution that will support a stable
orangutan population and protect the needs of people…What to do: This lesson assumes that
students are proficient at writing arguments from their previous learning in 7th grade (e.g., their
experiences in the Bath Bombs Unit and the Homemade Heater Unit). If students need
additional support to engage in this practice, first co-construct a class anchor chart that names
the parts of a good argument (see example to the right). If time permits, first work together on a
Gotta-Have-It checklist of science ideas that may be useful to use in the argument. With the
argumentation anchor chart and Gotta-Have-It checklist as scaffolds, assign the individual task
at that time” (Teacher Edition, page 287).
When comparing earlier lessons and later lessons, there is some evidence that scaffolds were reduced,
however these scaffolds support development of elementary-level elements. For example, when
supporting students in developing and using Patterns:
• Lesson 5: “Prompt students to use the lens of patterns as they document their observations.
Cue them to pay attention to: patterns in kinds of plants or location of plants; patterns in kinds
of birds, insects, or animals, along with the location of those organisms; and patterns in changes
humans have made to the land and if this seems to be related to patterns in organisms. Use the
following prompts: What patterns are you observing? What does the pattern you observed
allow you to conclude? What are you uncertain about? What are some similarities and
differences? What question could you ask next to further investigate the pattern?” (Teacher
Edition, page 93).
• Lesson 10: “Say, One way that we can look for how the population changed is by using the graph
of population versus time at the bottom of each case study. On that graph, you should circle the
sections of the graph that show a decreasing pattern in the population in red. Then, you should
circle the sections of the graph that show an increasing pattern in the population in blue. Be
sure to also add words or labels to the graph to describe what was happening to that
population’s resources during those times” (Teacher Edition, page 173).
• Lesson 20: “Prompt students to share an observation about patterns in the graphs, charts, or
images first and then a question that arose directly from their observations. Have students work
in pairs or small groups before sharing with the whole class” (Teacher Edition, page 320).
Suggestions for Improvement
• Consider supporting teachers with scaffolded differentiation by explicitly stating how the
scaffold is being reduced over time or how students are increasingly responsible for more
sophisticated applications of the SEP elements.
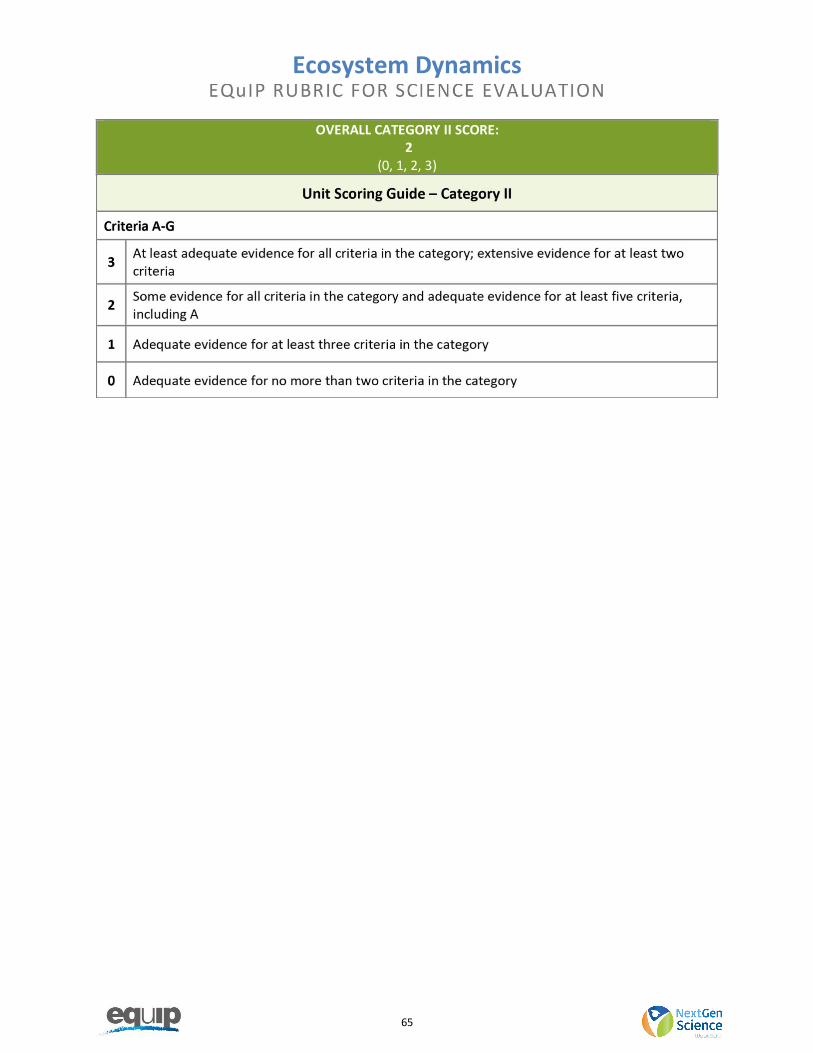
Ecosystem Dynamics
65
OVERALL CATEGORY II SCORE: 2
(0, 1, 2, 3)
Ecosystem Dynamics
66
CATEGORY III
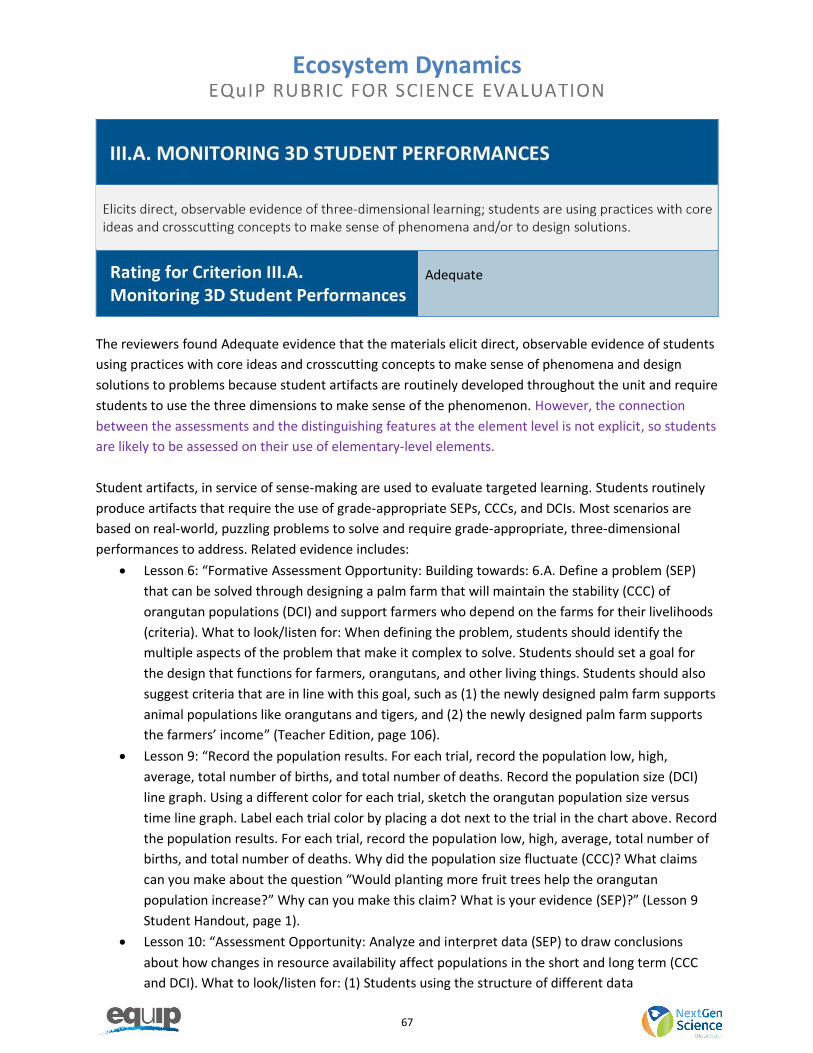
Ecosystem Dynamics
67
Adequate
The reviewers found Adequate evidence that the materials elicit direct, observable evidence of students
using practices with core ideas and crosscutting concepts to make sense of phenomena and design
solutions to problems because student artifacts are routinely developed throughout the unit and require
students to use the three dimensions to make sense of the phenomenon. However, the connection
between the assessments and the distinguishing features at the element level is not explicit, so students
are likely to be assessed on their use of elementary-level elements.
Student artifacts, in service of sense-making are used to evaluate targeted learning. Students routinely
produce artifacts that require the use of grade-appropriate SEPs, CCCs, and DCIs. Most scenarios are
based on real-world, puzzling problems to solve and require grade-appropriate, three-dimensional
performances to address. Related evidence includes:
• Lesson 6: “Formative Assessment Opportunity: Building towards: 6.A. Define a problem (SEP)
that can be solved through designing a palm farm that will maintain the stability (CCC) of
orangutan populations (DCI) and support farmers who depend on the farms for their livelihoods
(criteria). What to look/listen for: When defining the problem, students should identify the
multiple aspects of the problem that make it complex to solve. Students should set a goal for
the design that functions for farmers, orangutans, and other living things. Students should also
suggest criteria that are in line with this goal, such as (1) the newly designed palm farm supports
animal populations like orangutans and tigers, and (2) the newly designed palm farm supports
the farmers’ income” (Teacher Edition, page 106).
• Lesson 9: “Record the population results. For each trial, record the population low, high,
average, total number of births, and total number of deaths. Record the population size (DCI)
line graph. Using a different color for each trial, sketch the orangutan population size versus
time line graph. Label each trial color by placing a dot next to the trial in the chart above. Record
the population results. For each trial, record the population low, high, average, total number of
births, and total number of deaths. Why did the population size fluctuate (CCC)? What claims
can you make about the question “Would planting more fruit trees help the orangutan
population increase?” Why can you make this claim? What is your evidence (SEP)?” (Lesson 9
Student Handout, page 1).
• Lesson 10: “Assessment Opportunity: Analyze and interpret data (SEP) to draw conclusions
about how changes in resource availability affect populations in the short and long term (CCC
and DCI). What to look/listen for: (1) Students using the structure of different data
Ecosystem Dynamics
68
representations (graphs, tables, maps) to identify patterns of stability and change in population
and resource availability. (2) Students connecting these patterns of change to textual evidence
as a means of establishing a cause-and-effect relationship between resource availability and
population size, using mechanisms they have discussed in prior lessons for how changes to
ecosystem factors cause changes to the amount of organisms an ecosystem can sustain”
(Teacher Edition, page 175). Assessment Prompt: “The monarch butterfly population changes
every year, and scientists are concerned about what might happen to the population over time.
The graph below is the data collected between 2009 and 2012 for the populations of monarch
butterflies. The area of occupied forest is a method scientists use to estimate the number of
butterflies. In the graph below, the greater the area of occupied forest, the more butterflies. 1.
Identify the trends in the butterfly population. a. Circle the sections of the graph that show a
decreasing population over time in RED. b. Circle the sections of the graph that show an
increasing population over time in BLUE. 2. Milkweed is important to the survival of the
butterflies. In years with lower than normal rainfall, there can be fewer milkweed plants. The
table below shows the number of milkweed plants per hectare from 2009 and 2012.a. Annotate
the butterfly population graph above (in Question 1) to show what is happening with the
resource (milkweed) each year. b. Explain how this change in the number of milkweed plants
connects to how the population of monarch butterflies changed between 2009 and 2012… 3. Is
this graph showing a normal fluctuation or an unusual trend in population size? Explain your
thinking and note specific evidence from the graph. You may want to label parts of the graph
with words to support your explanation… Scientists estimate that there is only 1–2% of
milkweed left in this area now compared to what was there before it was farmed. 4. Write an
explanation to answer the question: Why did the change in the farming practices after 1990
affect the monarch butterfly population?” (Lesson 10 Assessment: Monarch Butterflies on the
Shortgrass Prairie, pages 1–5).
• Lesson 11: “Assessment Opportunity: Building towards: Develop a system model (SEP) to explain
how populations in a complex rainforest ecosystem interact to keep populations stable (DCI),
compared to interactions in an agricultural system, where some of the same populations are
increasing (CCC). What to look/listen for: See the Key Ideas above. What to do: If students are
struggling to understand how populations can stay stable in the tropical rainforest, have them
work with a partner to dig deeper into one population. Have partners work through these
questions about the population: What is the population’s main food resource(s), and is the
resource changing? If one food resource is changing, does the population have another food
resource option? Who is the main competitor? Are there changes happening to the competitor
population? Does it have a predator, and if so, what is happening to the predator population?
What might be missing from our model to help us clearly understand this population?” (Teacher
Edition, page 198).
• Lesson 13: “Assessment 1. What observations and patterns (CCC) do you notice in the types of
trees the flycatcher used for nests?... 2. What observations and patterns do you notice in the
number of babies born?...3. What observations and patterns do you notice in the types of trees
the flycatcher used for the nests? …4. What observations and patterns do you notice in the
number of babies born? …Scientists disagree about whether releasing the beetle was a good or
Ecosystem Dynamics
69
bad thing. Below are three claims that people make about releasing the beetle in Mormon Mesa
and St. George. Claim A: Introducing the tamarisk beetle is bad for the willow flycatcher in both
locations. Claim B: Introducing the tamarisk beetle is bad for the willow flycatcher in Mormon
Mesa, but good in St. George. Claim C: Introducing the tamarisk beetle is bad in the short-term
for the flycatcher population, but will be good in the long-term (DCI). 5. Circle the claim you
agree with most… 6. Write an argument to support the claim. Use data from the data tables and
scientific reasoning to construct a convincing argument (SEP)” (Teacher Edition, pages 375–376).
• Lesson 17: “Assessment: Apply ideas about ways of growing food (SEP) to design a better way to
use the land to minimize (CCC) human impact on orangutan populations (DCI). What to
look/listen for: Using a variety of different ways to grow food can maintain or increase
orangutan populations and people's income. people can reasonably set aside a portion of their
land to support orangutan populations without reducing their income. Neighboring farms can
coordinate their approaches to increase space for orangutans. Rainforest corridors connecting
intact areas of forest increase orangutan populations. Students should identify 2 features of a
diversified palm farm that support people and biodiversity and how each of these features
works” (Teacher Edition, page 274).
Suggestions for Improvement
• Consider including explicit connections to how distinguishing features of the elements of each
dimension are being assessed and how elements being developed are assessed.
Adequate
The reviewers found Adequate evidence that the materials embed formative assessment processes
throughout that evaluate student learning and inform instruction because the unit provides multiple
opportunities for formative assessment in a variety of modalities. However, rubrics and teacher material
do not support informing instruction on multiple levels for elements in all three dimensions.
The materials include opportunities for formative assessment and include some specific support for
informing instruction based on student responses. In addition, many formative assessment processes
attend to student equity. Related evidence includes:
• Lesson 1: “Assessment Opportunity Building towards: 1.A Develop an initial system model to
describe a phenomenon in which changes to one living component of an ecosystem (cause)
Ecosystem Dynamics
70
affect the other living parts of the ecosystem (effect). What to look/listen for: Inclusion of the
living components of the system models (such as the oil palm trees, orangutans, rats, snakes,
tigers, and pigs) in the systems model Inclusion of at least some of the needs that these livings
components have in the system model, such as needs for food, water, air, habitat, or shelter
Initial ideas about what causes the population sizes of living things to increase in number (a lot
of food or water, a lot of mates, not very many predators) and decrease in number (very little
food or water, can’t reproduce, many predators) Uncertainty about interactions between the
living things within the system and the specific cause-and-effect relationships in the system
model Uncertainty about which components of the system model are causing increases or
decreases in the different population sizes What to do: If your students struggle with identifying
important components of the ecosystems, refer them back to the class-developed list of
ecosystem components. Students may also wish to revisit Growing Oil Palm in Indonesia to find
more information about the components in the ecosystem. If students are not sharing their
initial ideas about what causes the population sizes of living things to increase or decrease in
number, or if students are not sharing their uncertainty about interactions in the system model,
encourage them to draw a large question mark and then record their thinking. It may help to
refer to these thoughts as “first draft thinking,” “initial ideas,” or “questions I have.” It can also
help to provide students with the sentence starter “Maybe…” and then ask them to record their
thinking” (Teacher Edition, page 41).
• Lesson 3: “What to do: If students are struggling to conclude that the oil palm needs to grow
near the equator, bring the issue closer to home. Ask them, Why do we not grow oil palm in the
United States or near our school? What nonliving condition does the plant need that our
location may not provide? What if we were to plant large farms of oil palm near our school—
how would that change the ecosystem around us?” (Teacher Edition, page 72).
• Lesson 4: “Building towards: 4.A Define a new criterion for a solution to more sustainably grow
oil palm in ways that protect the tropical rainforest ecosystem but that also recognize the needs
of local farmers, who are part of the palm oil production system. What to look/listen for: See
key ideas above. What to do: Use the Consensus Discussion and Progress Tracker entry for
formative assessment. If students struggle to identify or justify reasons why farmers feel they
need to cut down tropical rainforests to grow oil palms, prompt them to consider how they
might react if they only had the land around them as a resource to support themselves. Remind
them that we have previously figured out that the tropical rainforest has optimal conditions for
growing oil palms, and point out the vast numbers of people who would be left without income
if these plants could no longer be farmed. Provide cases of what happens when disease or
drought keeps key crops from being harvested, along with the fallout that these events have for
farmers” (Teacher Edition, page 83).
• Lesson 6: “What to do: If students are uncertain about constraints, suggest that they will
redesign a single farm with a set amount of land, so that their land area cannot increase. Also,
students will be limited to plants that can grow in tropical areas. As students share their thinking
about the criteria, use a stability and change lens for thinking about supporting the animal
populations. Pose questions such as the following: What would it mean to design a palm system
that is more stable for orangutans? How does your design idea keep the orangutan population
Ecosystem Dynamics
71
from decreasing? What do you need to look for to explain why the orangutan population stops
declining when you design the farm this way? What would you look for in the farmer’s income
over time to feel your design is successful for them?” (Teacher Edition, page 106).
• Lesson 10: “There is room to use this assessment formatively with respect to competition for
resources because students will expand on the idea of competition within a population (Lessons
8 and 9) to competition between populations (Lesson 11). Therefore, you have the opportunity
to use this assessment to adjust how you approach resource availability and competition in the
next lesson. The assessment can also serve as a summative assessment for students’
understanding of resource availability for organism growth and reproduction as these ideas will
not be revisited later in the unit” (Assessment System Overview, page 2).
• Lesson 10: “What to do: If students struggle to find patterns of change in graphical displays, ask
them to begin by identifying key structures (axis labels, scale, table headers, symbols) that help
them make sense of these displays. Then, ask students to connect the visual patterns of change
to their physical meaning for the size of the population in question. Encourage students to draw
connections between these patterns of change and the changes mentioned in textual evidence
to establish relationships between changes in resources and changes in population. Prompt
students to look back through their work on analysis questions and Progress Trackers from
these and other investigations during which students discussed the mechanisms that explain
how changes to key ecosystem factors caused changes to the size of local populations” (Teacher
Edition, page 175).
• Lesson 10: “This assessment encourages students to demonstrate their understanding of key
skills and concepts from the unit so far through multiple modalities, including writing to explain
and drawing models. Some students may benefit from using multiple modalities to illustrate
their thinking for any or all of the questions on this assessment. You may consider allowing
some students to present their answers verbally with you or with another student acting as a
scribe to record their thinking on paper. Some students may benefit from using gestures,
images, or manipulatives to support their explanations, as opposed to written text. In each case,
encouraging students to use multiple modalities to show their thinking creates a clear,
accessible, equitable pathway for all students to demonstrate proficiency” (Teacher Edition,
page 180).
• Lesson 11: Students complete a self-assessment of participation. “Save time at the end of this
class period to engage students in self-assessment of their participation during small-group and
whole-group discussion…The template used here guides students in self-reflection. It will draw
their attention to the quality of their participation in small-group and wholegroup discussions
and offer a chance to reflect on what went well and where they may want to improve. Including
these moments for self-reflection, and using templates to guide the reflection, can enhance
students’ capacity to monitor their own progress (action and expression).” (Teacher Edition,
pages 193–194).
• Lesson 11: “Assessment Opportunity: Building towards: Develop a system model (SEP) to explain
how populations in a complex rainforest ecosystem interact to keep populations stable (DCI),
compared to interactions in an agricultural system, where some of the same populations are
increasing (CCC). What to look/listen for: See the Key Ideas above. What to do: If students are
Ecosystem Dynamics
72
struggling to understand how populations can stay stable in the tropical rainforest, have them
work with a partner to dig deeper into one population. Have partners work through these
questions about the population: What is the population’s main food resource(s), and is the
resource changing? If one food resource is changing, does the population have another food
resource option? Who is the main competitor? Are there changes happening to the competitor
population? Does it have a predator, and if so, what is happening to the predator population?
What might be missing from our model to help us clearly understand this population?” (Teacher
Edition, page 198).
• Lesson 13: “This assessment encourages students to demonstrate their understanding of key
skills and concepts from the unit so far through multiple modalities, including analyzing and
annotating data and writing arguments to support claims. Some students may benefit from
using multiple modalities to share their thinking for any or all of the questions on this
assessment. In each case, encouraging students to use multiple modalities to share their
thinking creates a clear, accessible, equitable pathway for all students to demonstrate
proficiency. Sharing orally may be particularly beneficial for some students” (Teacher Edition,
page 226).
Materials suggest using consensus discussions and progress trackers for formative assessment. For
example:
• Lesson 4: “Use the Consensus Discussion and Progress Tracker entry for formative assessment. If
students struggle to identify or justify reasons why farmers feel they need to cut down tropical
rainforests to grow oil palms, prompt them to consider how they might react if they only had
the land around them as a resource to support themselves” (Teacher Edition, page 83).
• Assessment System Overview: “The Progress Tracker is a thinking tool that was designed to help
students keep track of important discoveries that the class makes while investigating
phenomena and to figure out how to prioritize and use those discoveries to develop a model to
explain phenomena. It is important that what the students write in the Progress Tracker reflects
their own thinking at that particular moment in time. In this way, the Progress Tracker can be
used to formatively assess individual student progress or for students to assess their own
understanding throughout the unit. Because the Progress Tracker is meant to be a thinking tool
for kids, we strongly suggest that it is not collected for a summative “grade” other than for
completion” (Teacher Edition, page 326).
• Lesson 6: “This lesson offers several opportunities for formative assessment, including (1) when
the class articulates the problem during a Consensus Discussion” (Teacher Edition, page 327).
Suggestions for Improvement
• Consider adding rubrics for more of the formative assessment tasks and adding specific
guidance on the rubrics and answer keys to support teachers in modifying instruction in areas
where students struggle in all three dimensions.
• Consider supporting teachers as they determine individual student proficiency with the
elements of the three dimensions, perhaps by adding rubrics or leveled guidance to general
“what to look for” and “what to do” statements.
Ecosystem Dynamics
73
Adequate
The reviewers found Adequate evidence that the materials include aligned rubrics and scoring guidelines
that help the teacher interpret student performance for all three dimensions because scoring guidance
is included, but only for some of the assessment opportunities.
Scoring guidance is included for only some of the assessment opportunities in the unit. Exemplar
student responses are included but not necessarily a range of student responses. Scoring guidance
provides the teacher with information to modify instruction but not necessarily enough to provide
ongoing, targeted feedback to students. Related evidence includes:
• Lesson 10: “Scoring Guidance: Monarch Butterflies on the Shortgrass Prairie: This assessment
can be used to assess student progress on the LLPE” (Teacher Edition, page 369). The answer
key provides the specific elements of all three dimensions that are targeted in this assessment
and what information to look for regarding each element. For example, Analyzing and
Interpreting Data: “Look for (1) students using the structure of different data representations
(graphs, tables, maps) to identify patterns of stability and change in population and resource
availability; and (2) students connecting these patterns of change to textual evidence as a
means to establish a cause-and-effect relationship between resource availability and
population size” (Teacher Edition, page 369.) This scoring guidance serves as an answer key but
is not a true rubric that provides scoring criteria and what each level of performance might look
like. The answer key also does not provide information on how to modify instruction based on
student responses.
• Lesson 13: “Answer Key Scoring Guidance: Southwestern Willow Flycatcher: Allow students to
annotate the graphs using words and symbols and/or write what they observe in the data in
the space below the graph. Allow your students to choose the modality for communicating
their arguments. They can construct their arguments in writing or orally. The guidance provided
should be similar regardless of the modality that students select. This assessment can be used
to assess student progress on the LLPE” (Teacher Edition, page 373).
Ecosystem Dynamics
74
Scoring guidance is provided that contains the elements of the three dimensions and what to look for
from students on all three of the dimensions that are included in the assessment. For example:
• “The focal crosscutting concept for this assessment is cause-and-effect. However, students may
naturally use stability and change as they construct their arguments and describe additional
data they would want to support their arguments. For cause-and-effect, look at how students
reason about the relationships between populations (tamarisk beetle - tamarisk, tamarisk-
flycatcher, tamarisk-willow, flycatcher-willow). If needed, encourage students to use “if-then”
sentence frames to articulate how a change in one population may impact the other population.
Students may use stability and change to describe how the loss of tamarisk in St. George was a
small change given the other habitat trees available, while the loss of tamarisk in Mormon Mesa
was a big change given its predominance in that location. Students may also point to needing
more long-term data to understand how the flycatcher population is affected over the long-
term and whether the willows returned to either location” (Teacher Edition, page 373).
“Scientific Reasoning (CCC: Cause & Effect of disruption and change) Look for scientific
reasoning that supports a cause and effect relationship between the disruption to the
ecosystem and the willow flycatcher population, including: The introduction of the tamarisk
beetle resulted in fewer tamarisk plants. This disruption means that fewer tamarisk plants are
available as habitats for willow flycatchers to live and build nests. With fewer nests, there are
fewer willow flycatchers born in the next year after the beetle is introduced” (Teacher Edition,
page 377). The scoring guidance also includes a section called “What a student might be missing
if they selected this claim. Included are the three possible claims students could select and what
may be missing. ‘Claim A: Students selecting this claim might be missing that the mix and ratio
of trees is likely to impact how the willow flycatcher population responds to the release of the
beetles’” (Teacher Edition, page 378).
• Lesson 18: “Rubric Option 1: Redesign the Land: Developing a design solution (group)
Demonstrated: Evidence from student artifact includes: A model or design solution that
supports orangutan populations and community income is fully developed, attending to all
criteria and constraints. The strategies, or features, for each area are identified, including
reasoning for using certain strategies given different roles and land area. See evidence on How
can we redesign the way land is used in Indonesia to support orangutans and people at the
same time?” (Teacher Edition, page 389). The rubric includes three performance levels:
Missing, Developing, and Demonstrated; however, the only performance level with information
is the “Demonstrated” column. Rubric option 2 provides information for two categories:
Developing and Demonstrating. Rubric 3: Engaging in Argument from Evidence for a Land
Redesign includes three columns identifying the performance levels: missing, developing, and
mastered. However, none of these performance level columns contains any information about
what students’ performance looks like in each of the categories.
• Lesson 19: “Rubric: Obtaining and Communicating Information about the Palm Oil Problem
Category: Communicate information about the problem and what is contributing to the
problem. (Level) 1: Shares limited information about the problem and what is causing it. (Level)
2: Shares detailed information about the problem and/or some information about what is
Ecosystem Dynamics
75
causing it. (Level) 3: Shares detailed and relevant information about the problem and what is
causing it and tailors that information for a specific audience” (Teacher Edition, page 407).
• The Assessment Overview is a table of all unit assessments. It includes “When”, a list of
“Assessment and Scoring Guidance”, and “Purpose of Assessment.” For example:
o Lesson 6: “Formative: Lesson 6 is a critical moment to re-anchor the unit. After
students have spent Lessons 2 through 5 digging deeper into the problem, the students
are ready to re-articulate the problem, define a design goal, and take a 2nd pass at the
DQB. This lesson offers several opportunities for formative assessment, including (1)
when the class articulates the problem during a Consensus Discussion, and (2) when
the students articulate a design goal and criteria for a successful palm farm. When
defining the problem, students should identify the multiple aspects of the problem that
make it complex to solve (e.g., oil palm uses less land than alternatives, it grows in the
same place as tropical rainforests, and it provides income to farmers). Students should
set a goal for the design that functions for farmers, orangutans, and other living things.
Students should also suggest criteria that are in line with this goal, such as (1) the
newly designed palm farm supports animal populations like orangutans and tigers, and
(2) the newly designed palm farm supports the farmers’ income. Students may struggle
to suggest constraints, and that is OK at this point. Students may suggest constraints,
such as not taking land away from farmers, not cutting down new forests, and so forth”
(Teacher Edition, page 327).
Suggestions for Improvement
• Consider providing rubrics for more of the formative assessments included in the unit.
• Consider creating rubrics for the formative and summative assessments that include criteria for
all levels of performance (with student sample responses for each level and modality) and how
to modify instruction based on student responses (for formative assessments).
• Consider providing a range of student responses and specific guidance on interpreting and
responding to individual progress on elements of each dimension.
• Consider additional self-assessment opportunities with accompanying scoring guidance to help
students track and monitor their own progress
Extensive
Ecosystem Dynamics
76
The reviewers found extensive evidence that the materials assess student proficiency using accessible
and unbiased methods, vocabulary, representations, and examples because vocabulary and text volume
in student assessments are grade appropriate and scenarios are unbiased with teacher support for
awareness of the limitations of the scenario for reaching all students. There is some variety in the
modality expected for student responses. However, the meaningfulness of involving differences in
modality is not clear.
Visuals are provided to explain some vocabulary terms and relationships. For example:
• Lesson 2: A visual representation of the difference between oil palm and palm oil is provided
“Add “palm oil” and “oil palm” to your Word Wall and include a photograph or picture to help
students remember the difference between the two words” (Teacher Edition, page 55).
• Lesson 9: When controlling a simulation focused on populations “It may help to reference the
visual representation for individuals and populations that you developed in Lesson 7” (Teacher
Edition, page 152).
• Lesson 10: When students analyze graphs for patterns of increase or decrease in populations,
the teacher is told “help draw students’ attention toward which parts of the graphs to look for
and what visual cues to look for in order to find increasing and decreasing patterns” (Teacher
Edition, page 173).
Choice in modality of response is suggested for some tasks. For example:
• Lesson 1: “Universal Design for Learning: Using a key can be beneficial to all students for clearly
understanding symbols in the model, but these kinds of graphical representations of ideas can
also embody representations of key concepts and processes, and support students in using
multiple modalities for meaning-making, which is a powerful tool for equitable participation.
Encourage students to develop their models using both linguistic resources and multiple
modalities when expressing their ideas and reasoning” (Teacher Edition, page 39).
• Lesson 3: When setting up Progress Trackers in scientist notebooks that will be used for
individual reflections and formative assessment, the teacher is told: “Allow students to use any
modality to express their understanding and reasoning in their own way. The Progress Tracker is
one option, and can use text or visual images. Encourage students to express what they have
learned using a mode that makes sense for them” (Teacher Edition, page 72).
• Lesson 10: “This assessment encourages students to demonstrate their understanding of
key skills and concepts from the unit so far through multiple modalities, including writing to
explain and drawing models. Some students may benefit from using multiple modalities to
illustrate their thinking for any or all of the questions on this assessment. You may consider
allowing some students to present their answers verbally with you or with another student
acting as a scribe to record their thinking on paper. Some students may benefit from using
gestures, images, or manipulatives to support their explanations, as opposed to written text.
In each case, encouraging students to use multiple modalities to show their thinking creates
a clear, accessible, equitable pathway for all students to demonstrate proficiency” (Teacher
Edition, page 180).
Ecosystem Dynamics
77
• Lesson 13: On the “Southwestern Willow Flycatcher” assessment, scoring guidance document
“Allow your students to choose the modality for communicating their arguments. They can
construct their arguments in writing or orally” (Teacher Edition, page 373). “This assessment
encourages students to demonstrate their understanding of key skills and concepts from the
unit so far through multiple modalities, including analyzing and annotating data and writing
arguments to support claims. Some students may benefit from using multiple modalities to
share their thinking for any or all of the questions on this assessment. In each case, encouraging
students to use multiple modalities to share their thinking creates a clear, accessible, equitable
pathway for all students to demonstrate proficiency. Sharing orally may be particularly
beneficial for some students” (Teacher Edition, page 226).
• Lesson 18: “The default argumentation task is designed as a written task, but should be
considered an opportunity for your students to choose the modality at which they want to
communicate what they have figured out. Below are several options you may want to offer to
your students: oral argument presented to you live (e.g., 1 minute “elevator speech”) oral
argument presented to you via a video or audio recording visual representation that uses a
model to support the being claim made. visual representation that communicates an argument
through a poster design or other visual layout of information” (Teacher Edition, page 287).
Scenarios in the unit are unbiased with teacher support provided for awareness of the limitations of the
scenario for reaching all students. For example:
• Lesson 1: “Palm oil has been harvested in west and central Africa for thousands of years. Be
mindful that you may have students in your classroom who come from cultural backgrounds in
which palm oil was sustainably harvested as part of their cultural tradition. You may also have
students in your classroom for whom palm oil is the primary cooking oil in their homes Instead
of villainizing the palm oil itself, help your students focus on the way we are farming it today on
large-scale plantations. This lesson includes an optional extension designed to explore the
characteristics of plantations and farms more fully, allowing students to connect to prior
knowledge and experiences and more fully develop a historical and modern-day perspective of
agricultural practices. It is designed intentionally to bring up similarities and differences across
historical and modern-day plantations and farms. This will include the negative and
controversial land and labor practices associated with these places. It is important to
acknowledge these practices exist and to help students understand that when we choose to
discuss these agricultural systems of plantations and farms, we are also acknowledging how the
land is being used and who the workers are in these places, both past and present. Regardless
of the decision to pursue the optional extension, this lesson includes a discussion in which
students consider the use of the term “plantation” and its negative social and historical
meanings. Students decide, as a class, to use an alternative word that does not have the same
negative social and historical meanings as the word “plantation." The materials will default to
“farm,” though the class should feel they can use the word they chose together” (Teacher
Edition, page 29).
Suggestions for Improvement
Ecosystem Dynamics
78
• Consider providing a range of expected student assessment responses in multiple modalities.
• Consider providing information to help teachers understand the reason for the modality or
modalities expected for student responses in different tasks.
Adequate
The reviewers found Adequate evidence that the materials include pre-, formative, summative, and self-
assessment measures that assess three-dimensional learning because all four assessment types are
present and the purpose and rationale for assessments is explicitly described. However, they are not
always described for all three dimensions.
Pre-assessment is included in the unit materials. For example:
• Lesson 1: “The initial models developed in the lesson are an opportunity to pre-assess student
understanding of systems thinking in the context of ecosystem changes. The two most
important times to do this include: (1) on day 2, after students have developed their initial
system model and (2) during the Consensus Discussion on day 3 when the class develops an
initial model together” (Assessment System Overview, page 1). “Assessment Opportunity:
Building towards: 1.A Develop an initial system model to describe a phenomenon in which
changes to one living component of an ecosystem (cause) affect the other living parts of the
ecosystem (effect)” (Teacher Edition, page 41).
• Lesson 1: “The Driving Question Board is another opportunity for pre-assessment. Reinforce for
students to generate open-ended questions, such as how and why questions, to post to the
DQB, but celebrate any questions that students share even if they are close-ended questions.
Make note of the parts of the ecosystem that have many questions and the parts that have few
or no questions. If a part of the system has few or no questions, prompt students to generate
more questions in this space so that each part of the system has a set of questions with which to
guide investigations. As you move into the discussion of ideas for future investigations and data
we need, have students focus on categorizing their questions and then identifying the kinds of
data and additional information that would help answer a category of questions” (Assessment
System Overview, page 1).
Ecosystem Dynamics
79
Formative assessment is included in the unit materials. See evidence in Criterion III.B.
Summative assessment is included in the unit materials. For example:
• Lesson 10: “There is a formative and summative assessment at the end of Lesson Set 2. The
lesson level performance expectation is: Analyze and interpret data to draw conclusions about
how changes in resource availability affect populations in the short- and long-term. This
assessment is building towards MS-LS2-1. Analyze and interpret data to provide evidence for the
effects of resource availability on organisms and populations of organisms in an ecosystem. At
this point, students should be able to explain that resource availability affects individual
organisms’ survival and reproduction, which ultimately affects population size. Land use change
by farming has decreased resource availability. Students demonstrate their new understanding
using a related phenomenon of monarch butterfly populations that depend on the prairie,
which has largely been converted for agricultural use. Prior to engaging in the individual
assessment, spend 10–15 minutes setting up the new context of monarch butterflies on the
prairie and mapping the new case to the orangutan case” (Teacher Edition, page 327).
• Lesson 13: “There is a formative and summative assessment at the end of Lesson Set 3. The
lesson level performance expectation is: Construct an argument supported by empirical
evidence that releasing the tamarisk beetle (change) affects the willow flycatcher population
when there are fewer nesting tree types available. This assessment is building towards MS-LS2-
4. Construct an argument supported by empirical evidence that changes to physical or biological
components of an ecosystem affect populations. This is a summative assessment focused on
students’ understanding of ecosystem interactions and disruptions that can change systems
over time. The context of the assessment is a real-world debate in the southwestern United
States. The case focuses on the southwestern willow flycatcher population who has been
impacted by invasive tamarisks and tamarisk (leaf) beetles. The assessment is an opportunity to
engage your students in authentic argumentation based on a small subset of data. To prepare
your students for this transfer task, you will spend at least 20 minutes orienting students to the
new case by mapping the new case model to the orangutan model. Students will also make
predictions with different disruption scenarios in the new context before they engage in
individual argumentation on the assessment” (Assessment System Overview, page 3).
Self-assessment is included in the unit materials. For example:
• Lesson 11: “Give students time to reflect on their participation in discussion. Display slide F. Pass
out 1 copy of the Self-Assessment for Classroom Discussions handout to each student. Allow
students time to reflect on their participation and brainstorm ways to improve or change
participation in the next class period, where students will again be engaging in small group and
whole group work. You may want to ask students to attach this handout to their science
notebooks so they can reread their reflection at the start of the next class” (Teacher Edition,
page 194).
• Lesson 17: “In addition to writing an explanation, students should complete the Teamwork Self-
Assessment. Use this as an opportunity to help students reflect on their own work and to
provide feedback on their teamwork” (Teacher Edition, page 274). The following are some of the
Ecosystem Dynamics
80
prompts included in the self-assessment. “I shared my thinking and contributed ideas to our
design. I used evidence to support my ideas, asked for evidence from others, and/or suggested
ways to get additional evidence. I contributed to the work of drawing, writing, and building. I
asked questions to help us understand everyone’s ideas. I encouraged others to share their
ideas. I was open to changing my mind and challenged myself to think in new ways. I may have
critiqued the ideas we were working with, but I was careful not to critique the people I was
working with. When things did not go how we had planned or hoped, I stuck with it and learned
from our failures” (Teamwork Self-Assessment, page 1).
• Lesson 19: “Present final PSAs. Students should present their final projects anywhere between
days 3-5 of this lesson.. Use Obtaining and Communicating Information about the Palm Oil
Problem to assess each group’s product. This is also another opportunity for self- and peer
assessment using Obtaining and Communicating Information about the Palm Oil Problem”
(Teacher Edition, page 311).
• Lesson 20: “Students self-assessment is one option for assessment. See Self-Assessment: Giving
and Receiving Feedback. If it makes sense, consider also including an opportunity for peer
feedback. See Reference: Peer Feedback Guidelines” (Teacher Edition, page 321).
Suggestions for Improvement
• Consider adding more support for teachers (e.g., rubrics, ways to modify instruction, how all
three dimensions are assessed and developed over time) on all formative assessments
throughout the unit.
• Consider explicitly adding and connecting rationale for how and why CCC elements are being
assessed to inform student proficiency in applying the CCC element to sense-making.
• The unit introduction lists 9 focal DCI elements, 6 SEP elements, and 3 CCC elements.
Assessments would therefore ideally focus on individual student proficiency for each of these
claimed focal elements. Consider reducing the number of focal elements to ensure alignment
and ongoing monitoring of student growth.
Adequate
The reviewers found Adequate evidence that the materials provide multiple opportunities for students
to demonstrate performance of practices connected with their understanding of core ideas and
Ecosystem Dynamics
81
crosscutting concepts because there were some iterative opportunities for students to demonstrate
growth in proficiency over time, there were some opportunities for written and oral feedback from
teacher and peers, and some opportunities for students to use feedback to construct new learning.
However, iterative opportunities to demonstrate growth in key claimed learning and respond to
feedback are concentrated towards the end of the unit.
Students have opportunities to receive peer and teacher feedback on their performance of some of the
targeted elements in the unit. For example:
• Lesson 1: “Peer or Teacher Feedback: Provide feedback to another student using the following
table. Is the question open ended? Yes or no? Feedback and/or suggested revision Does the
information or data in question #5 help answer the question? Does the question help the
student achieve their purpose for asking the question??” (Teacher Edition, page 352).
• Lesson 10: Students read case studies and engage in jigsaw discussions. “As you share what you
learned, remember to give specific details to help your group members understand your
organism, the resources it needs, and what changed in your case study.” “Say, If you’re having
trouble understanding what someone in your group is describing, make sure to ask them to
explain or give evidence from their case study” (Teacher Edition, page 176).
• Lesson 17: “Teacher Reference: Teacher Feedback on Land Redesign Projects: Strategies for
providing feedback: Before providing feedback, view the work students are doing on the
computer simulation and the current status of their design. Listen carefully to group
conversations to get a sense of the tradeoffs students are considering. When you feel ready to
provide feedback, consider the following strategies: Provide verbal feedback: Use sticky notes
to record feedback and leave the sticky note feedback with the group” (Teacher Edition, page
385). This feedback comes very late in the unit, giving students limited time to learn from
feedback before the end of the unit.
• Lesson 17: “What is one piece of feedback you received? What did you add or change to
address this feedback?” (Lesson 17 Handout: Self-Assessment: Giving and Receiving Feedback,
page 1).
• Lesson 18: “Peer Feedback and Revisions: With a partner, 21. Present your argument to a peer
for about 1 minute. 22. Listen to feedback about what to add or change to make it more
convincing for about 1 minute. 23. Then, switch and repeat for the other partner’s argument.
On your own 24. Reflect on the feedback you received. 25. Complete Question 3 on your
handout: What additional information do you want to add or change?” (Student Edition, page
68).
There are iterative student performances that provide students with the opportunity to demonstrate
their growth in proficiency over time.
• Lesson 11: Students update their model that was first developed in Lesson 1 based on the unit
phenomenon. They add new information about palm oil farms and how they relate to orangutan
populations. “Introduce the modeling task. Display slide B. Preview the instructions with
students. Explain that students are going to receive more information about these populations
and work in their small groups to develop a system model for the oil palm system. Review with
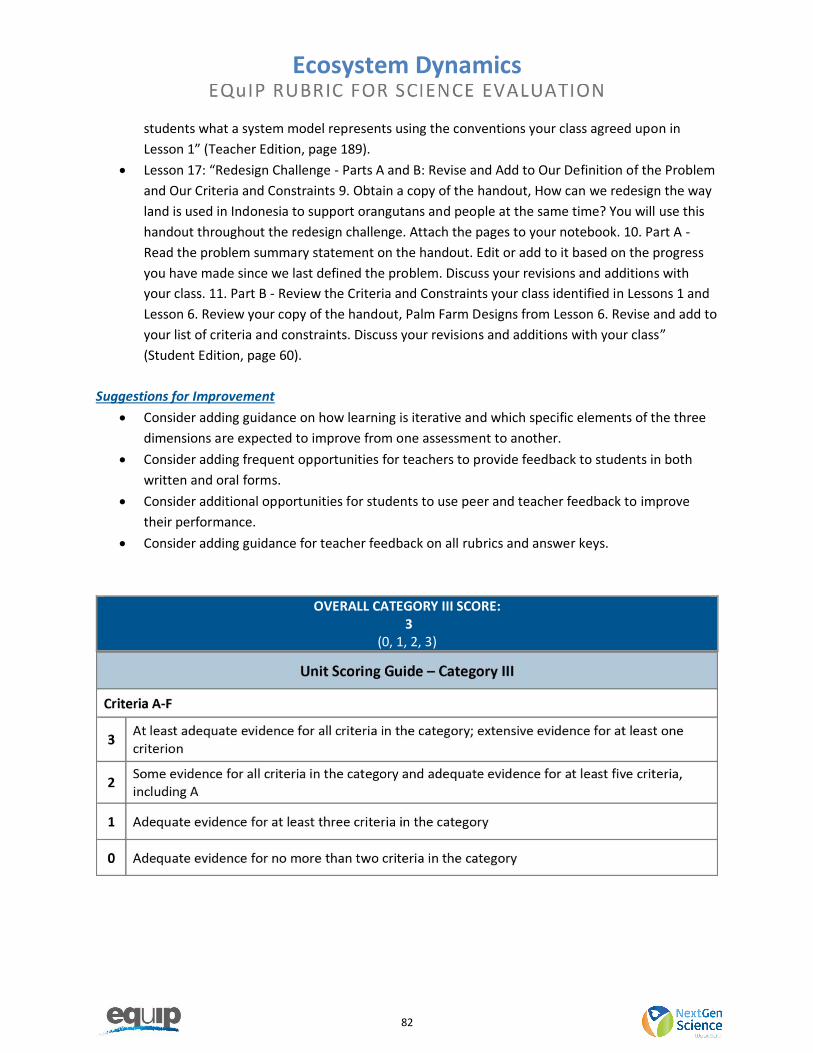
Ecosystem Dynamics
82
students what a system model represents using the conventions your class agreed upon in
Lesson 1” (Teacher Edition, page 189).
• Lesson 17: “Redesign Challenge - Parts A and B: Revise and Add to Our Definition of the Problem
and Our Criteria and Constraints 9. Obtain a copy of the handout, How can we redesign the way
land is used in Indonesia to support orangutans and people at the same time? You will use this
handout throughout the redesign challenge. Attach the pages to your notebook. 10. Part A -
Read the problem summary statement on the handout. Edit or add to it based on the progress
you have made since we last defined the problem. Discuss your revisions and additions with
your class. 11. Part B - Review the Criteria and Constraints your class identified in Lessons 1 and
Lesson 6. Review your copy of the handout, Palm Farm Designs from Lesson 6. Revise and add to
your list of criteria and constraints. Discuss your revisions and additions with your class”
(Student Edition, page 60).
Suggestions for Improvement
• Consider adding guidance on how learning is iterative and which specific elements of the three
dimensions are expected to improve from one assessment to another.
• Consider adding frequent opportunities for teachers to provide feedback to students in both
written and oral forms.
• Consider additional opportunities for students to use peer and teacher feedback to improve
their performance.
• Consider adding guidance for teacher feedback on all rubrics and answer keys.
OVERALL CATEGORY III SCORE: 3
(0, 1, 2, 3)
Ecosystem Dynamics
83
SCORING GUIDES
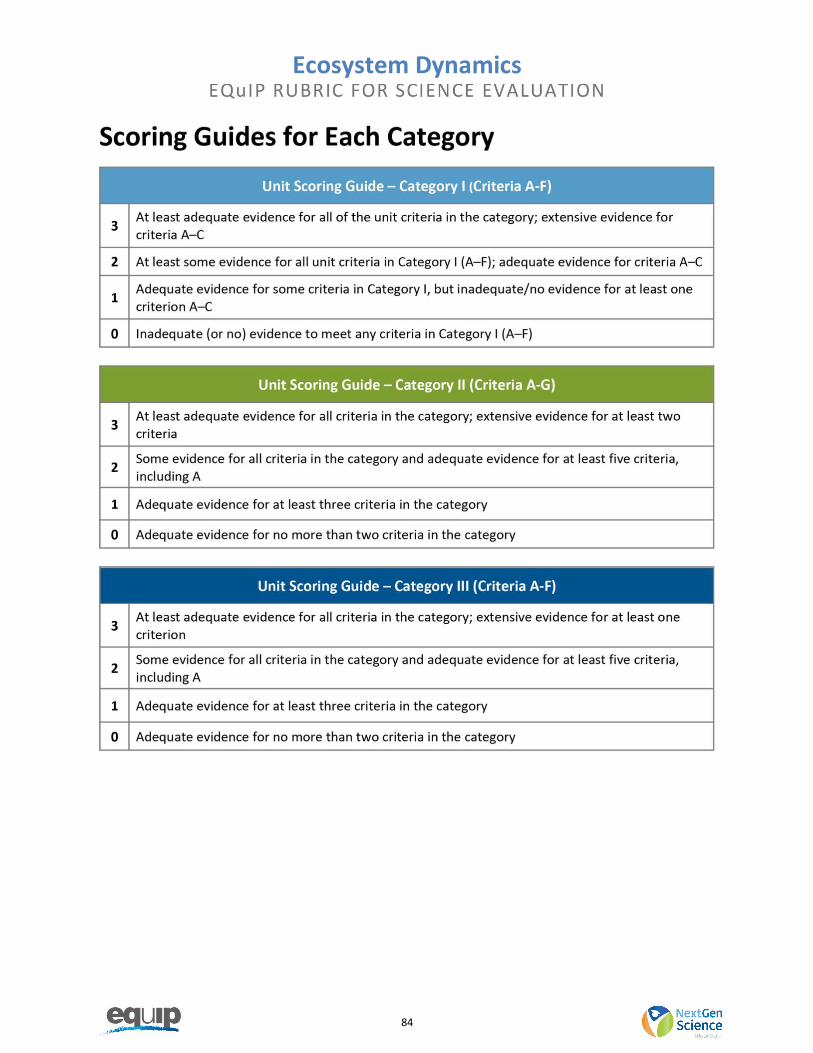
Ecosystem Dynamics
84
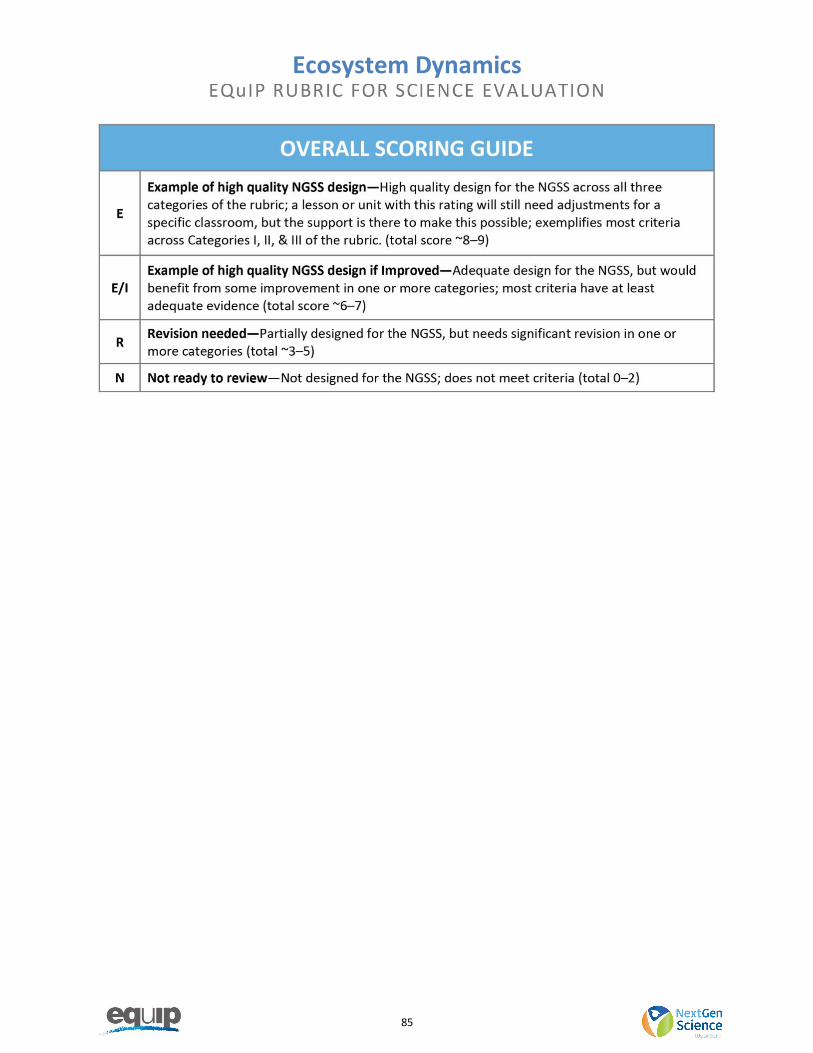
Ecosystem Dynamics
85