Embed Size (px)
Citation preview

How does foreign entry affect domestic banking markets?
Stijn Claessens, Asli Demirgüç-Kunt, and Harry Huizinga1
Revised: January 2000
Abstract:
Using 7900 bank observations from 80 countries for the 1988-1995 period, this paper examines the extent and effect of foreign presence in domestic banking markets. We investigate how net interest margins, overhead, taxes paid, and profitability differ between foreign and domestic banks. We find that foreign banks have higher profits than domestic banks in developing countries, but the opposite is the case for developed countries. Estimation results suggest that a increased presence of foreign banks is associated with a reduction in profitability and margins for domestic banks.
Keywords: foreign entry, domestic banking. JEL Classification: E44, G21
1 Financial Sector Strategy and Policy Group, The World Bank, Development Research Group, The World Bank, and CentER and Department of Economics, Tilburg University, respectively. The findings, interpretations, and conclusions expressed in this paper are entirely those of the authors. They do not necessarily represent the views of the World Bank, its Executive Directors, or the countries they represent. We thank two referees for valuable comments and Anqing Shi and Luc Laeven for excellent research assistance.

2
1. Introduction
In recent decades, international trade in goods and financial services has become
increasingly important. To facilitate such trade, many banking institutions have also
become international.2 Banks have expanded internationally by establishing foreign
subsidiaries and branches or by taking over established foreign banks. The
internationalization of the banking sector has been spurred by the liberalization of
financial markets worldwide. Developed and developing countries alike now increasingly
allow banks to be foreign-owned and allow foreign entry on a national treatment basis.
Financial liberalization of this kind proceeds, among other reasons, on the
premise that the gains from foreign entry to the domestic banking system outweigh any
losses. Several authors have addressed the potential benefits of foreign bank entry for the
domestic economy in terms of better resource allocation and higher efficiency (see
Levine (1996), Walter and Gray (1983), and Gelb and Sagari (1990)). Levine (1996)
specifically mentions that foreign banks may (i) improve the quality and availability of
financial services in the domestic financial market by increasing bank competition, and
enabling the greater application of more modern banking skills and technology, (ii) serve
to stimulate the development of the underlying bank supervisory and legal framework,
and (iii) enhance a country’s access to international capital.
There may also be costs to opening financial markets to foreign competition.
Stiglitz (1993), for instance, discusses the potential costs to domestic banks, local
entrepreneurs, and the government resulting from foreign bank entry. Domestic banks
2 See Aliber (1984) for an early survey of the literature on the internationalization of banking.

3
may incur costs since they have to compete with large international banks with better
reputation; local entrepreneurs may receive less access to financial services since foreign
banks generally concentrate on multinational firms; and governments may find their
control of the economy diminished since foreign banks tend to be less sensitive to their
wishes.
As yet, little evidence exists of the effects of an internationalization of the
banking sector other than several case studies of foreign bank entry. McFadden (1994)
reviews foreign bank entry in Australia, and finds that this has led to improved domestic
bank operations. Bhattacharaya (1993) reports on specific cases in Pakistan, Turkey, and
Korea, where foreign banks facilitated access to foreign capital for domestic projects.
Pigott (1986) describes the policies that have made increased foreign bank activity
possible in nine Pacific Basin countries, and provides some aggregate statistics on the
size and scope of foreign banking activities in these markets.3 Using aggregate
accounting data, Terrell (1986, Table 20-2) compares the banking markets of 14
developed countries (8 of which allow foreign bank entry) for 1976 and 1977.
Interestingly, in this sample, countries that allowed foreign bank entry on average
experience lower gross interest margins, lower pre-tax profits, and lower operating costs
(all scaled by the volume of business). Terrell (1986), however, does not control for
influences on domestic banking other than whether or not foreign banks are permitted to
enter.
3 Cho and Khatkhate (1989) provide in-depth case studies of financial liberalization in five Asian countries, however with no particular emphasis on foreign bank entry. Liberalization, though, is shown to lead to faster growth of the financial system and to increased competitiveness of the banking system, even if there

4
This paper aims to provide a systematic study of how foreign bank presence has
affected domestic banking markets in 80 countries. To do this, we use bank-level
accounting data and macroeconomic data for the 1988-1995 period. We first examine the
scale of foreign bank operations in each of the 80 countries. We define a bank to be
foreign if at least 50 percent of its shares is foreign-owned, i.e., when there is foreign
control of a bank’s operations. As measures of foreign bank presence, we consider the
importance of foreign banks both in terms of numbers and in terms of assets.
We then extend the work on the accounting decomposition of interest margins by
Hanson and Rocha (1986) and, more recently, Demirgüç-Kunt and Huizinga (1999).
Specifically, we use the data to investigate how foreign banks differ from domestic banks
in terms of interest margins, taxes paid, overhead expenses, loan loss provisioning, and
profitability. We find that, while foreign banks have lower interest margins, overhead
expenses, and profitability than domestic banks in developed countries (consistent with
Terrell’s (1986) findings), the opposite is true in developing countries. This suggests that
the reasons for foreign entry, as well as the competitive and regulatory conditions found
abroad, differ significantly between developed and developing countries.
Next, we estimate empirically how increased foreign bank presence, measured as
the change in the ratio of the number of foreign banks to the total number of banks,
affects the operation of domestic banks. We find that increased presence of foreign
banks is associated with reductions in profitability, lower non-interest income, and
overall expenses of domestic banks.
is no conclusive evidence that financial liberalization leads to lower intermediation margins. In their comparative study, Frankel and Montgomery (1991) also bypass the issue of internationalization.

5
The remainder of this paper is organized as follows. Section 2 presents data on
the relevance of foreign banks in 80 national banking markets. Section 3 presents the
empirical results, while section 4 concludes.
2. The data
We use information from the financial statements of domestic and foreign
commercial banks. The data comes from the BankScope data base provided by IBCA
(for a complete list of data sources and variable definitions, see the Appendix).
Coverage by IBCA is comprehensive, with banks included roughly accounting for 90
percent of the assets of banks in each country. The data are compiled by IBCA mostly
from the balance sheet, income statement and applicable notes found in audited annual
reports. Each country has its own data template which allows for differences in reporting
and accounting conventions. These are converted to a “global format” which is a
globally standardized template derived from the country-specific templates. The global
format contains thirty six standard ratios which can be compared across banks and
between countries. To our knowledge, this is the most comprehensive data base that
allows cross-country comparisons. While the underlying data reflects international
accounting standards as much as possible, and IBCA makes an effort to standardize
individual bank data while converting to the global format, some differences in
accounting conventions regarding the valuation of assets, loan loss provisioning, hidden

6
reserves, etc., no doubt remain.4 We try to capture some of these remaining differences
by using country-dummies in our regressions.
We start with the entire universe of commercial banks, with the exception that for
France, Germany and the United States only several hundred commercial banks listed as
‘large’ are included. To ensure reasonable coverage for individual countries, we include
only countries where there are data for at least three banks -- domestic and/or foreign --
in a country for a given year. This yields a data set covering 80 countries during the
years 1988-1995, with about 7900 individual commercial bank observations. This data
set includes all OECD countries, as well as many developing countries and economies in
transition.
While comprehensive, this data set does not allow us to distinguish between
wholesale versus retail banking markets. It can be argued that since foreign bank entry
initially commonly takes place in the wholesale banking market, it is more appropriate to
study the impact of entry in this market instead of the national geographic market.
However, unless various customer markets are completely segmented, foreign bank
presence at the wholesale level can be expected to have an impact at the retail level as
well. Specifically, as foreign banks expand their operations at the wholesale level, the
threat of foreign banks encroaching on retail markets may be also induce greater
efficiency and lower costs of domestic banks at the retail level.
Another, related distinction concerns de novo foreign entry versus entry through
the foreign acquisition of a (sizable) domestic bank. The two types of foreign entry may
4 See Vittas (1991) for an account of the pitfalls in interpreting international bank operating ratios.

7
have different implications for domestic banks. Data available, however, does not allow
us to make this distinction either.
We first provide information on the aggregate income statement items for all
domestic and foreign banks in each of the 80 countries individually. We then present
averages for country groups, by income and geographical location to better illustrate the
differences between domestic and foreign banks in developing and developed countries.
From the bank’s income statement, the following accounting identity follows:
(1) net margin/ta + non-interest income/ta = before tax profits/ta + overhead/ta +
loan loss provisioning/ta
The first two ratios are the accounting values of a bank’s net interest income over
its total assets, or net margin/ta, and its net non-interest income over total assets, non-
interest income/ta. The non-interest income/ta captures the fact that many banks also
engage in non-lending activities, such as investment banking and brokerage services,
which generate income. To measure bank profitability in the accounting identity, we use
the bank’s before-tax profits over total assets, or before tax profits/ta. This latter variable
can subsequently be broken down into the after tax profits/ta and tax/ta variables. The
overhead/ta variable represents the bank’s entire overhead over total assets, while loan
loss provisioning/ta simply measures actual provisioning for bad debts over total assets.
Similar to other studies on the effects of changes in market structures on firm
performance, we focus on accounting measures of income and profitability rather than

8
rates of return on stocks. This is for several reasons. For one, (risk-adjusted) financial
returns on bank stocks are equalized by investors in the absence of prohibitive
international investment barriers or other transaction costs. Comparing these returns
across different banking systems would thus not allow us to investigate the effects of
different degrees of competition and the effects of foreign bank entry. For this reason,
Gorton and Rosen (1995) and Schranz (1993) focus on accounting measures of
profitability when examining managerial entrenchment and bank takeovers. Also,
financial returns data are not available for a similarly large set of banks and countries.
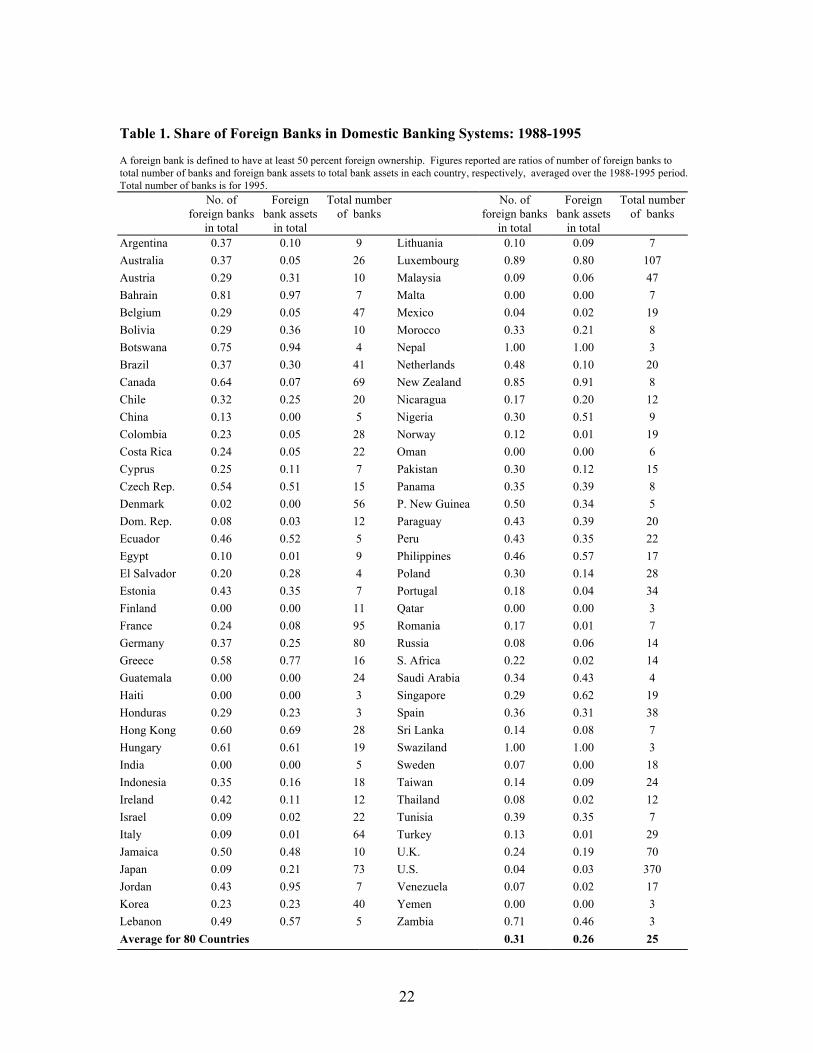
First, we document the extent of foreign bank presence in national banking
environments. Table 1 presents two measures of foreign bank presence: the share of the
number of banks that are foreign-owned, and the share of foreign bank assets in total
bank assets. The number presence measure is an appropriate measure, if the number of
domestic and foreign banks determines competitive conditions. This might be the case, if
domestic banking firms adjust the pricing of their lending and other activities as soon as
foreign entry occurs to prevent the foreign entrants from capturing significant market
share. Alternatively, the share presence measure can be appropriate, if foreign banks
start to have an impact on the pricing and profitability of domestic banks only after
gaining market share. Foreign banks may, for example, have to be sizable for there to be
any significant pressure on the spreads of domestic banks. Note that both presence
measures capture actual foreign banking presence, and thus do not capture the
disciplining effects on domestic banks of potential foreign bank entry. The threat of
foreign bank entry is difficult to measure, however, in part as it very difficult to

9
objectively measure the barriers to entry in a banking market, and in any case the absence
of barriers may be closely related to actual entry.
From Table 1, we see that for about three-fifth of the countries the number foreign
presence measure exceeds the asset presence measure (this is the case for France,
Germany, Italy, the U.K. and the U.S., but not Japan). This is also the case for a simple
average of all the countries. This reflects that foreign banks tend to be smaller than
domestic banks. Either presence measure is zero for Finland, Guatemala, Haiti, India,
Malta, Oman, and Yemen, reflecting in part regulatory barriers to foreign bank entry. At
the other extreme, Nepal and Swaziland only have foreign-owned banks in our sample.
Other countries with a large foreign bank presence (with both foreign presence measures
exceeding 75 percent) are Bahrain, Botswana, Luxembourg, and New Zealand. A
colonial past or the presence of a large neighboring country might explain some of these
high ratios. Among the developed countries, Denmark, Finland, Italy, Sweden and the
United States have relatively insulated banking markets, with foreign presence measures
below 10 percent.5 The last column for each country reports the total number of banks in
the sample for 1995.
Next, we consider whether there is a systematic link between foreign bank
presence and national income. In Table 2 we present average foreign presence shares by
national income group.6 Interestingly, the foreign asset share in the low-income
5 Previous studies, such as DeYoung and Nolle (1996) report foreign bank presence ratios of almost 50 percent for the U.S. However these studies define a bank as foreign if has more than 10 percent foreign ownership. In addition, these studies include off-shore operations of foreign banks. Data reported in Federal Reserve Bulletins confirm the figures we obtain above. 6 For country groupings by income, see the World Development Report (1996).

10
countries in our sample is comparable to that of high-income countries, with somewhat
higher presence shares for middle-income countries. This finding suggests that the
differences in national foreign presence shares in Table 1 are not necessarily due to
differences in levels of national income. Table 2 also provides a breakdown of the
average foreign presence share by geographical regions which exhibits quite a bit of
variation.7 While these aggregates are interesting, the high dispersion within groups
suggests that grouping by income or region may not be very informative.
Next, Table 3 presents the net interest margins and other accounting variables for
domestic and foreign banks separately in each of the 80 countries in the 1988-1995
period. An ownership indicator of “D” refers to the group of domestic banks, while an
indicator of “F” refers to the foreign banks. As already evident from Table 1, not all
countries have both domestic and foreign banks.
In some developing countries (such as Argentina, Costa Rica, and Venezuela),
foreign banks realize net interest incomes of around 10 percent of assets or higher. Also
in many developing countries (for example Egypt, Indonesia, Argentina and Venezuela)
foreign banks in fact report significantly higher net interest margins than domestic banks.
Instead, in most developed countries (for instance, in France, Austria, Australia, Japan,
the United Kingdom, and the United States), foreign banks report significantly lower net
interest margins than domestic banks.
7 Countries in transition are China, the Czech Republic, Estonia, Hungary, Lithuania, Poland, Romania, Russia, and Slovenia. Neither this group of countries nor the industrial economies are in regions in the strict sense.

11
These differences may reflect the differing market conditions foreign banks find
abroad. In developing countries, foreign banks may be able to realize high interest
margins because they are exempt from credit allocation regulations and other restrictions
which are a net burden on margins. Where state banks dominate a large share of the
banking system, non-commercial criteria may be frequently used to allocate credit, with
resulting downward pressure on margins. Furthermore, pervasive market inefficiencies
and outmoded banking practices that exist in developing countries should also allow
foreign banks to reap higher net interest margins than domestic banks, outweighing the
information disadvantages they possibly may face.
Developed country banking markets tend to be more competitive with more
sophisticated participants. The low margins of foreign banks in developed countries may
in addition be due to the fact that any technical advantages foreign banks may have in
these markets are not significant enough to overcome the informational disadvantages
they face relative to domestic banks.
The overhead/ta variable reflects the bank’s overhead associated with its deposit
and loan operations as well as any other activities. Foreign banks might on the one hand
have high overhead costs if they have to overcome large informational disadvantages, but
on the other hand they may have low overhead expenses if they engage mostly in
wholesale transactions. Many developed countries, such as Australia, Japan, the United
Kingdom, and the United States have foreign banks with significantly lower overhead
costs (as a percentage of assets) than domestic banks. In many developing countries,
12
however, foreign banks tend to have higher overhead than domestic banks, although the
difference is not significant most of the time.
Next, the tax/ta variable reflects primarily the corporate income tax in the host
country. Differences in this variable between domestic and foreign banks may reflect
different de-jure tax treatment, although most countries do not discriminate in this regard.
More likely, any tax burden differences reflect differences in the activity mix between
foreign and domestic banks and foreign banks’ efforts to shift profits worldwide so as to
minimize their global tax bill. Prima facie, foreign banks can be expected to have more
opportunities to shift taxable income abroad than domestic banks. In any event, banks
have an incentive to shift profits out of (into) high-tax (low-tax) jurisdictions. An
interesting case is the United States where foreign banks pay taxes as a share of assets at
about two-thirds the taxes paid by domestic banks (tax/ta of 0.3 vs. 0.5 percent). Also in
some other developed countries, such as in Australia, Austria, Belgium, the Netherlands,
Spain, and the United Kingdom foreign banks pay relatively low taxes. This pattern is
not as pervasive in developing countries: counter examples include Malaysia and Egypt.
An important determinant of actual tax bill is no doubt tax enforcement, which varies
from country to country.
The loan loss provisioning/ta variable measures the new provisioning made
during the accounting year for any previously contracted credits. Differences between
domestic and foreign banks here may reflect a difference in customer mix (with foreign
banks concentrating on large corporations rather than mortgage or consumer loans).
Alternatively, different provisioning ratios may reflect differences in foreign and

13
domestic banks’ ability to screen bad credit risks and willingness to provision for bad
risks. Foreign banks have higher provisioning ratios in some countries including
Australia, Canada, Germany, Japan, and the United Kingdom but most of these
differences are not significant. We see significantly lower provisioning ratios in Austria,
Denmark, France and Sweden. Also in some developing countries, foreign banks differ
statistically significantly from domestic banks in this regard.
Finally, the table provides information on differences in net profits over assets, or
net profits/ta, between domestic and foreign banks. As an accounting residual, this
variable is affected by each of the foregoing accounting variables in the table. In
addition, the required net profits of foreign banks may be influenced by the tax regime of
the bank’s parent country. A foreign bank that will benefit from a foreign tax credit, for
instance, may accept a relatively low net-of-host-country-tax profitability. At the same
time, domestic and foreign banks may accept different net profits to the extent that their
cost of capital differs. Foreign banks, specifically, may be able to raise equity capital
internationally, and therefore accept a lower net profitability. Although the significance
levels vary, the data shows that foreign banks have lower net profits in most developed
countries, whereas they generally have higher net profits in developing countries. This
supports DeYoung and Nolle (1996) who argue that foreign banks in the United States
have been relatively less profitable because they valued growth above profitability.
Table 4 provides a summary of Table 3 by averaging this data for domestic and
foreign banks by different country groupings. Considering the breakdown by income, we
see that foreign banks on average obtain the lowest interest margins in high-income

14
countries, and their margins are significantly lower than those of domestic banks in upper
middle and high income countries. At the same time, foreign banks achieve higher
interest margins than domestic banks in low income and lower middle income countries,
although this difference is significant only for the lowest income group. Overhead
expenses, taxes and net profitability of foreign banks in low-income countries similarly
tend to be relatively high (although these results are not significant). In high income
countries, however, these ratios are significantly lower for foreign banks. Note that
banks in low-income countries have significantly higher overhead expenses than banks in
high-income countries, despite generally lower wages in low-income countries. This
probably reflects bank overstaffing and possibly difficulties in evaluating loans in low-
income countries. Differences in loan loss provisioning ratios vary across income
groups. Foreign bank provisioning ratios are significantly lower than those of domestic
banks in high income countries, possibly reflecting the fact that foreign banks generally
provide relatively little risky consumer credit. The opposite is true in upper middle
income countries, however. The reason may be that foreign banks are at an informational
disadvantage in identifying good credit risks, or that they have more conservative
provisioning policies.
Turning to the breakdown by geographical region, we see that interest margins
are highest in Latin America and in the transitional economies. In both cases, high
overhead expenses seem to be the driving factor behind the high interest margins. In Asia
and Latin America foreign banks have higher interest margins than domestic banks, but
this difference is significant only for the first group. These are the two geographic

15
regions where foreign banks also have higher non-interest income ratios. In Africa,
Middle East and industrial economies domestic banks have significantly higher non-
interest income. Turning to taxes paid, the taxation of banking appears to be very high
in transition economies. Foreign banks pay higher taxes than domestic banks only in
Latin America. Provisioning levels are not significantly different except in industrialized
economies where foreign banks provision less. Finally, only in Asia and in Latin
America do foreign banks achieve significantly higher net profitability than domestic
banks.
3. Empirical estimation
In previous work, Demirgüç-Kunt and Huizinga (1999) investigate how a variety
of bank variables, including ownership, affect banks’ net interest income and
profitability.8 Foreign ownership was found to be associated with higher net interest
margins and profits in developing countries, while this result was reversed in developed
countries. That paper did not investigate, however, how foreign bank entry, i.e., a change
in foreign bank presence, might affect the operation of domestic banks. In this paper, we
extend the previous work by examining in detail if foreign bank entry is correlated with
changes in any of the five variables in the accounting equation (1).
To start, we estimate the following equation in first differences9
8 See also Barth, Nolle, and Rice (1997) who use bank-level accounting data for 1993 to study the impact of bank powers on the return to equity for a set of 19 countries. 9 Eq. (2) is a reduced form equation that relates endogenous banking variables, such a profitability to banking ‘inputs’ such as bank equity and non-interest earning assets and a set of controls, including the foreign bank share. DeYoung and Nolle (1996), among others, more explicitly derive a profit function that relates profitability to bank inputs and various controls.

16
(2) DIijt = αo + $ DFSjt + $i DBit+ $j DXjt + εijt
where Iijt = is the dependent variable (say, before tax profits/ta) for domestic bank i in
country j at time t; FSjt is the share of foreign banks in country j at time t (i.e., number of
foreign banks divided by the total number of banks); Bit are bank variables for domestic
bank i at time t ; Xjt are country variables for country j at time t. Further, αo is a
constant, and $, $i, and $j, are coefficients, while εijt is an error term. All regressions
include country and time-specific fixed effects. The estimation uses weighted least
squares, with the weights being the inverse of the number of domestic banks in a country
in a given year (to correct for varying numbers of banks across countries). We report
heteroskedasticity-corrected standard errors.
The estimation results, Table 5, indicate that foreign bank entry is significantly
associated with a reduction in domestic bank profitability (column 3), and also a
reduction in non-interest income and overhead expenses (columns 2 and 4), although
these results are less significant. We do not see a significant association of net interest
margins or loan loss provisioning with foreign entry. We interpret these results to mean
that foreign bank entry is associated with greater efficiency in the domestic banking
system. Holding other factors constant, high profits reflect an absence of competition,
while high overhead costs may reflect less efficient management and inferior
organizational structures. Foreign bank entry may enable domestic banks to reduce costs
as they assimilate any superior banking techniques and practices of foreign entrants.

17
Alternatively, or complementary, foreign bank entry may force domestic bank managers
to give up their sheltered ‘quiet life’ and to exert greater effort to reach cost efficiency.10
Turning to control variables, we see that inflation and real interest rate variables
are positively related to the net interest margin, before tax profits, and overheads.11 These
results are consistent with the notion that a higher interest rate and a higher inflation lead
to higher bank margins and profits, but also to higher operating costs. Increases in
overhead/ta are also associated with relatively higher interest and non-interest income
and lower profits.12 The first difference of per capital income, or Gdp/cap, interestingly
is associated with reduced costs as well as lower loan loss provisioning. Perhaps banks
can more easily reduce costly employment when incomes are growing.
As an alternative definition of the foreign bank share, we use the ratio of foreign
bank assets to total bank assets. After substituting for the foreign bank share, we find this
variable enters all five (unreported) regressions as in Table 5 with the same, negative
sign, but with an insignificant coefficient. This suggests that the number of foreign banks
rather than their size is associated with competitive conditions in national banking
markets. One possible explanation is that domestic banks already change their
competitive behavior upon the entry of foreign banks before these banks have gained
their long-run market share. It may also reflect that a contestable and competitive
10 Berger and Hannan (1998) estimates that the efficiency costs related to market power as explained by the ‘quiet life’ hypothesis are substantial. 11 Throughout the paper excluding variables with insignificant coefficients from regressions does not change the results in any significant way. Insignificant coefficients are reported to facilitate comparisons across different specifications.

18
banking system depends more on the number of banks, rather than their asset shares.
Even in the long run, the number of foreign competitors may be related to, say, domestic
banking profits, even if their lending market share (as proxied by relative asset size) does
not.13
4. Conclusion
Banking markets are becoming increasingly international on account of financial
liberalization and overall economic and financial integration. This paper presents
evidence on the scale of foreign participation in national banking markets in 80 countries.
Also, it provides some evidence on how foreign banks’ financial conditions differ from
those of domestic banks. These differences can reflect a different customer base, different
bank procedures as well as different relevant regulatory and tax regimes. A main finding
is that foreign banks tend to have higher interest margins, profitability, and tax payments
than domestic banks in developing countries, while the opposite is true in developed
countries.
12 This is consistent with the findings of Demirgüç-Kunt and Huizinga (1999) that some portion of overhead costs is passed on to bank depositors and other lenders. Nevertheless, since the cost are not passed on completely, bank profits do suffer from higher overhead. 13 This can be illustrated by a simple Cournot model of competition between n domestic banks and n* foreign banks. Let domestic and foreign banks offer a homogeneous product (‘loans’). Marginal cost of production is constant at c and c* for domestic and foreign banks, respectively. Demand is negatively related to price, as a – bp, while total supply is nq + n*q*, with the q’s being loan supply of a domestic and a foreign bank. By number, the relative foreign bank share is n*/n. By asset size, relative foreign bank share is s* = (n*q*)/(nq). In the Cournot-Nash equilibrium, we find that, s* = 1 + [ (n* - n)(a – bc) + bn*(c – c*)(2n + 1) ]/ N with N = n [ a – b(n* + 1)c + bn*c* ]. Let fixed costs of entry be such that one or more foreign banks can enter, i.e. n* increases. To assess the impact on s*, we can differentiate this variable w.r.t. n* (not ignoring the integer constraint on n*). Unreported calculations show that ds*/dn* has the same sign as a – bc + b(c – c*)[ (2n + 1)(a – bc) – n ] which is ambiguous. Hence, it is possible to change the ratio n*/n (and profits of domestic banks), while not changing s*. Therefore, the foreign number share
19
In the literature on foreign banking, it is frequently asserted that foreign bank
entry can render national banking markets more competitive, and thereby can force
domestic banks to start operating more efficiently. This paper provides empirical
evidence that for most countries a larger foreign ownership share of banks is associated
with a reduction in the profitability and margins of domestically owned banks.
Overall, these results are consistent with a hypothesis that in the long run foreign
bank entry may improve the functioning of national banking markets, with positive
welfare implications for banking customers.
Another interesting finding of the paper is that the number of entrants matters
rather than their market share. This indicates that the impact of foreign bank entry on
local bank competition is felt immediately upon entry rather than after they have gained
substantial market share.
The relaxation of restrictions on foreign bank entry can have risks, however. In
particular, by increasing competition and thereby lowering the profits of domestic banks,
foreign entry may reduce charter values of domestic banks, making them more
vulnerable. This may have a destabilizing effect on the financial system especially if the
domestic prudential regulations and supervision are not strong. To reap the benefits of
foreign bank entry and minimize its potential costs, policymakers need to pay attention to
the timing of the liberalization process and ensure adequate regulation and supervision.
may be correlated with profits, even if the foreign asset share is not. It is then possible that a change in n* affects the profits of each domestic bank without affecting the relative market share of foreign banks.

20
References Aliber, Robert Z., 1984, International banking, a survey, Journal of Money, Credit and Banking 16, 661-712. Barth, James R., Daniel E. Nolle, and Tara N. Rice, 1997, Commercial banking structure, regulation, and performance, an international comparison, Comptroller of the Currency Economics Working Paper 97-6. Bartholdy, Jan, Glenn W. Boyle, and Roger D. Stover, undated, Deposit insurance, bank regulation and interest rates: some international evidence, mimeo, University of Otago, New Zealand.
Berger, Allen N. and Timothy H. Hannan, 1998, The efficiency cost of market power in the banking industry; a test of the “quiet life” and related hypotheses, forthcoming, in Review of Economics and Statistics 80. Bhattacharaya, Joydeep, 1993, The role of foreign banks in developing countries: A survey of evidence. Cornell University, mimeo. Cho, Yoon-Je, and Deena Khatkhate, 1989, Lessons of financial liberalization in Asia, a comparative study, World Bank Discussion Paper 50, World Bank. Demirgüç-Kunt, Aslι and Harry Huizinga, 1999, Determinants of commercial bank
interest margins and profitability: some international evidence, World Bank Economic Review, Vol. 13. No 2, 379-408.
DeYoung, Robert and Daniel E. Nolle, 1996, Foreign-owned banks in the United States:
earning market share or buying it, Journal of Money, Credit and Banking 28, 622-636.
Frankel, Allen B., and John D. Montgomery, 1991, Financial structure: an international perspective, Brookings Papers on Economic Activity 1, 257-310. Gelb, Alan, and Silvia Sagari, 1990, Banking, in P. Messerlin and K. Sanvant, eds., The Uruguay Round: Services in the World Economy. Washington, D.C.: The World Bank and UN Centre on Transnational Corporations. Germidis, Dimitri, and Charles-Albert Michalet, 1984, International banks and financial markets in developing countries, Development Centre OECD, Paris. Goldberg, Lawrence G., and Anthony Saunders, 1981, The determinants of foreign banking activity in the United States, Journal of Banking and Finance 5, 17-32.

21
Gorton, Gary, and Richard Rosen, 1995, Corporate control, portfolio choice, and the decline of banking, Journal of Banking 50, 1377-1420. Hanson, James A., and Roberto de Rezende Rocha, 1986, High interest rates, spreads, and the cost of intermediation, two studies, Industry and Finance Series 18, World Bank. Levine, Ross, 1996, Foreign banks, financial development, and economic growth, in Claude E. Barfield, ed., International Financial Markets. Washington, D.C., AEI Press. McFadden, Catherine, 1994, Foreign banks in Australia, The World Bank, mimeo. Pigott, Charles A., 1986, Financial reform and the role of foreign banks in Pacific Basin
in H. Cheng (Ed.), Financial Policy and Reform in Pacific-Basin Countries, Lexington Books, Lexington.
Schranz, Mary S., 1993, Takeovers improve firm performance: evidence from the banking industry, Journal of Political Economy 101, 299-326. Stiglitz, Joseph E., 1993, The Role of the State in Financial Markets, Proceedings of the
World Bank Annual Conference on Development Economics, 19-52. Stiglitz, Joseph E., and Marilou Uy, 1996, Financial markets, public policy, and the East Asian miracle, The World Bank Economic Observer 11, 249-276. Terrell, Henry S., 1986, The role of foreign banks in domestic banking markets, in H. Cheng, ed., Financial Policy and Reform in Pacific-Rim Countries, Lexington: Lexington Books. Vittas, Dimitri, 1991, Measuring commercial bank efficiency, use and misuse of bank operating ratios, Policy Research Working Paper 806, World Bank. Walter, Ingo, and H. Peter Gray, 1983, Protectionism, and international banking, Sectoral efficiency, competitive structure and national policy, Journal of Banking and Finance 7, 597-609. White, Halbert, 1980, A heteroskedasticity-consistent covariance matrix estimator and a
direct test for heteroskedasticty, Econometrica 48, 817-838. World Development Report, 1996, World Bank.
22
Table 1. Share of Foreign Banks in Domestic Banking Systems: 1988-1995 A foreign bank is defined to have at least 50 percent foreign ownership. Figures reported are ratios of number of foreign banks to total number of banks and foreign bank assets to total bank assets in each country, respectively, averaged over the 1988-1995 period. Total number of banks is for 1995. No. of
foreign banks in total
Foreign bank assets
in total
Total number of banks
No. of foreign banks
in total
Foreign bank assets
in total
Total number of banks
Argentina 0.37 0.10 9 Lithuania 0.10 0.09 7 Australia 0.37 0.05 26 Luxembourg 0.89 0.80 107 Austria 0.29 0.31 10 Malaysia 0.09 0.06 47 Bahrain 0.81 0.97 7 Malta 0.00 0.00 7 Belgium 0.29 0.05 47 Mexico 0.04 0.02 19 Bolivia 0.29 0.36 10 Morocco 0.33 0.21 8 Botswana 0.75 0.94 4 Nepal 1.00 1.00 3 Brazil 0.37 0.30 41 Netherlands 0.48 0.10 20 Canada 0.64 0.07 69 New Zealand 0.85 0.91 8 Chile 0.32 0.25 20 Nicaragua 0.17 0.20 12 China 0.13 0.00 5 Nigeria 0.30 0.51 9 Colombia 0.23 0.05 28 Norway 0.12 0.01 19 Costa Rica 0.24 0.05 22 Oman 0.00 0.00 6 Cyprus 0.25 0.11 7 Pakistan 0.30 0.12 15 Czech Rep. 0.54 0.51 15 Panama 0.35 0.39 8 Denmark 0.02 0.00 56 P. New Guinea 0.50 0.34 5 Dom. Rep. 0.08 0.03 12 Paraguay 0.43 0.39 20 Ecuador 0.46 0.52 5 Peru 0.43 0.35 22 Egypt 0.10 0.01 9 Philippines 0.46 0.57 17 El Salvador 0.20 0.28 4 Poland 0.30 0.14 28 Estonia 0.43 0.35 7 Portugal 0.18 0.04 34 Finland 0.00 0.00 11 Qatar 0.00 0.00 3 France 0.24 0.08 95 Romania 0.17 0.01 7 Germany 0.37 0.25 80 Russia 0.08 0.06 14 Greece 0.58 0.77 16 S. Africa 0.22 0.02 14 Guatemala 0.00 0.00 24 Saudi Arabia 0.34 0.43 4 Haiti 0.00 0.00 3 Singapore 0.29 0.62 19 Honduras 0.29 0.23 3 Spain 0.36 0.31 38 Hong Kong 0.60 0.69 28 Sri Lanka 0.14 0.08 7 Hungary 0.61 0.61 19 Swaziland 1.00 1.00 3 India 0.00 0.00 5 Sweden 0.07 0.00 18 Indonesia 0.35 0.16 18 Taiwan 0.14 0.09 24 Ireland 0.42 0.11 12 Thailand 0.08 0.02 12 Israel 0.09 0.02 22 Tunisia 0.39 0.35 7 Italy 0.09 0.01 64 Turkey 0.13 0.01 29 Jamaica 0.50 0.48 10 U.K. 0.24 0.19 70 Japan 0.09 0.21 73 U.S. 0.04 0.03 370 Jordan 0.43 0.95 7 Venezuela 0.07 0.02 17 Korea 0.23 0.23 40 Yemen 0.00 0.00 3 Lebanon 0.49 0.57 5 Zambia 0.71 0.46 3 Average for 80 Countries 0.31 0.26 25

23
Table 2. Share of Foreign Banks in Domestic Banking Systems: Aggregates by Income Group and Regions A foreign bank is defined to have at least 50 percent foreign ownership. Figures reported are number of foreign banks to total number of banks and foreign bank assets to total bank assets in each income group or region averaged over the 1988-1995 period. Income and region classifications follow World Bank definitions as published in the World Development Report (1996). No of foreign banks in total Foreign bank assets in total Mean Std. Dev.
Mean Std. Dev. N
Income Groups Low income 0.26 0.31 0.21 0.30 12 Lower middle income 0.33 0.22 0.31 0.29 28 Upper middle income 0.32 0.25 0.31 0.31 14 High income 0.28 0.24 0.19 0.26 26 Regions Africa 0.59 0.33 0.58 0.40 5 Asia 0.31 0.27 0.28 0.31 14 Latin America 0.25 0.16 0.21 0.17 19 Middle East and North Africa 0.27 0.26 0.31 0.37 11 Transitional Economies 0.31 0.21 0.25 0.23 7 Industrial Economies 0.29 0.25 0.18 0.26 24
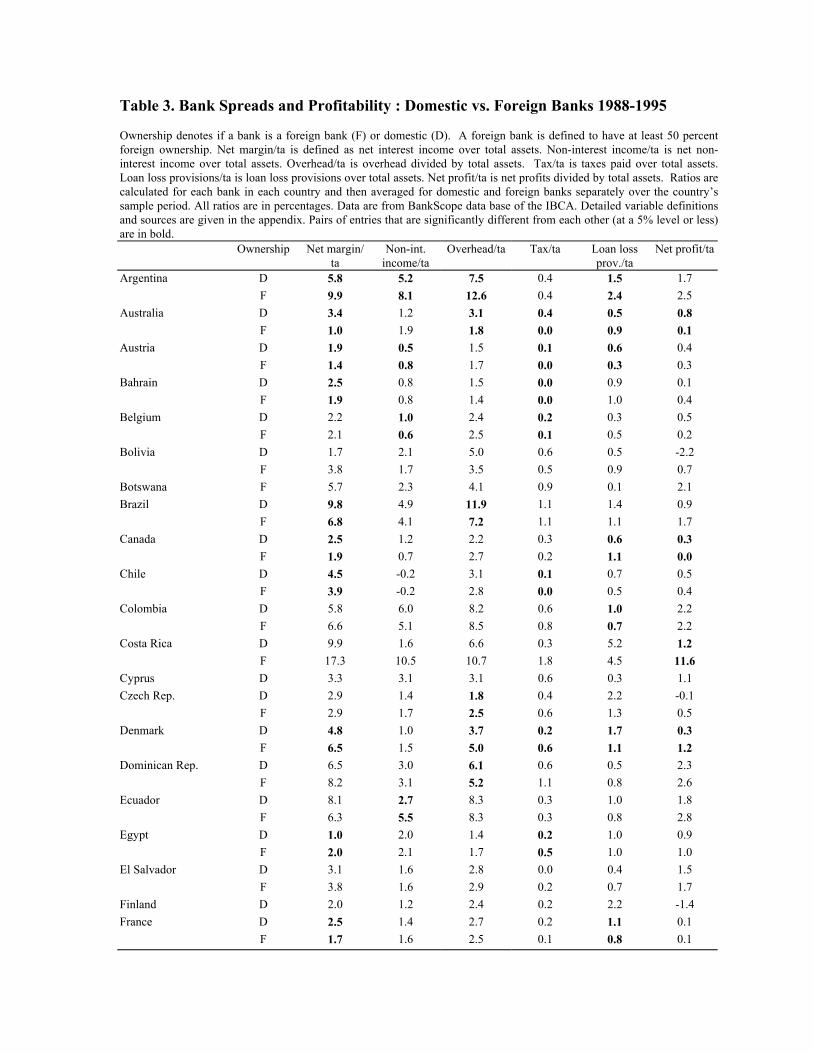
Table 3. Bank Spreads and Profitability : Domestic vs. Foreign Banks 1988-1995 Ownership denotes if a bank is a foreign bank (F) or domestic (D). A foreign bank is defined to have at least 50 percent foreign ownership. Net margin/ta is defined as net interest income over total assets. Non-interest income/ta is net non-interest income over total assets. Overhead/ta is overhead divided by total assets. Tax/ta is taxes paid over total assets. Loan loss provisions/ta is loan loss provisions over total assets. Net profit/ta is net profits divided by total assets. Ratios are calculated for each bank in each country and then averaged for domestic and foreign banks separately over the country’s sample period. All ratios are in percentages. Data are from BankScope data base of the IBCA. Detailed variable definitions and sources are given in the appendix. Pairs of entries that are significantly different from each other (at a 5% level or less) are in bold. Ownership Net margin/
ta Non-int.
income/ta Overhead/ta Tax/ta Loan loss
prov./ta Net profit/ta
Argentina D 5.8 5.2 7.5 0.4 1.5 1.7 F 9.9 8.1 12.6 0.4 2.4 2.5 Australia D 3.4 1.2 3.1 0.4 0.5 0.8 F 1.0 1.9 1.8 0.0 0.9 0.1 Austria D 1.9 0.5 1.5 0.1 0.6 0.4 F 1.4 0.8 1.7 0.0 0.3 0.3 Bahrain D 2.5 0.8 1.5 0.0 0.9 0.1 F 1.9 0.8 1.4 0.0 1.0 0.4 Belgium D 2.2 1.0 2.4 0.2 0.3 0.5 F 2.1 0.6 2.5 0.1 0.5 0.2 Bolivia D 1.7 2.1 5.0 0.6 0.5 -2.2 F 3.8 1.7 3.5 0.5 0.9 0.7 Botswana F 5.7 2.3 4.1 0.9 0.1 2.1 Brazil D 9.8 4.9 11.9 1.1 1.4 0.9 F 6.8 4.1 7.2 1.1 1.1 1.7 Canada D 2.5 1.2 2.2 0.3 0.6 0.3 F 1.9 0.7 2.7 0.2 1.1 0.0 Chile D 4.5 -0.2 3.1 0.1 0.7 0.5 F 3.9 -0.2 2.8 0.0 0.5 0.4 Colombia D 5.8 6.0 8.2 0.6 1.0 2.2 F 6.6 5.1 8.5 0.8 0.7 2.2 Costa Rica D 9.9 1.6 6.6 0.3 5.2 1.2 F 17.3 10.5 10.7 1.8 4.5 11.6 Cyprus D 3.3 3.1 3.1 0.6 0.3 1.1 Czech Rep. D 2.9 1.4 1.8 0.4 2.2 -0.1 F 2.9 1.7 2.5 0.6 1.3 0.5 Denmark D 4.8 1.0 3.7 0.2 1.7 0.3 F 6.5 1.5 5.0 0.6 1.1 1.2 Dominican Rep. D 6.5 3.0 6.1 0.6 0.5 2.3 F 8.2 3.1 5.2 1.1 0.8 2.6 Ecuador D 8.1 2.7 8.3 0.3 1.0 1.8 F 6.3 5.5 8.3 0.3 0.8 2.8 Egypt D 1.0 2.0 1.4 0.2 1.0 0.9 F 2.0 2.1 1.7 0.5 1.0 1.0 El Salvador D 3.1 1.6 2.8 0.0 0.4 1.5 F 3.8 1.6 2.9 0.2 0.7 1.7 Finland D 2.0 1.2 2.4 0.2 2.2 -1.4 France D 2.5 1.4 2.7 0.2 1.1 0.1 F 1.7 1.6 2.5 0.1 0.8 0.1

25
Table 3. Continued
Ownership Net margin/ ta
Non-int. income/ta
Overhead/ta Tax/ta Loan loss prov./ta
Net profit/ta
Germany D 2.2 1.2 2.1 0.3 0.6 0.3 F 1.9 1.1 2.0 0.3 0.7 0.3 Greece D 3.7 2.0 3.9 0.3 0.4 0.9 F 2.7 2.4 3.0 0.4 0.6 1.0 Haiti D 2.7 2.8 3.6 0.4 0.4 1.0 Hong Kong D 2.7 1.3 1.6 0.3 0.1 2.0 F 2.5 1.3 1.6 0.3 0.2 1.9 Hungary D 5.4 8.6 9.2 0.7 2.0 1.5 F 4.4 4.0 3.5 0.6 2.0 2.5 India D 1.9 1.6 1.0 0.2 0.3 1.1 Indonesia D 3.3 1.1 2.7 0.4 0.7 0.9 F 4.0 1.4 3.4 0.4 0.7 1.0 Ireland D 3.3 0.9 2.5 0.3 0.5 0.9 Israel D 3.3 1.9 3.7 0.6 0.7 0.3 F 2.9 1.5 3.3 0.7 0.6 0.6 Italy D 3.4 1.3 3.3 0.5 0.5 0.4 F 3.5 1.8 3.6 0.6 0.5 0.6 Jamaica F 8.8 2.8 6.6 1.4 0.6 3.0 Japan D 1.6 0.2 1.3 0.2 0.1 0.2 F 1.4 0.3 1.1 0.2 0.2 0.2 Jordan D 2.3 1.6 2.7 0.3 0.7 0.6 F 1.9 1.2 1.9 0.2 0.3 0.8 Korea D 2.1 1.5 2.4 0.3 0.5 0.6 F 1.9 1.4 2.3 0.2 0.5 0.4 Lebanon D 3.4 0.9 2.2 0.3 0.7 1.1 F 2.6 1.1 2.0 0.2 0.5 0.9 Lithuania D 10.0 4.5 7.6 1.6 5.6 0.4 F 6.4 7.2 7.2 1.7 8.0 -3.3 Luxembourg D 0.9 1.2 1.0 0.2 0.5 0.3 F 0.8 0.9 1.0 0.2 0.3 0.4 Malaysia D 2.7 0.8 1.9 0.4 0.4 0.8 F 2.4 0.9 1.3 0.6 0.3 1.1 Malta D 2.4 1.1 2.1 0.4 0.1 0.9 Mexico D 4.6 2.1 4.5 0.3 1.2 1.0 F 3.1 1.3 4.2 0.1 1.1 -0.9 Morocco D 3.5 1.3 3.5 0.6 0.0 0.9 F 3.3 1.1 3.7 0.3 0.0 0.4 Nepal D 3.6 2.1 2.4 1.0 0.5 1.8 Netherlands D 1.8 1.5 2.3 0.2 0.3 0.5 F 1.0 0.5 0.9 0.1 0.3 0.2 Nicaragua D 4.5 3.0 6.8 0.2 1.0 -0.5 F 4.8 3.1 6.4 0.3 0.6 0.7 Nigeria D 5.5 6.1 8.1 0.8 2.1 2.0 F 4.4 4.9 5.7 0.5 1.7 1.4 Norway D 3.2 1.1 2.7 0.1 1.2 0.3
F 2.5 2.3 2.0 0.4 0.6 1.7

26
Table 3. Continued
Ownership Net margin/ Ta
Non-int. income/ta
Overhead/ta Tax/ta Loan loss prov./ta
Net profit/ta
Oman D 4.2 1.4 3.3 0.2 0.5 1.5 Panama D 2.2 1.5 2.1 0.1 0.4 1.2 F 2.4 0.6 1.2 0.0 1.0 0.6 Papua New Guinea D 4.5 3.5 5.4 0.1 1.8 0.2 F 2.7 5.1 4.5 0.5 0.6 1.6 Paraguay D 6.4 2.2 5.7 0.5 0.8 2.0 F 7.2 2.5 7.3 0.4 1.3 1.7 Peru D 6.6 5.8 9.6 0.7 1.8 0.8 F 6.4 5.6 9.5 0.7 1.6 0.9 Philippines D 3.8 2.9 3.9 0.3 0.3 2.0 F 4.1 3.1 4.4 0.3 0.4 2.1 Poland D 4.9 2.1 3.3 1.6 1.5 2.2 F 6.6 3.0 4.3 1.8 1.1 2.6 Portugal D 3.4 1.0 2.5 0.2 1.1 0.6 F 3.4 1.3 2.3 0.6 0.4 1.4 Qatar D 1.9 1.1 1.8 0.0 0.4 1.1 Romania F 9.1 1.9 2.7 2.2 3.5 5.0 Russia D 6.6 9.3 7.6 2.2 2.8 3.7 Singapore F 1.7 0.9 1.2 0.4 0.1 1.1 South Africa D 4.4 2.4 3.8 0.4 0.7 1.2 F 3.2 0.9 3.1 0.3 1.1 0.4 Spain D 4.0 1.1 3.1 0.5 0.6 0.9 F 2.9 1.4 3.2 0.2 0.6 0.3 Sri Lanka D 4.1 2.2 2.7 0.7 0.4 2.5 Swaziland F 5.5 2.7 6.0 0.4 0.8 1.1 Sweden D 2.9 1.5 2.4 0.1 1.8 0.2 F 1.9 0.9 1.2 0.0 0.6 1.0 Taiwan D 2.1 1.1 1.6 0.2 0.3 1.0 F 2.1 0.8 1.5 0.2 0.3 0.9 Tunisia D 2.3 1.9 2.9 0.2 1.1 0.7 Turkey D 7.5 4.0 6.3 1.1 0.8 3.8 F 8.0 3.7 7.1 1.0 0.8 3.8 U.K. D 2.6 2.5 3.0 0.4 0.7 0.8 F 1.8 1.4 1.8 0.3 1.4 0.0 U.S. D 3.9 1.8 3.6 0.5 0.7 1.0 F 3.3 1.2 3.0 0.3 0.7 0.5 Venezuela D 6.7 2.7 6.3 0.2 1.1 1.9 F 13.7 3.9 7.2 0.4 0.4 9.7 Yemen D 2.8 -0.5 1.6 0.6 0.3 0.9 Zambia D -4.7 9.5 0.4 0.3 2.4 1.7 Country averages for China, Estonia, Guatemala, Honduras, New Zealand, Pakistan, Saudi Arabia and Thailand are not reported due to incomplete income statements.

27
Table 4. Bank Spreads and Profitability - Domestic vs. Foreign Banks Selected Aggregates 1988-1995. Net margin/ta is defined as net interest income over total assets. A foreign bank is defined to have more than 50 percent foreign ownership. Non-interest income/ta is net non-interest income over total assets. Overhead/ta is overhead divided by total assets. Tax/ta is taxes paid over total assets. Loan loss provisions/ta is loan loss provisions over total assets. Net profit/ta is net profits divided by total assets. Ratios are calculated for each bank in each country and then averaged for domestic and foreign banks separately over the country’s sample period. All ratios are in percentages. Data are from Bankscope data base of the IBCA. Detailed variable definitions and sources are given in the appendix. Pairs of entries that are significantly different from each other (at 5% level or less) are in bold. Includes only countries that have both domestic and foreign banks.
Net margin/ta Non-int. income/ta
Overhead/technical
assistance
Tax/ta Loan loss prov./ta
Net profit/ta
Income Groups Low income domestic 2.72 2.64 3.69 0.38 1.15 1.05foreign 3.71 3.01 4.39 0.54 1.20 1.21Lower middle income domestic 5.93 3.30 5.73 0.65 1.30 1.89foreign 6.09 3.90 5.84 0.67 1.07 2.44Upper middle income domestic 4.23 2.10 4.31 0.41 0.87 0.83foreign 3.78 2.35 3.60 0.44 1.11 1.12High income domestic 3.22 1.44 2.97 0.37 0.72 0.65foreign 1.70 1.12 1.97 0.24 0.62 0.35 Regions Africa domestic 4.88 3.82 5.38 0.55 1.24 1.49foreign 3.78 1.94 4.36 0.41 1.44 0.89Asia domestic 2.68 1.19 2.34 0.33 0.41 1.02foreign 2.98 1.70 2.74 0.32 0.40 1.42Latin America domestic 6.20 3.12 6.61 0.43 1.34 1.20foreign 6.93 3.93 7.01 0.62 1.29 2.26Middle East and North Africa domestic 2.43 1.72 2.69 0.39 0.83 0.63foreign 2.18 1.05 1.93 0.21 0.96 0.58Transitional economies domestic 5.23 4.40 5.06 1.13 2.30 1.34foreign 4.48 3.30 3.43 0.89 1.68 1.87Industrial economies domestic 3.38 1.49 3.10 0.39 0.73 0.73foreign 1.78 1.19 2.07 0.25 0.64 0.36

28
Table 5. Change in Foreign Bank Presence and Change in Domestic Bank Performance Regressions are estimated using weighted least squares pooling bank level data across 80 countries for the 1988-95 time period. Only domestic bank observations were used. Number of banks in each period is used to weight the observations. Regressions also include country and time dummy variables that are not reported. In column (1) the dependent variable is the one period change in net margin/ta defined as interest income minus interest expense over total assets. In column (2) it is the one period change in net non-interest income/ta. In column (3) it is the change in before tax profits over total assets (before tax profits/ta). In column (4) one period change in overhead/ta is the dependent variable defined as personnel expenses and other non-interest expenses over total assets. In column (5) the dependent variable is the change in loan loss provisions divided by total assets. Foreign bank share is the ratio of number of foreign banks to total number of banks. All independent variables are in first differences. Detailed variable definitions and data sources are given in the appendix. Heteroskedasticity-corrected standard errors are given in parentheses. (1)
DNet margin/ta (2)
DNon-int. income/ta
(3) DBefore tax
profits/ta
(4) DOverhead/ta
(5) DLoan loss
prov./ta
DForeign bank share -.001
(.012) -.023* (.013)
-.028** (.014)
-.015* (.009)
-.009 (.012)
DEquity/ta .017
(.033) .040
(.085) -.002 (.138)
.060 (.040)
.085 (.110)
DNon-int. assets/ta -.000 (.016)
.032 (.027)
-.014 (.048)
.061*** (.018)
.071 (.056)
DCust& short term funding/ta
-.008 (.015)
.044 (.033)
.026*** (.028)
-.023* (.014)
-.005 (.014)
DOverhead/ta .408*** (.147)
.411*** (.125)
-.597** (.279)
.482* (.265)
DGdp/cap -.002* (.001)
-.001 (.001)
.001 (.002)
-.002** (.001)
-.003*** (.001)
DGrowth .018*** (.007)
-.024** (.010)
.006 (.008)
.016*** (.005)
-.006 (.008)
DInflation .019*** (.007)
-.009 (.006)
.013** (.007)
.016*** (.005)
-.002 (.006)
DReal interest .025*** (.008)
-.013** (.006)
.016* (.009)
.015*** (.005)
-.004 (.009)
Adj. R2 .19 .12 .15 .12 .22 N. of obs. 4592 3904 4592 4592 3993 *, ** and *** indicate significance levels of 10, 5 and 1 percent respectively.

29
Appendix Variable Definitions and Sources
Net margin/ta - interest income minus interest expense over total assets. Before tax profits/ta - before tax profits over total assets. Equity/ta - book value of equity (assets minus liabilities) over total assets Non-interest earning assets/ta - cash, non-interest earning deposits at other banks, and other non-interest earning assets over total assets Customer & short term funding/ta - all short term and long term deposits plus other non-deposit short term funding over total assets Overhead/ta - personnel expenses and other non-interest expenses over total assets Foreign bank share - Foreign bank share is the number of foreign banks to total number of banks. A bank is defined to be a foreign bank if it has at least 50 percent foreign ownership. All individual bank level variables are obtained from BankScope data base of IBCA. Gdp/cap - real GDP per capita in thousands of US$. Growth - annual growth rate in real GDP. Inflation - the annual inflation of the GDP deflator. Real interest - the nominal interest rate minus rate of inflation. Where available, nominal rate is the rate on short term government securities. Otherwise, a rate changed by the Central Bank to domestic banks such as the discount rate is used. If that is not available, then the commercial bank deposit interest rate is used. Openness – exports plus imports divided by Gdp. Interest rate data are from the IMF, International Financial Statistics. Other macro data are from World Bank National Accounts.