Embed Size (px)
Citation preview

How Does Health Insurance Affect Workers’ Compensation Filing? DARIUS N. LAKDAWALLA, ROBERT T. REVILLE, AND SETH A. SEABURY
WR-205-1-ICJ
April 2005
WORK ING P A P E R
This product is part of the RAND Institute for Civil Justice working paper series. RAND working papers are intended to share researchers’ latest findings and to solicit informal peer review. They have been approved for circulation by the RAND Institute for Civil Justice but have not been formally edited or peer reviewed. Unless otherwise indicated, working papers can be quoted and cited without permission of the author, provided the source is clearly referred to as a working paper. RAND’s publications do not necessarily reflect the opinions of its research clients and sponsors.
is a registered trademark.

1
How Does Health Insurance Affect Workers’ Compensation Filing?*
Darius N. Lakdawalla, Robert T. Reville and Seth A. Seabury
RAND Corporation
Abstract Workers’ compensation provides insurance against job-related injuries, but as many as half of
injured workers choose not to file. A common explanation for this is the existence of private
health insurance, an alternative source of health care that may discourage insured workers from
taking the time to file a workers’ compensation claim. However, data from the NLSY paint a
surprising picture: uninsured and more vulnerable workers are actually less likely to file claims
than the insured. We study this relationship and find that it emerges as the result of employer
characteristics. In particular, whether or not employers offer health insurance to employees
appears most important, much more important even than the insurance status of workers
themselves. Indeed, even repeat injury-sufferers are more likely to file during episodes in which
their employer offers health insurance, but not statistically more likely to file during episodes in
which they themselves are insured. This suggests that the workplace environment and employer
incentives may have a significant, or perhaps even the dominant, impact on workers’
compensation filing.
* Direct correspondence to Seth Seabury; e-mail: [email protected]. For their helpful comments and suggestions, we are grateful to Les Boden, Karen Roberts, and participants in the 2003 NOIRS meeting in Pittsburgh, PA. Lakdawalla and Reville are also grateful to the National Institutes of Occupational Safety and Health (NIOSH) for research support (grant number 1R03OH07619).
2
A. Introduction
Workers’ compensation serves as a near universal health insurance system for workers
who become sick or injured because of their job. Almost every private sector worker in the U.S.
is covered by workers’ compensation, which typically provides full reimbursement for medical
expenditures and partial reimbursement for wage losses incurred as a result of a workplace injury
or illness.1 Given that employer-provided health insurance usually involves cost sharing for
medical expenditures and offers no income replacement, one would expect workers to seek
compensation for nearly all workplace health conditions.
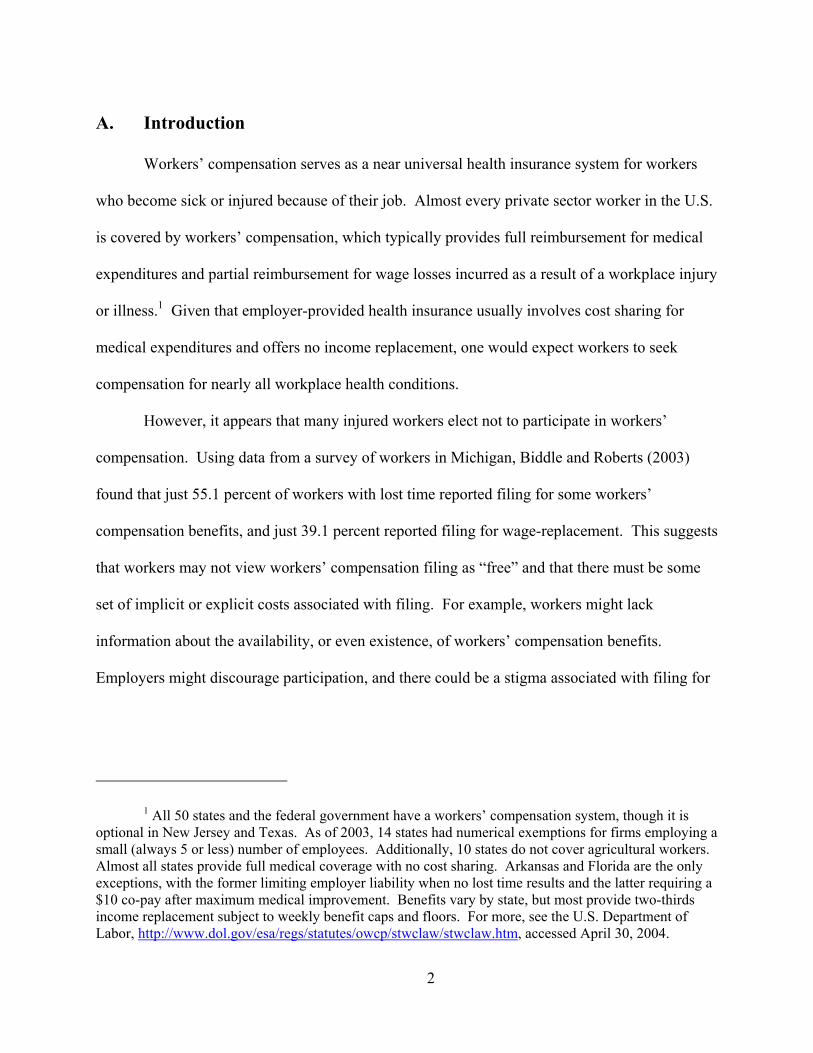
However, it appears that many injured workers elect not to participate in workers’
compensation. Using data from a survey of workers in Michigan, Biddle and Roberts (2003)
found that just 55.1 percent of workers with lost time reported filing for some workers’
compensation benefits, and just 39.1 percent reported filing for wage-replacement. This suggests
that workers may not view workers’ compensation filing as “free” and that there must be some
set of implicit or explicit costs associated with filing. For example, workers might lack
information about the availability, or even existence, of workers’ compensation benefits.
Employers might discourage participation, and there could be a stigma associated with filing for
1 All 50 states and the federal government have a workers’ compensation system, though it is optional in New Jersey and Texas. As of 2003, 14 states had numerical exemptions for firms employing a small (always 5 or less) number of employees. Additionally, 10 states do not cover agricultural workers. Almost all states provide full medical coverage with no cost sharing. Arkansas and Florida are the only exceptions, with the former limiting employer liability when no lost time results and the latter requiring a $10 co-pay after maximum medical improvement. Benefits vary by state, but most provide two-thirds income replacement subject to weekly benefit caps and floors. For more, see the U.S. Department of Labor, http://www.dol.gov/esa/regs/statutes/owcp/stwclaw/stwclaw.htm, accessed April 30, 2004.

3
benefits.2 Additionally, a worker might be uncertain about his or her ability to prove that an
injury or illness is work-related. As a result, pursuing a workers’ compensation claim could
require that a worker spend money on health care consultations up front, with uncertain
prospects for reimbursement. While any of these costs could lead a worker not to file a claim,
the magnitude of nonparticipation is surprising.
The existence of alternatives to workers’ compensation, specifically health insurance,
could exacerbate nonparticipation in the presence of filing costs. Workers with access to health
insurance may be unwilling to bear the filing costs associated with workers’ compensation
benefits, because their insurance reduces the burden of medical costs. Moreover, the absence of
health insurance could give rise to greater participation if uninsured workers try to fraudulently
pass off nonoccupational injuries or illnesses as work-related, in order to cover the cost of
treatment. The combination of these effects has given rise to the conventional wisdom in
economics that workers with health insurance are less likely to file workers’ compensation
claims in the event of injury. If the high level of nonparticipation on average appeared driven, at
least in part, by health insurance status, this would alleviate normative concerns that poor
participation imperils the health of injured workers.
However, a look at the data, reported in Table 1, calls the conventional wisdom into
question. The first two columns of the table demonstrate that injured workers without health
insurance are eight percentage points (about fifteen percent) less likely to file a claim than
injured workers with health coverage.3 This is in spite of the fact that uninsured workers are
2 Biddle and Roberts (2003) report that about 15-24 percent of non-filers claimed the fear of retribution as a reason for not filing.
3 In our data, about 55 percent of workers who suffer work-related injuries file a claim. This is consistent with the results of Biddle and Roberts (2003).

4
more likely to have lost wages and missed more days of work as a result of their injuries. This
result is puzzling, given the argument above that the uninsured should be more likely to file.
The last two columns of the table add nuance to this picture, showing that the gap in
filing widens substantially when we compare workers in firms that do and do not offer health
insurance to workers. Workers in insuring firms are twenty-one percentage points more likely to
file a claim, even though their injuries are still less severe in terms of lost wages and work-time
(though the disparity is smaller). It would appear that the effects of health insurance on workers’
compensation claiming are not as straightforward as they might appear, and may have more to do
with the characteristics of employers that offer health insurance than with the incentives faced by
workers. This table illustrates a result that we confirm in the paper; actual health insurance
coverage itself is much less important than whether an employer offers health insurance.
Using a full set of controls, we demonstrate that workers reporting a workplace injury are
more likely to file claims when they work for an employer who offers health insurance. This
result holds even when we incorporate individual fixed effects, suggesting that the characteristics
of the employer do not simply serve as proxies for unobserved worker characteristics. Rather,
workplaces offering health insurance may be offering more information and/or encouraging
injured workers to seek benefits. While we cannot determine whether the effect of health
insurance offers on employers are causal or selective in nature, we do show that worker
heterogeneity and incentives appear to be, at most, second-order relative to the effect of
employer heterogeneity or incentives. The health insurance offer may causally diminish
incentives for employers to fight workers’ compensation filing, perhaps because they pay for
injuries and illnesses regardless. Alternatively, employers who choose to offer health insurance

5
may have unobserved characteristics that also make them less likely to discourage workers’
compensation filing.
Our findings also support the idea that the ease of filing and the availability of support for
filing are crucial factors in an individual’s decision to file.4 We confirm the earlier finding that
union membership makes an individual worker more likely to file. We also show that workers
with conditions that are harder to document—specifically occupational illnesses—are less likely
to file. If workplace environment and employer heterogeneity are dominant factors in the
decision to file, this suggests the importance of targeting employers—rather than employees—in
efforts to raise the utilization of the workers’ compensation system.
B. Data and Methods
While we are interested in the general question of why workers do or do not file for
workers’ compensation in the event of an injury, the primary focus of our analysis is the role of
health insurance. On the surface, Table 1 suggests that, contrary to the conventional wisdom,
workers with health insurance are more likely to file for workers’ compensation. In our analysis,
we examine the extent to which health insurance matters for filing, and attempt to distinguish
between actually possessing health insurance and being offered health insurance.
There has been relatively little empirical study by economists on the link between health
insurance and a worker’s claiming behavior. Most past work has focused on the importance of
expected benefits and of information in the workers’ compensation filing decision. Numerous
studies all show a positive relationship between workers’ compensation benefit levels and the
4 There are a variety of possible mechanisms by which a firm can alter the ease of filing: supervisors can discourage workers from pursuing claims, can deny time off for obtaining medical or legal advice, or simply harass workers who appear willing to file claims (cf, Azaroff, Levenstein, and Wegman, 2002)

6
receipt of benefits (cf, Chelius, 1982; Ruser, 1985; Chelius and Kavanaugh, 1988; Krueger,
1990; Butler and Worrall, 1991; Butler, 1994; Ruser, 1995; Neuhauser and Raphael, 2004). In
principle, this could either come from a higher propensity to file a claim or from increased risk-
taking by workers, though the evidence suggests that an effect on claim filing is the predominant
cause of the relationship (Butler, 1994). Hirsch, Macpherson, and DuMond (1997) examine the
effect of union membership on the receipt of workers’ compensation benefits, and find that it is
positive. They interpret this result as suggesting that unionized workers are both better informed
and better-protected from employer retribution.
The other extant work has focused primarily on whether or not workers without health
insurance fraudulently pursue workers’ compensation benefits for nonoccupational injuries.
Smith (1989) documented what is commonly referred to as the “Monday effect,” the observation
that sprains and strains were more likely to occur on Mondays but more visible injuries with
clearer causation were no more likely to occur on Mondays than on other days of the week. This
evidence suggests that workers might suffer strains or sprains during the weekend but report
them on Mondays in order to receive workers’ compensation benefits. Card and McCall (1996)
raise some doubts about this issue, however, finding that workers who are more likely to have
health insurance are no less likely to file a Monday claim. A key limitation of their study,
however, is the absence of direct information on whether or not individual claimants actually
possess health insurance. Instead, they were forced to impute the likelihood that an individual
possessed health insurance based on observable characteristics.
Using the NLSY, we estimate the impact of health insurance on filing behavior more
directly. The NLSY is a rich, nationally representative data source with individual-level
information on demographics, health insurance status, unionization status, and detailed

7
information on whether a worker suffered a work-related health condition, whether she filed a
claim as a result, and whether she received compensation for that claim. Its true panel aspect is
also of value, because we can show how individuals behave when their health insurance
coverage changes.
B.1 Data
The NLSY is a longitudinal survey containing a representative sample of people who
were between the ages of 14 and 22 in 1979. This initial cohort is re-surveyed every year until
1994, after which point they are surveyed every other year. In addition to basic demographic
information, such as age, sex, race, and marital status, questions are asked about wages,
unionization status, and health insurance status. The NLSY also contains some information on
employers, including the size of the establishment, whether health insurance is offered, and
whether paid vacation or sick leave are offered.5 In addition, from 1988 onwards, there is a
substantial amount of data on workers’ compensation claims.
First, the NLSY collects data on whether the worker reports a workplace injury or illness.
They also collect data on whether a workers’ compensation claim was filed for any of those
injuries or illnesses, as well as data on whether the worker received a settlement. In addition,
they report the ICD-9 code for the illness or injury. We use this to classify a health condition as
an injury or an illness. This breakdown is made strictly according to the ICD-9 codes; if the code
is for an “illness” or “disease,” we classify the health condition as such. Otherwise, the condition
is called an injury. Finally, every year, the NLSY reports the total amount of workers’
compensation benefits received by each individual. Table 2 summarizes the workers’
5 Note that the NLSY reports establishment size, but we shall use firm size and establishment size interchangeably.
8
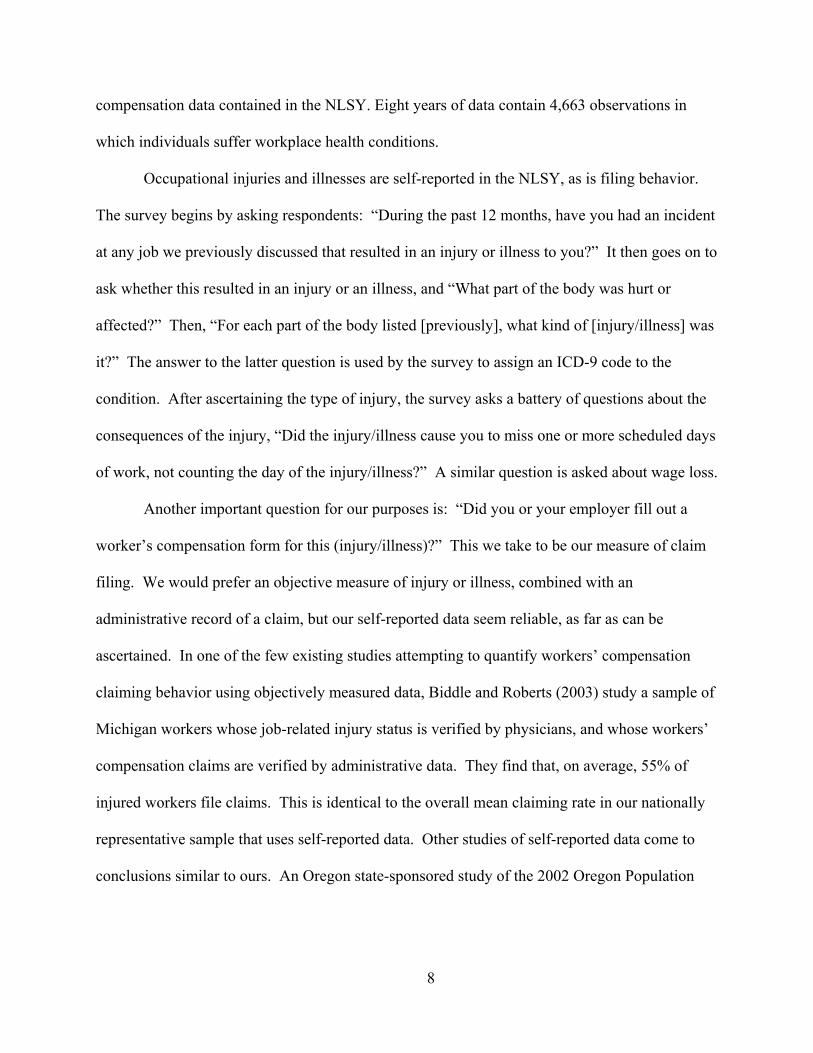
compensation data contained in the NLSY. Eight years of data contain 4,663 observations in
which individuals suffer workplace health conditions.
Occupational injuries and illnesses are self-reported in the NLSY, as is filing behavior.
The survey begins by asking respondents: “During the past 12 months, have you had an incident
at any job we previously discussed that resulted in an injury or illness to you?” It then goes on to
ask whether this resulted in an injury or an illness, and “What part of the body was hurt or
affected?” Then, “For each part of the body listed [previously], what kind of [injury/illness] was
it?” The answer to the latter question is used by the survey to assign an ICD-9 code to the
condition. After ascertaining the type of injury, the survey asks a battery of questions about the
consequences of the injury, “Did the injury/illness cause you to miss one or more scheduled days
of work, not counting the day of the injury/illness?” A similar question is asked about wage loss.
Another important question for our purposes is: “Did you or your employer fill out a
worker’s compensation form for this (injury/illness)?” This we take to be our measure of claim
filing. We would prefer an objective measure of injury or illness, combined with an
administrative record of a claim, but our self-reported data seem reliable, as far as can be
ascertained. In one of the few existing studies attempting to quantify workers’ compensation
claiming behavior using objectively measured data, Biddle and Roberts (2003) study a sample of
Michigan workers whose job-related injury status is verified by physicians, and whose workers’
compensation claims are verified by administrative data. They find that, on average, 55% of
injured workers file claims. This is identical to the overall mean claiming rate in our nationally
representative sample that uses self-reported data. Other studies of self-reported data come to
conclusions similar to ours. An Oregon state-sponsored study of the 2002 Oregon Population

9
Survey suggests that 54% of workers reporting a workplace injury in the past 12 months filed a
claim (Maier and Reinke, 2004).
Table 3 presents the characteristics of the NLSY sample, and Table 4 presents the
average population characteristics of the US cohort born between 1957 and 1964 (i.e., the NLSY
cohort). The sample averages are unweighted, while the cohort averages use the NLSY sampling
weights to construct averages that are representative of the NLSY cohort at large. In other
words, Table 3 presents the characteristics of the average sample member, while Table 4 presents
the characteristics of the average member of the cohort. Note that in both tables, a column to the
right of another one is a proper subset of the latter. We begin by presenting statistics for the
whole population, proceed to those who were employed in the last year, then to those who were
employed in the past year and injured in the past year, then to the injured people who filed, and
finally to the filers who received benefits.
The Tables demonstrate that injured workers—both in the sample and in the cohort—are
slightly less educated than the average worker; filing workers are less educated still than injured
ones; and those receiving compensation are the least educated of all. Similar patterns are evident
for earnings. The Tables support the results of Hirsch, Macpherson, and DuMond (1997),
showing that filing workers are more likely than non-filing workers to belong to unions. Injured
workers appear to work at somewhat smaller firms than average. The raw means also
demonstrate that, surprisingly, filing status is positively correlated with whether an employer
offers health insurance.
Table 5 displays the characteristics of the injured population (i.e., the third column of
data in Tables 3 and 4) broken down by employer health insurance offers and filing decisions.
There appear to be few demographic (age, sex, or race) differences between those working at

10
employers that do or do not offer health insurance, though workers at insuring firms are more
likely to be married, more likely to be employed in the past two weeks and slightly more
educated. Not surprisingly, being at an insuring firm is associated with significantly higher
earnings, a greater likelihood of having health insurance and being unionized. Interestingly,
there is relatively little difference between the two in whether or not any time was missed due to
injury, but workers at employers that do not offer health insurance remain out of work for a
substantially longer period of time and are more likely to have lost wages.
The table reveals complex relationships among health insurance, filing and employer
size. 6 Employers that offer health insurance to workers appear to be larger on average than
those that do not. However, within health insurance group, there are conflicting relationships
between filing tendencies and establishment size. Within the group of firms offering health
insurance, filing workers are at smaller establishments, but the opposite is true within firms not
offering health insurance. This suggests a nonlinear relationship between filing and firm size:
among larger firms, filing is negatively correlated with firm size, but the opposite is true among
smaller firms. We find some evidence of this later, although the relationship between firm size
and filing tends not to be robust.
We merged into the NLSY two measures of job-related strenuousness, to investigate
whether these affected rates of reported injuries or filing. These measures were job-related
exercise, and job-related strength requirements. The first measures the number of fitness-related
demands (e.g., crawling, reaching, stooping, and climbing), and the second measures the
6 The employer size as reported in the summary statistics reflects top coding at 10,000 to reduce the influence of a few instances where individuals report very large establishment size (over 100,000). Over 98 percent of observations report establishments less than 10,000. The top coding is not relevant for the regression analysis because the largest category we report is 3,000 or more employers.

11
strength-related demands (e.g., lifting) of a job. Both these variables are constructed by the
Department of Labor in the Dictionary of Occupational Titles. Each 3-digit level occupation is
rated on a scale of 1 to 4 for its job-related exercise, and on a scale of 1 to 5 for its strength
requirements.
In order to analyze the impact of workers compensation generosity, we include
information on the before-tax replacement rate of lost wages by state temporary disability (TD)
benefit levels. Workers’ compensation TD benefits are paid weekly and typically set equal to
two-thirds of weekly pre-injury wages subject to a maximum weekly benefit. The maximum
varies across states and over time; the US Chamber of Commerce’s annual Analysis of Workers’
Compensation Trends reports that in 1999 it was approximately $592.92 a week, or about
$29,646 annually. A higher benefit maximum is associated with a higher replacement rate for
workers earning wages over the benefit cap, whereas the variation in replacement rates is
minimal for workers under the cap.
B.2 Empirical Framework
An injured worker will file for workers’ compensation benefits if the expected benefits of
doing so are at least as great as the expected costs. While we do not directly observe the costs
and benefits of filing, which are functions of unobservable characteristics such as individual
utility functions, we do observe many variables that should be correlated with the expected
benefits, expected costs or both. Empirically, we model the workers’ compensation filing
decision of injured worker i in firm j at time t as:
itijjititititijtijt BXSHF εµλθαβββββ +++++++++= 43210 (1)

12
Fit is a binary variable indicating whether or not individual i filed at time t.7 In some
specifications, the variable H measures whether or not an individual has health insurance; in
others, it measures whether he/she is offered it by her employer. Distinguishing between these
two variables turns out to be interesting and important. Sit represents the severity of the
condition, which we model using the number of days the individual is absent from work. The
vector Xit contains demographic characteristics, such as age, sex, race, and education, as well as
other observable job characteristics such as the amount of physical stress involved, that might
affect the likelihood of filing a claim. The replacement rate offered by workers’ compensation
benefits is given by itB ; these vary for different individuals over time and across states. Year-
specific fixed-effects are represented by the term tα .
We expect that heterogeneity at the individual and employer level likely plays an
important role in the propensity to file for workers’ compensation. The term iθ represents
individual heterogeneity; individuals with higher values of iθ are more likely to file a claim than
others. The terms λj and µij represent firm-level heterogeneity and match-specific heterogeneity,
respectively. The firm-specific term would lead to increased filing if, say, firm j were less likely
to challenge claims by any of their workers. The match-specific term would lead to increased
filing if firm j were less likely to challenge claims filed by individual i but not (necessarily) any
other employee.
Because the NLSY is a true panel, it contains repeated observations on individuals. This
allows us to control directly for time-invariant individual heterogeneity. Unfortunately, since the
7 Equation 1 is specified as a linear probability model, although it could easily be written as a latent variable model estimable via a probit or logit specification. Throughout the paper, we will report results from linear probability models, as marginal effects from probit and logit models were quite similar in magnitude and statistical significance.

13
NLSY does not identify employers (and since the sample is too small, in any event, to share
many common employers), we are unable to identify employer-specific fixed-effects. Therefore,
our estimated coefficients may reflect either the causal effects of the regressors or the correlation
between the regressor and the employer-specific (or match-specific) fixed-effects.
In the NLSY, there are three health insurance variables that are of interest to us: whether
or not the employer offers health insurance, whether an individual has health insurance, and an
individual’s source(s) of health insurance. Clearly, whether or not the employer offers health
insurance is likely to be related to employer heterogeneity. There are seven potential sources of
health insurance: the current employer, a previous employer, the spouse’s current employer, the
spouse’s previous employer, the retail market, Medicaid or other public assistance, and any other
source. Of these, the one that should be most directly correlated with employer heterogeneity is
health insurance provided by the current employer; the others may, if anything, be correlated
with individual heterogeneity.8 Comparing the effect of employer-provided and other types of
health insurance provides some insight into the potential importance of employer heterogeneity,
although we are also unable to reject a causal effect of health insurance.
Identifying the coefficients in this model while controlling for individual heterogeneity
depends crucially on the properties of iθ . If iθ is uncorrelated with the other covariates, a
random effects model is the most efficient choice among consistent estimators. If it is correlated,
however, a fixed-effects model will yield consistent estimates, up to the employer fixed-effects.
8 Health insurance provided by the previous employer could be correlated, if individuals tend to move to similar employers or if the injured worker switched jobs after being injured and before the survey time, and listed the at-injury employer as the previous employer.

14
In our empirical work we report the results of both fixed-effects and random effects models, and
test for the correlation between iθ and other covariates using a Hausman specification test.
Finally, note that our results may be influenced by the way we define and measure
injuries. Our ultimate object of interest is ),|Pr( InjuryFiling the probability that an
injured worker files. To estimate this, we calculate the probability of filing for the NLSY
respondents who report an injury. If the set of people reporting an injury is a random sample of
the injured population, this strategy is straightforward. The results might not be generalizable,
however, if those likely to report an injury have different characteristics than the average injured
worker. Unfortunately, while we can bear this caveat in mind, this limitation cannot be
overcome without objective (i.e., not self-reported) injury data confirmed by a neutral third-
party.
C. Results
C.1 Determinants of Injuries
Table 6 provides a first look at the characteristics of the injured population by regressing,
for the entire NLSY population, a binary variable for whether the individual reported a
workplace injury to the NLSY, on a host of covariates. The columns of the table differ in the
complexity of their fixed-effects structure: the first column includes a year fixed-effect, the
second adds a 3-digit SIC industry fixed-effect, and the last adds an individual-specific fixed
effect. Regardless of the fixed-effect structure, we find that individuals in employers that offer
health insurance are more likely to self-report having suffered a work-related condition. The fact
that these results survive individual fixed-effects is particularly important: a given individual is
more likely to self-report an injury when he finds himself in an insuring employer.

15
Not surprisingly, more educated people are less likely to self-report an injury.9 People in
jobs that require more strength are more likely to self-report injuries, but interestingly, people in
jobs demanding more fitness are less likely to do so. This could be related to the finding that
people in fitness-demanding jobs maintain a healthier weight than others (Lakdawalla and
Philipson, 2002).
Confirming past studies, we find that workplace injuries are positively related to both the
individual replacement rate of lost earnings and union status. With just the year fixed-effects, a
10 percent increase in the replacement rate is associated with approximately a 3.6 percent
increase in the likelihood of suffering an injury, and this falls to 2.5 percent if the industry effects
are included. However, when we include individual fixed-effects the effect of replacement rates
becomes statistically insignificant. Workers in unions are about 2.5 to 4.6 percentage points more
likely to report an injury, and this effect is significant regardless of the fixed-effects structure.
Since the injury data are self-reported, it is not clear whether these workers experience
objective increases in injury rates, or whether they are simply more disposed toward perceiving a
condition as work-related or as a health limitation. Without objective data on health conditions,
it is impossible to disentangle these two interpretations. One thing that is clear, however, is that
individual heterogeneity in injury occurrence or reporting cannot explain the effect of health
insurance. Adding the individual fixed-effect actually increases the estimated effect of insurance
on the likelihood of reporting a workplace injury or illness. This suggests that the work
environment contributes to reporting (and/or injury) propensity, even conditioning on individual
proclivities.
9This does not survive individual fixed-effects, but this is probably because relatively few people switch educational attainment over the time-frame we are investigating in the NLSY (when the sample is between the ages of 23 and 35).

16
C.2 Filing Determinants
Table 7 presents our key results about the determinants of filing behavior conditional on
reporting an injury or illness. In the table, the sample is the set of respondents reporting a work-
related health condition within the last year, and reporting employment (i.e., nonzero
employment earnings) within the past year. For this sample, filing is regressed on health
insurance, a union status variable, whether the condition was an injury or illness, and a host of
other demographic characteristics listed in the table. The first four columns list the results
obtained when health insurance is measured as whether or not the individual’s current or last
employer offers health insurance to its employees. The second four columns use the individual’s
actual source of health insurance, broken down by various health insurance types.
The columns in Table 7 differ according to the way individual heterogeneity is measured;
they all incorporate different fixed-effects and random-effects structures. The first column
shows the results with a year fixed-effect. The second adds a three-digit SIC industry fixed-
effect. The third adds a state fixed-effect and an individual fixed-effect. The fourth is identical
to the third, except it considers the individual effect as a random effect rather than a fixed-effect.
As stated above, the random-effects model makes the identifying assumption that the
random individual heterogeneity effect is independent of the covariates. We tested this
assumption using a Hausman specification test. The Hausman test relies on the fact that the
individual fixed-effects model is always consistent, regardless of whether iθ is correlated with
covariates, but that the random-effects model is only consistent if the assumption holds. If the
hypothesis is false, the difference between the two estimates will be nonzero asymptotically.

17
The Hausman test fails to reject the null hypothesis that iθ is uncorrelated with the covariates.10
The p-value in the models using the employer-offered insurance variables is 0.7699 and for the
models using health insurance by source it is 0.4098, obviously much higher than the
conventional levels of significance.
C.2.1 The Effect of Health Insurance on Filing The first four columns show that the effect of employer’s offering health insurance is
remarkably stable. Injured workers in firms where health insurance is offered are about 15 to 18
percentage points more likely to file a claim. Repeat injury sufferers are more likely to file a
claim when they find themselves in a firm that offers health insurance, and this effect is of a
statistically similar magnitude to the other models. Since the individual fixed-effect model is
quite similar to the others, it suggests that the positive relationship between employer offers of
health insurance and filing cannot be explained simply as a spurious correlation with individual
heterogeneity.
In another regression (not shown here), we found that replacing the “employer offers
health insurance” variable with one that measures whether a respondent has health insurance
produces uniformly insignificant coefficients. It is difficult if not impossible to isolate a
significant effect of health insurance possession.
Motivated by this finding, we put the importance of employer offers to the test, in the
second four columns, by breaking down an individual’s health insurance status by source of
coverage. We code whether the individual has health insurance from an employer, a previous
10 The test statistic confirms that the random-effects model is more efficient than the fixed-effects modes; this is a condition for the validity of the test.
18
employer, a spouse’s employer, a spouse’s previous employer, the retail market, Medicaid or
welfare, or some other source. The excluded group is the set of uninsured respondents.
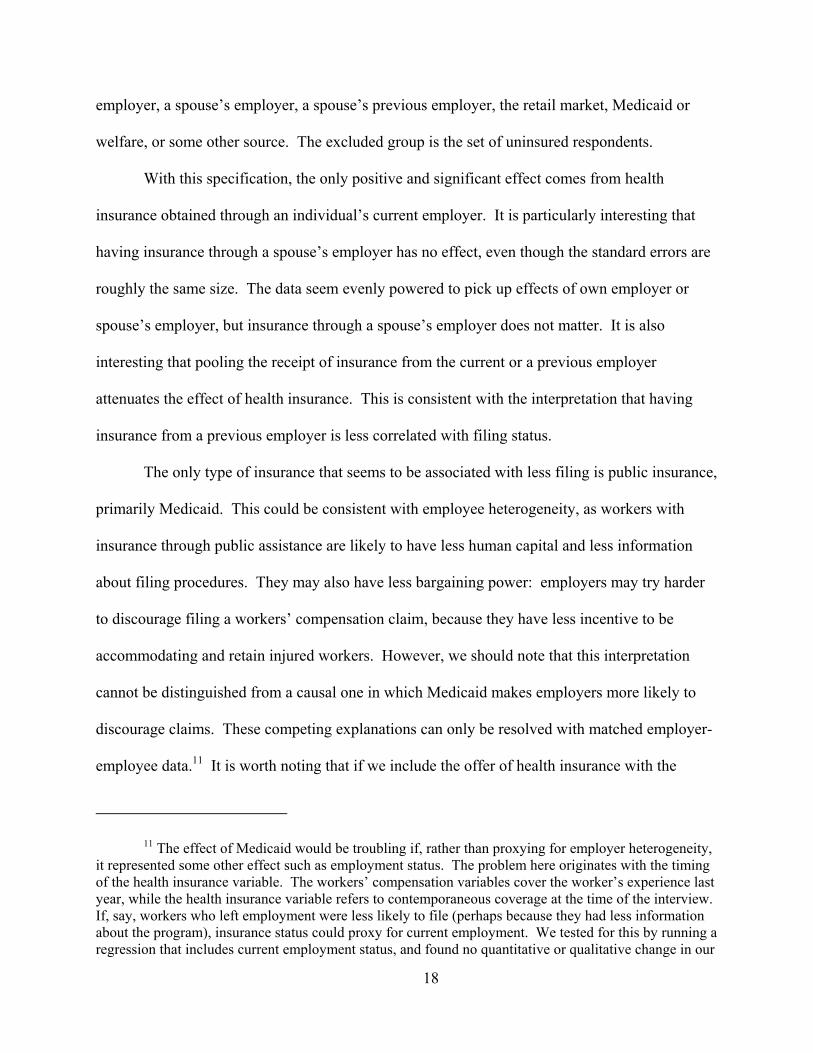
With this specification, the only positive and significant effect comes from health
insurance obtained through an individual’s current employer. It is particularly interesting that
having insurance through a spouse’s employer has no effect, even though the standard errors are
roughly the same size. The data seem evenly powered to pick up effects of own employer or
spouse’s employer, but insurance through a spouse’s employer does not matter. It is also
interesting that pooling the receipt of insurance from the current or a previous employer
attenuates the effect of health insurance. This is consistent with the interpretation that having
insurance from a previous employer is less correlated with filing status.
The only type of insurance that seems to be associated with less filing is public insurance,
primarily Medicaid. This could be consistent with employee heterogeneity, as workers with
insurance through public assistance are likely to have less human capital and less information
about filing procedures. They may also have less bargaining power: employers may try harder
to discourage filing a workers’ compensation claim, because they have less incentive to be
accommodating and retain injured workers. However, we should note that this interpretation
cannot be distinguished from a causal one in which Medicaid makes employers more likely to
discourage claims. These competing explanations can only be resolved with matched employer-
employee data.11 It is worth noting that if we include the offer of health insurance with the
11 The effect of Medicaid would be troubling if, rather than proxying for employer heterogeneity, it represented some other effect such as employment status. The problem here originates with the timing of the health insurance variable. The workers’ compensation variables cover the worker’s experience last year, while the health insurance variable refers to contemporaneous coverage at the time of the interview. If, say, workers who left employment were less likely to file (perhaps because they had less information about the program), insurance status could proxy for current employment. We tested for this by running a regression that includes current employment status, and found no quantitative or qualitative change in our

19
actual possession of health insurance by insurance source, most of the coefficients on the
possession of health insurance fall. The simple possession of health insurance does not appear to
have a significant effect, though the offer of health insurance does, if we include both in a model
with individual fixed-effects. Again, this supports the notion that the mere possession of health
insurance is not as relevant for filing a workers’ compensation claim as whether the current
employer is offering it.
The most straightforward interpretation of the importance of employer-offered health
insurance is that it proxies for the workplace environment, and is correlated with the employer
fixed-effect λj (or the match effect). There are two equally plausible interpretations of this result.
The first—causal interpretation—is that offering health insurance makes employers less likely to
discourage workers’ compensation claims, because it gives them less incentive to pass injuries
off onto health insurers. The second—selective interpretation—is that employers who offer
health insurance are likely to be of a “friendlier” type, and that this also encourages workers’
compensation claims. Either or both of these effects may be operating, but it seems clear that
heterogeneity across workers is not the sole reason for differences in filing behavior.
A “selective” type of interpretation is aided by the fact that other types of fringe
benefits—like paid vacation days—also seem to be associated with higher filing rates. For
example, when both health insurance offers and paid vacation offers are included in a random
effects specification, both variables are significant (at the 95% level) and both have coefficients
around 0.10. This suggests that workers who switch to “good employers” are more likely to file
results. While current employment status is correlated with health insurance status, it appears uncorrelated with filing for workers’ compensation. We also note that the timing problem for current health insurance status does not affect our results for whether or not employers offer health insurance, because that question refers to the employer with which you had the longest tenure over the past year.

20
claims, and that being a good employer is not entirely encapsulated by the health insurance offer.
It cannot simply be the case that health insurance alone makes an employer less concerned with
discouraging workers’ compensation claims.
C.2.2 Other Determinants of Filing Behavior The only other direct measure of employer heterogeneity in our sample is the size of the
establishment at which an individual works. It is not clear, in principle, whether large firms
should be more or less receptive to claim filing. Larger firms tend to have higher wage earners
and thus might be more willing and able to accommodate injured workers, which could indicate
a more positive workplace environment, just as the offer of health insurance might. On the other
hand, larger firms are also more likely to be experience-rated and thus could suffer more from a
successful workers’ compensation claim, making them less receptive to claims.
Figure 1 illustrates the estimated coefficients and 90% confidence intervals of the
employer size categories on filing in the industry fixed-effect and individual fixed-effects
regressions that include the employer offer of health insurance variable (i.e., the second and
fourth columns of Table 7). The omitted category is the set of firms with 1-4 employees. In
general, the figure suggests that the effect of establishment size on filing behavior is limited.
When we consider the model with just industry fixed-effects, there appears to be a positive effect
on filing for some of the smaller and middle sized firms, and a negative (though insignificant)
effect at the largest firms. When we control for individual fixed-effects, however, the coefficient
essentially disappears in statistical significance. This suggests that the effect of establishment
size on filing is more closely related to unobserved heterogeneity among workers than among
employers. This is consistent with the findings of Abowd, Kramarz and Margolis (1999), who
noted the substantial role played by employees in heterogeneity among firms of different sizes.

21
Though not reported in the tables, we find similar results for the other specifications, as well as
in the analysis of injury rates reported in Table 6.
Belonging to a union or employee association raises the probability of filing by about 5 to
7 percentage points. This is consistent with the findings of Hirsch, Macpherson, and DuMond
(1997), who found that workers were more likely to file in union workplaces than nonunion
workplaces. Their argument, which seems plausible here, is that unions provide more
information about filing and lower the costs of filing for their members.
The effect of unionization is not as robust once we control for individual heterogeneity.
One explanation for this is simply that individuals do not change union status very often. This is
illustrated in Table 8, which shows the number of transitions between health insurance status,
union status, and injury or illness status among repeat injury sufferers. It is these transitions that
identify the fixed-effects, and to a lesser extent the random-effects, model. Almost half of repeat
injury sufferers switch health insurance status across injuries, but about half that proportion
(25%) switch injury/illness status, and just 14% switch union status. Thus, the union coefficient
in the fixed-effects model is identified off approximately 430 observations. The random-effects
model suggests that union status has a positive effect on filing of about 5 percentage points, but it
is only weakly significant in the fourth column and not significant in the eighth.
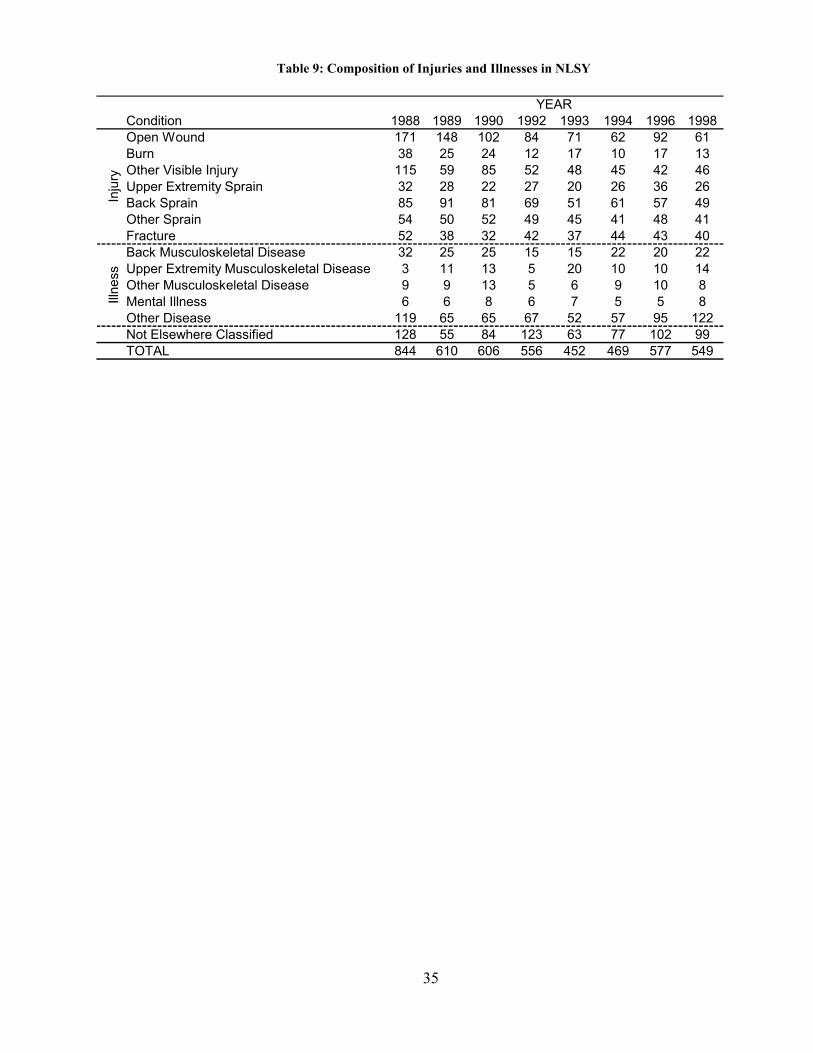
Workers with occupational illnesses are about 14 to 17 percentage points less likely to
file claims than workers with injuries. Table 9 provides some insight into the composition of
injuries and illnesses in the NLSY. Just over 20% of work-related conditions in the NLSY are
classified as illnesses. Just as in the union case, the coefficient on illness is insignificant in the
individual fixed-effects model, probably because there are relatively few observations
22
identifying it (according to Table 8). However, the random-effects model, which we are unable
to reject, produces an estimate that is significant and similar to the simpler specifications.
Interestingly, we found no statistically significant effect of the replacement rate of lost
wages on the decision to file for workers’ compensation benefits, contrary to past findings. This
is surprising, since one might expect workers’ compensation benefits to have a larger effect on
the decision to file than on injury reports. We find that the estimated coefficients for the
replacement rate are indeed larger in Table 7 than in Table 6, but they are insignificant. It is not
clear that this result can be easily explained by a lack of statistical power, as the coefficient
values are as large as others that are significant in our model. It is also not clear that there is a
plausible selection bias that would explain this result (if anything, most such biases would
overstate the impact of the replacement rate). Perhaps the most plausible explanation is
measurement error. Workers base their behavior on the after-tax replacement rate, but we
measure the before-tax replacement rate. This could bias our estimates towards zero.
People who miss more workdays are also more likely to file. One way to interpret this is
to argue that people with more severe injuries that keep them out longer are more likely to file,
but some caution is warranted here. People who file are intrinsically more likely to receive
benefits, and this may induce them to stay out of the workforce longer than people who do not
file. This is unlikely to affect the estimated effect of short (1-2 days) stays out of work, since
nearly all states employ worker’s compensation waiting periods of 3 days or more. The
comparison between people who missed no work and those who missed 1-2 days of work thus is
likely to reflect differences in severity, but the longer stays may also incorporate simultaneity
bias, since benefit receipt can affect incentives to return to work.

23
Finally, we find that college graduates are less likely to file than other educational
groups. This could be because less educated workers end up with more severe injuries, or that
they receive higher effective replacement rates. A less direct interpretation is that college
graduates are healthier than others, and healthier people file less often. We explore this issue
further in the next section.
C.3 The Relationship Between Health and Health Insurance
Recent research by Biddle and Roberts (2003) suggests that workers who are healthier
are less likely to file workers’ compensation claims than workers who are less healthy. If
working for an employer offering health insurance is simply an indicator of poor health, our
results might simply be an indirect special case of this result. To check this, it is important to
investigate whether our findings for employer-based health insurance could in principle be
explained entirely by a correlation between health and filing status. The 1998 NLSY asks
questions about health to all respondents over age 40. While this is not enough data to allow us
to incorporate health directly into our analysis of filing behavior, we can gain some insight into
the relationship between health and health insurance.
Table 10 suggests that our previous analysis identifies something other than a correlation
between health insurance and individual health status. The Table shows results of an analysis
performed for the NLSY population over age 40 in 1998. These are results from an ordered
probit of self-reported health status—where an individual is asked whether his health is excellent
(=1), very good (=2), good (=3), fair (=4) or poor (=5)—on several covariates, including
employer-based health insurance. A lower number implies better health. We find no
relationship between employer-based health insurance and health, although we find that people
who have health insurance are actually in better health than those who lack it. This suggests that

24
adverse selection in health insurance may be less relevant than heterogeneity; people who are
more risk-averse or forward-looking might both invest more in their health and be more likely to
purchase (or choose an employer who offers) health coverage. In any event, there is no evidence
that people in employers offering health insurance are sicker. Indeed, employers have incentives
to avoid such a situation; they would not want to offer health insurance if it would simply attract
sicker (and presumably less productive) workers.
While self-reported general health status is used widely as a comprehensive measure of
general health (cf, Idler and Benyamini, 1997), we also experimented with other measures of
health and found exactly the same patterns. These alternative measures included: whether the
respondent has difficulty climbing stairs, and whether the respondent finds it difficult to engage
in moderate levels of activities because of his/her health.
D. Conclusions
We have found that the propensity of injured workers to file workers’ compensation
claims is affected by certain worker characteristics—like union membership or type of injury—
in a predictable fashion, but is also independently affected by a worker’s health insurance status
in ways that are surprising and nuanced. Health insurance is positively related to the probability
of filing. What appears more important than simply the possession of health insurance, however,
is whether or not it is offered by the employer. This suggests that health insurance acts primarily
through the incentives of employers (or perhaps indicates heterogeneity among employers) and
has relatively little, if any effect, on the incentives of individuals.
From a policy perspective, these results suggest that efforts to encourage filing should be
targeted in part—and perhaps even primarily—at employers. We cannot say for sure whether
offering health insurance has a causal effect on employers, but it is clear that employer
25
characteristics and behavior are key determinants of worker filing. It also appears that concerns
about workers’ compensation being used to cover nonoccupational conditions are probably
overstated; if anything, it seems likely that employer-provided health insurance is providing
coverage for a number of occupational conditions.
Future research on the effects of employer characteristics on workers’ compensation
filing also seems warranted. Such a research agenda would benefit from matched employer-
employee databases; these would allow researchers to identify both employer and employee
fixed-effects in a single empirical framework. It would also benefit from objective data on
workplace health conditions. While it would be costly to compile a nationally representative
database with objectively verified data on workplace health conditions, a more affordable and
attractive alternative would be to validate injury reports for a randomly chosen subsample of
workers. This would provide insight into what it is that “reported” injury rates measure and
would allow researchers to refine their interpretation and analysis of variation in reported injury
rates.

26
References
Abowd, J. M., F. Kramarz, and D. N. Margolis (1999). "High Wage Workers and High Wage Firms." Econometrica 67(2): 251-333.
Azaroff, L. S., C. Levenstein, and D. Wegman (2002). "Occupational Injury and Illness Surveillance: Conceptual Filters Explain Underreporting." American Journal of Public Health 92(9): 1421--1429.
Biddle, J. E., and K. Roberts (2003). "Claiming Behavior in Workers' Compensation." Journal of Risk and Insurance 70(4): 759-780.
Butler, R. J. (1994). "Economic Determinants of Workers’ Compensation Trends." Journal of Risk and Insurance 61: 383-401.
Butler, R. J., and J. D. Worrall (1991). "Claims Reporting and Risk-Bearing Moral Hazard in Workers' Compensation." Journal of Risk and Insurance 58: 196-197.
Card, D., and B. P. McCall (1996). "Is Workers Compensation Covering Uninsured Medical Costs – Evidence from the Monday Effect." Industrial and Labor Relations Review 49(4): 690-706.
Chelius, J. R. (1982). "The Influence of Workers' Compensation on Safety Incentives." Industrial and Labor Relations Review 35: 235-242.
Chelius, J. R., and K. Kavanaugh (1988). "Workers' Compensation and the Level of Occupational Injuries." Journal of Risk and Insurance 55: 315-323.
Hirsch, B. T., D. A. Macpherson, and J. M. DuMond (1997). "Workers' Compensation Recipiency in Union and Nonunion Workplaces." Industrial and Labor Relations Review 50(2): 213-36.
Idler, E. L., and Y. Benyamini (1997). "Self-rated health and mortality: a review of twenty-seven community studies." Journal of Health and Social Behavior 38(1): 21-37.
Krueger, A. B. (1990). "Incentive Effects of Workers’ Compensation Insurance." Journal of Public Economics 41: 73-99.
Lakdawalla, D. N., and T. J. Philipson (2002). "Technological Change and the Growth of Obesity." National Bureau of Economic Research Working Paper 8946. Cambridge, MA: National Bureau of Economic Research.
Maier, M., and D. Reinke (2004). "Workplace Injuries and Workers' Compensation Claim Filing: Results from the 2002 Oregon Population Survey." State of Oregon.
http://www.cbs.state.or.us/imd/rasums/resalert/wcresults.html. Accessed: January 26, 2005.
Neuhauser, F., and S. Raphael (2004). "The Effect of an Increase in Workers' Compensation Benefits on the Duration and Frequency of Benefit Receipt." Review of Economics and Statistics forthcoming.
Ruser, J. W. (1985). "Workers' Compensation Insurance, Experience Rating, and Occupational Injuries." RAND Journal of Economics 16(4): 487-503.
Ruser, J. W. (1995). "Self-Correction versus Persistence of Establishment Injury Rates." Journal of Risk and Insurance 62(1): 67-93.
Smith, R. S. (1989). "Mostly on Monday: Is Workers’ Compensation Covering Off-the-Job Injuries?" Benefits, Costs, and Cycles in Workers’ Compensation Insurance. D. Appel, ed. Norwood, MA: Kluwer.

27
Yes No Yes NoProportion Filing 0.58 0.51 0.60 0.39
Proportion Losing Wages 0.24 0.42 0.25 0.36
Average Work-Days Lost 19.0 41.5 19.7 23.1
Has Health Insurance Offers Health InsuranceWorker Employer
Table 1: Health Insurance and Workers' Compensation Claiming

28
Year Injuries/Illnesses Claims Benefits Claims Benefits1988 844 401 187 0.48 0.221989 610 334 148 0.55 0.241990 606 343 168 0.57 0.281992 556 338 173 0.61 0.311993 452 248 115 0.55 0.251994 469 251 113 0.54 0.241996 577 347 151 0.60 0.261998 549 324 146 0.59 0.27TOTAL 4663 2586 1201 0.55 0.26
Number of Workers With Proportion of Injured With
Table 2: Occupational Illnesses and Injuries in the NLSY

29
Table 3: Characteristics of NLSY Sample, 1988-1998
Table 2. Characteristics of the NLSY Sample.
EmployedVariable Overall In Past Year Injured Filing CompensatedAge 31.20 31.21 31.12 31.30 31.23
(3.87) (3.88) (4.00) (4.00) (3.94)
Female 0.42 0.39 0.37 0.36 0.34(0.49) (0.49) (0.48) (0.48) (0.47)
Black 0.25 0.23 0.23 0.24 0.24(0.43) (0.42) (0.42) (0.42) (0.42)
Married 0.40 0.38 0.52 0.54 0.55(0.49) (0.49) (0.50) (0.50) (0.50)
Employed w/in 0.57 0.62 0.87 0.87 0.82Last 2 Weeks (0.50) (0.49) (0.34) (0.34) (0.39)
Highest Grade 12.89 13.08 12.33 12.15 12.00Attained (2.55) (2.52) (2.26) (2.12) (2.11)
Annual Wage $19,919 $24,461 $20,211 $20,418 $19,457Income ($) ($93,335) ($102,891) ($14,969) ($14,534) ($15,189)
Employer Offers 0.65 0.69 0.73 0.79 0.80Health Insurance (0.48) (0.46) (0.44) (0.40) (0.40)
Any Health Insurance 0.79 0.81 0.78 0.80 0.79(0.40) (0.40) (0.41) (0.40) (0.41)
Unionized 0.10 0.12 0.19 0.23 0.23(0.31) (0.33) (0.39) (0.42) (0.42)
Number of Employees 557.08 560.86 501.19 478.36 521.84(1744.17) (1736.85) (1617.22) (1563.02) (1680.94)
Missed Work 0.04 0.04 0.58 0.68 0.89due to an Injury (0.19) (0.20) (0.49) (0.47) (0.32)
Number of Work-Days 1.44 1.50 23.10 34.42 63.17Missed due to Injury (21.44) (19.99) (83.27) (100.49) (132.10)

30
Employed Injured Filed CompensatedVariable Overall In Past Year In Past Year In Past Year In Past YearAge 31.62 31.63 31.50 31.70 31.61
(3.93) (3.95) (4.07) (4.04) (3.95)
Female 0.47 0.44 0.35 0.34 0.33(0.50) (0.50) (0.48) (0.48) (0.47)
Black 0.14 0.13 0.11 0.11 0.13(0.35) (0.34) (0.32) (0.32) (0.33)
Married 0.59 0.59 0.55 0.57 0.58(0.49) (0.49) (0.50) (0.49) (0.49)
Employed w/in 0.79 0.90 0.89 0.89 0.84Last 2 Weeks (0.41) (0.31) (0.31) (0.31) (0.36)
Highest Grade 13.25 13.39 12.55 12.31 12.17Attained (2.55) (2.52) (2.25) (2.12) (2.08)
Annual Wage $23,700 $28,276 $21,829 $21,631 $20,654Income ($) ($115,936) ($126,124) ($15,671) ($13,751) ($13,468)
Employer Offers 0.67 0.70 0.72 0.79 0.79Health Insurance (0.47) (0.46) (0.45) (0.41) (0.41)
Any Health Insurance 0.82 0.83 0.80 0.82 0.80(0.38) (0.37) (0.40) (0.38) (0.40)
Unionized 0.10 0.12 0.19 0.23 0.22(0.30) (0.32) (0.39) (0.42) (0.42)
Number of Employees 533.61 536.66 471.33 442.75 463.74(1694.29) (1685.88) (1551.32) (1498.38) (1594.67)
Missed Work 0.04 0.04 0.54 0.63 0.86due to an Injury (0.19) (0.20) (0.50) (0.48) (0.35)
Number of Work-Days 1.38 1.39 18.68 27.51 52.42Missed due to Injury (21.13) (18.95) (67.45) (81.90) (109.65)
Table 4: Characteristics of NLSY Cohort

31
Variable Filed Didn't File Filed Didn't FileAge 31.36 30.76 30.83 31.06
(4.04) (4.00) (3.71) (4.07)
Female 0.33 0.37 0.36 0.35(0.47) (0.48) (0.48) (0.48)
Black 0.11 0.12 0.12 0.10(0.32) (0.32) (0.33) (0.30)
Married 0.59 0.53 0.48 0.49(0.49) (0.50) (0.50) (0.50)
Employed w/in 0.91 0.93 0.82 0.82Last 2 Weeks (0.28) (0.26) (0.38) (0.38)
Highest Grade 12.43 13.06 12.06 12.38Attained (2.14) (2.36) (2.11) (2.28)
Annual Wage $22,556 $24,222 $14,718 $15,263Income ($) ($13,233) ($16,785) ($11,622) ($14,678)
Any Health Insurance 0.90 0.90 0.47 0.53(0.30) (0.30) (0.50) (0.50)
Unionized 0.27 0.20 0.07 0.03(0.44) (0.40) (0.25) (0.18)
Number of Employees 524.4 670.6 291.9 259.7(1596) (1785) (1492) (1441)
Missed Work 0.63 0.41 0.67 0.46due to an Injury (0.48) (0.49) (0.47) (0.50)
Number of Work-Days 23.06 6.78 40.42 9.50Missed due to Injury (61.48) (31.00) (121.08) (54.37)
Employer Does Not OfferHealth Ins.Health Ins.
Employer Offers
Table 5: Characteristics of the injured NLSY population, by health insurance

32
Table 6: Determinants of Self-Reported Workplace Injuries and Illnesses in the NLSY
Dependent Variable: Experienced Workplace Injury/IllnessEmployer Offers Health Insurance 0.007** 0.008** 0.013**
(0.003) (0.004) (0.005)In Union or Employee Association 0.046*** 0.039*** 0.025***
(0.006) (0.006) (0.009)Obese 0.008* 0.006 0.01
(0.004) (0.004) (0.008)HS -0.018*** -0.014** 0.019
(0.006) (0.006) (0.029)SC -0.042*** -0.036*** 0.011
(0.006) (0.006) (0.031)COL -0.068*** -0.056*** 0.006
(0.006) (0.007) (0.032)black -0.023*** -0.022*** .
(0.004) (0.004) .female -0.023*** -0.017*** .
(0.003) (0.003) .State TD max ($1000's) 0.005 0.003 0.007
(0.015) (0.015) (0.035)Physical Demands -0.010*** -0.012*** -0.011**
(0.003) (0.003) (0.004)Strength Rating 0.016*** 0.015*** 0.013***
(0.003) (0.003) (0.004)Fixed-Effects Year Year Year
Industry IndustryIndividual
Other Controlsa
Observations 43241 43241 43241R-squared 0.02 0.04 0.31Robust standard errors in parentheses* significant at 10%; ** significant at 5%; *** significant at 1%aAll were statistically insignificant, with coefficients close to zero.
AFQT, age, establishment size

33
Table 7: Determinants of Filing Behavior among injured NLSY workers
Dependent Variable: Employer Offers Health Ins. 0.189*** 0.180*** 0.157* 0.151***
(0.024) (0.027) (0.095) (0.023)Has Health Insurance From:
Employer 0.124*** 0.135*** 0.031 0.111***(0.027) (0.031) (0.113) (0.027)
Previous Employer 0.051 -0.026 -0.158 0.021(0.093) (0.103) (0.298) (0.085)
Spouse's Employer 0.035 0.052 0.042 0.02(0.035) (0.038) (0.164) (0.033)
Spouse's Prev. Employer -0.039 -0.015 -0.12 0.187(0.223) (0.230) (0.248) (0.170)
Retail Market -0.047 -0.032 0.117 -0.029(0.061) (0.066) (0.300) (0.059)
Medicaid/Welfare -0.194*** -0.193*** 0.159 -0.207***(0.062) (0.069) (0.262) (0.057)
Other Source -0.008 -0.039 -0.145 -0.073(0.073) (0.091) (0.282) (0.076)
In Union or Employee Assoc. 0.069*** 0.052* 0.006 0.046* 0.074*** 0.061* -0.045 0.044(0.026) (0.029) (0.138) (0.026) (0.027) (0.033) (0.175) (0.030)
State TD Max ($1000's) -0.038 0.043 0.412 -0.224 -0.038 0.073 0.492 -0.28(0.100) (0.105) (0.975) (0.298) (0.108) (0.123) (1.318) (0.366)
Occupational Illness -0.176*** -0.171*** -0.078 -0.148*** -0.156*** -0.162*** -0.145 -0.148***(0.024) (0.026) (0.076) (0.022) (0.026) (0.029) (0.112) (0.025)
Missed Work-Days:1-2 0.058* 0.053 0.047 0.089*** 0.053 0.03 0.13 0.055*
(0.031) (0.033) (0.103) 0.026 (0.035) (0.039) (0.151) (0.031)3-9 0.180*** 0.174*** 0.178 0.195*** 0.153*** 0.150*** 0.222 0.164***
(0.031) (0.032) (0.108) 0.027 (0.033) (0.036) (0.149) (0.030)10-29 0.281*** 0.296*** 0.256** 0.309*** 0.277*** 0.289*** 0.320** 0.307***
(0.033) (0.036) (0.123) 0.033 (0.035) (0.041) (0.160) (0.037)30-129 0.330*** 0.319*** 0.149 0.388*** 0.298*** 0.275*** 0.184 0.336***
(0.036) (0.039) (0.128) 0.034 (0.038) (0.044) (0.164) (0.038)130+ 0.485*** 0.487*** 0.429** 0.476*** 0.456*** 0.500*** 0.419** 0.487***
(0.038) (0.042) (0.167) 0.052 (0.044) (0.047) (0.210) (0.057)High School Graduate -0.018 -0.005 -0.232 -(0.011) -0.001 0.009 -0.443 -0.009
(0.027) (0.028) (0.454) 0.025 (0.029) (0.031) (0.535) (0.028)College Attendee -0.045 -0.04 -0.518 -(0.037) -0.045 -0.045 -0.743 -0.057
(0.034) (0.036) (0.444) 0.031 (0.036) (0.042) (0.555) (0.035)College Graduate -0.124*** -0.081* -0.224 -0.108*** -0.135*** -0.097* -0.265 -0.128***
(0.042) (0.047) (0.545) 0.041 (0.046) (0.053) (0.750) (0.046)Fixed-Effects Year Year Year Year Year Year Year Year
Industry Industry Industry Industry Industry IndustryState State State State
Individual IndividualRandom-Effects Individual IndividualOther Controls
Observations 3103 3103 3103 3103 2687 2477 2477 2477R-squared 0.14 0.26 0.85 0.26 0.12 0.28 0.89 0.28Notes: Robust standard errors in parentheses; time-invariant controls are excluded from fixed-effects models.* significant at 10%; ** significant at 5%; *** significant at 1%
Weeks of Job Tenure, AFQT score, Obese, Female, age,black, job physical demands, job strength rating, wage loss, employer size
Filed a Workers' Compensation Claim

34
2 3 4 5 6 7 8 Total0 417 102 24 7 2 0 0 5521 297 81 28 6 1 0 0 4132 0 58 28 7 3 3 1 1003 0 0 3 6 0 0 0 94 0 0 0 0 1 0 0 1
Total 714 241 83 26 7 3 1 1075
0 634 204 66 21 1 2 0 9281 80 28 6 4 2 0 0 1202 0 9 10 1 3 1 1 253 0 0 1 0 1 0 0 2
Total 714 241 83 26 7 3 1 1075
0 573 160 57 16 4 1 1 8121 141 56 17 3 1 1 0 2192 0 25 8 7 1 1 0 423 0 0 1 0 1 0 0 2
Total 714 241 83 26 7 3 1 1075
Uni
on S
witc
hes
Number of Injuries
Insu
ranc
e S
witc
hes
Dis
ease
Sw
itche
s
Table 8: Changes in Health Insurance, Union, and Injury/Illness Status Among Repeat Sufferers
35
Condition 1988 1989 1990 1992 1993 1994 1996 1998Open Wound 171 148 102 84 71 62 92 61Burn 38 25 24 12 17 10 17 13Other Visible Injury 115 59 85 52 48 45 42 46Upper Extremity Sprain 32 28 22 27 20 26 36 26Back Sprain 85 91 81 69 51 61 57 49Other Sprain 54 50 52 49 45 41 48 41Fracture 52 38 32 42 37 44 43 40Back Musculoskeletal Disease 32 25 25 15 15 22 20 22Upper Extremity Musculoskeletal Disease 3 11 13 5 20 10 10 14Other Musculoskeletal Disease 9 9 13 5 6 9 10 8Mental Illness 6 6 8 6 7 5 5 8Other Disease 119 65 65 67 52 57 95 122Not Elsewhere Classified 128 55 84 123 63 77 102 99TOTAL 844 610 606 556 452 469 577 549
Inju
ryIll
ness
YEAR
Table 9: Composition of Injuries and Illnesses in NLSY

36
Ordered Probit on Self-Reported General Health Statusa
Employer Offers Health Insurance 0.05(0.111)
Has Health Insurance -0.218*(0.132)
In Union or Employee Association 0.014 -0.018(0.128) (0.119)
High School Graduate -0.335** -0.307**(0.149) (0.130)
College Attendee -0.532*** -0.408***(0.169) (0.147)
College Graduate -0.780*** -0.708***(0.189) (0.166)
Age (0.023) (0.022)(0.098) (0.089)
Black -(0.096) -(0.107)(0.114) (0.104)
Female 0.177* 0.149*(0.091) (0.083)
AFQT Score -0.005** -0.005**(0.002) (0.002)
Observations 758 912Pseudo R-Squared 0.04 0.04Robust standard errors in parentheses, below probit coefficients.* significant at 10%; ** significant at 5%; *** significant at 1%aGeneral health status takes on values of Excellent, Very Good,Good, Fair, or Poor, where "Excellent" takes on a value of 1, and"Poor" takes on a value of 5.
Table 10: Health Status and Health Insurance

37
Figure 1. The Effect of Establishment Size on the Likelihood of Filing a Workers' Compensation Claim
-60%
-40%
-20%
0%
20%
40%
60%
5-910
-1415
-2930
-4445
-5960
-99
100-1
99
200-2
99
300-4
99
500-9
99
1000
-2999
3000
+
Establishment Size
Increase in Filing Probability
Industry Fixed Effects Individual Fixed Effects