1
How Does Peer Pressure Affect One’s Perception of Beauty? Quetourah Dalencourt Introduction For thousands of years, philosophers have been discussing beauty. Plato said “Beauty of style and harmony and grace and good rhythm depends on simplicity.” Today, the discussion continues. People’s perception of beauty varies. There is no set definition of beauty. Everyone has his or her own p ercep tio n o f b eau ty . Beau ty is n o t u n iv ersal, b u t it is a p leasu re. Resu lts fro m th e stu d y Lingering p lea su re in th e exp erien ce o f b ea u ty show that the feeling of beauty is associated with high pleasure. Pleasure is 78% correlated with the feeling of beauty (Pelli & Vale 2 0 1 4 ). Th ere is n o u n iv ersal b eau ty , and one's perception of beauty may be influenced by the people that they are close to. Previous studies show a correlation between media and how one perceives one’s physical beauty. The articles th ey p u b lish , th e mo d els th ey ch o o se to b e o n th e co v er, an d th eir ad s all sh o w w h at th ey p erceiv e as b eau tifu l. D ifferen t eth n icities are affected differently. Girls would most likely identify with mo d els o f th e same eth n icity . First research ers h av e sh o w n h o w th e so cial co n tex t o f med ia u se is cru cial, p articu larly in th at sig n ifican t o th ers are relev an t (Milk ie, 1 9 9 , p . 1 9 0 ). In another study that was conducted, researchers found the ratings of the target person (average w o man ) in d icated th at sh e w as seen as sig n ifican tly less b eau tifu l b y p articip an ts ex p o sed to th e ad v ertisemen t fo r Wella Balsam, d ep ictin g th e p o p u lar mo d el Farrah Faw cett (attractiv e female in th e experiment) (Kenrick, 1980, p. 134). A number of studies have shown that judgments of attractiveness can be influenced by other information likely to affect interpersonal attraction in general, such as k n o w led g e o f a targ et p erso n 's attitu d in al similarity (Walster, cited in Bersch eid & Walster, 1974) (Kenrick, 1980, p. 137). It could be that some participants are more exposed to more media or attractiv e p eo p le b ecau se o f th eir o ccu p atio n s (K en rick , 1 9 8 0 , p . 1 3 7 ). Th e p articip an ts w ere all influenced by media, whether at the time the study was being conducted or prior, their perception of p h y sical b eau ty w as in flu en ced . Media isn’t the only factor that may affect one’s perception. Parents and peer pressure also affect a teenager’s actions. In the study, the responses reflect a concern to avoid being noticeably different from peers (Brittain, 1963, p.390). Parent-conformity happened mostly when the observers perceived the ch o ice to th e d ilemma as d ifficu lt (Brittain , 1 9 6 3 , p . 3 8 9 ). People in general tend to conform to what society perceives as normal. A reason for apparent conformism is that people’s preferences can depend on social comparison and in these circumstances knowing how others would act can encourage us to respond in similar ways (Hargreaves Heap, 2014, p. 12). In a study, 1027 6th-7th graders were given measures of peer conformity dispositions (willingness to accede to peer pressure), perceptions of peer pressure, and self-reported frequency of b eh av io r co n cern in g 2 majo r asp ects o f teen ag e life: h o w mu ch teen ag ers so cialize with friends and misco n d u ct (d ru g /alco h o l u se, sex u al in terco u rse, an d min o r d elin q u en t b eh av io r). Th e resu lts sh o w ed that students were less willing to follow peers in misconduct. They were most likely to follow peers w ith it came to so cializatio n (Brown, 1986, p. 521). Peo p le ten d to co n fo rm to so ciety ’s n o rm. Med ia in flu en ces ad u lts an d ch ild ren alik e. Teen s, esp ecially , ten d to v alu e th eir p eers’ o p in io n s. Teen s are in flu en ced b y p eers an d p aren ts alik e in different aspects of their lives. I hypothesize that peers do affect each other's’ perception of beauty. Materials and Methods Test observers were between 13 to 18 years old from a large urban, culturally diverse public high sch o o l in a n o rth eastern city . Th e sch o o l is 3 3 % A sian , 3 1 % Black , 1 2 % H isp an ic, an d 2 3 % w h ite. There were two procedures in this experiment. In the first procedure, participants were shown a number of images and asked to rate them on a scale of 1 to 10. Demographic questions were at the end of the survey. Then, participants took another survey rating the same images on a scale of 1 to 10. In the second survey, there were graphs that showed how others answered before the images. Observers’ answers from survey 1 and survey 2 were compared. If observer’s answer changes 2 points up or d o w n , p eers h av e slig h tly changed observer’s perception. If observer’s answer changes 3 or more p o in ts u p o r d o w n , p eers h av e sig n ifican tly changed observer’s perception. If observer’s answer doesn’t change, peers did not change observer’s perception. In the second procedure, a group of participants took only survey one. Another group took only survey two. Then, the answers from survey one of the first procedure were compared for similarity. After comparing the answers for survey one, the answers for survey two of the first procedure and the second procedure were compared. The questions from the survey are impersonal, so the risk of upsetting the observer is low. The observers’ answers will not be revealed to anyone, and the data will be anonymous when presented. At the end of the study, the data will be kept in storage for reference purposes. Consent forms were provided in classrooms or online. Signed consent forms will be kept as proofs of parents’ or guardians’ approval. Results Fig ure 1 Figure 1. Contr ol vs .Exper imentalin the fir st trial. The average answer for the control was 5.1±0. 47, and the average ans wer for the experimental was 4.9±0 .44 . Figure 2. Differ ence between Control andExper imental. This figure s hows the difference between the answers from the control and the experimental. Fig ure 2 Fig ure 3 a , 3 b Figure 3a. Scor es for Image1 in second pr ocedure. Figure 3b. Scor es that w ere shown to students befor e 1-10s cale The average s core for the image the firs t time around is 7.6±0.42.The average for the image the second time is6.2±0. 61. The average s core decreas ed after the obs ervers were shown theimage in the second s urvey. The image that was shown affect the scores the second time. This shows that it influenced the answers. Fig ure 4 a , 4 b Figure 4a. Scor es for Image2 in second pr ocedure. Figure 4b . Scor es that were s how n to s tudents befor e 1-10 scale. The average s core for the image the firs t time around is 3.3±0.55.The higher bar is towards the lower numbers . In the imagethat shown to the students, the higher bar was at five and the rest were towards the lower numbers .The average for the image the second time is 2.2±0 .29.The average score decreasedafter the obs ervers were s hown the image in the s econd survey . Theimage that was shown affects the scoresthe secondtime. This shows that it influencedthe answers. The bars for the scores the second time around donot showup at from 5-10. Fig ure 5 a , 5 b Fig ure 6 a , 6 b Figure 5a. Scor es for Image3 in second pr ocedure. Figure 5b . Scores that w er e s hown to students befor e 1-10 scale. The average s core for the image the firs t time around is 8.4±0.58.The higher bar is towards the higher numbers. The highes t bar is on 10 . In the image that was shown tothe students, the higher bar was at ten and s pread around. The average for the image the s econd timeis 7.9±0.57. The average score decreas ed after the obs ervers were s hown the image in the second survey. The image that was s hownaffects the scores the second time. This shows that it influenced the ans wers . Although the highest bar was at tenin the graphthat was shown, the ans wers were more s pread out throughout the lower scores inthe graph which cause the answers to shift towards the lower numbers the second time around. Figure 6a. Scor es for Image4 in second pr ocedure. Figure 6b. Scor es that w ere shown to students befor e 1-10s cale. The average s core for the image the firs ttime aroundis 7. 9±0.53 . The highes t bar is at 10. In the image thatshown tothe students, the highestbar is at 8 . The average for the image the second time is6.4±0. 67. The average s core decreased after the observers were showntheimage in the second survey. The image that was s hown affected the s cores the s econd time. This s hows that it influenced the ans wers . Manyof the answers remained the s ame the second time around, however, the ratings at 10 decreased.Since the ratings arelower at 10when the image was shownto the students , itcaus es obs ervers to lower their answers . Fig ure 7 a , 7 b Figure 7a. Scor es for Image5 in second pr ocedure. Figure 7b. Scor es that w ere shown to students befor e 1-10s cale. The average s core for the image the firs t time around is 7.1±0.50.The bars are s preadthroughout the graph witha range of 4-10. The highest bars are between 4and 5and8 and 10 . In the image that s hownto the s tudents , the highest bar is at 7. The bars als os pread throughout with a range of 4-10; no one rated the image a 5. The average for the image the second time is 6 .7±0.73. The average s core decreased after the obs ervers were s hown the image in the s econd survey . Theimage that was s hown affects the s cores the s econd time. This s hows that it influenced the answers .Since thehighes t bar is on 7,observers with s cores that were higher loweredtheir scores . Discussion The average for the images changes according to the graphs shown in the second trial. The averages show a decrease when the graph showed a low number on the scale the second time around. The graphs did affect the participants’ perception. When scores were mostly in the lower numbers, the scores shift towards the lower numbers the second time. When scores were mostly in the higher numbers, the scores shift towards the higher numbers the second time. Conclusion Peer pressure does affect one’s perception of beauty. The answers for the second survey decreased when the graph that was shown before the participants rated the image the second time had answers towards the lower numbers. The answers for the second survey increased when the graph that was shown before the participants rated the image the second time had answers towards the higher numbers. Th ere w eren ’t as man y p articip an ts as d esired . Testin g mo re p articip an ts co u ld h elp acq u ire mo re accu rate data. Also, testing with different age groups could show if peers’ influence on one’s perception of beauty can ch an g e o v er time. This research can help with matters concerning self-image and self-esteem. Understanding how one’s environment, specifically one’s peers, affect one’s perception of beauty can help understand how one’s perception of beauty of oneself and one’s environment changes. This can be helpful with people who suffer from eating disorders, and other issues concerning their physical beauty. It can help to understand a factor in what is causing those people to view themselves a certain way. This is important because in order to find a so lu tio n to a p ro b lem, it is imp o rtan t to k n o w w h at is cau sin g it. References Brittain , C. (1963). Adolescent Choices and Parent-Peer Cross-Pressures. Am erica n S o cio lo g ica l Review. 28(3) 385-391. Bro w n , B. Brad fo rd ; Clasen , Donna R.; Eicher, Sue A. (1986). Perceptions of peer pressure, peer conformity dispositions, and self-reported behavior among adolescents. D evelo p m en ta l Psych o lo g y. 22(4) 5 2 1 -5 3 0 . d o i:1 0 .1 0 3 7 /0 0 1 2-1 64 9 .2 2.4 .5 2 1 K en rick , D ., & G u tierres, S. (1 9 8 0 ). Co n trast effects an d ju d g men ts o f p h y sical attractiv en ess: When b eau ty b eco mes a so cial p ro b lem. Jo u rn a l o f Perso n a lity a n d S o cia l Psych o lo g y. 38(1) 131-140. d o i:1 0 .1 0 3 7 /0 0 2 2 -3 5 1 4.3 8 .1 .1 3 1 Milk ie, M. (1 9 9 9 ) So cial Co mp ariso n s, Reflected A p p raisals, an d Mass Med ia: Th e Imp act o f Perv asiv e Beauty Images on Black and White Girls' Self-Concepts. S o cia l Psych o lo g y Q u a rterly, 62(2) 190. Pelli, D . G . an d Vale, L. (2 0 1 4 ) Lin g erin g p leasu re in th e ex p erien ce o f b eau ty . In tern atio n al A sso ciatio n for Empirical Aesthetics, New York, New York, August 22-24, 2014 Shaun P. Hargreaves Heap (2014). Social Influences towards Conformism in Economic Experiments. Economics: The Open-Access, Open-Assessment E-Journal , 8 (2014-22): 1—14. 10.5018 Figure 10. C ontr ol vs. Exper imental for the secondtr ial. This figure shows how the observers answered in the control and inthe experimental in the second trial.The average for the control is 5 .2±0.52, and the average for theexperimental is 5.0±0.14. Fig ure 1 0 Fig ure 9 a , 9 b Figure 9a. Scor es for Image7 in second pr ocedure. Figure 9b. Scor es that w ere shown to students befor e 1-10s cale. The average s core for the image the firs t time around is 2.8±0.53.The higher bars are towards thelower numbers .The highest bar is on1 . In the image that was shownto the students, the higher bar was at3; a higher score than where the highestbar is for theratings the first time. The average for the image the second time is3.1±0. 60. The average s core increas ed after the observers weres hown the imagein the s econd s urvey . The image that was shown affects thescores the secondtime. Fig ure 8 a , 8 b Figure 8a. Scor es for Image6 in second pr ocedure. Figure 8b. Scor es that w ere shown to students befor e 1-10s cale. The average s core for the image the firs t time around is 3.0±0.53.The bars are spread throughout the first time. The highest bar is on1. In the image that was shown to the students, the higher bars are at 3, 4,and5. Theaverage for the image the second time is 2 .4±0.52. The average s core decreased after the observers were s hown the image in the second survey. The image that was s hown affects the s cores the second time. This s hows that it influenced the answers . The bars that were at the higher s cores 6and7 areno longer there the s econd time around; they are higher at 2 and 5 instead. The scores are onthe lower side of thegraphthe secondtime around. The graph that was shownto the s tudents influenced the ans wers to move down. Acknowledgements I would like to thank my mentor Dr. Pelli, my teacher Mr. Elert, my family for their endless support and everyone who took the time to p articip ate in this study. I would like to thank Dr. Pelli for kindly guiding me throughout my research and for reading my paper and helping me improve it. Mr. Elert helped me format my paper and properly analyze my data. My family’s endless support and encouragement helped me stay focused and positive throughout my endeavor. I w o u ld lik e to th an k th e p articip an ts in th is stu d y in clu d in g th o se w h o d id n o t p ro v id e in itials. Participants: YQZ, JLK,YYA, OLO, SR, VL, JYP, MSA, XYH, JLA, SHL, HMF, KB, RJC, SIS, MD O , A N S, X Y Z, BBB,CL, LHA, AXL, LAK, ASL,SWU, QQW, SK, KD, KAF, OOO, GAT, KDM, KZH, UFI, LHL, DCL, VAD, MCX, NCQ, JKD, MIF, BAB, LFV, MAL, MYL.

How Does Peer Pressure Affect One’s Perception of Beauty? · How Does Peer Pressure Affect One’s Perception of Beauty? QuetourahDalencourt Introduction For thousands of years,

  • Upload
    hadang

  • View
    220

  • Download
    0

Embed Size (px)

Citation preview

How Does Peer Pressure Affect One’s Perception of Beauty?Quetourah Dalencourt

IntroductionFor thousands of years, philosophers have been discussing beauty. Plato said “Beauty of style and harmony and grace and good rhythm depends on simplicity .” Today, the discussion continues. People’s perception of beauty varies. There is no set definition of beauty. Everyone has his or her own perception of beauty. Beauty is not universal, but it is a pleasure. Results from the study Lingering pleasure in the experience of beauty show that the feeling of beauty is associated with high pleasure. Pleasure is 78% correlated with the feeling of beauty (Pelli & Vale 2014). There is no universal beauty, and one's perception of beauty may be influenced by the people that they are close to .

Previous studies show a correlation between media and how one perceives one’s physical beauty. The articles they publish, the models they choose to be on the cover, and their ads all show what they perceive as beautiful. Different ethnicities are affected differently . Girls would most likely identify with models of the same ethnicity . First researchers have shown how the social context of media use is crucial, particularly in that significant others are relevant (Milkie, 199, p . 190).

In another study that was conducted, researchers found the ratings of the target person (average woman) indicated that she was seen as significantly less beautiful by participants exposed to the advertisement for Wella Balsam, depicting the popular model Farrah Fawcett (attractive female in the experiment) (Kenrick, 1980, p . 134). A number of studies have shown that judgments of attractiveness can be influenced by other information likely to affect interpersonal attraction in general, such as knowledge of a target person 's attitudinal similarity (Walster, cited in Berscheid & Walster, 1974) (Kenrick, 1980, p . 137). It could be that some participants are more exposed to more media or attractive people because of their occupations (Kenrick, 1980, p . 137). The participants were all influenced by media, whether at the time the study was being conducted or prior, their perception of physical beauty was influenced.

Media isn’t the only factor that may affect one’s perception. Parents and peer pressure also affect a teenager’s actions. In the study, the responses reflect a concern to avoid being noticeably different from peers (Brittain , 1963, p .390). Parent-conformity happened mostly when the observers perceived the choice to the dilemma as difficult (Brittain , 1963, p . 389). People in general tend to conform to what society perceives as normal. A reason for apparent conformism is that people’s preferences can depend on social comparison and in these circumstances knowing how others would act can encourage us to respond in similar ways (Hargreaves Heap, 2014, p . 12). In a study, 1027 6th-7th graders were given measures of peer conformity dispositions (willingness to accede to peer pressure), perceptions of peer pressure, and self-reported frequency of behavior concerning 2 major aspects of teenage life: how much teenagers socialize with friends and misconduct (drug/alcohol use, sexual intercourse, and minor delinquent behavior). The results showed that students were less willing to follow peers in misconduct. They were most likely to follow peers with it came to socialization (Brown, 1986, p . 521).

People tend to conform to society’s norm. Media influences adults and children alike. Teens, especially , tend to value their peers’ opinions. Teens are influenced by peers and parents alike in different aspects of their lives. I hypothesize that peers do affect each other's’ perception of beauty.

Materials and MethodsTest observers were between 13 to 18 years old from a large urban, culturally diverse public high school in a northeastern city . The school is 33% Asian, 31% Black, 12% Hispanic, and 23% white.

There were two procedures in this experiment. In the first procedure, participants were shown a number of images and asked to rate them on a scale of 1 to 10. Demographic questions were at the end of the survey. Then, participants took another survey rating the same images on a scale of 1 to 10. In the second survey, there were graphs that showed how others answered before the images. Observers’ answers from survey 1 and survey 2 were compared. If observer’s answer changes 2 points up or down, peers have slightly changed observer’s perception. If observer’s answer changes 3 or more points up or down, peers have significantly changed observer’s perception. If observer’s answer doesn’t change, peers did not change observer’s perception.

In the second procedure, a group of participants took only survey one. Another group took only survey two. Then, the answers from survey one of the first procedure were compared for similarity . After comparing the answers for survey one, the answers for survey two of the first procedure and the second procedure were compared.

The questions from the survey are impersonal, so the risk of upsetting the observer is low. The observers’ answers will not be revealed to anyone, and the data will be anonymous when presented. At the end of the study, the data will be kept in storage for reference purposes. Consent forms were provided in classrooms or online. Signed consent forms will be kept as proofs of parents’ or guardians’ approval.

ResultsFigure 1

Figure 1. Control vs . Exper imental in the fir st trial. The average answer for the control was 5.1±0.47, and the average answer for the experimental was 4.9±0.44.

Figure 2. Difference between Control and Exper imental. This figure shows the difference between the answers from the control and the experimental.

Figure 2

Figure 3a, 3b

Figure 3a. Scores for Image 1 in second procedure.Figure 3b. Scores that were shown to students before 1-10 scaleThe average score for the image the firs t time around is 7.6±0.42. The average for the image the second time is 6.2±0.61. The average score decreased after the observers were shown the image in the second survey. The image that was shown affect the scores the second time. This shows that it influenced the answers .

Figure 4a, 4b

Figure 4a. Scores for Image 2 in second procedure. Figure 4b. Scores that were shown to s tudents before 1-10 scale.The average score for the image the firs t time around is 3.3±0.55. The higher bar is towards the lower numbers . In the image that shown to the students, the higher bar was at five and the rest were towards the lower numbers . The average for the image the second time is 2.2±0.29. The average score decreased after the observers were shown the image in the second survey. The image that was shown affects the scores the second time. This shows that it influenced the answers. The bars for the scores the second time around do not show up at from 5-10.Figure 5a, 5b

Figure 6a, 6b

Figure 5a. Scores for Image 3 in second procedure. Figure 5b. Scores that were shown to students before 1-10 scale.The average score for the image the firs t time around is 8.4±0.58. The higher bar is towards the higher numbers. The highes t bar is on 10. In the image that was shown to the students, the higher bar was at ten and spread around. The average for the image the second time is 7.9±0.57. The average score decreased after the observers were shown the image in the second survey. The image that was shown affects the scores the second time. This shows that it influenced the answers . Although the highes t bar was at ten in the graph that was shown, the answers were more spread out throughout the lower scores in the graph which cause the answers to shift towards the lower numbers the second time around.

Figure 6a. Scores for Image 4 in second procedure. Figure 6b. Scores that were shown to students before 1-10 scale.The average score for the image the firs t time around is 7.9±0.53. The highes t bar is at 10. In the image that shown to the students, the highes t bar is at 8. The average for the image the second time is 6.4±0.67. The average score decreased after the observers were shown the image in the second survey. The image that was shown affected the scores the second time. This shows that it influenced the answers . Many of the answers remained the same the second time around, however, the ratings at 10 decreased. Since the ratings are lower at 10 when the image was shown to the students , it causes observers to lower their answers .

Figure 7a, 7b

Figure 7a. Scores for Image 5 in second procedure. Figure 7b. Scores that were shown to students before 1-10 scale.The average score for the image the firs t time around is 7.1±0.50. The bars are spread throughout the graph with a range of 4-10. The highest bars are between 4 and 5 and 8 and 10. In the image that shown to the s tudents , the highest bar is at 7. The bars also spread throughout with a range of 4-10; no one rated the image a 5. The average for the image the second time is 6.7±0.73. The average score decreased after the observers were shown the image in the second survey. The image that was shown affects the scores the second time. This shows that it influenced the answers . Since the highes t bar is on 7, observers with scores that were higher lowered their scores .

DiscussionThe average for the images changes according to the graphs shown in the second trial. The averages show a decrease when the graph showed a low number on the scale the second time around. The graphs did affect the participants’ perception. When scores were mostly in the lower numbers, the scores shift towards the lower numbers the second time. When scores were mostly in the higher numbers, the scores shift towards the higher numbers the second time.

ConclusionPeer pressure does affect one’s perception of beauty. The answers for the second survey decreased when the graph that was shown before the participants rated the image the second time had answers towards the lower numbers. The answers for the second survey increased when the graph that was shown before the participants rated the image the second time had answers towards the higher numbers.

There weren’t as many participants as desired. Testing more participants could help acquire more accurate data. Also, testing with different age groups could show if peers’ influence on one’s perception of beauty can change over time.

This research can help with matters concerning self-image and self-esteem. Understanding how one’s environment, specifically one’s peers, affect one’s perception of beauty can help understand how one’s perception of beauty of oneself and one’s environment changes. This can be helpful with people who suffer from eating disorders, and other issues concerning their physical beauty. It can help to understand a factor in what is causing those people to view themselves a certain way. This is important because in order to find a solution to a problem, it is important to know what is causing it.

ReferencesBrittain , C. (1963). Adolescent Choices and Parent-Peer Cross-Pressures. American Sociological Review. 28(3) 385-391.

Brown, B. Bradford; Clasen, Donna R.; Eicher, Sue A. (1986). Perceptions of peer pressure, peer conformity dispositions, and self-reported behavior among adolescents. Developmental Psychology. 22(4) 521-530. doi:10.1037/0012-1649.22.4.521

Kenrick, D., & Gutierres, S. (1980). Contrast effects and judgments of physical attractiveness: When beauty becomes a social problem. Journal of Personality and Social Psychology. 38(1) 131-140. doi:10.1037/0022-3514.38.1.131

Milkie, M. (1999) Social Comparisons, Reflected Appraisals, and Mass Media: The Impact of Pervasive Beauty Images on Black and White Girls' Self-Concepts. Social Psychology Quarterly, 62(2) 190.

Pelli, D. G. and Vale, L. (2014) Lingering pleasure in the experience of beauty. International Association for Empirical Aesthetics, New York, New York, August 22-24, 2014

Shaun P. Hargreaves Heap (2014). Social Influences towards Conformism in Economic Experiments. Economics: The Open-Access, Open-Assessment E-Journal, 8 (2014-22): 1—14. 10.5018

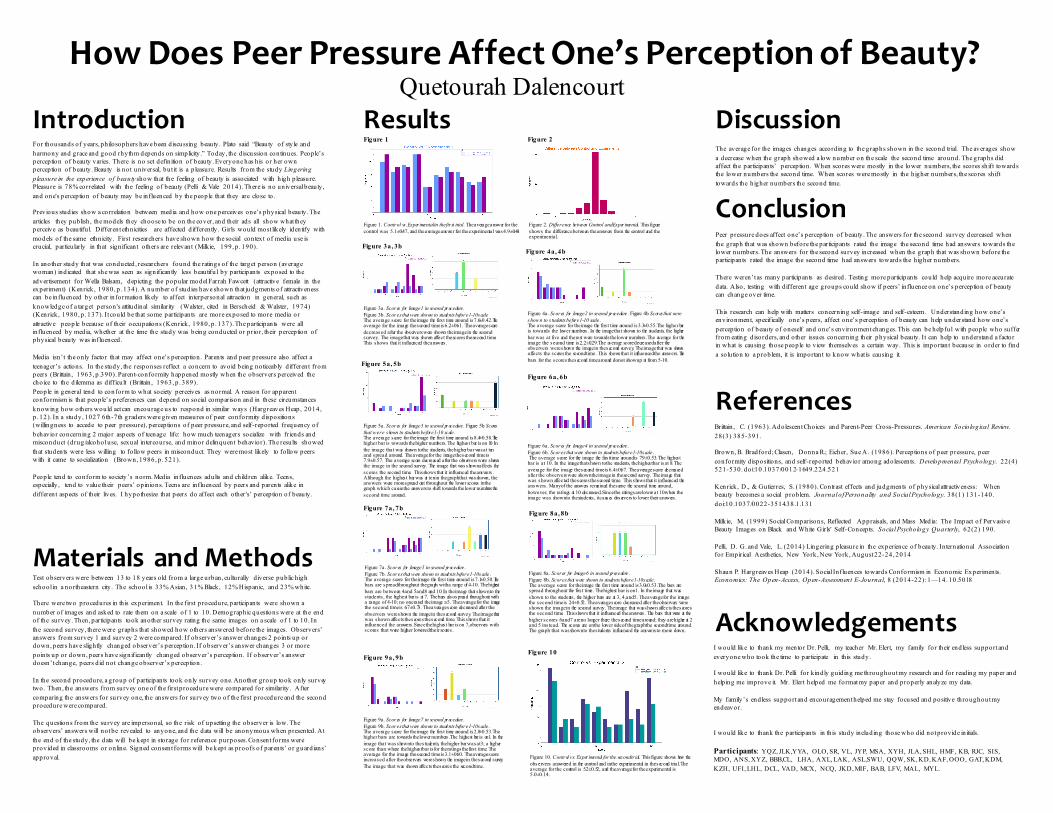
Figure 10. Control vs. Exper imental for the second tr ial. This figure shows how the observers answered in the control and in the experimental in the second trial. The average for the control is 5.2±0.52, and the average for the experimental is 5.0±0.14.

Figure 10Figure 9a, 9b

Figure 9a. Scores for Image 7 in second procedure.Figure 9b. Scores that were shown to students before 1-10 scale.The average score for the image the firs t time around is 2.8±0.53. The higher bars are towards the lower numbers . The highest bar is on 1. In the image that was shown to the s tudents, the higher bar was at 3; a higher score than where the highes t bar is for the ratings the firs t time. The average for the image the second time is 3.1±0.60. The average score increased after the observers were shown the image in the second survey. The image that was shown affects the scores the second time.

Figure 8a, 8b

Figure 8a. Scores for Image 6 in second procedure. Figure 8b. Scores that were shown to students before 1-10 scale.The average score for the image the firs t time around is 3.0±0.53. The bars are spread throughout the firs t time. The highest bar is on 1. In the image that was shown to the students , the higher bars are at 3, 4, and 5. The average for the image the second time is 2.4±0.52. The average score decreased after the observers were shown the image in the second survey. The image that was shown affects the scores the second time. This shows that it influenced the answers . The bars that were at the higher scores 6 and 7 are no longer there the second time around; they are higher at 2 and 5 ins tead. The scores are on the lower side of the graph the second time around. The graph that was shown to the s tudents influenced the answers to move down. Acknowledgements

I would like to thank my mentor Dr. Pelli, my teacher Mr. Elert, my family for their endless support and everyone who took the time to participate in this study.

I would like to thank Dr. Pelli for kindly guiding me throughout my research and for reading my paper and helping me improve it. Mr. Elert helped me format my paper and properly analyze my data.

My family’s endless support and encouragement helped me stay focused and positive throughout my endeavor.

I would like to thank the participants in this study including those who did not provide initials.

Participants: YQZ, JLK,YYA, OLO, SR, VL, JYP, MSA, XYH, JLA, SHL, HMF, KB, RJC, SIS, MDO, ANS, XYZ, BBB,CL, LHA, AXL, LAK, ASL,SWU, QQW, SK, KD, KAF, OOO, GAT, KDM, KZH, UFI, LHL, DCL, VAD, MCX, NCQ, JKD, MIF, BAB, LFV, MAL, MYL.