Embed Size (px)
Citation preview
Knight et al. Environ Evid (2021) 10:12 https://doi.org/10.1186/s13750-021-00226-y
SYSTEMATIC REVIEW
How effective is ‘greening’ of urban areas in reducing human exposure to ground-level ozone concentrations, UV exposure and the ‘urban heat island effect’? An updated systematic reviewTeri Knight1* , Sian Price2, Diana Bowler3, Amy Hookway4, Sian King5, Ko Konno6 and Raja Lorena Richter7
Abstract
Background: This review updates a systematic review published in 2010 (http:// www. envir onmen talev idence. org/ compl eted- revie ws/ how- effec tive- is- green ing- of- urban- areas- in- reduc ing- human- expos ure- to- ground- level- ozone- conce ntrat ions- uv- expos ure- and- the- urban- heat- island- effect) which addressed the question: How effective is ‘green-ing’ of urban areas in reducing human exposure to ground-level ozone concentrations, UV exposure and the ‘urban heat island effect’?
Methods: Searches of multiple databases and journals for relevant published articles and grey literature were conducted. Organisational websites were searched for unpublished articles. Eligibility criteria were applied at title, abstract and full text and included studies were critically appraised. Consistency checks of these processes were undertaken. Pre-defined data items were extracted from included studies. Quantitative synthesis was performed through meta-analysis and narrative synthesis was undertaken.
Review findings: 308 studies were included in this review. Studies were spread across all continents and climate zones except polar but were mainly concentrated in Europe and temperate regions. Most studies reported on the impact of urban greening on temperature with fewer studies reporting data on ground-level UV radiation, ozone con-centrations (or precursors) or public health indicators. The findings of the original review were confirmed; urban green areas tended to be cooler than urban non-green areas. Air temperature under trees was on average 0.8 °C cooler but treed areas could be warmer at night. Cooling effect showed tree species variation. Tree canopy shading was a significant effect modifier associated with attenuation of solar radiation during the day. Urban forests were on aver-age 1.6 °C cooler than comparator areas. Treed areas and parks and gardens were associated with improved human thermal comfort. Park or garden cooling effect was on average 0.8 °C and trees were a significant influence on this during the day. Park or garden cooling effect extended up to 1.25 kms beyond their boundaries. Grassy areas were cooler than non-green comparators, both during daytime and at night, by on average 0.6 °C. Green roofs and walls showed surface temperature cooling effect (2 and 1.8 °C on average respectively) which was influenced by substrate
© The Author(s) 2021. Open Access This article is licensed under a Creative Commons Attribution 4.0 International License, which permits use, sharing, adaptation, distribution and reproduction in any medium or format, as long as you give appropriate credit to the original author(s) and the source, provide a link to the Creative Commons licence, and indicate if changes were made. The images or other third party material in this article are included in the article’s Creative Commons licence, unless indicated otherwise in a credit line to the material. If material is not included in the article’s Creative Commons licence and your intended use is not permitted by statutory regulation or exceeds the permitted use, you will need to obtain permission directly from the copyright holder. To view a copy of this licence, visit http:// creat iveco mmons. org/ licen ses/ by/4. 0/. The Creative Commons Public Domain Dedication waiver (http:// creat iveco mmons. org/ publi cdoma in/ zero/1. 0/) applies to the data made available in this article, unless otherwise stated in a credit line to the data.
Open Access
Environmental Evidence
*Correspondence: [email protected] Public Health Wales, 2 Capital Quarter, Tyndall Street, Cardiff CF10 4BZ, UKFull list of author information is available at the end of the article
Page 2 of 38Knight et al. Environ Evid (2021) 10:12
BackgroundThe potential for climate change to impact on public health and the mechanisms through which this might occur has been increasingly explored since the publica-tion of the Fourth Intergovernmental Panel on Climate Change (IPCC) 2007 report [1–3]. The 2015 Lancet Commission on climate change [4] concluded that “…tackling climate change could be the greatest global health opportunity of the twenty-first century.” The 2017 Lancet Commission [5] reviewed data on one conse-quence of human induced climate warming predicted by the IPCC report, an increase in the intensity, fre-quency and duration of extreme heat days. The Commis-sion estimated that an additional 125 million vulnerable adults were exposed to heatwaves (defined as a period of more than 3 days during which the minimum tempera-ture is greater than the 99th percentile of the historical minima, 1986–2008 average) which can pose a serious health risk, between 2000 and 2016 [5, 6]. Increased tem-peratures can be particularly problematic in urban areas, where temperatures already tend to be a few degrees warmer than the surrounding countryside; a phenom-enon termed the ‘urban heat island effect’ (UHI) [7]. Heatwaves can therefore bring excessive temperatures in urban areas and these can result in heat strokes and other similar reactions particularly in the elderly, infirm or very young [8]. Air pollutants ozone and nitrogen dioxide (NO2) are serious threats to public health, particularly for those more exposed (lower socio-economic groups) or more vulnerable to their health impacts (elderly, young children, people with pre-existing health conditions) [3, 4, 9]. Ozone and nitrogen oxides (NOx) can also dam-age vegetation, water quality and soil and the eco-system services these provide [9]. Concentrations of ground-level ozone are dependent on relative concentrations of precursors such as NOx and volatile organic compounds (VOCs), of which some are emitted by vegetation/trees
(biogenic sources; BVOCs), as well as ambient tem-perature [4, 9], and higher urban temperatures will lead to increased ground-level ozone formation [9]. Whilst exposure to ultra-violet (UV) radiation can have mul-tiple health benefits, such as boosting vitamin D levels, too much exposure to UV radiation due to stratospheric ozone depletion and increased greenhouse gases is dam-aging to the skin and eyes and increases the risk of skin cancer [8, 10–13]. The Lancet Commission [5] asserts that the impacts of climate change are disproportionally affecting the most vulnerable in society and people in low- and middle-income countries (LMICs) and that in these populations the health effects of climate change act as a “threat multiplier” and compound the many existing pressures on the determinants of health such as housing, food and water security.
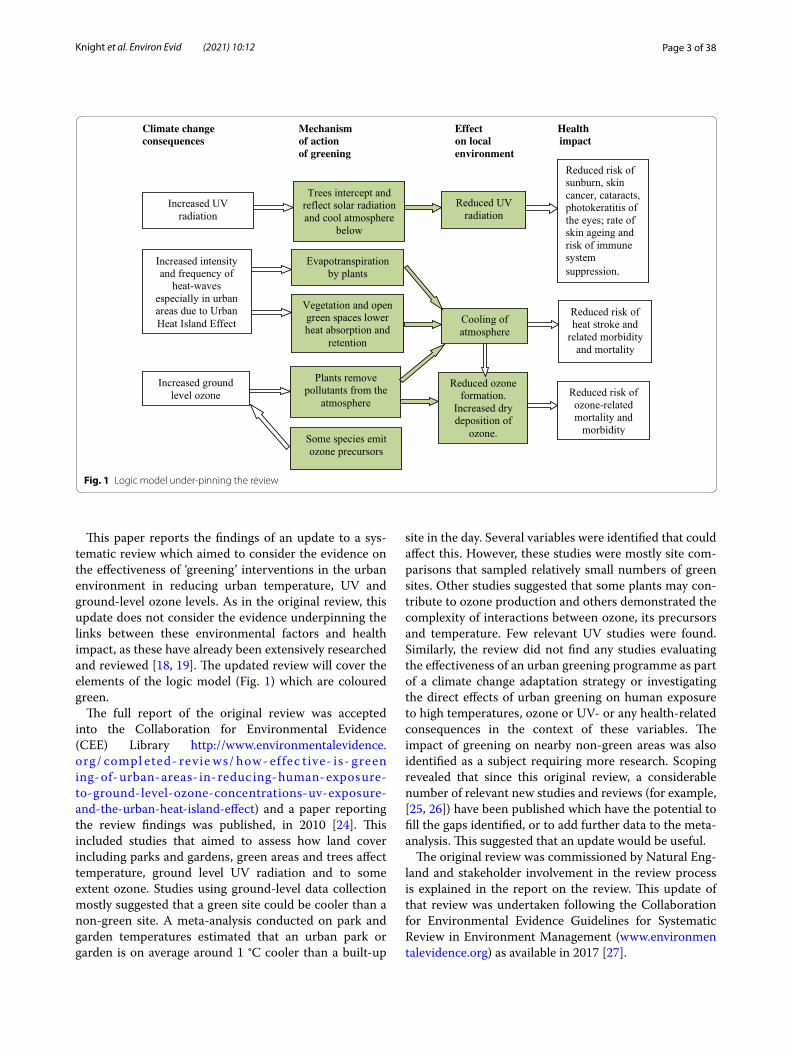
One strategy that has been proposed for adaptation to these predicted effects of climate change on health is to increase the abundance and cover of vegetation in cit-ies and to increase public access to these ‘green’ areas [14–19]. The hypothesis, as depicted in the simple logic model outlined in Fig. 1, is that greening urban areas could counter some of the health consequences of cli-mate change through, for instance, shading by trees potentially reducing human exposure to high tempera-tures and UV radiation [20–22]. Vegetation may reduce ozone levels by absorbing and trapping ozone precur-sors and pollutants [9] and may provide a cooling effect through processes such as evapotranspiration and reflec-tion of radiation [23]. However, given pollen release and the potential of trees to emit BVOCs, ozone precursors, the overall impact of green areas on air pollution levels in urban areas during heatwaves [4, 9] may demonstrate a more complex picture and careful consideration needs to be given to the design of urban green space to maximise health benefits whilst minimising negative impacts.
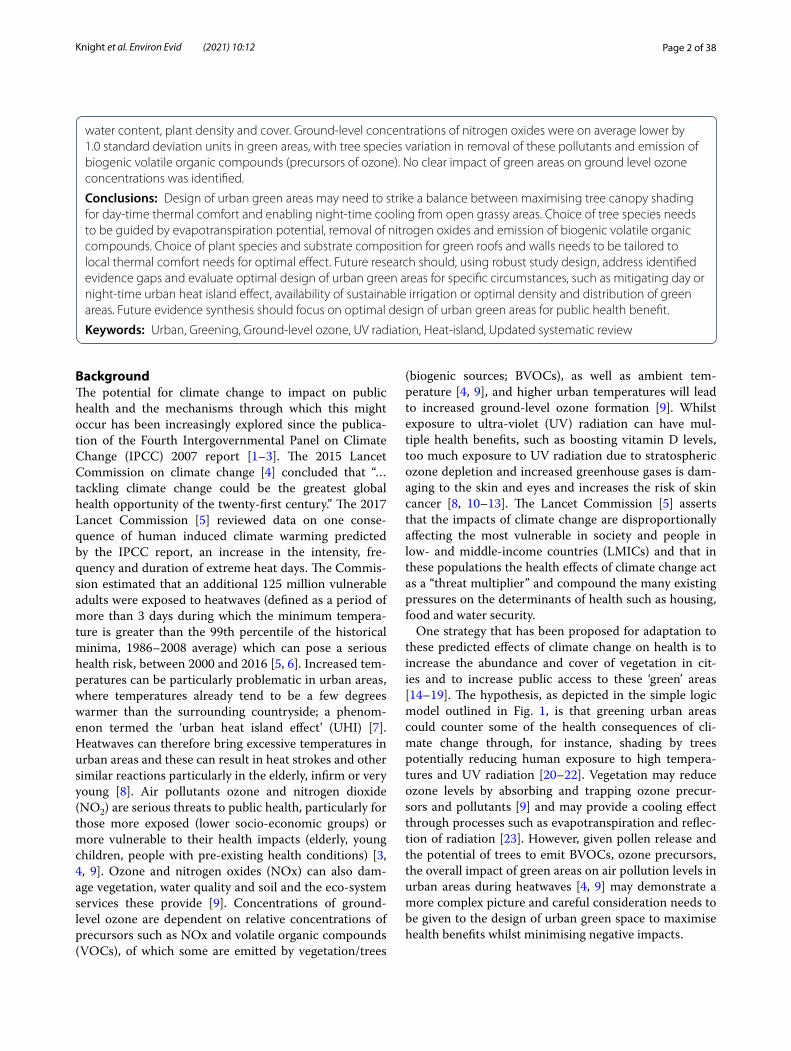
water content, plant density and cover. Ground-level concentrations of nitrogen oxides were on average lower by 1.0 standard deviation units in green areas, with tree species variation in removal of these pollutants and emission of biogenic volatile organic compounds (precursors of ozone). No clear impact of green areas on ground level ozone concentrations was identified.
Conclusions: Design of urban green areas may need to strike a balance between maximising tree canopy shading for day-time thermal comfort and enabling night-time cooling from open grassy areas. Choice of tree species needs to be guided by evapotranspiration potential, removal of nitrogen oxides and emission of biogenic volatile organic compounds. Choice of plant species and substrate composition for green roofs and walls needs to be tailored to local thermal comfort needs for optimal effect. Future research should, using robust study design, address identified evidence gaps and evaluate optimal design of urban green areas for specific circumstances, such as mitigating day or night-time urban heat island effect, availability of sustainable irrigation or optimal density and distribution of green areas. Future evidence synthesis should focus on optimal design of urban green areas for public health benefit.
Keywords: Urban, Greening, Ground-level ozone, UV radiation, Heat-island, Updated systematic review
Page 3 of 38Knight et al. Environ Evid (2021) 10:12
This paper reports the findings of an update to a sys-tematic review which aimed to consider the evidence on the effectiveness of ‘greening’ interventions in the urban environment in reducing urban temperature, UV and ground-level ozone levels. As in the original review, this update does not consider the evidence underpinning the links between these environmental factors and health impact, as these have already been extensively researched and reviewed [18, 19]. The updated review will cover the elements of the logic model (Fig. 1) which are coloured green.
The full report of the original review was accepted into the Collaboration for Environmental Evidence (CEE) Library http:// www. envir onmen talev idence. org/ compl eted- revie ws/ how- effec tive- is- green ing- of- urban- areas- in- reduc ing- human- expos ure- to- ground- level- ozone- conce ntrat ions- uv- expos ure- and- the- urban- heat- island- effect) and a paper reporting the review findings was published, in 2010 [24]. This included studies that aimed to assess how land cover including parks and gardens, green areas and trees affect temperature, ground level UV radiation and to some extent ozone. Studies using ground-level data collection mostly suggested that a green site could be cooler than a non-green site. A meta-analysis conducted on park and garden temperatures estimated that an urban park or garden is on average around 1 °C cooler than a built-up
site in the day. Several variables were identified that could affect this. However, these studies were mostly site com-parisons that sampled relatively small numbers of green sites. Other studies suggested that some plants may con-tribute to ozone production and others demonstrated the complexity of interactions between ozone, its precursors and temperature. Few relevant UV studies were found. Similarly, the review did not find any studies evaluating the effectiveness of an urban greening programme as part of a climate change adaptation strategy or investigating the direct effects of urban greening on human exposure to high temperatures, ozone or UV- or any health-related consequences in the context of these variables. The impact of greening on nearby non-green areas was also identified as a subject requiring more research. Scoping revealed that since this original review, a considerable number of relevant new studies and reviews (for example, [25, 26]) have been published which have the potential to fill the gaps identified, or to add further data to the meta-analysis. This suggested that an update would be useful.
The original review was commissioned by Natural Eng-land and stakeholder involvement in the review process is explained in the report on the review. This update of that review was undertaken following the Collaboration for Environmental Evidence Guidelines for Systematic Review in Environment Management (www. envir onmen talev idence. org) as available in 2017 [27].
Fig. 1 Logic model under-pinning the review
Page 4 of 38Knight et al. Environ Evid (2021) 10:12
Objective of the reviewFor this update review we consider the same primary question as the original review [28]. The secondary ques-tions reflect the evidence gaps identified in that review.
Primary questionHow effective is ‘greening’ of urban areas in reducing human exposure to ground-level ozone concentrations, UV exposure and the ‘urban heat island effect’?
Population: urban populations.Intervention: urban green spaces/vegetation.Comparators: urban areas with little or no vegetation.Outcomes: urban temperatures or urban ‘heat island effect’, urban ground-level ozone or NOx, ground-level UV radiation, human thermal comfort or other proxy measures of human heat-related health or well-being.
Secondary questions
What is the best design—abundance, distribution and type of vegetation—for an urban greening programme?What factors might modify the success of an urban green-ing programme? For instance, regional climate.
MethodsThe protocol for this review has been published [28]. Any deviations from the protocol have been stated in the relevant methods sections. Deviations occur in “Search for articles”, “Screening process”, “Study validity assess-ment”, “Potential effect modifiers/reasons for heteroge-neity”, sections. Otherwise, the process followed for the update review was that set out in the protocol. Reporting standards for systematic evidence synthesis in environ-mental research (ROSES) were followed (https:// www. roses- repor ting. com/ syste matic- review- repor ts) (for checklist see "Supplementary information").
Search for articlesA search of both published and unpublished sources was conducted (in English) between 2nd February and 1st April 2016 in order to capture as comprehensive and unbiased a sample of the relevant literature as possible. The search strategy, as set out in the update review proto-col [28], followed that conducted for the original review but some changes were made to the databases searched to reflect current Public Health Wales searching practice and source availability (reflecting the 10 years since the original review was undertaken). Thus, Web of Science was not included as it was considered sufficient to use SCOPUS combined with OpenGrey as it provides access to over 700,000 bibliographical references and covers the specialities of Science, Technology, Biomedical Science,
Economics, Social Science and Humanities. Access to Geobase was not available to reviewers. This was not considered to affect the comprehensiveness of the search given the other databases searched (see “Other sources” section).
A three-step search process was used. First, an ini-tial scoping search of two key databases, SCOPUS and Medline, was undertaken followed by analysis of the text-words in relevant titles and abstracts and of the index terms used to describe the papers. This resulted in additional search terms being added to those set out in the protocol (see “Search terms and strings” section).
A second search was then undertaken, across all included databases, using all identified keywords and index terms.
The third step involved examination of reference lists for any literature reviews found by the search in order to identify any new records.
Due to competing priorities for the review team, work on the review had to be halted and was resumed between 22nd and 31st January 2018 when the search was re-run to capture any relevant research published since the end of the 2016 search. The results of the two searches are reported separately.
Search sourcesEleven databases of different disciplines (environmental, ecological, clinical/medical) were searched:
1. Medline 2. SCOPUS 3. GeoRef/PROQUEST database: Environmental sci-
ences and pollution management sub-files (Bangor University)
4. CAB (Commonwealth Agricultural Bureau) 5. Directory of Open Access Journals 6. COPAC: joint catalogue of academic libraries 7. Index to theses online 8. Greenfile 9. AGRICOLA 10. Social Sciences in Forestry 11. SIGLE (Open Grey)
Search terms and stringsThe searches used free text, keywords and subject indexing and combined Greening and Climate change sets of terms. Search strings were adapted for the different databases to allow for differing wild cards (*, $, ?), word truncation (*) and proximity operators (“−”, adj, n, (−)). Details of search terms and strings are given in Appendix A.
Page 5 of 38Knight et al. Environ Evid (2021) 10:12
Other sourcesWebsites of 28 relevant organisations were searched (Appendix B).
Hand searching of electronic table of contents was car-ried out for the following journals as that content was not comprehensively included in any of the databases searched:
• Urban forestry and urban greening• Landscape and urban planning• Building and environment
Search limitsPapers published since the conclusion of the search for the original review in December 2007 were consid-ered for inclusion in the review. No language limit was applied. No document type or study type limits were applied. No country limits were applied.
Search comprehensivenessAs a test of search comprehensiveness, reference lists of any relevant literature or systematic reviews identified by the search were examined, to identify any relevant arti-cles that had been missed by the searches. Citations for these reviews are included in the list of excluded studies (see “Review descriptive statistics” section). Nine articles were identified from this check, of which, only three were relevant and were included in the review.
Search findingsCitations captured from computerised databases were imported into Reference Manager and duplicate entries were removed. Citations identified by website and other searches were manually added into Reference Manager. Subsequently, files were transferred to EndNote as Refer-ence Manager was no longer being supported or updated.
Article screening and eligibility criteriaEligibility criteriaArticle screening using the following eligibility criteria was undertaken for all articles retrieved. Each article had to satisfy all the following criteria in order to be included at each screening stage (articles for which there was no abstract were screened at title and full text). In cases of uncertainty about relevance the reviewers tended towards inclusion.
Relevant populations: Human populations in urban areas in any geographic location.Relevant interventions: Creation, enhancement or presence of green spaces in urban areas.
Creation or enhancement of different types of urban greening.Enhancement of green spaces refers to any interven-tions that have changed the management of existing green spaces to increase the abundance of vegetation or area covered (e.g., additional planting). Green spaces would include any form of semi-natural environment (e.g., parks; green roofs) or plant species (e.g., trees) in urban areas. Urban areas would include any town or city including suburbs.Relevant comparisons: The presence of green space versus the absence of green space.Creation versus no creation of green spaces.Enhancement versus no enhancement of green spaces. One type of urban greening versus a different type of urban greening.Relevant outcomes: Changes in quantitative measurements of ground-level air temperature (AT), surface temperature (ST), soil temperature (soil T), UV radiation, ground-level ozone or its precursors (NOx and VOCs) and human thermal comfort. Human exposures to these variables or health-related outcomes in an environmental context of changes in these variables, including measures of human thermal comfort.Types of study design: Only studies with a relevant comparator were included. Studies which did not provide empirical data were excluded (i.e., modelling studies).
Screening processNone of the review team members authored articles con-sidered within the review.
The protocol for this update review [28] states that the Kappa statistic would be calculated to measure the level of agreement in article screening between review-ers. Following published updates to the CEE systematic review guidelines [27], which acknowledge the subjective nature of screener agreement statistics such as Kappa, it was decided not to do this, but to discuss all discrepan-cies identified during the screening process and if neces-sary, to clarify the interpretation of the eligibility criteria. If systematic differences in screening criteria application were apparent the protocol required clarification of crite-ria application and re-screening of all citations.
For the 2016 search, at title screening stage, one reviewer (SK) screened 100% of the citations and the sec-ond reviewer (TK) independently screened a randomly selected 5% sample (168 of 2774 titles after duplicates removed) of these. In addition, to minimise ‘false exclu-sions’ at this early screening stage, the second reviewer
Page 6 of 38Knight et al. Environ Evid (2021) 10:12
also screened all titles excluded by the first reviewer (1865 titles). No systematic differences in application of interpretation of the inclusion criteria at title were found. At the abstract screening stage one reviewer (SP) screened 100% of abstracts and a second reviewer (TK) independently screened a 10% random sample (83 of 826). No systematic differences in application of interpre-tation of the inclusion criteria were identified. Due to the high number of articles retained for full text screening a change to the protocol was made whereby two reviewers (TK and SP) split the list of articles into two halves (arti-cles were listed in alphabetical order) and each screened the first 10 articles of their set and then, independently, the first 10 of the other set. Comparison and discussion of include/exclude decisions did not reveal any differ-ences between reviewers. Each reviewer then proceeded to screen the rest of the articles in their set and a ran-dom 10% sample of the other set. In total, 60 of 611 arti-cles were screened by both reviewers. Comparison and discussion revealed a systematic difference between the two reviewers in how one of the inclusion criteria (type of comparator) was being interpreted. Following dis-cussion and reclarification of the screening criterion, one reviewer (SP) rescreened all affected full texts. The review team communicated throughout the screening process to discuss any ambiguous articles and to make a joint decision.
For the 2018 update search one reviewer (SP) screened all titles. Formal consistency checking at title was not considered necessary given the extensive between-reviewer cross-checking and discussion of inclusion/exclusion criteria that had been undertaken on the 2016 search results. However, any uncertainties were dis-cussed with the second reviewer (TK) and a joint deci-sion made, as screening progressed. Abstract and full text screening were carried out as for the 2016 search, with SP acting as the first reviewer and TK checking 10% random samples of the articles at abstract and full text screening (40 of 408 abstracts and 24 of 241 full texts). Comparison and discussion of decisions at each screening stage did not reveal any systematic differences between reviewers.
All the following review processes involve articles included in the original 2010 review as well as articles included from the 2016 and 2018 searches.
Where there were multiple articles published on the same piece of research (study), each article was screened separately but thereafter, only one of these articles (either the most recent or that reporting the most relevant data) was included in the review processes as one study.
Study validity assessmentThe protocol for this update review [28] states that the methodology for study validity assessment will follow
that of the original review. However, in order to follow updated CEE guidelines, a more systematic and transpar-ent approach with a focus on risk of bias was adopted for this update. The assessment focussed on internal valid-ity; risk of bias arising from study design or conduct, as relevant to the study designs used across included stud-ies. Conduct of the original review revealed that the most concerning sources of bias affecting the study design types employed were likely to be:
Selection bias: Randomisation not employed to allocate treatment in experimental studies.Detection bias: Methods for data collection differed between comparators; measurement/data collection equipment used at different times/sites not calibrated, observers manually recorded data but intra- or inter-observer variation not checked.Performance bias: Differences in treatment between comparators in experimental studies, inappropriate choice of comparators in sites studies (potential ‘con-tamination’ of, for example, one type of greening with another or with non-green areas).
Data relevant to assessment of risk of bias were extracted for each included study as part of the data extraction process and were used to generate an overall study validity (risk of bias) grade (see Box 1).
Box 1
Criteria for study validity (risk of bias) Grade
Randomised experimental study design with no likely selection, detection or performance bias, or confounding
Low risk of bias
Non-randomised experimental study or site comparison study with no likely selec-tion, performance or detection bias and confounding considered. Randomised experimental study where detection bias was considered possible
Moderate risk of bias
Non-randomised experimental study or site comparison studies (including studies where data were collected at different points along a traverse and population correlation stud-ies) where performance or detection bias was considered possible, or confounding has not been considered
High risk of bias
Site comparison, traverse or population correlation studies where performance bias, detection bias and confounding were considered probable or where there was insufficient/very poor reporting of methods to allow assessment of bias
Very high risk of bias
Page 7 of 38Knight et al. Environ Evid (2021) 10:12
To pilot test application of the assessment grad-ing scheme two reviewers (TK and SP) independently assessed a 10% random sample (15/154) of studies that had been included at full text from the 2016 search. Com-parison of study validity grades awarded revealed minor inconsistency between reviewers in how assessment had been undertaken in relation to one element of study design (one type of vegetation compared to another). Fol-lowing discussion, the grading protocol was re-clarified and one reviewer (TK) then graded the full set of studies, with discussion and agreement between the two review-ers of any further uncertainties as they arose.
For the 2018 update search, one reviewer (SP) assessed all included full texts with discussion of any uncertainties along the way with the second reviewer (TK). The sec-ond reviewer then independently checked 10 of 71 stud-ies. No systematic differences between reviewers were identified.
TK assessed all studies included from the original review (with reference to the critical appraisal that had been carried out for that review). Assessment of external validity was considered and piloted but not progressed as a study validity grading criterion because it did not dis-criminate between individual studies of the same type; threats to external validity were different between differ-ent types of study but the same within each type of study. In experimental studies which used green roof or wall plots or model streets, external validity was limited by the need for scaling up from small plots or models to full size. For all site comparison studies e.g., parks, caution is required in generalisation to other urban areas where key effect modifiers may differ.
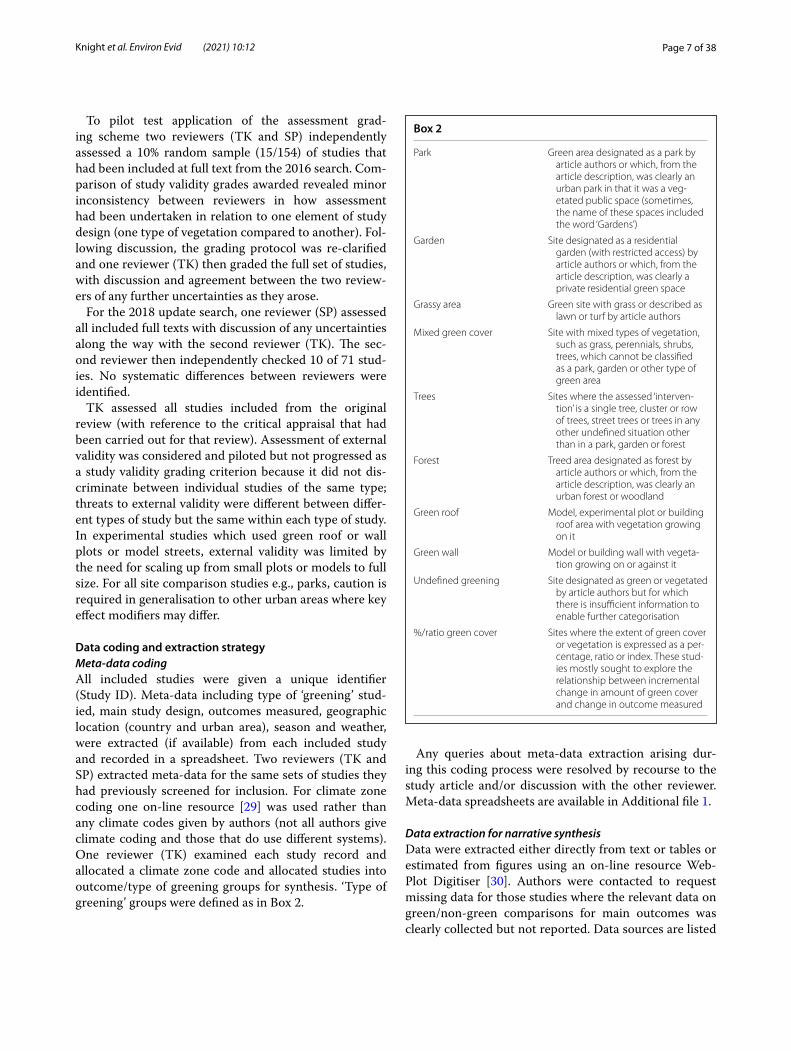
Data coding and extraction strategyMeta‑data codingAll included studies were given a unique identifier (Study ID). Meta-data including type of ‘greening’ stud-ied, main study design, outcomes measured, geographic location (country and urban area), season and weather, were extracted (if available) from each included study and recorded in a spreadsheet. Two reviewers (TK and SP) extracted meta-data for the same sets of studies they had previously screened for inclusion. For climate zone coding one on-line resource [29] was used rather than any climate codes given by authors (not all authors give climate coding and those that do use different systems). One reviewer (TK) examined each study record and allocated a climate zone code and allocated studies into outcome/type of greening groups for synthesis. ‘Type of greening’ groups were defined as in Box 2.
Box 2
Park Green area designated as a park by article authors or which, from the article description, was clearly an urban park in that it was a veg-etated public space (sometimes, the name of these spaces included the word ‘Gardens’)
Garden Site designated as a residential garden (with restricted access) by article authors or which, from the article description, was clearly a private residential green space
Grassy area Green site with grass or described as lawn or turf by article authors
Mixed green cover Site with mixed types of vegetation, such as grass, perennials, shrubs, trees, which cannot be classified as a park, garden or other type of green area
Trees Sites where the assessed ‘interven-tion’ is a single tree, cluster or row of trees, street trees or trees in any other undefined situation other than in a park, garden or forest
Forest Treed area designated as forest by article authors or which, from the article description, was clearly an urban forest or woodland
Green roof Model, experimental plot or building roof area with vegetation growing on it
Green wall Model or building wall with vegeta-tion growing on or against it
Undefined greening Site designated as green or vegetated by article authors but for which there is insufficient information to enable further categorisation
%/ratio green cover Sites where the extent of green cover or vegetation is expressed as a per-centage, ratio or index. These stud-ies mostly sought to explore the relationship between incremental change in amount of green cover and change in outcome measured
Any queries about meta-data extraction arising dur-ing this coding process were resolved by recourse to the study article and/or discussion with the other reviewer. Meta-data spreadsheets are available in Additional file 1.
Data extraction for narrative synthesisData were extracted either directly from text or tables or estimated from figures using an on-line resource Web-Plot Digitiser [30]. Authors were contacted to request missing data for those studies where the relevant data on green/non-green comparisons for main outcomes was clearly collected but not reported. Data sources are listed
Page 8 of 38Knight et al. Environ Evid (2021) 10:12
in (Additional file 1) for each included study. Narrative synthesis was undertaken for all outcome/type of green-ing sub-groups.
Data extraction for meta‑analysisAdditional file 1 identifies which studies were included in meta-analysis and Additional file 2 provides the sum-mary data from each study used in the meta-analyses. Missing data (e.g., sample size or variance) were calcu-lated or inferred where possible from the summary sta-tistics presented. Data on ground-level temperature, NOx and ozone were extracted from articles. For temperature, some studies reported AT, or ST or both. AT data were usually collected between 0.5 and 2.5 m above the surface and thus are more likely to represent the temperature felt by a person. Where available, AT data were extracted for parks and gardens, treed and grassy areas. ST data were most frequently reported for roof and walls studies and were therefore extracted for these meta-analyses. Where possible, data were extracted for the specific times of day when measurements were taken at green and non-green sites. The difference in temperature between the green and non-green sites were then calculated at each measurement time, controlling for diurnal variation in temperature. When the data were presented as a continuous time-series, the number of times at which temperature data were extracted was guided by how the data were presented, or at regular intervals of circa 2 h. In some cases, temperature data could only be extracted at a coarser resolution, e.g., daily averages or site average. Similarly, the data were used to calculate a mean temperature difference. When mul-tiple green and non-green sites were sampled, the mean temperature across all green sites and across all non-green sites was calculated, before the mean temperature differ-ence was calculated. Because all the data were presented in °C, they were not standardized by the standard deviation. This facilitated interpretation of the effect sizes since they were in the original units of the data. For each effect size a standard deviation of the temperature difference, based on the level at which the data were extracted, was calculated. Standard deviations were converted into standard errors by dividing by the square root of the number of separate (and assumed independent) measurement sites.
For NOx and ozone, data were not usually presented at multiple times, hence mean and standard deviation of values for green and non-green sites (instead of directly the mean and standard deviation of differences) were cal-culated. A standardized effect size was calculated using the compute.es package in R.
For all analyses, if the authors presented their data split by a modifier, e.g., season, the data and calculated effect sizes at the level that was presented were extracted. This sometimes produced multiple effect sizes from a study.
Consistency checking for data extractionData were extracted by two reviewers (KK, RR). A third reviewer (DB) oversaw the data extraction by each of the two reviewers to check for consistency. This reviewer also undertook the transformation of the data into effect sizes for meta-analysis and that process itself acted as a further check of the data extraction process. In addition, as an extra check for accuracy of data extraction, another reviewer (TK), checked the results of the meta-analysis against any summary or effect size data presented in the included studies. A small number of queries were raised by this process and these were resolved through discus-sion (TK and DB) and, where necessary, meta-analyses were re-run.
Potential effect modifiers/reasons for heterogeneityIn the original review protocol, a list of potential effect modifiers was compiled using a priori reasons for het-erogeneity and these were included in the update review protocol:
Type of urban ‘greening’ and vegetation.Geographic location (latitude/altitude/longitude). Degree of urbanisation (town or city, population density).Human state/activity. Extremity of the event (e.g., duration and intensity of a heatwave). Empirical/Modelling/Different types of modelling approaches.
However, it became clear during data extraction that many included studies did not report data for some of these, whereas other factors not hitherto listed, but dis-cussed in the original review report, were more relevant, particularly to the secondary questions being addressed by the update review and possibly, to external validity. A modified list was therefore compiled and these were then used in meta-regression to test for effect modification:
Type of comparatorPark sizeClimate zoneSeasonTime of dayStudy validity grade
Data synthesis and presentationDescriptive analysisDescriptive statistics were compiled for all included stud-ies using the extracted meta-data and presented either as simple frequency charts or ‘heatmaps’ which give a vis-ual, structural matrix of linkages between interventions (types of greening) and outcomes and between interven-tions and climate zone of intervention (study) location.
Page 9 of 38Knight et al. Environ Evid (2021) 10:12
Heatmaps were created using the package ggplot2 in R version 3.6.3.
Meta‑analysisRandom effects meta-analysis with calculation of Hedge’s g was carried out on subsets of data, following the meth-odology of the original review [24] to explore the overall effect of different greening interventions, e.g., park, forest, on temperature; in all cases greening intervention com-pared with non-green interventions (area of same urban conurbation without, or with very little, vegetation). Meta-analysis was also performed for studies measuring ozone or ozone precursors (nitrogen oxides) but due to small numbers of studies it was not possible to calculate overall effect sizes for different types of greening, rather, all types of greening were analysed together. To combine the effect sizes, the metaphor R package was used, spe-cifically, the rma.mv function for meta-analysis via mixed-effects models. This function allowed the inclusion of ‘study’ as a random effect to control for any pseudo-rep-lication (non-independence) issues arising from multiple effect sizes being extracted from the same study.
The model with only the intercept as a fixed effect was fitted first; calculating the overall average effect size and its 95% confidence intervals (CI) for each greening type. The effect was regarded as significant when the 95% CI did not contain zero.
Meta-regression to identify effect modifiers as fixed effects was then conducted. For each variable, the levels of the variable were reordered so that the level with the largest number of studies was the reference level. The dif-ferences in the other levels from this reference level were then tested using a z-test. The modifying effect of a cat-egorical explanatory variable on a particular effect size was only tested when there were at least five effect sizes available for each variable sub-group being compared (e.g., different climate zones, comparator types, study validity categories) to ensure that the results reflected a general pattern.
In the meta-analysis, study validity grades were con-verted into numerical scores; low risk: 0, moderate risk: 1, high risk: 2, very high risk: 3. Sensitivity analysis was undertaken to explore the effect of study validity by including then excluding studies with the highest risk of bias (score 3).
The R-codes used for the meta-analysis are given in Additional file 2.
Where undertaken, findings from quantitative data synthesis (meta-analysis) are presented alongside those from narrative synthesis for each outcome group (tem-perature, thermal comfort, solar radiation, ozone and precursors) in turn.
Distance‑dependent effects of parks and gardensTo analyse the extension of park or garden cooling effects into surrounding sites data from studies measuring tem-perature at increasing distance from a park or garden edge were extracted. For these studies, the mean tem-perature (across all measuring times) at each distance for each park or garden was extracted. To facilitate visualiza-tion of general patterns, the temperatures for each park or garden at each distance were standardized by subtract-ing the mean temperature at the park or garden edge, or the nearest distance to it. To aggregate data across parks and gardens and studies, a mixed effect model with linear and quadratic fixed terms for distance and park and gar-den, nested within study as a random effect was applied, using the lme4 R package. Prediction intervals for how the temperature cooling effect changes with distance were generated using bootstrapping using the bootMer function. R-codes for this analysis are given in Additional file 2.
Publication biasTo examine publication bias funnel plots were produced and rank correlation tests for funnel plot asymmetry con-ducted using the ranktest in the metaphor package of R.
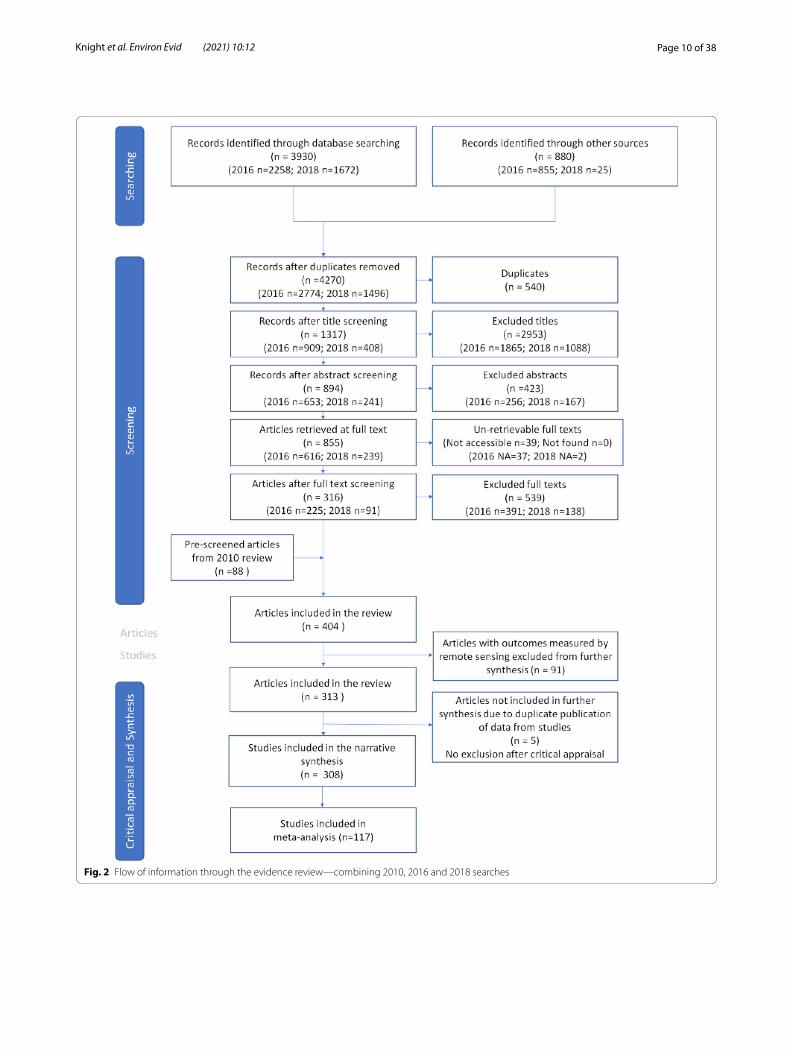
Review findingsReview descriptive statisticsThe results of the searching and article screening pro-cess are shown in a ROSES flow diagram in Fig. 2. As for the original review, articles reporting research employ-ing remote sensing technology for measurement of sur-face temperature were included but have not been taken further in the review process, due to the large scale of most of these types of studies and incomparability of temperature measured using this methodology with that of ground-based measurement; a list of these articles is given as Additional file 3.
A list of articles excluded or not available at full text, with reasons for exclusion, is available as Additional file 4.
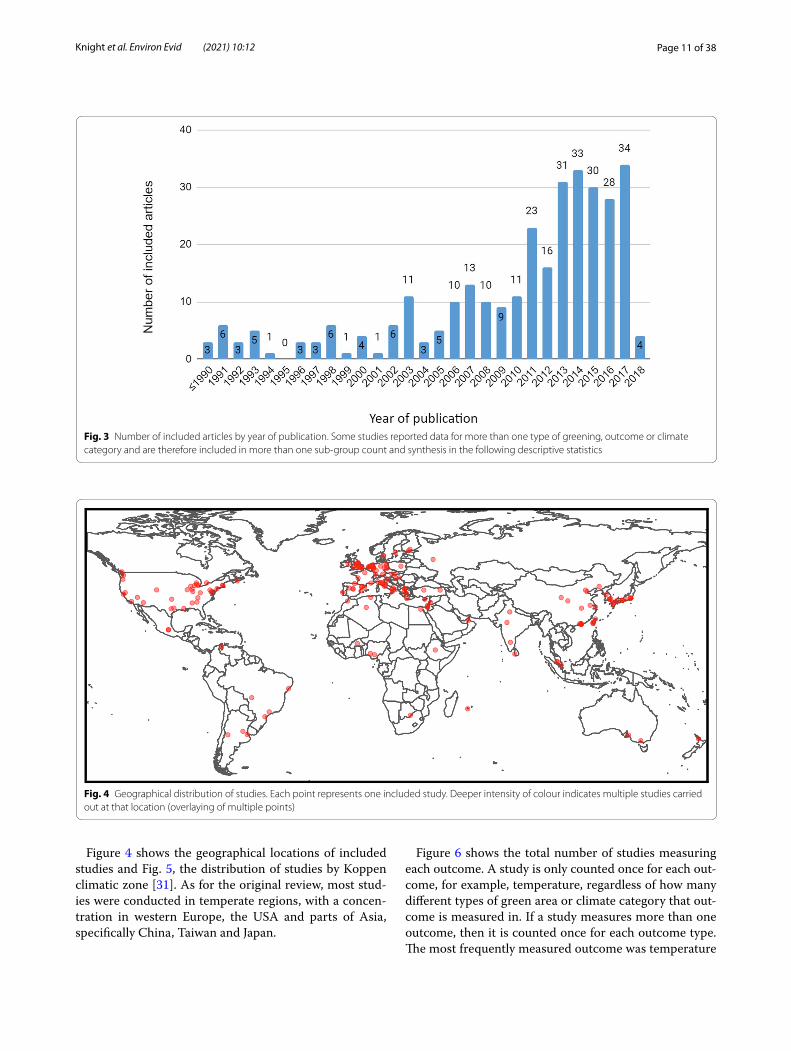
Since publication of the original review in 2010 there has been a noticeable increase in the number of relevant articles being published (Fig. 3). Note that the figure for 2018 is only for articles published up until 1st February 2018. In total, 313 articles, excluding the ‘remote sensing’ articles, were included in the update review; 88 from the original review; 154 from the 2016 search and 71 from the search in 2018. These 313 articles reported on 308 studies; there were five studies which were each reported on in two separate articles—only the earliest publication of each, or that reporting the most relevant data, was included in the synthesis.
Page 10 of 38Knight et al. Environ Evid (2021) 10:12
Fig. 2 Flow of information through the evidence review—combining 2010, 2016 and 2018 searches
Page 11 of 38Knight et al. Environ Evid (2021) 10:12
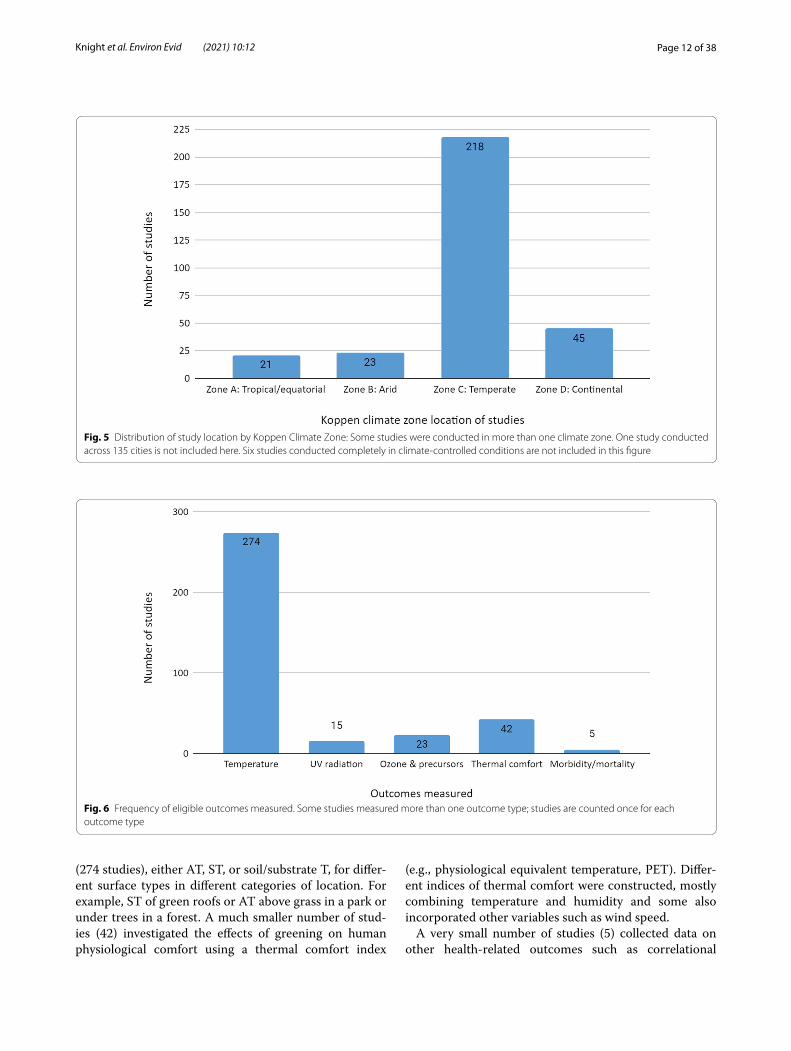
Figure 4 shows the geographical locations of included studies and Fig. 5, the distribution of studies by Koppen climatic zone [31]. As for the original review, most stud-ies were conducted in temperate regions, with a concen-tration in western Europe, the USA and parts of Asia, specifically China, Taiwan and Japan.
Figure 6 shows the total number of studies measuring each outcome. A study is only counted once for each out-come, for example, temperature, regardless of how many different types of green area or climate category that out-come is measured in. If a study measures more than one outcome, then it is counted once for each outcome type. The most frequently measured outcome was temperature
Fig. 3 Number of included articles by year of publication. Some studies reported data for more than one type of greening, outcome or climate category and are therefore included in more than one sub-group count and synthesis in the following descriptive statistics
Fig. 4 Geographical distribution of studies. Each point represents one included study. Deeper intensity of colour indicates multiple studies carried out at that location (overlaying of multiple points)
Page 12 of 38Knight et al. Environ Evid (2021) 10:12
(274 studies), either AT, ST, or soil/substrate T, for differ-ent surface types in different categories of location. For example, ST of green roofs or AT above grass in a park or under trees in a forest. A much smaller number of stud-ies (42) investigated the effects of greening on human physiological comfort using a thermal comfort index
(e.g., physiological equivalent temperature, PET). Differ-ent indices of thermal comfort were constructed, mostly combining temperature and humidity and some also incorporated other variables such as wind speed.
A very small number of studies (5) collected data on other health-related outcomes such as correlational
Fig. 5 Distribution of study location by Koppen Climate Zone: Some studies were conducted in more than one climate zone. One study conducted across 135 cities is not included here. Six studies conducted completely in climate-controlled conditions are not included in this figure
Fig. 6 Frequency of eligible outcomes measured. Some studies measured more than one outcome type; studies are counted once for each outcome type
Page 13 of 38Knight et al. Environ Evid (2021) 10:12
studies investigating the relationship between the amount of green cover in an area and population health related statistics e.g., mortality. As for the original review, the number of studies investigating ground level ozone or ozone precursors (NOx, BVOCs) in green areas was also relatively low (23). Only 15 studies were found which measured the impact of greening on solar radiation in some form (some measured total solar long-wave radia-tion and others specifically measured UVA or B radia-tion). In the following analyses, studies which reported solar long-wave radiation are included in the UV cat-egory. Most (13) of these studies looked at the effect of shading by trees; two studied green roofs.
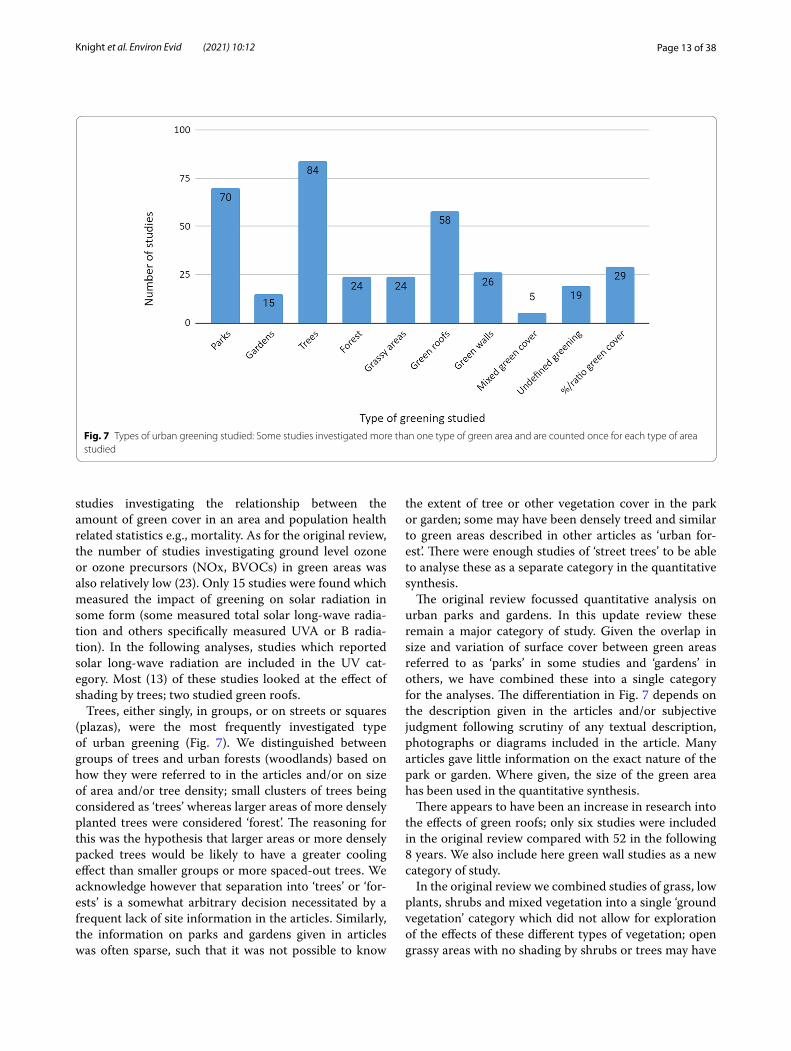
Trees, either singly, in groups, or on streets or squares (plazas), were the most frequently investigated type of urban greening (Fig. 7). We distinguished between groups of trees and urban forests (woodlands) based on how they were referred to in the articles and/or on size of area and/or tree density; small clusters of trees being considered as ‘trees’ whereas larger areas of more densely planted trees were considered ‘forest’. The reasoning for this was the hypothesis that larger areas or more densely packed trees would be likely to have a greater cooling effect than smaller groups or more spaced-out trees. We acknowledge however that separation into ‘trees’ or ‘for-ests’ is a somewhat arbitrary decision necessitated by a frequent lack of site information in the articles. Similarly, the information on parks and gardens given in articles was often sparse, such that it was not possible to know
the extent of tree or other vegetation cover in the park or garden; some may have been densely treed and similar to green areas described in other articles as ‘urban for-est’. There were enough studies of ‘street trees’ to be able to analyse these as a separate category in the quantitative synthesis.
The original review focussed quantitative analysis on urban parks and gardens. In this update review these remain a major category of study. Given the overlap in size and variation of surface cover between green areas referred to as ‘parks’ in some studies and ‘gardens’ in others, we have combined these into a single category for the analyses. The differentiation in Fig. 7 depends on the description given in the articles and/or subjective judgment following scrutiny of any textual description, photographs or diagrams included in the article. Many articles gave little information on the exact nature of the park or garden. Where given, the size of the green area has been used in the quantitative synthesis.
There appears to have been an increase in research into the effects of green roofs; only six studies were included in the original review compared with 52 in the following 8 years. We also include here green wall studies as a new category of study.
In the original review we combined studies of grass, low plants, shrubs and mixed vegetation into a single ‘ground vegetation’ category which did not allow for exploration of the effects of these different types of vegetation; open grassy areas with no shading by shrubs or trees may have
Fig. 7 Types of urban greening studied: Some studies investigated more than one type of green area and are counted once for each type of area studied
Page 14 of 38Knight et al. Environ Evid (2021) 10:12
a different effect on temperature than more shaded green areas. For this update review there were enough stud-ies to be able to distinguish between studies of grassy areas (fields, lawns etc.) (24 studies), mixed low vegeta-tion cover such as grass, perennial plants and shrubs (5 studies), green areas for which we had no details of type of greening (19) (‘green area undefined’ category) and 29 studies which compared areas with different percentages or other ratio or index of mixed green cover.
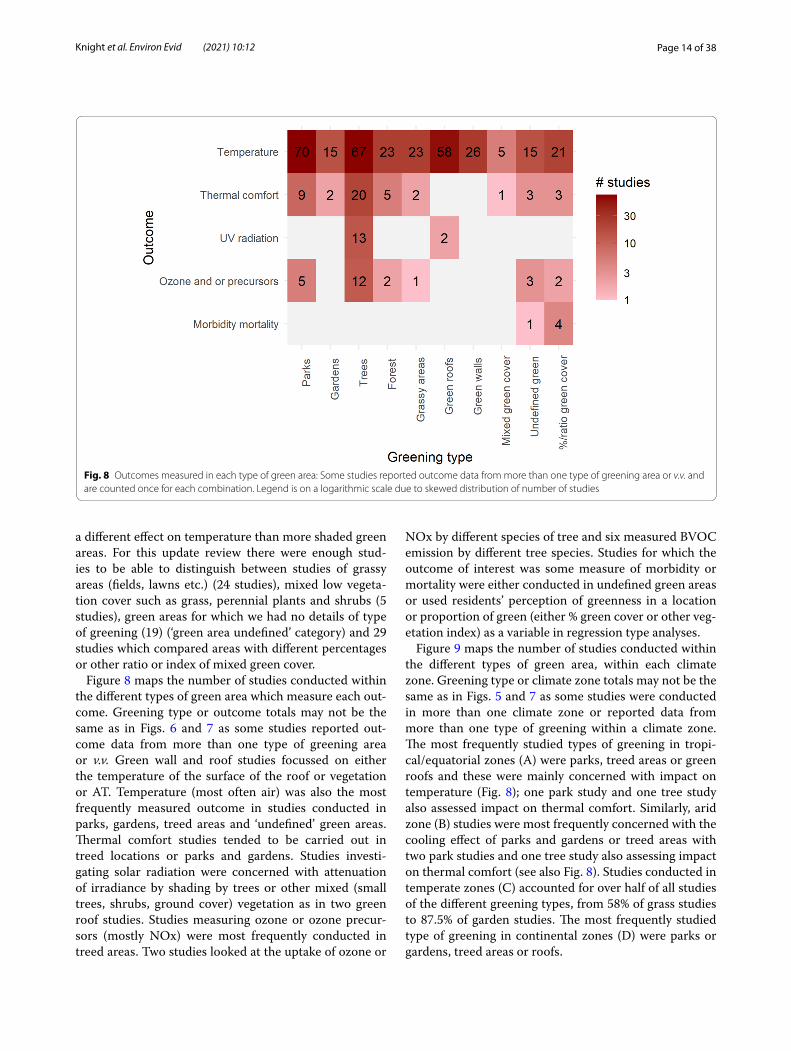
Figure 8 maps the number of studies conducted within the different types of green area which measure each out-come. Greening type or outcome totals may not be the same as in Figs. 6 and 7 as some studies reported out-come data from more than one type of greening area or v.v. Green wall and roof studies focussed on either the temperature of the surface of the roof or vegetation or AT. Temperature (most often air) was also the most frequently measured outcome in studies conducted in parks, gardens, treed areas and ‘undefined’ green areas. Thermal comfort studies tended to be carried out in treed locations or parks and gardens. Studies investi-gating solar radiation were concerned with attenuation of irradiance by shading by trees or other mixed (small trees, shrubs, ground cover) vegetation as in two green roof studies. Studies measuring ozone or ozone precur-sors (mostly NOx) were most frequently conducted in treed areas. Two studies looked at the uptake of ozone or
NOx by different species of tree and six measured BVOC emission by different tree species. Studies for which the outcome of interest was some measure of morbidity or mortality were either conducted in undefined green areas or used residents’ perception of greenness in a location or proportion of green (either % green cover or other veg-etation index) as a variable in regression type analyses.
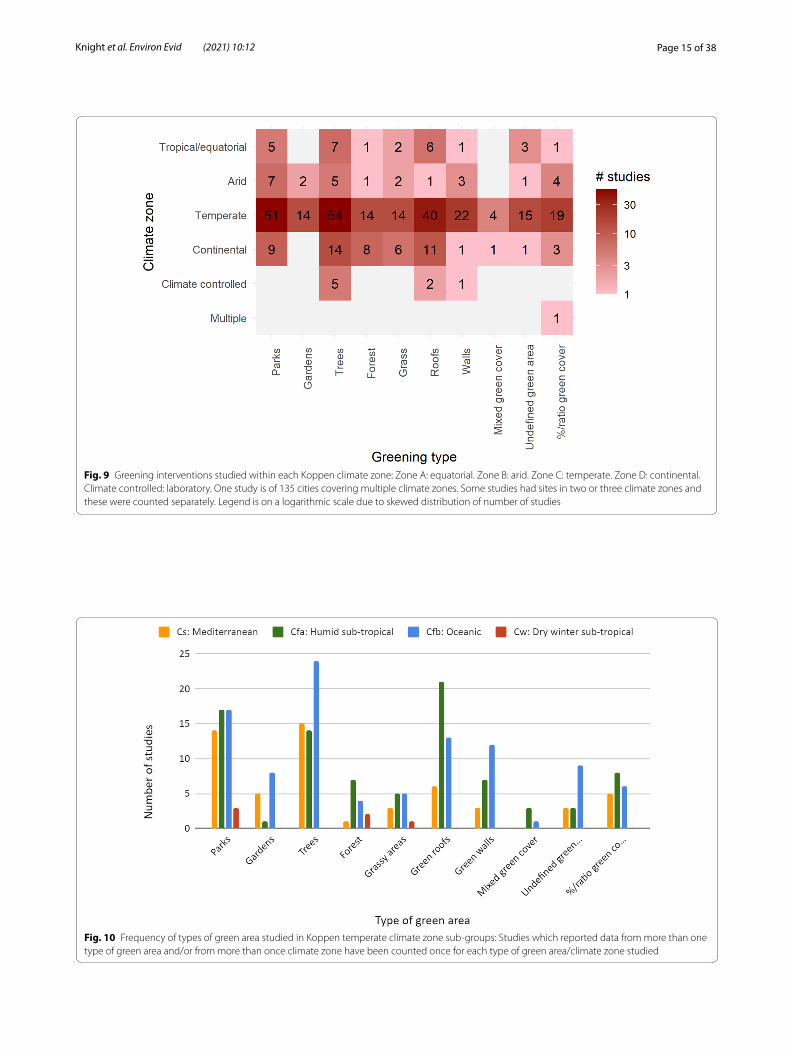
Figure 9 maps the number of studies conducted within the different types of green area, within each climate zone. Greening type or climate zone totals may not be the same as in Figs. 5 and 7 as some studies were conducted in more than one climate zone or reported data from more than one type of greening within a climate zone. The most frequently studied types of greening in tropi-cal/equatorial zones (A) were parks, treed areas or green roofs and these were mainly concerned with impact on temperature (Fig. 8); one park study and one tree study also assessed impact on thermal comfort. Similarly, arid zone (B) studies were most frequently concerned with the cooling effect of parks and gardens or treed areas with two park studies and one tree study also assessing impact on thermal comfort (see also Fig. 8). Studies conducted in temperate zones (C) accounted for over half of all studies of the different greening types, from 58% of grass studies to 87.5% of garden studies. The most frequently studied type of greening in continental zones (D) were parks or gardens, treed areas or roofs.
Fig. 8 Outcomes measured in each type of green area: Some studies reported outcome data from more than one type of greening area or v.v. and are counted once for each combination. Legend is on a logarithmic scale due to skewed distribution of number of studies
Page 15 of 38Knight et al. Environ Evid (2021) 10:12
Fig. 9 Greening interventions studied within each Koppen climate zone: Zone A: equatorial. Zone B: arid. Zone C: temperate. Zone D: continental. Climate controlled: laboratory. One study is of 135 cities covering multiple climate zones. Some studies had sites in two or three climate zones and these were counted separately. Legend is on a logarithmic scale due to skewed distribution of number of studies
Fig. 10 Frequency of types of green area studied in Koppen temperate climate zone sub-groups: Studies which reported data from more than one type of green area and/or from more than once climate zone have been counted once for each type of green area/climate zone studied
Page 16 of 38Knight et al. Environ Evid (2021) 10:12
Figure 10 focusses in on climate zone C as this is the zone in which most included studies were located. It has nine sub-zones, with five represented in this review, vary-ing from Mediterranean (Cs zones), humid sub-tropical (Cfa), oceanic (Cfb) to dry-winter sub-tropical (Cwa and Cwb). Figure 10 shows that studies in Mediterranean zones were mostly conducted in parks or on treed areas (30/55) whereas the single most frequently studied type of greening in humid sub-tropical zones was green roofs (21/86). There were only six studies conducted in dry winter sub-tropical zones, half being in parks. Almost one third (28/99) of studies conducted in oceanic zone studies were of trees/treed areas.
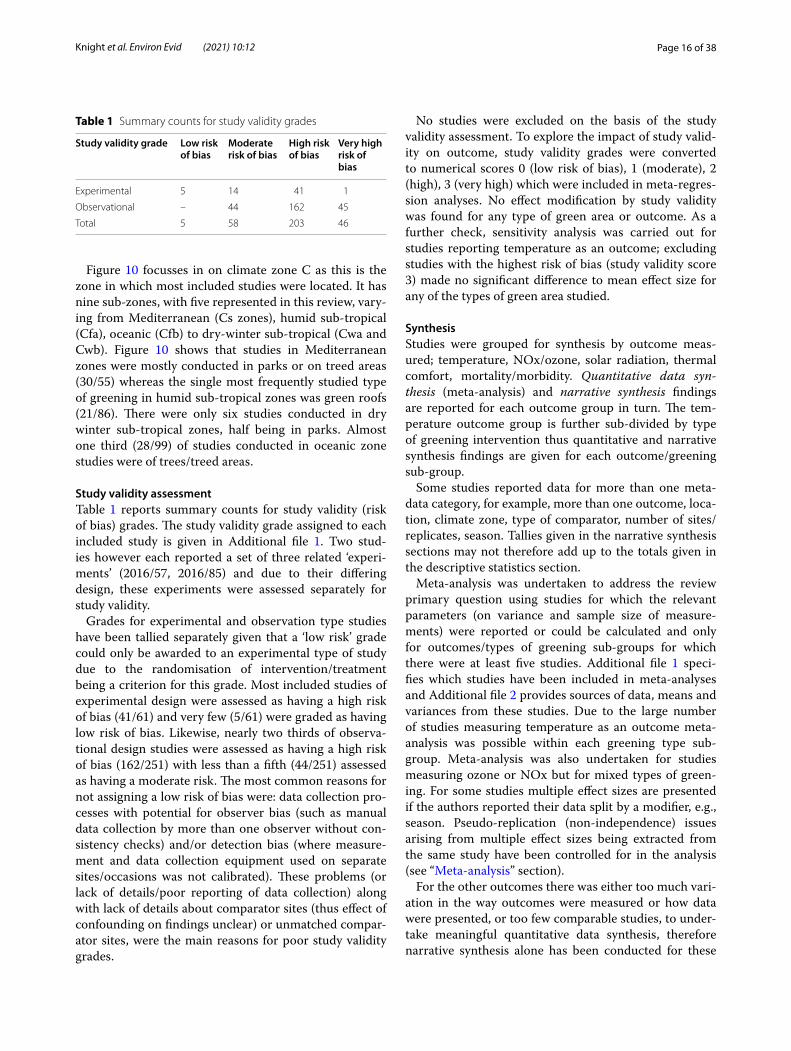
Study validity assessmentTable 1 reports summary counts for study validity (risk of bias) grades. The study validity grade assigned to each included study is given in Additional file 1. Two stud-ies however each reported a set of three related ‘experi-ments’ (2016/57, 2016/85) and due to their differing design, these experiments were assessed separately for study validity.
Grades for experimental and observation type studies have been tallied separately given that a ‘low risk’ grade could only be awarded to an experimental type of study due to the randomisation of intervention/treatment being a criterion for this grade. Most included studies of experimental design were assessed as having a high risk of bias (41/61) and very few (5/61) were graded as having low risk of bias. Likewise, nearly two thirds of observa-tional design studies were assessed as having a high risk of bias (162/251) with less than a fifth (44/251) assessed as having a moderate risk. The most common reasons for not assigning a low risk of bias were: data collection pro-cesses with potential for observer bias (such as manual data collection by more than one observer without con-sistency checks) and/or detection bias (where measure-ment and data collection equipment used on separate sites/occasions was not calibrated). These problems (or lack of details/poor reporting of data collection) along with lack of details about comparator sites (thus effect of confounding on findings unclear) or unmatched compar-ator sites, were the main reasons for poor study validity grades.
No studies were excluded on the basis of the study validity assessment. To explore the impact of study valid-ity on outcome, study validity grades were converted to numerical scores 0 (low risk of bias), 1 (moderate), 2 (high), 3 (very high) which were included in meta-regres-sion analyses. No effect modification by study validity was found for any type of green area or outcome. As a further check, sensitivity analysis was carried out for studies reporting temperature as an outcome; excluding studies with the highest risk of bias (study validity score 3) made no significant difference to mean effect size for any of the types of green area studied.
SynthesisStudies were grouped for synthesis by outcome meas-ured; temperature, NOx/ozone, solar radiation, thermal comfort, mortality/morbidity. Quantitative data syn-thesis (meta-analysis) and narrative synthesis findings are reported for each outcome group in turn. The tem-perature outcome group is further sub-divided by type of greening intervention thus quantitative and narrative synthesis findings are given for each outcome/greening sub-group.
Some studies reported data for more than one meta-data category, for example, more than one outcome, loca-tion, climate zone, type of comparator, number of sites/replicates, season. Tallies given in the narrative synthesis sections may not therefore add up to the totals given in the descriptive statistics section.
Meta-analysis was undertaken to address the review primary question using studies for which the relevant parameters (on variance and sample size of measure-ments) were reported or could be calculated and only for outcomes/types of greening sub-groups for which there were at least five studies. Additional file 1 speci-fies which studies have been included in meta-analyses and Additional file 2 provides sources of data, means and variances from these studies. Due to the large number of studies measuring temperature as an outcome meta-analysis was possible within each greening type sub-group. Meta-analysis was also undertaken for studies measuring ozone or NOx but for mixed types of green-ing. For some studies multiple effect sizes are presented if the authors reported their data split by a modifier, e.g., season. Pseudo-replication (non-independence) issues arising from multiple effect sizes being extracted from the same study have been controlled for in the analysis (see “Meta-analysis” section).
For the other outcomes there was either too much vari-ation in the way outcomes were measured or how data were presented, or too few comparable studies, to under-take meaningful quantitative data synthesis, therefore narrative synthesis alone has been conducted for these
Table 1 Summary counts for study validity grades
Study validity grade Low risk of bias
Moderate risk of bias
High risk of bias
Very high risk of bias
Experimental 5 14 41 1
Observational – 44 162 45
Total 5 58 203 46
Page 17 of 38Knight et al. Environ Evid (2021) 10:12
outcome/greening type sub-groups. Contextual infor-mation for all included studies is in Additional file 1 and data extracted for the narrative synthesis is provided in Additional file 5. Both Additional files 1 and 5 therefore supplement the narrative synthesis.
For those sub-groups in which meta-analysis has been undertaken, narrative synthesis focussed most on addressing the review secondary questions, with the aim of maximising use of the reported data and extending the findings of this update beyond those of the original review.
Temperature studiesEnough studies were available with temperature as an outcome measure for synthesis to be undertaken sepa-rately for different categories of urban greening.
Parks and gardens Some studies reported data from sites described as both parks and gardens and others, just parks or gardens. There was overlap between the sizes and nature of green spaces described in included articles as ‘parks’ or ‘gardens’ and these categories were combined in the synthesis. 75 stud-ies that addressed the effects of parks and gardens on temperature all used an observational study design that involved a site comparison and in over half (45) of stud-ies this comparison was based on one park or garden and one or more non-green urban sites; 19 studies included 2–5 parks or gardens; seven studies included 6–10 parks or gardens and four included over 10 parks or gardens; the overall range was 1–61 parks or gardens. In 39 studies comparison was with a non-green area close to/surround-ing the park or garden, in 34 studies the comparison was with a non-green site elsewhere in the urban area. In five studies comparison was between green and non-green areas within the park or garden and in two, parks or gar-dens were compared to other types of urban greening only. Only 17 studies were assessed as having moderate risk of bias, over half (38) studies were assessed as having a high risk and 20 as having a very high risk of bias. 11 park and garden studies reported ST and all except three reported AT.
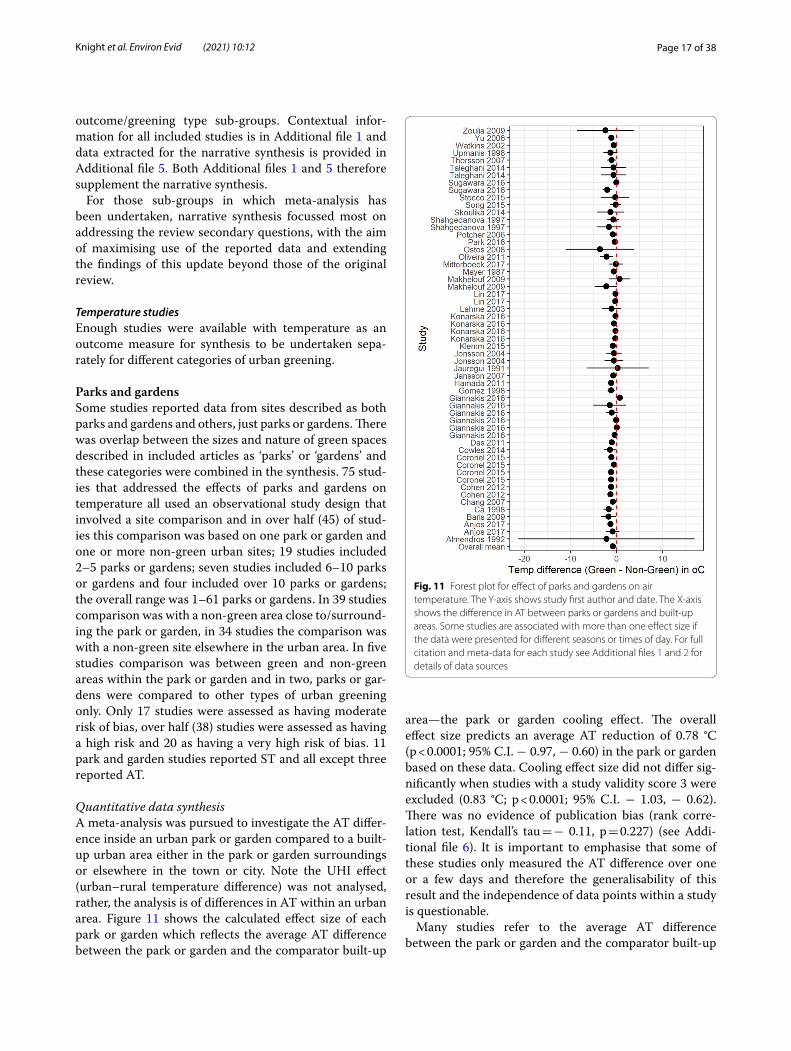
Quantitative data synthesisA meta-analysis was pursued to investigate the AT differ-ence inside an urban park or garden compared to a built-up urban area either in the park or garden surroundings or elsewhere in the town or city. Note the UHI effect (urban–rural temperature difference) was not analysed, rather, the analysis is of differences in AT within an urban area. Figure 11 shows the calculated effect size of each park or garden which reflects the average AT difference between the park or garden and the comparator built-up
area—the park or garden cooling effect. The overall effect size predicts an average AT reduction of 0.78 °C (p < 0.0001; 95% C.I. − 0.97, − 0.60) in the park or garden based on these data. Cooling effect size did not differ sig-nificantly when studies with a study validity score 3 were excluded (0.83 °C; p < 0.0001; 95% C.I. − 1.03, − 0.62). There was no evidence of publication bias (rank corre-lation test, Kendall’s tau = − 0.11, p = 0.227) (see Addi-tional file 6). It is important to emphasise that some of these studies only measured the AT difference over one or a few days and therefore the generalisability of this result and the independence of data points within a study is questionable.
Many studies refer to the average AT difference between the park or garden and the comparator built-up
Fig. 11 Forest plot for effect of parks and gardens on air temperature. The Y-axis shows study first author and date. The X-axis shows the difference in AT between parks or gardens and built-up areas. Some studies are associated with more than one effect size if the data were presented for different seasons or times of day. For full citation and meta-data for each study see Additional files 1 and 2 for details of data sources
Page 18 of 38Knight et al. Environ Evid (2021) 10:12
area as the ‘park cooling intensity’ (PCI). In this report we use the term ‘cooling effect’ for this phenomenon.
Effect modifiers Meta-regression was used to explore the effect of key variables (when there were at least five effect sizes in each variable sub-group being compared) on the effect size statistic:
Type of comparator: close park or garden surroundings c.f. elsewhere in cityClimate zoneSeasonTime of dayStudy validity scorePark or garden size
No significant effects were found for park or garden size, study validity score, comparator, season or time of day. Some effects of climate zone were found; cooling effect of parks or gardens was significantly (p = 0.037) greater in temperate zones (− 0.81 °C; 95% C.I. − 1.00, − 0.61, p < 0.0001) compared with arid zones (− 0.1 °C; 95% C.I. − 0.74, 0.54) and within the C zone, park or garden cooling effect was significantly (p = 0.022) greater in Mediterranean zones (− 1.25 °C; 95% C.I. − 1.68, − 0.82, p < 0.0001) than in oceanic/humid sub-tropical zones (− 0.69 °C; 95% C.I. − 0.90, − 0.49, p < 0.0001).
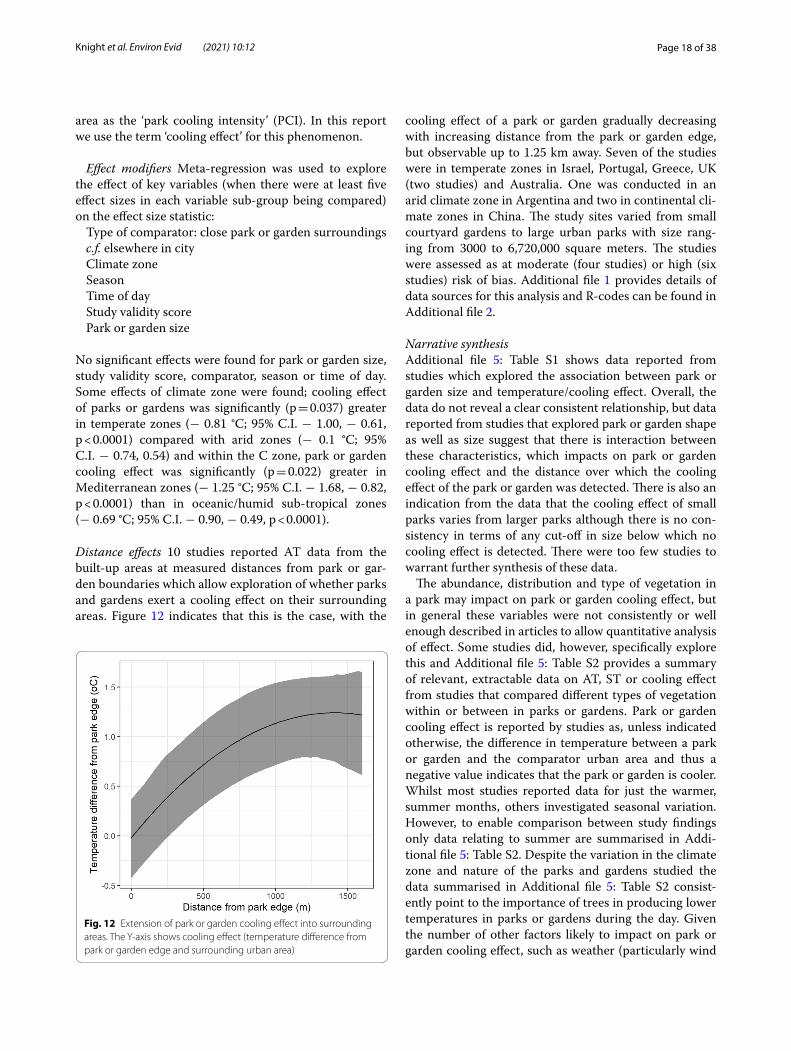
Distance effects 10 studies reported AT data from the built-up areas at measured distances from park or gar-den boundaries which allow exploration of whether parks and gardens exert a cooling effect on their surrounding areas. Figure 12 indicates that this is the case, with the
cooling effect of a park or garden gradually decreasing with increasing distance from the park or garden edge, but observable up to 1.25 km away. Seven of the studies were in temperate zones in Israel, Portugal, Greece, UK (two studies) and Australia. One was conducted in an arid climate zone in Argentina and two in continental cli-mate zones in China. The study sites varied from small courtyard gardens to large urban parks with size rang-ing from 3000 to 6,720,000 square meters. The studies were assessed as at moderate (four studies) or high (six studies) risk of bias. Additional file 1 provides details of data sources for this analysis and R-codes can be found in Additional file 2.
Narrative synthesisAdditional file 5: Table S1 shows data reported from studies which explored the association between park or garden size and temperature/cooling effect. Overall, the data do not reveal a clear consistent relationship, but data reported from studies that explored park or garden shape as well as size suggest that there is interaction between these characteristics, which impacts on park or garden cooling effect and the distance over which the cooling effect of the park or garden was detected. There is also an indication from the data that the cooling effect of small parks varies from larger parks although there is no con-sistency in terms of any cut-off in size below which no cooling effect is detected. There were too few studies to warrant further synthesis of these data.
The abundance, distribution and type of vegetation in a park may impact on park or garden cooling effect, but in general these variables were not consistently or well enough described in articles to allow quantitative analysis of effect. Some studies did, however, specifically explore this and Additional file 5: Table S2 provides a summary of relevant, extractable data on AT, ST or cooling effect from studies that compared different types of vegetation within or between in parks or gardens. Park or garden cooling effect is reported by studies as, unless indicated otherwise, the difference in temperature between a park or garden and the comparator urban area and thus a negative value indicates that the park or garden is cooler. Whilst most studies reported data for just the warmer, summer months, others investigated seasonal variation. However, to enable comparison between study findings only data relating to summer are summarised in Addi-tional file 5: Table S2. Despite the variation in the climate zone and nature of the parks and gardens studied the data summarised in Additional file 5: Table S2 consist-ently point to the importance of trees in producing lower temperatures in parks or gardens during the day. Given the number of other factors likely to impact on park or garden cooling effect, such as weather (particularly wind
Fig. 12 Extension of park or garden cooling effect into surrounding areas. The Y-axis shows cooling effect (temperature difference from park or garden edge and surrounding urban area)
Page 19 of 38Knight et al. Environ Evid (2021) 10:12
speed and direction), the presence of impervious sur-faces, water bodies or buildings within parks and gardens and the nature of the surrounding areas, the consistency of these observations suggests that the cooling effect of trees probably accounts for a significant proportion of the variability in park or garden cooling effect. There is less of a clear picture of the modifying effect on tem-perature, of type and abundance of park or garden veg-etation, during the night. Studies on trees, summarised in Additional file 5: Table S4, provide some insights into the mechanisms through which trees might affect park or garden microclimate during the day and night.
Additional file 5: Table S3 provides a summary of rel-evant, extractable data on AT, ST or park or garden cool-ing effect reported from studies that were not included in the meta-analysis or in Additional file 5: Table S2. Over-all, the data reported in Additional file 5: Tables S2 and S3 confirm the findings of the meta-analysis (Fig. 11) in that parks and gardens appear cooler than comparator urban areas during summer days and nights. The magnitude of the park or garden cooling effect varies considerably, from less than 1 to 4 °C (AT). Although publication bias and bias arising from lack of matched methods of data collection between measurement sites cannot be completely ruled as out as alternative explanations for these observations, this seems unlikely given that no significant publication bias was detected for the studies included in the meta-analysis and the consistency of observed effect is maintained if just the studies with a moderate risk of bias are considered.
Trees 67 observational studies exploring the effect of trees on temperature fell into two main groups, those investigating trees in streets or city squares/plazas (38 studies) or stud-ies of individual trees, rows or clusters of trees (33 stud-ies). Five studied locations with trees (no further defini-tion), one studied trees in pots and one studied a model of street canyons with trees. Some studied more than one of these tree categories. Nearly half (28) of tree studies meas-ured temperature in only 1 green site/replicate, 17 in 2–5 site/replicates and 18 in more than 5 sites/replicates. 27 studies compared temperature in and out of tree shade at the same site. In 14 studies the comparator was a matched site without trees, in 10 studies the comparator site was only partially matched or unmatched and in 7 studies the comparator was another type of green area. 12 studies were assessed as having a moderate risk of bias, four at a very high risk of bias, the remainder were assigned a high risk of bias grade.
Quantitative data synthesis29 tree studies were included in a meta-analysis to investigate the difference in AT in locations with, and
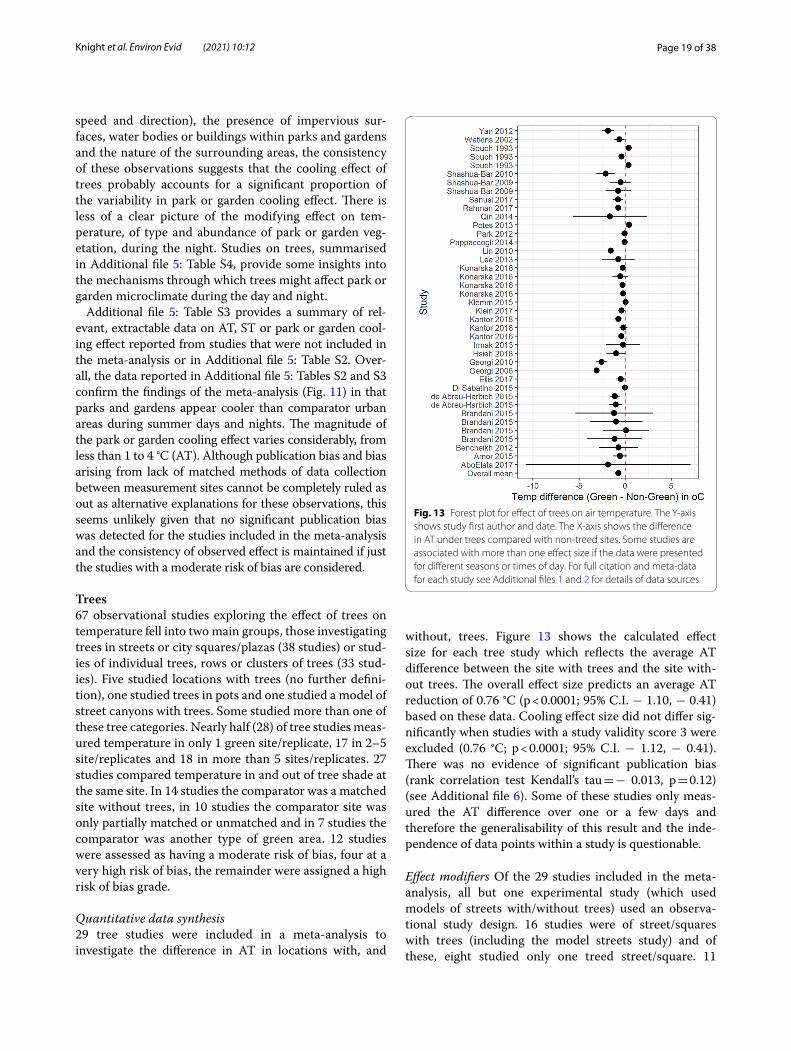
without, trees. Figure 13 shows the calculated effect size for each tree study which reflects the average AT difference between the site with trees and the site with-out trees. The overall effect size predicts an average AT reduction of 0.76 °C (p < 0.0001; 95% C.I. − 1.10, − 0.41) based on these data. Cooling effect size did not differ sig-nificantly when studies with a study validity score 3 were excluded (0.76 °C; p < 0.0001; 95% C.I. − 1.12, − 0.41). There was no evidence of significant publication bias (rank correlation test Kendall’s tau = − 0.013, p = 0.12) (see Additional file 6). Some of these studies only meas-ured the AT difference over one or a few days and therefore the generalisability of this result and the inde-pendence of data points within a study is questionable.
Effect modifiers Of the 29 studies included in the meta-analysis, all but one experimental study (which used models of streets with/without trees) used an observa-tional study design. 16 studies were of street/squares with trees (including the model streets study) and of these, eight studied only one treed street/square. 11
Fig. 13 Forest plot for effect of trees on air temperature. The Y-axis shows study first author and date. The X-axis shows the difference in AT under trees compared with non-treed sites. Some studies are associated with more than one effect size if the data were presented for different seasons or times of day. For full citation and meta-data for each study see Additional files 1 and 2 for details of data sources
Page 20 of 38Knight et al. Environ Evid (2021) 10:12
investigated individual trees and/or clusters of trees and of these, four studied only one individual tree or one tree cluster. In addition, there were two studies of undefined treed locations. Some studies investigated more than one type of tree category. Comparisons were either with posi-tions out of tree shade at the same location (i.e., unshaded part of same street or in sun next to tree) (17 studies), or with different, but matched, unshaded locations (i.e., similar streets in same part of the city) (11 studies), or in unmatched or only partially matched locations (1 study). Meta-regression was used to explore the modifying effect of key variables (when there were at least five effect sizes in each variable sub-group being compared) on the effect size statistic:
Type of comparator: same location c.f. with matched site elsewhereClimate zoneTime of dayStudy validity score Type of study: trees in street or square, clusters of trees or individual trees
Of these potential effect-modifiers significant effects were only found for type of study where cooling effect was significantly greater (p = 0.0009) for individual trees in non-street settings (− 1.76 (− 2.43, − 1.09), p < 0.0001) compared with trees in streets (− 0.38 (− 0.84, 0.09), p = 0.12).
Narrative synthesisSome studies included in the review investigated differ-ent potential effect modifiers of the impact of trees on thermal conditions. Some of these concerned the trees themselves such as size and shape of trees and their cano-pies (tree morphology), canopy density/leaf area index, the extent to which the canopy reduces SVF, density of tree clusters. Others investigated the modifying effect of environmental factors such as weather or the pres-ence of buildings. In general, these variables were not consistently or well enough described in sufficient stud-ies, to allow meaningful quantitative analysis. Empiri-cal findings relevant to effect modification reported in these studies are however summarised in Additional file 5: Table S4. Whilst most of these studies reported data for just the warmer, summer months, others investi-gated seasonal variation. However, to enable comparison between study findings only data relating to summer are summarised in Additional file 5: Table S4. In the narra-tive below the data described are from studies included in Additional file 5: Table S4.
Where trees were reported to have significant cool-ing effects on AT, these most often fall within the range of 0.5–5 °C but there is considerable variation in the
means and variances reported. Although less frequently reported, ST under trees tend to be higher than AT. In general, the studies varied considerably in terms of which species of tree, in which configurations (for example individual, street trees), were studied, but it is clear from the reported data that there is (within-study) variation between species in reported impact of shading by tree canopies, on AT and ST. One explanation for species dif-ference in effect could be variation in tree characteristics such as shading area, leaf area index, transpiration rates and canopy density and dimensions but the association between these and impact on temperature under trees is not consistent across all studies.
There is however consistency in that tree canopy shad-ing is most often reported as having a cooling effect, or having the highest cooling effect, during the times of day when insolation, ambient AT and tree transpiration rates are higher and either having no significant effect during the night or AT being higher under trees at night com-pared to open sites. Although, where it is reported, data show species variation in the amount of solar radiation attenuated by tree canopies, overall, they suggest that trees in leaf can block around 70–95% of solar radiation and that trees without leaves still have a substantial atten-uating effect. Reported regression analyses suggest that shading by trees accounts for some 70–80% of the vari-ation of temperature under tree canopies during the day.
The reported data paint a complex picture of the impact of trees on thermal conditions in streets, with some stud-ies reporting no cooling effect of street trees during day-time whereas others do report significant cooling. This is consistent with the findings of the meta-analysis which found significant cooling effect for individual trees in non-street settings but not for street trees (although this effect was of borderline significance at the 95% level). However, studies assigned a moderate risk of bias grade consistently report a day-time cooling effect of street trees. Variability in outcome for street trees could be due to the variation between studies in terms of the geometry, orientation, building density, openness of the street to sky, distance between trees along streets, species of tree, amount of traffic and other factors, of streets studied.
Where data on relative humidity (RH) are reported, they consistently suggest that trees have a humidifying effect, with the magnitude of RH increase under trees compared with open sites ranging from widely from 1 to 35%. This effect was less often reported as modified by tree characteristics such as LAI or canopy density, and as having less diurnal variation, than temperature under trees. Humidity and temperature combine to affect human thermal comfort and reported data consistently suggest that thermal comfort improves under tree can-opy shade.
Page 21 of 38Knight et al. Environ Evid (2021) 10:12
Studies of trees summarised in Additional file 5: Table S4 are mainly from temperate climate zone sub-zones Cfa or Cfb and the reported data seem not to differ in direction of effect between these two climate groups.
If just the data reported from studies assessed as having a low or moderate risk of bias are examined, there is con-sistency in the direction of reported observations, despite differences between what has been studied, where; AT is lower, RH is higher and thermal comfort is improved under tree canopies compared with open sites during the warmest times of the day and there is either no difference between treed and open sites at night or treed sites are warmer and less humid. There is still a lack of consistency in the reported association between cooling and humidi-fying effects and tree characteristics.
Data on cooling effect of trees reported by studies not included in the meta-analysis or in Additional file 5: Table S4 are given in Additional file 5: Table S5. In these studies, the range of reported mean differences in AT (cooling effect) under trees compared with open sites
varies from less than 1 °C to over 10 °C. This high varia-tion is probably due to differences between sites, in sur-face cover, density of trees, tree canopy shading and other environmental factors.
Overall, the findings reported from studies in Addi-tional file 5: Tables S4, S5 support that of the meta-anal-ysis (Fig. 13), that trees can have a significant cooling effect. Publication bias still however remains a possible explanation for the observed findings although no signifi-cant publication bias was found for the studies included in the meta-analysis.
Forest 23 studies that addressed the effects of urban forests/woodland on temperature all used an observational study design that involved a site comparison. Of these, 15 only studied one green site, six studied 2–5 sites and two stud-ied more than five sites. Non-green comparators were within the same forest in two studies, were with non-green sites close to the forest in four studies and elsewhere in the urban area in 12 studies. Seven studies compared forest to different types of green area. Only two studies were assessed as having a moderate risk of bias and six as having a very high risk. The remainder were assigned a high risk of bias grade.
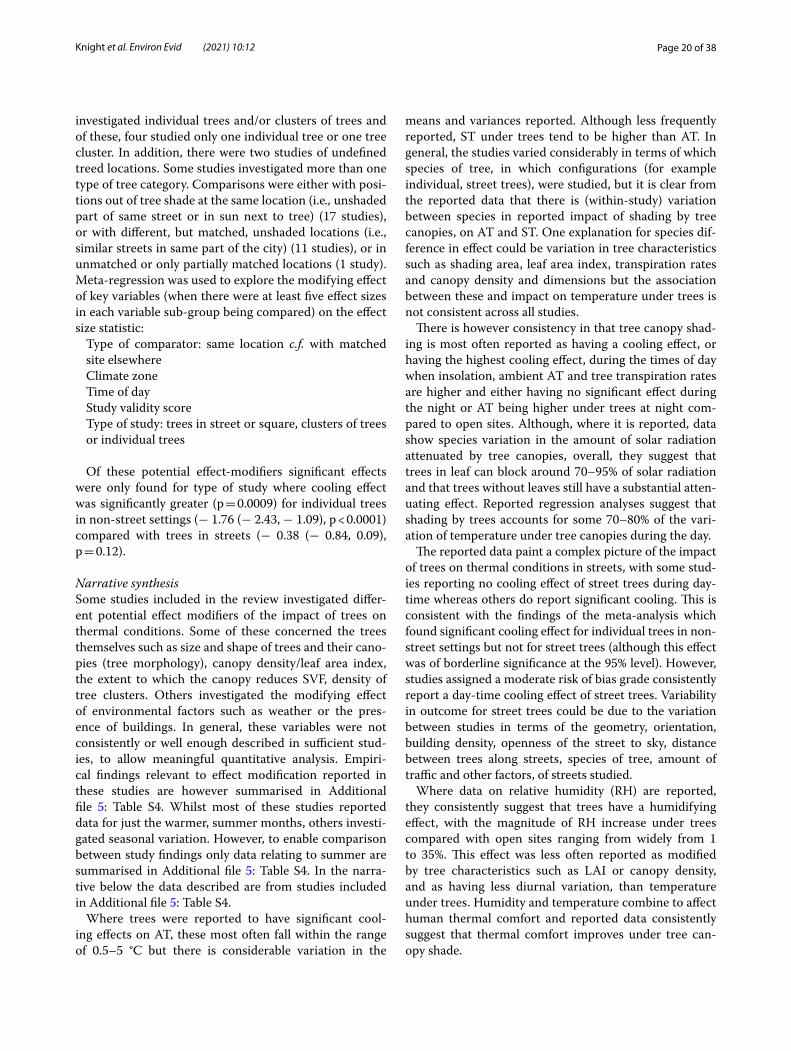
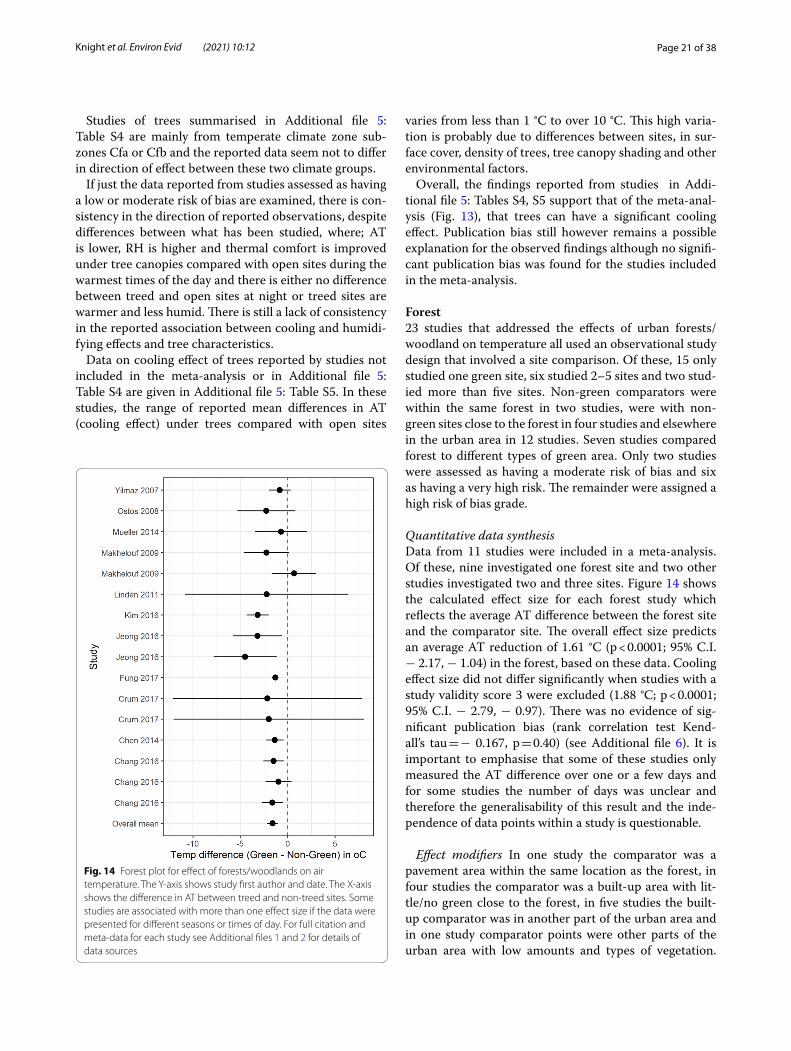
Quantitative data synthesisData from 11 studies were included in a meta-analysis. Of these, nine investigated one forest site and two other studies investigated two and three sites. Figure 14 shows the calculated effect size for each forest study which reflects the average AT difference between the forest site and the comparator site. The overall effect size predicts an average AT reduction of 1.61 °C (p < 0.0001; 95% C.I. − 2.17, − 1.04) in the forest, based on these data. Cooling effect size did not differ significantly when studies with a study validity score 3 were excluded (1.88 °C; p < 0.0001; 95% C.I. − 2.79, − 0.97). There was no evidence of sig-nificant publication bias (rank correlation test Kend-all’s tau = − 0.167, p = 0.40) (see Additional file 6). It is important to emphasise that some of these studies only measured the AT difference over one or a few days and for some studies the number of days was unclear and therefore the generalisability of this result and the inde-pendence of data points within a study is questionable.
Effect modifiers In one study the comparator was a pavement area within the same location as the forest, in four studies the comparator was a built-up area with lit-tle/no green close to the forest, in five studies the built-up comparator was in another part of the urban area and in one study comparator points were other parts of the urban area with low amounts and types of vegetation.
Fig. 14 Forest plot for effect of forests/woodlands on air temperature. The Y-axis shows study first author and date. The X-axis shows the difference in AT between treed and non-treed sites. Some studies are associated with more than one effect size if the data were presented for different seasons or times of day. For full citation and meta-data for each study see Additional files 1 and 2 for details of data sources
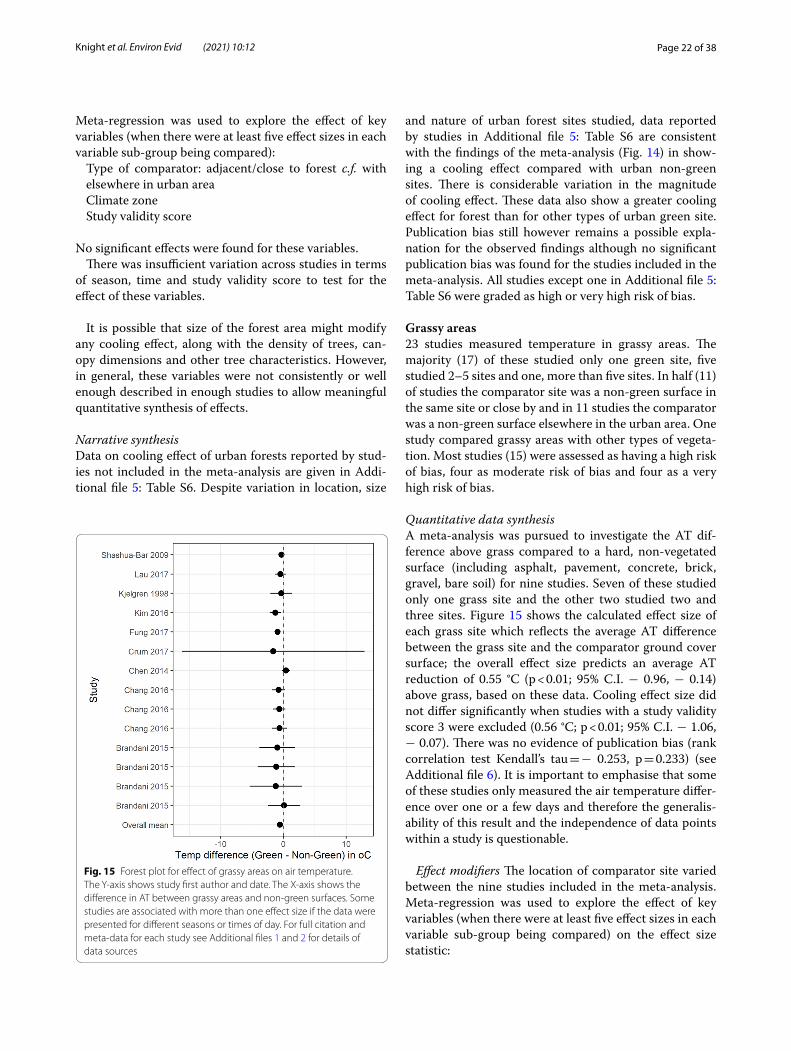
Page 22 of 38Knight et al. Environ Evid (2021) 10:12
Meta-regression was used to explore the effect of key variables (when there were at least five effect sizes in each variable sub-group being compared):
Type of comparator: adjacent/close to forest c.f. with elsewhere in urban areaClimate zoneStudy validity score
No significant effects were found for these variables.There was insufficient variation across studies in terms
of season, time and study validity score to test for the effect of these variables.
It is possible that size of the forest area might modify any cooling effect, along with the density of trees, can-opy dimensions and other tree characteristics. However, in general, these variables were not consistently or well enough described in enough studies to allow meaningful quantitative synthesis of effects.
Narrative synthesisData on cooling effect of urban forests reported by stud-ies not included in the meta-analysis are given in Addi-tional file 5: Table S6. Despite variation in location, size
and nature of urban forest sites studied, data reported by studies in Additional file 5: Table S6 are consistent with the findings of the meta-analysis (Fig. 14) in show-ing a cooling effect compared with urban non-green sites. There is considerable variation in the magnitude of cooling effect. These data also show a greater cooling effect for forest than for other types of urban green site. Publication bias still however remains a possible expla-nation for the observed findings although no significant publication bias was found for the studies included in the meta-analysis. All studies except one in Additional file 5: Table S6 were graded as high or very high risk of bias.
Grassy areas 23 studies measured temperature in grassy areas. The majority (17) of these studied only one green site, five studied 2–5 sites and one, more than five sites. In half (11) of studies the comparator site was a non-green surface in the same site or close by and in 11 studies the comparator was a non-green surface elsewhere in the urban area. One study compared grassy areas with other types of vegeta-tion. Most studies (15) were assessed as having a high risk of bias, four as moderate risk of bias and four as a very high risk of bias.
Quantitative data synthesisA meta-analysis was pursued to investigate the AT dif-ference above grass compared to a hard, non-vegetated surface (including asphalt, pavement, concrete, brick, gravel, bare soil) for nine studies. Seven of these studied only one grass site and the other two studied two and three sites. Figure 15 shows the calculated effect size of each grass site which reflects the average AT difference between the grass site and the comparator ground cover surface; the overall effect size predicts an average AT reduction of 0.55 °C (p < 0.01; 95% C.I. − 0.96, − 0.14) above grass, based on these data. Cooling effect size did not differ significantly when studies with a study validity score 3 were excluded (0.56 °C; p < 0.01; 95% C.I. − 1.06, − 0.07). There was no evidence of publication bias (rank correlation test Kendall’s tau = − 0.253, p = 0.233) (see Additional file 6). It is important to emphasise that some of these studies only measured the air temperature differ-ence over one or a few days and therefore the generalis-ability of this result and the independence of data points within a study is questionable.
Effect modifiers The location of comparator site varied between the nine studies included in the meta-analysis. Meta-regression was used to explore the effect of key variables (when there were at least five effect sizes in each variable sub-group being compared) on the effect size statistic:
Fig. 15 Forest plot for effect of grassy areas on air temperature. The Y-axis shows study first author and date. The X-axis shows the difference in AT between grassy areas and non-green surfaces. Some studies are associated with more than one effect size if the data were presented for different seasons or times of day. For full citation and meta-data for each study see Additional files 1 and 2 for details of data sources
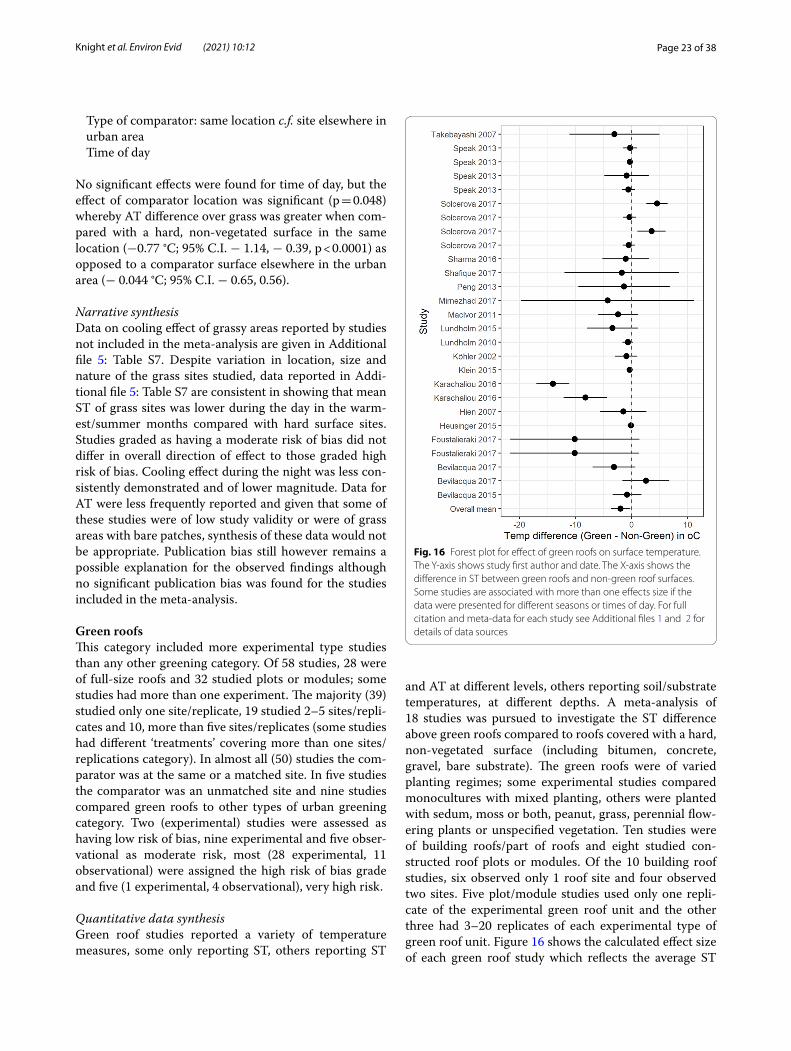
Page 23 of 38Knight et al. Environ Evid (2021) 10:12
Type of comparator: same location c.f. site elsewhere in urban areaTime of day
No significant effects were found for time of day, but the effect of comparator location was significant (p = 0.048) whereby AT difference over grass was greater when com-pared with a hard, non-vegetated surface in the same location (−0.77 °C; 95% C.I. − 1.14, − 0.39, p < 0.0001) as opposed to a comparator surface elsewhere in the urban area (− 0.044 °C; 95% C.I. − 0.65, 0.56).
Narrative synthesisData on cooling effect of grassy areas reported by studies not included in the meta-analysis are given in Additional file 5: Table S7. Despite variation in location, size and nature of the grass sites studied, data reported in Addi-tional file 5: Table S7 are consistent in showing that mean ST of grass sites was lower during the day in the warm-est/summer months compared with hard surface sites. Studies graded as having a moderate risk of bias did not differ in overall direction of effect to those graded high risk of bias. Cooling effect during the night was less con-sistently demonstrated and of lower magnitude. Data for AT were less frequently reported and given that some of these studies were of low study validity or were of grass areas with bare patches, synthesis of these data would not be appropriate. Publication bias still however remains a possible explanation for the observed findings although no significant publication bias was found for the studies included in the meta-analysis.
Green roofs This category included more experimental type studies than any other greening category. Of 58 studies, 28 were of full-size roofs and 32 studied plots or modules; some studies had more than one experiment. The majority (39) studied only one site/replicate, 19 studied 2–5 sites/repli-cates and 10, more than five sites/replicates (some studies had different ‘treatments’ covering more than one sites/replications category). In almost all (50) studies the com-parator was at the same or a matched site. In five studies the comparator was an unmatched site and nine studies compared green roofs to other types of urban greening category. Two (experimental) studies were assessed as having low risk of bias, nine experimental and five obser-vational as moderate risk, most (28 experimental, 11 observational) were assigned the high risk of bias grade and five (1 experimental, 4 observational), very high risk.
Quantitative data synthesisGreen roof studies reported a variety of temperature measures, some only reporting ST, others reporting ST
and AT at different levels, others reporting soil/substrate temperatures, at different depths. A meta-analysis of 18 studies was pursued to investigate the ST difference above green roofs compared to roofs covered with a hard, non-vegetated surface (including bitumen, concrete, gravel, bare substrate). The green roofs were of varied planting regimes; some experimental studies compared monocultures with mixed planting, others were planted with sedum, moss or both, peanut, grass, perennial flow-ering plants or unspecified vegetation. Ten studies were of building roofs/part of roofs and eight studied con-structed roof plots or modules. Of the 10 building roof studies, six observed only 1 roof site and four observed two sites. Five plot/module studies used only one repli-cate of the experimental green roof unit and the other three had 3–20 replicates of each experimental type of green roof unit. Figure 16 shows the calculated effect size of each green roof study which reflects the average ST
Fig. 16 Forest plot for effect of green roofs on surface temperature. The Y-axis shows study first author and date. The X-axis shows the difference in ST between green roofs and non-green roof surfaces. Some studies are associated with more than one effects size if the data were presented for different seasons or times of day. For full citation and meta-data for each study see Additional files 1 and 2 for details of data sources
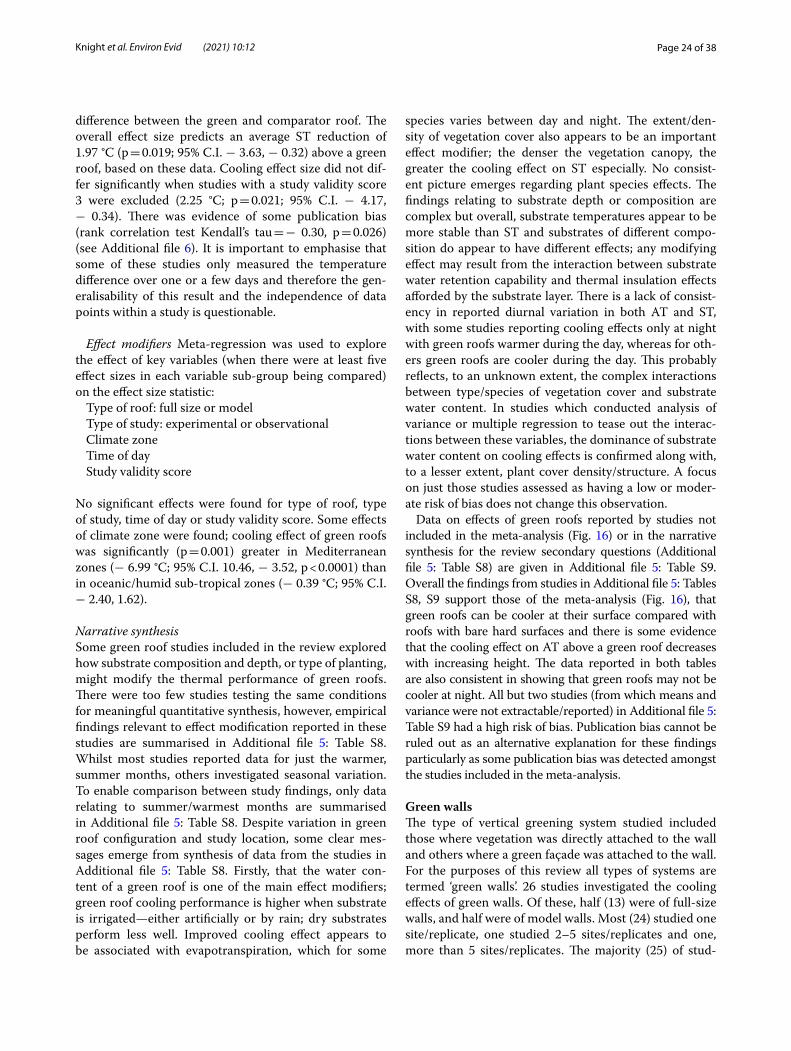
Page 24 of 38Knight et al. Environ Evid (2021) 10:12
difference between the green and comparator roof. The overall effect size predicts an average ST reduction of 1.97 °C (p = 0.019; 95% C.I. − 3.63, − 0.32) above a green roof, based on these data. Cooling effect size did not dif-fer significantly when studies with a study validity score 3 were excluded (2.25 °C; p = 0.021; 95% C.I. − 4.17, − 0.34). There was evidence of some publication bias (rank correlation test Kendall’s tau = − 0.30, p = 0.026) (see Additional file 6). It is important to emphasise that some of these studies only measured the temperature difference over one or a few days and therefore the gen-eralisability of this result and the independence of data points within a study is questionable.
Effect modifiers Meta-regression was used to explore the effect of key variables (when there were at least five effect sizes in each variable sub-group being compared) on the effect size statistic:
Type of roof: full size or modelType of study: experimental or observationalClimate zoneTime of dayStudy validity score
No significant effects were found for type of roof, type of study, time of day or study validity score. Some effects of climate zone were found; cooling effect of green roofs was significantly (p = 0.001) greater in Mediterranean zones (− 6.99 °C; 95% C.I. 10.46, − 3.52, p < 0.0001) than in oceanic/humid sub-tropical zones (− 0.39 °C; 95% C.I. − 2.40, 1.62).
Narrative synthesisSome green roof studies included in the review explored how substrate composition and depth, or type of planting, might modify the thermal performance of green roofs. There were too few studies testing the same conditions for meaningful quantitative synthesis, however, empirical findings relevant to effect modification reported in these studies are summarised in Additional file 5: Table S8. Whilst most studies reported data for just the warmer, summer months, others investigated seasonal variation. To enable comparison between study findings, only data relating to summer/warmest months are summarised in Additional file 5: Table S8. Despite variation in green roof configuration and study location, some clear mes-sages emerge from synthesis of data from the studies in Additional file 5: Table S8. Firstly, that the water con-tent of a green roof is one of the main effect modifiers; green roof cooling performance is higher when substrate is irrigated—either artificially or by rain; dry substrates perform less well. Improved cooling effect appears to be associated with evapotranspiration, which for some
species varies between day and night. The extent/den-sity of vegetation cover also appears to be an important effect modifier; the denser the vegetation canopy, the greater the cooling effect on ST especially. No consist-ent picture emerges regarding plant species effects. The findings relating to substrate depth or composition are complex but overall, substrate temperatures appear to be more stable than ST and substrates of different compo-sition do appear to have different effects; any modifying effect may result from the interaction between substrate water retention capability and thermal insulation effects afforded by the substrate layer. There is a lack of consist-ency in reported diurnal variation in both AT and ST, with some studies reporting cooling effects only at night with green roofs warmer during the day, whereas for oth-ers green roofs are cooler during the day. This probably reflects, to an unknown extent, the complex interactions between type/species of vegetation cover and substrate water content. In studies which conducted analysis of variance or multiple regression to tease out the interac-tions between these variables, the dominance of substrate water content on cooling effects is confirmed along with, to a lesser extent, plant cover density/structure. A focus on just those studies assessed as having a low or moder-ate risk of bias does not change this observation.
Data on effects of green roofs reported by studies not included in the meta-analysis (Fig. 16) or in the narrative synthesis for the review secondary questions (Additional file 5: Table S8) are given in Additional file 5: Table S9. Overall the findings from studies in Additional file 5: Tables S8, S9 support those of the meta-analysis (Fig. 16), that green roofs can be cooler at their surface compared with roofs with bare hard surfaces and there is some evidence that the cooling effect on AT above a green roof decreases with increasing height. The data reported in both tables are also consistent in showing that green roofs may not be cooler at night. All but two studies (from which means and variance were not extractable/reported) in Additional file 5: Table S9 had a high risk of bias. Publication bias cannot be ruled out as an alternative explanation for these findings particularly as some publication bias was detected amongst the studies included in the meta-analysis.
Green walls The type of vertical greening system studied included those where vegetation was directly attached to the wall and others where a green façade was attached to the wall. For the purposes of this review all types of systems are termed ‘green walls’. 26 studies investigated the cooling effects of green walls. Of these, half (13) were of full-size walls, and half were of model walls. Most (24) studied one site/replicate, one studied 2–5 sites/replicates and one, more than 5 sites/replicates. The majority (25) of stud-
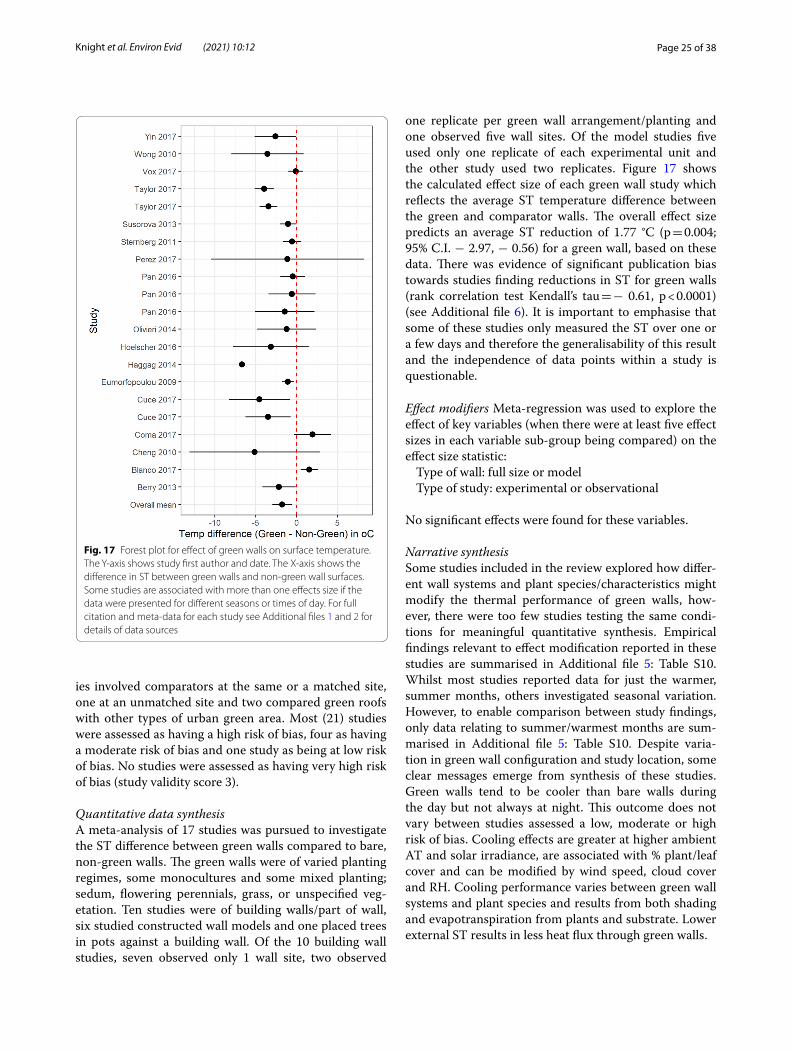
Page 25 of 38Knight et al. Environ Evid (2021) 10:12
ies involved comparators at the same or a matched site, one at an unmatched site and two compared green roofs with other types of urban green area. Most (21) studies were assessed as having a high risk of bias, four as having a moderate risk of bias and one study as being at low risk of bias. No studies were assessed as having very high risk of bias (study validity score 3).
Quantitative data synthesisA meta-analysis of 17 studies was pursued to investigate the ST difference between green walls compared to bare, non-green walls. The green walls were of varied planting regimes, some monocultures and some mixed planting; sedum, flowering perennials, grass, or unspecified veg-etation. Ten studies were of building walls/part of wall, six studied constructed wall models and one placed trees in pots against a building wall. Of the 10 building wall studies, seven observed only 1 wall site, two observed
one replicate per green wall arrangement/planting and one observed five wall sites. Of the model studies five used only one replicate of each experimental unit and the other study used two replicates. Figure 17 shows the calculated effect size of each green wall study which reflects the average ST temperature difference between the green and comparator walls. The overall effect size predicts an average ST reduction of 1.77 °C (p = 0.004; 95% C.I. − 2.97, − 0.56) for a green wall, based on these data. There was evidence of significant publication bias towards studies finding reductions in ST for green walls (rank correlation test Kendall’s tau = − 0.61, p < 0.0001) (see Additional file 6). It is important to emphasise that some of these studies only measured the ST over one or a few days and therefore the generalisability of this result and the independence of data points within a study is questionable.
Effect modifiers Meta-regression was used to explore the effect of key variables (when there were at least five effect sizes in each variable sub-group being compared) on the effect size statistic:
Type of wall: full size or modelType of study: experimental or observational
No significant effects were found for these variables.
Narrative synthesisSome studies included in the review explored how differ-ent wall systems and plant species/characteristics might modify the thermal performance of green walls, how-ever, there were too few studies testing the same condi-tions for meaningful quantitative synthesis. Empirical findings relevant to effect modification reported in these studies are summarised in Additional file 5: Table S10. Whilst most studies reported data for just the warmer, summer months, others investigated seasonal variation. However, to enable comparison between study findings, only data relating to summer/warmest months are sum-marised in Additional file 5: Table S10. Despite varia-tion in green wall configuration and study location, some clear messages emerge from synthesis of these studies. Green walls tend to be cooler than bare walls during the day but not always at night. This outcome does not vary between studies assessed a low, moderate or high risk of bias. Cooling effects are greater at higher ambient AT and solar irradiance, are associated with % plant/leaf cover and can be modified by wind speed, cloud cover and RH. Cooling performance varies between green wall systems and plant species and results from both shading and evapotranspiration from plants and substrate. Lower external ST results in less heat flux through green walls.
Fig. 17 Forest plot for effect of green walls on surface temperature. The Y-axis shows study first author and date. The X-axis shows the difference in ST between green walls and non-green wall surfaces. Some studies are associated with more than one effects size if the data were presented for different seasons or times of day. For full citation and meta-data for each study see Additional files 1 and 2 for details of data sources
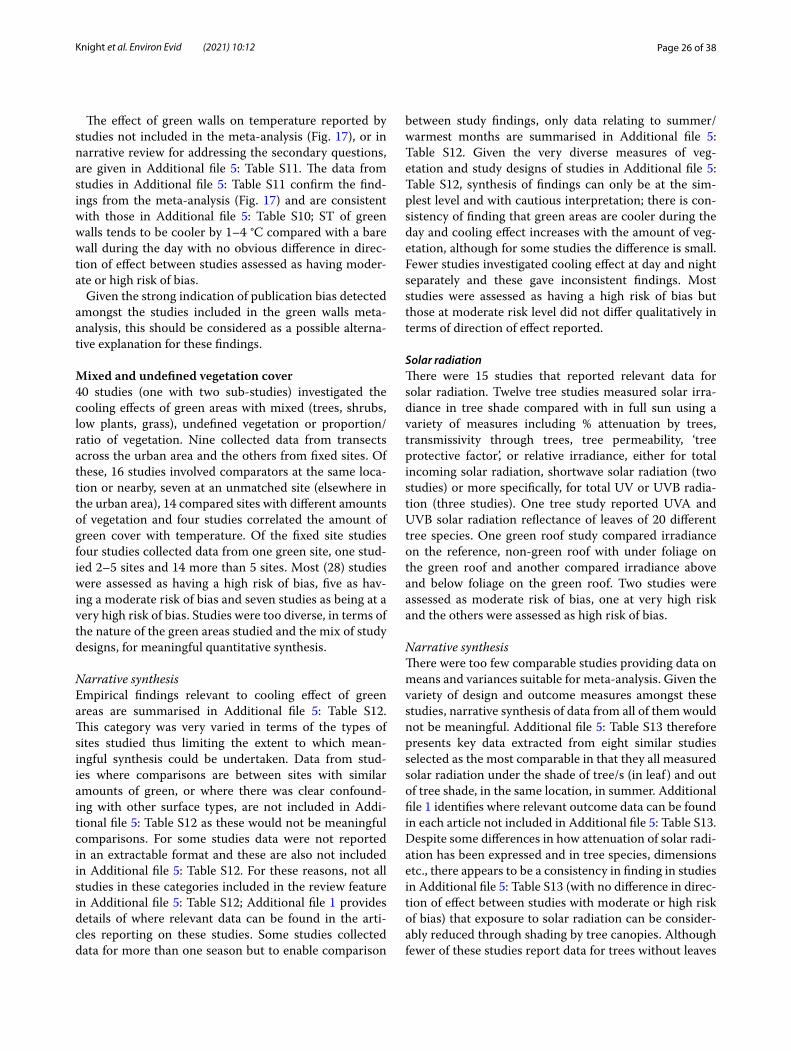
Page 26 of 38Knight et al. Environ Evid (2021) 10:12
The effect of green walls on temperature reported by studies not included in the meta-analysis (Fig. 17), or in narrative review for addressing the secondary questions, are given in Additional file 5: Table S11. The data from studies in Additional file 5: Table S11 confirm the find-ings from the meta-analysis (Fig. 17) and are consistent with those in Additional file 5: Table S10; ST of green walls tends to be cooler by 1–4 °C compared with a bare wall during the day with no obvious difference in direc-tion of effect between studies assessed as having moder-ate or high risk of bias.
Given the strong indication of publication bias detected amongst the studies included in the green walls meta-analysis, this should be considered as a possible alterna-tive explanation for these findings.
Mixed and undefined vegetation cover 40 studies (one with two sub-studies) investigated the cooling effects of green areas with mixed (trees, shrubs, low plants, grass), undefined vegetation or proportion/ratio of vegetation. Nine collected data from transects across the urban area and the others from fixed sites. Of these, 16 studies involved comparators at the same loca-tion or nearby, seven at an unmatched site (elsewhere in the urban area), 14 compared sites with different amounts of vegetation and four studies correlated the amount of green cover with temperature. Of the fixed site studies four studies collected data from one green site, one stud-ied 2–5 sites and 14 more than 5 sites. Most (28) studies were assessed as having a high risk of bias, five as hav-ing a moderate risk of bias and seven studies as being at a very high risk of bias. Studies were too diverse, in terms of the nature of the green areas studied and the mix of study designs, for meaningful quantitative synthesis.
Narrative synthesisEmpirical findings relevant to cooling effect of green areas are summarised in Additional file 5: Table S12. This category was very varied in terms of the types of sites studied thus limiting the extent to which mean-ingful synthesis could be undertaken. Data from stud-ies where comparisons are between sites with similar amounts of green, or where there was clear confound-ing with other surface types, are not included in Addi-tional file 5: Table S12 as these would not be meaningful comparisons. For some studies data were not reported in an extractable format and these are also not included in Additional file 5: Table S12. For these reasons, not all studies in these categories included in the review feature in Additional file 5: Table S12; Additional file 1 provides details of where relevant data can be found in the arti-cles reporting on these studies. Some studies collected data for more than one season but to enable comparison
between study findings, only data relating to summer/warmest months are summarised in Additional file 5: Table S12. Given the very diverse measures of veg-etation and study designs of studies in Additional file 5: Table S12, synthesis of findings can only be at the sim-plest level and with cautious interpretation; there is con-sistency of finding that green areas are cooler during the day and cooling effect increases with the amount of veg-etation, although for some studies the difference is small. Fewer studies investigated cooling effect at day and night separately and these gave inconsistent findings. Most studies were assessed as having a high risk of bias but those at moderate risk level did not differ qualitatively in terms of direction of effect reported.
Solar radiationThere were 15 studies that reported relevant data for solar radiation. Twelve tree studies measured solar irra-diance in tree shade compared with in full sun using a variety of measures including % attenuation by trees, transmissivity through trees, tree permeability, ‘tree protective factor’, or relative irradiance, either for total incoming solar radiation, shortwave solar radiation (two studies) or more specifically, for total UV or UVB radia-tion (three studies). One tree study reported UVA and UVB solar radiation reflectance of leaves of 20 different tree species. One green roof study compared irradiance on the reference, non-green roof with under foliage on the green roof and another compared irradiance above and below foliage on the green roof. Two studies were assessed as moderate risk of bias, one at very high risk and the others were assessed as high risk of bias.
Narrative synthesis There were too few comparable studies providing data on means and variances suitable for meta-analysis. Given the variety of design and outcome measures amongst these studies, narrative synthesis of data from all of them would not be meaningful. Additional file 5: Table S13 therefore presents key data extracted from eight similar studies selected as the most comparable in that they all measured solar radiation under the shade of tree/s (in leaf ) and out of tree shade, in the same location, in summer. Additional file 1 identifies where relevant outcome data can be found in each article not included in Additional file 5: Table S13. Despite some differences in how attenuation of solar radi-ation has been expressed and in tree species, dimensions etc., there appears to be a consistency in finding in studies in Additional file 5: Table S13 (with no difference in direc-tion of effect between studies with moderate or high risk of bias) that exposure to solar radiation can be consider-ably reduced through shading by tree canopies. Although fewer of these studies report data for trees without leaves
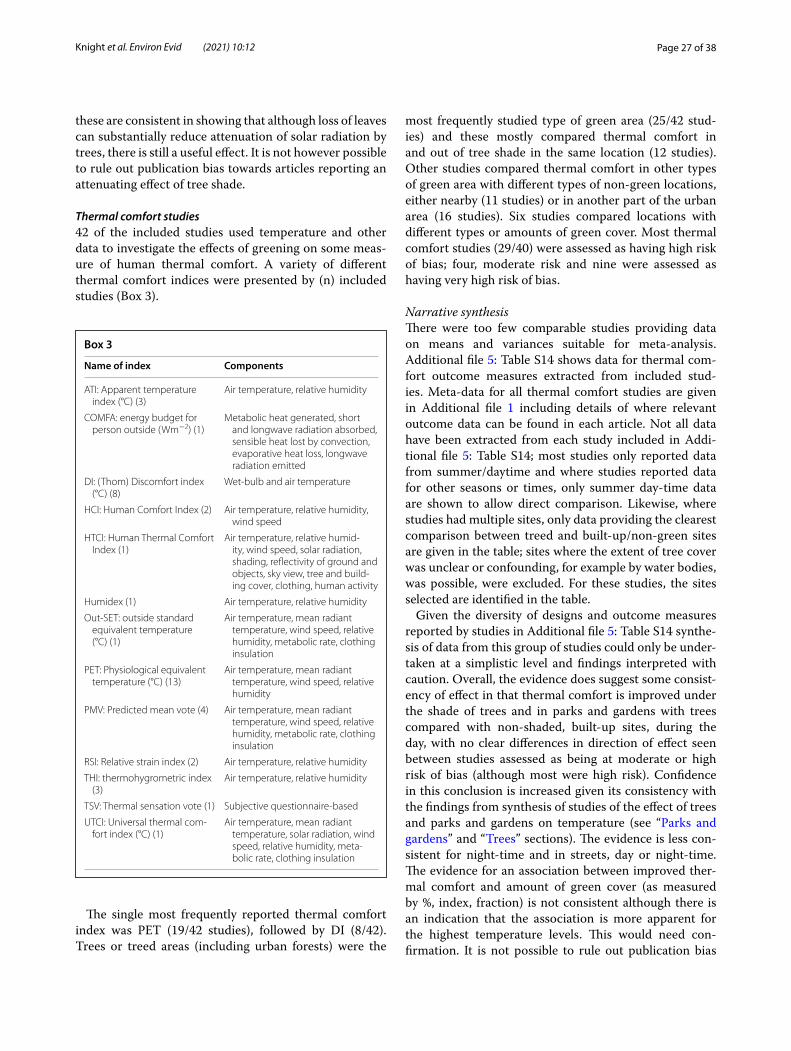
Page 27 of 38Knight et al. Environ Evid (2021) 10:12
these are consistent in showing that although loss of leaves can substantially reduce attenuation of solar radiation by trees, there is still a useful effect. It is not however possible to rule out publication bias towards articles reporting an attenuating effect of tree shade.
Thermal comfort studies42 of the included studies used temperature and other data to investigate the effects of greening on some meas-ure of human thermal comfort. A variety of different thermal comfort indices were presented by (n) included studies (Box 3).
most frequently studied type of green area (25/42 stud-ies) and these mostly compared thermal comfort in and out of tree shade in the same location (12 studies). Other studies compared thermal comfort in other types of green area with different types of non-green locations, either nearby (11 studies) or in another part of the urban area (16 studies). Six studies compared locations with different types or amounts of green cover. Most thermal comfort studies (29/40) were assessed as having high risk of bias; four, moderate risk and nine were assessed as having very high risk of bias.
Narrative synthesis There were too few comparable studies providing data on means and variances suitable for meta-analysis. Additional file 5: Table S14 shows data for thermal com-fort outcome measures extracted from included stud-ies. Meta-data for all thermal comfort studies are given in Additional file 1 including details of where relevant outcome data can be found in each article. Not all data have been extracted from each study included in Addi-tional file 5: Table S14; most studies only reported data from summer/daytime and where studies reported data for other seasons or times, only summer day-time data are shown to allow direct comparison. Likewise, where studies had multiple sites, only data providing the clearest comparison between treed and built-up/non-green sites are given in the table; sites where the extent of tree cover was unclear or confounding, for example by water bodies, was possible, were excluded. For these studies, the sites selected are identified in the table.
Given the diversity of designs and outcome measures reported by studies in Additional file 5: Table S14 synthe-sis of data from this group of studies could only be under-taken at a simplistic level and findings interpreted with caution. Overall, the evidence does suggest some consist-ency of effect in that thermal comfort is improved under the shade of trees and in parks and gardens with trees compared with non-shaded, built-up sites, during the day, with no clear differences in direction of effect seen between studies assessed as being at moderate or high risk of bias (although most were high risk). Confidence in this conclusion is increased given its consistency with the findings from synthesis of studies of the effect of trees and parks and gardens on temperature (see “Parks and gardens” and “Trees” sections). The evidence is less con-sistent for night-time and in streets, day or night-time. The evidence for an association between improved ther-mal comfort and amount of green cover (as measured by %, index, fraction) is not consistent although there is an indication that the association is more apparent for the highest temperature levels. This would need con-firmation. It is not possible to rule out publication bias
Box 3
Name of index Components
ATI: Apparent temperature index (°C) (3)
Air temperature, relative humidity
COMFA: energy budget for person outside (Wm−2) (1)
Metabolic heat generated, short and longwave radiation absorbed, sensible heat lost by convection, evaporative heat loss, longwave radiation emitted
DI: (Thom) Discomfort index (°C) (8)
Wet-bulb and air temperature
HCI: Human Comfort Index (2) Air temperature, relative humidity, wind speed
HTCI: Human Thermal Comfort Index (1)
Air temperature, relative humid-ity, wind speed, solar radiation, shading, reflectivity of ground and objects, sky view, tree and build-ing cover, clothing, human activity
Humidex (1) Air temperature, relative humidity
Out-SET: outside standard equivalent temperature (°C) (1)
Air temperature, mean radiant temperature, wind speed, relative humidity, metabolic rate, clothing insulation
PET: Physiological equivalent temperature (°C) (13)
Air temperature, mean radiant temperature, wind speed, relative humidity
PMV: Predicted mean vote (4) Air temperature, mean radiant temperature, wind speed, relative humidity, metabolic rate, clothing insulation
RSI: Relative strain index (2) Air temperature, relative humidity
THI: thermohygrometric index (3)
Air temperature, relative humidity
TSV: Thermal sensation vote (1) Subjective questionnaire-based
UTCI: Universal thermal com-fort index (°C) (1)
Air temperature, mean radiant temperature, solar radiation, wind speed, relative humidity, meta-bolic rate, clothing insulation
The single most frequently reported thermal comfort index was PET (19/42 studies), followed by DI (8/42). Trees or treed areas (including urban forests) were the
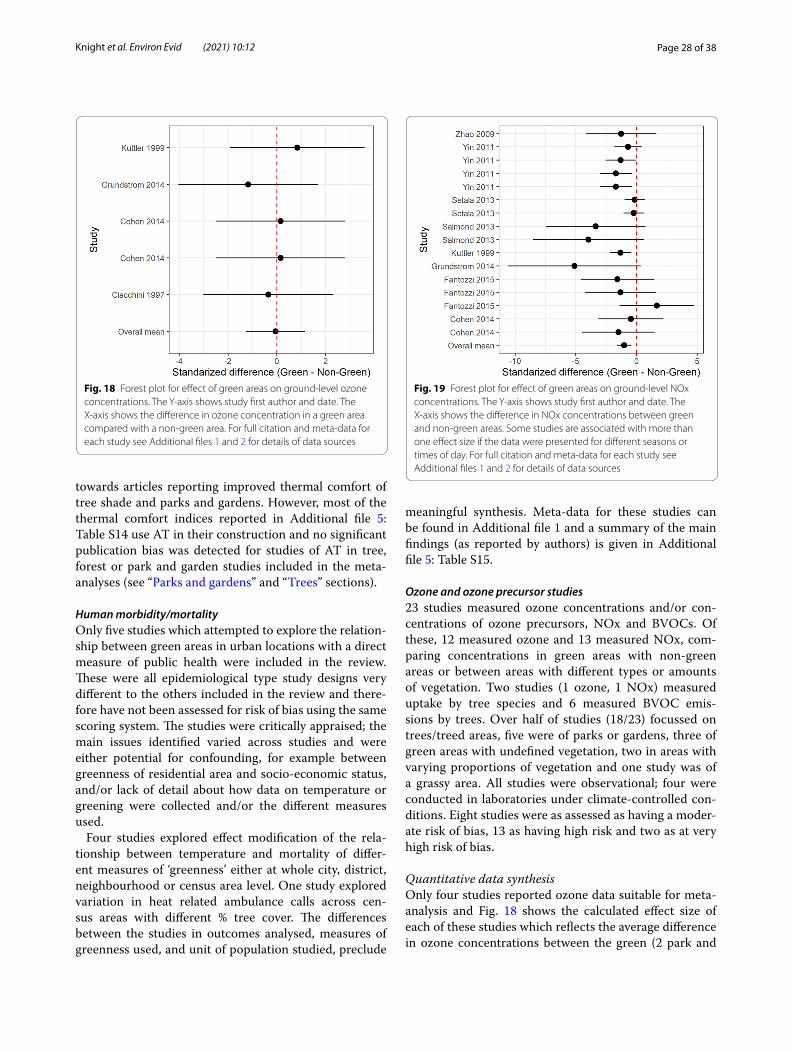
Page 28 of 38Knight et al. Environ Evid (2021) 10:12
towards articles reporting improved thermal comfort of tree shade and parks and gardens. However, most of the thermal comfort indices reported in Additional file 5: Table S14 use AT in their construction and no significant publication bias was detected for studies of AT in tree, forest or park and garden studies included in the meta-analyses (see “Parks and gardens” and “Trees” sections).
Human morbidity/mortalityOnly five studies which attempted to explore the relation-ship between green areas in urban locations with a direct measure of public health were included in the review. These were all epidemiological type study designs very different to the others included in the review and there-fore have not been assessed for risk of bias using the same scoring system. The studies were critically appraised; the main issues identified varied across studies and were either potential for confounding, for example between greenness of residential area and socio-economic status, and/or lack of detail about how data on temperature or greening were collected and/or the different measures used.
Four studies explored effect modification of the rela-tionship between temperature and mortality of differ-ent measures of ‘greenness’ either at whole city, district, neighbourhood or census area level. One study explored variation in heat related ambulance calls across cen-sus areas with different % tree cover. The differences between the studies in outcomes analysed, measures of greenness used, and unit of population studied, preclude
meaningful synthesis. Meta-data for these studies can be found in Additional file 1 and a summary of the main findings (as reported by authors) is given in Additional file 5: Table S15.
Ozone and ozone precursor studies23 studies measured ozone concentrations and/or con-centrations of ozone precursors, NOx and BVOCs. Of these, 12 measured ozone and 13 measured NOx, com-paring concentrations in green areas with non-green areas or between areas with different types or amounts of vegetation. Two studies (1 ozone, 1 NOx) measured uptake by tree species and 6 measured BVOC emis-sions by trees. Over half of studies (18/23) focussed on trees/treed areas, five were of parks or gardens, three of green areas with undefined vegetation, two in areas with varying proportions of vegetation and one study was of a grassy area. All studies were observational; four were conducted in laboratories under climate-controlled con-ditions. Eight studies were as assessed as having a moder-ate risk of bias, 13 as having high risk and two as at very high risk of bias.
Quantitative data synthesis Only four studies reported ozone data suitable for meta-analysis and Fig. 18 shows the calculated effect size of each of these studies which reflects the average difference in ozone concentrations between the green (2 park and
Fig. 18 Forest plot for effect of green areas on ground-level ozone concentrations. The Y-axis shows study first author and date. The X-axis shows the difference in ozone concentration in a green area compared with a non-green area. For full citation and meta-data for each study see Additional files 1 and 2 for details of data sources
Fig. 19 Forest plot for effect of green areas on ground-level NOx concentrations. The Y-axis shows study first author and date. The X-axis shows the difference in NOx concentrations between green and non-green areas. Some studies are associated with more than one effect size if the data were presented for different seasons or times of day. For full citation and meta-data for each study see Additional files 1 and 2 for details of data sources
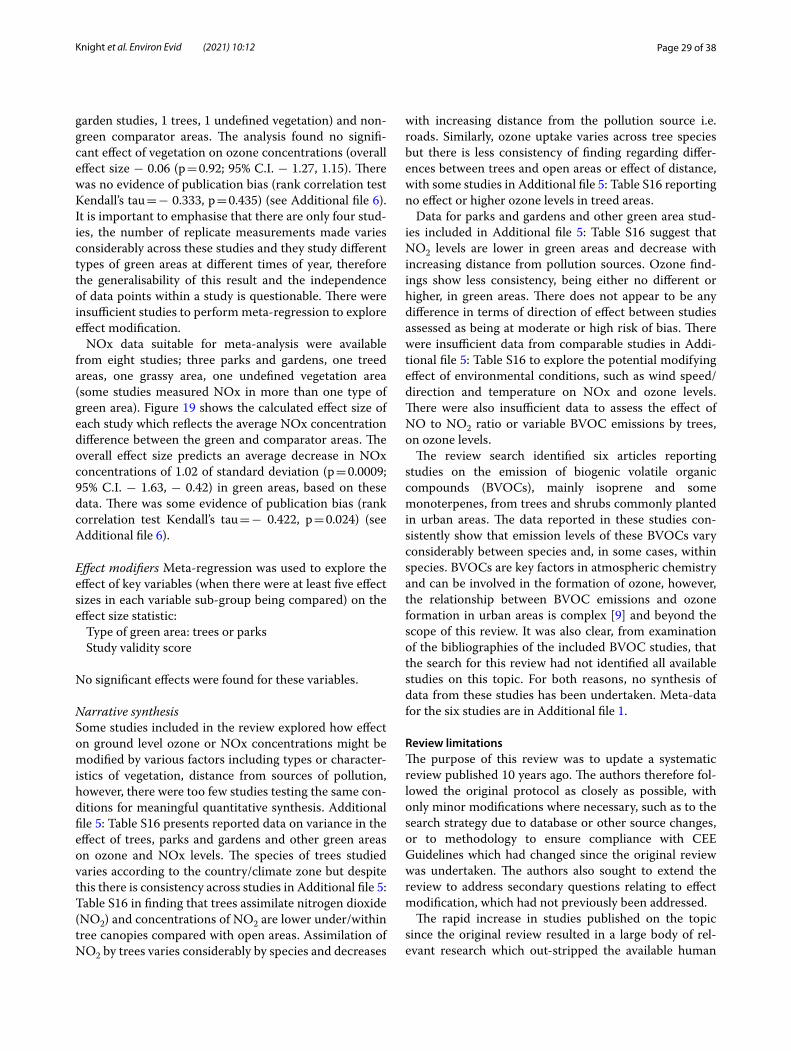
Page 29 of 38Knight et al. Environ Evid (2021) 10:12
garden studies, 1 trees, 1 undefined vegetation) and non-green comparator areas. The analysis found no signifi-cant effect of vegetation on ozone concentrations (overall effect size − 0.06 (p = 0.92; 95% C.I. − 1.27, 1.15). There was no evidence of publication bias (rank correlation test Kendall’s tau = − 0.333, p = 0.435) (see Additional file 6). It is important to emphasise that there are only four stud-ies, the number of replicate measurements made varies considerably across these studies and they study different types of green areas at different times of year, therefore the generalisability of this result and the independence of data points within a study is questionable. There were insufficient studies to perform meta-regression to explore effect modification.
NOx data suitable for meta-analysis were available from eight studies; three parks and gardens, one treed areas, one grassy area, one undefined vegetation area (some studies measured NOx in more than one type of green area). Figure 19 shows the calculated effect size of each study which reflects the average NOx concentration difference between the green and comparator areas. The overall effect size predicts an average decrease in NOx concentrations of 1.02 of standard deviation (p = 0.0009; 95% C.I. − 1.63, − 0.42) in green areas, based on these data. There was some evidence of publication bias (rank correlation test Kendall’s tau = − 0.422, p = 0.024) (see Additional file 6).
Effect modifiers Meta-regression was used to explore the effect of key variables (when there were at least five effect sizes in each variable sub-group being compared) on the effect size statistic:
Type of green area: trees or parksStudy validity score
No significant effects were found for these variables.
Narrative synthesis Some studies included in the review explored how effect on ground level ozone or NOx concentrations might be modified by various factors including types or character-istics of vegetation, distance from sources of pollution, however, there were too few studies testing the same con-ditions for meaningful quantitative synthesis. Additional file 5: Table S16 presents reported data on variance in the effect of trees, parks and gardens and other green areas on ozone and NOx levels. The species of trees studied varies according to the country/climate zone but despite this there is consistency across studies in Additional file 5: Table S16 in finding that trees assimilate nitrogen dioxide (NO2) and concentrations of NO2 are lower under/within tree canopies compared with open areas. Assimilation of NO2 by trees varies considerably by species and decreases
with increasing distance from the pollution source i.e. roads. Similarly, ozone uptake varies across tree species but there is less consistency of finding regarding differ-ences between trees and open areas or effect of distance, with some studies in Additional file 5: Table S16 reporting no effect or higher ozone levels in treed areas.
Data for parks and gardens and other green area stud-ies included in Additional file 5: Table S16 suggest that NO2 levels are lower in green areas and decrease with increasing distance from pollution sources. Ozone find-ings show less consistency, being either no different or higher, in green areas. There does not appear to be any difference in terms of direction of effect between studies assessed as being at moderate or high risk of bias. There were insufficient data from comparable studies in Addi-tional file 5: Table S16 to explore the potential modifying effect of environmental conditions, such as wind speed/direction and temperature on NOx and ozone levels. There were also insufficient data to assess the effect of NO to NO2 ratio or variable BVOC emissions by trees, on ozone levels.
The review search identified six articles reporting studies on the emission of biogenic volatile organic compounds (BVOCs), mainly isoprene and some monoterpenes, from trees and shrubs commonly planted in urban areas. The data reported in these studies con-sistently show that emission levels of these BVOCs vary considerably between species and, in some cases, within species. BVOCs are key factors in atmospheric chemistry and can be involved in the formation of ozone, however, the relationship between BVOC emissions and ozone formation in urban areas is complex [9] and beyond the scope of this review. It was also clear, from examination of the bibliographies of the included BVOC studies, that the search for this review had not identified all available studies on this topic. For both reasons, no synthesis of data from these studies has been undertaken. Meta-data for the six studies are in Additional file 1.
Review limitationsThe purpose of this review was to update a systematic review published 10 years ago. The authors therefore fol-lowed the original protocol as closely as possible, with only minor modifications where necessary, such as to the search strategy due to database or other source changes, or to methodology to ensure compliance with CEE Guidelines which had changed since the original review was undertaken. The authors also sought to extend the review to address secondary questions relating to effect modification, which had not previously been addressed.
The rapid increase in studies published on the topic since the original review resulted in a large body of rel-evant research which out-stripped the available human

Page 30 of 38Knight et al. Environ Evid (2021) 10:12
resources therefore progress in the review was intermit-tent and took longer than anticipated. The review update could have been curtailed to make a more manage-able workload however, this would have meant that the update would have limitations to its usefulness; it would not have necessarily progressed the evidence base.
The search was conducted in English, but no language limitations were placed on the review search strategy and foreign language articles were included. Eleven included papers were published in languages other than English. On-line translation resources together with reviewer language skills were used to translate these articles. It is possible however that inaccuracies in translation led to misinterpretation of methods or findings. Most such articles, however, gave English translations of figure and table titles and an English abstract.
On-line resources were used for extracting data from figures where necessary. Initial checks revealed the diffi-culty of obtaining 100% repeatability of data extracted in this way. Resource constraints meant that it was not pos-sible to double-extract data from figures thus data from these sources can only be regarded as estimates. Wher-ever available however, the authors checked the extracted data against what was reported in the article text when referring to specific figures.
Study validity (risk of bias) grading did not appear to modify observed effects of green areas on outcomes and it is unclear whether this is due to poor sensitivity of the grading system for detecting important sources of bias, lack of range in grades (the majority of studies were given high risk of bias grades), or whether it reflects a real lack of impact of study validity on outcome. It is recom-mended that consideration be given to standardising and validating a numerical scoring system for use across CEE systematic reviews.
The high diversity of study designs, nature and loca-tions of green areas studied, and outcomes measured, resulted in a complex data set which was challenging to synthesise, and thus only simplistic relationships could be explored.
The review only included studies providing empiri-cal data. Some included studies reported outcome data from remote sensing studies which would require sepa-rate appraisal. These could not be synthesised along with ground-level data so have not been included in the review results. Additional file 3 provides a list of these studies.
Limitations of the evidence baseSimilar limitations were identified as in the original review in that, of necessity, most comparisons were of existing sites rather than specifically designed experi-ments (with some exceptions in green roof and wall stud-ies). Matching of green and non-green sites is therefore
limited by what is present in the urban environment. There was a noticeable lack of evidence from ‘controlled before and after’ type studies, where new urban green spaces were created and their impact evaluated, although it is acknowledged that resource and urban space con-straints are likely to restrict the extent to which this may be possible at full scale. Similarly, apart from green roof and wall studies, studies of experimental design are not a practical option.
Replication limits the extent to which the findings may be generalisable; for some types of greening groups there were only relatively small numbers of studies included in the review, the number of sites studied, and the num-ber of replicate measurements made varies considerably across studies, the nature and size of the green area var-ies and data are collected at different times of year. Low replication may also mean that the independence of data points within a study is questionable.
Risk of bias due to unmatched data collection pro-cesses (or lack of reporting of checks such as calibration of equipment) also reduces the confidence that can be placed in the findings of many studies. The evidence base could also be improved by less variation and greater con-sistency in outcome measures.
Some studies deliberately selected clear/sunny, warm and calm days in which to take temperature measure-ment as this is when the urban heat island is considered to be most detectable. However, this limits investigation of the effect of different weather conditions on the link between land cover type and temperature in this review.
The standard of reporting, of vegetation type and abundance of green sites, the extent to which sites were matched for key variables and of data collection meth-ods, varied considerably across the included studies. Many studies did not report outcome data in a format which enabled calculation of effect size; some did not report measures of variance or details of any statistical tests undertaken (it was often not clear if data had been subject to any such tests).
In general, the high diversity of green areas studied and often poor reporting of the nature and extent of vegeta-tion in these spaces limits the usefulness of the evidence base to those seeking to design urban green spaces to maximise human well-being.
Review conclusionsImplications for policy/managementThere are a large number of studies published on this topic-mostly concerned with the effect of green areas on temperature. Systematic maps and reviews that fol-low methodological guidelines aimed at maximis-ing reliability of findings are necessary to increase
Page 31 of 38Knight et al. Environ Evid (2021) 10:12
accessibility of this substantial body of research findings to decision-makers.
Overall, there is confirmation of the findings of original review in that urban green areas tend to be cooler than urban areas with little or no vegetation, with mean cool-ing effect (from meta-analysis) ranging from less than 1 to 2 °C, depending on the type of greening intervention.
The evidence suggests that trees, whether within parks and gardens, singly or in clusters, provide important cooling effects in their immediate environment during the day due to shading from solar radiation and evapo-transpiration. Urban forests accentuate the cooling effect of trees. Cooling effect shows species variation and dif-ferences in tree canopy shading appears to contribute to this variation. However, there is a balance to be struck between maximising tree canopy area for daytime cool-ing effect and avoiding reducing radiative cooling at night. This is particularly the case for street trees where the evidence is less consistent, particularly for night-time, suggesting that cooling effect is influenced by street geometry and orientation; sky view factor is an important consideration.
Urban parks and gardens vary considerably in extent and type of vegetation and the evidence indicates that this affects cooling performance. Park and garden trees were the most important factor for day-time cooling effect but appear to slow radiative heat loss at night. Open grassy areas are cooler than neighbouring hard, non-green surfaces but day-time cooling effect is lower than for trees. However, open grassy areas cool more rapidly at night. Thus, overall, the evidence suggests that the balance of open grassy areas and tree shaded areas in a park or garden is important and influences the extent to which the park or garden cooling effect operates both during the day and at night. Whilst some studies find cooling effect to increase with park or garden area, others do not; the relationship between park or garden size and cooling effect appears complex, possibly due to interac-tion between size and shape. Analysis of park or garden cooling effect indicated that this decreases with distance from park or garden edges but can extend up to 1.25 km beyond the park boundaries thus the density and spacing of green spaces within an urban area is likely to be impor-tant for combatting the UHI effect.
Human thermal comfort depends primarily upon the ambient temperature, relative humidity and extent of exposure to solar radiation. The evidence indicates that tree shade provides improved thermal comfort in urban areas thus access to treed areas, including parks and gar-dens with trees, could help reduce thermal stress where UHI during the day is a public health risk. The same issue of balance between treed and open grassy areas as
noted for daytime and night-time cooling effect applies to impact on thermal comfort.
Overall, the evidence reviewed suggested that ozone levels were either no different or higher in treed areas. Concentration of NOx, the ratio of NO to NO2, concen-tration of BVOCs and temperature will vary within urban areas, thus the overall impact of any one green area, on ground-level ozone levels, is complex and difficult to predict. The evidence reviewed was clearer for NOx; treed areas appeared to provide an environment lower in NOx, particularly close to the sources of these pollut-ants. Assimilation/removal of NOx by trees was reported to vary by species as did emission of BVOCs, suggesting that choice of species for urban areas needs to be guided by both factors.
The cooling effect of green roofs on the near environ-ment is a complex picture and reported data do not iden-tify any one design that can offer optimal benefit in all situations. In designing green roofs consideration should be given to the local climate and whether the need for a cooling effect from a green roof is greater during the day or night. Choice of substrate depth/roof construc-tion might depend on the balance between the need for greater water retention during the day and the need to minimise thermal insulation by the substrate layer thus maximising heat loss during the night. Choice of plant species might be affected by whether increased evapo-transpiration during the night is more important than shading by vegetation during the day. A key considera-tion is whether irrigation is a sustainable option as main-taining soil water content at a level which will support healthy plant growth/maximise cover appears to be one of the most important factors in maximising cooling ben-efits. The evidence also suggests a balance needs to be struck between canopy height and density to maximise cooling through shading during the day and achieving optimal night-time heat loss. Similar considerations need to be given to green walls.
The focus in this review has been on cooling effects of urban greening in summer, for trees in leaf, as this is when the impact of UHI on public health is likely to be most problematic. However, some studies report that even leafless trees can provide significant shading which is an important consideration in climate zones where high levels of solar radiation persist year-round.
Sustainability of green areas, particularly the need for irrigation, will be an increasingly important considera-tion and design of green areas, particularly choice of spe-cies, needs to take this into consideration.
In conclusion, the evidence confirms the importance of green, particularly treed, areas for mitigation of the potential impacts of climate change on public health. The consistency of effect across climate zones suggests that
Page 32 of 38Knight et al. Environ Evid (2021) 10:12
findings, in general, are transferable, however research is relatively lacking in some climate zones which might benefit most. Local environmental conditions do, how-ever, need to influence how urban greening interventions are designed i.e., balance of treed and open green areas, choice of plant species; some of the studies included in this review provide useful evidence for specific climate zones. The review identified studies which employed var-ious numerical models to explore the potential impacts of urban green areas on the outcomes of interest. Modelling studies were out of scope for this review but, where ade-quately validated using data from relevant climate zones and type of local environment, could provide useful tools for evaluating different designs for specific urban green areas.
The focus of this review has been on potential ben-efits of urban green areas for specific public health out-comes and our conclusions are drawn in this context. We acknowledge however that urban green spaces are important for other reasons; for recreation, social inter-action and physical activity. The design of green spaces will therefore also need to take account of this.
Most studies included in the review investigate the micro-scale. The epidemiological studies provide some, limited, evidence at a population level that targeting urban greening interventions, specifically trees, in areas with the highest population density, concentration of lower socio-economic neighbourhoods and with the lowest levels of existing green cover, could provide the greatest potential for mitigation against climate change induced, heat and NOx related public health harm and the highest return on investment. However this strat-egy would need careful appraisal at local level before implementation.
Implications for researchDespite the rapid increase in the number of studies on urban greening there are still areas of the world, and cli-mate zones, where the impact of climate change on UHI will be more severe but which are poorly covered by the available research; Africa, S.E. Asia, South America/trop-ical and arid zones. The key findings emerging from the evidence synthesised in this review appear not to vary significantly between climate zones and so may be con-sidered transferable. However, urban greening interven-tions do need tailoring to specific local environmental conditions and evaluation of interventions shown effec-tive elsewhere, in the local setting, is necessary.
The impact of urban green areas on temperature has been extensively researched and it is recommended that future updates produce systematic maps in order
to maintain accessibility to new research, rather than full syntheses, as it seems unlikely that the direction of finding will change with the addition of new research. Future syntheses should focus on aspects of this review which remain relatively un-explored or lacked the data to address fully, particularly in relation to effect modifica-tion, so as to better inform design of urban green spaces and impact on human heat-related morbidity. Future syntheses might also focus on data from studies using remote sensing technology.
Whilst some studies included in this review provided useful evidence on the relationship between green space size and shape, optimal density and spacing of public green areas, policy makers will require further research on this, particularly for parks and urban forest, if the spe-cific public health benefits considered in this review are to be optimised.
Studies included in this review, particularly tree stud-ies, measured RH as well as temperature. RH was not included as an outcome in this update, or the original review, as thermal comfort indices were an included out-come measure and many of these used data on RH. How-ever, future research could further explore the interaction between temperature, RH and green areas in the context of human thermal comfort, particularly focussing on the most vulnerable population groups or most affected areas within a city. The wide range of indices used for thermal comfort research, and for some studies, the lack of detail about the green areas studied, made it difficult to synthesise the whole body of research. Greater stand-ardisation of outcome measures and improved reporting of the type and extent of green areas studied would aid design of urban green areas for optimal thermal comfort.
There is relatively less research on the impact of urban green areas on ground-level ozone and its precursor pol-lutants. The contribution of urban vegetation to the level of BVOCs, the interactions between these, NOx and other urban pollutants and their impact on the formation of ozone, in the urban environment, needs further inves-tigation. However, the complexity of the relationships between these chemical species and tree species varia-tion in NOx assimilation and BVOC emissions makes the estimation of the overall impact of urban greening challenging.
Whilst it is acknowledged that designing studies to assess the impact of urban greening on public health related outcomes is challenging there are some basic aspects of study design which need to be incorporated into further research into this subject. Whenever pos-sible, sites should be matched for important known or potential effect modifiers or confounding factors, for
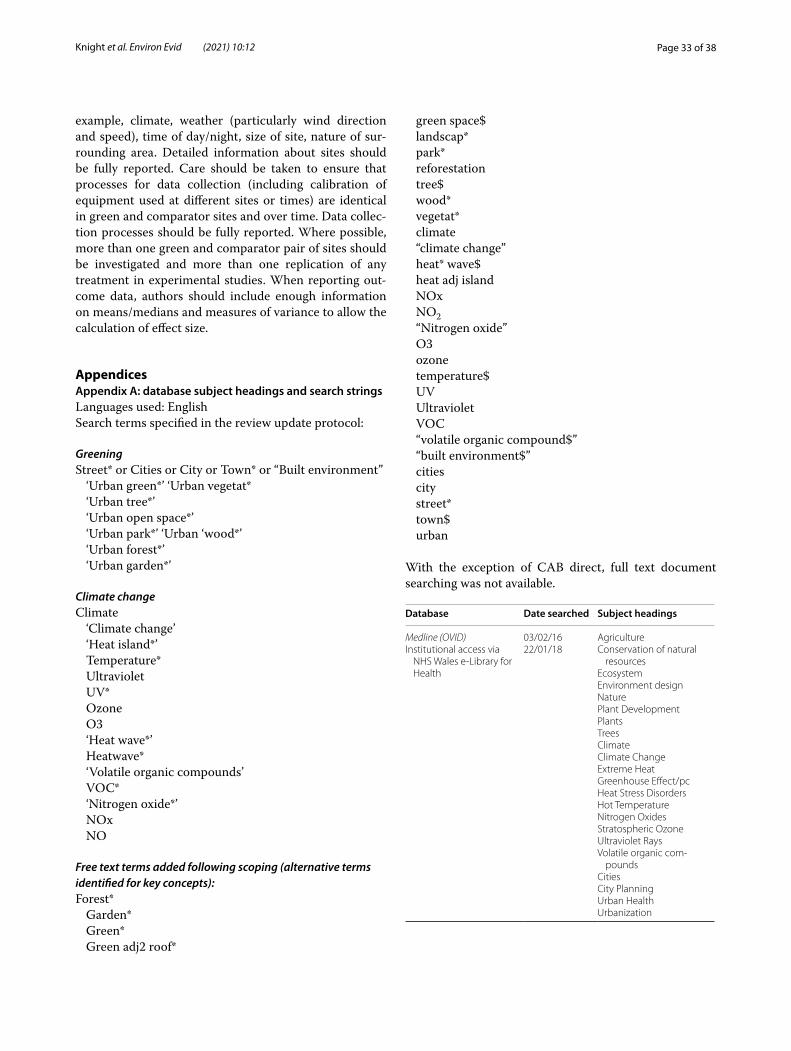
Page 33 of 38Knight et al. Environ Evid (2021) 10:12
example, climate, weather (particularly wind direction and speed), time of day/night, size of site, nature of sur-rounding area. Detailed information about sites should be fully reported. Care should be taken to ensure that processes for data collection (including calibration of equipment used at different sites or times) are identical in green and comparator sites and over time. Data collec-tion processes should be fully reported. Where possible, more than one green and comparator pair of sites should be investigated and more than one replication of any treatment in experimental studies. When reporting out-come data, authors should include enough information on means/medians and measures of variance to allow the calculation of effect size.
AppendicesAppendix A: database subject headings and search stringsLanguages used: EnglishSearch terms specified in the review update protocol:
GreeningStreet* or Cities or City or Town* or “Built environment”
‘Urban green*’ ‘Urban vegetat*‘Urban tree*’‘Urban open space*’‘Urban park*’ ‘Urban ‘wood*’‘Urban forest*’‘Urban garden*’
Climate changeClimate
‘Climate change’‘Heat island*’Temperature*UltravioletUV*OzoneO3‘Heat wave*’Heatwave*‘Volatile organic compounds’VOC*‘Nitrogen oxide*’NOxNO
Free text terms added following scoping (alternative terms identified for key concepts):Forest*
Garden*Green*Green adj2 roof*
green space$landscap*park*reforestationtree$wood*vegetat*climate“climate change”heat* wave$heat adj islandNOxNO2“Nitrogen oxide”O3ozonetemperature$UVUltravioletVOC“volatile organic compound$”“built environment$”citiescitystreet*town$urban
With the exception of CAB direct, full text document searching was not available.
Database Date searched Subject headings
Medline (OVID)Institutional access via
NHS Wales e-Library for Health
03/02/1622/01/18
AgricultureConservation of natural
resourcesEcosystemEnvironment designNaturePlant DevelopmentPlantsTreesClimateClimate ChangeExtreme HeatGreenhouse Effect/pcHeat Stress DisordersHot TemperatureNitrogen OxidesStratospheric OzoneUltraviolet RaysVolatile organic com-
poundsCitiesCity PlanningUrban HealthUrbanization
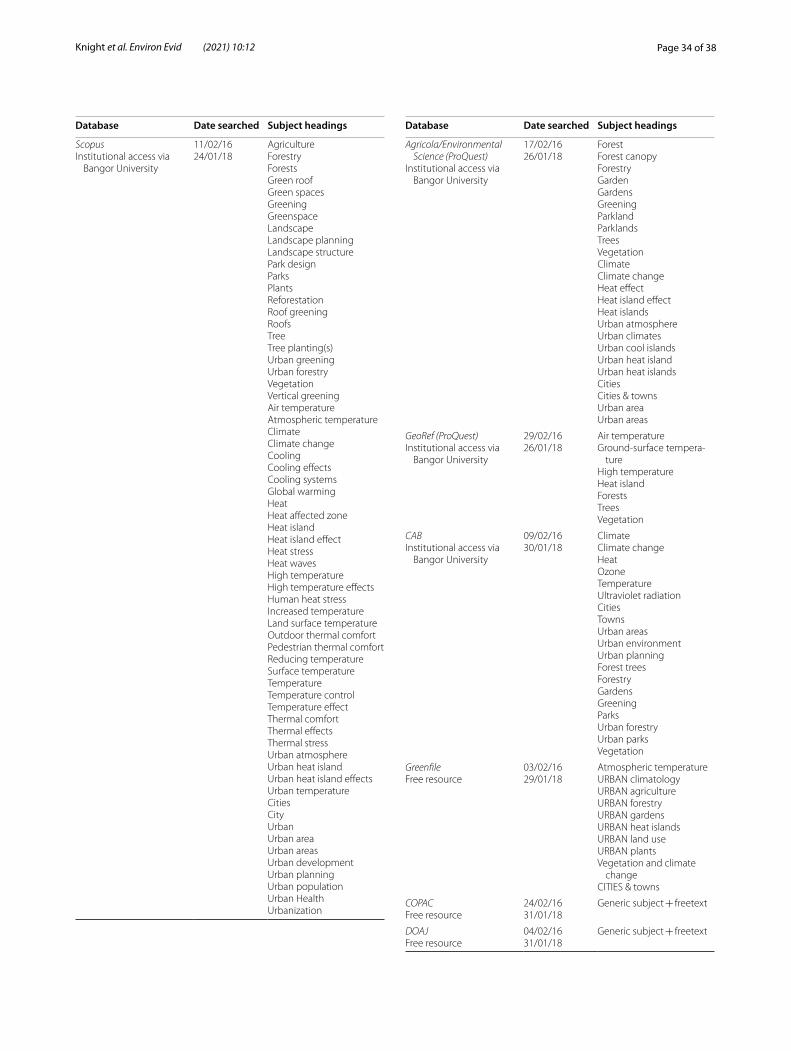
Page 34 of 38Knight et al. Environ Evid (2021) 10:12
Database Date searched Subject headings
ScopusInstitutional access via
Bangor University
11/02/1624/01/18
AgricultureForestryForestsGreen roofGreen spacesGreeningGreenspaceLandscapeLandscape planningLandscape structurePark designParksPlantsReforestationRoof greeningRoofsTreeTree planting(s)Urban greeningUrban forestryVegetationVertical greeningAir temperatureAtmospheric temperatureClimateClimate changeCoolingCooling effectsCooling systemsGlobal warmingHeatHeat affected zoneHeat islandHeat island effectHeat stressHeat wavesHigh temperatureHigh temperature effectsHuman heat stressIncreased temperatureLand surface temperatureOutdoor thermal comfortPedestrian thermal comfortReducing temperatureSurface temperatureTemperatureTemperature controlTemperature effectThermal comfortThermal effectsThermal stressUrban atmosphereUrban heat islandUrban heat island effectsUrban temperatureCitiesCityUrbanUrban areaUrban areasUrban developmentUrban planningUrban populationUrban HealthUrbanization
Database Date searched Subject headings
Agricola/Environmental Science (ProQuest)
Institutional access via Bangor University
17/02/1626/01/18
ForestForest canopyForestryGardenGardensGreeningParklandParklandsTreesVegetationClimateClimate changeHeat effectHeat island effectHeat islandsUrban atmosphereUrban climatesUrban cool islandsUrban heat islandUrban heat islandsCitiesCities & townsUrban areaUrban areas
GeoRef (ProQuest)Institutional access via
Bangor University
29/02/1626/01/18
Air temperatureGround-surface tempera-
tureHigh temperatureHeat islandForestsTreesVegetation
CABInstitutional access via
Bangor University
09/02/1630/01/18
ClimateClimate changeHeatOzoneTemperatureUltraviolet radiationCitiesTownsUrban areasUrban environmentUrban planningForest treesForestryGardensGreeningParksUrban forestryUrban parksVegetation
GreenfileFree resource
03/02/1629/01/18
Atmospheric temperatureURBAN climatologyURBAN agricultureURBAN forestryURBAN gardensURBAN heat islandsURBAN land useURBAN plantsVegetation and climate
changeCITIES & towns
COPACFree resource
24/02/1631/01/18
Generic subject + freetext
DOAJFree resource
04/02/1631/01/18
Generic subject + freetext
Page 35 of 38Knight et al. Environ Evid (2021) 10:12
Database Date searched Subject headings
SIGL/OpenGreyFree resource
16/03/1631/01/18
Freetext only
Social Sciences in ForestryFree resource via Univer-
sity of Minnesota
18/03/1629/01/18
Freetext only
Database search stringsScopus (((built environment$ OR cities OR city OR street* OR town$ OR urban) OR(KEY(cities OR city OR urban OR (urban AND areas)
OR (urban AND area) OR (urban AND development) OR (urban AND planning)) OR KEY ((urban AND popula-tion) OR (urban AND health) OR urbanization))
AND (((Forest* OR garden* OR green* OR (green roof) OR (green space$) OR landscap* OR park* OR reforestation OR tree$ OR wood* OR vegetat*) OR (KEY(agriculture OR forestry OR forests OR (green AND roof) OR (green AND spaces) OR (greening) OR greens-pace OR landscape) OR KEY ((landscape AND planning) OR (landscape AND structure) OR (park AND design) OR parks OR plants) OR KEY (reforestation OR (roof AND greening) OR roofs OR tree OR(tree AND plant-ing) OR (urban AND greening) OR vegetation OR (urban AND forestry) OR (vertical AND greening))) AND (((Cli-mate OR (climate change) OR (heat* wave$) OR (heat island) OR NOx OR NO2 OR Nitrogen oxide OR O3 OR ozone OR temperature$ OR UV OR Ultraviolet OR VOC OR (volatile organic compound$) OR
KEY ((high AND temperature) OR (high AND temper-ature AND effects) OR (human AND heat AND stress) OR (increased AND temperature) OR (land AND surface AND temperature) OR (outdoor AND thermal AND com-fort)) OR KEY ((pedestrian AND thermal AND comfort) OR (reducing AND temperature) OR (surface AND tem-perature) OR temperature OR (temperature AND effect) OR (temperature AND control) OR (thermal AND com-fort) OR (thermal AND effects) OR (thermal AND stress)) OR KEY ((urban AND atmosphere) OR (urban AND heat AND island) OR (urban AND heat AND island AND effects) OR (urban AND temperature)) OR ((KEY ((air AND temperature) OR (atmospheric AND temperature) OR climate OR (climate AND change) OR cooling OR (cooling AND effects) OR (cooling AND systems)) OR KEY ((global AND warming) OR heat OR (heat AND island) OR (heat AND island AND effect) OR (heat AND stress) OR (heat AND waves))) AND (((KEY ((high AND tem-perature) OR (high AND temperature AND effects) OR (human AND heat AND stress) OR (increased AND tem-perature) OR (land AND surface AND temperature) OR (outdoor AND thermal AND comfort)) OR KEY ((pedes-trian AND thermal AND comfort) OR (reducing AND
temperature) OR (surface AND temperature) OR tem-perature OR (temperature AND effect) OR (temperature AND control) OR (thermal AND comfort) OR (thermal AND effects) OR (thermal AND stress)) OR KEY((urban AND atmosphere) OR (urban AND heat AND island) OR (urban AND heat AND island AND effects) OR (urban AND temperature))) OR ((KEY ((air AND temperature) OR (atmospheric AND temperature) OR climate OR (cli-mate AND change) OR cooling OR (cooling AND effects) OR (cooling AND systems)) OR KEY ((global AND warm-ing) OR heat OR (heat AND island) OR (heat AND island AND effect) OR (heat AND stress) OR (heat AND waves))) AND (LIMIT-TO (PUBYEAR, 2007–2016)).
Ovid MEDLINE(R) 1996 to current (at date of searches)
1. Plants/ or Environment Design/ or green space$.mp.
2. exp Urban Health/ 3. exp Stratospheric Ozone/ 4. exp Ultraviolet Rays/ 5. exp Extreme Heat/ 6. heatwave$.mp. 7. heat*wave$.mp. 8. (heat adj island).mp. 9. exp Cities/ 10. exp City Planning/ 11. *"Plant Development"/ 12. exp Trees/ or woodland.mp. 13. vegetation.mp. or Agriculture/ 14. parks.mp. 15. open space$.mp. 16. (green adj2 roof*).mp. 17. (urban and green*).mp. 18. (urban and (wood* or forest* or park* or vegetation
or tree$ or garden*)).mp. 19. exp Nitrogen Oxides/ 20. exp Volatile Organic Compounds/ 21. *"Hot Temperature"/ 22. exp Urbanization/ 23. exp Greenhouse Effect/pc [Prevention & Control] 24. exp *"Conservation of Natural Resources"/ 25. exp Ecosystem/ 26. exp Heat Stress Disorders/ 27. exp Extreme Heat/ 28. (climate or climate change).mp. 29. exp Climate Change/ or exp Climate/ 30. temperature$.mp. 31. UV.mp 32. ultraviolet.mp. 33. 31 or 32 34. (ozone or O3).mp. 35. (volatile organic compound$ or VOC).mp.
Page 36 of 38Knight et al. Environ Evid (2021) 10:12
36. (nitrogen oxide or NOx or NO2).mp. 37. (street$ or cities or city or town$).mp. 38. built environment$.mp. 39. 1 or 11 or 12 or 13 or 14 or 15 or 16 or 17 or 18 or
24 or 25 40. 2 or 9 or 10 or 22 or 37 or 38 41. 3 or 4 or 5 or 6 or 7 or 8 or 19 or 20 or 21 or 26 or
27 or 28 or 29 or 30 or 33 or 34 or 35 or 36 42. 39 and 40 and 41 43. limit 42 to (humans and yr = "2007 -Current")
AGRICOLA (Proquest)((climate OR climate change OR heat effect OR heat
island effect OR heat islands OR urban atmosphere OR urban climates OR urban cool islands OR urban heat island OR urban heat islands) OR (climate or “climate change” or “heat* wave$” or “heat island$” or NOx or NO2 or “Nitrogen oxide” or O3 or ozone or tempera-ture$ or UV or ultraviolet or VOC or “volatile organic compound$”)).
AND ((Forest OR forest canopy OR forestry OR garden OR gardens OR greening OR parkland OR parklands OR trees OR vegetation) OR (forest* or garden* or green* or “green roof*” or “green space$” or landscap* or park* or reforestation or tree$ or wood* or vegetat*)).
AND ((cities OR cities & towns OR urban area OR urban areas) OR (“built environment$” or cities or city or street* or town$ or urban)).
Date limits applied.
GeoRef (Proquest):(air temperature OR ground-surface temperature OR
high temperature OR heat island) OR (climate or “cli-mate change” or “heat* wave$” or “heat island$” or NOx or NO2 or “Nitrogen oxide” or O3 or ozone or temper-ature$ or UV or ultraviolet or VOC or “volatile organic compound$”)).
AND ((forests OR trees OR vegetation) OR (forest* or garden* or green* or “green roof*” or “green space$” or landscap* or park* or reforestation or tree$ or wood* or vegetat*)).
AND (“built environment$” or cities or city or street* or town$ or urban)).
Date limits applied.
Greenfile((atmospheric temperature OR URBAN climatol-
ogy OR URBAN heat islands) OR (climate or “climate change” or “heat* wave$” or “heat island$” or NOx or NO2 or “Nitrogen oxide” or O3 or ozone or tempera-ture$ or UV or ultraviolet or VOC or “volatile organic compound$”)).
AND ((URBAN agriculture OR URBAN forestry OR URBAN gardens OR URBAN land use OR URBAN plants OR Vegetation and climate change) OR (forest* or garden* or green* or “green roof*” or “green space$” or landscap* or park* or reforestation or tree$ or wood* or vegetat*)).
AND (CITIES & towns) OR (“built environment$” or cities or city or street* or town$ or urban).
Date limits applied.
CAB((Climate OR climate change OR heat OR Ozone OR
temperature OR ultraviolet radiation) OR (climate or “cli-mate change” or “heat* wave$” or “heat island$” or NOx or NO2 or “Nitrogen oxide” or O3 or ozone or temper-ature$ or UV or ultraviolet or VOC or “volatile organic compound$”)).
AND ((forest trees OR forestry OR gardens OR green-ing OR parks OR urban forestry OR urban parks OR veg-etation) OR (forest* or garden* or green* or “green roof*” or “green space$” or landscap* or park* or reforestation or tree$ or wood* or vegetat*)).
AND ((cities OR towns OR urban areas OR urban envi-ronment OR urban planning) OR (“built environment$” or cities or city or street* or town$ or urban)).
Date limits applied.
COPAC; DOAJ; SIGL/OpenGrey; Social Sciences in ForestryFreetext searching using combination of:(Forest* or garden* or green* or “green roof*” or “green
space$” or landscap* or park* or reforestation or tree$ or wood* or vegetat*).
AND (climate or “climate change” or “heat* wave$” or “heat island$” or NOx or NO2 or “Nitrogen oxide” or O3 or ozone or temperature$ or UV or ultraviolet or VOC or “volatile organic compound$”).
AND (“built environment$” or cities or city or street* or town$ or urban).
Date limits applied.
Appendix B: Websites searchedLanguages used: English
California Energy CommissionCalifornia Environmental Protection AgencyCentre for Urban and Regional EcologyCenter for Urban Forest ResearchDesign Council (formerly Commission for Architec-ture and the Built Environment)Commonwealth Agricultural BureauEnvironment AgencyEuropean Environment AgencyFaculty of Public HealthForest Research
Page 37 of 38Knight et al. Environ Evid (2021) 10:12
Forestry CommissionGreenspace (including Greenspace Scotland)Health Protection AgencyRIVM (Dutch National Institute for Public Health and the Environment)National TrustNatural EnglandNatural Resources WalesRoyal Society of Public HealthScottish ExecutiveScottish Environment Protection AgencyScottish Natural HeritageStockholm Resilience CentreTyndall Centre for Climate Change ResearchUK Climate Impacts ProgrammeUK MAB Urban ForumUS Environment Protection AgencyUS Department of Energy (DOE)World Health Organisation
Supplementary InformationThe online version contains supplementary material available at https:// doi. org/ 10. 1186/ s13750- 021- 00226-y.
Additional file 1. Meta-data for included studies.
Additional file 2. Sources of data and effect sizes for meta-analyses.
Additional file 3. Remote sensing studies.
Additional file 4. Excluded studies.
Additional file 5. Outcome data extracted from included studies.
Additional file 6. Funnel plots for analysis of publication bias.
Additional file 7. Reference list for included articles.
Additional file 8. ROSES checklist.
AcknowledgementsThis project was supported by Public Health Wales through permitting TK, SP, SK and AH to undertake some of the work without external funding. Bangor University provided support with undertaking searches through enabling access to sources and we would like to acknowledge the assistance of Beth Hall at Bangor University who advised on undertaking searches and facilitated access to certain databases. We thank Professor Andrew Pullin for guidance in the protocol development stage, throughout the review process and for com-ments on early drafts of this report. We also thank George Pullin for checking the final report against CEE reporting standards and Eleanor Fallon for under-taking citation checking and formatting. We are especially grateful to the peer-reviewers who dedicated a considerable amount of time and effort to helping the authors improve the transparency and accuracy of the review report.
The authors listed below kindly responded to requests for further informa-tion about their studies:
B. Amor, E. Bozonnet, E. Di Giuseppe, K. Diock, D. Gopal, D. Leung, G. Li, P. Lin, J. Linden, S. Pauleit, M. Petralli, L. Rodriguez Potes, M. Vaz Monteiro, F. Yang, S. Yilmaz, C. Zhu.
At the time of making the request the review authors stated the intention to name those who responded, in the acknowledgements section.
Authors’ contributionsTK and DB conceived the original systematic review. TK, SP and DB conceived the update of the systematic review. SK and SP undertook the searches and
SP, SK and TK undertook title screening. AH contributed to article and missing data retrieval. SP and TK undertook abstract and full text screening, meta-data coding and study validity assessment. AH and TK undertook the descriptive statistics analyses. KK and RLR extracted the data for meta-analyses and narra-tive syntheses, which were undertaken by DB and TK. TK wrote this report with SP, SK, AH, DB, KK, contributing to the sections reporting on the specific review elements they undertook. All authors read and approved the final manuscript.
FundingThis update review was not supported by any external funding. Public Health Wales permitted some of the work to be undertaken by TK, SP, SK and AH during paid hours.
Availability of data and materialsAll data generated or analysed during this review are included in this report and its additional information files.
Declarations
Ethics approval and consent to participateNot applicable.
Consent for publicationNot applicable.
Competing interestsThe authors declare that they have no competing interests.
Author details1 Public Health Wales, 2 Capital Quarter, Tyndall Street, Cardiff CF10 4BZ, UK. 2 Public Health Wales, Building 1, St David’s Park, PO Box 108, Carmarthen SA31 3WY, UK. 3 German Centre for Integrative Biodiversity Research (iDiv), Friedrich Schiller University Jena, Halle-Jena-Leipzig, Deutscher Pl. 5E, 04103 Leipzig, Germany. 4 Public Health Wales, Floor 5, Number 2 Capital Quarter, Tyndall Street, Cardiff CF10 4BZ, UK. 5 Public Health Wales, 1st Floor, Matrix House, Northern Boulevard, Matrix Park, Swansea Enterprise Park, Swansea SA6 8DP, UK. 6 School of Natural Sciences, Bangor University, Bangor LL57 2UW, UK. 7 Faculty of Veterinary Medicine, University of Leipzig, An den Tierkliniken 1-43, 04103 Leipzig, Germany.
Received: 2 September 2020 Accepted: 5 May 2021
References 1. Intergovernmental Panel on Climate Change. IPCC fourth assessment
report: climate change. Cambridge: Cambridge University Press; 2007. 2. Confalonieri U, Menne B, Akhtar R, Ebi KL, Hauengue M, Kovats RS, Revich
B, Woodward A. Human health. In: Parry ML, Canziani OF, Palutikof JP, van der Linden PJ, Hanson CE, editors. Climate change 2007: impacts, adapta-tion and vulnerability. contribution of Working Group II to the fourth assessment report of the intergovernmental panel on climate change. Cambridge: Cambridge University Press; 2007. p. 391–431.
3. Vardoulakis S, Heaviside C. Health effects of climate change in the UK. London: Public Health England. Health Protection Agency; 2012.
4. Watts N, Adger WN, Agnolucci P, Blackstock J, Byass P, Caiet W, et al. Health and climate change: policy responses to protect public health. Lancet Comm. 2015. https:// doi. org/ 10. 1016/ S0140- 6736(15) 60854-6.
5. Watts N, Amann M, Ayeb-Karlsson S, Belesova K, Bouley T, Boykoff M, et al. The Lancet Countdown on health and climate change from 25 years of inaction to a global transformation for public health. Lancet. 2017. https:// doi. org/ 10. 1016/ S0140- 6736(17) 32464-9.
6. Smith KR, Woodward A, Campbell-Lendrum D, Chadee DD, Honda Y, Liu Q, Olwoch JM, Revich B, Sauerborn R, et al. Human health: impacts, adaptation, and co-benefits. In: Field CB, Barros VR, Dokken DJ, et al., edi-tors. Climate change 2014: impacts, adaptation, and vulnerability. Part A: global and sectoral aspects contribution of Working Group II to the Fifth Assessment Report of the Intergovernmental Panel on Climate Change. Cambridge: Cambridge University Press; 2014. p. 709–54.
Page 38 of 38Knight et al. Environ Evid (2021) 10:12
• fast, convenient online submission
•
thorough peer review by experienced researchers in your field
• rapid publication on acceptance
• support for research data, including large and complex data types
•
gold Open Access which fosters wider collaboration and increased citations
maximum visibility for your research: over 100M website views per year •
At BMC, research is always in progress.
Learn more biomedcentral.com/submissions
Ready to submit your researchReady to submit your research ? Choose BMC and benefit from: ? Choose BMC and benefit from:
7. Arnfield AJ. Two decades of urban climate research: a review of turbu-lence, exchanges of energy and water, and the urban heat island. Int J Climatol. 2003;23:1–26.
8. Lucas R, McMichael T, Smith W, Armstrong B. Environmental burden of disease series, No. 13 Solar Ultraviolet Radiatio Global burden of disease from solar ultraviolet radiation. Geneva: WHO; 2006.
9. European Environment Agency. Air quality in Europe—2019 report (10/2019). 2019. https:// doi. org/ 10. 2800/ 822355.
10. Armstrong BK, Kricker A. The epidemiology of UV induced skin cancer. J Photochem Photobiol B. 2001;63:8–18.
11. W.H.O. Fact Sheet No.227. Solar radiation and human health. Too Much Sun is Dangerous. 7 August 1999. https:// www. who. int/ uv/ resou rces/ fact/ en/ fs227 toomu chsun. pdf. Accessed 16 May 2020.
12. AGNIR. Ultraviolet Radiation, Vitamin D and Health (Report of the Independent Advisory Group on Non-ionising Radiation), Public Health England, London, UK. 2017. https:// assets. publi shing. servi ce. gov. uk/ gover nment/ uploa ds/ system/ uploa ds/ attac hment_ data/ file/ 620184/ UV_ Radia tion__ Vitam in_ D___ Health. pdf. Accessed 16 May 2020.
13. van der Rhee H, de Vries E, Coomans C, van de Velde P, Coebergh JW. Sunlight: for better or for worse? A review of positive and negative effects of sun exposure. Cancer Res Front. 2016. https:// doi. org/ 10. 17980/ 2016. 156.
14. Handley J, Carter J. Adaptation strategies for climate change in the urban environment. Draft final report to the National Steering Group. Manches-ter: University of Manchester; 2006.
15. Vandentoorn S, Brehin P, Zeghnoun A, Mandereau-Bruno L, Croisier A, Cochet C, et al. Heat wave in France: risk factors for death of elderly people living at home. Eur J Pub Health. 2003;6:583–91.
16. Gill S, Handley J, Ennos R, Pauleit S. Adapting cities for climate change: the role of the green infrastructure. Built Environ. 2007;30:97–115.
17. Norton BA, Coutts AM, Livesley SJ, Harris RJ, Hunter AM, Williams NSG. Planning for cooler cities: a framework to prioritise green infrastructure to mitigate high temperatures in urban landscapes. Landsc Urban Plan. 2015;134:127–38.
18. Watts N, et al. Health and climate change: policy responses to protect public health. Lancet Comm. 2015. https:// doi. org/ 10. 1016/ S0140- 6736(15) 60854-6.
19. WHO. Urban green spaces and health. Copenhagen: WHO Regional Office for Europe; 2016.
20. Heisler GM, Grant RH, Rao W. UV exposure in the shade. Bull Am Meteorol Soc. 2005;86(1):29.
21. Gies P, Elix R, Lawry D, Gardner J, Hancock T, Cockerell S, et al. Assessment of the UVR protection provided by different tree species. J Photochem Photobiol. 2007;83(6):1465–70.
22. Tan Z, Lau KKL, Ng E. Urban tree design approaches for mitigating day-time urban heat island effects in a high-density urban environment. Energy Build. 2016;114:265–74.
23. Hsieh CM, Li JJ, Zhang L, Schwegler B. Effects of tree shading and transpi-ration on building cooling energy use. Energy Build. 2018;159:382–97.
24. Bowler D, Buyung-Ali L, Knight T, Pullin A. Urban greening to cool towns and cities: A systematic review of the empirical evidence. Landscape and Urban Planning. 2010;97:147–55.
25. Block AH, Livesley ST, Williams NSG. Responding to the urban heat island—a review of the potential of green infrastructure. Victorian Centre for Climate Change Adaptation Research, Melbourne. 2012. http:// www. vcccar. org. au/ sites/ defau lt/ files/ publi catio ns/ VCCCAR% 20Urb an% 20Heat% 20Isl and% 20- WEB. pdf.
26. Zupancic T, Westmacott C, Bulthuis M. The impact of green space on heat and air pollution in urban communities. A meta-narrative systematic review. David Suzuki Foundation. 2015. https:// david suzuki. org/ scien ce- learn ing- centre- artic le/ impact- green- space- heat- air- pollu tion- urban- commu nitie s/#: ~: text= Report- ,The% 20Imp act% 20of% 20Gre en% 20Spa ce% 20on% 20Heat% 20and% 20Air% 20Pol lutio n,A% 20Meta% 2DNar rative% 20Sys temat ic% 20Rev iew& text= It% 20fou nd% 20that% 20urb an% 20gre en,cooli ng% 20eff ects% 20dur ing% 20ext reme% 20heat. Last accessed 10 Aug 2020.
27. CEE. Guidelines and standards for evidence synthesis in environmental management. Version 5.0. 2018. http:// www. envir onmen talev idence. org/ infor mation- for- autho rs.
28. Knight T, Price S, Bowler D, King S. How effective is ‘greening’ of urban areas in reducing human exposure to ground-level ozone concentra-tions, UV exposure and the ‘urban heat island effect’? A protocol to update a systematic review. Environ Evid. 2016;5:3. https:// doi. org/ 10. 1186/ s13750- 016- 0054-y.
29. Weatherbase. http:// www. weath erbase. com. Last accessed 20 July 2020. 30. WebPlotDigitiser. https:// autom eris. io/ WebPl otDig itizer/. Last accessed
20 July 2020. 31. National Geographic. https:// www. natio nalge ograp hic. org/ encyc loped
ia/ koppen- clima te- class ifica tion- system/. Accessed 9 Feb 2020.
Publisher’s NoteSpringer Nature remains neutral with regard to jurisdictional claims in pub-lished maps and institutional affiliations.