Embed Size (px)
Citation preview

1
HowEnergyEfficiencycutscostsforatwo-degreefuture
Dr.JakobWachsmuth(Fraunhofer ISI)
ECEEEpolicyseminar“AfterCOP21:Potentialsandpoliciesforenergyefficientdecarbonisation”
Brussels,8February2016

HowEnergyEfficiencycutscostsforatwo-degreefuture
• Introduction• Methodology• Impact• Regionalimplications• Conclusions
Contents
2

Background
3
EnergyEfficiency:ACheaperpathtoatwo-degreefuture
• RoleofEEindecarbonization• Whythisstudy?Whynow?• What’snew?– costsavingsandpolicyfocus• Whyregionsmatter?
INTRODUCTION
Historyshowshopeandchallenges
4
• Mostcountriesareproducingincreasinglymorefromeachunitofenergyconsumed
• Stricterfueleconomystandardshavedecoupledconsumptioninthetransportsectorfromeconomicgrowthbuttotalconsumptionisstillincreasing
0.000
0.050
0.100
0.150
0.200
0.250
0.300
0.350
0.400
1990 2000 2005 2009 2013
koe/$05p
Energy intensity of industry
World EU USA Brazil
Mexico China India
0.000
0.010
0.020
0.030
0.040
0.050
0.060
0.070
1990 2000 2005 2009 2013ko
e/$0
5p
Energy intensity of transport
World EU USA Brazil
Mexico China India
Source:ownrepresentationbasedontheEnerdata database
INTRODUCTION

Globalsavingsandclimatestabilization
5
Aggressiveefficiencypoliciesinbuildings,transport,industrykeytoachieving2degreetarget;cheapestcarbonabatementinmostnations.
Cumulativesavingsof
$2.5– 2.8Trillionto2030
Annualsavingsof
$440– 480Billionin2030
Cumulativesavingsof
$750Billionto2030fromhistorical
policies*
*Policiespassedsince1990in3Regions:China,EuropeanUnion,UnitedStates
Energyefficientpathwayvs.
Energyintensivepathway
INTRODUCTION

Methodology
6
Goal:Assesstheimpactofenergyefficiency(EE)onthecostofdecarbonization basedonexistingestimatesofEEandalternativedecarbonization measures
METHODOLOGY
METHODOLOGY
1. AssessmentofexistingEEpoliciesinthefocusregions
2. Reviewof2°Cscenariosandtheroleofenergyefficiency
3. ProjectionofcostreductionsbyEEpoliciesuntil2030
4. Conclusionsreviewed bylocalexperts

Contributors
7
Aglobalteamofenergyefficiencyexperts
Projectteam• JakobWachsmuth,VickiDuscha,MatthiasReuter,FraunhoferISI
• HannaFekete,MarkusHagemann,NiklasHöhne,NewClimate Institute
• BjoernDransfeld,FelixRöben,the greenwerk
Steering Committee• NilsBorg,ECEEE• FabiánGaioli,CoraliaEnviromental
• Dian Grueneich,StanfordUniversity
• StevenNadel,ACEEE• JamesWolf,independentconsultant
• JoachimSchleich,GrenobleEcole deManagement
METHODOLOGY

Contributors
8
Aglobalteamofenergyefficiencyexperts
Local experts• Brazil:Pontifical Catholic Universityof RiodeJaneiro,RodrigoFCaliliand ReinaldoCSouza
• China:ChineseAcademy of Sciences (CAS),YingFanand Jin-HuaXu• EU:Fraunhofer ISI,WolfgangEichhammer• India:TheEnergyandResources Institute India(TERI),Neha Pahuja• Mexico:Comisión Nacional para el UsoEficiente delaEnergía,JuanIgnacioNavarrette Barbosa
• US:ACEEE,StevenNadel+colleagues
METHODOLOGY
$Benefit
$Cost
emissionsreduction
energyefficientpathway energyintensivepathway
Generation
BuildingsandIndustry
Transport
InterventionType
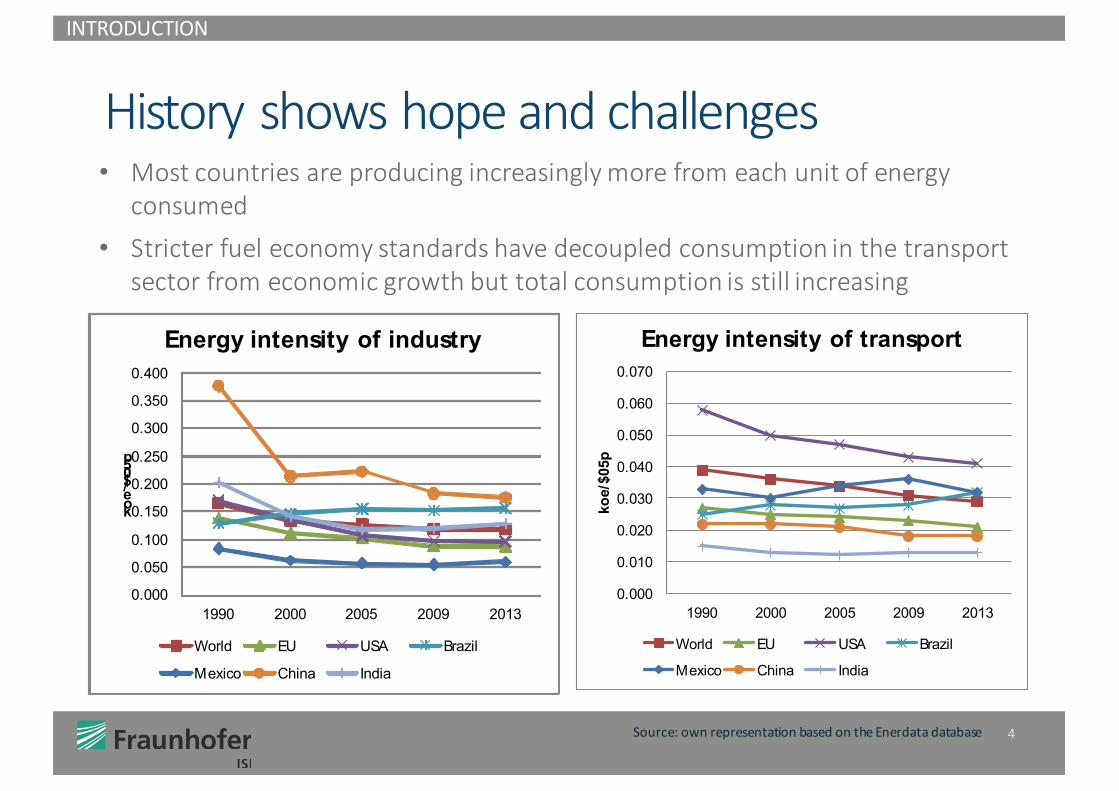
ComparingTwoPathwaysAfocusonenergyefficiencyturnsabatementcostsintoabatementbenefits.
Eventheenergyintensivepathwayrequiresloweringannualenergydemandinendusesectorsby7%in2030
Highefficiency inend-use sectorsgrants significant flexibility inchoosingoptions fordecarbonizing supply.
Anenergyefficientpathwaysaves$440–480Billiongloballyincomparisontoanenergyintensivepathway,
andyetbothmitigate15’400Mtofemissionsannuallyin2030.
PotentialInterventions
9
IMPACT

10
Highly efficient buildings come withlargeabatement potentials,butvarying cost-effectiveness.
Abatement potentials of REand nuclear powerare by farthe largest,butcosts of fully exploiting themwillbe high.
Until 2030,use of Carbon Capture&Storageboth for powergenerationand industrial processes is mainlyavoidable by energy efficiency &RE.
Efficiencygains inindustry showhugesaving potentials,inparticular inheavy industries.
Increasing fueleconomy of vehicleshighly cost-effectivewith much largerabatement potentialthan biofuels.
Theenergyefficientpathwaysaves$440–480Billiongloballyincomparisontoanenergyintensivepathway
PowerIndustry
0 10 30
Totalannualabatement[GtCO2e/y]
50
100
-50
-100
20
AnnualspecificcostsofGHGabatement[USD/tCO2e] Transport Buildings
$Benefit
$Cost
emissionsreduction
IMPACT
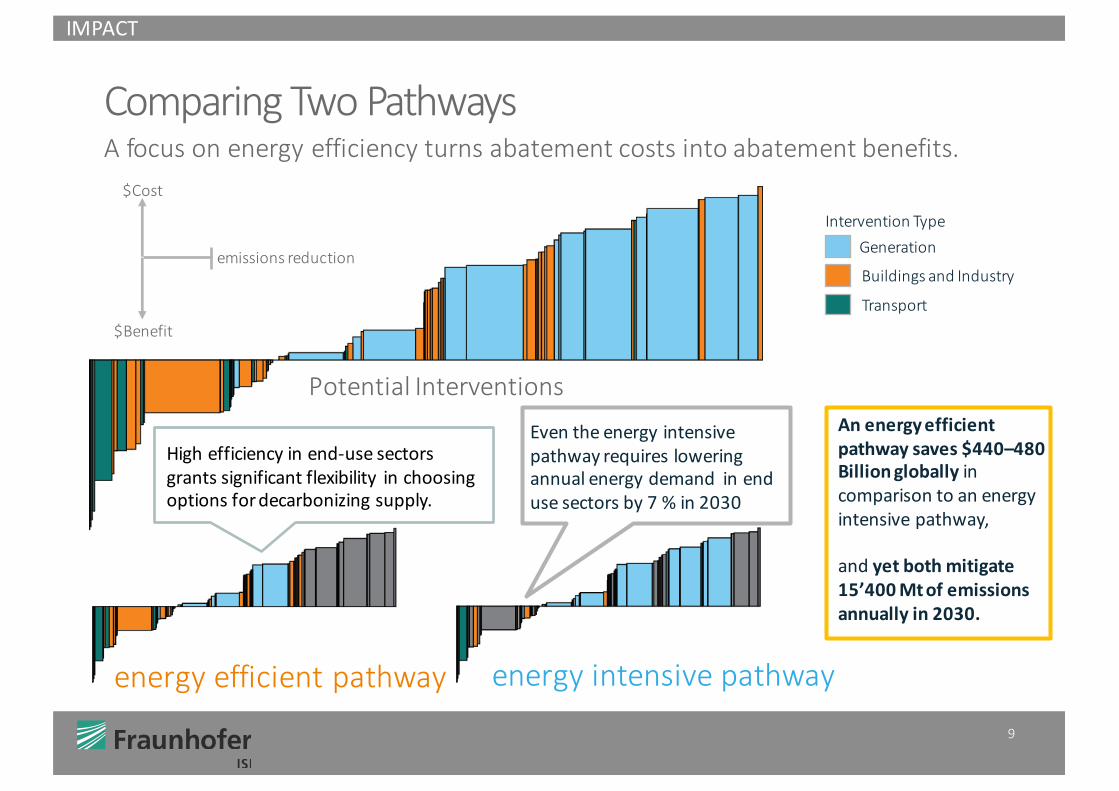
Significantcostsavingsandemissionsreductionin2030
11Morethan85%ofthosesavingsoccurinChina,theEuropeanUnion,andtheUnitedStates
ResultsfortheEnergyEfficiency Pathwayforsix-regionsinclude$220-250Billioninannualsavingsandreductionsof11,000MtCO2equivalentin2030.Notonlyisthisasignificantamountofsavingsfortheseregionsbutitisalargeshareoftheemissionsreductionneededreachatwo-degreepathway.
IMPACT

ChinainFocus
12
Energy Efficient vs.Energy IntensivePathway:• ComparedtoBAU,theIntensivePathwayreducesannualconsumptionby>14EJ
until2030.TheEfficientPathwayachievesadditional savingsof4.7- 6.0EJ.• RealizationoftheEfficientPathwaywouldreducetheannualnetcostsby54- 69
billionUSD(savingof10– 12USD/tCO2e).
Currentpolicies:• historicalEEpolicies, inparticularinindustry(TOP1000andTOP10000program),
havealreadydecreasedthenetcostsby52– 64billionUSDperannum.• significantunaddressed industrialpotentials,especially inthechemical industryand
theiron&steelsector,aswellasinpetroleumprocessingandcoking.• transportsectorrequiresadditionaleffortstoreducefuelconsumption,especially
inHDVs,butalsoamodalshiftinpublicandfreighttransport.
REGIONALIMPLICATIONS

BrazilinFocus
13
Energy Efficient vs.Energy IntensivePathway:• ComparedtoBAU,theIntensivePathwayreducesannualconsumptionby1.6EJuntil2030.TheEfficientPathwayachievesadditional savingsof0.7– 0.8EJ.
• RealizationoftheEfficientPathwaywouldreducetheannualnetcostsby13billionUSD(savingsof54– 55USD/tCO2e).
Currentpolicies:• Historic savings notquantified dueto data constraints butalsomarginalimpacts.• Significantpotentials inbuildingssectorcurrentlytargeted,particularlywithinPROCEL,butretrofitsofHVACsandair-conditioningcallforadditionalmeasures.
• Fortransport,strictfueleconomystandardsandinfrastructureforamodalshiftseemtobenecessaryadditionstotheexisting labelingofcars.
• Industryholdspotential fornumerousEEmeasuresthroughoutallsubsectors.
IMPACT

TheEUinFocus
14
Energy Efficient vs.Energy IntensivePathway:• ComparedtoBAU,theIntensivePathwayreducesannualconsumptionby4.1– 4.5EJuntil2030.TheEfficientPathwaydoublesthesavings(8– 9EJ).
• Realisation oftheEfficientPathwaywouldreducetheannualnetcostsby79– 82billionUSDin2030(savingof72– 75USD/tCO2e).
Currentpolicies:• HistoricalEEpolicieshavedecreasedfuturenetcostsbyatleast8– 10bill.USD/a.• RevisionofEEDwithaconcreteEEtargetfor2030and3rdNEEAPsdriveEE.Ecodesign directiveplaysarelevantroleforheatingandelectricalappliances .
• Realizing industrialpotentialsmainlydependsonsuccessfulreformoftheEUETS.• ModeratefueleconomystandardsforLDVs,absenceofstrongpoliciesforHDVs,andlackofEU-widestandardsforbuildingsretrofitsleaveroomforimprovements.
IMPACT
Conclusion– Global&Regionalimplications
15
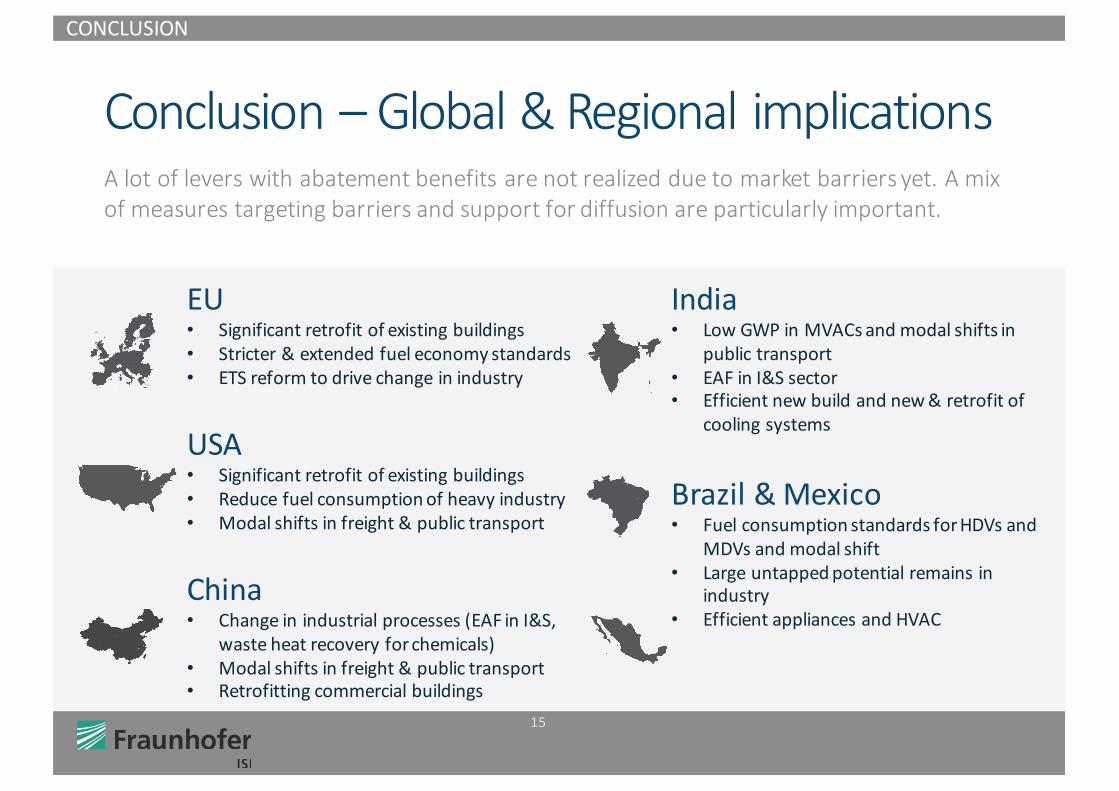
Alotofleverswithabatementbenefitsarenotrealizedduetomarketbarriers yet.Amixofmeasurestargetingbarriersandsupportfordiffusionareparticularly important.
India• LowGWPinMVACsandmodalshiftsin
publictransport• EAFinI&Ssector• Efficientnewbuildandnew&retrofitof
coolingsystems
Brazil&Mexico• FuelconsumptionstandardsforHDVsand
MDVsandmodalshift• Largeuntappedpotentialremainsin
industry• EfficientappliancesandHVAC
EU• Significantretrofitofexistingbuildings• Stricter&extendedfueleconomystandards• ETSreformtodrivechangeinindustry
USA• Significantretrofitofexistingbuildings• Reducefuel consumptionofheavyindustry• Modalshiftsinfreight&publictransport
China• Changeinindustrialprocesses(EAFinI&S,
wasteheatrecoveryforchemicals)• Modalshiftsinfreight&publictransport• Retrofittingcommercialbuildings
CONCLUSION

EnergyEfficiency:ACheaperpathtoatwo-degree future
Dr.JakobWachsmuthCompetenceCenterEnergyPolicyandEnergyMarketsFraunhofer InstituteforSystemsandInnovationResearchISI
BreslauerStraße48|76139Karlsruhe|GermanyPhone+497216809-632
[email protected]://www.isi.fraunhofer.de
ContactInformation
16

USAinFocus
17
Energy Efficient vs.Energy IntensivePathway:• ComparedtoBAU,theIntensivePathwayreducesannualconsumptionby3.8EJuntil2030.TheEfficientPathwayachievesadditionalsavingsof6.0– 6.3EJ.
• RealizationoftheEfficientPathwaywouldreducetheannualnetcostsby66– 72billionUSD(savingsof29– 33USD/tCO2e).
Currentpolicies:• HistoricalEEpolicieshavedecreasedfuturenetcostsby40– 43bill.USD/a,mainlyinducedbyCAFEstandardsforLDVs,appliancestandards&buildingenergycodes.
• CleanPowerPlan,updatesofCAFEstandardsandbuildingenergycodesarelikelytoboostenergyefficiencythroughoutallsectors.
• AchievingsignificantretrofitsofexistingbuildingsbiggestchallengeforEEpolicy-making.Otherchallenges includereducingfuel intensityinheavyindustries.
IMPACT
IndiainFocus
18
Energy Efficient vs.Energy IntensivePathway:• ComparedtoBAU,theIntensivePathwayreducesannualconsumptionby3.9EJuntil2030.TheEfficientPathwayachievesadditional savingsof1.1– 1.3EJ.
• RealizationoftheEfficientPathwaywouldreducetheannualnetcostsby10– 15billionUSD(savingsof6– 9USD/tCO2e).
Currentpolicies:• Historic savings notquantified dueto data constraints butalsomarginalimpacts.• Onlyalimited numberofEEmeasures isbeingimplemented.• Industryharborssavingpotentials iniron&steelproduction,whiletransporthaspotential forreducedfuelconsumption(mainlyHDVs).
• Bothefficientnew-buildsandreplacingexistingcoolingsystemsofferlargesavingpotentials inthebuildingssector.
IMPACT

MexicoinFocus
19
Energy Efficient vs.Energy IntensivePathway:• ComparedtoBAU,theIntensivePathwayreducesannualconsumptionby0.7EJuntil2030.TheEfficientPathwayachievesadditional savingsof0.1– 0.2EJ.
• RealizationoftheEfficientPathwaywouldreducetheannualnetcostsby1.9– 2.6billionUSD(savingof13- 17USD/tCO2e).
Currentpolicies:• Historic savings notquantified dueto data constraints butalsomarginalimpacts.• Whilebuildingssectorissystematicallytargetedusingnormsandlabeling,potentials inindustryandtransportsectoraddressedonlytoaminorextent.
• AdditionalmeasuresdebatedwithinPRONASE2013– 2018,whichholdshugepotentialtotargetnumerousEEoptionsinheavyindustryandtransport.
IMPACT

02000400060008000
100001200014000160001800020000
20052010202020302040205020602070208020902100
Energyinvestm
ents[billionUSD
(200
5)/a]
GEA_geala_450_atr_fullGEA_geala_450_atr_limbeGEA_geala_450_atr_limbe_limirGEA_geala_450_atr_limirGEA_geala_450_atr_nbecsGEA_geala_450_atr_nbecs_nsink_limbeGEA_geala_450_atr_noccsGEA_geala_450_atr_noccs_nonucGEA_geala_450_atr_nonucGEA_geala_450_atr_nsinkGEA_geala_450_btr_fullGEA_geala_450_btr_limbeGEA_geala_450_btr_limbe_limir
Reviewof the role of EEin2°Cscenarios
20
• Difficulttocomparedifferentmodels,butcoststendtobelowerinscenarioswithhighefficiencywhenusingthesamemodel
• FormostIAMs,EEmeasuresnotmodeledbutdemandreductionisassumed
• Investments(CAPEX&OPEX)inscenarioswithhigh(left)andlowefficiency(right):
Source:Enerdata database,whichisbasedonofficialnationalstatistics
02000400060008000
100001200014000160001800020000
20052010202020302040205020602070208020902100Energyin
vestments[b
illionUS
D(200
5)/a]
GEA_geaha_450_atr_full
GEA_geaha_450_atr_limbe
GEA_geaha_450_atr_limir
GEA_geaha_450_atr_nbecs
GEA_geaha_450_atr_nonuc
GEA_geaha_450_atr_nsink
GEA_geaha_450_btr_full
GEA_geaha_450_btr_nonuc
Source:representationbyNewClimate InstitutebasedontheGEAscenariodatabase
20