Embed Size (px)
Citation preview

Anthony Heath, Nan Dirk de Graaf and Yaojun Li*
There has been considerable controversy among academics in recent years as to whether social mobility has been declining in Britain. Both social scientists and policy makers have been much exercised by the question of whether there has been any change in patterns of intergenerational mobility – that is, in the extent to which the occupations or economic positions of sons and daughters are higher, lower or the same as those of their fathers (or mothers). (See, for example, the report of the Cabinet Office, 2008.) High rates of intergenerational mobility are usually taken to be a sign of an ‘open’ dynamic society where there is equality of opportunity for people from different backgrounds, whereas a high degree of intergenerational stability suggests a more ‘closed’ society where privileged positions are passed on from one generation to another.
The actual trends over time have been a source of considerable academic dispute. One frequently quoted piece of research by the economists Blanden and Machin (2007) showed that intergenerational earnings mobility has declined over recent decades (see also Ermisch and Nicoletti, 2007). Sociological researchers, however, such as Goldthorpe and Mills (2008), have suggested that intergenerational occupational mobility has been fairly stable over the last 30 years. (The two different findings are not formally incompatible since there could well have been changing patterns of earnings within occupational classes; although see Erikson and Goldthorpe (2010) for a discussion of the divergent findings.1) All researchers, however, do agree that there is less intergenerational mobility in Britain than in many other highly developed societies (see, for example, Breen, 2004), and all main political parties have taken the issue seriously. As Harriet Harman argued in her introduction to the report of the National Equality Panel:
* Anthony Heath is Professorial Fellow and University Professor of Sociology at
Nuffield College, Oxford University. Nan Dirk de Graaf is Official Fellow at Nuffield College, Oxford University. Yaojun Li is Professor of Sociology at the University of Manchester.
How fair is the route to the top? Perceptions of social mobility 2

BRITISH SOCIAL ATTITUDES
30
[Equality matters] for individuals, who deserve to … have the opportunity to fulfil their potential … for the economy, because the economy that will succeed in the future [is], not one which is blinkered by prejudice and marred by discrimination; for the society, because an equal society is more cohesive … (Harman, 2010: v)
Our concern in this chapter, however, is not with resolving debates about actual levels of social mobility but to explore people’s perceptions of their own occupational mobility, their perceptions of the routes to upward mobility and their perceptions of the inequalities between the positions in the occupational structure to which mobility gives access. Sociologists have often argued that it is people’s perceptions that will determine how they respond to events. This is particularly likely to be the case with social mobility, as the statistical techniques that sociologists and economists use to measure mobility are likely to be completely opaque to most lay people, including most policy makers. Ordinary people will have no direct experience of the abstract concepts used by social scientists such as ‘relative social mobility’ or of the measures used, such as ‘odds ratios’. But they may nonetheless have perceptions of whether or not they themselves have moved up the social ladder, compared with their mothers and fathers, whether there have been unfair obstacles to their attempts to climb the ladder, and whether the gaps between the rungs have become larger.
People’s perceptions of unfair obstacles are likely to be of particular significance, both in terms of generating pressures for reform and in terms of the wider legitimacy of elite institutions. Perceptions that access to higher-level positions is unfairly blocked can also lead to a lack of effort – ‘there’s no point in trying’ – and can in turn become a self-fulfilling prophecy.
Broadly speaking, Britain officially subscribes to an ethos of equal opportunities and meritocracy, where one’s life chances should depend on one’s own talents and effort. As the National Equality Panel (NEP) argued:
… the crucial test of whether inequalities in outcomes are seen as fair or unfair will depend on whether they reflect choices made against a background where the opportunities open to people were equal …, or whether they stem from aspects of their lives over which they have manifestly little control. (NEP, 2010: 4)
The latest British Social Attitudes survey confirms that equality of opportunity is indeed an ideal to which the great majority of the public subscribe. As many as 95 per cent of people agree2 with the statement “In a fair society every person should have an equal opportunity to get ahead.”
One of the key questions that we will attempt to answer in this chapter is whether people in Britain feel that the opportunities to gain access to advantageous outcomes are indeed fair or whether they depend on prior privileges open only to the few. However, the NEP seems to assume that fair access and equal opportunities will be sufficient to justify inequality of

How fair is the route to the top? Perceptions of social mobility
31
outcomes. In contrast we would argue that fair access may indeed be a necessary condition for inequalities of outcome to be seen as fair, but it may well not be a sufficient condition. People may still object to the magnitude of the inequalities in pay and reward given nowadays to top jobs, even if the routes to these top jobs are seen to be entirely fair and open. In other words, as well as looking at rates of mobility and at the fairness of the mobility chances open to people, we also need to consider the perceived fairness of the outcomes to which mobility gives access.
As part of the International Social Survey Programme (ISSP; further information on the ISSP can be found in Appendix 1 of this report.), British Social Attitudes in 2009 carried a number of questions on perceptions of occupational mobility, of the factors perceived to be associated with ‘getting ahead’, and of the acceptability of the inequalities in outcomes for those who have got ahead. These questions replicated similar questions asked in previous rounds, with some of the questions going back to 1987.
In the first section of this chapter we look at trends in perceptions of occupational mobility. Are people now less likely to think than people 20 years ago that they have been upwardly mobile? And how do these perceptions relate to more ‘objective’ sociological measures of occupational mobility?
In the second section we then look at people’s perceptions of what is needed in order to get ahead. To what extent do people perceive the factors involved to be ones that would normally be regarded as legitimate such as the ‘meritocratic’ factors of effort and educational achievement? Or are they rather less legitimate ones such as coming from a privileged background or who you know? How have these perceptions changed over time? Is there a growing groundswell of discontent about what it takes to get ahead? And is it the case that, as previous scholars have often argued, the successful are more likely to take a favourable view of the legitimacy of the processes involved, whereas the unsuccessful are more likely to view them as illegitimate?
In the third section we shift our attention from perceptions of processes of mobility to perceptions of the nature of the positions themselves, especially their level of reward. How acceptable do people find the current inequalities between occupational positions? And is it the case that people who think that the access routes to these positions are fair and open are also more likely to find the outcomes fair and legitimate?
Perceived social mobility
We begin, then, by looking at people’s perception of their own mobility; that is, at their own occupational status relative to that of their fathers. In 2009, British Social Attitudes asked a question that was first asked in 1987, and which therefore allows us to chart trends in people’s perceptions of their occupational mobility over the last 22 years. Unfortunately the original question asked only about mobility compared with one’s father, although nowadays one would also want to ask about mobility compared with one’s mother, too.

BRITISH SOCIAL ATTITUDES
32
We asked: Please think of your present job (or your last one if you don’t have one now) If you compare this job with the job your father had when you were 16, would you say that the level or status of your job is (or was) Much higher than your father’s Higher About equal Lower Much lower than your father’s I have never had a job
Table 2.1 shows the trends over time.
Table 2.1 Perceived rates of intergenerational occupational mobility, 1987–2009
1987 1992 1999 2009
Level/status of job is ... % % % %
… much higher than father’s 16 18 14 12 … higher than father’s 30 30 26 27 … about equal 26 27 27 28 … lower than father’s 17 14 15 16 … much lower than father’s 4 5 7 7 … never had a job 2 2 1 1
Base 1212 1066 804 958
Two features stand out from Table 2.1. The first concerns perceived ‘long-range’ mobility, that is, people thinking that they are in a much higher or much lower position than their fathers. In all four years, perceived long-range upwards or downwards mobility was relatively rare. Thus only around 20 per cent of people in each year thought that their position was much higher or much lower than that of their father. More detailed investigation shows that people who believed that they had experienced such long-range mobility were typically ones who had moved from semi- or unskilled manual origins to professional or managerial positions, or vice versa. And standard accounts of ‘objective’ occupational mobility also show that such long-range mobility is relatively rare (e.g. Goldthorpe, 1987).
Second, again in all four years, there were more people who thought that they had been upwardly mobile than people who thought that they had experienced

How fair is the route to the top? Perceptions of social mobility
33
downwards mobility. Thus in the most recent survey, 39 per cent think that they are in a higher job than their fathers (combining both the responses “much higher” and “higher”), while only 23 per cent think they are lower. This perceived excess of upwards over downwards mobility accords well with the data from sociologists’ ‘objective’ measures of mobility based on comparisons of fathers’ and sons’ (or daughters’) occupational positions: over the last half- century, Britain has seen an expansion of higher-level managerial and professional occupations and a contraction of traditional working-class or manual jobs (see, for example, Li and Heath, 2010, Table 6.1). There has thus been greater ‘room at the top’ for sons as compared with their fathers, whose occupational careers were typically shaped some 20 to 25 years earlier.
So far, then, the results for subjective perceptions of mobility are in close accord with standard sociological accounts. When we turn to trends over time, however, the two stories diverge. Whereas sociologists have typically found no change over time in overall rates of occupational mobility, people’s perceptions are more pessimistic. They give a story of a lower level of perceived upwards mobility in the most recent decade, while perceived downwards mobility has remained stable or if anything increased too. The changes are most noticeable in the case of ‘long-range’ upwards – which has declined from 16 per cent in 1987 to 12 per cent in 2009 – and of long-range downwards mobility – which has increased from four per cent to seven per cent in 2009. These are not especially large changes, but the direction of change seems clear enough (and the differences between 1987 and 2009 are statistically significant). So in this respect the public’s reports tally with the analysis of the pessimists such as Blanden and Machin who have found declining earnings mobility in the more recent period.
It is naturally of considerable interest to check whether these perceived changes correspond at all closely to what might be (somewhat misleadingly) termed the ‘objective’ patterns of change in mobility as measured by sociologists from data on the occupations of fathers and sons (or daughters). We have used data from the General Household Survey for 1987, 1992 and 2005 (the most recent available) and from the British Household Panel Study for 1999 in order to estimate ‘objective’ measures of long-range upwards, short-range upwards, long-range downwards, short-range downwards and, of course, intergenerational stability broadly comparable to the structure of Table 2.1.
In estimating the percentages we have divided occupations into three broad classes. Our highest class is the ‘salariat’, which is composed of professional and managerial workers in relatively secure salaried positions with occupational pensions and the like. These would generally be regarded as the most desirable positions in the labour market, although we must remember that there will be very considerable variation within this class between those in senior posts and those in more junior posts. Our lowest class is composed of semi- and unskilled workers in manual or personal service occupations (described as ‘routine’ positions in official classifications). We can term this the class of ‘routine’ workers. In between these two classes comes what we can term the ‘intermediate’ class containing positions such as clerical, shopkeepers and

BRITISH SOCIAL ATTITUDES
34
trades people, foremen, technicians and skilled manual workers. (This classification corresponds broadly to those used by sociologists such as Goldthorpe, 1987; Goldthorpe and Mills, 20083).
We then define long-range mobility as any intergenerational movement between the salariat and the routine class, while short-range mobility is defined as movements between these two classes and the intermediate class. It is important to recognise that the exact amount of mobility that we find will depend on how many classes we identify. Sociologists often use a seven-class schema developed by John Goldthorpe and his colleagues, and if we were to use this more elaborate scheme we would inevitably find more mobility and less stability. However, our concern here is not with the absolute level of mobility but with the trends over time. We would not expect the trends to differ much between our three-class classification and more elaborate ones.
The results are shown in Table 2.2.
Table 2.2 ‘Objective’ rates of intergenerational occupational mobility, 1987–20094
1987 1992 1999 2009
Mobility between classes % % % %
Long-range upwards 4 4 5 7 Short-range upwards 24 26 28 27 Stable 47 46 46 43 Short-range downwards 24 21 18 21 Long-range downwards 2 3 3 3
Base 10,297 12,080 6,931 8,839
Sources: General Household Survey (1987, 1992, 2005); British Household Panel Survey (1999). All respondents aged 18 and over, with no upper age limit, classified according to present or last main job Table 2.2 shows even less long-range mobility than people had perceived in Table 2.1. However, as we noted above, this is partly an artefact of how many classes we have distinguished and where we have drawn the boundaries between them. The more important difference between the two tables, however, is in the character of the trends. Whereas Table 2.1 had shown a decline in long-range upwards mobility (and something of a decline in short-range upwards mobility, too), Table 2.2 shows the reverse, with both long-range and short-range upwards mobility increasing over time. This is a striking disparity between the ‘subjective’ and ‘objective’ trends.
How are we to account for this discrepancy in the trends shown by Tables 2.1 and 2.2? One possibility is that people, when interpreting whether their own occupation is at a higher or lower level or status than that of their father, are taking into account their social standing relative to other people. Sociologists on

How fair is the route to the top? Perceptions of social mobility
35
the other hand tend to focus on access to certain types of occupation, which are assumed to have a fairly constant character over time.
One of the key points that sociologists make is that the size of the salariat has been growing – which is why there is increasing ‘room at the top’ and hence more upwards mobility. And this is indeed what we find in the data on which Table 2.2 is based: in 1987, 30 per cent of the population were in the salariat, whereas by 2005 this had increased to just over 40 per cent. However, someone who occupies a position at the bottom of the salariat would, in 2005, have 39 per cent of the population ‘above’ him, whereas someone in the same position in 1987 would have had only 29 per cent of people above him. His or her relative standing was thus lower in 2005 than it would have been 20 years before. So someone who is a junior manager today, and whose father was also a junior manager 20 years earlier, may feel that he has slipped down the occupational ranking since there will now be many more people above him in the ranking than there were in his father’s time.
In other words, in answering our questions, people may be thinking about where they stand in the ranking, whereas sociologists typically consider the employment conditions of the job that they hold. This has interesting parallels with debates over educational measurement. Educationists make a distinction between ‘norm-referenced’ and ‘criterion-referenced’ measurement; a norm-referenced test measures whether the test-taker did better or worse than other people who took the test, whereas a criterion-referenced test measures whether the test-taker has reached a specified standard or criterion (such as being able to add two single-digit numbers together). In effect we believe that people may well be taking a norm-referenced approach to social standing, whereas sociologists typically take a criterion-referenced approach to the measurement of social mobility.
This may also explain why people’s subjective reports are more in accord with the judgements of the economists about trends in social mobility. Economists typically look at movement between percentile categories, such as the top and bottom 10 per cent of earners, which is, in effect, a norm-referenced approach and essentially focuses on people’s relative standing within the income hierarchy. It would seem, then, on this evidence, that the economists’ findings may well be vindicated by the public’s approach to understanding social mobility.
Perceptions of what is needed to get ahead
We turn next to consider whether this decline in perceived mobility is associated with any decline in the extent to which people think that access to elite occupations has become more slanted towards people from privileged backgrounds and less based on the kinds of principle, such as meritocracy, that are generally regarded as legitimate in a liberal democracy that espouses equality of opportunity.
Meritocracy was once famously defined by Michael Young, in his satire The

BRITISH SOCIAL ATTITUDES
36
Rise of the Meritocracy (1958), as a situation where positions were allocated on the basis of ‘IQ plus effort’. Nowadays, sociologists and policy makers would regard meritocracy as more a matter of whether people were allocated on the basis of their formal achievements (such as their educational qualifications) and effort as opposed to a society where allocation was governed by ‘ascriptive’ factors such as family background, race or gender. There have been heated debates about whether Britain is, in fact, a meritocracy (similar in some ways to the debates about mobility in Britain) but the sociological consensus has largely been that both achieved and ascribed factors continue to be important (see, for example, Saunders, 1995; Lampard, 1996; Marshall and Swift, 1996).
As part of the ISSP module we asked a number of questions that tapped the extent to which the public (as opposed to sociologists) believes that various achieved and ascribed characteristics affect people’s chance of getting ahead. We asked the following:
To begin, we have some questions about opportunities for getting ahead … Please tick one box for each of these to show how important you think it is for getting ahead in life … How important is … … coming from a wealthy family? … having well-educated parents? … having a good education yourself? … having ambition? … hard work? … knowing the right people? … having political connections? … giving bribes? … a person’s ethnicity? … a person’s religion? … being born a man or a woman?
The response codes are “essential”, “very important”, “fairly important”, “not very important”, “not important at all”, and “can’t choose”. Most of these questions had also been asked in the three previous rounds of the ISSP module.
The various items correspond to different theories about what are the main influences on who gets ahead. One theory is the classic meritocratic theory, which corresponds to the ideals of a liberal society such as contemporary Britain, to which we have already alluded. The items “having a good education” and “hard work” clearly belong to the meritocratic theory as, perhaps, does “ambition”.
A second set of items, “knowing the right people”, “having political connections” and “bribes” corresponds to sociological theories about the role of contacts and connections in obtaining desirable occupations (see, for example, Granovetter, 1973; Lin et al,. 1981). These would generally be seen as non-meritocratic factors which give insiders an advantage in the competition for top jobs and which serve to exclude outsiders or people from non-elite

How fair is the route to the top? Perceptions of social mobility
37
backgrounds. In the British context we would not expect bribery to be seen as a major factor, and its inclusion in the list is more because the ISSP is also conducted in countries where bribery and corruption are seen to be endemic.
Thirdly we have the items “coming from a wealthy family”, “well-educated parents”, “ethnicity”, “religion” and “being born a man or a woman” which would normally be seen as ascriptive factors. That is, these are all largely matters connected with the family that one is born into and over which one has no choice oneself. Religion does not fit all that well into this group, since one can, of course, choose to convert to or leave a religion, although in general there is strong tendency for people to ‘inherit’ their religions from their families of origin.
To be sure, these theories are not mutually exclusive. For example, social connections might be one of the main mechanisms which explain why white men from wealthy backgrounds tend to be advantaged when competing for jobs, or why women or ethnic minorities are excluded from such positions. Furthermore, some sociologists would argue that the chances of obtaining a good education are crucially dependent upon one’s family background, and in that sense is not nearly so ‘meritocratic’ as it appears at first sight. Indeed, as we noted above, most sociologists would tend to argue that, in a country like Britain, all three sorts of explanation have a role to play in explaining ‘who gets ahead’, although they disagree about the relative importance of the different factors. Table 2.3, then, shows what people think about their importance.
Table 2.3 Perceptions of what is important for getting ahead, 1987–2009
1987 1992 1999 2009
% saying factor is essential or very important
Meritocratic factors Hard work 84 84 n/a 84 Good education 72 74 n/a 74 Ambition 79 74 n/a 71 Non-meritocratic factors Knowing the right people 39 35 41 33 Having political connections 7 7 n/a 6 Giving bribes n/a n/a n/a 2 Ascriptive factors Well-educated parents 27 28 n/a 31 Wealthy family 21 15 19 14 A person’s religion 5 3 n/a 9 A person’s race/ethnicity 16 15 n/a 8 Being born a man or a woman 11 12 n/a 8
Base 1212 1066 804 958
n/a = not asked

BRITISH SOCIAL ATTITUDES
38
The great majority of people see the meritocratic items, namely “having a good education oneself” and “hard work”, as either essential or very important. Over three-quarters think these are crucial, and the figure has stayed fairly constant over time. There is no sign in Table 2.3 that these two meritocratic principles are perceived to be on the decline in Britain, although there is some decline in the perceived importance of ambition. Possibly this decline reflects the circumstances at the time of the 1987 survey when Thatcherism, with its emphasis on opportunities for the aspirational members of society, was at its height.
However, many people feel that meritocracy is not the only game in town. Family background – “having well-educated parents” – is also seen to be crucial by around a third of people, as is “knowing the right people”. However, there is little sign that these elements of privilege are seen to be more important today than they were previously. In fact, there have been slight declines in the percentage who think that “coming from a wealthy background” or “knowing the right people” is essential or very important, although this is balanced by a slight increase in the percentage who think that “having well-educated parents” is essential or very important. And it is reassuring that very few people see political connections, and even fewer see bribes, to be very important.
Markedly less important, too, in the eyes of the public are the other ascriptive factors – ethnicity (termed race in the two earlier surveys), religion and gender. Indeed, there is something of a decline in the percentage of people who think that ethnicity and gender are very important for getting ahead.
If we carry out a factor analysis (further information on factor analysis can be found in Appendix I of this report) of these items,5 in essence checking how the people’s answers about different items are correlated, we find three main dimensions only one of which corresponds perfectly to one of the three sociological theories described above. One dimension corresponds to the classic ‘meritocratic’ principles of a good education and hard work, together with ambition. A second dimension might be interpreted as one focusing on ‘privilege’, broadly defined. This dimension includes coming from a wealthy background, having well-educated parents (although this particular item is also quite strongly related to the meritocratic dimension) as well as the non-meritocratic factors of knowing the right people, and having political connections. A third dimension covers the ‘ascribed’ characteristics of race/ethnicity, gender and religion.
It is interesting that people tend to link coming from a wealthy background and having well-educated parents with knowing the right people and political connections, rather than with ethnicity, religion or gender. Possibly people believe that different obstacles, such as discrimination, are faced by women or ethnic minorities and that the issues around these ascribed factors amount to more than (as could be the case for coming from a wealthy background and having well-educated parents) simply a matter of lacking the right connections. This would not be an unreasonable interpretation, although we do not have the data to investigate it further in this chapter. (For details of the factor analyses see Tables A1 and A2 in the appendix to this chapter.)

How fair is the route to the top? Perceptions of social mobility
39
So the perception of British society which people have is one of qualified meritocracy: most people think that effort, ambition and education are important, but many also think that privilege in the form of family background and/or connections are important, too. In this respect our respondents are rather good sociologists. Standard sociological accounts indicate that education is the single most important influence on one’s success, but that family background is also important – even among people with similar educational levels (e.g. Heath et al., 1992). Many sociologists have also emphasised the importance of social connections in finding good jobs, while other sociologists have emphasised the barriers that ethnic minorities and women experience (Heath and Yu, 2005; Joshi, 2005).
To fully understand how people view what it takes to ‘get ahead’, we need to know the relative weight that people place on the importance of each of these three dimensions. Who thinks that only one of these dimensions explains why some people get ahead and others do not, and who thinks that the mechanisms are more nuanced? To look at this issue, we classified people into three main types:
• Utopians: who think that the meritocratic factors of education and effort
(or ambition) are the only ones that are either essential or very important, and who do not give so much weight to the non-meritocratic factors.
• Realists: who think that in addition to the meritocratic factors, at least
one of the main non-meritocratic factors (wealthy family, well-educated parents, knowing the right people, political connections, ethnicity, religion or gender) is also essential or very important.
• Cynics: who think that none of the meritocratic factors are either
essential or very important. What we find is that the realists are the most numerous group amounting to 53 per cent of the sample in 2009, with a fair number of utopians (41 per cent) and very few cynics (only 6 per cent). In line with the detailed results of Table 2.3, there is rather little change over time in the percentages of utopians, realists and cynics. In 1987 there were fewer utopians (only 37 per cent) and more realists (59 per cent), but in 1992 the percentages were almost identical to those from the most recent survey.
Our next question is whether people’s own mobility experiences colour their perceptions of what it takes to get ahead. Are the upwardly mobile more likely to adopt the utopian view, while the downwardly mobile are more likely to be[come] cynics? Theorists have often suggested that people who have done well out of the current system will take a more favourable view of it, whereas those who have not done so well will be more cynical about it. Table 2.4 gives us our answer.

BRITISH SOCIAL ATTITUDES
40
Table 2.4 Subjective intergenerational mobility for utopians, realists and cynics
Utopians Realists Cynics Base
Level/status of job is ...
… much higher than father’s % 43 53 4 111
… higher than father’s % 45 53 3 259
… about equal % 40 50 10 269
… lower than father’s % 40 53 7 160
… much lower than father’s % 33 60 7 69
All % 41 53 6 868
Table 2.4 suggests that subjective mobility experiences have only a weak relationship with people’s perceptions of what it takes to get ahead. As had been expected, there is a tendency for the upwardly mobile to be somewhat more utopian and less cynical in their views, and for the downwardly mobile to be less utopian and more realistic. But the differences are very modest and certainly do not suggest any especial crisis in the legitimacy of British institutional arrangements.
Further analysis of other possible drivers of these perceptions, such as people’s ‘objective’ mobility experiences, their occupational standing, their educational level and their wealth, all produce similarly modest relationships in the expected direction. People who have missed out are indeed slightly more cynical, while those who have got to the top take a somewhat rosier view, but there is no great gulf in perceptions between those at the top and the bottom. People differ in their perceptions of what it takes to get ahead, but the differences in perception are only weakly structured by one’s own social position in society.
Outcomes
So far, then, we find that the declining rates of subjective social mobility have not been associated with a perception that meritocracy is waning, and we have seen no sign of a growing groundswell of discontent about the avenues for getting ahead. However, as we emphasised earlier, a perception that meritocracy is the major determinant of who gets ahead should not necessarily be taken to indicate that the distribution of outcomes will also be regarded as fair and legitimate. People may be reasonably happy with what it takes to climb the ladder, but they may not be so happy about the height of the ladder. This is an empirical matter to which we now turn.
We have regularly asked the following question about the actual and the appropriate level of earnings of a range of jobs, covering both highly paid positions such as company chairmen or cabinet ministers and lower-paid jobs
How fair is the route to the top? Perceptions of social mobility
41
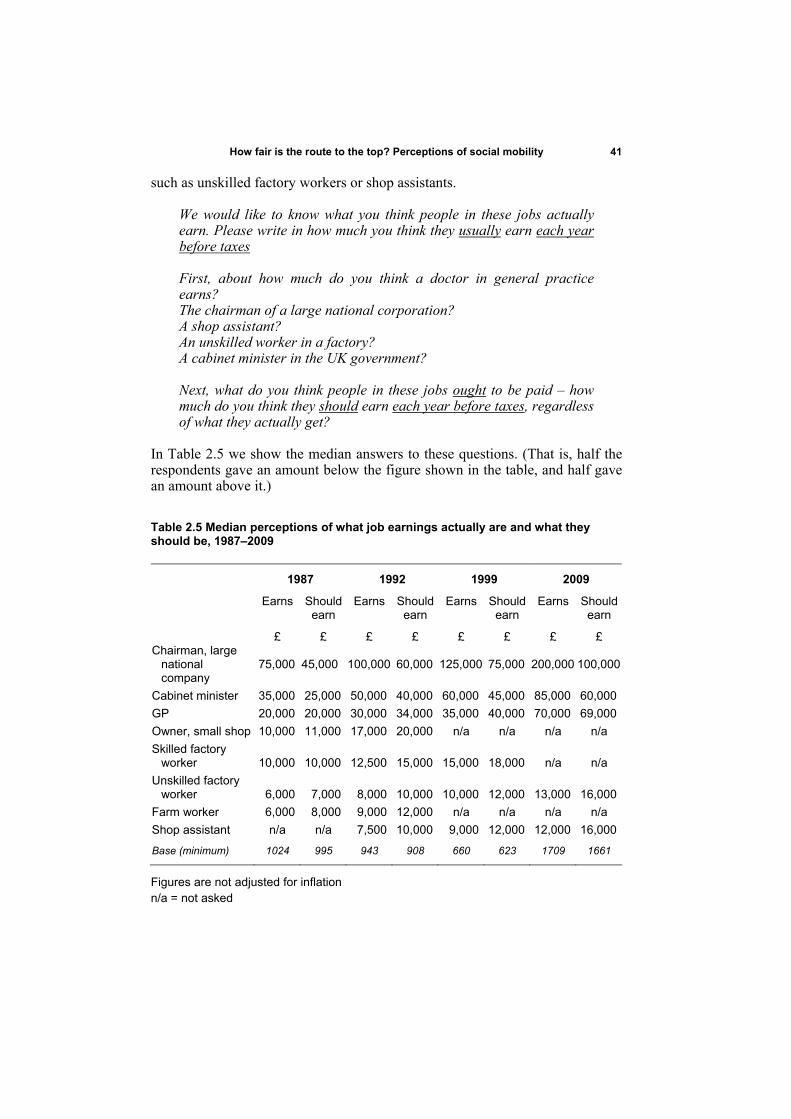
such as unskilled factory workers or shop assistants. We would like to know what you think people in these jobs actually earn. Please write in how much you think they usually earn each year before taxes First, about how much do you think a doctor in general practice earns? The chairman of a large national corporation? A shop assistant? An unskilled worker in a factory? A cabinet minister in the UK government? Next, what do you think people in these jobs ought to be paid – how much do you think they should earn each year before taxes, regardless of what they actually get?
In Table 2.5 we show the median answers to these questions. (That is, half the respondents gave an amount below the figure shown in the table, and half gave an amount above it.)
Table 2.5 Median perceptions of what job earnings actually are and what they should be, 1987–2009
1987 1992 1999 2009
Earns Should earn
Earns Should earn
Earns Should earn
Earns Should earn
£ £ £ £ £ £ £ £ Chairman, large
national company
75,000
45,000 100,000 60,000 125,000 75,000
200,000
100,000
Cabinet minister 35,000 25,000 50,000 40,000 60,000 45,000 85,000 60,000 GP 20,000 20,000 30,000 34,000 35,000 40,000 70,000 69,000 Owner, small shop 10,000 11,000 17,000 20,000 n/a n/a n/a n/a Skilled factory
worker
10,000 10,000 12,500 15,000 15,000 18,000
n/a
n/a Unskilled factory
worker
6,000 7,000 8,000 10,000 10,000 12,000
13,000
16,000 Farm worker 6,000 8,000 9,000 12,000 n/a n/a n/a n/a Shop assistant n/a n/a 7,500 10,000 9,000 12,000 12,000 16,000
Base (minimum) 1024 995 943 908 660 623 1709 1661
Figures are not adjusted for inflation n/a = not asked

BRITISH SOCIAL ATTITUDES
42
There are several striking findings. First, we can see that people clearly accept the notion of higher pay for ‘top’ jobs. There is a clear hierarchy with respondents feeling that the chairman of a large national company should get paid more than a cabinet minister or GP, with a skilled factory worker or owner of a small shop coming in the middle of the earnings hierarchy, and a shop assistant, farm worker or unskilled factory earning rather less.
Second, it is equally clear that, in all four years in which these questions have been asked, people felt that the actual earnings of people in these jobs were considerably more unequal than they ought to be. For example, in 1987, the median perceived earnings of the chairman of a large national company were 12.5 times that of a farm worker or unskilled factory worker (£75,000/£6000), whereas the appropriate or fair ratio was thought to be slightly over 6:1 (£45,000/£8000). In fact, in all four years people on average felt that the earnings of the top jobs should be reduced while those of the bottom jobs should be raised (see the chapter by Rowlingson et al. in this report for an examination of attitudes to income inequality and redistribution).
It is also worth recording that people almost certainly underestimate the actual salaries of the top earners. Getting reliable estimates of top salaries is almost as contentious as measuring social mobility, but we can at least get authoritative measures of cabinet ministers’ pay. In 2009, for example, the actual salaries of cabinet ministers were, at £144,500, over 50 percent higher than the £85,000 estimated by our median respondent.6 And in 2006/7 (the latest year for which data have been published) GPs in England typically earned around £110,000, over 50 per cent higher than people’s median estimate of £70,000.7 We are not brave enough to try and estimate the actual salaries of chairs of large national companies (partly because of the uncertainty of who exactly is included in this category). However, the National Equality Panel reported that, in 2008, the average remuneration of the chief executive officers (CEOs) of the FTSE top 100 companies was £2.4 million a year, while that of the next largest 250 companies was £1.1 million. To be sure, a CEO technically is a different position from the Chair of the Board, while the FTSE top 100 companies include many multinational companies (such as BP, for example) and not just large national companies. We would guess, then, that people substantially underestimate these salaries, probably to an even greater extent than they have underestimated the salaries of GPs and cabinet ministers.
At the lower end, in contrast, people’s perceptions appear to be more accurate. From the 2009 Labour Force Survey8 we have been able to estimate that the average hourly earnings of women in the ‘routine’ class (which would include shop assistants) were £6.55. This would gross up (assuming a 36-hour working week and payment for all 52 weeks of the year) to somewhere around the £12,000 estimated by our median respondent for shop assistants (whom people might typically assume to be women). Average earnings are rather higher for male routine workers, which people have therefore probably underestimated. However, they are probably as not as far out as they are with the GPs and cabinet ministers. Our estimate (from the Labour Force Survey) of hourly earnings for male routine workers in 2009 was £8.29, which would gross up to

How fair is the route to the top? Perceptions of social mobility
43
around £15,000 per annum compared with our median respondent’s estimate of £13,000 for unskilled factory workers (shown in Table 2.5). But this would still represent an overestimate of only 15 per cent. So the ‘true’ ratios between the earnings of different occupations are very likely to be considerably larger than those perceived by people, and reported in Table 2.6.
The third striking point that we take from Table 2.5 involves changes in people’s perceptions over the time period. There is a clear pattern for earnings inequalities to be perceived to be larger in 2009 than in any of the previous years. Table 2.6 shows how the ratios (taking the unskilled factory worker’s median perceived earnings as the base) have changed over time. In particular the ratio between top (chairman of large national company) and bottom (unskilled worker) is perceived to have widened from 13:1, where it had been in all three previous surveys, to 15:1 in 2009. Similarly the cabinet minister:unskilled worker ratio in 2009 is the highest that it has been in any of the four surveys (up to nearly 7:1 from the approximately 6:1 that it had been in the three previous surveys), and so is the GP:unskilled worker ratio (up to over 5:1 compared with less than 4:1 in the previous surveys). So there is very clearly a perception in 2009 of widening differentials.
It is difficult to determine the extent to which people’s perceptions of increased inequalities between 1999 and 2009 are borne out in reality. The salaries of cabinet ministers are readily available and are shown to have increased by 30 per cent between 1999 and 2009, rather less than our median respondent’s estimate of an increase of 42 per cent over this period.9 It is very likely that the MPs, expenses row and the media attention on MPs, remuneration led people to feel that cabinet ministers, too, had gained excessively over this period. On the other hand, there can be little doubt that GPs’ salaries did increase very substantially over this period following the renegotiation of their contracts.10 And the National Equality Panel shows very clearly that, in real terms, the remuneration of CEOs of large companies rose by very much more between 1999 and 2008 than did those of the average employee.11
Table 2.6 Perceived earnings ratios relative to those of an unskilled factory worker, 1987–2009
1987 1992 1999 2009 Earns Should
earn Earns Should
earn Earns Should
earn Earns Should
earn (ratio) (ratio) (ratio) (ratio) (ratio) (ratio) (ratio) (ratio)
Chair, large national company
13
6
13
6
13
6
15
6
Cabinet minister 6 4 6 4 6 4 7 4 GP 3 3 4 3 4 3 5 4 Unskilled factory worker 1 1 1 1 1 1 1 1
Base (minimum) 1024 995 943 908 660 623 1709 1661

BRITISH SOCIAL ATTITUDES
44
Overall, then, the public is probably not too far off the mark in thinking that differentials had increased between 1999 and 2009. But it probably greatly under estimates the true extent of the increase.
The fourth and final striking point is how stable people’s views have been on what the income differentials should be (Table 2.6). For example, the ratio for what a company chairman should earn was six times that of the unskilled factory worker in 2009, the same as it had been in 1987, 1992 and 1999. Similarly, the ratio for what cabinet ministers should earn was the same in 2009 as it had been in the three previous surveys. Only in the case of GPs do we see a marked change, with an increase in the acceptable ratio between 1999 and 2009.
Overall, then, it would seem that people’s judgements about what the differentials in pay should be have remained remarkably stable over time, despite the recent turmoil over the excessive wages of bankers, and MPs, expenses. There is a clear acceptance of differentials, and a clear and stable understanding of what those differentials should be. There is also a long-standing perception that actual differentials are substantially larger than the ones that should prevail. In 2009 there has been a clear change, with the public perceiving that the gap between ‘is’ and ‘ought’ has widened, with top earners’ salaries pulling away.
A key question is whether people’s views about the salary differentials are related to their views about the extent to which a privileged background or connections are important for getting ahead. In other words, was the National Equality Panel right to argue that:
… the crucial test of whether inequalities in outcomes are seen as fair or unfair will depend on whether they reflect choices … [that] stem from aspects of their lives over which they have manifestly little control. (NEP, 2010: 4)
We do this by comparing the views of our utopians, realists and cynics on the salary levels of different occupations (Table 2.7). What are the views of each about whether the chairman of a large national company, a cabinet minister, a GP and an unskilled manual worker are paid ‘about right’ or ‘too little’? We might expect, given the arguments of the National Equality Panel, that people who think that merit is the crucial factor in getting ahead (the people whom we have termed ‘utopians’) might find the pay of the high earners more acceptable, while people who think that getting ahead depends partly on privilege or on ascribed factors that are outside people’s control (whom we have termed ‘realists’) will take a more negative view.
For Table 2.7, the proportion of people saying that a particular occupation is paid ‘about right’ or ‘too little’ has been calculated by comparing the salary that people say that the occupation is paid with what they say they ought to be paid (for more detail, see note 12). So, as we can see, the vast majority of people feel that unskilled factory workers earn about right or too little. There is, then, a very clear gradient, with fewer and fewer people thinking that GPs’ earnings, cabinet ministers’ earnings and chairmen of large companies earnings are about right or too little.

How fair is the route to the top? Perceptions of social mobility
45
Table 2.7 Perceptions of different occupational pay levels, by perceptions of meritocracy12
Utopians Realists Cynics All
% saying that the occupation is paid about right or too little
Chairman, large national company 21 18 33 20 Cabinet minister 25 34 29 30 GP 67 58 69 63 Unskilled factory worker 96 95 96 96
Base (minimum) 340 425 51 816
Table 2.7 does not support the arguments of the National Equality Panel posed above. In fact we see little or no sign of utopians finding the pay of high earners more acceptable or of realists taking a more negative view. There is pretty general disapproval of the earnings of the chairmen of large national companies, and the difference between the utopians and the realists is not statistically significant. In the case of cabinet ministers’ earnings, it is the realists not the utopians who find their level of pay more acceptable. Only in the case of GPs do we find the expected pattern, with utopians taking a more favourable view of their level of earnings. Meanwhile all three groups are united in thinking that unskilled factory workers earn too little or about right.
So perceptions of the role of privilege in ‘getting ahead’ do not, on this evidence, show any consistent or strong relationship with the acceptability of the rewards accruing to holders of high-level positions. While there is broad acceptance that meritocratic factors are important in getting ahead, there is also very broad rejection of the extent of the earnings differentials secured by those who have got ahead. And we should remember that the extent of the ‘true’ earnings differentials is almost certainly a great deal larger than the ones that people believe to be the case. In short, most people in Britain believe that there is, to a greater or lesser extent, a measure of equality of opportunity. But they do not believe that the outcomes are fair. In this respect, we cannot support the arguments of the National Equality Panel that inequalities in outcomes are acceptable to those who believe that society is meritocratic.
We must, however, admit one possible objection to our argument and analysis. The questions about what is important for ‘getting ahead’ did not specify particular types of occupation. It may well be that our respondents, when they answered this question, were thinking about rather broader occupational categories, such as our category of the ‘salariat’ (in which, as it happens, GPs are located) rather than about ‘elite’ occupations such as cabinet ministers and the chairmen of large national companies. While apologists for the extraordinary earnings of captains of industry and finance routinely tell us that these salaries are necessary in order to retain the ‘best’ people, we should not take it for granted that the general public agrees. It is an open question whether

BRITISH SOCIAL ATTITUDES
46
the general public ‘buys’ this argument, a question to which unfortunately our data do not contain an answer.
Conclusions
On the basis of our analysis, we can conclude, with reasonable confidence, that perceived social mobility has declined somewhat over time, more in line with economists’ than with sociologists’ analyses of the trends, but this has not been accompanied by any growing cynicism about the openness of routes for ‘getting ahead’. In general, British people remain either ‘utopians’ or ‘realists’, believing that meritocratic factors are a major (or in the case of utopians the primary) route for getting ahead, although family background, connections and other ascriptive factors are also believed by the majority (the ‘realists’) to be equally important. There is no sign of an increase in cynicism. However, there has been a perception that earnings differentials have risen sharply between 1999 and 2009, especially for cabinet ministers and the chairmen of large national companies, and that they should not have done. Finally, there is little evidence that people’s perceptions of the fairness of these outcomes is related to their perceptions of how meritocratic are the channels for getting ahead.
Our provisional conclusions, then, are that politicians and policy makers are probably wrong to assume that a socially mobile society is one that will necessarily be regarded as fair and socially just. The National Equality Panel is probably wrong to suggest that:
… the crucial test of whether inequalities in outcomes are seen as fair or unfair will depend on whether they reflect choices made against a background where the opportunities open to people were equal to start with. (NEP, 2010: 4)
While we do not have quite enough evidence to refute the NEP’s argument entirely, since we do not know how fair access to those elite positions whose rewards have grown so disproportionately is perceived to be. We suspect that the British public does not agree that equality of opportunity necessarily justifies very large inequalities of outcome.
People in Britain, then, are not only rather good sociologists; they may also be rather good political philosophers and recognise that equality of opportunity is indeed not the same thing as equality of outcome.
Notes
1. Erikson and Goldthorpe (2010) have also shown that the family income variable in the 1958 data on which Blanden and Machin based their research is not of a comparable standard to that found in the 1970 data.

How fair is the route to the top? Perceptions of social mobility
47
2. Answering using a five-point scale from “agree strongly” to “disagree strongly”. The figures quoted combine the proportions who “agree strongly” and those who “agree”.
3. Goldthorpe (1987) collapses his seven-class schema into three broad classes for the same kind of purpose. The major difference from our approach is that he classified class VI, the skilled manual class, together with his class VII (the semi- and unskilled manual class), whereas we have classified it as one of the intermediate classes. Our reason for doing so is that, as Goldthorpe explains elsewhere, his seven- class schema is not strictly ordered and that his classes III, IV, V and VI cannot be placed in any straightforward ordering. Movement between these classes would therefore be regarded as ‘sideways’. It therefore seems desirable, when measuring rates of upwards and downwards mobility, to put them at the same level. We have, however, checked our findings about trends over time, re-classifying class VI into the lowest of our three classes. See Table A2 in the appendix to this chapter. As we can see, rates of long-range upwards mobility are as a result greater than those shown in Table 2.2, while rates of short-range upwards mobility are lower. Table A2 also shows a high degree of stability over time, exactly in line with Goldthorpe and Mills’ conclusions. 4. We coded father’s and respondent’s classes in all datasets on the basis of the Social- Economic Groups (SEG) using the conversion programme by Heath and McDonald (1987) but with the category for the armed forces removed due to the lack of ranking information (see also Goldthorpe and Mills, 2008). GHS 2005 does not have SEG for fathers. We coded the 35-category NsSEC derived from the original SOC codes (soc2kf) into the Goldthorpe classes according to Rose and Pevalin (2003: 8–10). 5. Using all four years of data. 6. The figure of £144,500 includes cabinet ministers’ full parliamentary salaries. For full details see House of Commons Information Office (2009). 7. See NHS Information Centre for Health and Social Care (2009). However, we should note that this figure is more contentious and that salaried GPs earn considerably less than the figure quoted, which is for ‘contractor’ GPs, i.e. partners. 8. More information on the Labour Force Survey can be found at:
http://www.ons.gov.uk/about-statistics/user-guidance/lm-guide/sources/household /lfs/index.html
9. The salaries of cabinet ministers increased from £111,300 in 1999 to the 2009 figure of £144,500. 10. The NHS Information Centre provides figures for the period 2002/3 to 2007/8 which show an increase of 46 per cent, and the increase is likely to have been much greater for the full 1999 to 2009 period covered by British Social Attitudes. 11. The NEP concluded: “For all employees, real earnings were roughly static between 2003 and 2008 …, but between 1999 and 2007 the real earnings of the CEOs of the top 100 companies more than doubled (reaching £2.4 million per year)” (NEP 2010: 42). 12.We constructed this variable as follows: people who gave a higher value for the actual earnings of a given occupation than they gave for what it ought to earn were classified as believing that the occupation was paid too much. Those who gave the same figures for actual earnings and for what ought to be earned were classified as

BRITISH SOCIAL ATTITUDES
48
thinking the earnings were ‘about right’, while those who gave a lower figure for the actual earnings than for the earnings that members of the occupation ought to earn were classified as thinking that it earned too little.
References
Blanden, J. and Machin, S. (2007), Recent Changes in Intergenerational Mobility: Report for the Sutton Trust, London: Sutton Trust
Breen, R. (2004), Social Mobility in Europe, Oxford: Oxford University Press Cabinet Office (2008), Getting on, getting ahead: A discussion paper: analysing the
trends and drivers of social mobility, London: Cabinet Office Erikson, R. and Goldthorpe, J. (2010), ‘Has social mobility in Britain decreased?
Reconciling divergent findings on income and class mobility’, British Journal of Sociology, 61(2): 211–230
Ermisch, J. and Nicoletti, C. (2007), ‘Intergenerational earnings mobility: changes across cohorts in Britain’, The B E Journal of Economic Analysis and Policy, 7
Goldthorpe, J.H. (1987), Social Mobility and Class Structure in Modern Britain, 2nd edition, Oxford: Oxford University Press
Goldthorpe, J.H. and Mills, C. (2008), ‘Trends in intergenerational class mobility in modern Britain: evidence from national surveys, 1972–3005’, National Institute Economic Review, 205: 83–100
Granovetter, M. (1973), ‘The strength of weak ties’, American Journal of Sociology, 78(6): 1360–1380
Harman, H. (2010), ‘Introduction’, in National Equality Panel, An Anatomy of Economic Inequality in the UK: report of the National Equality Panel, London: Government Equalities Office
Heath, A. F. and McDonald, S.K. (1987), 'Social change and the future of the Left', The Political Quarterly, 58: 364–377
Heath, A.F., Mills, C. and Roberts, J. (1992), ‘Towards meritocracy – new evidence on an old problem’, in Crouch, C. and Heath, A.F. (eds.), Social Research and Social Reform: Essays in Honour of A.H. Halsey, Oxford: Oxford University Press, pp. 217–243
Heath, A.F. and Yu, S. (2005), ‘The puzzle of ethnic minority disadvantage’, in Heath, A.F., Ermisch, J. and Gallie, D. (eds.), Understanding Social Change, Oxford: Oxford University Press, pp. 187–234
House of Commons Information Office (2009), Ministerial salaries. Factsheet M6, Members Services. Appendix A
Joshi, H. (2005), ‘Gender and pay: some more equal than others’, in Heath, A.F., Ermisch, J. and Gallie, D. (eds.), Understanding Social Change, Oxford: Oxford University Press, pp. 151–186
Kelley, S. and Kelley, C. (2009), ‘Subjective social mobility: data from 30 nations’, in Haller, M., Jowell, R. and Smith, Tom W. (eds.), Charting the Globe: The International Social Survey Programme 1984–2009, London: Routledge, pp. 106–124
Li, Y. and Heath, A. (2010), ‘Struggling onto the ladder, climbing the rungs: employment status and class position by minority ethnic groups in Britain (1972–

How fair is the route to the top? Perceptions of social mobility
49
2005)’, in Stillwell, J., Norman, P., Thomas, C. and Surridge, P. (eds.), Spatial and Social Disparities, Dordrecht: Springer, pp. 83–97
Lin, N., Ensel, W. and Vaughn, J. (1981), ‘Social resources and the strength of ties: structural factors in occupational attainment’, American Sociological Review, 46: 393–405
National Equality Panel (2010), An Anatomy of Economic Inequality in the UK: report of the National Equality Panel, London: Government Equalities Office
NHS Information Centre for Health and Social Care (2009), GP Earnings and Expenses Enquiry 2006/7: Final Report, available at
http://www.ic.nhs.uk/webfiles/publications/ Rose, D. and Pevalin, D. (2003), A Researcher’s Guide to the National Statistics Socio-
economic Classification, London: Sage Young, M. (1958), The Rise of the Meritocracy, 1870–2023: an essay on education and
equality, London: Thames and Hudson
Acknowledgements
The National Centre for Social Research is grateful to the Economic and Social Research Council (grant number RES-062–23–1671) for their financial support which enabled us to ask the questions reported in this chapter. The views expressed are those of the authors alone. The authors would like to thank Jane Roberts of the Nuffield College data library for her invaluable assistance in accessing and organising the British Social Attitudes data.

BRITISH SOCIAL ATTITUDES
50
Appendix
Table A1 Factor analysis of the ‘getting ahead’ items, 2009 (N=892)
Factor 1 Factor 2 Factor 3
Wealthy family 0.76 Well-educated parents 0.58 0.39 Good education yourself 0.70 Ambition 0.80 Hard work 0.79 Knowing the right people 0.73 Having political connections 0.73 Giving bribes 0.48 0.40 A person’s race/ethnicity 0.78 A person’s religion 0.83 Being born a man or a woman 0.73 Eigenvalue 3.31 1.86 1.20
‘Not answered’ excluded but ‘can’t choose’ included in base Principal components extraction and varimax rotation
Table A2 ‘Objective’ rates of intergenerational occupational mobility, 1987–2005, with skilled manual assigned to the lowest of the three classes
1987 1992 1999 2009
% % % % Long-range upwards 9.0 10.0 13.5 10.4 Short-range upwards 24.2 25.7 26.2 24.8 Stable 45.1 44.7 42.5 41.6 Short-range downwards 17.8 15.5 14.4 18.6 Long-range downwards 3.8 4.2 3.5 4.5
Base 1212 1066 804 958