Embed Size (px)
Citation preview

How fat is the top tail of the
wealth distribution?
Philip VermeulenEuropean Central Bank
DG-R MPRD
SEEK, Mannheim
16/May/2014
Philip Vermeulen How fat is the top tail 16/May/2014 1 / 34

This slideshow should not be reported as representing the views ofthe European Central Bank (ECB). The views expressed are thoseof the author and do not necessarily reflect those of the ECB.
Philip Vermeulen How fat is the top tail 16/May/2014 2 / 34

Intro
Wealth distribution and its tail
30 percent of wealth is held by 1 percent of the population(Kennickell, 2009)
Piketty “Capital in the Twenty-First Century”
Stiglitz “The Price of Inequality: How Today’s Divided
Society Endangers Our Future”
monetary and fiscal policy have first order distributionalimplications
shift from representative agent model to heterogeneous agentmodels
Philip Vermeulen How fat is the top tail 16/May/2014 3 / 34

Intro
Wealth distribution data
Household wealth surveys
US Survey of consumer finances
European Household Finance and Consumption Survey
Complex survey designs: stratification, clustering, weighting
representative of population
Philip Vermeulen How fat is the top tail 16/May/2014 4 / 34

Intro
Part of the wealth distribution Germany
02.
0e−
064.
0e−
066.
0e−
06D
ensi
ty
0 200000 400000 600000 800000 1000000wealtheuro
Philip Vermeulen How fat is the top tail 16/May/2014 5 / 34

Intro
Part of the wealth distribution France
01.
0e−
062.
0e−
063.
0e−
064.
0e−
065.
0e−
06D
ensi
ty
0 200000 400000 600000 800000 1000000wealtheuro
Philip Vermeulen How fat is the top tail 16/May/2014 6 / 34

Intro
Part of the wealth distribution Italy
01.
0e−
062.
0e−
063.
0e−
064.
0e−
06D
ensi
ty
0 200000 400000 600000 800000 1000000wealtheuro
Philip Vermeulen How fat is the top tail 16/May/2014 7 / 34

Intro
Part of the wealth distribution Spain
01.
0e−
062.
0e−
063.
0e−
06D
ensi
ty
0 200000 400000 600000 800000 1000000wealtheuro
Philip Vermeulen How fat is the top tail 16/May/2014 8 / 34

Intro
The wealth distribution is special
Practically all familiar distributions: inflation, bond returns,stock returns, growth rates,
“mean” and “variance” that makes sense (central tendencyand fluctuations around it)
wealth distribution in contrast:
an astronomically long tail: roughly twenty thousand timeslarger than the first 95 percent of the distribution
Has a “mean” and “variance” that don’t make sense.
NEED to sample especially from the tail to estimate itsimportance
Philip Vermeulen How fat is the top tail 16/May/2014 9 / 34
Intro
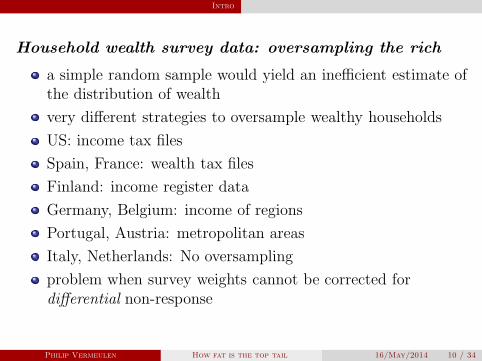
Household wealth survey data: oversampling the rich
a simple random sample would yield an inefficient estimate ofthe distribution of wealth
very different strategies to oversample wealthy households
US: income tax files
Spain, France: wealth tax files
Finland: income register data
Germany, Belgium: income of regions
Portugal, Austria: metropolitan areas
Italy, Netherlands: No oversampling
problem when survey weights cannot be corrected fordifferential non-response
Philip Vermeulen How fat is the top tail 16/May/2014 10 / 34

Intro
Different oversampling strategies
Number of wealthy households in the samples > 2 million euroAbsolute Number vs Pct in sample
Sample size Absolute number Pct of sample
USA 6482 965 15Germany 3565 85 2France 15006 638 4Italy 7951 78 1Spain 6197 544 9Netherlands 1301 2 0.15
Philip Vermeulen How fat is the top tail 16/May/2014 11 / 34

Intro
Purpose of the research
Philip Vermeulen How fat is the top tail 16/May/2014 12 / 34

Intro
Purpose of the research
How much wealth is in the tail?
Philip Vermeulen How fat is the top tail 16/May/2014 12 / 34

Intro
Purpose of the research
How much wealth is in the tail?
Does the survey data give a good account of tail wealth?
Philip Vermeulen How fat is the top tail 16/May/2014 12 / 34

Intro
Purpose of the research
How much wealth is in the tail?
Does the survey data give a good account of tail wealth?
Show the importance of differential non-response for tailwealth estimation
Philip Vermeulen How fat is the top tail 16/May/2014 12 / 34

Intro
Purpose of the research
How much wealth is in the tail?
Does the survey data give a good account of tail wealth?
Show the importance of differential non-response for tailwealth estimation
Provide new method to estimate tail wealth in the presenceof differential non-response.
New estimates of tail wealth: US, Germany, France, Spain, ...
Philip Vermeulen How fat is the top tail 16/May/2014 12 / 34

The data
The extreme tail
The forbes list (billion euro)
Individuals Total wealth Pct country wealth
USA 396 978.6 2.3Germany 52 183.3 2.4France 11 60.1 0.9Italy 14 46.6 0.7Spain 12 28.3 0.6Netherlands 3 4.8 0.4Belgium 1 1.9 0.1Austria 5 13.0 1.2Finland 1 1.0 0.2Portugal 2 4.1 0.7
Philip Vermeulen How fat is the top tail 16/May/2014 13 / 34

The data
The Household data: the missing end of the tail
MIND THE GAPMax wealth Survey vs Min wealth at Forbes
Million euros
Max wealth SCF/HFCS Min wealth Forbes
USA 806 737Germany 76 818France 153 810Italy 26 893Spain 409 780Netherlands 5 958Belgium 8 1920Portugal 27 1110Austria 22 1560Finland 15 958
Philip Vermeulen How fat is the top tail 16/May/2014 14 / 34

The data
Some observations
large gap between the highest wealth household in HFCSsample and the poorest household in Forbes
suggest combination of non-response and lack of effectiveoversampling
suggest to estimate the tail of the distribution survey +Forbes data
Philip Vermeulen How fat is the top tail 16/May/2014 15 / 34

Tail distributions
How to estimate tail wealthSurvey Sample only
Directly from the observations in the survey samples
Assume tail is Pareto:(pseudo) maximum likelihood
Assume tail is Pareto: Regression method on survey sample
Survey sample + Forbes
Assuming tail is Pareto: Regression method on surveysample+Forbes data
Philip Vermeulen How fat is the top tail 16/May/2014 16 / 34

Tail distributions
A candidate distribution for the tail
Pareto distribution (Power law)
complementary CDF or tail function
P (W > w) = (wmin
w)α (1)
defined on the interval [wmin,∞[ and α > 0
α tail index determines the fatness of the tail. The lower α,the fatter the tail.
Klass et al. (2006), Ogwang (2011)
Philip Vermeulen How fat is the top tail 16/May/2014 17 / 34

Tail distributions
Method 1: Pseudo maximum likelihood
Maximum likelihood is impossible, cannot write thelikelihood function
Pseudo maximum likelihood
act ”as if the data were a census”
L(α,wmin | W ) =∏
f(wi)swi
Does not deal with the differential non-response problem
Philip Vermeulen How fat is the top tail 16/May/2014 18 / 34

Tail distributions
An interesting property of the Pareto
complementary CDF or tail function
P (W > w) = (wmin
w)α (2)
n(wi) the number of households that have wealth above wi
(rank of the household)
n(wi)
N= (
wmin
wi
)α (3)
log(n(wi)) = log(N) + αlog(wmin)− αlog(wi)
log of the rank of the household and log of its wealth are on astraigth line.
Philip Vermeulen How fat is the top tail 16/May/2014 19 / 34

Tail distributions
Method 2: Regression method
log(n(wi)) = constant− αlog(wi)
log of the rank of the household and log of its wealth are on astraight line.
use survey data to construct n(wi)
also use Forbes data to construct n(wi)
ˆαRH : survey data only
ˆαRHF : survey data + Forbes data
Philip Vermeulen How fat is the top tail 16/May/2014 20 / 34

Tail distributions
Log rank of the household and log wealth (Germany)0
510
15
14 16 18 20 22 24lnwealtheuro
ln_rank_hfcs ln_rank_forbes
Philip Vermeulen How fat is the top tail 16/May/2014 21 / 34

Tail distributions
Log rank of the household and log wealth (France)0
510
15
14 16 18 20 22 24lnwealtheuro
ln_rank_hfcs ln_rank_forbes
Philip Vermeulen How fat is the top tail 16/May/2014 22 / 34

Tail distributions
Log rank of the household and log wealth (Italy)0
510
15
14 16 18 20 22 24lnwealtheuro
ln_rank_hfcs ln_rank_forbes
Philip Vermeulen How fat is the top tail 16/May/2014 23 / 34

Tail distributions
Log rank of the household and log wealth (Spain)0
510
15
14 16 18 20 22 24lnwealtheuro
ln_rank_hfcs ln_rank_forbes
Philip Vermeulen How fat is the top tail 16/May/2014 24 / 34

Tail distributions
Log rank of the household and log wealth (Netherlands)0
510
15
14 16 18 20 22lnwealtheuro
ln_rank_hfcs ln_rank_forbes
Philip Vermeulen How fat is the top tail 16/May/2014 25 / 34

Tail distributions
Log rank of the household and log wealth (Belgium)0
510
15
14 16 18 20 22lnwealtheuro
ln_rank_hfcs ln_rank_forbes
Philip Vermeulen How fat is the top tail 16/May/2014 26 / 34

Tail distributions
Log rank of the household and log wealth (Austria)0
510
15
14 16 18 20 22lnwealtheuro
ln_rank_hfcs ln_rank_forbes
Philip Vermeulen How fat is the top tail 16/May/2014 27 / 34

Tail distributions
Monte Carlo
1 million households draw wealth from Pareto distributionwith tail index α
rich list (households more than 740 million euro)
A survey sample is drawn for 750 households
non-response probability follows 0.097+0.0365*ln(Wealth)
Estimate tail index using pseudo maximum likelihood,regression method survey, regression method survey + richlist
ten thousand Monte Carlo iterations
Philip Vermeulen How fat is the top tail 16/May/2014 28 / 34

Tail distributions
Pareto tail index estimates under differentialnon-response
Monte Carlo estimates of Pareto tail indexα αml αreg αregfor Resp obs Rich list obs
(1) (2) (3) (4) (5) (6)
1.30 1.41 1.38 1.30 277 1860.08 0.09 0.01 13 13
1.40 1.51 1.48 1.40 279 960.09 0.10 0.02 13 10
1.50 1.61 1.57 1.50 280 500.10 0.10 0.03 13 7
1.60 1.71 1.67 1.60 281 260.10 0.11 0.04 13 5
1.70 1.81 1.77 1.69 282 130.11 0.12 0.05 13 4
Philip Vermeulen How fat is the top tail 16/May/2014 29 / 34

Tail distributions
Pareto tail index estimates under differentialnon-response
Monte Carlo estimates of tail wealthas a proportion of true tail wealthα survey est. αml αreg αregfor
(1) (2) (3) (4) (5)
1.30 0.77 0.82 0.89 1.020.41 0.14 0.20 0.06
1.40 0.83 0.87 0.92 1.010.29 0.11 0.15 0.04
1.50 0.87 0.90 0.94 1.010.20 0.09 0.12 0.03
1.60 0.90 0.91 0.95 1.010.16 0.08 0.10 0.03
1.70 0.92 0.93 0.96 1.010.18 0.07 0.09 0.04
Philip Vermeulen How fat is the top tail 16/May/2014 30 / 34

Tail distributions
TAIL WEALTH DISTRIBUTION (MONTE CARLOEXAMPLE)
100
101
102
103
104
105
10−7
10−6
10−5
10−4
10−3
10−2
10−1
100
Monte Carlo: Tail of the wealth distribution
Wealth (in million euro)
P(X
>=
x)
Empirical ccdf (Sample)
Empirical ccdf (Rich list)
Regression (SAmple)
Regression (Sample and Rich list)
TRUE power law
Philip Vermeulen How fat is the top tail 16/May/2014 31 / 34

Estimation results
TAIL WEALTH DISTRIBUTION (Germany)
100
101
102
103
104
105
10−7
10−6
10−5
10−4
10−3
10−2
10−1
100
Tail of the wealth distribution
Wealth (in million euro)
P(X
>=
x)
Empirical ccdf (Survey)
Empirical ccdf (Forbes)
Regression (survey)
Regression (survey and Forbes)
Pseudo Maxlik(survey)
Figure:Philip Vermeulen How fat is the top tail 16/May/2014 32 / 34

Estimation results
TAIL WEALTH DISTRIBUTION (USA)
100
101
102
103
104
105
10−7
10−6
10−5
10−4
10−3
10−2
10−1
100
Tail of the wealth distribution
Wealth (in million euro)
P(X
>=
x)
Empirical ccdf (Survey)
Empirical ccdf (Forbes)
Regression (survey)
Regression (survey and Forbes)
Pseudo Maxlik(survey)
Figure:Philip Vermeulen How fat is the top tail 16/May/2014 33 / 34

Estimation results
Percentage wealth share of top 1 pct of households
Regres ∆
SURVEY incl Forbes
Austria 23 33 +10Germany 24 32 +8Italy 14 21 +7Belgium 12 17 +5Netherlands 9 12 +3Finland 12 15 +3countries using tax records to oversample !France 18 20 +2USA 34 35 +1Spain 15 16 +1
Philip Vermeulen How fat is the top tail 16/May/2014 34 / 34

Conclusion
Conclusion
unobserved differential non-response creates substantiallydownward biased estimates of tail wealth
oversampling (using tax records) allows to observe andaddress differential non-response
combining Forbes tail wealth individual with survey dataimproves tail wealth estimates
Germany, Austria, Italy, etc have substantially higher tailwealth than can be derived from the HFCS data only
Philip Vermeulen How fat is the top tail 16/May/2014 35 / 34