Embed Size (px)
Citation preview
1
HOW FINANCIAL MARKET LEGITIMACY CONDITIONS CHANGES IN SOCIAL LEGITIMACY: THE IMPACT OF ADDITIONS AND DELETIONS BY THE DOW JONES
SUSTAINABILITY INDEX
OLGA HAWN Boston University
E-mail: [email protected]
AARON CHATTERJI Duke University, The Fuqua School of Business
WILL MITCHELL
Duke University, The Fuqua School of Business and the University of Toronto, Rotman School of Management
Version: April 23, 2013
Key words: corporate social responsibility (CSR), organizational legitimacy, Dow Jones Sustainability Index (DJSI), event study
1
HOW FINANCIAL MARKET LEGITIMACY CONDITIONS CHANGES IN SOCIAL LEGITIMACY: THE IMPACT OF ADDITIONS AND DELETIONS BY THE DOW JONES
SUSTAINABILITY INDEX Abstract: This study considers the interplay between two dimensions of organizational legitimacy: financial market legitimacy arising from a firm’s alignment with the norms and values of financial market actors and social legitimacy stemming from the firm’s alignment with the norms and values of non-market actors. Using a large-scale financial event study of additions and deletions by Dow Jones Sustainability Index, we demonstrate that firms with higher financial market legitimacy benefit less from increased social legitimacy and lose less from decreased social legitimacy. We contribute to the neo-institutional literature by highlighting that different dimensions of legitimacy, stemming from different organizational audiences, may substitute for each other in influencing organizational outcomes.
INTRODUCTION
Institutional scholars have long argued that organizations can gain access to scarce resources by
aligning their means and ends with societal values, thereby creating organizational legitimacy (Meyer and
Rowan 1977; Meyer and Scott 1983; Parsons 1960; Stinchcombe 1965).1 The neo-institutional literature
has studied how organizations acquire, maintain, and repair organizational legitimacy (Ashforth and
Gibbs 1990; Barley and Tolbert 1997) and, in turn, the benefits that legitimacy bestows upon
organizations, including survival, predictability, growth, and profitability (Bansal and Clelland 2004;
Corbett et al. 2005; Dobrev and Gotsopoulos 2010; King et al. 2005; Ruef and Scott 1998). While neo-
institutional researchers have recently started to distinguish between different dimensions of
organizational legitimacy that arise from variation in norms and values across different social systems
(Deephouse and Suchman 2008; Earle et al. 2010; Greenwood et al. 2002), a gap still remains in
understanding how different dimensions of legitimacy condition the effects of each other. Understanding
whether different dimensions of legitimacy are substitutes or complements is important because it is
unclear how much organizations should invest in different dimensions of legitimacy and how much
disparate audiences can influence firm performance (Ashforth and Gibbs 1990). We argue that legitimacy
that arises from different types of actors will often substitute for one another in influencing organizational
outcomes, such that organizations with high levels of legitimacy on one dimension will gain less and lose
less following changes in another dimension.
1 Suchman (1995: 574) defines legitimacy as “a generalized perception or assumption that the actions of a firm are desirable, proper, or appropriate within some socially constructed system of norms, values, beliefs, and definitions.”
2
We focus on two dimensions of organizational legitimacy – social legitimacy that stems from
non-market actors and financial market legitimacy (for brevity, we will also refer to financial market
legitimacy as market legitimacy) that stems from market actors. We argue that organizations with higher
financial market legitimacy will gain or lose less from changes in social legitimacy, in comparison to
organizations with lower market legitimacy. As we define in greater detail below, financial market
legitimacy is market actors’ perception of how well a firm fits with norms and values of financial markets
(Certo 2003; Rao et al. 2001), while social legitimacy is the perception that non-market actors hold of
how a firm’s actions fit with the norms and values of acceptable behavior in the larger social system
(Dowling and Pfeffer 1975; Bansal and Clelland 2004). A recent study by Lamin and Zaheer (2012)
suggests that “Wall Street” and “Main Street” perceive firm actions quite differently, suggesting that
these worlds operate by separate moralities, in which Main Street appears to privilege fairness as a core
value, whereas Wall Street privileges profit. We build on this idea in differentiating between these
different audiences as their values and norms vary as well as the nature of intermediaries and
characteristics of firms’ interactions with the environment (Baron 1995). Market interactions are
intermediated by markets or private agreements – typically voluntary in nature such as economic
transactions and the exchange of property – that create value by improving economic performance;
market actors include executives, investors, analysts, brokers, and others who actively assess an
organization’s economic activity (Zuckerman 1999). Non-market interactions are intermediated by
government, media, public institutions, and other stakeholders – voluntary or involuntary in nature – that
create value by improving multiple dimensions of performance (Baron 1995; Wood 1991); non-market
actors include regulators, employees, non-governmental organizations, and the local community who rely
on a wider system of criteria when evaluating organizational legitimacy (Bonardi et al. 2005).
In distinguishing between social and market legitimacy, we draw from and contribute to the neo-
institutional literature, which suggests that the two types of legitimacy reflect potentially contradictory
values and expectations (Ashforth and Gibbs 1990; Deephouse 1999; Dobrev and Gotsopoulos 2010) that
arise from two non-overlapping organizational constituencies (Hybels 1995). While non-market actors
3
value human capital development, health and safety, and environmental sustainability (Delmas and Toffel
2008; Terlaak and King 2006), market actors have particular interests in the future viability of a firm as
an economic agent (Cohen and Dean 2005; Friedman 1970; Hirsch 1975; Pfeffer 1981; Westphal and
Zajac 1998). As part of general society, market actors care about social legitimacy, including the social
impact of firms’ economic activity, and vice versa, society will care about market legitimacy as it relates
to a firm’s viability; however, when evaluating organizations both market and non-market actors use
different criteria (Hybels 1995; White 2001).
This study addresses market legitimacy that arises from meeting the norms and values of financial
markets, particularly market actors’ perceptions of a firm’s future financial viability. We study social
legitimacy that stems from evaluations of firms’ corporate social responsibility (CSR) activities that
emerged in response to increasing pressure from non-market actors. We regard CSR as a source of social
legitimacy, and social indices that provide external validation and evaluation of a firm’s CSR activities as
social legitimacy agents (Durand and McGuire 2005). Social indices, such as FTSE4Good, the Kinder,
Lydenberg, Domini, and Company Inc. Index (KLD), and the Dow Jones Sustainability Index (DJSI),
seek to verify that a firm’s goals and actions align with societal values such as environmental
sustainability, labor and human rights, anti-corruption practices, and community engagement. In doing so,
the indices provide meaningful signals of social legitimacy. Moreover, because indices use these criteria
to add or drop firms from their lists, social indices serve as mechanisms that articulate changes in social
legitimacy to the market.
We explore the interplay between social and market legitimacy by considering the impact of
being added and subsequently dropped from Dow Jones Sustainability Index (DJSI). We argue that
changes in social legitimacy, as reflected by addition or deletion from the DJSI, will have less impact on
the economic value of firms with greater market legitimacy, as reflected by stronger indicators of the
future financial viability of the firm. We test this argument with a financial event study that addresses the
potential endogeneity arising in many CSR studies from the relationship with firm’s financial
performance (Margolis et al. 2007). The choice of this methodology focuses our dependent variable on
4
the abnormal stock returns that reflect market actors’ reaction to the event. This is an important outcome
to examine because recent CSR studies analyzing the impact of additions and deletions from a social
index (Consolandi et al. 2009; Lackmann et al. 2011; Robinson et al. 2011), even in light of prior
financial performance and CSR reputation (Doh et al. 2010), find inconsistent results (Michlik and
Rubash 2011) and do not clearly outline when and why CSR matters. We contribute to this literature by
explaining this effect, finding consistent impact for additions and deletions. We demonstrate that even
though additions to social indices articulate increased social legitimacy and deletions indicate reduced
social legitimacy, investors interpret the events differently for firms with different levels of financial
market legitimacy. Firms with higher levels of market legitimacy gain little from increased social
legitimacy and, in turn, pay lower economic penalties for reductions in their social legitimacy.
More generally, our study contributes to the neo-institutional literature by examining how two
main organizational audiences that assess a firm’s legitimacy interact in affecting its value. Scholars have
mainly studied legitimacy as a static uni-dimensional phenomenon, typically dichotomous in nature:
whether a firm possesses it or not (Deephouse and Suchman 2008; Pfeffer and Salancik 1978). By
moving away from this static uni-dimensional view toward a dynamic multi-dimensional model of
legitimacy (Ruef and Scott 1998), we show that legitimacy to one audience may not mean legitimacy to
another (Deephouse 1996); moreover, legitimation by key organizational constituencies may have either a
positive or negative impact on legitimacy at the same time (Hybels 1995). Therefore, one type of
legitimacy may substitute for another in affecting organizational outcomes. This conclusion has strategic
implications: organizations can gain legitimacy by conforming with institutional myths (Meyer and
Rowan 1977) and/or by strategically manipulating environments (Deephouse 1996, 1999; Gimeno and
Woo 1996). If one type of legitimacy substitutes for another, organizations can work to gain both types so
that when they lose one, the other saves them from a crisis of legitimacy.
ORGANIZATIONAL LEGITIMACY
Different Sources, Outcomes, and Dynamism of Organizational Legitimacy
Organizational legitimacy scholars have conceptualized legitimacy as both a process and a state
5
(Deephouse 1996). As a process, legitimation comes from constituencies through conferral of resources
and communication of good will (Hybels 1995). As a state (i.e., property), legitimacy results from
legitimation and thus reflects changes in legitimation over time (Navis and Glynn 2010): while some
constituencies may confer resources on the organization, others may withdraw or reduce their support
(i.e., paths of communication and resources each may have either a negative or positive effect on
legitimacy). Moreover, even though legitimacy may stem from institutionalized norms and values, social
systems change over time and consist of multiple institutions (Hybels 1995). Therefore, we refer to
greater and lower levels of legitimacy to identify these changes over time as well as the variance in
certainty and security of legitimacy – in the sense that a firm may become “more legitimate” by becoming
more clearly legitimate, more firmly legitimate, and/or more legitimate to more audiences in more of its
activities (Deephouse and Suchman 2008).
Neo-institutional scholars generally view greater organizational legitimacy as a source of
organizational success. As Meyer and Rowan (1977: 352) put it, “Organizational success depends on
factors other than efficient coordination and control of productive activities: organizations that
incorporate socially legitimated rationalized elements in their formal structures maximize their legitimacy
and increase their resources and survival capabilities.” More recently, scholars have demonstrated that
greater legitimacy can be a critical resource that helps organizations gain access to other resources, such
as alliance partners (Dacin et al. 2007), new capital and market opportunities (Lounsbury and Glynn
2001), and human, financial, and intellectual resources (Zimmerman and Zeitz 2002). These resources, in
turn, provide economic value for the firm, so that greater legitimacy provides a pathway to superior
financial outcomes, such as increased sales, greater profits, and stronger market valuations.
Given the dynamism of organizational legitimacy (Deephouse and Suchman 2008), it is important
to distinguish between its different sources (for the most recent overview see Bitektine 2011). The
literature suggests two sets of key evaluators that provide different sources of organizational legitimacy:
general society and more focused financial markets (Baron 1995). The distinction between these sources
of legitimacy reflects the long-standing debate in the literature rooted in the tension between business and
6
society, whereby Friedman (1970) claims that the main responsibility of business lies in meeting
shareholders’ financial expectations, while Freeman (1984) highlights a much broader set of relevant
stakeholders (e.g., employees, customers, partners, and communities) and argues that, by meeting
stakeholder demands, organizations can become more successful. While previous literature has generally
considered these different sources of legitimacy independently, we will discuss how they can jointly
affect organizations. First, we need to draw boundaries between the concepts; in doing so, we will
distinguish between two key sources and evaluators of organizational legitimacy – non-market and
market actors – and the basis and potential effects of their judgments.
Social legitimacy
One type of organizational legitimacy, which we refer to as social legitimacy, arises from
activities that address broad social forces. Scholars have discussed these social forces in three related
ways. First, in light of normative and moral legitimacy, broad social forces reflect suppositions of
collectively valued purposes, means, and goals (Meyer and Rowan 1977). Second, as value challenges,
broad social forces place the organization’s mission and legitimacy for existence at issue, regardless of
how well it has fulfilled its own goals; e.g., some social forces view industries such as tobacco, gambling,
alcohol, and nuclear as immoral (Hirsch and Andrews 1984). Third, broad social forces affect
organizations through socio-political legitimacy when “stakeholders, the general public, key opinion
leaders, and government officials accept a venture as appropriate given existing norms and laws” (Aldrich
and Fiol 1994: 648). Because broad social forces arise in multiple contexts, social legitimacy involves
evaluation by multiple audiences, including media (Bansal and Clelland 2004), regulators (Singh et al.
1986), advocacy groups (Rao 1998), and organizational insiders (Kostova and Zaheer 1999).
However broad such social forces might be, firms gain social legitimacy from two main sources
(Suchman 1995; Dacin et al. 2007): institutional and strategic. Institutional sources of social legitimacy
include cultural factors beyond the control of any one firm and to which a firm simply needs to respond;
for example, by tailoring environmental actions to conform to sustainability values. Strategic sources
include more focused social engagements that firms can control, such as choosing which, if any, charities
7
to contribute to; such activities, in turn, can raise the social profile of the organization. Whether
institutional or strategic, achieving consistency and credibility with these sources of social legitimacy
contributes to a firm’s societal alignment. As a result, such firms are often able to attract social resources
from a wide range of actors, including preferential tax treatment, motivated employees, subsidies,
preferential contracts, regulatory support, loyal customers, volunteers, and other valuable resources.
Financial market legitimacy
The second type of organizational legitimacy, which we refer to as financial market legitimacy,
arises from a narrower range of activities by which organizations align with the norms and values of
actors in financial markets. Market legitimacy is evaluated by financial market actors such as analysts
(Certo 2003) and investors (Rao et al. 2001). Previous literature has assessed market legitimacy through
three lenses. First, as pragmatic legitimacy that results from demands for what Meyer and Rowan (1977)
call rational effectiveness, whereby actors require tangible data for their decisions (Suchman 1995).
Second, as performance challenges that occur when relevant actors believe that organizations have failed
to execute the purposes for which they are chartered (Hirsch and Andrews 1984), including achieving
expected economic performance. Third, as technical efficacy whereby tangible organizational outputs
reflect a firm’s ability to fulfill an evaluating audience’s material needs (Love and Kraatz 2009),
including producing superior products and delivering superior financial results (Shapiro 1982, 1983).
The sources of financial market legitimacy lie in frames of reference that arise from market
actors’ (intendedly) rational cognitive maps, objective data, and empirical reality testing (Shrivastava
1987). The emphasis on rationality, objectivity, and empiricism enables management to understand and
defend the organization’s performance, regardless of its underlying social values (Ashforth and Gibbs
1990). Objective data provide market actors with a concrete basis for judgment of the company as an
investment target, whereby market actors demonstrate their endorsement of an organization through
investment, loans, and ongoing support by analyst recommendations and ratings. Market legitimacy arises
from multiple sources of judgment that together form market perceptions of the future financial viability
of the firm. Relevant indicators of future viability include historical track records and current performance
8
measures, as well as credit quality and forecasts of future growth.
To be able to make judgments about market legitimacy, the economic environment expects
objective financial outcomes, especially profitability (Hirsh 1975; Pfeffer 1981). Profitability reassures
investors that the firm is viable and worth supporting. In addition, market legitimacy can arise from more
subjective indicators such as innovativeness, cost effectiveness, expected growth, and technical
efficiency, which shape expectations about future financial performance (Shapiro 1982; Love and Kraatz
2009). Such indicators influence investors’ and other market actors’ perception of a firm both directly and
indirectly via analysts’ ratings and recommendations (Westphal and Clement 2008). As a result of a
record of success and expectations of future financial viability, firms gain market legitimacy – a form of
endorsement from the market that helps them attract investment and financial support.
In sum, the neo-institutional literature suggests two types of organizational legitimacy, which we
refer to as social and market legitimacy. By social legitimacy, we mean generalized perceptions and
assumptions that the actions of a firm are desirable, proper, and appropriate within societal systems of
norms, values, beliefs, and definitions. By market legitimacy, we mean generalized perceptions and
assumptions that the same is true within financial market actors’ systems of norms, values, beliefs, and
definitions. The main difference between social and market legitimacy lies in the institutional
environments in which they are embedded: broader social arenas versus more specific economic contexts.
In the social environment, legitimacy reflects responses to cultural pressures, potentially by engaging in
socially and environmentally responsible activities. In the financial market environment, legitimacy arises
from producing expectations of strong financial performance. As we discuss later, we use a multi-
dimensional approach to measuring both types of legitimacy. A distinction between them lies in the fact
that many of the measures of current and future financial performance that are the basic criteria by which
market actors decide whether to support a firm in the future are not immediately obvious to non-market
actors who are assessing social legitimacy, so that perceptions of social legitimacy and market legitimacy
can arise independently of each other.2
2 Market and social legitimacy parallel the concept of reputation. Rindova, Pollock, and Hayward (2006: Table 1) define reputation as “the perceived ability of the firm to create value for stakeholders” based on firms’ strategic
9
Relationship between Social and Market Legitimacy
Although independent as conceptual properties that different audiences confer on an organization, social
and market legitimacy may affect each other. Social legitimacy can help firms garner resources that lead
to profitability, which in turn may generate market legitimacy. In turn, market legitimacy can create
future social acceptance; for instance, technically innovative firms can help attract new social resources.
Examples include Nokia’s ability to garner support from the Finnish government, Skoda’s ability to
attract high-quality labor, and Apple’s ability to gather regulatory support for its expansion initiatives.
Despite the potential inter-relationships, firms may have different levels of social and market
legitimacy at any point in time, for both strategic and environmental reasons. Strategically, firms may
benefit from differences in levels of social and market legitimacy. For instance, strategic balance theory
suggests that firms should seek to differ from each other as much as legitimately possible because,
although they can benefit by conforming to social norms, firms need to differentiate in order to achieve
superior profitability (Deephouse 1999). Additionally, conformity with societal rules and norms may or
may not be consistent with short-term profit maximization (Dacin et al. 2007). For instance, firms that
provide superior employee benefits or closely adhere to or surpass environmental regulations may suffer
at least short-term losses relative to less socially responsive competitors. In reverse, firms that become
perceived as too successful financially may lose social legitimacy and come under increasing regulatory
scrutiny and social challenges; examples include IBM in the 1970s, Microsoft in the 1990s, financial
institutions during the global crisis in 2009, and potentially Google in the next decade. Zuboff and
Maxmin (2002) argue that gaps in legitimacy that arise from the clash between social and economic
environments have long existed; indeed, such conflicts may be inherent to corporate activity. Recent
highly visible corporate crises, such as the economic recession and the Gulf of Mexico oil spill, highlight
the tension between expectations about social actions and economic performance.
Beyond any strategic considerations, gaps between social and market legitimacy can arise from
choices and outcomes (signaling theory), which they contrast with legitimacy – a “fit with normative values and beliefs” based on external validation from multiple sources (institutional theory). Taking these definitions, one could view social and market legitimacy as perceptions by non-market and market actors that a firm’s actions and performance create a reputation for delivering the types of value that the actors care about. Even with such overlap in definitions, the legitimacy concepts help distinguish between different values and types of actors.
10
environmental dynamism. As focal organizations undertake activities and other groups shape the
environments that determine relevant norms of legitimacy, both forms of legitimacy, as cultural
constructs, may vary at different temporal rates. What is expected and accepted as norms in terms of labor
and environmental practices today may vary over time, for instance, leading to changes in social
legitimacy; expectations about unionization, pollution, smoking, and alcohol advertising in North
America differ strikingly in the 2000s from the 1950s and 1960s. In parallel, different expectations about
appropriate financial levels and/or views on the importance of innovativeness may stem from changing
norms of market legitimacy. For instance, pharmaceutical companies achieved substantial financial
market legitimacy in the 1980s if they reached financial targets of 8% to 10% return on sales; if a
pharmaceutical executive announced that the company was seeking profitability at that level today, she or
he would be fired because expected levels of profitability now exceed 15% to 20% return on sales.
Furthermore, a specific action may be considered legitimate at one time under one set of circumstances
and illegitimate at another. During the past quarter of the century, for example, pig farms in eastern North
Carolina have moved from being socially desirable businesses to being social outcasts. Appendix A
illustrates examples in which social and market legitimacy may co-exist and/or conflict.
The core point is that each form of legitimacy is a dynamic concept that can vary independently.
Whether due to strategic actions of a firm or changes in the legitimacy environment, legitimacy can
increase or decrease at any time. Given this dynamic effect, the different types of organizational
legitimacy may substitute for each other. For instance, if a firm already has a substantial level of market
legitimacy, growth in social legitimacy may provide limited incremental value. If it loses social
legitimacy, however, the market legitimacy may create a buffer for losses. Thus, the dichotomy of social
and market legitimacy as two dimensions of organizational legitimacy may come together in affecting
organizational outcomes. We now elaborate upon the mechanisms through which this effect takes place. HYPOTHESES: MARKET LEGITIMACY CONDITIONS HOW CHANGES IN SOCIAL LEGITIMACY AFFECT ECONOMIC VALUE
We start by considering how market legitimacy conditions the degree to which economic value changes
with increases in social legitimacy. We focus on changes in economic value because firms and many
11
stakeholders care deeply about financial performance and factors that shape it as it ensures growth and
survival. Two mechanisms are relevant for our argument: (1) the incremental economic impact of
increased social legitimacy for firms with greater or lesser market legitimacy, and (2) the relative clarity
of the two forms of organizational legitimacy.
First, consider the incremental impact of increased social legitimacy. Firms that possess higher
market legitimacy, at least in countries with active financial markets, labor markets, and other elements of
business infrastructure, have competitive advantages. In addition to their ability to support their existing
activities, such firms will be able to garner resources they need to reinforce their business or to expand
into new activities. Hence, additions to social legitimacy provide only limited incremental value, because
the firms can already gain access to most resources that they need. By contrast, firms with lower market
legitimacy often struggle to gain access to new resources. In such cases, increases in social legitimacy
provide an alternative route to attracting investment, personnel, regulatory support, and other resources in
order to sustain existing operations or develop new activities that they would otherwise struggle to obtain
by relying solely on their market position. Therefore, investors will expect increased social legitimacy to
provide greatest incremental economic benefits when firms have lower market legitimacy.
Second, consider the relative clarity of social and market legitimacy. The value of social
legitimacy to the market will often be more ambiguous than that of market legitimacy, particularly when
market legitimacy arises from financial performance, because social indicators often provide ambiguous
forecasts of a firm’s future viability (Power 1997). Ambiguity about the value of social legitimacy arises
for two reasons. First, investors may recognize the potential economic value of social legitimacy, but they
are often uncertain about whether a firm will be able to use increased social legitimacy to gather new
resources or whether the firm will struggle to sustain the benefits. Second, reliable social indicators often
are difficult to produce and, even when they exist, are hard to interpret. A firm’s own executives are often
uncertain about the implications of social indicators. Interpreting the impact of environmental actions, for
instance, is highly uncertain not only for executives but also for engineers who undertake them, let alone
for investors. The examples in Appendix A demonstrate that social legitimacy is often ambiguous.
12
By contrast, market indicators provide clearer signals of a firm’s value and opportunities (Pfeffer
1981), generating stronger indicators of Meyer and Rowan’s (1977) notion of the ceremonial criteria of
worth. Of course, market legitimacy also can be ambiguous. Attempts to innovate often have uncertain
implications for future performance, for instance, while measures of current profitability that rely on
accounting judgments and profitability forecasts depend on the reliability of market trends and
sustainability of a firm’s capabilities. Nonetheless, investors and analysts, as reinforced in interviews that
we conducted as part of this research, commonly find it easier to assess the value of a firm’s market
legitimacy than that of its social legitimacy.
The ease of assessing market legitimacy reflects different uncertainties about the value of market
and social legitimacy in the sense that the financial indicators that underlie market legitimacy reflect the
dominant logic of the financial market (Bettis and Prahalad 1995; Grant 1988; Reay and Hinings 2009).
Thus, for financial actors, market legitimacy commonly provides a clearer signal of firm value. Faced
with indicators of value stemming from social and market legitimacy, investors will commonly follow the
clearer signal (Spence 1973). If a firm has higher market legitimacy, investors will often rely on that
signal and pay less heed to information from more ambiguous signals of increased social legitimacy.
When market legitimacy is low, by contrast, investors will be more likely to view increased social
legitimacy as a meaningful signal of increased opportunities. In such cases, even ambiguous increases in
social legitimacy will provide incremental value to stakeholders who have social resources that the firm
may benefit from and will in turn help the firm increase its financial performance. Hence, increases in
social legitimacy will have greatest benefit for firms with low levels of market legitimacy.
Hypothesis 1 (H1): The lower the level of market legitimacy that a firm possesses, the greater the gain in economic value from increased social legitimacy.
In parallel, based on the logic of incremental value and signal clarity, firms that lose social
legitimacy suffer most when they have lower levels of market legitimacy. The instrumental financial logic
suggests that firms with strong market legitimacy will attract resources in any case. Investors will often be
willing to support a firm that demonstrates strong market legitimacy, even if it visibly undertakes actions
that do not align with social norms (Ruef and Scott 1998; Singh et al. 1986). Despite increasing social
13
disapproval, cigarette companies, for instance, long attracted investment – even from health professionals
– because their higher levels of profitability and growth substituted for social legitimacy. Similarly,
energy and pharmaceutical companies face regular criticisms of their pricing strategies, environmental
practices, political lobbying, questionable engagements in developing markets, and other socially dubious
activities. Indeed, energy and pharmaceutical firms consistently fall near the bottom of social reputation
indices (e.g., in the tail of the annual Gallup poll of industry image from 2001 through 2012).
Nonetheless, many energy and pharmaceutical sector firms have strong financial performance and, as a
consequence, possess high levels of market legitimacy.
In turn, such companies easily attract investment and weather challenges to their social legitimacy
that would severely damage firms with lesser levels of market legitimacy. In an extreme case, BP recently
suffered massive losses in social legitimacy as a result of the Gulf oil disaster. However, while it also lost
major economic value directly after the spill, the company continues to operate; in 2011, the company
announced that it would pay its first dividend since the spill and planned to increase its total investment
by $2 billion (Werdigier 2011, February 1). With this in mind, BP will survive and attract new investment
in the future. Similarly, the pharmaceutical firm Merck continues to prosper despite major losses in social
legitimacy following its withdrawal of the anti-pain drug Vioxx in 2004 due to cardiovascular problems.
In contrast, companies with less market legitimacy would not have these survival and recovery chances.
Hence, we expect reductions in social legitimacy to have the greatest impact on the economic value of
firms with low levels of market legitimacy.
Hypothesis 2 (H2): The lower the level of market legitimacy that a firm possesses, the greater the loss in economic value from decreased social legitimacy.
In sum, the hypotheses argue that market legitimacy will condition how changes in social
legitimacy affect changes in firms’ economic value. We do not predict a main effect for changes in social
legitimacy for three reasons: the core logic highlights the importance of the conditioning effects; the
organizational legitimacy literature suggests positive (negative) returns to increases (decreases) in any
types of legitimacy; and other empirical studies have tested the main effects in the context of additions
and deletions from socially responsible indices (Cheung 2011; Doh et al. 2010). By contrast, the potential
14
substitution between the two types of legitimacy is important to examine for strategic and theoretical
reasons. If different sources of legitimacy interact in affecting organizational outcomes, the literature
needs to examine the multiple dimensions of legitimacy, the mechanisms by which they are generated,
and the ways in which they affect organizations, as well as their co-evolution. We now turn to a specific
context of social and market legitimacy, focusing on market reaction to addition and deletion from indices
of socially responsible corporate activity.
THE DOW JONES SUSTAINABILITY INDEX AND SOCIAL LEGITIMACY
The Dow Jones Sustainability Index (DJSI)
Prior literature considered several mechanisms that confer legitimacy, including community
directory listings (Ruef and Scott 1998), public and government endorsement in the media (Deephouse
1996), public approval based on a survey (Elsbach 1994), consistency with laws, filing articles of
incorporation, registration with the Securities and Exchange Commission (SEC), and obtaining
professional certification (Zimmerman and Zeitz 2002). Organizations lose legitimacy from negative
assessments involving questions, challenges, and rejections (Deephouse 1996; Hirsch and Andrews 1984;
Meyer and Scott 1983). In order to gain legitimacy in restricted arenas, management must obtain explicit
certification that typically conforms to detailed formal requirements (Suchman 1995). Social indices
publicly outline these requirements in the area of CSR and, as social legitimacy agents, certify socially
(ir)responsible companies by adding them to (or dropping them from) their lists. Therefore, we examine
the interchange between social and market legitimacy by studying how investors interpret the news of
addition to and deletion from a social index.
We focus on the Dow Jones Sustainability Index, a key social index increasingly viewed by firms
as a mechanism for generating social legitimacy. Four factors make it a desirable mechanism for
assessing social legitimacy. First, DJSI provides international coverage in both developed and emerging
markets since 1999. Second, DJSI is more publicly visible and is familiar to most experts (e.g., while
KLD licenses their index for a fee and does not openly disclose its changes to the index, the DJSI
publishes press releases and reveals the list, including additions and deletions, on its website and to its
15
licensees). Third, DJSI has been recognized as “the most rigorous in terms of the number of questions and
depth of information requested” (UNEPFI 2008) as well as one of the most credible (SustainAbility
2012). Fourth, many fund managers globally recognize and value the DJSI. In 2010, DJSI licensees
included 88 global institutions in 16 countries with more than $8 billion total investment in the financial
products in the index (http://www.sustainability-index.com/07_htmle/other/faq.html); in comparison,
KLD’s list included 11 licensees.
To further assess the DJSI as a meaningful mechanism for signaling social legitimacy, we
undertook four procedures. First, we examined the media and academic attention to CSR, sustainability,
and the DJSI. Second, we considered the criteria for the addition to DJSI and why it is a relevant signal of
social legitimacy. Third, we conducted an archival review of reactions to the addition to DJSI by about
twenty North American and European companies. Fourth, we interviewed analysts on the importance of
social indices in their evaluation. Appendix B reports the results of this assessment.
METHODS
Methods and Data
A recent meta-analysis on the link between corporate social and financial performance (Margolis
et al. 2007) recommended that future studies meet four criteria. First, data about firms’ CSR should
consist of reliable measures such as quantifiable outputs or third-party audits, using assessment processes
that are clear and open to validation. DJSI meets this criterion because it uses an independent organization
to collect and verify company and non-company data, as well as undertaking an annual audit of each firm
on the index. Second, studies must control for factors such as geographic location, industry, risk, size,
R&D spending, and advertising expenditures (McWilliams and Siegel 2000). Our dependent variable,
beta excess returns, inherently controls for risk by representing a difference between the asset’s return and
the return on a reference asset that is assumed to be riskless (Campbell et al. 2007); we also include
multiple controls. Third, the direction of causality needs to be theoretically articulated and empirically
assessed at different time periods. The event study methodology addresses this concern. Finally, the
mechanism by which CSR affects financial performance needs to be articulated. This paper identifies
16
information and legitimacy aspects of value creation along with mechanisms involving incremental
impact and relative clarity that help develop a perspective on this relationship.
We use a financial event study with an original dataset of additions and deletions from the DJSI
World. The event study measures the effect of an unanticipated event on stock prices. The abnormal
returns reflect the stock market's reaction to the arrival of new information, where the abnormal returns
are calculated by subtracting the expected return for the stock from its actual return (McWilliams and
Siegel 1997). If significant, abnormal returns indicate the average effect of the event on the value of the
firm; that is, the presence of significant abnormal returns allows the researcher to infer that the event had
a significant impact on firm value. Inferring significance relies on two assumptions: events were
unanticipated and no confounding effects occurred during the event window. The method helps
researchers avoid the use of accounting-based measures of profit, which are weak indicators of actual
performance and connect only weakly to individual events.
The event of additions and deletions from DJSI World occurs annually. While the announcement
of changes is anticipated, the event of addition or deletion of particular companies is unexpected (more
information can be found http://www.sustainability-indexes.com/images/djsi-world-guidebook_tcm1071-
337244.pdf). We control for confounding events with media articles described below.
For the event study method to be reliable, the DJSI must send a significant signal to the market.
Fowler and Hope (2007) identify three criteria for such a signal. First, news about a company’s CSR
activities must be announced through sources other than the company itself; the SAM Group publishes
annual releases of the index changes in press and on their website. Second, the audit of social,
environmental, and corporate governance performance must be conducted by a third party; DJSI uses
independent third parties (i.e., the SAM Group and Evalueserve) to examine all three performance
indicators simultaneously. Third, the CSR engagement needs to be so substantial that it makes the
company a leader in its industry; the DJSI selects companies based on a “best in class” approach that
seeks to identify the best companies in each industry sector.
The process by which DJSI World is compiled every year starts with an invitation to 2,500 largest
17
companies (by market capitalization) to participate in an assessment (by sending them a survey as well as
conducting stakeholder media analysis throughout the year by third parties). Companies are then ranked
within each industry by industry-specific as well as general criteria on corporate governance, social, and
environmental dimensions. Only those industry sectors where the highest ranked company has a Total
Sustainability Score of at least 40% of the maximum score (relative to the best scoring company in the
eligible universe) are eligible for the DJSI World. All other sectors – and their associated companies – are
deemed ineligible and are eliminated from the selection process. From each eligible industry sector, only
companies with a Total Sustainability Score of at least half of the highest ranked company in the existing
DJSI universe are eligible for the inclusion into the DJSI World. All other companies are deemed
ineligible and are eliminated from the review process. This is how only sustainability leaders in each
eligible industry (DJSI does not exclude any industries from the evaluation) end up on the index, and if
they lost their leadership position to its peers in the industry (or their industry sector experienced a crisis
of legitimacy and as a result saw a decrease in CSR), they get dropped. There is no limited number of
slots in the index but the comparative analyses of the “best in class” (in the industry sector) eliminate
‘unworthy’ companies from ‘worthy’ ones. This process is similar to the social process of legitimation
and authorization (Johnson et al. 2006) as well as legitimation by other legitimacy agents by way of
penalties and official recognition described in prior research (Rao et al. 2005).
We used an event study because it isolates investors’ reaction as a mechanism for associating
CSR and financial performance (Margolis et al. 2007). Given the specifics of DJSI World and our
approach to the study, we did not face a national bias or confounding events, for two reasons. First, our
sample included companies from fourteen countries (Australia, Brazil, Canada, Chile, China, Germany,
France, Japan, South Africa, South Korea, Spain, Taiwan, the U.S.A., and the U.K.). Second, we
undertook a Lexis-Nexis search for potential events that may have affected investors’ decisions during the
fourteen months before the announcement and one week before the announcement (the former period is
when the DJSI is evaluating firms for addition or deletion, while the latter targets a more narrow period of
time in which confounding events to the immediate reaction of investors could have taken place).
18
We identified three prior empirical studies of performance that examined the DJSI. Two
evaluated determinants of adding European firms from 1998–2004 (López et al. 2007; Ziegler and
Schroder 2010), relying on accounting measures of performance; the third used U.S. stocks in 2002–
2008, using an event study without controls for firm or industry characteristics (Cheung 2011), all finding
inconclusive results. Our study, in addition to undertaking a more refined methodology with beta excess
returns as a measure of financial performance, uses a more extensive timeframe (1999–2007) and
encompasses a larger number of countries.
Overall, the DJSI as a source of data suited the event study due to its global reach, brand
visibility, yearly review, continuous monitoring of companies, openness of information, consistent
methodology, and availability for licensing. Between 1999 and 2007, the DJSI added about 500 firms and
deleted about 300 firms. Due to data availability on CSRP (which provides data for firms listed on NYSE
and AMEX only), our final dataset includes 268 addition events that listed 216 companies (companies
that were added twice were added in non-consecutive years) and 150 deletion events that delisted 133
companies, of which 58% were U.S.-based. This sample is substantially larger than in previous studies.
By checking the assumptions of event studies, we assured the quality of the data and implementation of
the study. Appendix C addresses potential criticisms of endogenous drivers of additions and deletions.
Measures
Dependent variable. The dependent variable, Beta Excess Returns (BER), comes from the Daily
Stock file of The Center for Research in Security Prices (CRSP). BER is the excess return of a stock issue
less the average return of all issues in its beta-portfolio on each trading date, calculated using NYSE and
AMEX data. We use BER as a dependent variable because it inherently controls for risk and compares the
target company to all others in the market, solving two main limitations of previous studies. We aggregate
beta excess returns on day one and two after the announcement of DJSI changes for clarity; we tested our
models separately on days one and two, finding consistent results.
Changes in social legitimacy. As we noted above, we use the event of addition to (deletion from)
the DJSI to indicate increased (decreased) social legitimacy.
19
Market legitimacy. We reviewed the academic literature and interviewed analysts with
experience in global financial markets in New York, London, and Moscow (Bloomberg, investment
banks, and financial research firms) to determine indicators that market actors use when they assess firms’
market legitimacy. We gave the analysts Suchman’s definition of legitimacy and asked them what norms,
beliefs, values, and definitions they hold of legitimate firms. We found that legitimacy for market actors
reflects perceptions of a firm’s future financial viability. More specifically, the analysts identified two
sources of market legitimacy, one based on objective and the other one subjective sources.
Objective sources of market legitimacy that the analysts rely on rest on measures of financial
performance that help them form perceptions of future financial viability of the firm. Relevant measures
include profitability, liquidity, and other ratios that assess profitability. The interviews highlighted
multiple ways of constructing perceptions of future viability of the firm, so that there is no one best
indicator for market legitimacy; instead, one needs to evaluate the impact of multiple inputs. This
conclusion reinforces Bitektine’s (2011) argument about the need to investigate the evaluation criteria
that different audiences use to assess legitimacy. We focused on identifying indicators that would be
relevant to many analysts and investors but would not be immediately intuitive to the general public, so
that we could separate broader social evaluations from more specific market assessments.
In our interviews, the analysts highlighted the importance of current measures of performance
rather than more historical trends. Therefore, we assess the impact of objective market legitimacy through
six indicators that measure current financial performance: (1) earnings before income and tax margin
(EBIT margin), (2) earnings from continuous operations margin (ECO margin), (3) net income margin
(return on sales, i.e., ROS), (4) return on assets (ROA), (5) return on equity (ROE), and (6) return on
capital (ROC). We then used a composite measure of standardized values (z-transformations: mean=0,
s.d.=1) of the six ratios as our primary measure of objective market legitimacy. As we note below, we
assessed other potential indicators of objective market legitimacy in sensitivity analysis. The data on
financial performance comes from Capital IQ, which covers about 88,000 companies globally with over
5,000 financial data items. The six ratios are percentages, which makes it possible to compare across them
20
and form a composite measure of objective market legitimacy. Table 1a reports descriptive statistics for
standardized values of the items. Appendix D shows that the six individual measures had consistent
influence (with somewhat varying significance) on the impact of addition and deletion by the DJSI.
********** Tables 1a and 1b about here **********
The analysts also identified subjective sources of market legitimacy. The measures rest in third-
party assessments, recommendations, and company ratings, such as credit ratings by Moody’s, Standard
& Poor’s, Fitch, and analyst recommendations to buy, hold, or sell a stock. Subjective sources generally
include market research, industry reports, and industry rankings that demonstrate firms’ “ability to deliver
future maintainable/sustainable earnings.” Our interviewees suggested that such subjective third-party
sources primarily complement their own assessments of objective data – indeed, they commonly search
for a rationale within the subjective data that will support their own prior assessments. Nonetheless, the
analysts believed that subjective criteria were relevant indicators of market legitimacy. In our event study,
we assess the impact of subjective market legitimacy by recording analyst recommendations to buy a
firm’s stock during either of the two days prior to the event of addition or deletion by the DJSI.
The data on analyst recommendations comes from First Call Analyst Recommendations database,
where the contributing analysts represent major international research firms, regional firms, and
boutiques. The database provides broad coverage and local expertise to over 50,000 institutional investors
and brokerage firms worldwide. We searched for analyst recommendations to buy (which should
strengthen investor’s perception of market legitimacy) during a short event window – either one or two
days before the DJSI announcement. If more than one analyst made recommendations on the same day,
we calculated the average between them: analyst recommendations range from 1 (Strong Buy) to 5
(Strong Sell); our measure of the recommendation to buy was coded as 1 when analysts’
recommendations were lower than 2.5 and 0 otherwise. Table 1b reports descriptive statistics for the
variables, including the control variables that we describe below.
The analysts’ discussion of objective and subjective sources of market legitimacy is consistent
with academic studies. The organizational legitimacy literature suggests that higher levels of objective
21
market legitimacy as indicated by stronger financial performance will result in greater attention and
endorsement by market actors and thus generate greater levels of market legitimacy (Deephouse 1996;
Dowling and Pfeffer 1975; Galaskiewicz 1985). In parallel, studies of social embededdness of financial
markets suggest that when investors are unsure about how to interpret the news from the market,
subjective sources such as analyst recommendations can influence their interpretation and, in turn, change
the market value (Westphal and Clement 2008; Westphal and Graebner 2010; Zuckerman 1999, 2004).
We considered other potential measures of objective and subjective market legitimacy, based on
long-term indicators. For objective market legitimacy, we examined several measures of longer-term
profitability and growth. For subjective market legitimacy, we considered Standard & Poor’s annual
ranking of firm quality and credit rating in the year of the announcement, as well as average analyst
recommendations over the year. The longer-term potential measures of objective and subjective market
legitimacy were not significant when the models included other variables. The insignificant impact of the
longer-term indicators was consistent with our interviews – the analysts said that their evaluations focus
on information from the past two to three months, so that the effect of annual ratings and longer-term
financial performance will tend to have little influence in their evaluation of market legitimacy.
Control variables. The analysis included industry dummies based on DJSI classification
(consumer, industrial, financial, and natural resources), dummy variables for headquarters location (North
America, Europe, and Other), variables for negative and positive news during 14 months and 1 week
before the DJSI announcement, and organizational size (log of the number of employees). Industry is
relevant because the closer the product is to the end customer, such as the consumer industry, the stronger
investor preferences might be for CSR and, thus, the higher the gains or losses from inclusion or
exclusion from DJSI (Porter and Kramer 2006). Geographic location of a company might affect the
economic value attached to CSR; in particular, the European Union has a longer history of corporate
social engagement and stronger regulations (Waddock 2008), so investors might particularly welcome the
addition to the index for firms from these countries or, instead, might simply take CSR for granted.
The variables for prior positive and negative news reflect the need for the listing event to provide
22
new information. The less longer- or short-term prior information there is about a firm’s CSR activities,
the higher the impact that the event may have on the investors. We controlled for confounding events with
a Lexis-Nexis search for potential events that may have affected investors’ decisions. Our search included
major world publications in two periods. For the period of fourteen months before the event, we sought
headlines that referred to the company with the keywords “environment,” “fine,” “illegal,” and/or “sue”
within 40 words from the company name. For the period of one week before the announcement, we
sought headlines that included the company name, with the general words “good,” “bad,” “positive,”
“negative,” or “outstanding” within 20 words from the name of the firm. The former period is when the
DJSI is evaluating firms for addition or deletion, while the latter targets a narrow period of time in which
confounding events to the immediate reaction of investors could have taken place. After we conducted the
Lexis-Nexis search, we coded the mentions in the press as four separate count variables: positive/negative
press 14 months in advance and positive/negative press one week before the announcement.
We needed to apply judgment in how we used and interpreted the impact of organizational size.
Organizational size could be a measure of market legitimacy, because it may provide power in market
activities such as in obtaining a contract with a local supplier, but it may also be a source of vulnerability
in non-market activities, such as the maintenance of social legitimacy, because larger and more visible
organizations are more likely to be attacked by interest groups (Kostova and Zaheer 1999). Therefore, we
use size as a control variable rather than a measure of legitimacy. Including or excluding size did not
affect the predicted effects of objective or subjective market legitimacy in either the addition or deletion
models. Size has a significant effect on its own in the case of additions to the DJSI (the negative sign is
consistent with what we would expect for additions had we used size as a measure of market legitimacy).
By contrast, size did not affect market reaction to deletions when we include a constant term in the
deletion models, where the constant reflects the main effect of deletion. We exclude the insignificant size
variable from the deletion models because it tended to overlap with the negative main effect of the
constant term; in addition, owing to missing values for the size variable, excluding the variable allowed us
to analyze a larger deletion sample. Appendix E reports sensitivity analyses with and without
23
organizational size, as well as with and without the constant term. We will discuss these sensitivity
analyses following the main results, along with other robustness checks.
RESULTS
Table 2 reports the results. Model 1 and Model 5 report baseline models for addition (268 cases)
and deletion (150 cases, including 11 for which we lacked data when the DJSI first added them to the
list). In order to maintain focus, we report only the most important control variables. The main effect of
addition is positive (= 0.0367, p<0.05), while the main effect of deletion is negative (= -0.0103,
p<0.10). In the addition model, greater size confers less benefit (= -0.0034, p<0.05), while the service
sector gains more benefit relative to the other industries (most significantly in comparison to the
consumer sector). In the deletion model, the resource sector suffers less (= 0.0194, p<0.05), while firms
with negative press during the week prior to the event suffer more (= -0.0092, p<0.01).
********** Table 2 about here **********
The results in Models 2 to 4 of Table 2 support Hypothesis 1. Model 2 tests Hypothesis 1 with the
aggregate objective measure of market legitimacy, finding strong significance in the hypothesized effect
(= -0.0061, p<0.01). Model 3 uses subjective market legitimacy, also finding strong support (=
-0.0279, p<0.01). Model 4a includes the effects of both measures of market legitimacy, once again
finding strong support to Hypothesis 1 with consistent results for objective and subjective market
legitimacy (= -0.0058, p<0.05; = -0.0268 p<0.01). Model 4b limits the sample to firms that the DJSI
subsequently dropped (we matched 139 cases, which we examine again in the deletion analysis), which
ensures that we directly compare the benefits of addition to the costs of deletion; the paired subset has
consistent results with the earlier analysis. Thus, the main effect of being added to the DJSI is positive
but, as expected, companies with greater market legitimacy, whether objective or subjective, benefit less
from the increased social legitimacy. We depict the extent of differences after discussing deletion models.
The deletion results in Models 6 to 8 support Hypothesis 2. Model 6 tests Hypothesis 2 with the
objective measure of market legitimacy, finding significance for the hypothesized effect (= 0.0066,
p<0.05). Model 7 uses the subjective measure of market legitimacy, also finding a significant effect
24
(=0.0333, p<0.05). Model 8a includes both measures of market legitimacy, finding consistent results for
both objective (=0.0071, p<0.05) and subjective market legitimacy (=0.0366 p<0.05). Model 8b
focuses on the subsample of firms with both addition and deletion events (139 cases); the results are
consistent with Model 8a. Hence, these results suggest that, as expected, market legitimacy counter-
balances losses of social legitimacy.
Figure 1 depicts the results. The figure uses coefficients from Models 4a and 8a of Table 2, based
on calculations with the possible values of subjective market legitimacy (0 or 1) and values of objective
market legitimacy two standard deviations above and below the mean. Figure 1a shows that firms that are
high on both forms of market legitimacy realize little or no benefit when the DJSI adds them (the left
front corner of the figure). Firms gain more from addition when they have lower levels of either objective
or subjective market legitimacy (the upward slopes on the left and right axes of the figure). Firms that are
low on both dimensions of market legitimacy gain most (the right rear corner of the figure). Figure 1b
(based on Model 8a) reports parallel results for deletions. Firms that are low on both objective and
subjective market legitimacy suffer when they are dropped (the left front corner of the figure). The losses
are less pronounced as either objective or subjective market legitimacy increases (the upward slopes on
the right and left axes). Firms with high values of both objective and subjective market legitimacy may
actually gain when they are dropped. One might view the positive reaction to deletion as the market
expecting financially robust firms to have more time to attend to their business activities if they devote
less time to social activities; perhaps more likely, though, is that the trend reflects a strong attenuation of
the negative impact, rather than a precise point estimate of the net impact. In general, the figures highlight
the degree to which either form of market legitimacy attenuates the positive impact of addition and the
negative impact of deletion by the DJSI, that is, reduces the impact of the changes in social legitimacy.
********* Figures 1 and 2 about here **********
Figure 2 depicts the results for the matched sample of firms that were added and subsequently
dropped in our sample (total of 139 firms; models 4b and 8b in Table 2). It allows for a more direct
comparison of the net impact of additions and deletions at different levels of legitimacy (mean,
25
plus/minus 1-2 standard deviations). The figure shows a small net gain when firms had similar market
legitimacy at addition and deletion, net gain with low market legitimacy when added and high market
legitimacy when dropped, and net loss with high market legitimacy when added and low market
legitimacy when dropped.
The results for objective and subjective market legitimacy remain significant in sensitivity
analyses (Appendix E). We added a control for slack resources based on the ratio of current liabilities to
current assets (Models E1a and E2a); we did not include slack in other models because data availability
limited our sample size. We added age, vertical and horizontal diversification, and R&D and advertising
expenditures: greater R&D (Model E1b) has a negative impact with additions, while greater advertising
expenditure (Model E2b) has a negative impact with deletions, in fact substituting for the negative effect
of deletion. Prior studies suggest that greater visibility provides challenges to maintaining organizational
legitimacy (Kostova and Zaheer 1999); firms with greater R&D and advertising expenditures are often
highly visible. Size (employees) has no significant impact when the analysis includes a constant (Model
E3a), but exacerbates the negative impact of deletion when there is no constant (Model E3b: = -0.00134,
p<0.05); the negative impact of deletion is greatest for larger firms (similar to the negative effect of high
advertising), just as larger firms benefit less from addition.
DISCUSSION AND CONCLUSIONS
Ruef and Scott (1998) proposed a multi-dimensional model of organizational legitimacy more
than a decade ago, but the literature has only started to explore different sources and mechanisms behind
the social construction of legitimacy (Bitektine 2011; Deephouse and Suchman 2008). We study how
different dimensions of legitimacy affect organizations in a new light – through their interaction. By
considering two sets of organizational constituents – market and non-market – that have different values
and norms in assessing organizational legitimacy, we theorize, measure, and test how different sources of
organizational legitimacy affect organizational outcomes. In particular, we examine how financial market
legitimacy arising from market actors conditions the effect of changes in social legitimacy arising from
non-market actors. We find that firms with higher market legitimacy benefit less from increased social
26
legitimacy and lose less from decreased social legitimacy. The results suggest an intriguing effect
whereby market legitimacy substitutes for social legitimacy in creating economic value.
This study contributes to the neo-institutional and CSR literatures. First, we extend organizational
legitimacy theory by moving away from the dichotomous understanding of legitimacy which has been
common in many studies (Zimmerman and Zeitz 2002) and considering interactions among different
sources of legitimacy and their effect on performance (Bansal and Clelland 2004; Deephouse 1999; Earle
et al. 2010; Kostova and Zaheer 1999). In doing so, we assess two sources of organizational legitimacy,
examine how they affect firm value, and argue that market legitimacy, subjective or objective, conditions
the benefits and costs of gaining and losing social legitimacy. The core argument that market legitimacy
conditions and substitutes for social legitimacy in terms of market assessment reinforces the point that
organizational legitimacy is a multi-dimensional concept (Dacin et al. 2007; Deephouse and Suchman
2008; Kraatz and Block 2008; Ruef and Scott 1998). Moreover, by making a clear distinction between
subjective and objective sources of market legitimacy and testing their effect separately and
simultaneously, we demonstrate how different sources of one dimension of organizational legitimacy
complement each other. Thus, while different dimensions of organizational legitimacy may substitute for
each other, different sources of one of the dimensions in turn can reinforce each other.
Second, we extend the literature on CSR. By applying organizational legitimacy theory to study
firms’ engagement in CSR and its effects on performance, we enhance our understanding of the
mechanisms behind CSR value construction: Investors approve of CSR less when the firm has developed
an alternative base of organizational legitimacy, consistent with the values and norms of the market.
Empirically, corporations face increasing social, political, and economic institutional pressures to
undertake actions within the realm of CSR. Many firms view indices that list companies based on various
dimensions of social and environmental performance as a valuable way of gaining organizational
legitimacy (Schuler and Cording 2006). In addition, with increasing funds available in the market for
socially responsible investment, managers commonly believe that joining such indices will generate
financial benefits. While the literature on the relationship between corporate social performance (CSP)
27
and corporate financial performance (CFP) often finds modest returns to CSR (Margolis and Elfenbein
2008), previous studies have not considered how the effect of CSR on firm value may vary with market
legitimacy, and whether and under what conditions the costs outweigh the benefits of CSR. We
demonstrate that costs of deletion may outweigh benefits of addition for firms that lack market
legitimacy, possibly reflecting financial market demands that firms focus first on financial performance
before taking on social activities. This comparison is intriguing for the academic literature and has
implications for firm strategy.
Third, empirically, we contribute to both literatures by answering a call from neo-institutional
scholars to examine the role of private decentralized institutions (King et al. 2005) and using a robust
methodology to examine CSP-CFP link. Akin to norms, codes of conduct, and industry standards,
participation in DJSI evaluation is voluntary, and diffuse actors rather than centralized brokers provide
rewards and sanctions (Ingram and Silveramn 2002). The work is one of the first to examine the DJSI,
using a robust methodology and triangulating the event study analysis with qualitative data from
interviews and archival search, previously called for (Margolis and Walsh 2003). In addition, the paper
examines the data-generating process and the opinions of the parties most interested in the links between
social and financial performance, including corporations, analysts, and investors. By examining under
what conditions the market values social legitimacy signals, we address a gap in our understanding of
perceptions of CSR by key stakeholders in the capital markets.
Our study has practical implications. Social indices are not only a meaningful source of social
legitimacy but also important investment tools in the market. Currently, about 11% of the $25 trillion in
total assets under professional management in the United States involves socially responsible investing
(SIF 2007), whereby investors seek to attain both financial returns and social good. Globally, this number
is even higher, according to Carbon Disclosure Project’s 534 institutional investors representing more
than $64 trillion of assets (PWC 2010) and UN Principles for Responsible Investment’s 784 signatories
with $22 trillion of assets under management (PRI 2010). Evaluating the impact of additions and
deletions at DJSI is important to both market and non-market actors seeking to understand the role of
28
social indices. Furthermore, our discussion of conditions under which different sources of organizational
legitimacy interact in affecting organizational outcomes provides the basis for active management of
organizational legitimacy. In particular, managers can seek to establish several bases of organizational
legitimacy, so that when they lose one, they can draw on another in defending their organization.
The study has limits that provide direction to future research. First, studies could examine more
firms, including those for which CRSP or Capital IQ lack data. Second, further work could examine other
elements of social legitimacy beyond social indices, as well as market legitimacy beyond analyst
recommendations and profitability. Third, studies could examine the joint evolution of social and market
legitimacy, or dynamism of legitimacy. Fourth, research could examine other mechanisms for market
interpretation of the social legitimacy signals. Finally, future research could study periods that experience
major shocks to social and market legitimacy, such as the recent financial recession and the Gulf Oil spill.
More generally, while recent studies demonstrate how market legitimacy conditions the likelihood of
social illegitimacy (Mishina et al. 2010) and how social legitimacy conditions the changes in market
legitimacy (Handelman and Arnold 1999), future work could consider other dimensions of organizational
legitimacy, including how they condition each other and affect various other organizational outcomes.
In sum, this paper advances our understanding of CSR and organizational legitimacy. The core
finding that market legitimacy conditions how changes in social legitimacy affect firms’ economic value
is robust and important. We hope the paper will open lines of inquiry that will broaden our understanding
of this phenomenon.
29
REFERENCES Aldrich, H.E., C.M. Fiol. 1994. Fools Rush in? The Institutional Context of Industry Creation. The Academy of
Management Review 19(4) 645-670. Ashforth, B.E., B.W. Gibbs. 1990. The Double-Edge of Organizational Legitimation. Organization Science 1(2)
177-194. Bansal, P., I. Clelland. 2004. Talking Trash: Legitimacy, Impression Management, and Unsystematic Risk in the
Context of the Natural Environment. The Academy of Management Journal 47(1) 93-103. Barley, S.R., P.S. Tolbert. 1997. Institutionalization and Structuration: Studying the Links between Action and
Institution. Organization Studies 18(1) 93-117. Baron, D.P. 1995. Integrated Strategy: Market and Nonmarket Components. California Management Review 37(2)
47. Bebchuk, L.A., A. Cohen, C.C. Wang. 2010. Learning and the Disappearing Association Between Governance and
Returns. Harvard Law School Olin Discussion Paper No. 667(April 2010). Bettis, R.A., C.K. Prahalad. 1995. The dominant logic: Retrospective and extension. Strategic Management Journal
16(1) 5-14. Bitektine, A. 2011. Toward a Theory of Social Judgments of Organizations: The Case of Legitimacy, Reputation,
and Status. The Academy of Management Review (AMR) 36(1) 151-179. Bonardi, J.-P., A.J. Hillman, G.D. Keim. 2005. The Attractiveness of Political Markets: Implications for Firm
Strategy. The Academy of Management Review 30(2) 397-413. Campbell, J.L. 2007. Why Would Corporations Behave in Socially Responsible Ways? An Institutional Theory of
Corporate Social Responsibility Academy of Management Review 32(3) 946-967. Campbell, J.Y., A.W. Lo, A.C. MacKinlay. 2007. The Econometrics of Financial Markets. PRINCETON
UNIVERSITY PRESS. Casselman, B. 2007. Why 'Social Enterprise' Rarely Works The Wall Street Journal. Dow Jones & Company, Inc.,
Page W2. Certo, S.T. 2003. Influencing Initial Public Offering Investors with Prestige: Signaling with Board Structures. The
Academy of Management Review 28(3) 432-446. Cheung, A.W.K. 2011. Do Stock Investors Value Corporate Sustainability? Evidence from an Event Study. Journal
of Business Ethics 99(2) 145-165. Cohen, B.D., T.J. Dean. 2005. Information Asymmetry and Investor Valuation of IPOs: Top Management Team
Legitimacy as a Capital Market Signal Strategic Management Journal 26(7) 683-690. Consolandi, C., A. Jaiswal-Dale, E. Poggiani, A. Vercelli. 2009. Global Standards and Ethical Stock Indexes: The
Case of the Dow Jones Sustainability Stoxx Index. Journal of Business Ethics 87(0) 185-197. Corbett, C.J., M.J. Montes-Sancho, D.A. Kirsch. 2005. The Financial Impact of ISO 9000 Certification in the United
States: An Empirical Analysis. Management Science 51(7) 1046-1059. Dacin, M.T., C. Oliver, J.-P. Roy. 2007. The legitimacy of strategic alliances: an institutional perspective. Strategic
Management Journal 28(2) 169-187. Deephouse, D.L. 1996. Does Isomorphism Legitimate? The Academy of Management Journal 39(4) 1024-1039. Deephouse, D.L. 1999. To be different, or to be the same? It's a question (and theory) of strategic balance. Strategic
Management Journal 20(2) 147-166. Deephouse, D.L., M.C. Suchman. 2008. Legitimacy in Organizational Institutionalism. R. Greenwood, C. Oliver, K.
Sahlin-Andersson, R. Suddaby., eds. The Handbook of Organizational Institutionalism. SAGE Publications, 49-77.
Delmas, M.A., M.W. Toffel. 2008. Organizational responses to environmental demands: opening the black box. Strategic Management Journal 29(10) 1027-1055.
Dobrev, S.D., A. Gotsopoulos. 2010. Legitimacy Vacuum, Structural Imprinting, and the First Mover Disadvantage. Academy of Management Journal 53(5) 1153-1174.
Doh, J.P., S.D. Howton, S.W. Howton, D.S. Siegel. 2010. Does the Market Respond to an Endorsement of Social Responsibility? The Role of Institutions, Information, and Legitimacy. Journal of Management 36(6) 1461-1485.
Dowling, J., J. Pfeffer. 1975. Organizational Legitimacy: Social Values and Organizational Behavior. The Pacific Sociological Review 18(1) 122-136.
Durand, R., J. McGuire. 2005. Legitimating Agencies in the Face of Selection: The Case of AACSB. Organization Studies 26(2) 165-196.
30
Earle, J., A. Spicer, K. Peter. 2010. The Normalization of Deviant Organizational Practices: Wage Arrears in Russia, 1991-98. The Academy of Management Journal (AMJ) 53(2) 218-237.
Elsbach, K.D. 1994. Managing Organizational Legitimacy in the California Cattle Industry: The Construction and Effectiveness of Verbal Accounts. Administrative Science Quarterly 39(1) 57-88.
Espeland, W.N., M. Sauder. 2007. Rankings and Reactivity: How Public Measures Recreate Social Worlds. American Journal of Sociology 113(1) 1-40.
Fowler, S.J., C. Hope. 2007. A critical review of sustainable business indices and their impact. Journal of Business Ethics 76(3) 243-252.
Freeman, R.E. 1984. Strategic management: A stakeholder approach. Pitman, Boston. Friedman, M. 1970. The Social responsibility of Business if to increase its profits New York Time Magazine. The
New York Times Company, New York. Galaskiewicz, J. 1985. Interorganizational Relations. Annual Review of Sociology 11(ArticleType: primary_article /
Full publication date: 1985 / Copyright © 1985 Annual Reviews) 281-304. Gardberg, N.A., C.J. Fombrun. 2006. Corporate Citizenship: Creating Intangible Assets Across Institutional
Environments Academy of Management Review 31(2) 329-346. Gimeno, J., C.Y. Woo. 1996. Hypercompetition in a Multimarket Environment: The Role of Strategic Similarity and
Multimarket Contact in Competitive De-Escalation. Organization Science 7(3) 322-341. Godfrey, P.C. 2005. The relationship Between Corporate Philanthropy and Shareholder Wealth: A Risk
Management Perspective Academy of Management Review 30(4) 777-798. Godfrey, P.C., C.B. Merrill, J.M. Hansen. 2009. The relationship between corporate social responsibility and
shareholder value: an empirical test of the risk management hypothesis. Strategic Management Journal 30(4) 425-445.
Grant, R.M. 1988. On 'dominant logic', relatedness and the link between diversity and performance. Strategic Management Journal 9(6) 639-642.
Greenwood, R., R. Suddaby, C.R. Hinings. 2002. Theorizing Change: The Role of Professional Associations in the Transformation of Institutionalized Fields. The Academy of Management Journal 45(1) 58-80.
Handelman, J.M., S.J. Arnold. 1999. The Role of Marketing Actions with a Social Dimension: Appeals to the Institutional Environment. The Journal of Marketing 63(3) 33-48.
Hirsch, P.M. 1975. Organizational Effectiveness and the Institutional Environment. Administrative Science Quarterly 20(3) 327-344.
Hirsch, P.M., J.A.Y. Andrews. 1984. Administrators' response to performance and value challenges: Stance, symbols, and behavior. T.J.a.C. Sergiovanni, J. E., ed. Leadership and Organizational Culture. University of Illinois Press, Urbana, IL, 170-185.
Hybels, R.C. 1995. On legitimacy, legitimation, and organizations: A critical review and integrative theoretical model. Academy of Management Journal(00014273) 241-241.
Ingram, P., B.S. Silveramn. 2002. The new institutionalism in strategic management. P. Ingram, B.S. Silverman, eds. Advances in strategic management. JAI Press, Greenwich, CT, 1-32.
Johnson, C., T.J. Dowd, C.L. Ridgeway. 2006. Legitimacy as a Social Process. Annual Review of Sociology 32(1) 53-78.
King, A.A., M.J. Lenox, A. Terlaak. 2005. The Strategic Use of Decentralized Institutions: Exploring Certification with the ISO 14001 Management Standard. Academy of Management Journal 48(6) 1091-1106.
Kostova, T., S. Zaheer. 1999. Organizational Legitimacy Under Conditions of Complexity: The Case of the Multinational Enterprise. The Academy of Management Review 24(1) 64-81.
Kraatz, M.S., E.S. Block. 2008. Organizational Implications of Institutional Pluralism. R. Greenwood, C. Oliver, K. Sahlin-Andersson, R. Suddaby., eds. The Handbook of Organizational Institutionalism. SAGE Publications, 243-275.
Lackmann, J., J. Ernstberger, M. Stich. 2011. Market Reactions to Increased Reliability of Sustainability Information. Journal of Business Ethics September 1-18.
Lamin, A., S. Zaheer. 2012. Wall Street vs. Main Street: Firm Strategies for Defending Legitimacy and Their Impact on Different Stakeholders. Organization Science 23(1) 47-66.
López, M.V., A. Garcia, L. Rodriguez. 2007. Sustainable Development and Corporate Performance: A Study Based on the Dow Jones Sustainability Index. Journal of Business Ethics 75(3) 285-300.
Lounsbury, M., M.A. Glynn. 2001. Cultural entrepreneurship: stories, legitimacy, and the acquisition of resources. Strategic Management Journal 22(6-7) 545-564.
Love, E., M. Kraatz. 2009. Character, Conformity, or the Bottom Line? How and Why Downsizing Affected Corporate Reputation. The Academy of Management Journal (AMJ) 52(2) 314-335.
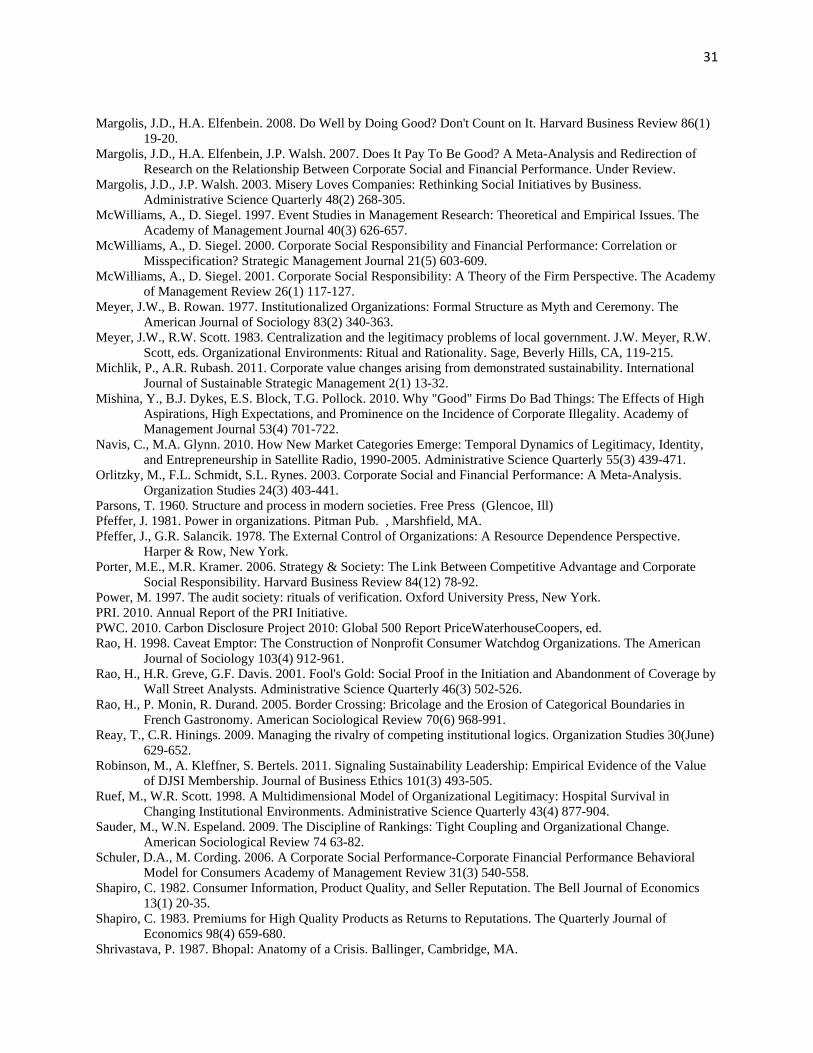
31
Margolis, J.D., H.A. Elfenbein. 2008. Do Well by Doing Good? Don't Count on It. Harvard Business Review 86(1) 19-20.
Margolis, J.D., H.A. Elfenbein, J.P. Walsh. 2007. Does It Pay To Be Good? A Meta-Analysis and Redirection of Research on the Relationship Between Corporate Social and Financial Performance. Under Review.
Margolis, J.D., J.P. Walsh. 2003. Misery Loves Companies: Rethinking Social Initiatives by Business. Administrative Science Quarterly 48(2) 268-305.
McWilliams, A., D. Siegel. 1997. Event Studies in Management Research: Theoretical and Empirical Issues. The Academy of Management Journal 40(3) 626-657.
McWilliams, A., D. Siegel. 2000. Corporate Social Responsibility and Financial Performance: Correlation or Misspecification? Strategic Management Journal 21(5) 603-609.
McWilliams, A., D. Siegel. 2001. Corporate Social Responsibility: A Theory of the Firm Perspective. The Academy of Management Review 26(1) 117-127.
Meyer, J.W., B. Rowan. 1977. Institutionalized Organizations: Formal Structure as Myth and Ceremony. The American Journal of Sociology 83(2) 340-363.
Meyer, J.W., R.W. Scott. 1983. Centralization and the legitimacy problems of local government. J.W. Meyer, R.W. Scott, eds. Organizational Environments: Ritual and Rationality. Sage, Beverly Hills, CA, 119-215.
Michlik, P., A.R. Rubash. 2011. Corporate value changes arising from demonstrated sustainability. International Journal of Sustainable Strategic Management 2(1) 13-32.
Mishina, Y., B.J. Dykes, E.S. Block, T.G. Pollock. 2010. Why "Good" Firms Do Bad Things: The Effects of High Aspirations, High Expectations, and Prominence on the Incidence of Corporate Illegality. Academy of Management Journal 53(4) 701-722.
Navis, C., M.A. Glynn. 2010. How New Market Categories Emerge: Temporal Dynamics of Legitimacy, Identity, and Entrepreneurship in Satellite Radio, 1990-2005. Administrative Science Quarterly 55(3) 439-471.
Orlitzky, M., F.L. Schmidt, S.L. Rynes. 2003. Corporate Social and Financial Performance: A Meta-Analysis. Organization Studies 24(3) 403-441.
Parsons, T. 1960. Structure and process in modern societies. Free Press (Glencoe, Ill) Pfeffer, J. 1981. Power in organizations. Pitman Pub. , Marshfield, MA. Pfeffer, J., G.R. Salancik. 1978. The External Control of Organizations: A Resource Dependence Perspective.
Harper & Row, New York. Porter, M.E., M.R. Kramer. 2006. Strategy & Society: The Link Between Competitive Advantage and Corporate
Social Responsibility. Harvard Business Review 84(12) 78-92. Power, M. 1997. The audit society: rituals of verification. Oxford University Press, New York. PRI. 2010. Annual Report of the PRI Initiative. PWC. 2010. Carbon Disclosure Project 2010: Global 500 Report PriceWaterhouseCoopers, ed. Rao, H. 1998. Caveat Emptor: The Construction of Nonprofit Consumer Watchdog Organizations. The American
Journal of Sociology 103(4) 912-961. Rao, H., H.R. Greve, G.F. Davis. 2001. Fool's Gold: Social Proof in the Initiation and Abandonment of Coverage by
Wall Street Analysts. Administrative Science Quarterly 46(3) 502-526. Rao, H., P. Monin, R. Durand. 2005. Border Crossing: Bricolage and the Erosion of Categorical Boundaries in
French Gastronomy. American Sociological Review 70(6) 968-991. Reay, T., C.R. Hinings. 2009. Managing the rivalry of competing institutional logics. Organization Studies 30(June)
629-652. Robinson, M., A. Kleffner, S. Bertels. 2011. Signaling Sustainability Leadership: Empirical Evidence of the Value
of DJSI Membership. Journal of Business Ethics 101(3) 493-505. Ruef, M., W.R. Scott. 1998. A Multidimensional Model of Organizational Legitimacy: Hospital Survival in
Changing Institutional Environments. Administrative Science Quarterly 43(4) 877-904. Sauder, M., W.N. Espeland. 2009. The Discipline of Rankings: Tight Coupling and Organizational Change.
American Sociological Review 74 63-82. Schuler, D.A., M. Cording. 2006. A Corporate Social Performance-Corporate Financial Performance Behavioral
Model for Consumers Academy of Management Review 31(3) 540-558. Shapiro, C. 1982. Consumer Information, Product Quality, and Seller Reputation. The Bell Journal of Economics
13(1) 20-35. Shapiro, C. 1983. Premiums for High Quality Products as Returns to Reputations. The Quarterly Journal of
Economics 98(4) 659-680. Shrivastava, P. 1987. Bhopal: Anatomy of a Crisis. Ballinger, Cambridge, MA.
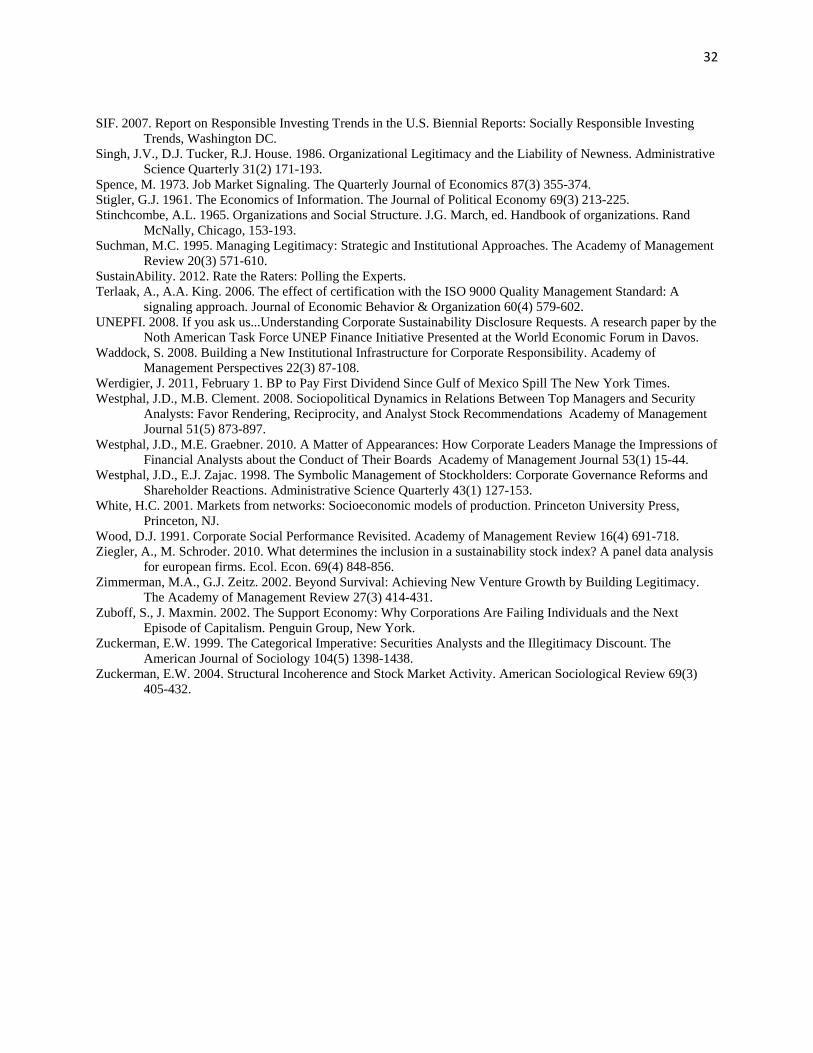
32
SIF. 2007. Report on Responsible Investing Trends in the U.S. Biennial Reports: Socially Responsible Investing Trends, Washington DC.
Singh, J.V., D.J. Tucker, R.J. House. 1986. Organizational Legitimacy and the Liability of Newness. Administrative Science Quarterly 31(2) 171-193.
Spence, M. 1973. Job Market Signaling. The Quarterly Journal of Economics 87(3) 355-374. Stigler, G.J. 1961. The Economics of Information. The Journal of Political Economy 69(3) 213-225. Stinchcombe, A.L. 1965. Organizations and Social Structure. J.G. March, ed. Handbook of organizations. Rand
McNally, Chicago, 153-193. Suchman, M.C. 1995. Managing Legitimacy: Strategic and Institutional Approaches. The Academy of Management
Review 20(3) 571-610. SustainAbility. 2012. Rate the Raters: Polling the Experts. Terlaak, A., A.A. King. 2006. The effect of certification with the ISO 9000 Quality Management Standard: A
signaling approach. Journal of Economic Behavior & Organization 60(4) 579-602. UNEPFI. 2008. If you ask us...Understanding Corporate Sustainability Disclosure Requests. A research paper by the
Noth American Task Force UNEP Finance Initiative Presented at the World Economic Forum in Davos. Waddock, S. 2008. Building a New Institutional Infrastructure for Corporate Responsibility. Academy of
Management Perspectives 22(3) 87-108. Werdigier, J. 2011, February 1. BP to Pay First Dividend Since Gulf of Mexico Spill The New York Times. Westphal, J.D., M.B. Clement. 2008. Sociopolitical Dynamics in Relations Between Top Managers and Security
Analysts: Favor Rendering, Reciprocity, and Analyst Stock Recommendations Academy of Management Journal 51(5) 873-897.
Westphal, J.D., M.E. Graebner. 2010. A Matter of Appearances: How Corporate Leaders Manage the Impressions of Financial Analysts about the Conduct of Their Boards Academy of Management Journal 53(1) 15-44.
Westphal, J.D., E.J. Zajac. 1998. The Symbolic Management of Stockholders: Corporate Governance Reforms and Shareholder Reactions. Administrative Science Quarterly 43(1) 127-153.
White, H.C. 2001. Markets from networks: Socioeconomic models of production. Princeton University Press, Princeton, NJ.
Wood, D.J. 1991. Corporate Social Performance Revisited. Academy of Management Review 16(4) 691-718. Ziegler, A., M. Schroder. 2010. What determines the inclusion in a sustainability stock index? A panel data analysis
for european firms. Ecol. Econ. 69(4) 848-856. Zimmerman, M.A., G.J. Zeitz. 2002. Beyond Survival: Achieving New Venture Growth by Building Legitimacy.
The Academy of Management Review 27(3) 414-431. Zuboff, S., J. Maxmin. 2002. The Support Economy: Why Corporations Are Failing Individuals and the Next
Episode of Capitalism. Penguin Group, New York. Zuckerman, E.W. 1999. The Categorical Imperative: Securities Analysts and the Illegitimacy Discount. The
American Journal of Sociology 104(5) 1398-1438. Zuckerman, E.W. 2004. Structural Incoherence and Stock Market Activity. American Sociological Review 69(3)
405-432.
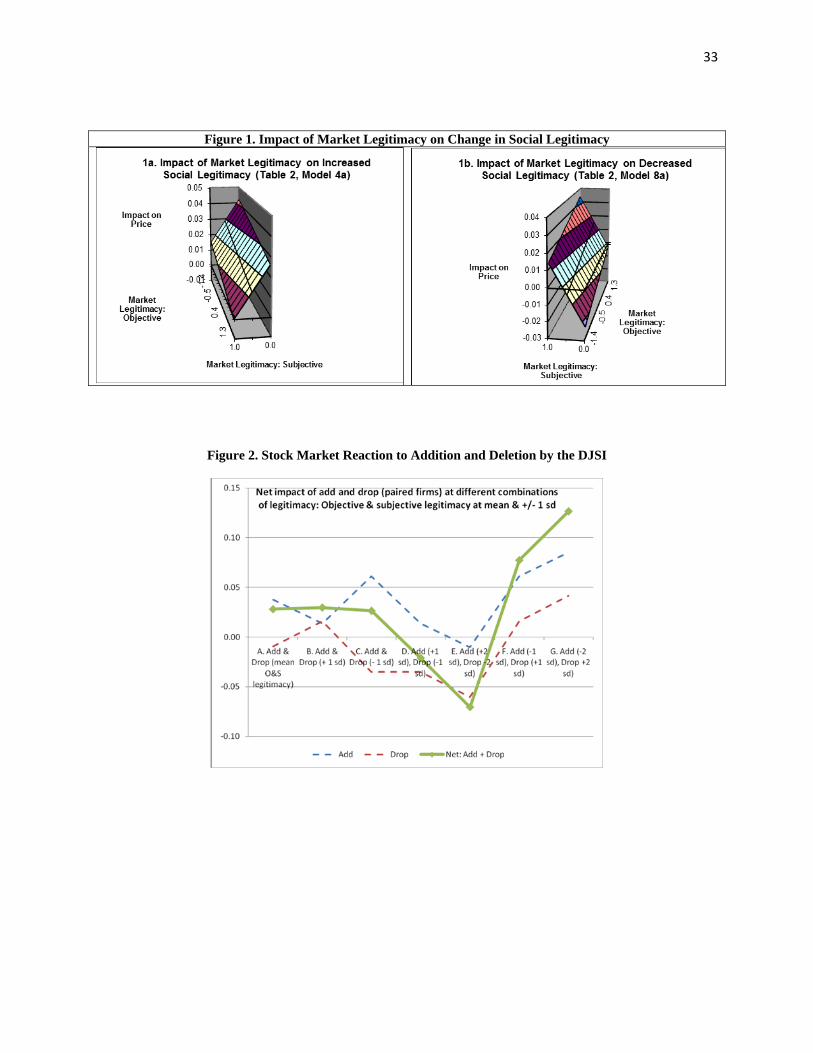
33
Figure 1. Impact of Market Legitimacy on Change in Social Legitimacy
Figure 2. Stock Market Reaction to Addition and Deletion by the DJSI
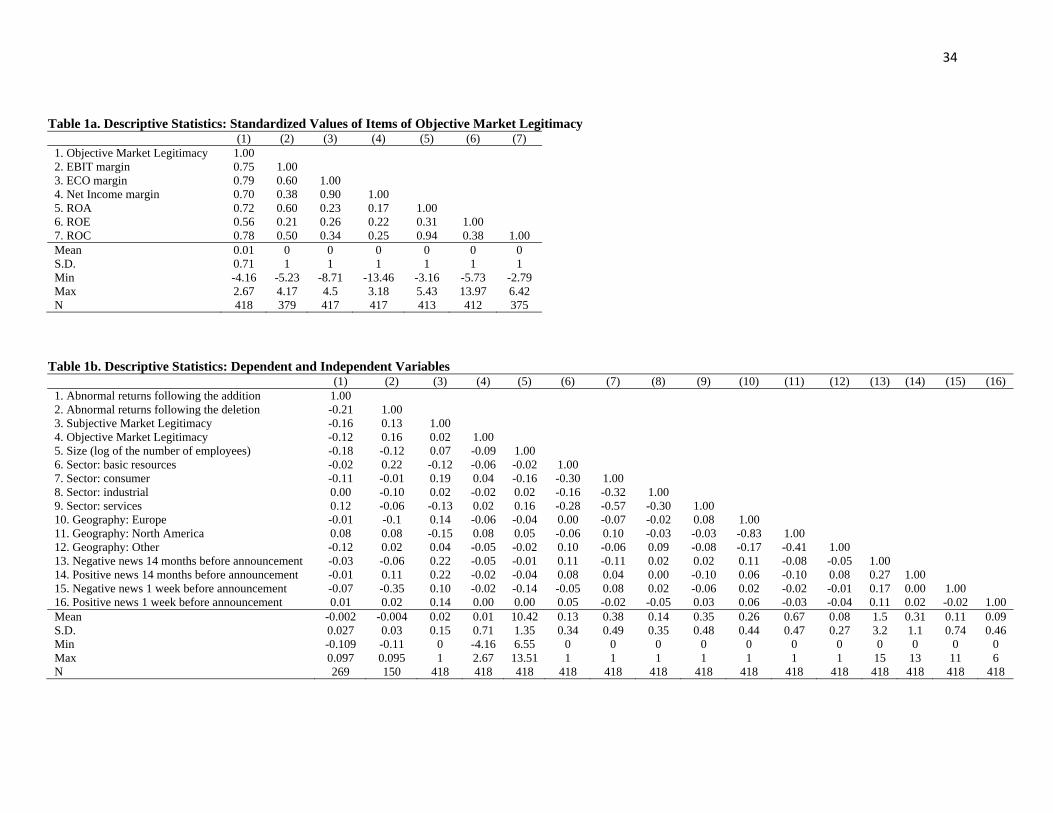
34
Table 1a. Descriptive Statistics: Standardized Values of Items of Objective Market Legitimacy (1) (2) (3) (4) (5) (6) (7) 1. Objective Market Legitimacy 1.00 2. EBIT margin 0.75 1.00 3. ECO margin 0.79 0.60 1.00 4. Net Income margin 0.70 0.38 0.90 1.00 5. ROA 0.72 0.60 0.23 0.17 1.00 6. ROE 0.56 0.21 0.26 0.22 0.31 1.00 7. ROC 0.78 0.50 0.34 0.25 0.94 0.38 1.00 Mean 0.01 0 0 0 0 0 0 S.D. 0.71 1 1 1 1 1 1 Min -4.16 -5.23 -8.71 -13.46 -3.16 -5.73 -2.79 Max 2.67 4.17 4.5 3.18 5.43 13.97 6.42 N 418 379 417 417 413 412 375
Table 1b. Descriptive Statistics: Dependent and Independent Variables
(1) (2) (3) (4) (5) (6) (7) (8) (9) (10) (11) (12) (13) (14) (15) (16) 1. Abnormal returns following the addition 1.00 2. Abnormal returns following the deletion -0.21 1.00 3. Subjective Market Legitimacy -0.16 0.13 1.00 4. Objective Market Legitimacy -0.12 0.16 0.02 1.00 5. Size (log of the number of employees) -0.18 -0.12 0.07 -0.09 1.00 6. Sector: basic resources -0.02 0.22 -0.12 -0.06 -0.02 1.00 7. Sector: consumer -0.11 -0.01 0.19 0.04 -0.16 -0.30 1.00 8. Sector: industrial 0.00 -0.10 0.02 -0.02 0.02 -0.16 -0.32 1.00 9. Sector: services 0.12 -0.06 -0.13 0.02 0.16 -0.28 -0.57 -0.30 1.00 10. Geography: Europe -0.01 -0.1 0.14 -0.06 -0.04 0.00 -0.07 -0.02 0.08 1.00 11. Geography: North America 0.08 0.08 -0.15 0.08 0.05 -0.06 0.10 -0.03 -0.03 -0.83 1.00 12. Geography: Other -0.12 0.02 0.04 -0.05 -0.02 0.10 -0.06 0.09 -0.08 -0.17 -0.41 1.00 13. Negative news 14 months before announcement -0.03 -0.06 0.22 -0.05 -0.01 0.11 -0.11 0.02 0.02 0.11 -0.08 -0.05 1.00 14. Positive news 14 months before announcement -0.01 0.11 0.22 -0.02 -0.04 0.08 0.04 0.00 -0.10 0.06 -0.10 0.08 0.27 1.00 15. Negative news 1 week before announcement -0.07 -0.35 0.10 -0.02 -0.14 -0.05 0.08 0.02 -0.06 0.02 -0.02 -0.01 0.17 0.00 1.00 16. Positive news 1 week before announcement 0.01 0.02 0.14 0.00 0.00 0.05 -0.02 -0.05 0.03 0.06 -0.03 -0.04 0.11 0.02 -0.02 1.00 Mean -0.002 -0.004 0.02 0.01 10.42 0.13 0.38 0.14 0.35 0.26 0.67 0.08 1.5 0.31 0.11 0.09 S.D. 0.027 0.03 0.15 0.71 1.35 0.34 0.49 0.35 0.48 0.44 0.47 0.27 3.2 1.1 0.74 0.46 Min -0.109 -0.11 0 -4.16 6.55 0 0 0 0 0 0 0 0 0 0 0 Max 0.097 0.095 1 2.67 13.51 1 1 1 1 1 1 1 15 13 11 6 N 269 150 418 418 418 418 418 418 418 418 418 418 418 418 418 418
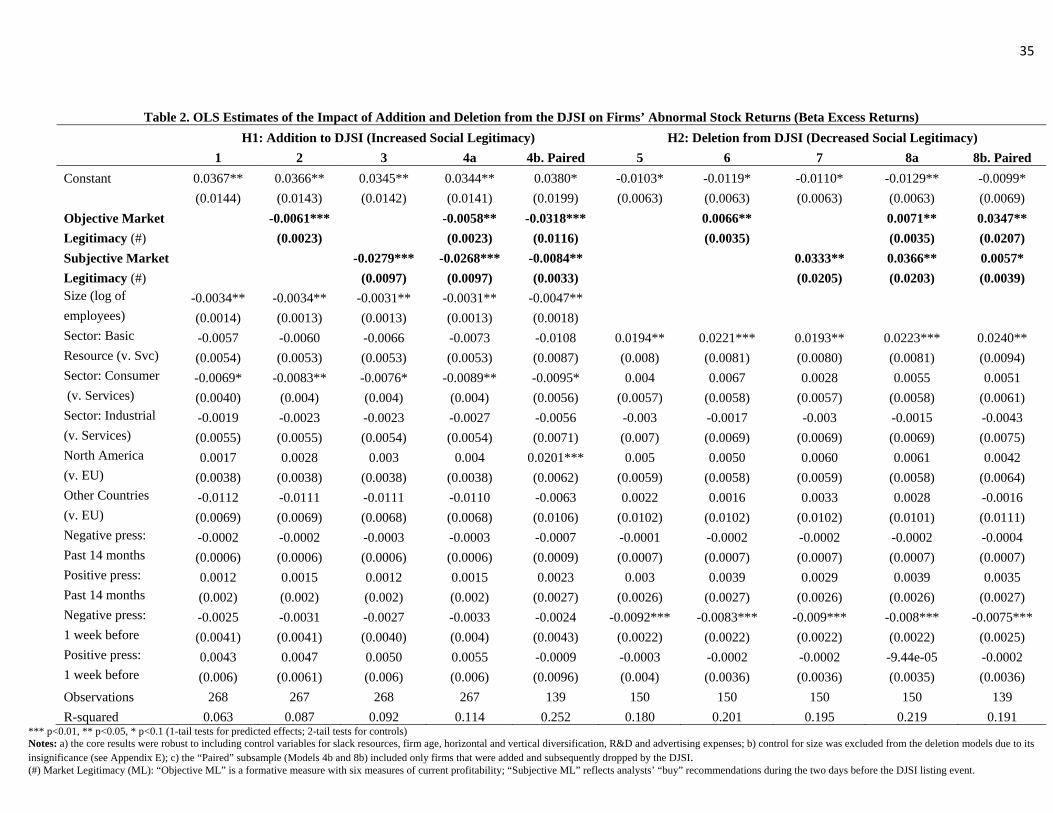
35
Table 2. OLS Estimates of the Impact of Addition and Deletion from the DJSI on Firms’ Abnormal Stock Returns (Beta Excess Returns)
H1: Addition to DJSI (Increased Social Legitimacy) H2: Deletion from DJSI (Decreased Social Legitimacy)
1 2 3 4a 4b. Paired 5 6 7 8a 8b. Paired
Constant 0.0367** 0.0366** 0.0345** 0.0344** 0.0380* -0.0103* -0.0119* -0.0110* -0.0129** -0.0099*
(0.0144) (0.0143) (0.0142) (0.0141) (0.0199) (0.0063) (0.0063) (0.0063) (0.0063) (0.0069)
Objective Market -0.0061*** -0.0058** -0.0318*** 0.0066** 0.0071** 0.0347**
Legitimacy (#) (0.0023) (0.0023) (0.0116) (0.0035) (0.0035) (0.0207)
Subjective Market -0.0279*** -0.0268*** -0.0084** 0.0333** 0.0366** 0.0057*
Legitimacy (#) (0.0097) (0.0097) (0.0033) (0.0205) (0.0203) (0.0039) Size (log of -0.0034** -0.0034** -0.0031** -0.0031** -0.0047** employees) (0.0014) (0.0013) (0.0013) (0.0013) (0.0018) Sector: Basic -0.0057 -0.0060 -0.0066 -0.0073 -0.0108 0.0194** 0.0221*** 0.0193** 0.0223*** 0.0240** Resource (v. Svc) (0.0054) (0.0053) (0.0053) (0.0053) (0.0087) (0.008) (0.0081) (0.0080) (0.0081) (0.0094) Sector: Consumer -0.0069* -0.0083** -0.0076* -0.0089** -0.0095* 0.004 0.0067 0.0028 0.0055 0.0051 (v. Services) (0.0040) (0.004) (0.004) (0.004) (0.0056) (0.0057) (0.0058) (0.0057) (0.0058) (0.0061) Sector: Industrial -0.0019 -0.0023 -0.0023 -0.0027 -0.0056 -0.003 -0.0017 -0.003 -0.0015 -0.0043 (v. Services) (0.0055) (0.0055) (0.0054) (0.0054) (0.0071) (0.007) (0.0069) (0.0069) (0.0069) (0.0075) North America 0.0017 0.0028 0.003 0.004 0.0201*** 0.005 0.0050 0.0060 0.0061 0.0042 (v. EU) (0.0038) (0.0038) (0.0038) (0.0038) (0.0062) (0.0059) (0.0058) (0.0059) (0.0058) (0.0064) Other Countries -0.0112 -0.0111 -0.0111 -0.0110 -0.0063 0.0022 0.0016 0.0033 0.0028 -0.0016 (v. EU) (0.0069) (0.0069) (0.0068) (0.0068) (0.0106) (0.0102) (0.0102) (0.0102) (0.0101) (0.0111) Negative press: -0.0002 -0.0002 -0.0003 -0.0003 -0.0007 -0.0001 -0.0002 -0.0002 -0.0002 -0.0004 Past 14 months (0.0006) (0.0006) (0.0006) (0.0006) (0.0009) (0.0007) (0.0007) (0.0007) (0.0007) (0.0007) Positive press: 0.0012 0.0015 0.0012 0.0015 0.0023 0.003 0.0039 0.0029 0.0039 0.0035 Past 14 months (0.002) (0.002) (0.002) (0.002) (0.0027) (0.0026) (0.0027) (0.0026) (0.0026) (0.0027) Negative press: -0.0025 -0.0031 -0.0027 -0.0033 -0.0024 -0.0092*** -0.0083*** -0.009*** -0.008*** -0.0075*** 1 week before (0.0041) (0.0041) (0.0040) (0.004) (0.0043) (0.0022) (0.0022) (0.0022) (0.0022) (0.0025) Positive press: 0.0043 0.0047 0.0050 0.0055 -0.0009 -0.0003 -0.0002 -0.0002 -9.44e-05 -0.0002 1 week before (0.006) (0.0061) (0.006) (0.006) (0.0096) (0.004) (0.0036) (0.0036) (0.0035) (0.0036)
Observations 268 267 268 267 139 150 150 150 150 139
R-squared 0.063 0.087 0.092 0.114 0.252 0.180 0.201 0.195 0.219 0.191 *** p<0.01, ** p<0.05, * p<0.1 (1-tail tests for predicted effects; 2-tail tests for controls) Notes: a) the core results were robust to including control variables for slack resources, firm age, horizontal and vertical diversification, R&D and advertising expenses; b) control for size was excluded from the deletion models due to its insignificance (see Appendix E); c) the “Paired” subsample (Models 4b and 8b) included only firms that were added and subsequently dropped by the DJSI. (#) Market Legitimacy (ML): “Objective ML” is a formative measure with six measures of current profitability; “Subjective ML” reflects analysts’ “buy” recommendations during the two days before the DJSI listing event.

36
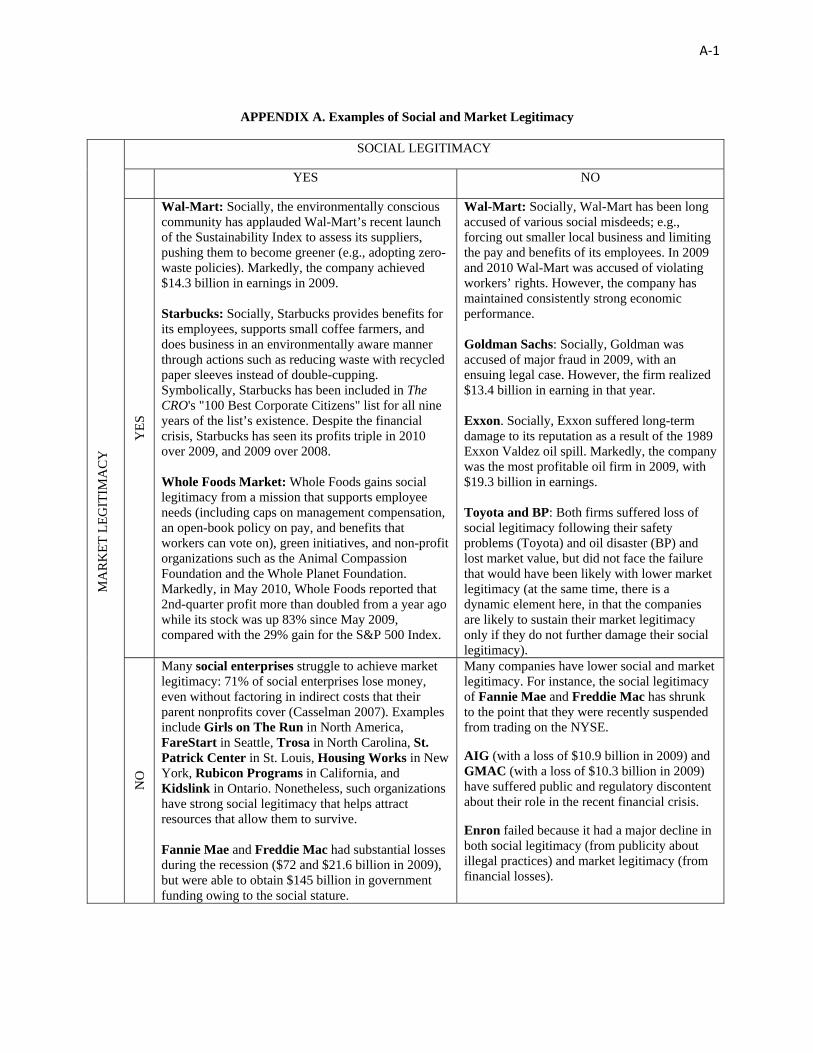
A‐1
APPENDIX A. Examples of Social and Market Legitimacy
MA
RK
ET
LE
GIT
IMA
CY
SOCIAL LEGITIMACY
YES NO
YE
S
Wal-Mart: Socially, the environmentally conscious community has applauded Wal-Mart’s recent launch of the Sustainability Index to assess its suppliers, pushing them to become greener (e.g., adopting zero-waste policies). Markedly, the company achieved $14.3 billion in earnings in 2009. Starbucks: Socially, Starbucks provides benefits for its employees, supports small coffee farmers, and does business in an environmentally aware manner through actions such as reducing waste with recycled paper sleeves instead of double-cupping. Symbolically, Starbucks has been included in The CRO's "100 Best Corporate Citizens" list for all nine years of the list’s existence. Despite the financial crisis, Starbucks has seen its profits triple in 2010 over 2009, and 2009 over 2008. Whole Foods Market: Whole Foods gains social legitimacy from a mission that supports employee needs (including caps on management compensation, an open-book policy on pay, and benefits that workers can vote on), green initiatives, and non-profit organizations such as the Animal Compassion Foundation and the Whole Planet Foundation. Markedly, in May 2010, Whole Foods reported that 2nd-quarter profit more than doubled from a year ago while its stock was up 83% since May 2009, compared with the 29% gain for the S&P 500 Index.
Wal-Mart: Socially, Wal-Mart has been long accused of various social misdeeds; e.g., forcing out smaller local business and limiting the pay and benefits of its employees. In 2009 and 2010 Wal-Mart was accused of violating workers’ rights. However, the company has maintained consistently strong economic performance. Goldman Sachs: Socially, Goldman was accused of major fraud in 2009, with an ensuing legal case. However, the firm realized $13.4 billion in earning in that year. Exxon. Socially, Exxon suffered long-term damage to its reputation as a result of the 1989 Exxon Valdez oil spill. Markedly, the company was the most profitable oil firm in 2009, with $19.3 billion in earnings. Toyota and BP: Both firms suffered loss of social legitimacy following their safety problems (Toyota) and oil disaster (BP) and lost market value, but did not face the failure that would have been likely with lower market legitimacy (at the same time, there is a dynamic element here, in that the companies are likely to sustain their market legitimacy only if they do not further damage their social legitimacy).
NO
Many social enterprises struggle to achieve market legitimacy: 71% of social enterprises lose money, even without factoring in indirect costs that their parent nonprofits cover (Casselman 2007). Examples include Girls on The Run in North America, FareStart in Seattle, Trosa in North Carolina, St. Patrick Center in St. Louis, Housing Works in New York, Rubicon Programs in California, and Kidslink in Ontario. Nonetheless, such organizations have strong social legitimacy that helps attract resources that allow them to survive. Fannie Mae and Freddie Mac had substantial losses during the recession ($72 and $21.6 billion in 2009), but were able to obtain $145 billion in government funding owing to the social stature.
Many companies have lower social and market legitimacy. For instance, the social legitimacy of Fannie Mae and Freddie Mac has shrunk to the point that they were recently suspended from trading on the NYSE.
AIG (with a loss of $10.9 billion in 2009) and GMAC (with a loss of $10.3 billion in 2009) have suffered public and regulatory discontent about their role in the recent financial crisis.
Enron failed because it had a major decline in both social legitimacy (from publicity about illegal practices) and market legitimacy (from financial losses).
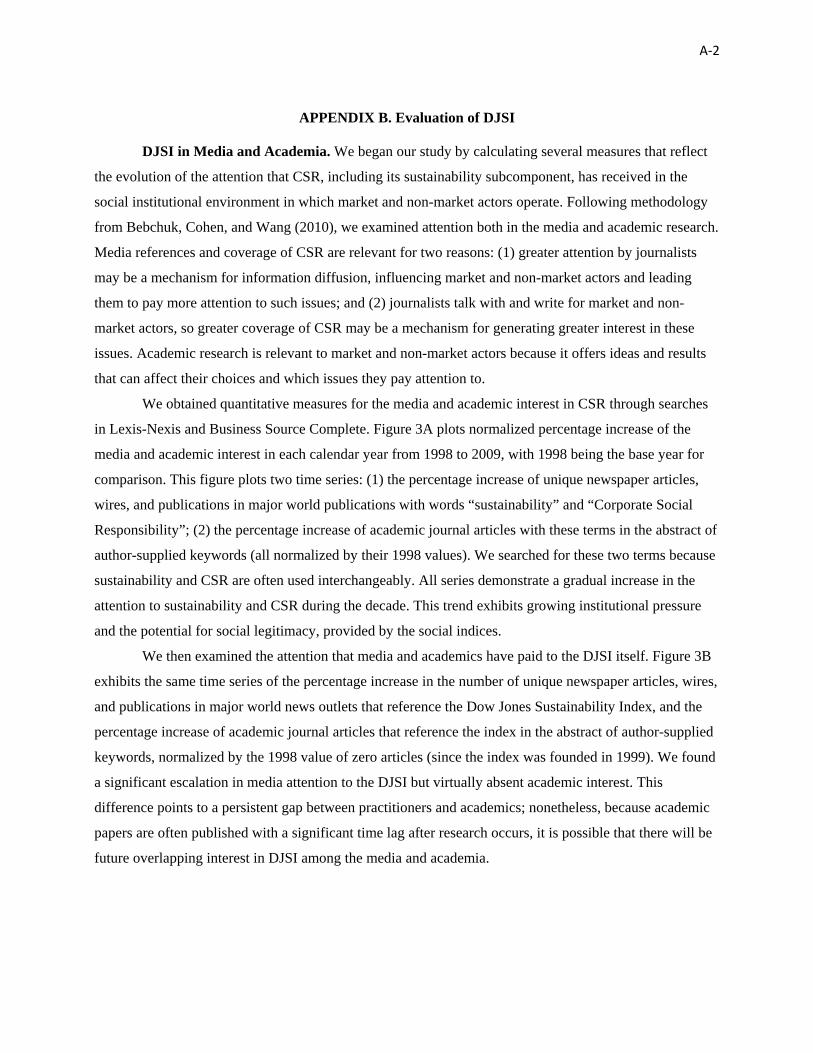
A‐2
APPENDIX B. Evaluation of DJSI
DJSI in Media and Academia. We began our study by calculating several measures that reflect
the evolution of the attention that CSR, including its sustainability subcomponent, has received in the
social institutional environment in which market and non-market actors operate. Following methodology
from Bebchuk, Cohen, and Wang (2010), we examined attention both in the media and academic research.
Media references and coverage of CSR are relevant for two reasons: (1) greater attention by journalists
may be a mechanism for information diffusion, influencing market and non-market actors and leading
them to pay more attention to such issues; and (2) journalists talk with and write for market and non-
market actors, so greater coverage of CSR may be a mechanism for generating greater interest in these
issues. Academic research is relevant to market and non-market actors because it offers ideas and results
that can affect their choices and which issues they pay attention to.
We obtained quantitative measures for the media and academic interest in CSR through searches
in Lexis-Nexis and Business Source Complete. Figure 3A plots normalized percentage increase of the
media and academic interest in each calendar year from 1998 to 2009, with 1998 being the base year for
comparison. This figure plots two time series: (1) the percentage increase of unique newspaper articles,
wires, and publications in major world publications with words “sustainability” and “Corporate Social
Responsibility”; (2) the percentage increase of academic journal articles with these terms in the abstract of
author-supplied keywords (all normalized by their 1998 values). We searched for these two terms because
sustainability and CSR are often used interchangeably. All series demonstrate a gradual increase in the
attention to sustainability and CSR during the decade. This trend exhibits growing institutional pressure
and the potential for social legitimacy, provided by the social indices.
We then examined the attention that media and academics have paid to the DJSI itself. Figure 3B
exhibits the same time series of the percentage increase in the number of unique newspaper articles, wires,
and publications in major world news outlets that reference the Dow Jones Sustainability Index, and the
percentage increase of academic journal articles that reference the index in the abstract of author-supplied
keywords, normalized by the 1998 value of zero articles (since the index was founded in 1999). We found
a significant escalation in media attention to the DJSI but virtually absent academic interest. This
difference points to a persistent gap between practitioners and academics; nonetheless, because academic
papers are often published with a significant time lag after research occurs, it is possible that there will be
future overlapping interest in DJSI among the media and academia.
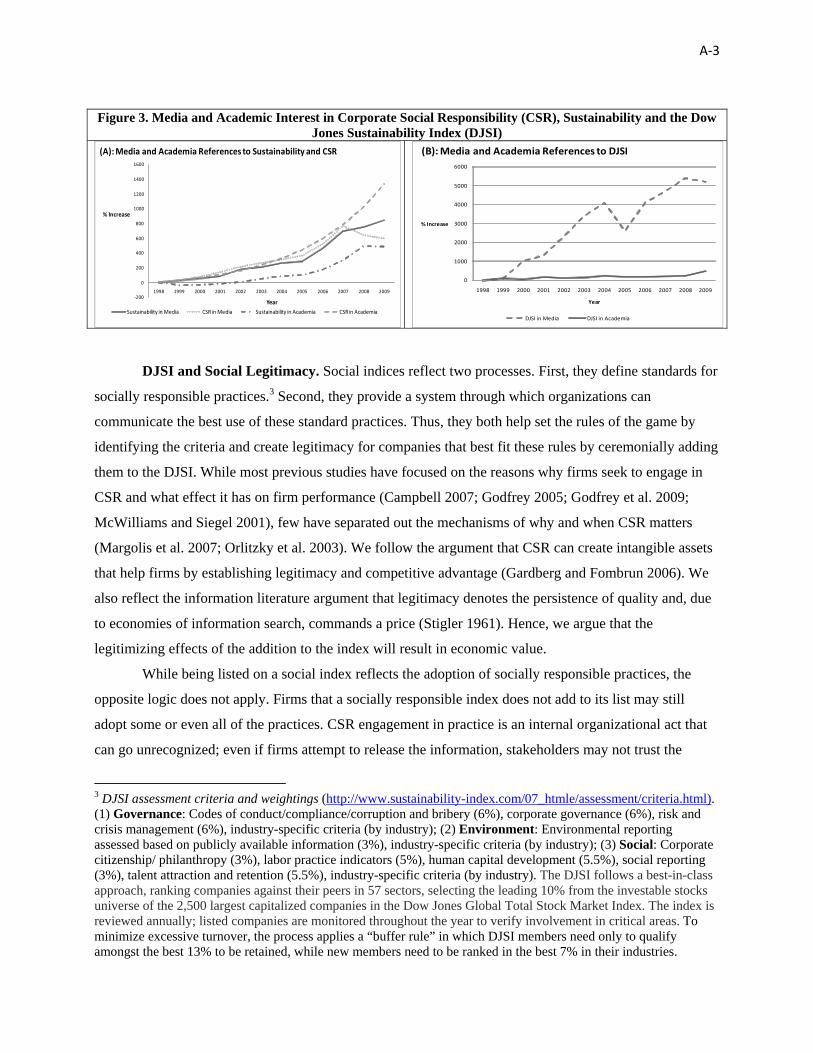
A‐3
Figure 3. Media and Academic Interest in Corporate Social Responsibility (CSR), Sustainability and the Dow Jones Sustainability Index (DJSI)
‐200
0
200
400
600
800
1000
1200
1400
1600
1998 1999 2000 2001 2002 2003 2004 2005 2006 2007 2008 2009
% Increase
Year
(A): Media and Academia References to Sustainability and CSR
Sustainability in Media CSR in Media Sustainability in Academia CSR in Academia
0
1000
2000
3000
4000
5000
6000
1998 1999 2000 2001 2002 2003 2004 2005 2006 2007 2008 2009
% Increase
Year
(B): Media and Academia References to DJSI
DJSI in Media DJSI in Academia
DJSI and Social Legitimacy. Social indices reflect two processes. First, they define standards for
socially responsible practices.3 Second, they provide a system through which organizations can
communicate the best use of these standard practices. Thus, they both help set the rules of the game by
identifying the criteria and create legitimacy for companies that best fit these rules by ceremonially adding
them to the DJSI. While most previous studies have focused on the reasons why firms seek to engage in
CSR and what effect it has on firm performance (Campbell 2007; Godfrey 2005; Godfrey et al. 2009;
McWilliams and Siegel 2001), few have separated out the mechanisms of why and when CSR matters
(Margolis et al. 2007; Orlitzky et al. 2003). We follow the argument that CSR can create intangible assets
that help firms by establishing legitimacy and competitive advantage (Gardberg and Fombrun 2006). We
also reflect the information literature argument that legitimacy denotes the persistence of quality and, due
to economies of information search, commands a price (Stigler 1961). Hence, we argue that the
legitimizing effects of the addition to the index will result in economic value.
While being listed on a social index reflects the adoption of socially responsible practices, the
opposite logic does not apply. Firms that a socially responsible index does not add to its list may still
adopt some or even all of the practices. CSR engagement in practice is an internal organizational act that
can go unrecognized; even if firms attempt to release the information, stakeholders may not trust the
3 DJSI assessment criteria and weightings (http://www.sustainability-index.com/07_htmle/assessment/criteria.html). (1) Governance: Codes of conduct/compliance/corruption and bribery (6%), corporate governance (6%), risk and crisis management (6%), industry-specific criteria (by industry); (2) Environment: Environmental reporting assessed based on publicly available information (3%), industry-specific criteria (by industry); (3) Social: Corporate citizenship/ philanthropy (3%), labor practice indicators (5%), human capital development (5.5%), social reporting (3%), talent attraction and retention (5.5%), industry-specific criteria (by industry). The DJSI follows a best-in-class approach, ranking companies against their peers in 57 sectors, selecting the leading 10% from the investable stocks universe of the 2,500 largest capitalized companies in the Dow Jones Global Total Stock Market Index. The index is reviewed annually; listed companies are monitored throughout the year to verify involvement in critical areas. To minimize excessive turnover, the process applies a “buffer rule” in which DJSI members need only to qualify amongst the best 13% to be retained, while new members need to be ranked in the best 7% in their industries.
A‐4
potentially biased source. Addition to the index, though, is a public act of CSR commitment because in
addition to a voluntary action by the firm, it involves an independent and public audit; it is a signal to the
market that the organization has fulfilled the ceremonial requirements of the institutionalized myths of
inspection and evaluation (Espeland and Sauder 2007; Meyer and Rowan 1977; Sauder and Espeland
2009). Therefore, information about social legitimacy that comes from an independent third party such as
the DJSI is credible in the market; moreover, by delineating a list of socially responsible firms, the index
saves investors and analysts the costs associated with the search for information. Meyer and Rowan’s
(1977) notion of a ceremonial criteria of worth applies to additions to the DJSI, demonstrating an
organization’s social fitness and legitimating organizations with internal participants, stockholders, the
public, the state, the IRS, and the SEC.
DJSI and Companies. Our archival review found that companies actively seek to be added to the
DJSI for multiple reasons: to gain reputational and membership benefits, to seek insurance-like protection,
to meet institutional pressures and stakeholder demands, to signal to analysts and investors that they are
creating long-term shareholder value, to signify product and company differentiation, and to increase the
value and recognition of the company’s brand. Many executives believe that being listed on a socially
responsible index will generate financial benefits from investors (who, in turn, expect the increased social
legitimacy to attract support from major stakeholders such as customers and regulators). A meta-analysis
of CSR studies found modest financial returns to CSR (Margolis et al. 2007); however, few studies
examined the economic impact of addition and deletion from a socially responsible index. As we argued
above, addition to the socially responsible index demonstrates that firms have satisfied the expectations of
social, political, and environmental counterparts and, moreover, have accomplished this in a visible and
effective manner. Even if many of a firm’s CSR activities might be known to market actors – and the
current stock price might already reflect many of the expected benefits – validation by a credible third
party such as the DJSI generates new information that has economic value.
DJSI and Analysts. In order to assess whether the DJSI generates meaningful information for
investors, we conducted interviews with market analysts about the role of social indices in stock
evaluation. We picked 16 additions to the DJSI, representing different industries. Using the One Source
Database, we identified analyst reports that included stock valuation, company profile, recommendations,
and analysis. We then contacted analysts involved in preparing these reports in several institutions,
including Wachovia Capital Markets, Credit Suisse, HSBC, Deutsche Bank, Société Générale, Cowen and
Company, Macquarie Research, CIBC World Markets, RBC Capital Markets, and Oppenheimer. We
contacted 3 to 4 institutions per company, approaching analysts based in the U.S. and Europe. During
2009, we sent out 116 interview requests and were able to obtain 12 interviews (we can provide the
interview protocol and transcriptions). More than half of the respondents were aware of the social indices,
A‐5
such as the DJSI, and used them or considered using them in their evaluations, supporting the assumption
that the DJSI is a meaningful source of social legitimacy.
In turn, many of the respondents recommended contacting equities analysts that focus exclusively
on socially responsible investing (SRI). An interview with an SRI analyst in France indicated that at least
one third of all socially responsible investors rely on sustainability indexes in their decision-making. The
other sources include sustainability reports, annual reports, press, industry association memberships,
NGOs, and rating agencies; institutional investors were particularly likely to pay attention to the indices.
For exploratory reasons, we asked the analysts to comment on why the companies they cover
would be added to a socially responsible index. The respondents identified four factors. First, the nature of
the product: in some industries, the product itself can be considered socially responsible. The managed
care company Humana, for instance, offered healthcare to minorities and disadvantaged people, which
helped increase its share of Medicare business, thereby supporting the business case for CSR. Second, the
nature of the industry: firms in the wireless equipment industry such as Motorola, for instance, can be
considered “greener” than companies in other technology-related sector because radio waves do not affect
human beings (according to current theories of science and physiology) and building wireless systems
requires less physical infrastructure than any other type of construction. Third, company leadership:
because CSR contributes to corporate reputation in the general merchandise industry (e.g., Wal-Mart,
Target, and Carrefour), the former CEO of Wal-Mart, Lee Scott, reorganized the company’s supplier
structure by introducing more stringent requirements with the launch of the Wal-Mart Supplier Index.
Wal-Mart’s actions, in turn, initiated industry-wide change: for instance, Procter & Gamble redesigned
their laundry detergent, making it more concentrated, so that consumers could save water, producers could
save plastic and energy, and distributors and retailers could save space. Finally, the industry life cycle can
matter; for instance, in the past analysts evaluated CSR issues in the utilities sector (e.g., firms such as
EoN AG), but now they pay less attention to such issues because the practices are integrated within the
utilities business and analysts pay attention to CSR news only when something goes wrong.
This multifaceted evaluation of the DJSI led us to conclude that the addition to (deletion from) the
index is a credible and observable signal of an element of otherwise difficult-to-observe social legitimacy,
in terms of accomplishments in the area of CSR. Because many managers that believe in the financial
benefits of CSR, the evaluation of their social legitimacy by third parties provides a way to ascertain that a
firm meets social norms and value.

A‐6
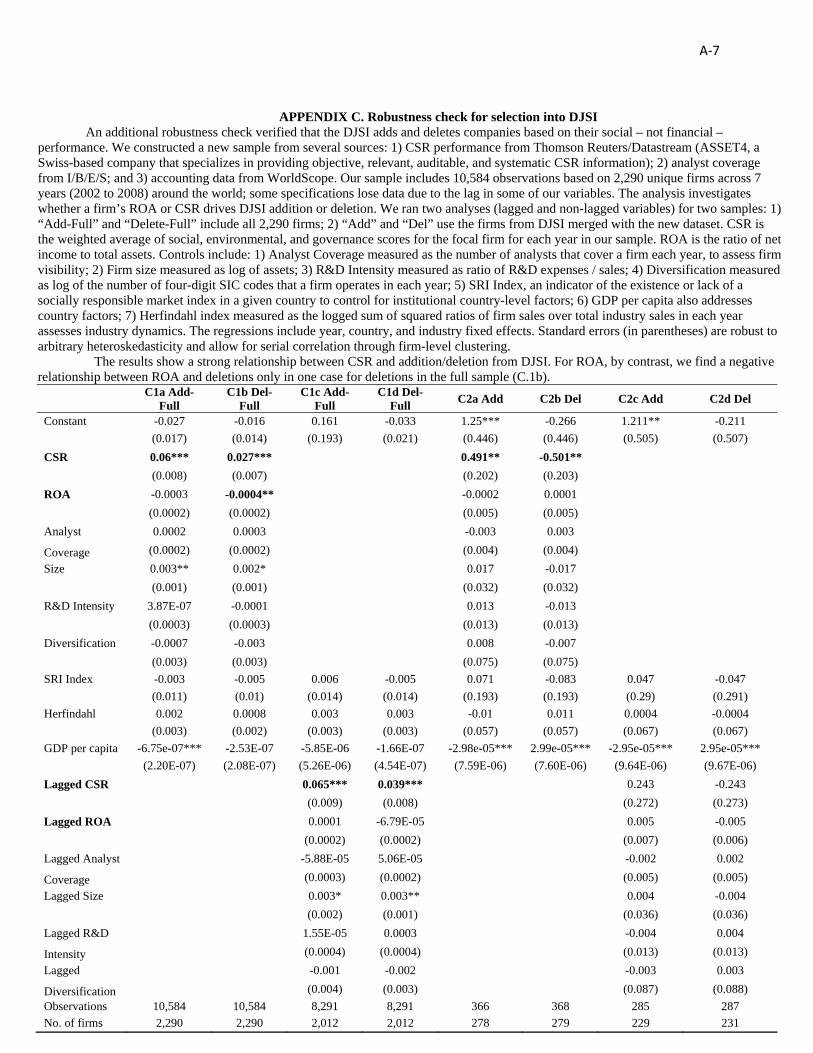
A‐7
APPENDIX C. Robustness check for selection into DJSI An additional robustness check verified that the DJSI adds and deletes companies based on their social – not financial –
performance. We constructed a new sample from several sources: 1) CSR performance from Thomson Reuters/Datastream (ASSET4, a Swiss-based company that specializes in providing objective, relevant, auditable, and systematic CSR information); 2) analyst coverage from I/B/E/S; and 3) accounting data from WorldScope. Our sample includes 10,584 observations based on 2,290 unique firms across 7 years (2002 to 2008) around the world; some specifications lose data due to the lag in some of our variables. The analysis investigates whether a firm’s ROA or CSR drives DJSI addition or deletion. We ran two analyses (lagged and non-lagged variables) for two samples: 1) “Add-Full” and “Delete-Full” include all 2,290 firms; 2) “Add” and “Del” use the firms from DJSI merged with the new dataset. CSR is the weighted average of social, environmental, and governance scores for the focal firm for each year in our sample. ROA is the ratio of net income to total assets. Controls include: 1) Analyst Coverage measured as the number of analysts that cover a firm each year, to assess firm visibility; 2) Firm size measured as log of assets; 3) R&D Intensity measured as ratio of R&D expenses / sales; 4) Diversification measured as log of the number of four-digit SIC codes that a firm operates in each year; 5) SRI Index, an indicator of the existence or lack of a socially responsible market index in a given country to control for institutional country-level factors; 6) GDP per capita also addresses country factors; 7) Herfindahl index measured as the logged sum of squared ratios of firm sales over total industry sales in each year assesses industry dynamics. The regressions include year, country, and industry fixed effects. Standard errors (in parentheses) are robust to arbitrary heteroskedasticity and allow for serial correlation through firm-level clustering.
The results show a strong relationship between CSR and addition/deletion from DJSI. For ROA, by contrast, we find a negative relationship between ROA and deletions only in one case for deletions in the full sample (C.1b).
C1a Add-
Full C1b Del-
Full C1c Add-
Full C1d Del-
Full C2a Add C2b Del C2c Add C2d Del
Constant -0.027 -0.016 0.161 -0.033 1.25*** -0.266 1.211** -0.211
(0.017) (0.014) (0.193) (0.021) (0.446) (0.446) (0.505) (0.507)
CSR 0.06*** 0.027*** 0.491** -0.501**
(0.008) (0.007) (0.202) (0.203) ROA -0.0003 -0.0004** -0.0002 0.0001
(0.0002) (0.0002) (0.005) (0.005) Analyst 0.0002 0.0003 -0.003 0.003
Coverage (0.0002) (0.0002) (0.004) (0.004) Size 0.003** 0.002* 0.017 -0.017
(0.001) (0.001) (0.032) (0.032) R&D Intensity 3.87E-07 -0.0001 0.013 -0.013
(0.0003) (0.0003) (0.013) (0.013) Diversification -0.0007 -0.003 0.008 -0.007
(0.003) (0.003) (0.075) (0.075) SRI Index -0.003 -0.005 0.006 -0.005 0.071 -0.083 0.047 -0.047
(0.011) (0.01) (0.014) (0.014) (0.193) (0.193) (0.29) (0.291)
Herfindahl 0.002 0.0008 0.003 0.003 -0.01 0.011 0.0004 -0.0004
(0.003) (0.002) (0.003) (0.003) (0.057) (0.057) (0.067) (0.067)
GDP per capita -6.75e-07*** -2.53E-07 -5.85E-06 -1.66E-07 -2.98e-05*** 2.99e-05*** -2.95e-05*** 2.95e-05***
(2.20E-07) (2.08E-07) (5.26E-06) (4.54E-07) (7.59E-06) (7.60E-06) (9.64E-06) (9.67E-06)
Lagged CSR 0.065*** 0.039*** 0.243 -0.243
(0.009) (0.008) (0.272) (0.273)
Lagged ROA 0.0001 -6.79E-05 0.005 -0.005
(0.0002) (0.0002) (0.007) (0.006)
Lagged Analyst -5.88E-05 5.06E-05 -0.002 0.002
Coverage (0.0003) (0.0002) (0.005) (0.005)
Lagged Size 0.003* 0.003** 0.004 -0.004
(0.002) (0.001) (0.036) (0.036)
Lagged R&D 1.55E-05 0.0003 -0.004 0.004
Intensity (0.0004) (0.0004) (0.013) (0.013)
Lagged -0.001 -0.002 -0.003 0.003
Diversification (0.004) (0.003) (0.087) (0.088)
Observations 10,584 10,584 8,291 8,291 366 368 285 287
No. of firms 2,290 2,290 2,012 2,012 278 279 229 231
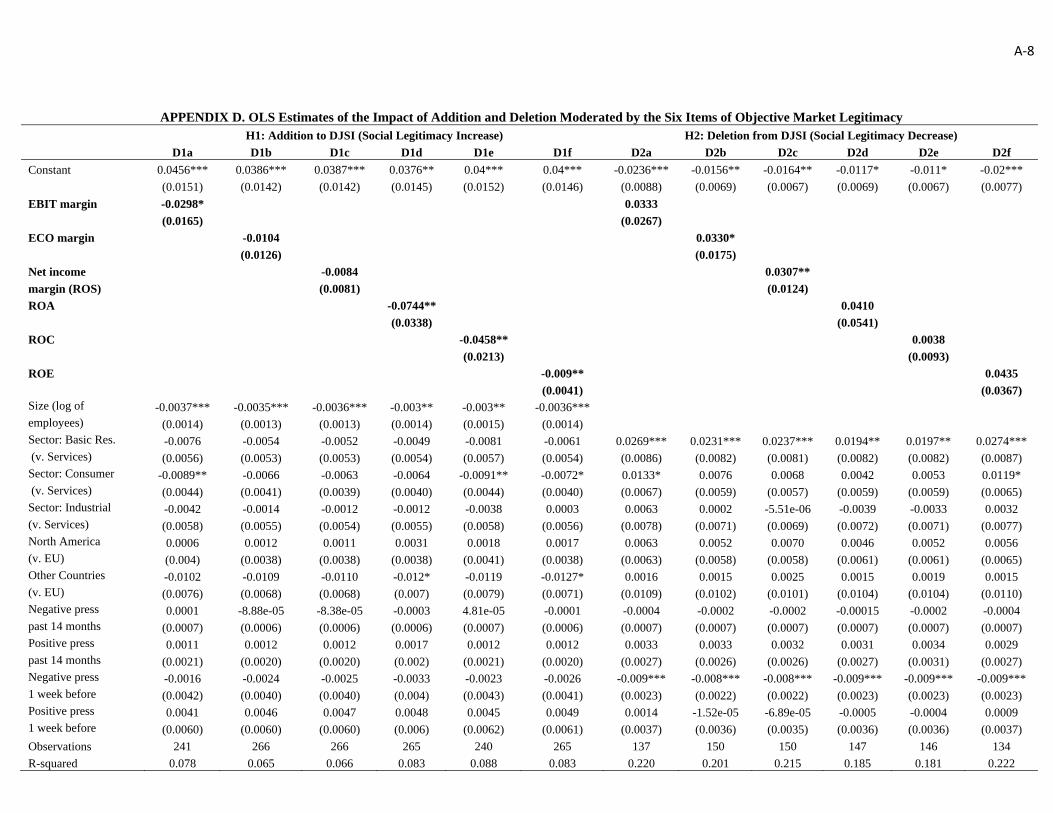
A‐8
APPENDIX D. OLS Estimates of the Impact of Addition and Deletion Moderated by the Six Items of Objective Market Legitimacy H1: Addition to DJSI (Social Legitimacy Increase) H2: Deletion from DJSI (Social Legitimacy Decrease)
D1a D1b D1c D1d D1e D1f D2a D2b D2c D2d D2e D2f
Constant 0.0456*** 0.0386*** 0.0387*** 0.0376** 0.04*** 0.04*** -0.0236*** -0.0156** -0.0164** -0.0117* -0.011* -0.02***
(0.0151) (0.0142) (0.0142) (0.0145) (0.0152) (0.0146) (0.0088) (0.0069) (0.0067) (0.0069) (0.0067) (0.0077)
EBIT margin -0.0298* 0.0333
(0.0165) (0.0267)
ECO margin -0.0104 0.0330*
(0.0126) (0.0175)
Net income -0.0084 0.0307**
margin (ROS) (0.0081) (0.0124)
ROA -0.0744** 0.0410
(0.0338) (0.0541)
ROC -0.0458** 0.0038
(0.0213) (0.0093)
ROE -0.009** 0.0435
(0.0041) (0.0367) Size (log of -0.0037*** -0.0035*** -0.0036*** -0.003** -0.003** -0.0036*** employees) (0.0014) (0.0013) (0.0013) (0.0014) (0.0015) (0.0014) Sector: Basic Res. -0.0076 -0.0054 -0.0052 -0.0049 -0.0081 -0.0061 0.0269*** 0.0231*** 0.0237*** 0.0194** 0.0197** 0.0274*** (v. Services) (0.0056) (0.0053) (0.0053) (0.0054) (0.0057) (0.0054) (0.0086) (0.0082) (0.0081) (0.0082) (0.0082) (0.0087) Sector: Consumer -0.0089** -0.0066 -0.0063 -0.0064 -0.0091** -0.0072* 0.0133* 0.0076 0.0068 0.0042 0.0053 0.0119* (v. Services) (0.0044) (0.0041) (0.0039) (0.0040) (0.0044) (0.0040) (0.0067) (0.0059) (0.0057) (0.0059) (0.0059) (0.0065) Sector: Industrial -0.0042 -0.0014 -0.0012 -0.0012 -0.0038 0.0003 0.0063 0.0002 -5.51e-06 -0.0039 -0.0033 0.0032 (v. Services) (0.0058) (0.0055) (0.0054) (0.0055) (0.0058) (0.0056) (0.0078) (0.0071) (0.0069) (0.0072) (0.0071) (0.0077) North America 0.0006 0.0012 0.0011 0.0031 0.0018 0.0017 0.0063 0.0052 0.0070 0.0046 0.0052 0.0056 (v. EU) (0.004) (0.0038) (0.0038) (0.0038) (0.0041) (0.0038) (0.0063) (0.0058) (0.0058) (0.0061) (0.0061) (0.0065) Other Countries -0.0102 -0.0109 -0.0110 -0.012* -0.0119 -0.0127* 0.0016 0.0015 0.0025 0.0015 0.0019 0.0015 (v. EU) (0.0076) (0.0068) (0.0068) (0.007) (0.0079) (0.0071) (0.0109) (0.0102) (0.0101) (0.0104) (0.0104) (0.0110) Negative press 0.0001 -8.88e-05 -8.38e-05 -0.0003 4.81e-05 -0.0001 -0.0004 -0.0002 -0.0002 -0.00015 -0.0002 -0.0004 past 14 months (0.0007) (0.0006) (0.0006) (0.0006) (0.0007) (0.0006) (0.0007) (0.0007) (0.0007) (0.0007) (0.0007) (0.0007) Positive press 0.0011 0.0012 0.0012 0.0017 0.0012 0.0012 0.0033 0.0033 0.0032 0.0031 0.0034 0.0029 past 14 months (0.0021) (0.0020) (0.0020) (0.002) (0.0021) (0.0020) (0.0027) (0.0026) (0.0026) (0.0027) (0.0031) (0.0027) Negative press -0.0016 -0.0024 -0.0025 -0.0033 -0.0023 -0.0026 -0.009*** -0.008*** -0.008*** -0.009*** -0.009*** -0.009*** 1 week before (0.0042) (0.0040) (0.0040) (0.004) (0.0043) (0.0041) (0.0023) (0.0022) (0.0022) (0.0023) (0.0023) (0.0023) Positive press 0.0041 0.0046 0.0047 0.0048 0.0045 0.0049 0.0014 -1.52e-05 -6.89e-05 -0.0005 -0.0004 0.0009 1 week before (0.0060) (0.0060) (0.0060) (0.006) (0.0062) (0.0061) (0.0037) (0.0036) (0.0035) (0.0036) (0.0036) (0.0037)
Observations 241 266 266 265 240 265 137 150 150 147 146 134
R-squared 0.078 0.065 0.066 0.083 0.088 0.083 0.220 0.201 0.215 0.185 0.181 0.222

A‐9
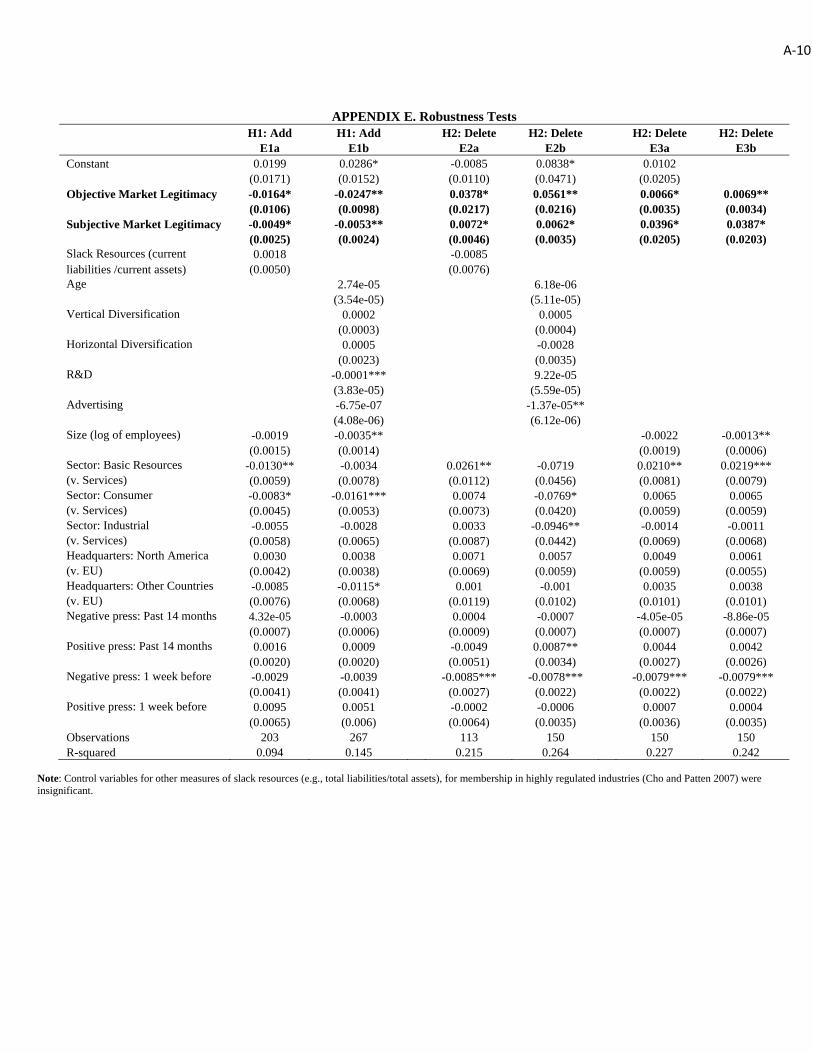
A‐10
APPENDIX E. Robustness Tests
Note: Control variables for other measures of slack resources (e.g., total liabilities/total assets), for membership in highly regulated industries (Cho and Patten 2007) were insignificant.
H1: Add H1: Add H2: Delete H2: Delete H2: Delete H2: Delete E1a E1b E2a E2b E3a E3b Constant 0.0199 0.0286* -0.0085 0.0838* 0.0102 (0.0171) (0.0152) (0.0110) (0.0471) (0.0205) Objective Market Legitimacy -0.0164* -0.0247** 0.0378* 0.0561** 0.0066* 0.0069** (0.0106) (0.0098) (0.0217) (0.0216) (0.0035) (0.0034) Subjective Market Legitimacy -0.0049* -0.0053** 0.0072* 0.0062* 0.0396* 0.0387* (0.0025) (0.0024) (0.0046) (0.0035) (0.0205) (0.0203) Slack Resources (current 0.0018 -0.0085 liabilities /current assets) (0.0050) (0.0076) Age 2.74e-05 6.18e-06 (3.54e-05) (5.11e-05) Vertical Diversification 0.0002 0.0005 (0.0003) (0.0004) Horizontal Diversification 0.0005 -0.0028 (0.0023) (0.0035) R&D -0.0001*** 9.22e-05 (3.83e-05) (5.59e-05) Advertising -6.75e-07 -1.37e-05** (4.08e-06) (6.12e-06) Size (log of employees) -0.0019 -0.0035** -0.0022 -0.0013** (0.0015) (0.0014) (0.0019) (0.0006) Sector: Basic Resources -0.0130** -0.0034 0.0261** -0.0719 0.0210** 0.0219*** (v. Services) (0.0059) (0.0078) (0.0112) (0.0456) (0.0081) (0.0079) Sector: Consumer -0.0083* -0.0161*** 0.0074 -0.0769* 0.0065 0.0065 (v. Services) (0.0045) (0.0053) (0.0073) (0.0420) (0.0059) (0.0059) Sector: Industrial -0.0055 -0.0028 0.0033 -0.0946** -0.0014 -0.0011 (v. Services) (0.0058) (0.0065) (0.0087) (0.0442) (0.0069) (0.0068) Headquarters: North America 0.0030 0.0038 0.0071 0.0057 0.0049 0.0061 (v. EU) (0.0042) (0.0038) (0.0069) (0.0059) (0.0059) (0.0055) Headquarters: Other Countries -0.0085 -0.0115* 0.001 -0.001 0.0035 0.0038 (v. EU) (0.0076) (0.0068) (0.0119) (0.0102) (0.0101) (0.0101) Negative press: Past 14 months 4.32e-05 -0.0003 0.0004 -0.0007 -4.05e-05 -8.86e-05 (0.0007) (0.0006) (0.0009) (0.0007) (0.0007) (0.0007) Positive press: Past 14 months 0.0016 0.0009 -0.0049 0.0087** 0.0044 0.0042 (0.0020) (0.0020) (0.0051) (0.0034) (0.0027) (0.0026) Negative press: 1 week before -0.0029 -0.0039 -0.0085*** -0.0078*** -0.0079*** -0.0079*** (0.0041) (0.0041) (0.0027) (0.0022) (0.0022) (0.0022) Positive press: 1 week before 0.0095 0.0051 -0.0002 -0.0006 0.0007 0.0004 (0.0065) (0.006) (0.0064) (0.0035) (0.0036) (0.0035) Observations 203 267 113 150 150 150 R-squared 0.094 0.145 0.215 0.264 0.227 0.242