Embed Size (px)
Citation preview

How firms will affect the Future of Work
Authors
Jacques Bughin
Solvay Brussels School of Economics and Management, Université Libre de Bruxelles,
iCite – email : : [email protected]
iCite Working Paper 2020-035
iCite - International Centre for Innovation, Technology and Education Studies
Université libre de Bruxelles – CP114/05
50, avenue F.D. Roosevelt – B -1050 Brussels – Belgium
www. https://sbsem.ulb.be/research/research-centres/icite
International Centre for Innovation
Technology and Education
How firms will affect the Future of
Work
Dr Jacques Bughin, Solvay business school of Economics and
management, Free University of Brussels, Brussels Belgium
A version of this article is forthcoming in : Capitalism, Global Change and
Sustainable Development, Springer, 2020
Abstract In the current debate over the Future of Work, there is little discussion about
how firms anticipate the evolution of their demand for labor and the related
mix of skills as they adopt Artificial Intelligence (AI) tools. This article
contributes to this debate by leveraging a global survey of 3000 firms in 10
countries, covering the main sectors of the economy. Descriptive statistics
from the survey are complemented by econometric analyses of corporate labor
demand decisions. The findings are four-fold. First, those are still early days
in the absorption of AI technologies, with less than 10% of companies
investing in a majority of AI technologies and for multiple purposes. Second,
if an aggregate portion of firms anticipates reducing employment as a result
of adopting AI technologies, as many other companies anticipate labor growth
or reorganizing employment. Third, this reallocation picture holds true when
we examine further demand by labor functions and skills, with talent shifting
toward more analytic, creative, and interaction skills, and away from
administrative and routine-based functions, in line with past trends of skill-
and routine-biased technological change. Fourth, a novel to the literature on
Future of Work, econometric results on employment change highlight that
employment dynamics are driven by related spillover effects to product
markets. Higher competition, larger expectations of market (share)
deployment may counterbalance negative automation effect on employment
dynamics.
Keywords : Artificial intelligence, Derived labor demand, Product market
competition
1. Introduction
Recent advances in the field of artificial intelligence (henceforth, AI)
have led to public fears that these technologies will substitute a large
part of job occupations (Brynjolfsson and McAfee 2014, or
Nubler 2016). This fear is being fueled by companies announcing
their intention to replace groups of workers by smart algorithms
and/or robots.
At the same time, a recent stream of academic work has strengthened
the vision of a “workless future.” In their seminal work, Frey and
Osborne (2013) calculated that 47% of all US jobs are at risk of being
automated by the rise of AI technologies. Another recent study by
Acemoglu and Resterpo (2017) claims that every robot makes as
many as eight jobs obsolete. Follow-up research by same authors
(Acemoglu and Restrepo 2018) suggests that new technologies may
fuel more automation than new jobs, creating inequality risks
between workers, and likely pressure on total jobs.
Susskind (2020, forthcoming, develops a theoretical model of smart
capital augmentation which is fully substitutable to jobs at high-
wages, leading to an extreme scenario in which “wages can only
decline to zero” to secure workers employability. Empirically, a
recent study linking labor productivity and employment in a sample
of large OECD countries by Autor and Salomons (2017) also
suggests that higher productivity at sectorial level (often driven by
technology innovations) is associated with decline in employment in
the same sector.
Such fears are not new. Already at the time of the first Industrial
Revolution, renowned thinkers such as John Stuart Mill and David
Ricardo conceded the possibility of unemployment. Given the rise of
manufacturing and its need for workers, however, the concern shifted
quickly to issues around wages, which stagnated for 50 years until
the middle of the nineteenth century—a “pause” noted by Engels.
The Great Depression brought a revival of concerns. John Maynard
Keynes (1931) wrote his famous essay Economic Possibilities of our
Grandchildren, predicting that by 2030, the “most pressing problem
in developed economies would be how to fill our leisure time.”
Today, the top ten US firms by market cap employ 30% fewer people
than the top ten firms in the 1960s.1 Featuring among those top ten
are the so-called GAFAs—Google, Amazon, Facebook, and Apple—
which are able to generate every $1 of value with five times fewer
employees than the largest US firms 50 years ago.
Some research brings however more nuance to a scenario of large
unemployment, such as Gregory et al (2014). Atkinson (2013)
concludes that, at least looking backwards, there is no single decade
in the United States, from 1850 through 2010, in which the adoption
of technology did not destroy employment more than it was
responsible for creating new jobs. A McKinsey Global Institute
(2017a)’s research across 46 countries has attempted to
match technical capabilities of AI with those of humans —for
example a virtual assistant system answering questions versus the
task being done by a call-center agent.
Recognizing that typically jobs are composed by many tasks, it is
found that automation technology would likely more affect the mix
of activities within a job than it will threaten to replace an entire
occupation. On average, in developed countries, the study finds that
25%–30% of existing jobs runs the risk of 70% of their tasks being
automated. Further, the shift in tasks will be felt in more routine-
based ones than in tasks requiring social and creative skills.2 Those
findings have been corroborated by parallel research at OECD
(2017).
Likewise, absorption of technology takes time. Looking at a wide set
of technologies in the last century, the median time of complete
diffusion has been close to 40 years, even if diffusion speed has
accelerated lately for digital technologies (Comin and Hobijn 2010).
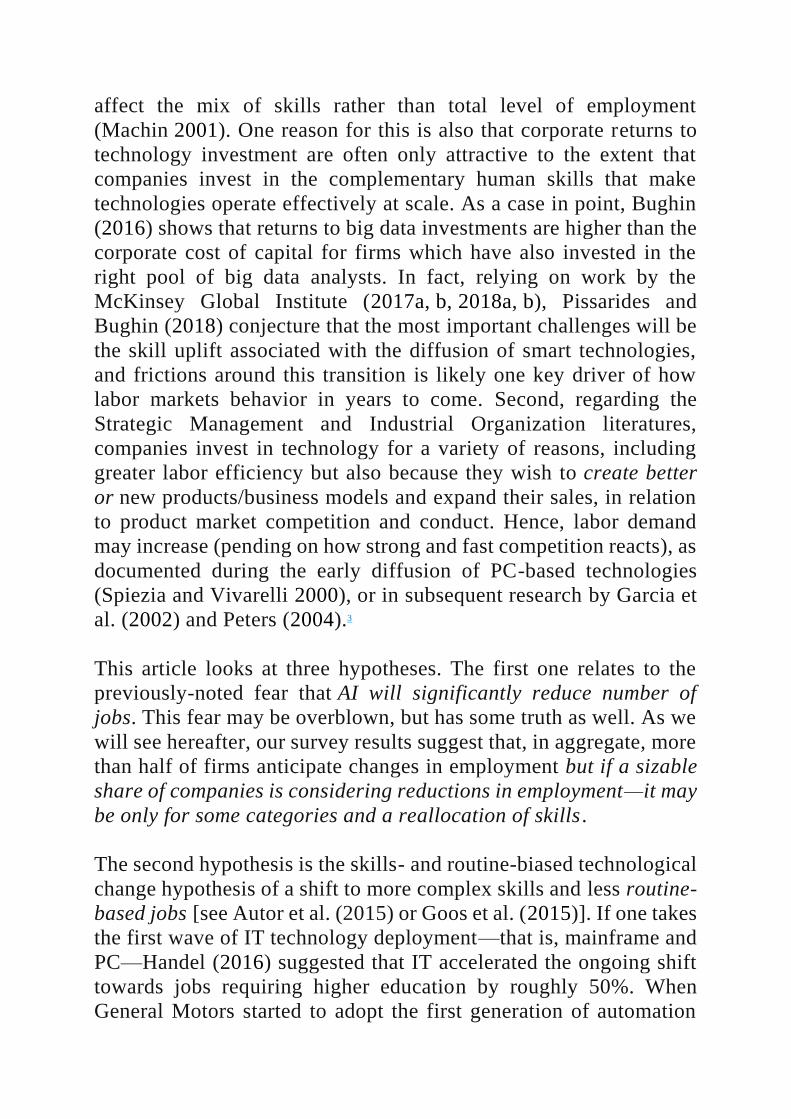
Our survey of large companies (see Table 1) confirms that AI
adoption is in its early day. There are also large bottlenecks in digital
assets and skills needed within the majority of incumbent firms that
may lead to a somewhat slow diffusion of AI technologies (Bughin
and van Zeebroeck 2018).
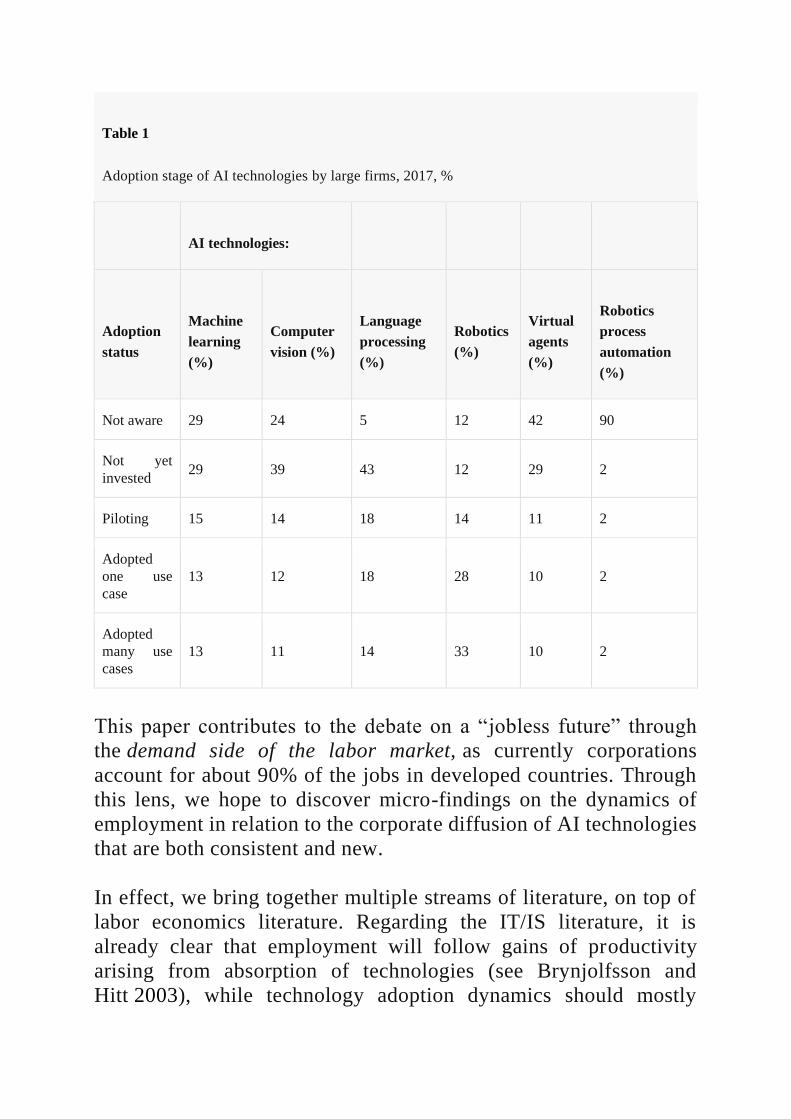
Table 1
Adoption stage of AI technologies by large firms, 2017, %
AI technologies:
Adoption
status
Machine
learning
(%)
Computer
vision (%)
Language
processing
(%)
Robotics
(%)
Virtual
agents
(%)
Robotics
process
automation
(%)
Not aware 29 24 5 12 42 90
Not yet
invested 29 39 43 12 29 2
Piloting 15 14 18 14 11 2
Adopted
one use
case
13 12 18 28 10 2
Adopted
many use
cases
13 11 14 33 10 2
This paper contributes to the debate on a “jobless future” through
the demand side of the labor market, as currently corporations
account for about 90% of the jobs in developed countries. Through
this lens, we hope to discover micro-findings on the dynamics of
employment in relation to the corporate diffusion of AI technologies
that are both consistent and new.
In effect, we bring together multiple streams of literature, on top of
labor economics literature. Regarding the IT/IS literature, it is
already clear that employment will follow gains of productivity
arising from absorption of technologies (see Brynjolfsson and
Hitt 2003), while technology adoption dynamics should mostly
affect the mix of skills rather than total level of employment
(Machin 2001). One reason for this is also that corporate returns to
technology investment are often only attractive to the extent that
companies invest in the complementary human skills that make
technologies operate effectively at scale. As a case in point, Bughin
(2016) shows that returns to big data investments are higher than the
corporate cost of capital for firms which have also invested in the
right pool of big data analysts. In fact, relying on work by the
McKinsey Global Institute (2017a, b, 2018a, b), Pissarides and
Bughin (2018) conjecture that the most important challenges will be
the skill uplift associated with the diffusion of smart technologies,
and frictions around this transition is likely one key driver of how
labor markets behavior in years to come. Second, regarding the
Strategic Management and Industrial Organization literatures,
companies invest in technology for a variety of reasons, including
greater labor efficiency but also because they wish to create better
or new products/business models and expand their sales, in relation
to product market competition and conduct. Hence, labor demand
may increase (pending on how strong and fast competition reacts), as
documented during the early diffusion of PC-based technologies
(Spiezia and Vivarelli 2000), or in subsequent research by Garcia et
al. (2002) and Peters (2004).3
This article looks at three hypotheses. The first one relates to the
previously-noted fear that AI will significantly reduce number of
jobs. This fear may be overblown, but has some truth as well. As we
will see hereafter, our survey results suggest that, in aggregate, more
than half of firms anticipate changes in employment but if a sizable
share of companies is considering reductions in employment—it may
be only for some categories and a reallocation of skills.
The second hypothesis is the skills- and routine-biased technological
change hypothesis of a shift to more complex skills and less routine-
based jobs [see Autor et al. (2015) or Goos et al. (2015)]. If one takes
the first wave of IT technology deployment—that is, mainframe and
PC—Handel (2016) suggested that IT accelerated the ongoing shift
towards jobs requiring higher education by roughly 50%. When
General Motors started to adopt the first generation of automation
technologies in the car manufacturing industry in the 1980s,
problem-solving capabilities for skilled workers rose by 40% (and
fell by 10% for unskilled, blue collar workers), as did tasks with
higher memory, accuracy and concentration skills (Milkman and
Pullman 1991). As detailed hereafter, we find support for the skill-
bias hypothesis in our survey. In particular, we find evidence for
employment increases in big data analytics and for occupations
requiring interpersonal skills for corporations already well vested in
AI. Increase in AI investment is also positively correlated to better
odds ratios in categories such as leadership and creative design.
The third hypothesis is that the effect of AI automation on
employment will ultimately depend on product market overspill.
These include new products and its interaction with a company’s
profitability, in line with the oligopoly theory of firm-induced labor
demand. Our econometric results are the first, to the best of our
knowledge, to demonstrate that the effect of AI technology on labor
demand must take into account those spill-over effects on product
markets.
This article is structured as follows: Sect. 2 describes our survey, as
well as our definition of AI and the hypotheses we test.
Section 3 presents the descriptive results, while Sect. 4 is concerned
with the econometric analysis of labor demand by type of firms and
firm pace of adoption of AI technologies. Section 5 concludes.
2. Background
2.1. AI Definition
Our definition of AI in the article (and in the survey questionnaire)
is one of technologies being technically able to mimic cognitive
human functions.4 Consider Amazon’s Kiva robots. Today, they are
already able to handle parcels faster than humans and in a space that
is half the size of traditional human–heavy logistics centers, leading
to significant efficiency gains, and with return of investments easily
a multiple of cost of capital (see McKinsey Global Institute 2018b).
Likewise, virtual assistants such as IPSoft’s Amelia are able to
handle customer care much faster, and with more consistent positive
responses, than humans, reducing cost of care by more than 50%, and
improving quality of interactions with users.
The ability of AI to perform and self-learn obviously depends on big
data, and on the use of powerful algorithms such as deep learning.
Alphabet’s DeepMind reported that it improved the overall power
usage efficiency of Google’s data centers by 15% after placing an AI
program similar to a program taught to play Atari games in charge of
managing a data center’s control system.5
Based on actual evidence of technologically readiness, we have
surveyed the use of five types of technologies (computer vision,
language processing, robotics, robotic process automation, and
virtual agents) in the market place. We add to the list deep-learning
techniques (and their derivatives), as most of the above technologies
usually rely on deep machine-learning algorithms to deliver their
results.
2.2. Survey Collection and Highlights
2.2.1. Sample
We leverage a C-suite executive survey conducted in the spring of
2017, covering 10 countries and 14 sectors. The survey was
commissioned externally to a major research firm, covering topics
such as awareness and use of a set of AI technologies, returns to AI
investment, as well as impact on strategy and labor resources
allocation by skills and company functions. In total, there were about
25 questions to answer, for an average time to fill of less than 20 min,
in order to maximize take-up rates and adequate responses. The
survey was administered online. The survey questionnaire is
accessible in the appendix of other research report by Bughin et al.
(2017).
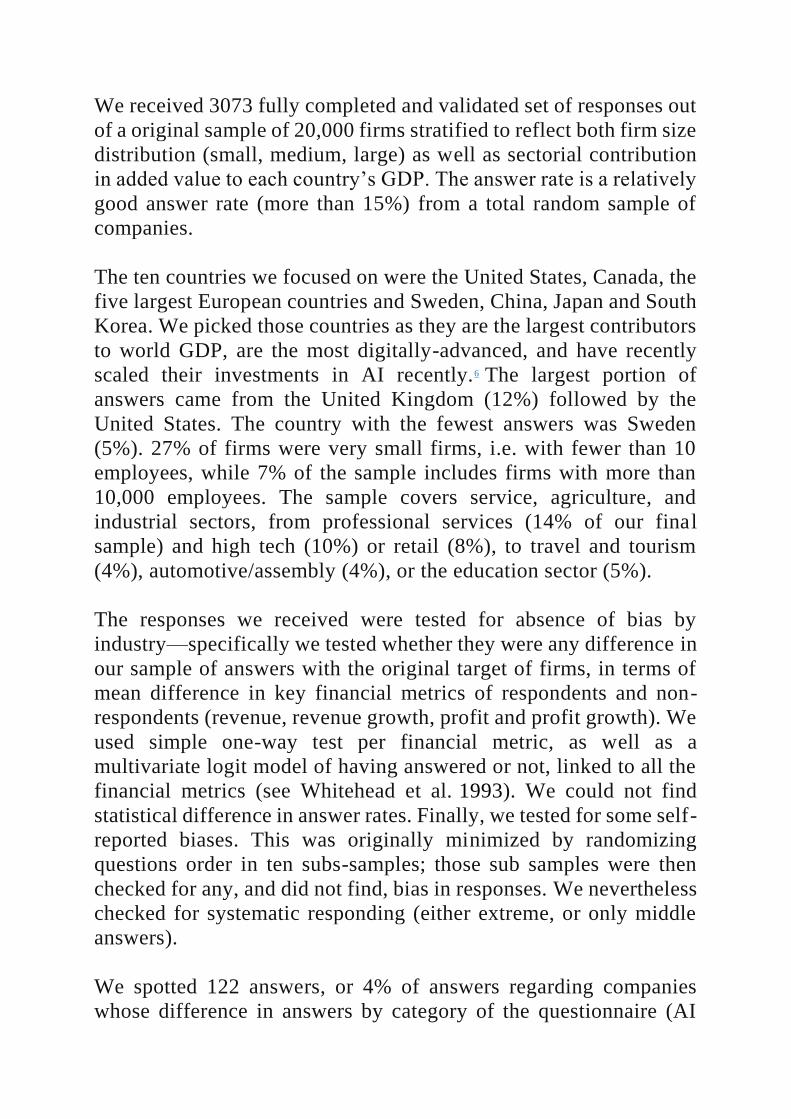
We received 3073 fully completed and validated set of responses out
of a original sample of 20,000 firms stratified to reflect both firm size
distribution (small, medium, large) as well as sectorial contribution
in added value to each country’s GDP. The answer rate is a relatively
good answer rate (more than 15%) from a total random sample of
companies.
The ten countries we focused on were the United States, Canada, the
five largest European countries and Sweden, China, Japan and South
Korea. We picked those countries as they are the largest contributors
to world GDP, are the most digitally-advanced, and have recently
scaled their investments in AI recently.6 The largest portion of
answers came from the United Kingdom (12%) followed by the
United States. The country with the fewest answers was Sweden
(5%). 27% of firms were very small firms, i.e. with fewer than 10
employees, while 7% of the sample includes firms with more than
10,000 employees. The sample covers service, agriculture, and
industrial sectors, from professional services (14% of our final
sample) and high tech (10%) or retail (8%), to travel and tourism
(4%), automotive/assembly (4%), or the education sector (5%).
The responses we received were tested for absence of bias by
industry—specifically we tested whether they were any difference in
our sample of answers with the original target of firms, in terms of
mean difference in key financial metrics of respondents and non-
respondents (revenue, revenue growth, profit and profit growth). We
used simple one-way test per financial metric, as well as a
multivariate logit model of having answered or not, linked to all the
financial metrics (see Whitehead et al. 1993). We could not find
statistical difference in answer rates. Finally, we tested for some self-
reported biases. This was originally minimized by randomizing
questions order in ten subs-samples; those sub samples were then
checked for any, and did not find, bias in responses. We nevertheless
checked for systematic responding (either extreme, or only middle
answers).
We spotted 122 answers, or 4% of answers regarding companies
whose difference in answers by category of the questionnaire (AI
awareness, AI impact on profit, AI impact on employment, and on
employment mix) were found to be very low (in the bottom 5% in
difference in answers across all categories). However, the
econometric results are not sensitive to including or not those
responses, so we keep our full sample as basis of our results here-
after.
2.2.2. Data Highlights
Our survey confirms that like any other technology (Comin and
Hobijn 2010), AI adoption may take time to spread. By 2017,
diffusion is still in its early days (see Table 1). Only one out of 8
companies report using AI at scale (for multiple use-cases), and a
very large set of companies (90%) are not even aware of RPA.
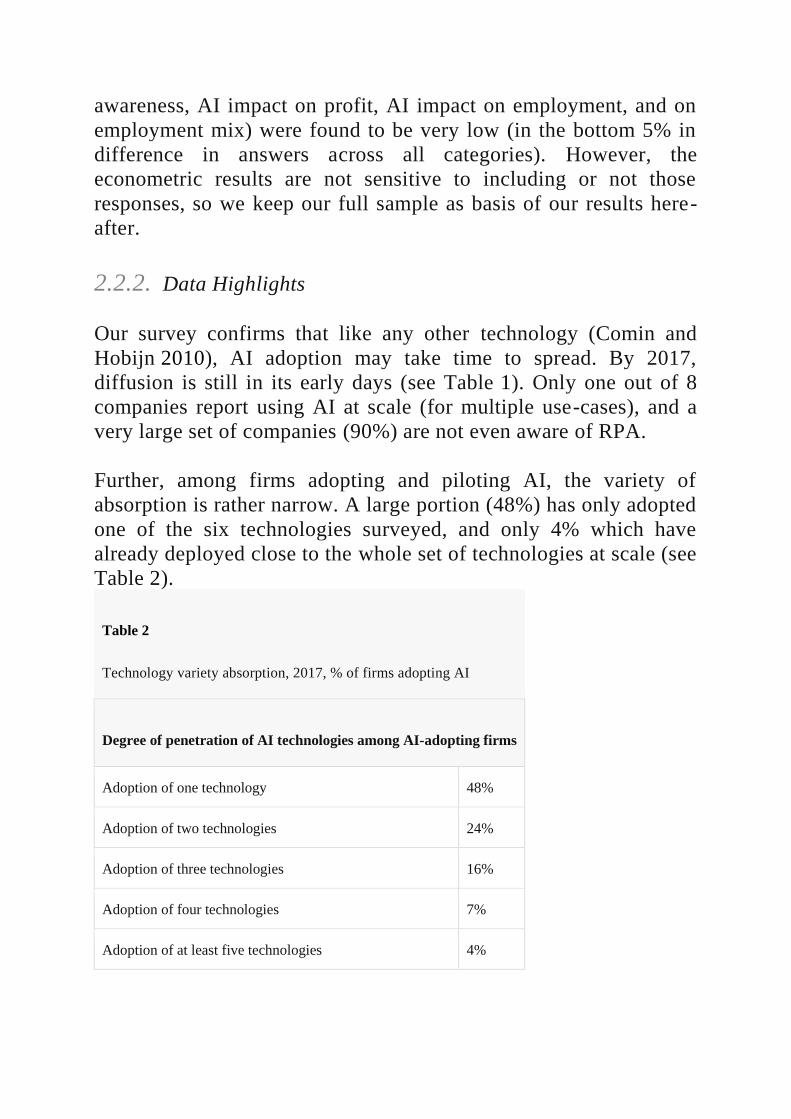
Further, among firms adopting and piloting AI, the variety of
absorption is rather narrow. A large portion (48%) has only adopted
one of the six technologies surveyed, and only 4% which have
already deployed close to the whole set of technologies at scale (see
Table 2).
Table 2
Technology variety absorption, 2017, % of firms adopting AI
Degree of penetration of AI technologies among AI-adopting firms
Adoption of one technology 48%
Adoption of two technologies 24%
Adoption of three technologies 16%
Adoption of four technologies 7%
Adoption of at least five technologies 4%
While not reproduced here for sake of space, the sample shows that
US and Chinese firms are more advanced in adoption and breadth of
diffusion, in line with other research that most buoyant markets in AI
investment are in those two geographies (see Bughin et al. 2017).
Likewise, sectors that are more advanced in digitization, such as
telecom, high tech, and media are already more advanced in AI
adoption than other sectors such as construction. Patterns of adoption
by technology type is also industry specific; for instance, RPA is
twice more often adopted in automotive and assembly than average,
while virtual agent technology is most advanced in B2C services
such as consumer high tech and telecom (22% versus 12% on
average).
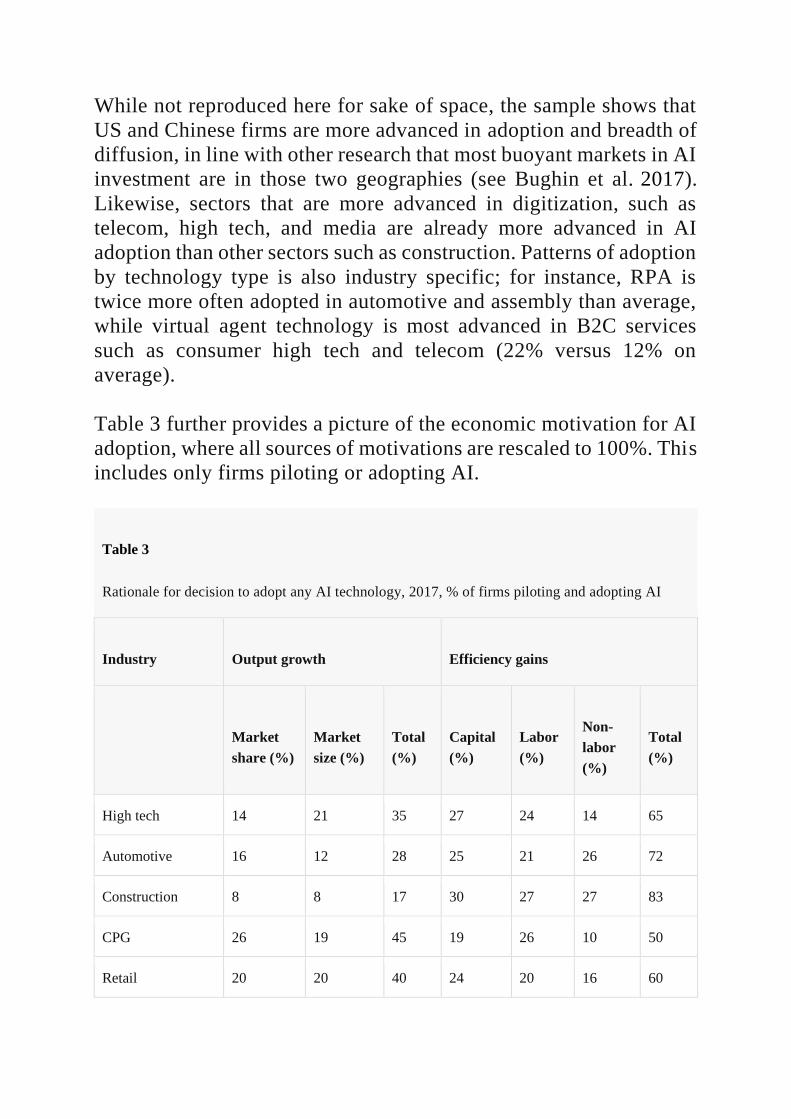
Table 3 further provides a picture of the economic motivation for AI
adoption, where all sources of motivations are rescaled to 100%. This
includes only firms piloting or adopting AI.
Table 3
Rationale for decision to adopt any AI technology, 2017, % of firms piloting and adopting AI
Industry Output growth Efficiency gains
Market
share (%)
Market
size (%)
Total
(%)
Capital
(%)
Labor
(%)
Non-
labor
(%)
Total
(%)
High tech 14 21 35 27 24 14 65
Automotive 16 12 28 25 21 26 72
Construction 8 8 17 30 27 27 83
CPG 26 19 45 19 26 10 50
Retail 20 20 40 24 20 16 60

Table 3
Rationale for decision to adopt any AI technology, 2017, % of firms piloting and adopting AI
Industry Output growth Efficiency gains
Market
share (%)
Market
size (%)
Total
(%)
Capital
(%)
Labor
(%)
Non-
labor
(%)
Total
(%)
Media 17 29 46 14 17 22 54
Telecom 23 28 52 20 20 8 48
Travel 10 24 34 17 21 27 66
Transport/logistics 24 7 31 24 30 15 69
Financial services 23 23 46 16 30 9 54
Professional
services 21 16 38 21 21 20 62
Education 17 20 37 27 16 20 63
Health 20 15 35 24 32 9 65
Energy 21 12 33 24 24 18 67
Table 3 provides two critical insights.
The first is that, when planning to invest in AI, companies report
multiple rationales (3 rationales out the 5 surveyed). Otherwise
stated, companies do not generally invest in AI for only
a single purpose, and usually it is for a mix of efficiency as well as
to facilitate top line growth. This link to product market is not
explicitly discussed in the labor market literature. Looking further at
use cases of companies investing in automation of labor, most of
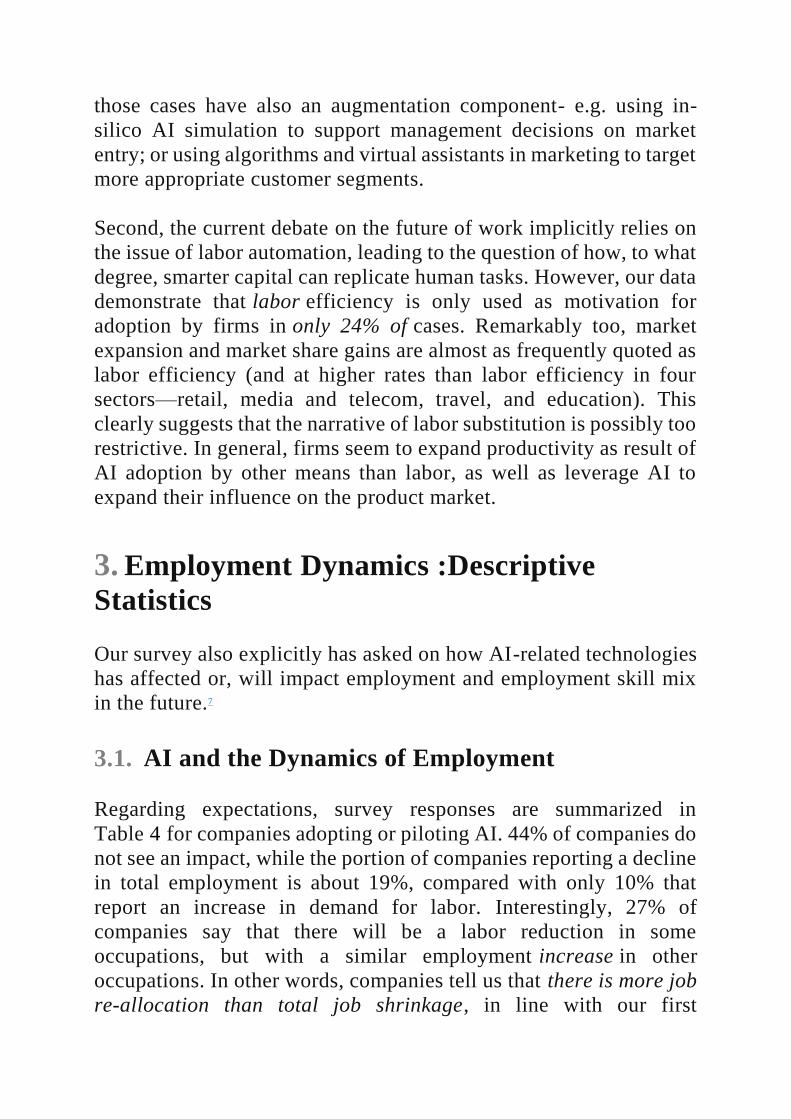
those cases have also an augmentation component- e.g. using in-
silico AI simulation to support management decisions on market
entry; or using algorithms and virtual assistants in marketing to target
more appropriate customer segments.
Second, the current debate on the future of work implicitly relies on
the issue of labor automation, leading to the question of how, to what
degree, smarter capital can replicate human tasks. However, our data
demonstrate that labor efficiency is only used as motivation for
adoption by firms in only 24% of cases. Remarkably too, market
expansion and market share gains are almost as frequently quoted as
labor efficiency (and at higher rates than labor efficiency in four
sectors—retail, media and telecom, travel, and education). This
clearly suggests that the narrative of labor substitution is possibly too
restrictive. In general, firms seem to expand productivity as result of
AI adoption by other means than labor, as well as leverage AI to
expand their influence on the product market.
3. Employment Dynamics :Descriptive
Statistics
Our survey also explicitly has asked on how AI-related technologies
has affected or, will impact employment and employment skill mix
in the future.7
3.1. AI and the Dynamics of Employment
Regarding expectations, survey responses are summarized in
Table 4 for companies adopting or piloting AI. 44% of companies do
not see an impact, while the portion of companies reporting a decline
in total employment is about 19%, compared with only 10% that
report an increase in demand for labor. Interestingly, 27% of
companies say that there will be a labor reduction in some
occupations, but with a similar employment increase in other
occupations. In other words, companies tell us that there is more job
re-allocation than total job shrinkage, in line with our first
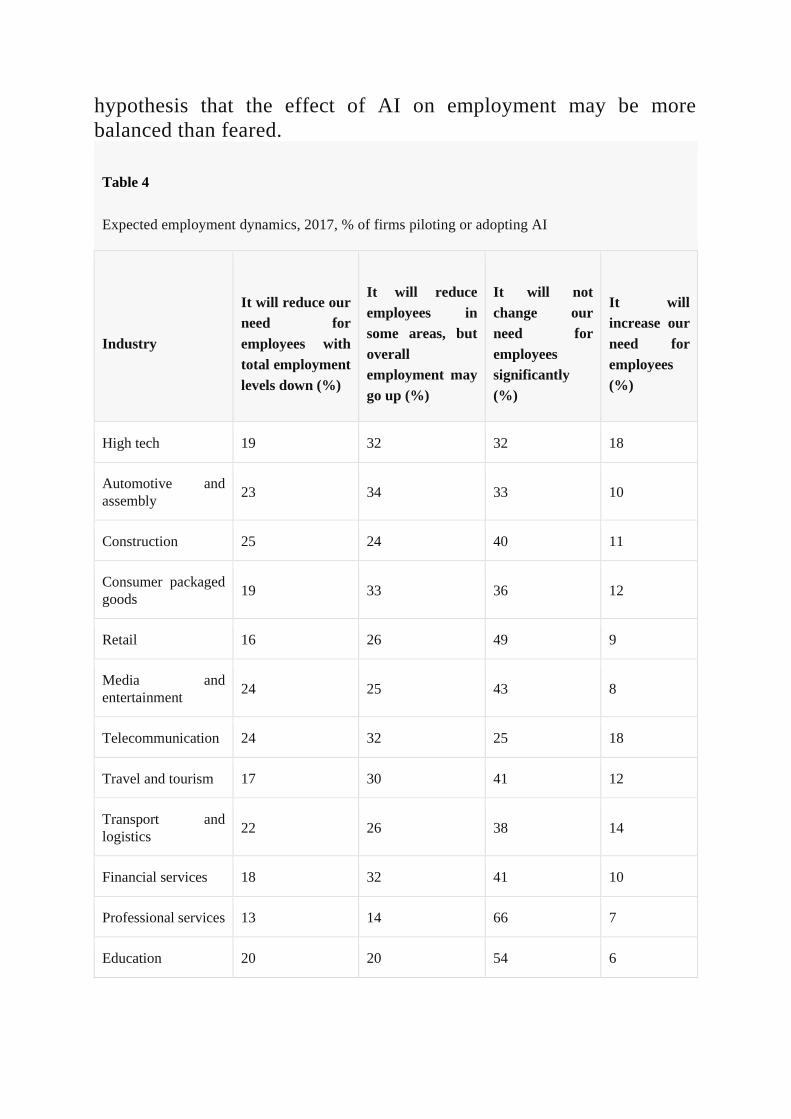
hypothesis that the effect of AI on employment may be more
balanced than feared.
Table 4
Expected employment dynamics, 2017, % of firms piloting or adopting AI
Industry
It will reduce our
need for
employees with
total employment
levels down (%)
It will reduce
employees in
some areas, but
overall
employment may
go up (%)
It will not
change our
need for
employees
significantly
(%)
It will
increase our
need for
employees
(%)
High tech 19 32 32 18
Automotive and
assembly 23 34 33 10
Construction 25 24 40 11
Consumer packaged
goods 19 33 36 12
Retail 16 26 49 9
Media and
entertainment 24 25 43 8
Telecommunication 24 32 25 18
Travel and tourism 17 30 41 12
Transport and
logistics 22 26 38 14
Financial services 18 32 41 10
Professional services 13 14 66 7
Education 20 20 54 6
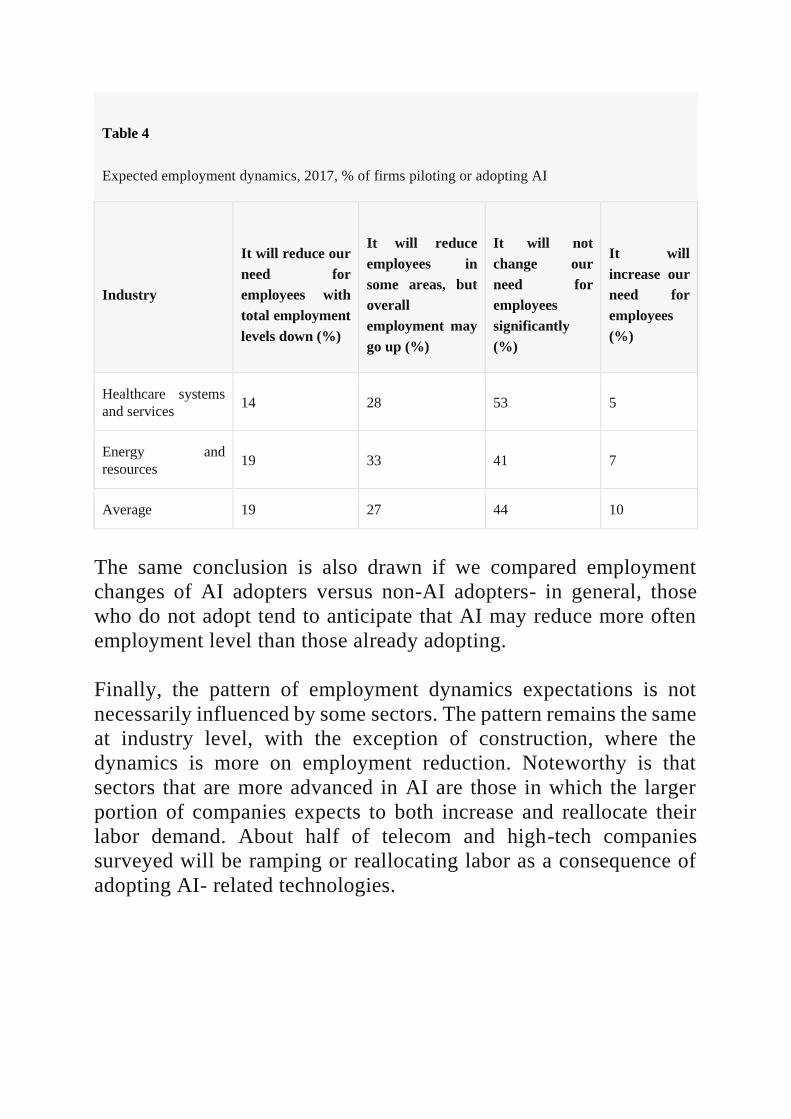
Table 4
Expected employment dynamics, 2017, % of firms piloting or adopting AI
Industry
It will reduce our
need for
employees with
total employment
levels down (%)
It will reduce
employees in
some areas, but
overall
employment may
go up (%)
It will not
change our
need for
employees
significantly
(%)
It will
increase our
need for
employees
(%)
Healthcare systems
and services 14 28 53 5
Energy and
resources 19 33 41 7
Average 19 27 44 10
The same conclusion is also drawn if we compared employment
changes of AI adopters versus non-AI adopters- in general, those
who do not adopt tend to anticipate that AI may reduce more often
employment level than those already adopting.
Finally, the pattern of employment dynamics expectations is not
necessarily influenced by some sectors. The pattern remains the same
at industry level, with the exception of construction, where the
dynamics is more on employment reduction. Noteworthy is that
sectors that are more advanced in AI are those in which the larger
portion of companies expects to both increase and reallocate their
labor demand. About half of telecom and high-tech companies
surveyed will be ramping or reallocating labor as a consequence of
adopting AI- related technologies.

3.2. AI and Employment Mix Change
The picture of employment evolution is even clearer if one
disaggregates labor demand by occupations and by skills type (see
Table 5).8 The portion of surveyed executives who report a reduction
in employment is about 25% for almost every function. The highest
frequency of decline is visible in functions with more routine-
based activities such as operations and back-office, while the lowest
frequency of decline lies in senior management roles. Further, there
are as many companies reporting an increase in the level of
employment by function as those reporting a decline. The net balance
is less favorable for more routine-based jobs, while functions in data
and analytics and IT/Design are more likely to increase than
decrease, as already hypothesized in simulations presented in the
McKinsey Global Institute (2018a) research on probable skill shits.
Table 5
Expected employment dynamics by skill type, 2017, % of firms piloting or adopting AI
AI impact on employment:
By functions Less More By skills Less More
Back office 28 30 Basic literacy skills 25 33
Front line employees 30 31 Basic numerical skills 27 34
Operations 30 30 Basic IT skills 26 43
Sales and marketing 22 32 Advanced IT skills 21 51
Data and analytics 23 37 Advanced data skills 23 49
Engineers, IT, design 22 41 Critical thinking 24 43
Finance, HR 25 33 Social skills 21 39

Table 5
Expected employment dynamics by skill type, 2017, % of firms piloting or adopting AI
AI impact on employment:
By functions Less More By skills Less More
Middle management 22 30 Communication skills 20 39
Senior management 19 29 Creative design 23 41
Average 25 33 Craft/technical skills 21 34
Engineering skills 22 41
R&D skills 24 47
Leadership skills 20 33
Average 25 33 23 41
The largest portion of firms reporting a decline is for basic literacy
and basic numerical skills. 40% of companies will increase any skill ,
and the largest portion of companies is willing to raise labor demand
once again for advanced data and IT skills. This is clearly consistent
with our second hypothesis that AI may lead to a skill-biased
technological change in employment mix, as happened in the recent
past (Autor and Handel 2013).9
4. Employment Choice: The Econometric
Analysis
The above data suggest that the dynamics on employment may be
more complex than the narrative that AI will reduce jobs. We
formally test this in this section. In the first subsection, we start by

specifying a simple derived labor demand that serves as the backbone
of our econometric specification laid out in a second sub-section.
Then results are reported and discussed.10
4.1. The Short-Term Derived Labor Demand as a
Function of AI Automation
4.1.1. Product Market Spillover
One important element of this article is to emphasize the link
between labor and product markets and how it may affect how AI
diffusion influence labor demand.
We consider a firm r which maximizes profit, π, while being in
competition with other firms, and supplying a product Q r, with iso-
price elasticity of product demand, κ, (κ < 0).11 Given competitive
interactions, this firm’s equilibrium market share is given by,
MSr = Qr/Q (where Q is total market supply) and product price over
marginal costs, P/MC = μr (= > 1) is:
μr=κMSr/(MSrκ+1+COMP),μr=κMSr/(MSrκ+1+COMP) (1)
COMP is a conjectural variation parameter, and lies between [−1,1],
and COMP = −1 means perfect competition (μ = 1), while
COMP = 0 means that all firms behave as Cournot.
Based on the above, it is easy to show that the growth in μ,(=ϕ), is a
positive function of the growth in MS, ΔMS, as well as a negative
function of growth in competitive intensity, COMP, ΔCOMP. We
note:
δlog(μ)=ϕ=ϕ(ΔMS,ΔCOMP)δlog(μ)=ϕ=ϕ(ΔMS,ΔCOMP) (2)
ϕ in Eq. (2) will turn to be important as it reflects the extent of how
AI automation effect on production efficiency is passed-through into
profitability of the firm, see infra.
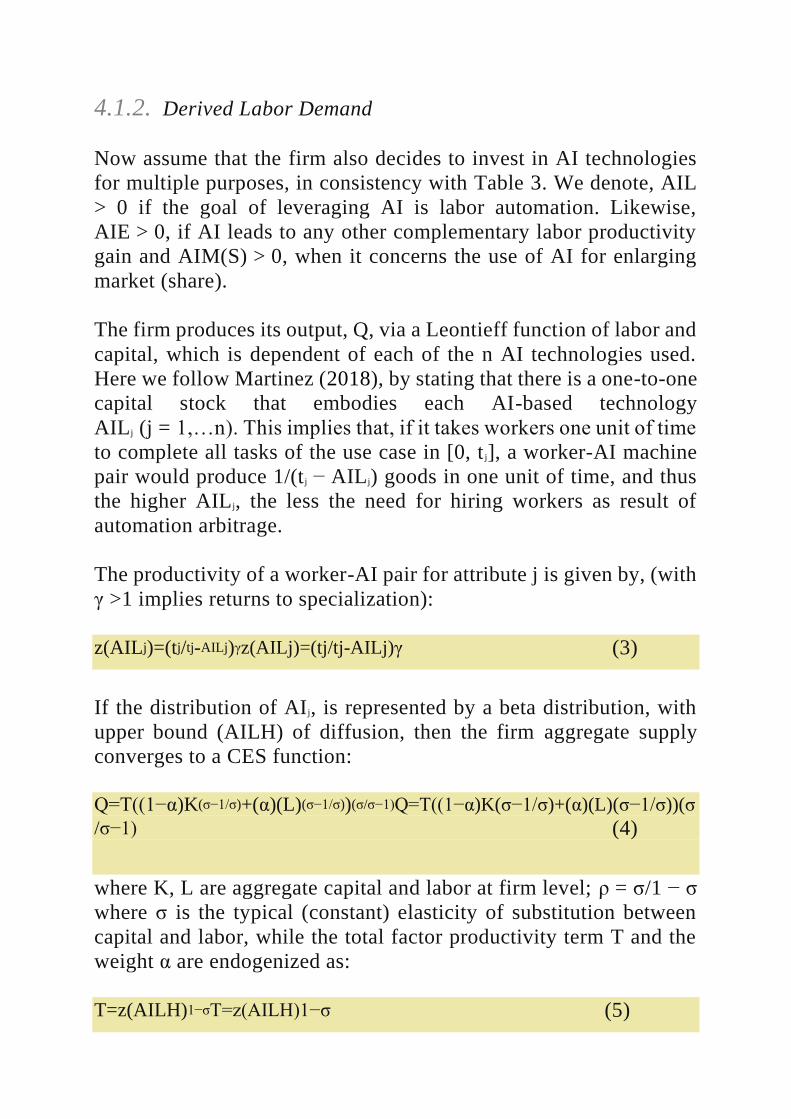
4.1.2. Derived Labor Demand
Now assume that the firm also decides to invest in AI technologies
for multiple purposes, in consistency with Table 3. We denote, AIL
> 0 if the goal of leveraging AI is labor automation. Likewise,
AIE > 0, if AI leads to any other complementary labor productivity
gain and AIM(S) > 0, when it concerns the use of AI for enlarging
market (share).
The firm produces its output, Q, via a Leontieff function of labor and
capital, which is dependent of each of the n AI technologies used.
Here we follow Martinez (2018), by stating that there is a one-to-one
capital stock that embodies each AI-based technology
AILj (j = 1,…n). This implies that, if it takes workers one unit of time
to complete all tasks of the use case in [0, t j], a worker-AI machine
pair would produce 1/(t j − AILj) goods in one unit of time, and thus
the higher AILj, the less the need for hiring workers as result of
automation arbitrage.
The productivity of a worker-AI pair for attribute j is given by, (with
γ >1 implies returns to specialization):
z(AILj)=(tj/tj-AILj)γz(AILj)=(tj/tj-AILj)γ (3)
If the distribution of AIj, is represented by a beta distribution, with
upper bound (AILH) of diffusion, then the firm aggregate supply
converges to a CES function:
Q=T((1−α)K(σ−1/σ)+(α)(L)(σ−1/σ))(σ/σ−1)Q=T((1−α)K(σ−1/σ)+(α)(L)(σ−1/σ))(σ
/σ−1) (4)
where K, L are aggregate capital and labor at firm level; ρ = σ/1 − σ
where σ is the typical (constant) elasticity of substitution between
capital and labor, while the total factor productivity term T and the
weight α are endogenized as:
T=z(AILH)1−σT=z(AILH)1−σ (5)

α=z(AILH)σ−1α=z(AILH)σ−1 (6)
6
If one notates that γ = ρ + ε (ε > 1).
Equations (4)–(6) illustrate how AIL affects factor intensity and in
particular, how automation may put pressure of labor. To see that
more simply, take the log of (6), that is ln (α) = ε. ln(1-AILH), as
well as the special case ε = 1. Then, we find roughly that the labor
share is directly linked to increased automation AILH:
α=(1−AILH)α=(1−AILH) (7)
This is in line with the idea in the literature that efficient automation
exerts a direct decline in labor share (Autor and Salomons 2018),
4.1.3. Employment Dynamics in Function of AI
As said earlier, the derived labor demand must take into account all
channels and namely the indirect impact on full supply through the
change in μ. In fact, using (2)–(4)–(5)–(7), the first order condition
for profit maximization leads to the following short-term
employment elasticity that is12:
τ=(∂logL/∂AILH)=−κϕ(ΔMS,ΔCOMP)θ+(1−σ)ετ
=(∂logL/∂AILH)=−κϕ(ΔMS,ΔCOMP)θ+(1−σ)ε (8)
Where the first term can be broken down as the opposite of the
product of three terms: (a) the product elasticity; (b) the elasticity of
mark-up as described by Eq. (2) and (c) 𝜃, the elasticity on marginal
cost of automation intensity change.
Taking all those terms together, their product tends to be negative,
so that an increase in automation AILH boosts employment. The sign
of second term is not known a priori—it depends on how large capital
and labor are substitutes to each other; in an aggregate Cobb-Douglas
specification, the term collapses to zero; if capital and labor are
strategic complements, σ < 113; if there are gross substitutes the term
is negative. Nevertheless, the second term increases in labor
specialization ε, and declines in σ.
From the different tables, and equations above, we can further
assume that κ is a decreasing function of AIM, while ϕ is a positive
function of AIMS. Further, if labor is strategic
complements/substitutes with other inputs, 𝜃 may be a
positive/negative function of AIE. Hence, we thus clearly see that the
effect of investing in automation (AILH) on employment depends on
the nature of the technology, the indirect effect on product supply
(and the latter is being affected by the additional mix of objectives in
investing in AI).
One extreme case is when capital and labor are gross substitutes, and
that the firm only uses AI for automation (AIQ = AIE = 0), and has
monopoly power- in this case, labor is the only adjustment variable,
leading to a decline. On another extreme, a firm invests in AI with
its labor being more complement to capital and where AI leads to
higher market (share) expansion, may rather lead to a net positive
effect on employment. The latter is likely to be more relevant when
it concerns crucial employment skills that must be bundled with new
type of smart capital, as early mentioned in Brynjolfsson and Hitt
(2003).
4.2. The Econometric Specification
We now turn to an empirical specification for τ, using Eq. (8), as
backbone of drivers that determine the level of τ.
Table 6 in particular demonstrates that, among firms already
adopting AI, the largest segment is from companies investing both in
automation and other forms of product market shifting, while the
segment using AI for product market shifting is actually larger than
the one doing it only for labor automation. This type of overspill to
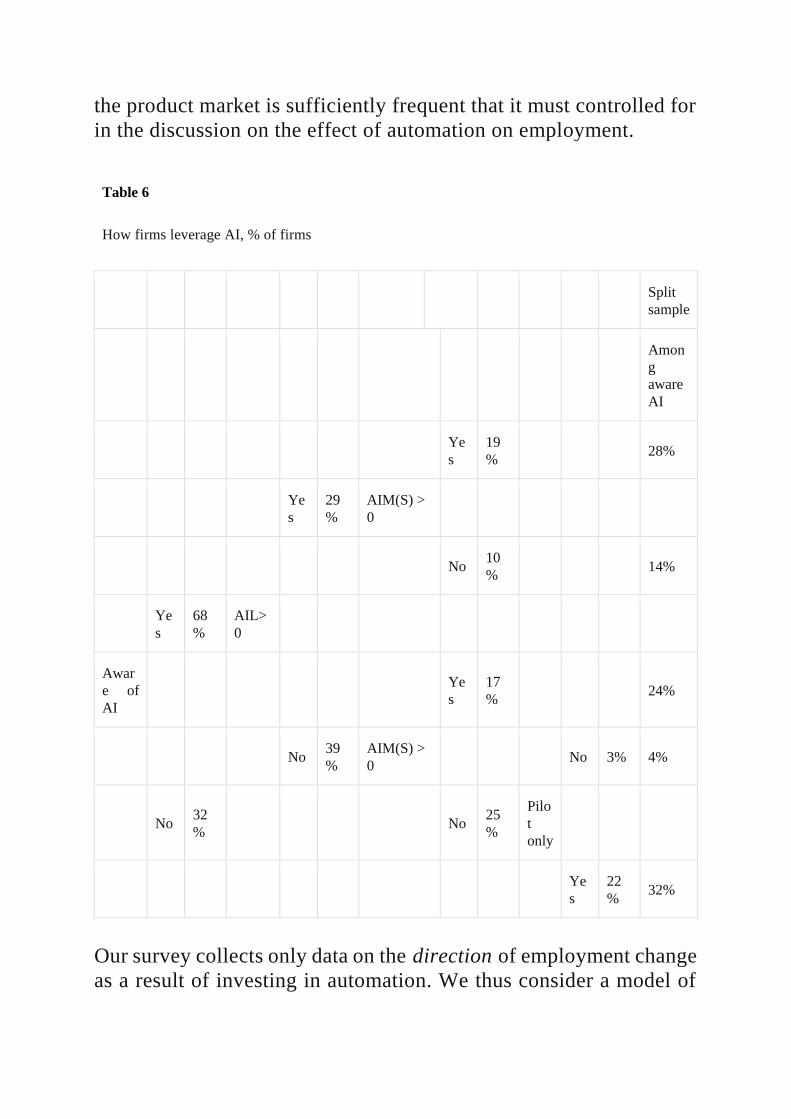
the product market is sufficiently frequent that it must controlled for
in the discussion on the effect of automation on employment.
Table 6
How firms leverage AI, % of firms
Split
sample
Amon
g
aware
AI
Ye
s
19
% 28%
Ye
s
29
%
AIM(S) >
0
No 10
% 14%
Ye
s
68
%
AIL>
0
Awar
e of
AI
Ye
s
17
% 24%
No 39
%
AIM(S) >
0 No 3% 4%
No 32
% No
25
%
Pilo
t
only
Ye
s
22
% 32%
Our survey collects only data on the direction of employment change
as a result of investing in automation. We thus consider a model of
the form, I(I) where I = 1 if planned employment is on the decrease,
0 otherwise. As we do not have a view on output, I(I).
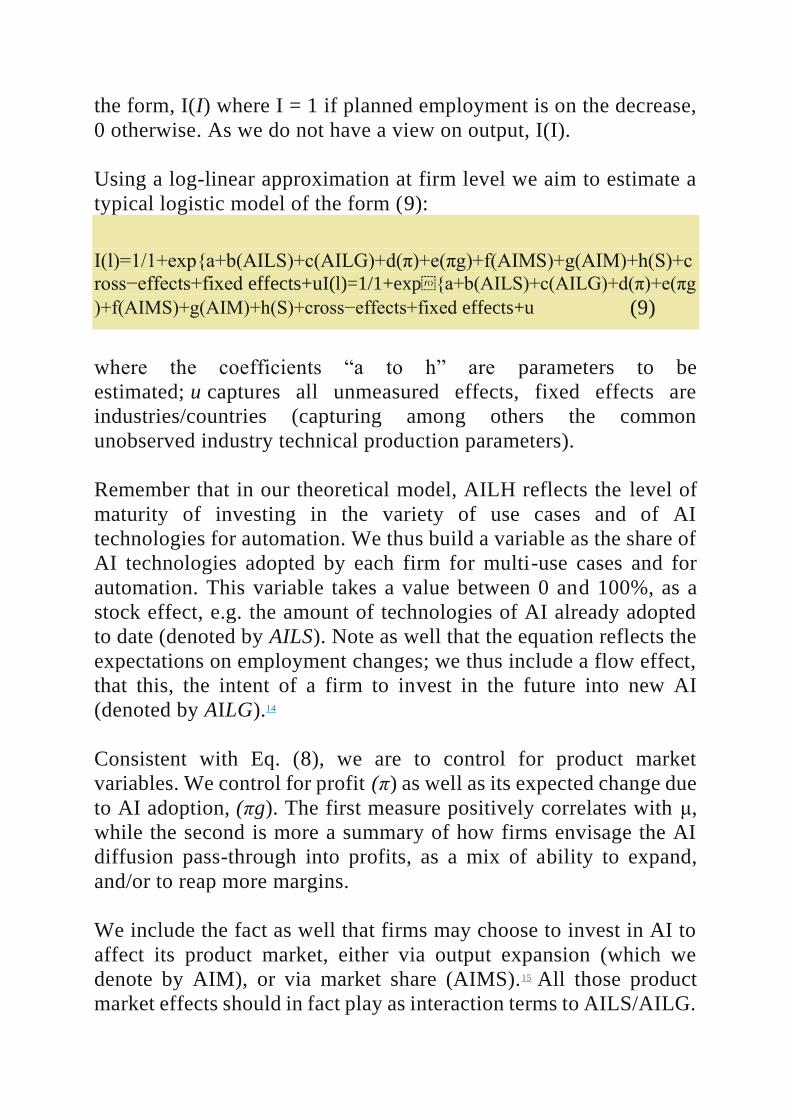
Using a log-linear approximation at firm level we aim to estimate a
typical logistic model of the form (9):
I(l)=1/1+exp{a+b(AILS)+c(AILG)+d(π)+e(πg)+f(AIMS)+g(AIM)+h(S)+c
ross−effects+fixed effects+uI(l)=1/1+exp{a+b(AILS)+c(AILG)+d(π)+e(πg
)+f(AIMS)+g(AIM)+h(S)+cross−effects+fixed effects+u (9)
where the coefficients “a to h” are parameters to be
estimated; u captures all unmeasured effects, fixed effects are
industries/countries (capturing among others the common
unobserved industry technical production parameters).
Remember that in our theoretical model, AILH reflects the level of
maturity of investing in the variety of use cases and of AI
technologies for automation. We thus build a variable as the share of
AI technologies adopted by each firm for multi-use cases and for
automation. This variable takes a value between 0 and 100%, as a
stock effect, e.g. the amount of technologies of AI already adopted
to date (denoted by AILS). Note as well that the equation reflects the
expectations on employment changes; we thus include a flow effect,
that this, the intent of a firm to invest in the future into new AI
(denoted by AILG).14
Consistent with Eq. (8), we are to control for product market
variables. We control for profit (π) as well as its expected change due
to AI adoption, (πg). The first measure positively correlates with μ,
while the second is more a summary of how firms envisage the AI
diffusion pass-through into profits, as a mix of ability to expand,
and/or to reap more margins.
We include the fact as well that firms may choose to invest in AI to
affect its product market, either via output expansion (which we
denote by AIM), or via market share (AIMS).15 All those product
market effects should in fact play as interaction terms to AILS/AILG.
We include them both as cross-effects and shift variables, and we let
data speak. We finally control for company size (S), as it is well
known that technology shape may be different by size (Dupuy and
de Grip 2003).
In practice the model (9) is being estimated as a multi-logit model
given three categories (increase, decrease, or no impact) of
employment changes, and in difference versus industry average, so
we control for trends in industry dynamics. The variables πm, πmg as
well as AILG are all categorical variables. Given our coding, one
delta in πm is 5 points extra of current margin, one delta in πg is 3
extra points of expected margin in next 3 years, while one delta in
AILG amounts to 20% growth in investment in AI technologies in
next 3 years. The size variable (s) is categorical with eight categories
of employment, from 0 to 10 employees (small firms) to very large
firms (more than 10,000 employees). The largest firm size category
is the default variable.16
4.3. Results
4.3.1. Employment level effects
Our results for total employment are presented in Tables 7 and 8.
For readability, we only reproduce statistically significant
coefficients at 10% in both tables. The model always controls for
industry and country effects (not reproduced). Employment increase
is the reference categories, so that a negative estimated sign found in
our model will be equivalent to a larger probability to increase
(versus decrease or freeze) employment. Table 7 estimates a simple
model linking employment choice to AI and profit, without the
interaction terms.
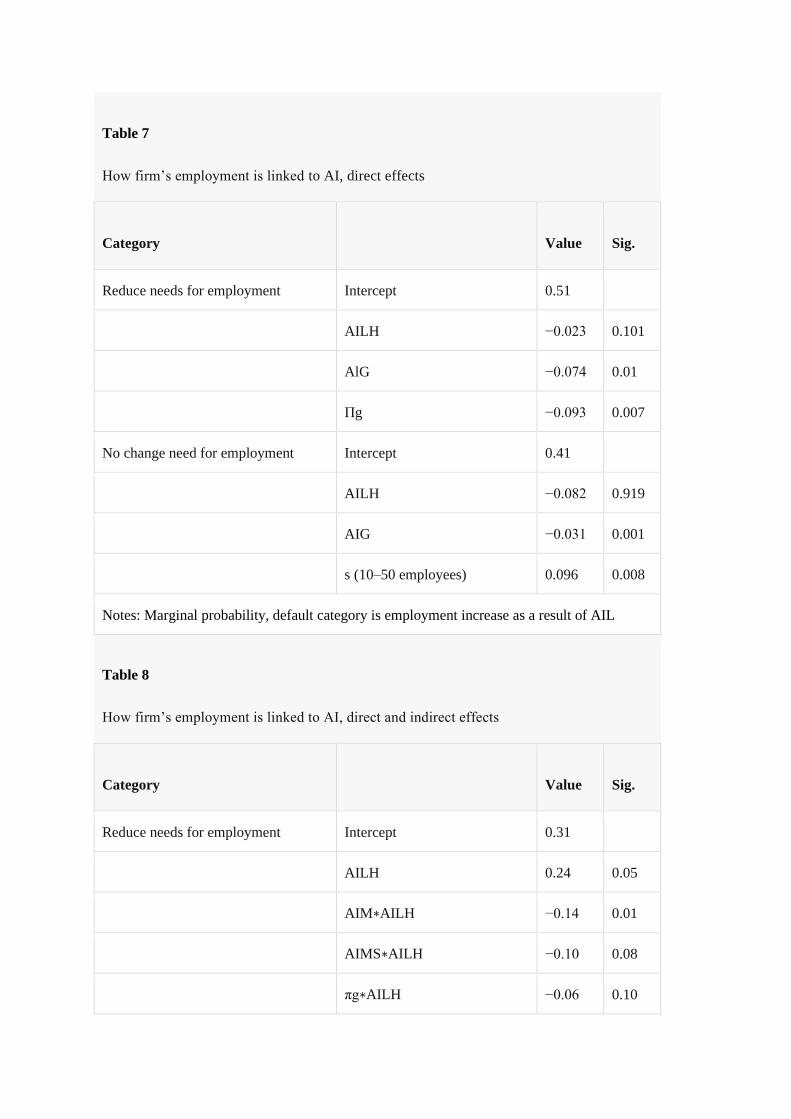
Table 7
How firm’s employment is linked to AI, direct effects
Category Value Sig.
Reduce needs for employment Intercept 0.51
AILH −0.023 0.101
AlG −0.074 0.01
Πg −0.093 0.007
No change need for employment Intercept 0.41
AILH −0.082 0.919
AIG −0.031 0.001
s (10–50 employees) 0.096 0.008
Notes: Marginal probability, default category is employment increase as a result of AIL
Table 8
How firm’s employment is linked to AI, direct and indirect effects
Category Value Sig.
Reduce needs for employment Intercept 0.31
AILH 0.24 0.05
AIM∗AILH −0.14 0.01
AIMS∗AILH −0.10 0.08
πg∗AILH −0.06 0.10
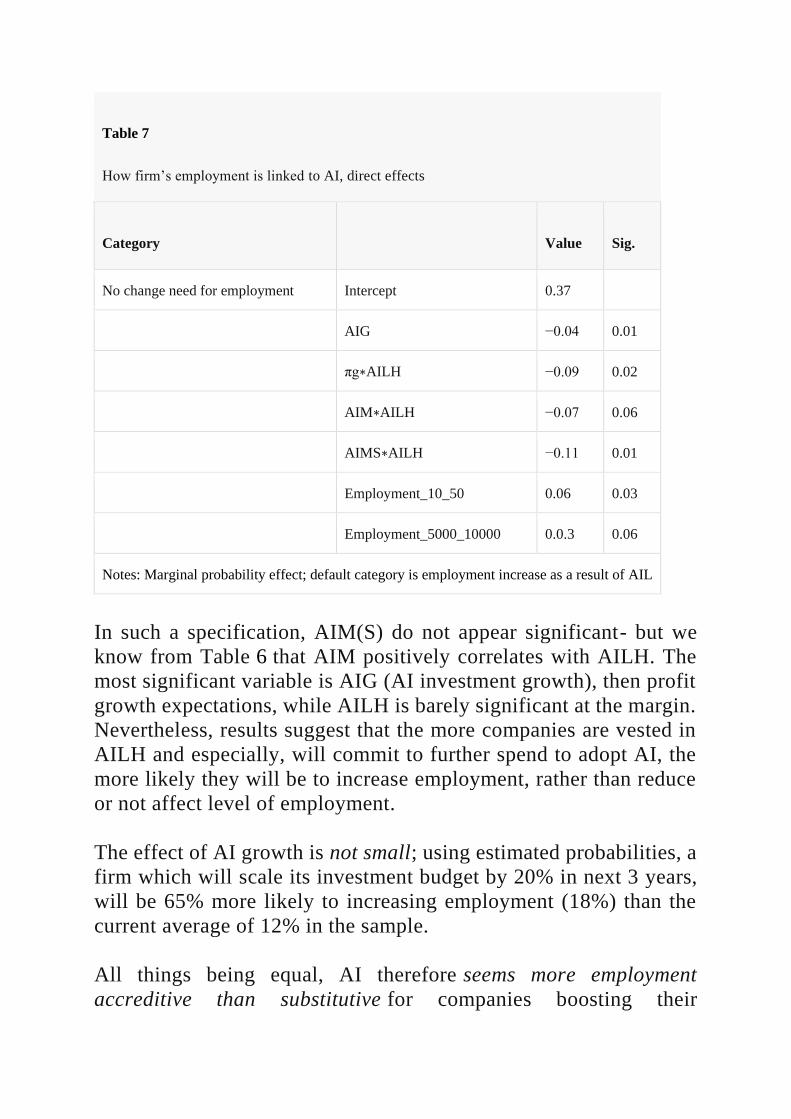
Table 7
How firm’s employment is linked to AI, direct effects
Category Value Sig.
No change need for employment Intercept 0.37
AIG −0.04 0.01
πg∗AILH −0.09 0.02
AIM∗AILH −0.07 0.06
AIMS∗AILH −0.11 0.01
Employment_10_50 0.06 0.03
Employment_5000_10000 0.0.3 0.06
Notes: Marginal probability effect; default category is employment increase as a result of AIL
In such a specification, AIM(S) do not appear significant- but we
know from Table 6 that AIM positively correlates with AILH. The
most significant variable is AIG (AI investment growth), then profit
growth expectations, while AILH is barely significant at the margin.
Nevertheless, results suggest that the more companies are vested in
AILH and especially, will commit to further spend to adopt AI, the
more likely they will be to increase employment, rather than reduce
or not affect level of employment.
The effect of AI growth is not small; using estimated probabilities, a
firm which will scale its investment budget by 20% in next 3 years,
will be 65% more likely to increasing employment (18%) than the
current average of 12% in the sample.
All things being equal, AI therefore seems more employment
accreditive than substitutive for companies boosting their
commitment to AI technologies. Table 8 reports results of a more
appropriate specification, as variables other that AILH enter as
interaction with AILH on employment changes, as per Eq. (8).
Interestingly, AILH comes as a significant driver for decline in
employment evolution. This effect is however counter-balanced by
any plan to expand output in the form of market and market share
extensins.
Likewise profit growth expectations as well as plans for further AI
investment remain associated with higher employment plans.
Using the estimates, we can provide some sensitivities of AI linked
to employment. Consider first a case where a firm only invested for
automation-and is no longer planning to increase level of AI, while
its profit growth out of AI investment is limited. In such as case, the
probability to reduce (some forms of) employment is dominant (it
goes to 55%) and the likelihood to increase employment collapses to
zero.
The opposite, and optimistic case is a firm that d continues
aggressively to invest in AI (more than 20% a year), increases its
profit by 3 points of margins, and further uses AI not only for
automation, but for market (share) deployments.
In such as case, the probability of increasing employment becomes
dominant (51%), while the probability of decline decreases to 25%,
from an average in our sample of 45%. Clearly, the product market
overspills are changing the distribution probabilities of employment
as result of AI decision.17
4.3.2. Employment skill mix effects
We finally zoom by skills type in Table 9. The first column of the
table uses the gross statistics shown in Table 2 to compute an
indicator of net employment expectations (versus all skills’ average).
This indicator becomes more negative the higher the portion of firms
planning to reduce, or the lower the share of companies willing to

increase employment, for this skill type. Basic listening and
numerical skills have 7.5 points fewer employment opportunities
than the average, in relative contrast to advanced data or IT skills,
for example, which have respectively a 6.5%/11.5% higher
employability.
Table 9
How firm’s employment is linked to AI, difference by skills
Increase in
employment linked
to:
Skills
Relative
employment change
(%)
AQ8
AILH (%) AIX∗AILH
(%)
Total
(%)
Basic listening skills −7.50
Basic numerical skills −7.50
Leadership skills −6.50 14.4 14.4
Craft / technical skills −5.50 16.1 16.1
Communication skills −2.50 7.2 7.2
General management
skills −2.50 12.3 12.3
Basic IT skills −1.50 7.30 7.3
Engineering skills −1.50 7.6 7.6
Interpersonal skills 0.50 4.5 9.90 14.4
Optimisation and
planning 0.50 10.10 10.1
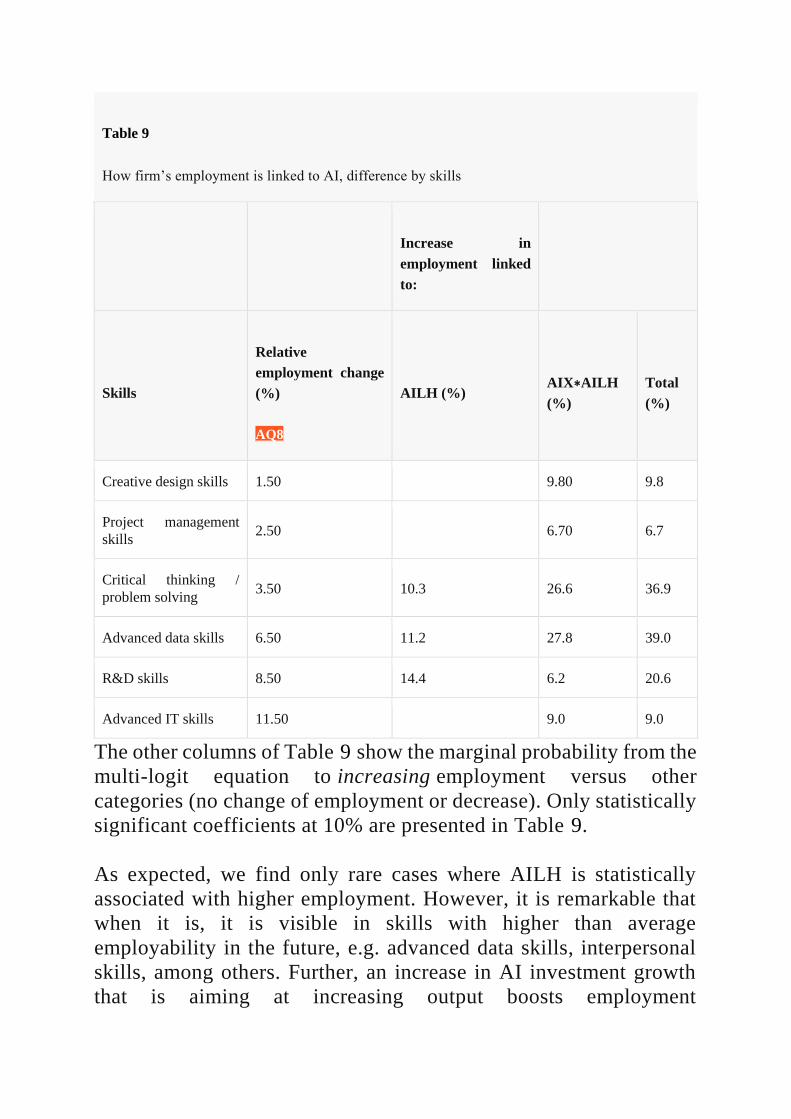
Table 9
How firm’s employment is linked to AI, difference by skills
Increase in
employment linked
to:
Skills
Relative
employment change
(%)
AQ8
AILH (%) AIX∗AILH
(%)
Total
(%)
Creative design skills 1.50 9.80 9.8
Project management
skills 2.50 6.70 6.7
Critical thinking /
problem solving 3.50 10.3 26.6 36.9
Advanced data skills 6.50 11.2 27.8 39.0
R&D skills 8.50 14.4 6.2 20.6
Advanced IT skills 11.50 9.0 9.0
The other columns of Table 9 show the marginal probability from the
multi-logit equation to increasing employment versus other
categories (no change of employment or decrease). Only statistically
significant coefficients at 10% are presented in Table 9.
As expected, we find only rare cases where AILH is statistically
associated with higher employment. However, it is remarkable that
when it is, it is visible in skills with higher than average
employability in the future, e.g. advanced data skills, interpersonal
skills, among others. Further, an increase in AI investment growth
that is aiming at increasing output boosts employment

across all categories, except notably for skill categories with the
least employability potential, e.g. basic listening and numerical
skills. The largest potential in employment growth lies in advanced
data skills, or critical thinking/problem-solving, and to a lesser
extent, R&D skills, all of which are skills with relatively more
employability than average.
Those results are consistent with the idea that there is a tendency of
skill redistribution
5. Conclusions
The research above is rather new and may be extended in many ways.
First, the sample can be extended and updated; second, it would be
great if employment changes emerge directly for observed from data,
rather than from qualitative survey. Finally, our results should be
checked for robustness in terms of sample selection, in terms of
omitted variables (e.g. wages as determinant of employment
changes), among others.
Nevertheless, this article has put the narrative of a “workless future”
to a first and new test, looking from the derived demand side of labor
by companies. We have argued that this lens complements the recent
stream of research focusing on technical automation and skills from
the supply side, as corporations are primary influencers, both
deciding on timing and extent of technology adoption as well as on
the arbitrage to make between capital and labor, and pass-through to
higher output (thus employment) or not.
Our results confirm that the narrative should indeed be more
nuanced. Rather than an inevitable era of depletion of all type of jobs,
our data suggest that the ultimate balance will depend on product
market spillovers as well as type of skills. The product market
spillover is itself dependent on how AI is used by firms- and the good
news is that many firms report using AI, not (only) for pure labor
automation, but for other aims, among others, expanding their
product and services and competitiveness. Those are critical
elements to assess how AI will be linked to employment, even if our
current estimates still show an asymmetry towards lower than higher
hours employment out of automation.
Regarding reallocation, our data analysis confirms a tendency
towards skill-bias change. The demand for certain new skills will
certainly rise, including skills linked to social, new analytics, and
interfacing skills (see Deming 2017). Basic skills (including basic IT
ones) exhibit lower employability and are subject to further arbitrage
when companies increase their plan to invest in AI. Hence, on top of
some fear of employment reduction due to automation, one may also
want to ensure enough supply of skills in demand. In general, there
are often frictions in the short term for new skills, e.g. STEM talents
(Holtgrewe 2014 or Walvei 2016).
Hence, companies in need of those new skills will have to poach the
best talent in their onboarding strategy. Likewise, those companies
will need to nurture their workforce via all possibilities of on-the-job
and lifelong training. Perhaps this is why most of the most innovative
HR practices are now coming from digital companies, from Zappos
to Netflix.18 In a world of up-skills, those companies with the right
skill mix and adequate expansive business models will be those to
thrive in both labor and product markets.
Acknowledgements
We thank Eric Hazan and Peter Gumbel for comments and editing,
as well as Chris Pissarides. All remaining mistakes are mine.

References
Acemoglu, D., & Resterpo, P. (2017). Robots and jobs – Evidence
from US labor markets. NBER working paper 23285, March.
Acemoglu, D., & Restrepo, P. (2018). The race between man and
machine: Implications of technology for growth, factor shares, and
employment. American Economic Review, 108(6), 1488–1542.
Arntz, M., Gregory, T., & Zierahn, U. (2016). The risk of automation
for jobs in OECD countries: A comparative analysis. OECD Social,
Employment and Migration Working Papers, No. 189.
Atkinson, R. (2013). Stop saying robots are destroying jobs – they
are not, Technology Review, September.
Autor, D., & Handel, M. (2013). Putting tasks to the test: Human
capital, job tasks, and wages. Journal of Labor Economics, 31(2),
S59–S96.
Autor, D., & Salomons, A. (2017). Does productivity growth
threaten employment. Paper presented at Cintra at the EIB meeting,
June 19.
Autor, D., & Salomons, A. (2018). Is automation labor-displacing?
Productivity growth, employment, and the labor share. Brookings
Papers on Economic Activity, 2018, 1–87.
Brynjolfsson, E., & Hitt, L. M. (2003). Computing productivity:
Firm-level evidence. Review of Economics and Statistics, 85(4),
793–808.
Brynjolfsson, E., & McAfee, A. (2014). The second machine age:
Work, progress and prosperity in a time of brilliant technologies .
New York: W.W. Norton & Company.
Bughin, J. (2016). Reaping the benefits of big data in
telecom. Journal of Big Data, 3(1), 14.60(2): 338–355.
Bughin, J., & van Zeebroeck, N. (2018). Why a digital base is critical
forAI. McKinseyQuarterly,
Issue1, at https://www.mckinsey.com/business-functions/mckinsey-
analytics/our-insights/artificial-intelligence-why-a-digital-base-is-
critical
Comin, D., & Hobijn, B. (2010). An exploration of technology
diffusion. The American Economic Review, 100(5), 2031–2059.
Deming, J. (2017). The growing importance of social skills in the
labor market. The Quarterly Journal of Economics, 132(4), 1593–
1640.
Dupuy, A., & de Grip, A. (2003). Do large firms have more
opportunities to substitute labour than small firms. Center for Labour
Market and Social Research Working Paper.
Frey, C., & Osborne, M. (2013). The future of employment: How
susceptible are jobs to computerisation?. Oxford Martin School
Working Paper.
Garcia, A., Jaumandreu, J., & Rodriguez, C. (2002). Innovation and
jobs- evidence from manufacturing industries. Discussion paper,
Universidad Carlos III de Madrid, June.
Goos, M., Konings, J., & Vandeweyer, M. (2015). Employment
growth in Europe: The roles of innovation, local job multipliers and
institutions. Utrecht School of Economics Discussion Paper Series,
Vol. 15, No. 10.
Gregory, T., Salomons, A., & Zierahn, U. (2016). Racing with or
against the machine, Evidence from Europe, ZEW. Discussion paper
16-053.
Handel, M. (2016). Dynamics of occupational change: Implications
for the occupational requirements survey. Research paper prepared
for the US Bureau of Labor Statistics, July, bls.gov
Holtgrewe, U. (2014). New new technologies: The future and the
present of work in information and communication technology. New
Technology, Work and Employment, 29(1), 9–24.
Keynes, J.M. (1931), “The Economic Possibilities for our
Grandchildren” in J.M. Keynes, Essays in Persuasion, Macmillan,
London.
Machin, S. (2001). The changing nature of labour demand in the new
economy and skill-biased technology change. Oxford Bulletin of
Economics and Statistics, 63(s 1), 753–776.
Martinez, J. (2018) Automation, growth and factor shares. No. 736.
Society for Economic Dynamics.
McKinsey Global Institute. (2017a). A future that works:
Automation, employment, and productivity. January: McKinsey
Global Institute.
McKinsey Global Institute. (2017b). Artificial Intelligence – The
next digital frontier? McKinsey Global Institute, May.
McKinsey Global Institute. (2018a). Skill shift: Automation and the
future of work. McKinsey Global Institute, May.
McKinsey Global Institute. (2018b). Notes from the AI frontier:
Modelling the impact of AI on the world economy. McKinsey Global
Institute, September.
Milkman, R., & Pullman, C. (1991). Technological change in an auto
assembly plant: The impact on workers’ tasks and skills. Work and
Occupations, 18(2), 123–147.
Nubler, I. (2016), New technologies: A jobless future or golden age
of job creation? ILO, Working paper 13, November.
OECD. (2017). Future of work and skills. Paper presented at the 2nd
meeting of the G20 Employment Working Group, 15–17 February
2017.
Peters, B. (2004). Employment effects of different innovation
activities- microeconomic evidence, ZEW discussion paper 4–73.,
Mannheim, Zentrum fur Europäische Wirtschaftsforschung.
Pissarides, Ch., & Bughin, J. (2018). Embracing the new age of
automation, Project syndicate, January. https://www.project-
syndicate.org/commentary/automation-jobs-policy-imperatives-by-
christopher-pissarides-and-jacques-bughin-2018-01
Spiezia, V., & Vivarelli, M. (2000). The analysis of technological
change and employment. In M. Pianta & M. Vivarelli (Eds.), The
employment impact of innovation. London: Routledge.
Susskind, D. (2020). A world without work: Technology,
automation, and how we should respond, forthcoming.
Ugur, M., Awaworyi, S., & Solomon, E. (2016). Technology
innovation and employment in derived labour demand models: A
hierarchical meta-regression analysis. MPRA paper, Munich, paper
73557, September.
Vivarelli, M. (2014). Innovation, employment, and skills in advanced
and developing countries: A survey of the economic
literature. Journal of Economic Issues, 48, 123–154.
Walvei, U. (2016). Digitization and structural labor market
problems. ILO research paper, 17.
Whitehead, J. C., Groothuis, P. A., & Blomquist, G. C. (1993).
Testing for non-response and sample selection bias in contingent
valuation: Analysis of a combination phone/mail survey. Economics
Letters, 41(2), 215–220.
Zeira, J. (1998). Workers, machines, and economic growth. The
Quarterly Journal of Economics, 113, 10911117.
End-notes
1 Discussion with Mark Purdy from Accenture research at the G-20Y in Evian, Sept. 2 See A future that works: Automation, employment, and productivity , McKinsey
Global Institute, January 2017. 3 As a case in point, let us consider the Associated Press news agency, which used
to deliver reports on large corporations using 65 journalists in its newsroom. With
AI technologies, the company quickly managed to automate the production of
simple stories of quarterly earnings for 10 times as many small companies in the
long-tail. This output gain was not done at the expenses of reporters; the in-house
reporters did not lose their jobs, but were instead redirected to write longer research
article on business trends as a major latent demand spotted by the company.
See Ramaswamy, S (2017) at https://hbr.org/2017/04/how-companies-are-already-
using-ai 4 Substitution may arise when, furthermore, the economics are attractive to replace
human capital for example. 5 https://www.infoq.com/news/2016/07/deepmind-cooling-pue

6 For statistics, see https://www.thetechedvocate.org/six-countries-leading-the-ai-
race/ and https://qz.com/1264673/ai-is-the-new-space-race-heres-what-the-biggest-
countries-are-doing/ 7 We are rather keen to understand the expectations of firms as the current level of
AI diffusion across all technologies is still relatively low. 8 Here we show results in aggregate, but the same picture is also visible by industry. 9 The same skill-biased tendency is also noticeable in the econometric analysis
conducted by Arntz et al. (2016) linking occupations and tasks to the OECD PIACC
skill database. 10 Note that the sample used will concern only firms which are aware of, but not
necessarily adopting, AI technologies. We sub-select those firms, and survey
responses on the impact on AI are likely not to be largely noisy for those respondents
with limited understanding of AI technologies 11 With no loss of generality, we drop the suffix r hereafter. 12 See also Ugur et al. (2016). 13 The preponderance of empirical estimates on the substitution between labor and
capital point to σ < 1, 14 We do not have any mean to split this variable in terms of investment objectives,
however. 15 We do not include AILE as otherwise, we have perfect multicollinearity. 16 There is a case for a selection bias in the sense that we only concentrate on firms
aware of AI. However, firms not aware of AI have not given data, and if yes, noisy
ones, so we can not control for them. We tried a Heckman correction where we try
to predict awareness or not of AI in a first step. But it is rather difficult to have
specific regressor for this first step. 17 See however the asymmetry- in this present case, employment decline has still a
positive probability; while employment increase in the previous case was nil.
Everything being equal, it still suggests that employment pressure may be happening
along automation. 18 See https://hbr.org/2014/01/how-netflix-reinvented-hr

1
001 - Exploring europe’s r&d deficit relative to the us: differences in the rates of return to r&d of
young leading r&d firms - Michele Cincera and Reinhilde Veugelers.
002 - Governance typology of universities’ technology transfer processes - A. Schoen, B. van
Pottelsberghe de la Potterie, J. Henkel.
003 - Academic Patenting in Belgium: Methodology and Evidence – M. Mejer.
004 - The impact of knowledge diversity on inventive performance at European universities – M.
Mejer.
005 - Cross-Functional Knowledge Integration, Patenting and Firm’s Performance – M. Ceccagnoli, N.
van Zeebroeck and R. Venturini.
006 - Corporate Science, Innovation and Firm Value, M. Simeth and M. Cincera.
007 - Determinants of Research Production at top US Universities – Q. David. 008 - R&D financing constraints of young and old innovation leaders in the EU and the US – M. Cincera, J. Ravet and R. Veugelers. 009 - Globalization of Innovation Production; A Patent-Based Industry Analysis – J. Danguy. 010 - Who collaborates with whom: the role of technological distance in international innovation – J. Danguy.
011 - Languages, Fees and the International Scope of Patenting – D. Harhoff , K. Hoisl, B. van Pottelsberghe de la Potterie , C. Vandeput. 012 - How much does speed matter in the fixed to mobile broadband substitution in Europe? – M. Cincera, L. Dewulf, A. Estache. 013 - VC financing and market growth – Interdependencies between technology-push and market-pull investments in the US solar industry – F. Schock, J. Mutl, F. Täube, P. von Flotow. 014 - Optimal Openness Level and Economic Performance of Firms: Evidence from Belgian CIS Data – M. Cincera, P. De Clercq, T. Gillet 015 - Circular Causality of R&D and Export in EU countries – D. Çetin, M. Cincera.
WORKING PAPERS 2013
WORKING PAPERS 2014
WORKING PAPERS 2015
2
016 - Innovation and Access to Finance – A Review of the Literature – M. Cincera, A. Santos.
017 - Effectiveness of Government intervention in the SME sector: Evidence from the Brussels-Capital Region – G. E. Fombasso, M. Cincera. 018 - A review of corporate R&D intensity decomposition – P. Moncada-Pastemò-Castello. 019 - The laws of action and reaction: on determinants of patent disputes in European chemical and drug industries – R. Kapoor, N. van Zeebroeck. 020 - How do the normativity of headquarters and the knowledge autonomy of subsidiaries co- evolve? – M. Hansmans, G. Liu.
021 - The case for offensive strategies in response to digital disruption – J. Bughin, N. van Zeebroeck.
022 - Access to finance as a pressing problem: Evidene from innovative European firms – A. Santos, M. Cincera. 023 - Platform play among incumbent firms: the wrong focus? – N. van Zeebroeck, J. Bughin.
024 - Social Movements – M. Hensmans, K. van Bommel.
025 - Decoding Patent Examination Services – L. Gimeno-Fabran, B. van Pottelsberghe de la Potterie.
026 - Countries Attractiveness: an Analysis of EU Firms’s Decisions to (De) Localize R&D Activities – M. Cincera, A. Santos.
027 - The impact of EUREKA projects on the economic performance of R&D SMEs – M. Cincera, G. Fombasso.
028 - Forecasting short-term transaction fees on a smart contracts platform – C. Hoffreumon, N. van Zeebroeck.
029 - Sharing the risk of innovative investment: Assessing the effect of new European financing instrument - M. Cincera, A. Santos.
030 - Academic scientists: The golden opportunity for high-tech companies – L. Dewulf, M. Cincera.
WORKING PAPERS 2017
WORKING PAPERS 2016
3
031 - Experimentation, Learning and Stress. The Role of Digital Technologies in Strategy Change – J. Bughin, T. Kretschmer, N. van Zeebroeck.
032 - Learning from 20 Years of Research on Innovation Economics – B. van Pottelsberghe de la Potterie. 033 - The Value of Platform Strategy. It’s the Ecosystem, Stupid! - J. Gossé - C. Hoffreumon – N. van Zeebroeck – J. Bughin. 034 - Selectivity versus Reach: Flattening the Curve of Covid 19 for Joint Health and Economic Prosperity – J. Bughin. 035 - How firms will affect the Future of Work – J. Bughin.