Embed Size (px)
Citation preview
How has the Swedish intra-industry
trade been affected by the
Eurozone crisis?
CAROLINE KUOSKU
Master of Science Thesis
Stockholm, Sweden 2013
How has the Swedish intra-industry been
affected by the Eurozone crisis?
Caroline Kuosku
Master of Science Thesis INDEK 2013:69
KTH Industrial Engineering and Management
SE-100 44 STOCKHOLM
Master of Science Thesis INDEK 2013:69
How has the Swedish intra-industry trade been
affected by the Eurozone crisis?
Caroline Kuosku
Approved
2013-06-06
Examiner
Kristina Nyström
Supervisor
Börje Johansson
Zara Daghbashyan
Abstract
This paper analyzes how the Swedish intra-industry trade, simultaneous import and export of
goods in the same industry, has changed after the Eurozone crisis occurred year 2008. The
hypothesis is associated with trade theory regarding more intense intra-industry trade
between countries with similar economic structure, development and market size. The crisis-
effect is assumed to decrease the two-way trade between Sweden and countries with large
economic differences and stay unchanged between Sweden and countries with similar
economic structures. By conducting three different models that evaluates the effects in
different steps, the main findings are supporting the hypothesis. The intra-industry trade
intensity has increased for the cluster of countries with low or medium difference in GDP per
capita compared to Sweden, and decreased for those countries with large difference. The
explanation to these findings is that the international trade has experienced simultaneous
development for both Sweden and partner countries and this has generated equalized two-
way trade between similar economies, there could also be the possibility of long-term trade
contracts that are less sensitive when a crisis occurs. The countries with larger economic
difference has been affected in a larger extent which has led to decreased two-way trade,
probably caused by a greater gap between countries economic structures and consumer
demands.
Key-words: International trade, Intra-industry trade, Grubel-Lloyd index,
Country characteristics, Industry characteristics, European Union, Eurozone crisis.
Index
1. Introduction ....................................................................................................................... 1
2. Previous studies and theoretical background ................................................................. 3
2.1 Eurozone crisis ............................................................................................................ 3
2.2 Intra-industry trade models .......................................................................................... 4
2.3 Country and industry characteristics ........................................................................... 6
2.3.1 Country characteristics ......................................................................................... 7
2.3.2 Industry characteristics ......................................................................................... 8
2.4 Crisis effect on intra-industry trade ............................................................................. 9
2.4.1 Eurozone crisis ..................................................................................................... 9
2.4.2 Asian financial crisis .......................................................................................... 10
2.5 Limitations ...................................................................................................................... 11
3. Method and data ............................................................................................................. 11
3.1 Data and variable description .................................................................................... 11
3.2 Theory and hypothesis ............................................................................................... 16
3.3 Models ....................................................................................................................... 17
4. Results .............................................................................................................................. 17
4.1 Crisis effect ..................................................................................................................... 18
4.2 Cluster effects ................................................................................................................. 20
4.3 Country effects ............................................................................................................... 23
5. Conclusions ...................................................................................................................... 27
References ............................................................................................................................... 29
Appendix ................................................................................................................................. 31
1A. Correlation matrix .......................................................................................................... 31
2A. Cluster of countries ........................................................................................................ 32
3A. Countries Grubel-Lloyd index ....................................................................................... 33

1
1. Introduction
The financial crisis in the United States, caused by payment difficulties in the subprime
mortgages in year 2007, was spread over the world to a global financial crisis and entered
Europe in year 2008, referred as the Eurozone crisis. According to OECD (2010) the increase
in the sovereign debt affected the financial markets heavily and finally spilled over to the real
economy and their consumers. This resulted in increased unemployment levels, many
businesses went bankrupt, decreased domestic demand, GDP levels fell, international trade
decreased and the economies were heavily harmed. Further, the crisis caused dramatic drops
in the stock market and deterioration of business and consumer confidence which affected all
economic operators. As a consequence, financial institutions became unwilling to lend to each
other, credits became more difficult and costly to receive and household decreased their
consumption and started to save more. According to international economic theory, as
suggested by Andresen (2003), when consumer demand decreases the desire of more varieties
available on the market is assumed to decline, which would lead to lower production options
available on the market.
The empirical field concerning how the crisis has affected the international trade
is limited. The literature available on the effects of the Eurozone crisis is mainly focusing on
the financial division such as credit conditions, cash flows and lending rates. Toporowski
(2012) finds a negative effect of the Eurozone crisis on the intra-industry trade between
Visegrad group countries and EU-15, while Rana (2008) finds a positive effect of the intra-
industry trade among East Asian countries after the occurrence of the Asian financial crisis.
An explanation to the opposite findings by the authors is probably due to the countries
examined and their economic similarities between trading partners.
The aim of this paper is to contribute to the limited literature and evaluate how
the intra-industry trade, two-way trade with simultaneous export and import of goods in the
same industry, is affected by the Eurozone crisis.
Sweden is a strong economic country and the international economic theory
predicts that the intra-industry trade will be more intense when the partner country has similar
economic structure, market and demand. The most common proxy for this is the GDP per
capita level between countries. To be able to evaluate if the intra-industry trade has changed
after the occurrence of the Eurozone crisis, the trade Sweden makes within its largest export
sector, metalworking machinery, is analyzed. The paper is limited to only study the trade with
countries that are members of the European Union, since the trade conditions are the same for
all partner countries and without trade barriers. The two-way trade is also limited to only look
at the overall intra-industry trade without any specifications for horizontally or vertically
differentiated products.
The hypothesis regarding the overall intra-industry trade development due to the
crisis for the Swedish trade with all European Union membership countries is expected to stay
unchanged or with a possible small negative effect, since the crisis is expected to affect all
economies simultaneously. The second hypothesis is that the Swedish intra-industry trade
with countries with similar economic structures will stay unchanged or with positive effects
after the crisis occurs. If the international trade level between countries decrease

2
simultaneously the intra-industry trade will stay unchanged, and richer countries are expected
to recover from a crisis faster. The last and third hypothesis refers to countries with larger
differences in economic structures. Since the international trade theory predicts the intra-
industry trade to be weaker when partner countries have greater difference in economic
structure, the expected effect from the crisis is further decreased intra-industry trade. The
economic gap between countries’ economic structures is expected to increase as well as the
consumer demand is assumed to decline mainly for the cluster of countries with large
economic dissimilarity.
By conducting a model that use both country and industry specific variables for
the period 2002-2011, the models will show general conditions for the intra-industry trade
between Sweden and countries, as well as capture the effect of the Eurozone crisis from
year 2008. Grubel-Lloyd index as the dependent variable is representing the level of intra-
industry trade development and several models are conducted in different detailed levels.
First, the overall crisis effect during the crisis years 2008-2011 is observed for all European
Union membership countries. Next, countries are being clustered by their GDP per capita
difference levels for the crisis period to evaluate if the trade theory holds, and test the
hypothesis if countries that are economically dissimilar from Sweden have been affected by
the crisis in a greater degree. Finally, each country is analyzed separately to observe which
countries mainly were affected by the crisis.
The first approach to observe the Eurozone crisis effects on the Swedish intra-
industry trade was to focus on the countries that were the hardest affected by the crisis.
However, since these countries are significantly different from each other in terms of size,
market, economy etc., the evaluation of the crisis effects are instead concentrated on clusters
of economic differences.
The paper is organized as follows. Section 2 contain previous studies and
theoretical background within the field of financial crisis and international trade, followed by
section 3 that contains the model and data description, and finalized with the results in section
4 and conclusions in section 5.
3
2. Previous studies and theoretical background
This section will first explain the occurrence of the Eurozone crisis and the effects that has
been observed so far. The following section explain different types of intra-industry trade
models, followed by description of country and industry characteristics that are commonly
used in the empirical field as independent variables when examining intra-industry trade
flows. Finally, the effect the crisis might have on the intra-industry trade as well as some
limitations with the intra-industry index is specified.
2.1 Eurozone crisis
The financial crisis started in the United States due to payment difficulties associated with the
subprime mortgage segments within the property market and evolved to high mortgage debts
and declining housing prices. According to OECD (2010) this lead to a financial crisis that
rapidly spread around the globe and caused dramatic drops in the stock market and
deterioration of business and consumer confidence which affected all economic operators.
Further, financial institutions became unwilling to lend to each other, credits became more
difficult and costly to receive and household decreased their consumption and started to save
more.
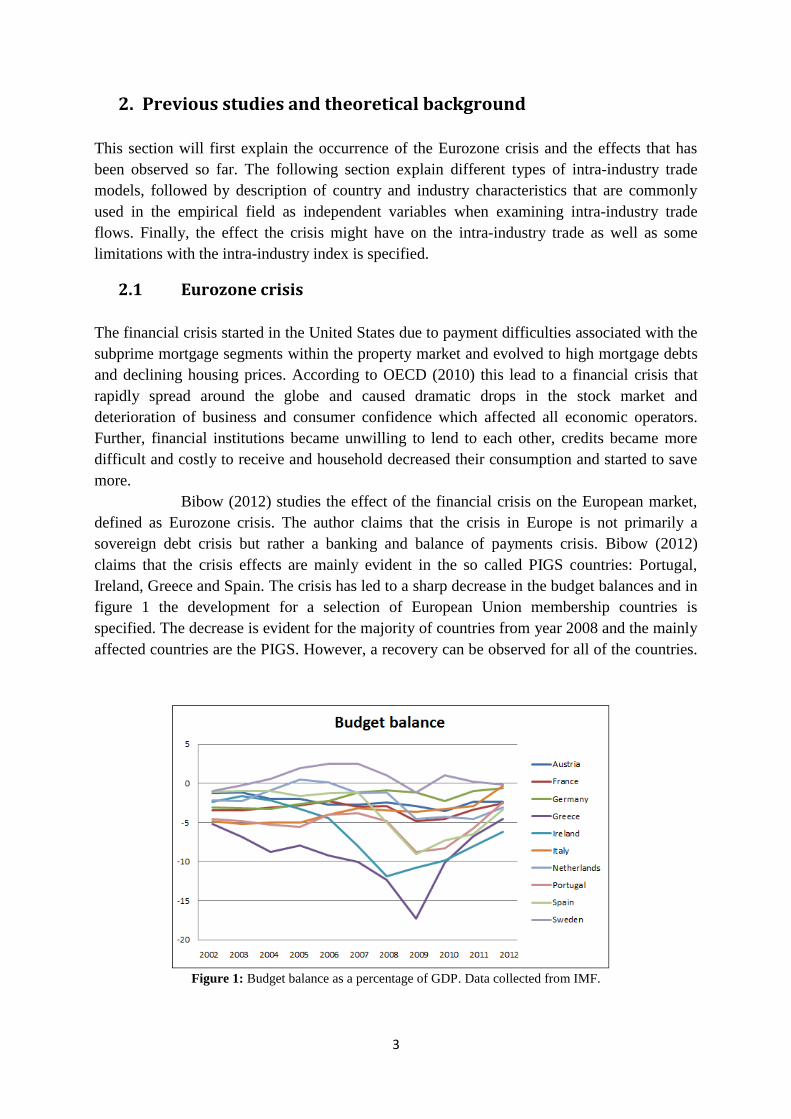
Bibow (2012) studies the effect of the financial crisis on the European market,
defined as Eurozone crisis. The author claims that the crisis in Europe is not primarily a
sovereign debt crisis but rather a banking and balance of payments crisis. Bibow (2012)
claims that the crisis effects are mainly evident in the so called PIGS countries: Portugal,
Ireland, Greece and Spain. The crisis has led to a sharp decrease in the budget balances and in
figure 1 the development for a selection of European Union membership countries is
specified. The decrease is evident for the majority of countries from year 2008 and the mainly
affected countries are the PIGS. However, a recovery can be observed for all of the countries.
Figure 1: Budget balance as a percentage of GDP. Data collected from IMF.
4
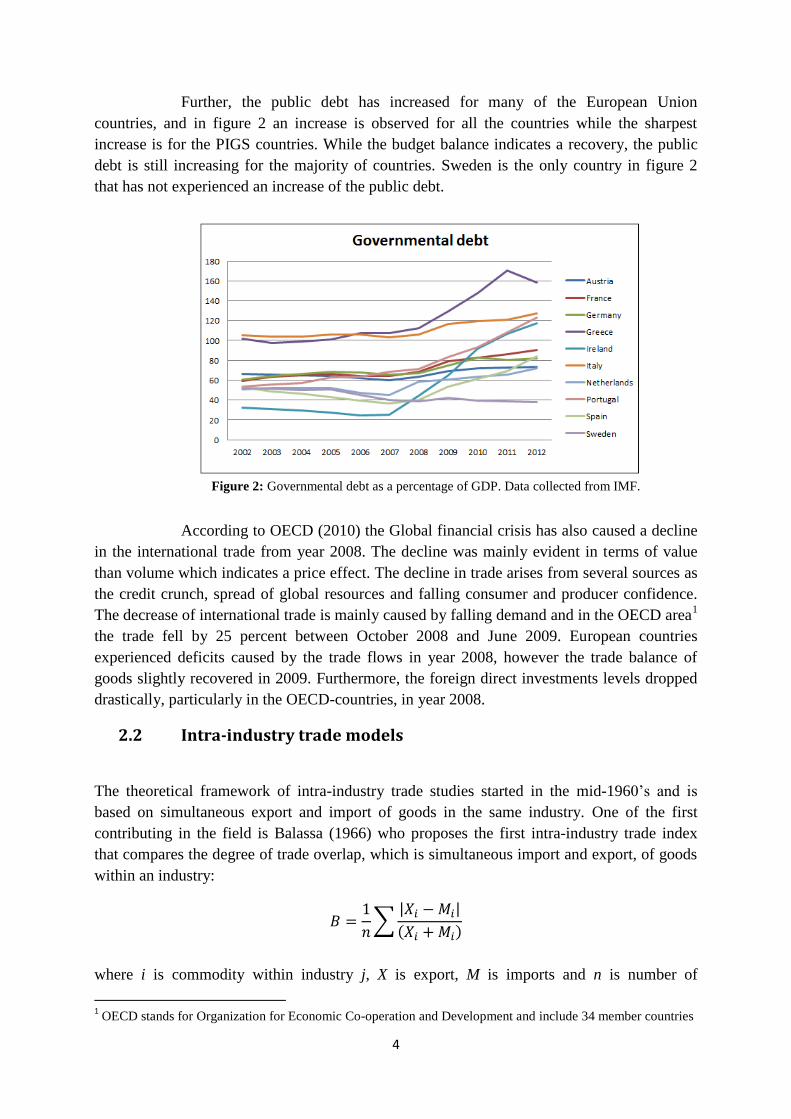
Further, the public debt has increased for many of the European Union
countries, and in figure 2 an increase is observed for all the countries while the sharpest
increase is for the PIGS countries. While the budget balance indicates a recovery, the public
debt is still increasing for the majority of countries. Sweden is the only country in figure 2
that has not experienced an increase of the public debt.
According to OECD (2010) the Global financial crisis has also caused a decline
in the international trade from year 2008. The decline was mainly evident in terms of value
than volume which indicates a price effect. The decline in trade arises from several sources as
the credit crunch, spread of global resources and falling consumer and producer confidence.
The decrease of international trade is mainly caused by falling demand and in the OECD area1
the trade fell by 25 percent between October 2008 and June 2009. European countries
experienced deficits caused by the trade flows in year 2008, however the trade balance of
goods slightly recovered in 2009. Furthermore, the foreign direct investments levels dropped
drastically, particularly in the OECD-countries, in year 2008.
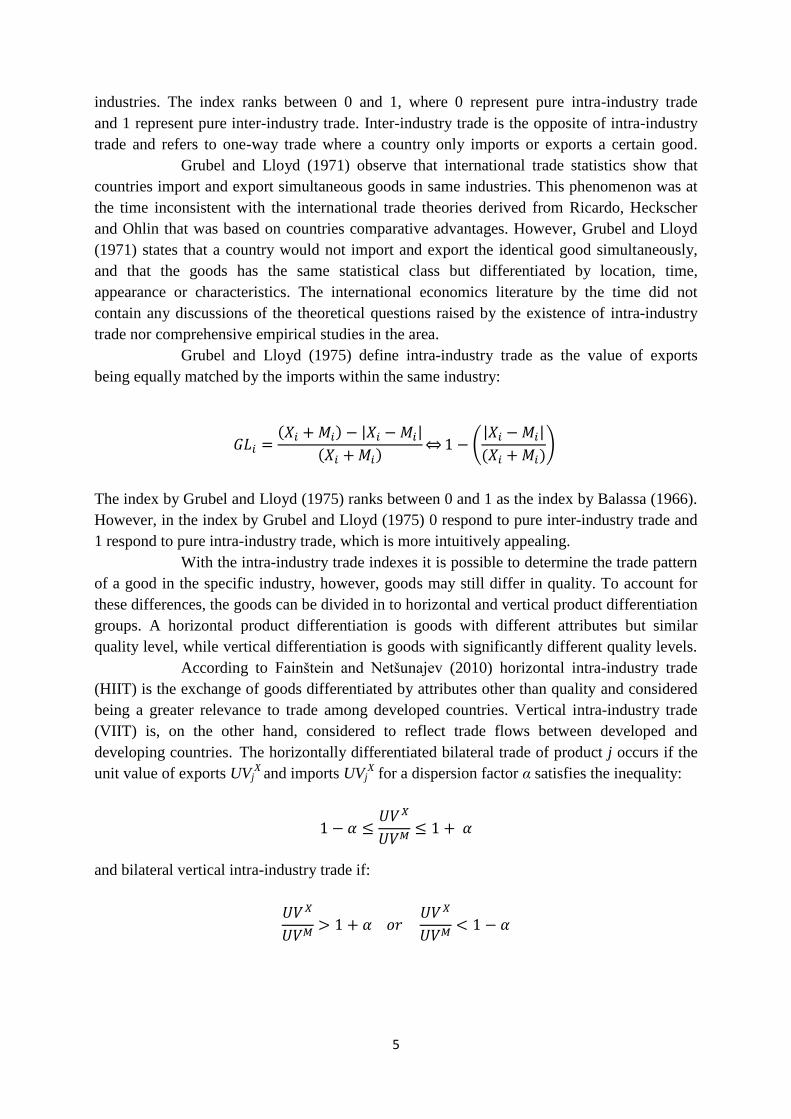
2.2 Intra-industry trade models
The theoretical framework of intra-industry trade studies started in the mid-1960’s and is
based on simultaneous export and import of goods in the same industry. One of the first
contributing in the field is Balassa (1966) who proposes the first intra-industry trade index
that compares the degree of trade overlap, which is simultaneous import and export, of goods
within an industry:
where i is commodity within industry j, X is export, M is imports and n is number of
1 OECD stands for Organization for Economic Co-operation and Development and include 34 member countries
Figure 2: Governmental debt as a percentage of GDP. Data collected from IMF.
5
industries. The index ranks between 0 and 1, where 0 represent pure intra-industry trade
and 1 represent pure inter-industry trade. Inter-industry trade is the opposite of intra-industry
trade and refers to one-way trade where a country only imports or exports a certain good.
Grubel and Lloyd (1971) observe that international trade statistics show that
countries import and export simultaneous goods in same industries. This phenomenon was at
the time inconsistent with the international trade theories derived from Ricardo, Heckscher
and Ohlin that was based on countries comparative advantages. However, Grubel and Lloyd
(1971) states that a country would not import and export the identical good simultaneously,
and that the goods has the same statistical class but differentiated by location, time,
appearance or characteristics. The international economics literature by the time did not
contain any discussions of the theoretical questions raised by the existence of intra-industry
trade nor comprehensive empirical studies in the area.
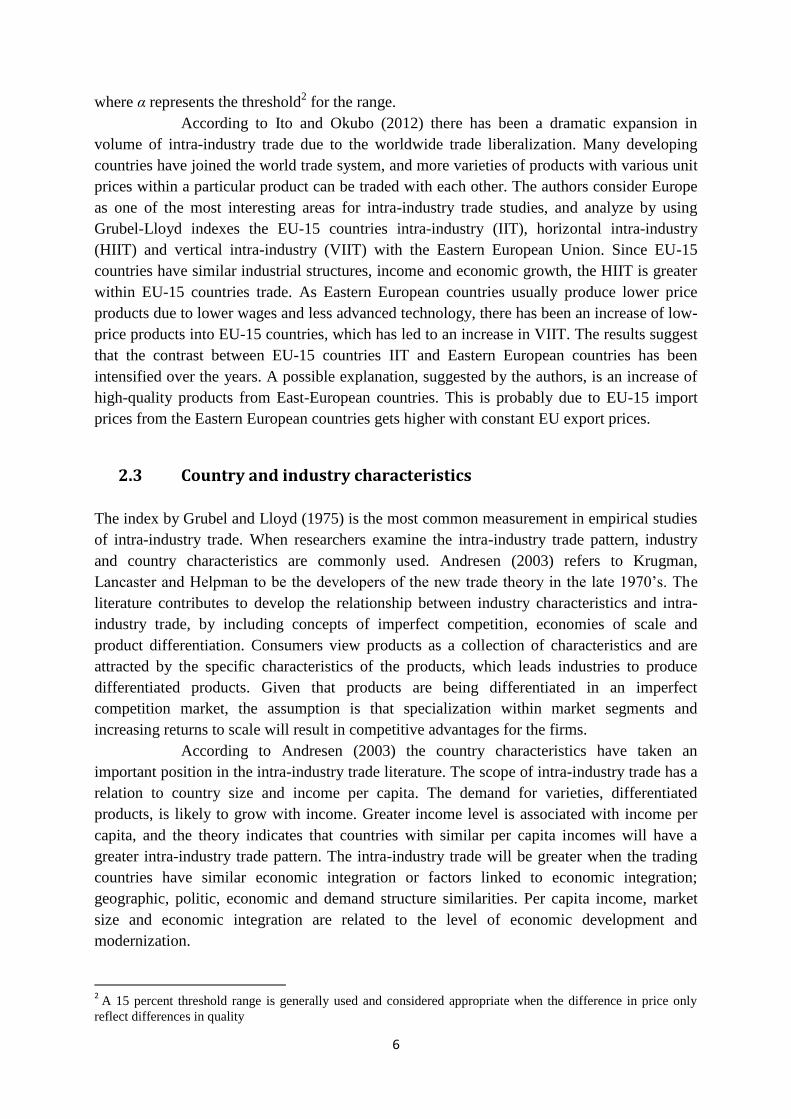
Grubel and Lloyd (1975) define intra-industry trade as the value of exports
being equally matched by the imports within the same industry:
The index by Grubel and Lloyd (1975) ranks between 0 and 1 as the index by Balassa (1966).
However, in the index by Grubel and Lloyd (1975) 0 respond to pure inter-industry trade and
1 respond to pure intra-industry trade, which is more intuitively appealing.
With the intra-industry trade indexes it is possible to determine the trade pattern
of a good in the specific industry, however, goods may still differ in quality. To account for
these differences, the goods can be divided in to horizontal and vertical product differentiation
groups. A horizontal product differentiation is goods with different attributes but similar
quality level, while vertical differentiation is goods with significantly different quality levels.
According to Fainštein and Netšunajev (2010) horizontal intra-industry trade
(HIIT) is the exchange of goods differentiated by attributes other than quality and considered
being a greater relevance to trade among developed countries. Vertical intra-industry trade
(VIIT) is, on the other hand, considered to reflect trade flows between developed and
developing countries. The horizontally differentiated bilateral trade of product j occurs if the
unit value of exports UVjX
and imports UVjX for a dispersion factor α satisfies the inequality:
and bilateral vertical intra-industry trade if:
6
where α represents the threshold2 for the range.
According to Ito and Okubo (2012) there has been a dramatic expansion in
volume of intra-industry trade due to the worldwide trade liberalization. Many developing
countries have joined the world trade system, and more varieties of products with various unit
prices within a particular product can be traded with each other. The authors consider Europe
as one of the most interesting areas for intra-industry trade studies, and analyze by using
Grubel-Lloyd indexes the EU-15 countries intra-industry (IIT), horizontal intra-industry
(HIIT) and vertical intra-industry (VIIT) with the Eastern European Union. Since EU-15
countries have similar industrial structures, income and economic growth, the HIIT is greater
within EU-15 countries trade. As Eastern European countries usually produce lower price
products due to lower wages and less advanced technology, there has been an increase of low-
price products into EU-15 countries, which has led to an increase in VIIT. The results suggest
that the contrast between EU-15 countries IIT and Eastern European countries has been
intensified over the years. A possible explanation, suggested by the authors, is an increase of
high-quality products from East-European countries. This is probably due to EU-15 import
prices from the Eastern European countries gets higher with constant EU export prices.
2.3 Country and industry characteristics
The index by Grubel and Lloyd (1975) is the most common measurement in empirical studies
of intra-industry trade. When researchers examine the intra-industry trade pattern, industry
and country characteristics are commonly used. Andresen (2003) refers to Krugman,
Lancaster and Helpman to be the developers of the new trade theory in the late 1970’s. The
literature contributes to develop the relationship between industry characteristics and intra-
industry trade, by including concepts of imperfect competition, economies of scale and
product differentiation. Consumers view products as a collection of characteristics and are
attracted by the specific characteristics of the products, which leads industries to produce
differentiated products. Given that products are being differentiated in an imperfect
competition market, the assumption is that specialization within market segments and
increasing returns to scale will result in competitive advantages for the firms.
According to Andresen (2003) the country characteristics have taken an
important position in the intra-industry trade literature. The scope of intra-industry trade has a
relation to country size and income per capita. The demand for varieties, differentiated
products, is likely to grow with income. Greater income level is associated with income per
capita, and the theory indicates that countries with similar per capita incomes will have a
greater intra-industry trade pattern. The intra-industry trade will be greater when the trading
countries have similar economic integration or factors linked to economic integration;
geographic, politic, economic and demand structure similarities. Per capita income, market
size and economic integration are related to the level of economic development and
modernization.
2 A 15 percent threshold range is generally used and considered appropriate when the difference in price only
reflect differences in quality
7
According to Andresen (2003) the country-specific and industry-specific
characteristics can be divided into five broad sub-groups, described in Table 1 below.
Country-specific characteristics Industry-specific characteristics
Economic development Product differentiation
Market size Economies of scale
Geographic proximity Market structure
Economic integration Product life cycle
Barriers to trade Presence of multinational corporations
Table 1: Country and industry-specific characteristics
2.3.1 Country characteristics
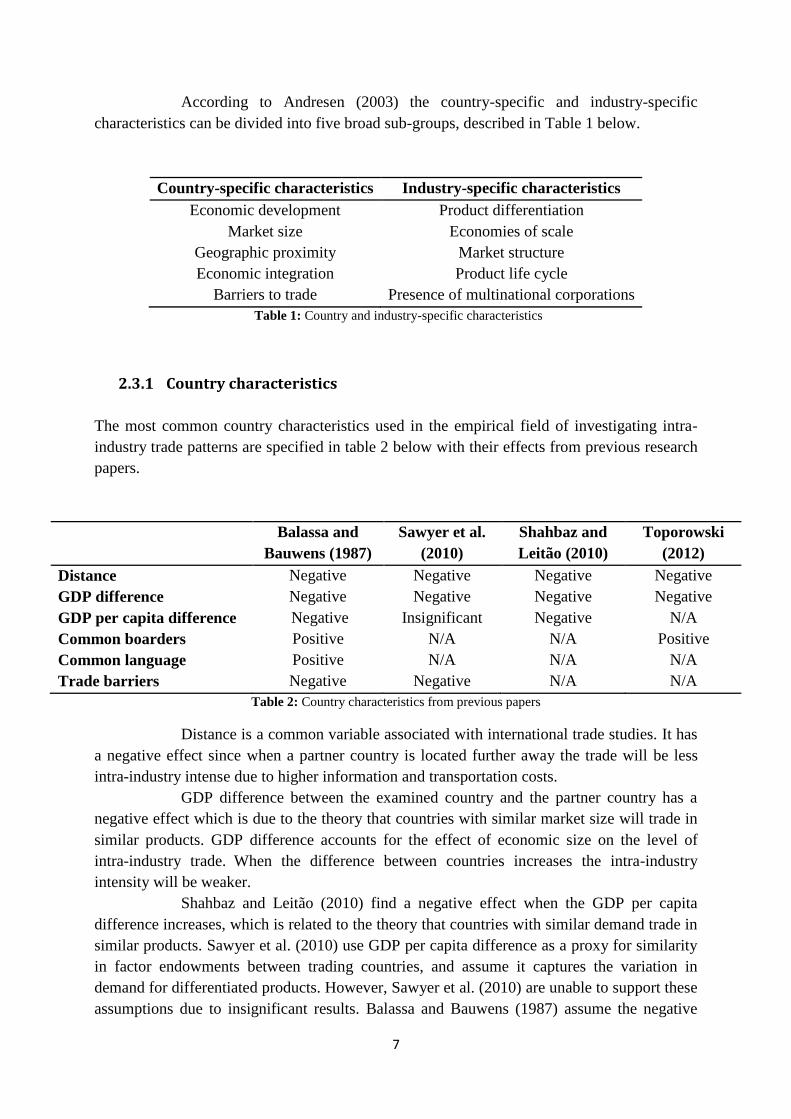
The most common country characteristics used in the empirical field of investigating intra-
industry trade patterns are specified in table 2 below with their effects from previous research
papers.
Table 2: Country characteristics from previous papers
Distance is a common variable associated with international trade studies. It has
a negative effect since when a partner country is located further away the trade will be less
intra-industry intense due to higher information and transportation costs.
GDP difference between the examined country and the partner country has a
negative effect which is due to the theory that countries with similar market size will trade in
similar products. GDP difference accounts for the effect of economic size on the level of
intra-industry trade. When the difference between countries increases the intra-industry
intensity will be weaker.
Shahbaz and Leitão (2010) find a negative effect when the GDP per capita
difference increases, which is related to the theory that countries with similar demand trade in
similar products. Sawyer et al. (2010) use GDP per capita difference as a proxy for similarity
in factor endowments between trading countries, and assume it captures the variation in
demand for differentiated products. However, Sawyer et al. (2010) are unable to support these
assumptions due to insignificant results. Balassa and Bauwens (1987) assume the negative
Balassa and
Bauwens (1987)
Sawyer et al.
(2010)
Shahbaz and
Leitão (2010)
Toporowski
(2012)
Distance Negative Negative Negative Negative
GDP difference Negative Negative Negative Negative
GDP per capita difference Negative Insignificant Negative N/A
Common boarders Positive N/A N/A Positive
Common language Positive N/A N/A N/A
Trade barriers Negative Negative N/A N/A
8
relationship represents the difference in demand structure.
According to Balassa and Bauwens (1987) common boarders between countries
have a positive effect on the intra-industry trade due to locational advantages.
Balassa and Bauwens (1987) find positive effect of the use of common language
while the significance level varies depending on what language is analyzed. English, French
and German languages are highly significant while Portuguese, Spanish and Scandinavian
languages are less significant.
Sawyer et al. (2010) analyze the effect of trade barriers by looking at economic
integration channels represented by different forms of free trade agreements between partner
countries. The result is higher intra-industry trade levels when it exist free trade agreements
and when there is barriers to trade the effect is negative. Balassa and Bauwens (1987) also
assume that the level of intra-industry trade is negatively correlated with trade barriers, and
find that trade agreements and participation in regional integration schemes increase the intra-
industry trade.
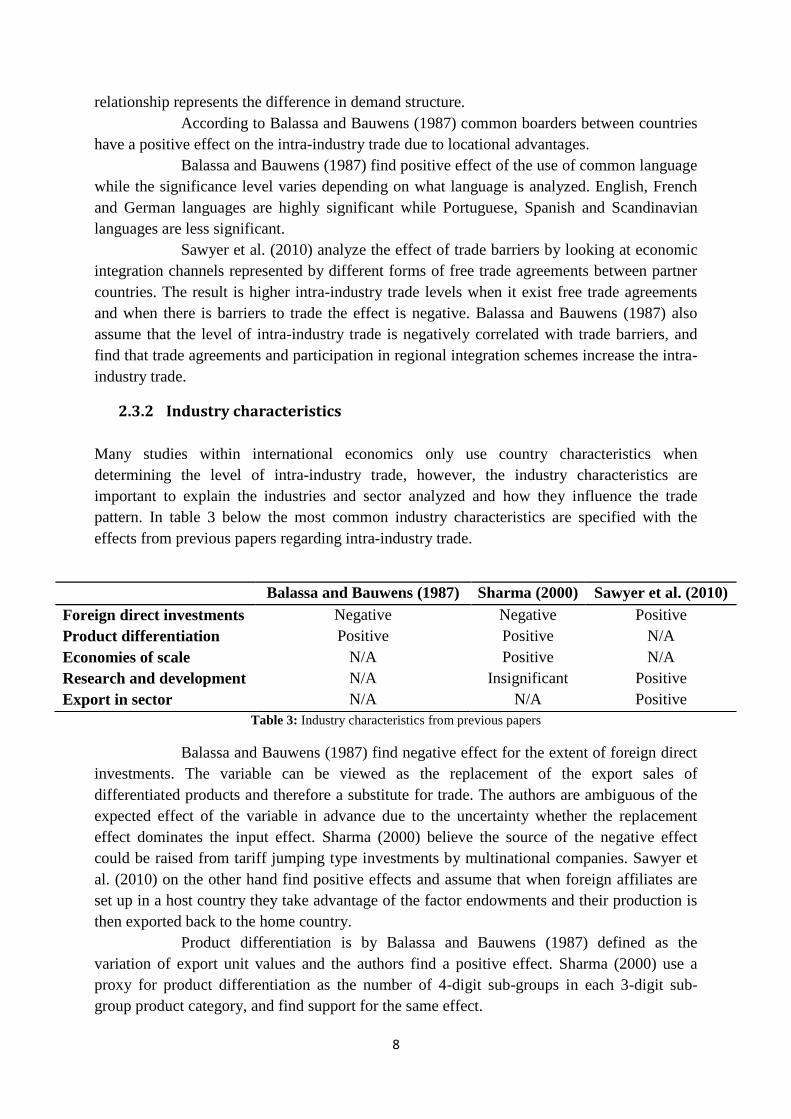
2.3.2 Industry characteristics
Many studies within international economics only use country characteristics when
determining the level of intra-industry trade, however, the industry characteristics are
important to explain the industries and sector analyzed and how they influence the trade
pattern. In table 3 below the most common industry characteristics are specified with the
effects from previous papers regarding intra-industry trade.
Table 3: Industry characteristics from previous papers
Balassa and Bauwens (1987) find negative effect for the extent of foreign direct
investments. The variable can be viewed as the replacement of the export sales of
differentiated products and therefore a substitute for trade. The authors are ambiguous of the
expected effect of the variable in advance due to the uncertainty whether the replacement
effect dominates the input effect. Sharma (2000) believe the source of the negative effect
could be raised from tariff jumping type investments by multinational companies. Sawyer et
al. (2010) on the other hand find positive effects and assume that when foreign affiliates are
set up in a host country they take advantage of the factor endowments and their production is
then exported back to the home country.
Product differentiation is by Balassa and Bauwens (1987) defined as the
variation of export unit values and the authors find a positive effect. Sharma (2000) use a
proxy for product differentiation as the number of 4-digit sub-groups in each 3-digit sub-
group product category, and find support for the same effect.
Balassa and Bauwens (1987) Sharma (2000) Sawyer et al. (2010)
Foreign direct investments Negative Negative Positive
Product differentiation Positive Positive N/A
Economies of scale N/A Positive N/A
Research and development N/A Insignificant Positive
Export in sector N/A N/A Positive
9
Sharma (2010) use a proxy for economies of scale as the average value added
per establishment and the result provides support for the assumption that industries that are
able to exploit economies of scale are industries with higher levels of intra-industry trade.
Research and development intensity is measured by Sharma (2000) who finds
insignificant result. The author suggests that the insignificance could be due to low variations
in research and development across the industries in Australia which is the country examined.
Sawyer et al. (2010) measure the research and development spending as a share of GDP and
find positive effect. The authors assume it reflects product differentiation which determines
the level of horizontal intra-industry trade.
Sawyer et al. (2010) analyze the manufacturing industry and have a variable that
represents the share of manufactured exports of total merchandise exports and find a positive
effect.
2.4 Crisis effect on intra-industry trade
There are very limited literatures regarding intra-industry trade effects after a crisis occurs,
and concerning the Eurozone crisis there is only one paper I have been able to find. The
reason for the limited literature is probably due to the crisis is still ongoing in the European
market and that there is no existing theory of how a crisis might affect countries trade
patterns. The articles available are presented in this section, which concerns the Eurozone
crisis as well as the Asian financial crisis.
2.4.1 Eurozone crisis
The only paper analyzing the effects of the recent financial crisis on the intra-industry trade
pattern, to my knowledge, is by the PhD student Toporowski (2012). The author aim to clarify
if the crisis has a real impact on the intra-industry trade pattern and analyze the determinants
of intra-industry trade linked with consumer welfare.
First, Toporowski (2012) looks at the intra-industry, horizontal intra-industry
and vertical intra-industry trade development between the Visegrad group3 countries and EU-
15 countries. The intra-industry trade has increased from year 2004 and indicates an
increasing engagement in global production. A decrease of the intra-industry can be observed
after year 2009 when the crisis occurred. Horizontal and high quality vertical intra-industry
trade levels are stable or increasing during the whole period, however, the low quality vertical
intra-industry trades are generally stable or decreasing. This would indicate an improvement
of the quality of goods produced by the Visegrad group countries, or a deterioration of quality
goods produced in the EU-15 region due to the financial crisis.
Further, Toporowski (2012) analyze the effect of the crisis by conducting a
regression model with country characteristics as independent variables as well as a crisis
dummy variable. The crisis dummy variable represents the occurrence of crisis and is
according to Toporowski (2012) a straightforward and simplified variable that represents the
influence of a crisis through other channels than income. What exactly is captured in the
variable is not further explained by the author. All the country characteristics in the model are
3 Visegrad group is the alliance of four Central European states: Czech Republic, Hungary, Poland and Slovakia

10
significant, however, the dummy variable for the crisis is insignificant. The author assumes
that the insignificant result is probably raised from the variable being to straightforward and
in order to capture the effect a specific variable is recommended.
The intra-industry trade between Visegrad group countries and EU-15 was
decreased due to the Eurozone crisis, even if the effect could not be observed in the regression
model. Visegrad group countries are mainly poorer countries with a low GDP per capita
levels, and EU-15 are richer and stronger economies with a significantly higher GDP per
capita levels. The decrease can therefore be explained by the difference in economic
structures between the countries, and as mentioned by Andresen (2003), the scope of intra-
industry trade has a relation to country size and income per capita.
2.4.2 Asian financial crisis
The Economist (2007) explain that the Asian financial crisis occurred year 1997 due to the
central bank of Thailand floated their currency bath and was not able to protect it from
speculative attack. This triggered a financial and economic collapse that spread to the other
economies in the Asian region. The crisis mainly led to contraction of GDP growth rates and
companies that had overexposed their foreign-currency risk went bankrupt.
Rana (2008) analyzes the intra-industry trade among East Asian countries4 and
contributes to the literature by extending the results to the post-crisis period since many
previous authors have limited their research to not including the crisis-period. The authors
explain that the volume of trade of East Asian countries increased at a faster pace than
anywhere else in the world due to lowering tariffs in the 1980’s. According to Rana (2008)
the intra-industry trade has constantly increased during the time-period 1993-2004 for all of
the examined countries trade with each other, and an effect of the Asian financial crisis cannot
be observed.
Further, Rana (2008) analyze the correlation of industrial protection index
between partner countries by conducting a regression model with trade intensity, intra-
industry trade, fiscal policy regulation and monetary policy coordination as independent
variables. The author also includes a dummy-variable for the post-crisis period. The author
finds positive impact of the intra-industry trade variable and the crisis-dummy variable. The
crisis-dummy variable illustrates that the relationship between trade intensity, intra-industry
trade and business cycle synchronization has strengthened after the crisis occurred among the
East Asian countries in the sample.
Cortina (2007) also analyze the intra-industry trade and business cycles among
ASEAN5 countries, however, he excludes the post-crisis period since other studies have found
evidence that the Asian financial crisis has increased the degree of supply, demand and
monetary shock correlation among ASEAN countries and by excluding the post-crisis period
the analysis should not be overestimated. The author also believe the Asian financial crisis has
4 Eight East Asian countries are included: People’s Republic of China, Indonesia, Japan, Republic of Korea,
Malaysia, Philippines, Singapore and Thailand. 5 ASEAN stands for Association of Southeast Asian Nations and includes 10 member countries

11
increased both economic integration and monetary and exchange rate cooperation in the
ASEAN countries.
The effects for the Asian financial crisis and Eurozone crisis illustrate opposite
effects, where an increase of the intra-industry trade has occurred after the crisis for the Asian
countries. The countries in the sample by Rana (2008) are quite similar in terms of economic
similarities where only Japan and Singapore have significantly higher GDP per capita levels
than the rest of the observed countries. The author only analyzes the trade among the
countries and not their international trade to other partner countries that might be different in
terms of economic structure. Therefore, the increase can be explained by the similarity among
the countries which has generated an increase of the intra-industry trade level.
2.5 Limitations
In the previous sections different approach to evaluate international trade has been reviewed.
Even though the Grubel-Lloyd index is the most popular measurement for intra-industry
trade, it has some limitations. According to Andresen (2003) an equal increase in the exports
and imports within an industry, from example trade liberalization, will raise the quantity of
intra-industry trade, while the index value remains the same. Further, inflation might also
raise an upward bias in the estimates, if the same quantity of exports or imports commands an
inflated price it will lead to an increased intra-industry trade that is only raised from a nominal
phenomenon. Using real-valued trade data will eliminate this bias, as well as the use constant
prices instead of current prices were the inflation is not controlled for. Finally, there might be
aggregation issues due to the classification systems. It exist different levels of classification
systems and different types of goods might be put together into the same class even though
the goods are significantly different, this is resolved by analyzing more detailed levels of data.
It is also important to remember that the Grubel-Lloyd index does not specify the level of
imports or exports between countries, just the level of two-way trade.
3. Method and data
The aim of the paper is to evaluate the effects of the Eurozone crisis and how the Swedish
intra-industry trade has changed since the crisis occurred year 2008. First, the data and
variables descriptions are specified followed by the theory and hypothesis of the paper.
Finally, the models that are used to conduct the later empirical part are specified.
3.1 Data and variable description
To be able to observe if the Eurozone crisis affected the intra-industry trade Sweden makes
with its partner countries, the industry sector machinery is selected for two reasons.
Firstly, according to OECD (2010) the international trade fell by 25 percent
between October 2008 and June 2009 in the OECD area, the sector mainly affected by the
decline is the machinery sector and an effect is therefore expected to be captured.

12
Secondly, machinery is Sweden’s largest export sector, and according to SCB
(2013) machinery contributes for 43.6 percent of Sweden’s total export products in year 2012.
Data is collected from Statistics Sweden (SCB) in 3-digit SITC level, which contains 4
subgroups where the category metalworking machinery consists of 55 percent of the total
exports and is the chosen product category for this paper. Due to larger classification
subgroups the data should not suffer from any aggregation issues.
Within the metalworking machinery category Sweden is export dominating
compared to its partner countries, specified in figure 3. Both Swedish exports and imports
declined during year 2009, while the exports have recovered during 2011. As previously
mentioned, the international trade declined during the crisis mainly due to a pricing effect
rather a change in volume, which could explain the decline in year 2009. The comparison
between Sweden’s export and imports before the crisis occurred, years 2002-2007, and during
the crisis period, years 2008-2011, show almost identical result even though there are
fluctuations over the years.
Figure 3: Average annual imports and exports between Sweden and European Union membership countries,
in thousands of Swedish kronor. Data collected from SCB.
The dependent variable of the model is the Grubel-Lloyd index that explains the
level of intra-industry trade within the metalworking machinery sector during the time period
2002-2011:
where Xi is exports of industry i, Mi is imports of industry i, is the net trade and
is the total trade. The index ranks between 0 and 1, where an index value if 1
indicates complete intra-industry trade. The model is limited only analyze the intra-industry
trade within European Union membership countries. However, the trade can be assumed to be
horizontally dominated since the partner countries are expected to have similar quality level
with different attributes rather than explaining trade between developed and developing
countries.
0
500 000
1 000 000
1 500 000
2 000 000
2 500 000
3 000 000
Swedish trade Imports and exports within Metalworking machinery
Imports
Exports
13
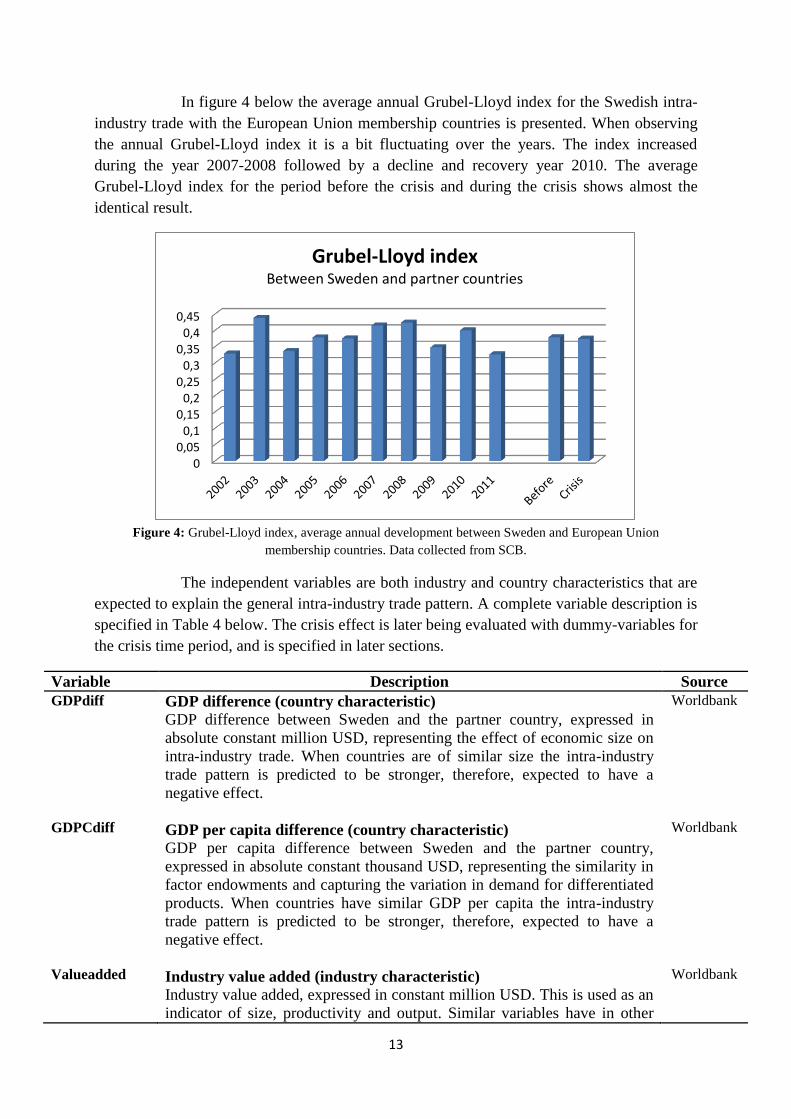
In figure 4 below the average annual Grubel-Lloyd index for the Swedish intra-
industry trade with the European Union membership countries is presented. When observing
the annual Grubel-Lloyd index it is a bit fluctuating over the years. The index increased
during the year 2007-2008 followed by a decline and recovery year 2010. The average
Grubel-Lloyd index for the period before the crisis and during the crisis shows almost the
identical result.
Figure 4: Grubel-Lloyd index, average annual development between Sweden and European Union
membership countries. Data collected from SCB.
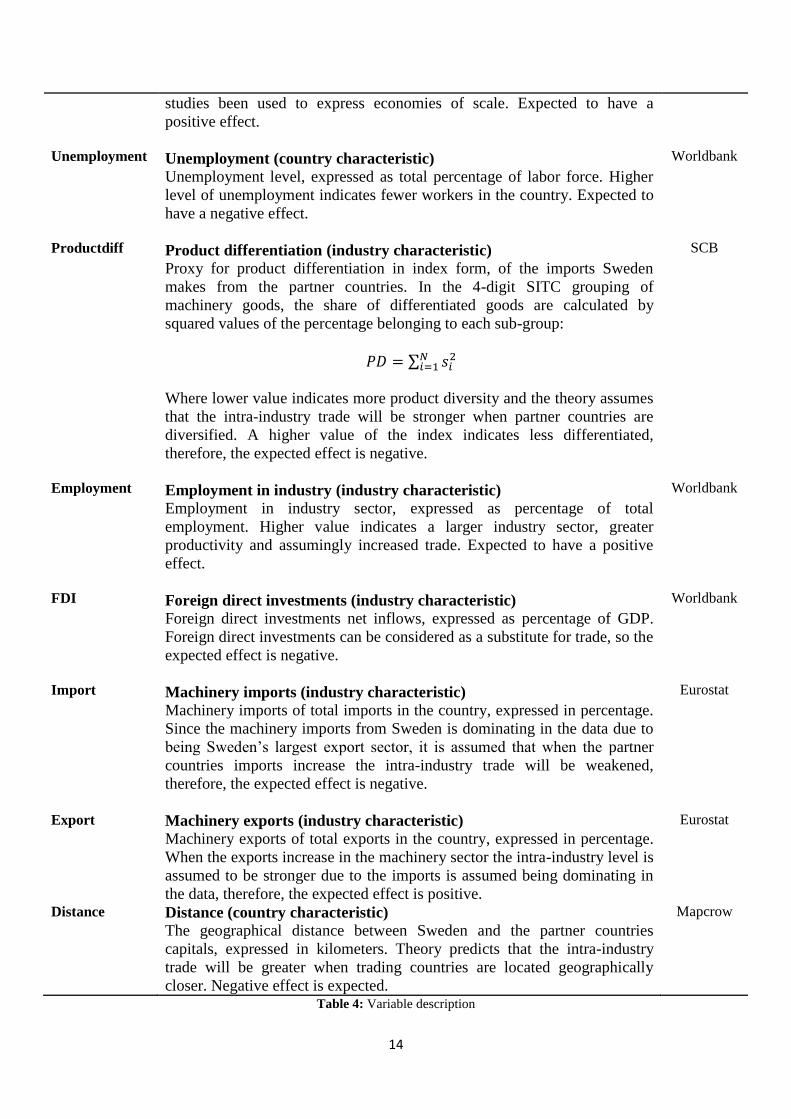
The independent variables are both industry and country characteristics that are
expected to explain the general intra-industry trade pattern. A complete variable description is
specified in Table 4 below. The crisis effect is later being evaluated with dummy-variables for
the crisis time period, and is specified in later sections.
Variable Description Source
GDPdiff GDP difference (country characteristic)
GDP difference between Sweden and the partner country, expressed in
absolute constant million USD, representing the effect of economic size on
intra-industry trade. When countries are of similar size the intra-industry
trade pattern is predicted to be stronger, therefore, expected to have a
negative effect.
Worldbank
GDPCdiff
GDP per capita difference (country characteristic)
GDP per capita difference between Sweden and the partner country,
expressed in absolute constant thousand USD, representing the similarity in
factor endowments and capturing the variation in demand for differentiated
products. When countries have similar GDP per capita the intra-industry
trade pattern is predicted to be stronger, therefore, expected to have a
negative effect.
Worldbank
Valueadded
Industry value added (industry characteristic)
Industry value added, expressed in constant million USD. This is used as an
indicator of size, productivity and output. Similar variables have in other
Worldbank
0 0,05
0,1 0,15
0,2 0,25
0,3 0,35
0,4 0,45
Grubel-Lloyd index Between Sweden and partner countries
14
studies been used to express economies of scale. Expected to have a
positive effect.
Unemployment
Unemployment (country characteristic)
Unemployment level, expressed as total percentage of labor force. Higher
level of unemployment indicates fewer workers in the country. Expected to
have a negative effect.
Worldbank
Productdiff
Product differentiation (industry characteristic)
Proxy for product differentiation in index form, of the imports Sweden
makes from the partner countries. In the 4-digit SITC grouping of
machinery goods, the share of differentiated goods are calculated by
squared values of the percentage belonging to each sub-group:
Where lower value indicates more product diversity and the theory assumes
that the intra-industry trade will be stronger when partner countries are
diversified. A higher value of the index indicates less differentiated,
therefore, the expected effect is negative.
SCB
Employment
Employment in industry (industry characteristic)
Employment in industry sector, expressed as percentage of total
employment. Higher value indicates a larger industry sector, greater
productivity and assumingly increased trade. Expected to have a positive
effect.
Worldbank
FDI
Foreign direct investments (industry characteristic)
Foreign direct investments net inflows, expressed as percentage of GDP.
Foreign direct investments can be considered as a substitute for trade, so the
expected effect is negative.
Worldbank
Import
Machinery imports (industry characteristic)
Machinery imports of total imports in the country, expressed in percentage.
Since the machinery imports from Sweden is dominating in the data due to
being Sweden’s largest export sector, it is assumed that when the partner
countries imports increase the intra-industry trade will be weakened,
therefore, the expected effect is negative.
Eurostat
Export Machinery exports (industry characteristic)
Machinery exports of total exports in the country, expressed in percentage.
When the exports increase in the machinery sector the intra-industry level is
assumed to be stronger due to the imports is assumed being dominating in
the data, therefore, the expected effect is positive.
Eurostat
Distance Distance (country characteristic)
The geographical distance between Sweden and the partner countries
capitals, expressed in kilometers. Theory predicts that the intra-industry
trade will be greater when trading countries are located geographically
closer. Negative effect is expected.
Mapcrow
Table 4: Variable description
15
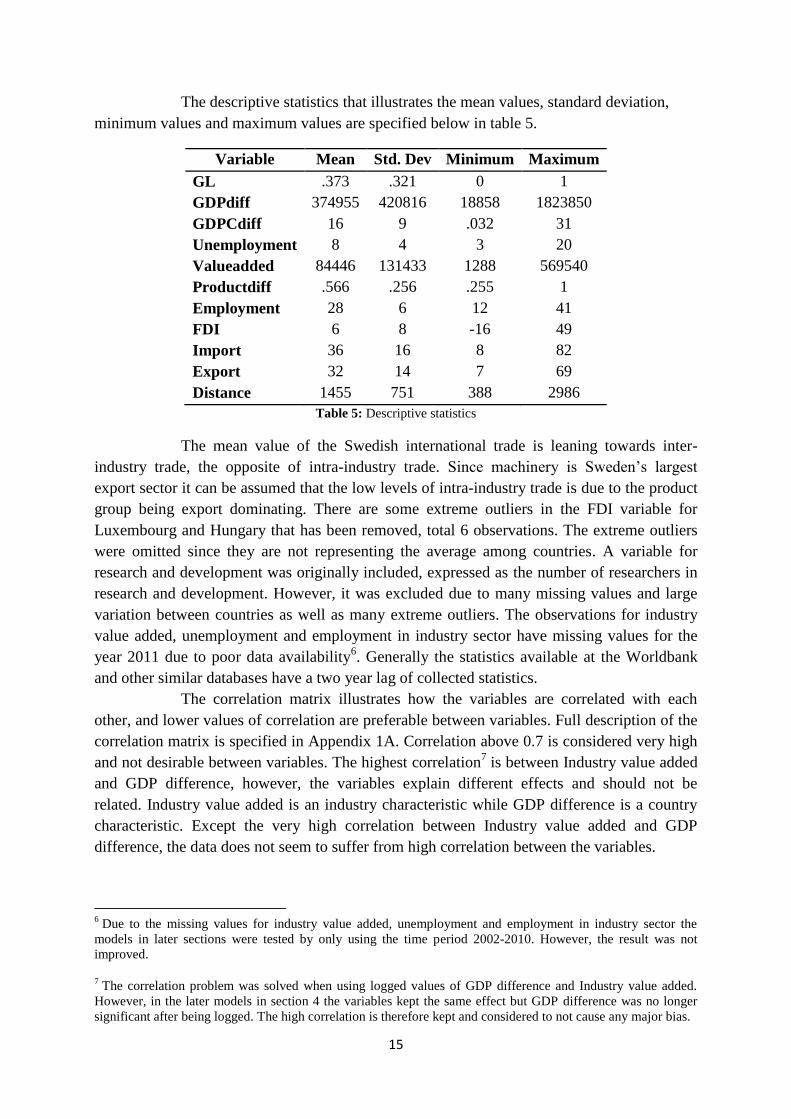
The descriptive statistics that illustrates the mean values, standard deviation,
minimum values and maximum values are specified below in table 5.
Variable Mean Std. Dev Minimum Maximum
GL .373 .321 0 1
GDPdiff 374955 420816 18858 1823850
GDPCdiff 16 9 .032 31
Unemployment 8 4 3 20
Valueadded 84446 131433 1288 569540
Productdiff .566 .256 .255 1
Employment 28 6 12 41
FDI 6 8 -16 49
Import 36 16 8 82
Export 32 14 7 69
Distance 1455 751 388 2986
Table 5: Descriptive statistics
The mean value of the Swedish international trade is leaning towards inter-
industry trade, the opposite of intra-industry trade. Since machinery is Sweden’s largest
export sector it can be assumed that the low levels of intra-industry trade is due to the product
group being export dominating. There are some extreme outliers in the FDI variable for
Luxembourg and Hungary that has been removed, total 6 observations. The extreme outliers
were omitted since they are not representing the average among countries. A variable for
research and development was originally included, expressed as the number of researchers in
research and development. However, it was excluded due to many missing values and large
variation between countries as well as many extreme outliers. The observations for industry
value added, unemployment and employment in industry sector have missing values for the
year 2011 due to poor data availability6. Generally the statistics available at the Worldbank
and other similar databases have a two year lag of collected statistics.
The correlation matrix illustrates how the variables are correlated with each
other, and lower values of correlation are preferable between variables. Full description of the
correlation matrix is specified in Appendix 1A. Correlation above 0.7 is considered very high
and not desirable between variables. The highest correlation7 is between Industry value added
and GDP difference, however, the variables explain different effects and should not be
related. Industry value added is an industry characteristic while GDP difference is a country
characteristic. Except the very high correlation between Industry value added and GDP
difference, the data does not seem to suffer from high correlation between the variables.
6 Due to the missing values for industry value added, unemployment and employment in industry sector the
models in later sections were tested by only using the time period 2002-2010. However, the result was not
improved.
7 The correlation problem was solved when using logged values of GDP difference and Industry value added.
However, in the later models in section 4 the variables kept the same effect but GDP difference was no longer
significant after being logged. The high correlation is therefore kept and considered to not cause any major bias.
16
3.2 Theory and hypothesis
The trade theories assume that the intra-industry trade is stronger when partner countries have
similar economic structure, development and market size. According to Krugman (1994) is
much of the world trade between countries similar factor endowments and similar countries
has greater intra-industry intensity. The two-way trade exists since firms in different
countries produce different differentiated products. Krugman (1994) claims that the gains of
trade are due to greater varieties of goods, and consumers prefer more varieties to choose
from on the market. The preference of more varieties can therefore be assumed to correlate
with consumer demand. Since the consumer confidence has decreased as a consequence of the
crisis, and consumers have started to save more instead of consuming, the consumer demand
is expected to decrease as well. Therefore, a change in the intra-industry trade is expected,
however, the hypothesis regarding intra-industry trade effects are different depending on the
partner countries economic similarity compared to Sweden.
In figure 3 in previous section it was evident that Swedish imports and exports
are remaining on similar levels before and during the crisis period. One explanation could be
long-term contracts that are less sensitive when a crisis occurs. According to Johansson
(1991) an interaction between economic agents are usually based on some form of
agreements, and a contract becomes more important when it is set on long-term relation. Due
to the possibility of long-term agreements between Sweden and partner countries the intra-
industry trade for some countries might not be as affected by a crisis.
The theory regarding how a crisis affects the intra-industry trade is limited, and
the hypothesis of this paper is being based on the similarity between countries economic
structures, decreased consumer demand as well as how the Swedish trade has changed in
terms of imports and exports from the previous section.
Since the overall imports and exports Sweden makes with the European Union
membership countries has stayed at similar levels before and after the crisis, an effect from
the crisis is still expected. An unchanged or positive effect in the intra-industry trade is
expected when partner countries have similar economic structure since the countries will
experience similar changes which will not affect the two-way trade level dramatically. The
intra-industry effect is expected to be negative when the differences between countries are
larger since the gap between economies will be greater and the change in consumer demand
might be more evident in these countries.
There are three hypotheses that are tested in section 4, and the effects are being
evaluated by dummy variables in the models:
i) The overall intra-industry trade is expected to be unchanged or with small effects
after a crisis occurs:
An unchanged or small change in the level of intra-industry trade is expected from the
period after the crisis occurs, for the Swedish trade with all European Union membership
countries. However, since countries are affected in different degrees and the economic
structure is different across countries, the potential small effect is expected to be negative.
17
ii) The intra-industry trade between Sweden and partner countries with similar
economic structure is expected to be unchanged or with positive effect after a crisis
occurs:
It is assumed that the trade between similar economies will have the similar effect of the
crisis which would generate the same level of two-way trade as before the crisis. The
expected effect is therefore an unchanged or small change in the intra-industry trade level.
The small change is expected to be positive since the trade between similar economies,
which in this case also is mainly richer economies, is predicted to be stronger and faster
recovered by the crisis.
iii) The intra-industry trade between Sweden and partner countries with large
dissimilar economic structures is expected to be negative after a crisis occurs:
When partner countries have large differences in economic structures, the theory predicts
weaker intra-industry trade intensity. If a crisis occurs, the hypothesis is that the difference
in trade will become even larger and have a negative effect. The partner countries
international trade is expected to decline more than Sweden’s due to decreased consumer
demand and larger gap between economies. This is due to Sweden’s relatively fast recovery
from the crisis and the countries with large dissimilarities in economic structures are
expected to be affected by the crisis in a greater degree.
3.3 Models
There will be two forms of regression models used in the following section where the
empirical results are presented. Since the data is multi-dimensional with multiple time periods
and cross-sectional units of countries, a panel data approach is the chosen method.
A panel data approach with Hausman test for Random or Fixed effects, with
robust standard errors, is the first model.
The second model is a Tobit panel data model with bootstrapped standard errors,
which is a replication of the standard errors that makes them robust, since robust option is not
available for Tobit models. Tobit model is developed by Tobin (1958) who finds that in
household surveys many variables have lower, or upper, limits when it comes to household
spending. Even if the variable could be positive or negative it could not be smaller than the
negative of the household’s holdings of liquid assets since a household cannot liquidate more
assets than it owns. Therefore, a Tobit model makes it possible to set upper and lower levels
of censoring on the variables, which is desirable in this paper when dealing with index as the
dependent variable. In the model in next sections censoring is set between 0 and 1, which is
the ranking of the Grubel-Lloyd index.
4. Results
The result part is divided into three sections where more detailed levels are being observed in
different steps. First, the crisis period effect is evaluated for all European Union membership
18
countries. Next, cluster of countries sorted by GDP per capita differences are integrated with
the crisis time period and used as dummy variables, to see the crisis effect based on the
similarity between countries. Last, an integrated dummy variable for each country and crisis
period is generated to see which economies are mainly affected by the crisis.
4.1 Crisis effect
The hypothesis is that the intra-industry trade will be unchanged or weakened when a crisis
occurs for the trade between Sweden and the European Union membership countries. The
estimated regression model for the crisis period effect includes the country and industry
characteristics as well as the dummy variable for the crisis period 2008-2011:
Hausman test estimates if a Fixed or Random effect is more appropriate for the
data, and in this case it predicts a Random effect model. Random effect panel data model with
robust standard errors and Tobit panel data model with bootstrapped standard errors are
estimated. Both of the regression models show similar results, which is positive for the
models credibility, and are specified below with their respective significance levels.
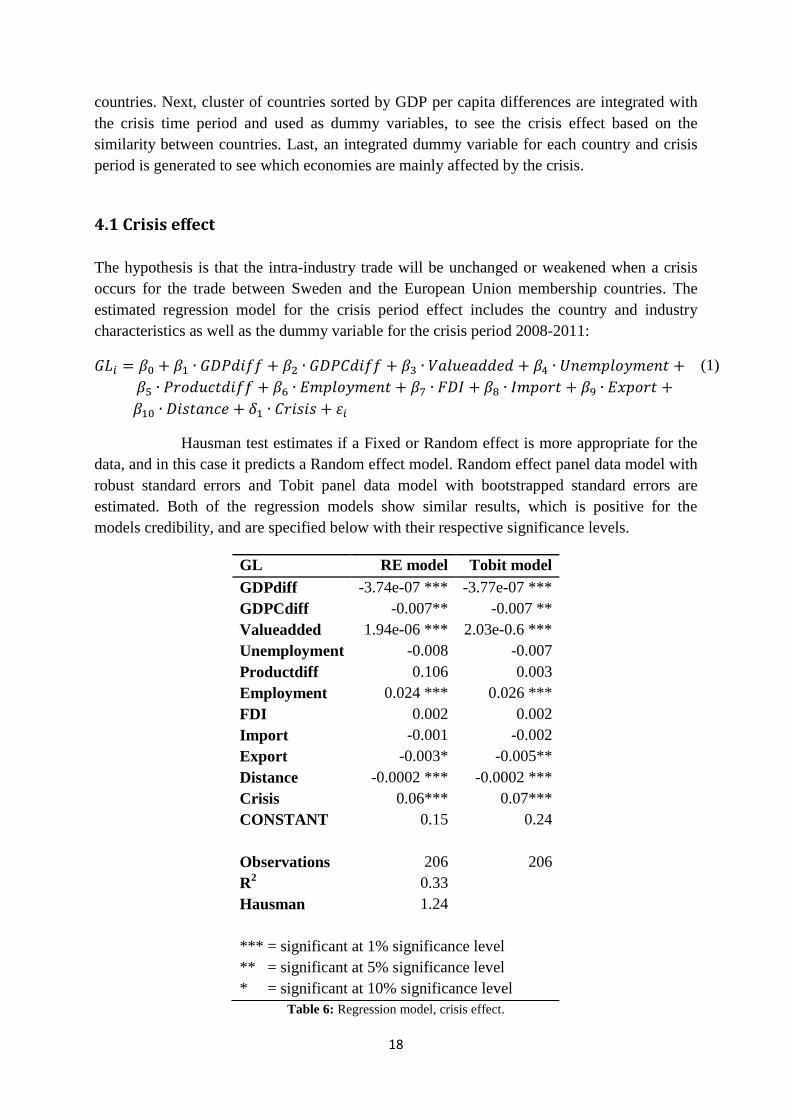
Table 6: Regression model, crisis effect.
GL RE model Tobit model
GDPdiff -3.74e-07 *** -3.77e-07 ***
GDPCdiff -0.007** -0.007 **
Valueadded 1.94e-06 *** 2.03e-0.6 ***
Unemployment -0.008 -0.007
Productdiff 0.106 0.003
Employment 0.024 *** 0.026 ***
FDI 0.002 0.002
Import -0.001 -0.002
Export -0.003* -0.005**
Distance -0.0002 *** -0.0002 ***
Crisis 0.06*** 0.07***
CONSTANT 0.15 0.24
Observations 206 206
R2 0.33
Hausman 1.24
*** = significant at 1% significance level
** = significant at 5% significance level
* = significant at 10% significance level
(1)
19
The dummy variable for the crisis period is highly significant in both models
and is relatively small and positive. This indicates that the crisis has increased the level of
intra-industry trade between Sweden and the European Union membership countries. As
emphasized previously, the increase of two-way trade can be raised from a decline in the
international trade in terms of imports and exports, however, the two-way trade is a bit more
equalized after the crisis occurred than the time period before. This indicates that the
Eurozone crisis has not had a negative effect on the Swedish trade with its partner countries in
terms of two-way trade.
GDP difference between Sweden and the partner country show a significant
negative effect, which is consistent with the theory that countries of equal size have more
intra-industry trade intensity. When a partnering country increases their GDP difference, the
intra-industry trade will decrease due to a larger gap between economies.
GDP per capita difference has similar interpretation as GDP difference while
GDP per capita difference describes the consumers and demand. The negative significant
effect suggests that similar economies have greater intra-industry trade.
Industry value added is significant and positive, indicating that when the
partnering countries are more productive the intra-industry trade level will increase. Industry
value added can also be seen as a proxy for economies of scale, and when the country is
engaged in economies of scale productions the intra-industry trade will be stronger.
Unemployment was in advance predicted to have negative effect, when an
economy has more unemployed workers the productivity will decrease. The variable has the
expected sign in both models, however they are not significant. This is probably due to the
variation in unemployment is similar across the observations and time.
The insignificance of the product differentiation variable in both models can be
explained by the fact that the variable only captures the product differentiation in the Swedish
imports from the partner countries, the values do not describe the overall product
differentiation in the country for the machinery sector. The variable also indicates a positive
effect while the opposite was expected. A different proxy for the product differentiation
would have been desirable, however, was not possible to find.
Employment in the industry sector has a significant and positive effect, when the
employment in the industry sector increases the level of intra-industry trade will be stronger.
A greater workforce is associated with higher productivity levels.
Foreign direct investment has an insignificant and positive effect. The positive
effect is not consistent with the theory that predicted a negative effect due to foreign direct
investments could be considered a substitute for trade. However, it would fit the assumption
that foreign direct investments generate larger exports from the host country to the home
country, which would have a positive effect on the intra-industry trade. The variables
insignificance is probably due to uneven variations over the years, both before and after the
crisis period.
Machinery industries import as a share of total import is insignificant and
negative. A possible explanation for the insignificant result is that the machinery imports have
stayed at similar levels during the whole period.
20
Machinery exports as a share of total exports is significant and negative. This is
not consistent with the hypothesis made in advance. The hypothesis was based on that
Sweden is export dominating and if the partner countries exports increase, the trade would
become more equalized and have a positive effect. However, this variable represents the
partner countries total machinery exports to all countries they are trading with, which is
probably the reason for the incoherent result. The result suggests that if the partner country
increases their machinery export the intra-industry trade will become weaker. There are other
countries than Sweden that are export dominating within machinery sector, Germany as an
example8, where a negative effect would be expected. If a variable that represented each
partner countries share of machinery exports of total exports to Sweden the result would
probably have been more accurate.
Distance is significant with a negative effect, which indicates that the intra-
industry trade will be weaker when the partner country is located further away. This is due to
higher transportation and information costs associated with distance.
4.2 Cluster effects
Next, the estimated regression model includes clusters of countries based on their absolute
GDP per capita difference levels to see if the partner countries are affected differently
regarding economic similarities compared to Sweden. GDP per capita is commonly used as a
proxy to describe the consumers and demand. List of which countries belong to each cluster is
specified in Appendix 2A. The dummy variables are an interaction between the clusters the
countries are belonging to and the crisis time period.
The countries are divided into clusters depending on the average GDP per capita
differences during the total time period 2002-2011:
Low difference indicates an absolute GDP difference lower than 10 000 constant USD
(Cluster Low).
Medium difference indicates an absolute GDP difference between 10 000 - 20 000
constant USD (Cluster Medium).
Large difference indicates an absolute GDP difference greater than 20 000 constant
USD (Cluster Large).
Several different clustering categories were tested while three groups of clustering was the
best way to capture an effect and appear most appropriate. Generally the countries belonging
to the clusters with large GDP per capita difference are poorer countries since Sweden is a
strong economy. However, Luxembourg9 is a significantly richer country than Sweden in
terms of GDP per capita level and is included in the large difference cluster since it is the
economic difference that is taken into account.
In figure 5 below the Grubel-Lloyd index for the different clusters is presented.
The cluster with low difference in GDP per capita in comparison to Sweden has increased
8 According to Trading Economics (2012) machinery is Germanys second largest export sector after cars.
9 The clustering was also tested by grouping of countries GDP per capita level without using the difference
relative to Sweden. However, the result was almost identical and the theory is mainly based on economic
similarities.
21
0
0,1
0,2
0,3
0,4
0,5
0,6
Low Medium Large
Grubel-Lloyd index Between Sweden and clustered partner countries
Before
Crisis
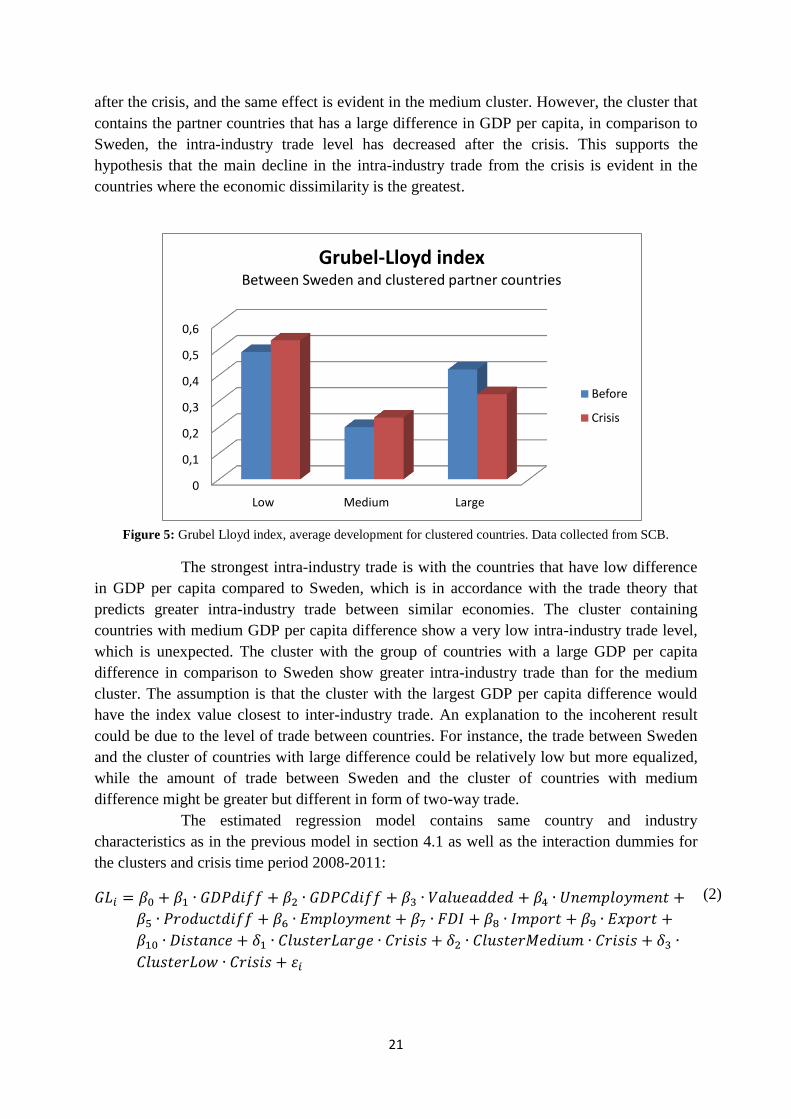
after the crisis, and the same effect is evident in the medium cluster. However, the cluster that
contains the partner countries that has a large difference in GDP per capita, in comparison to
Sweden, the intra-industry trade level has decreased after the crisis. This supports the
hypothesis that the main decline in the intra-industry trade from the crisis is evident in the
countries where the economic dissimilarity is the greatest.
Figure 5: Grubel Lloyd index, average development for clustered countries. Data collected from SCB.
The strongest intra-industry trade is with the countries that have low difference
in GDP per capita compared to Sweden, which is in accordance with the trade theory that
predicts greater intra-industry trade between similar economies. The cluster containing
countries with medium GDP per capita difference show a very low intra-industry trade level,
which is unexpected. The cluster with the group of countries with a large GDP per capita
difference in comparison to Sweden show greater intra-industry trade than for the medium
cluster. The assumption is that the cluster with the largest GDP per capita difference would
have the index value closest to inter-industry trade. An explanation to the incoherent result
could be due to the level of trade between countries. For instance, the trade between Sweden
and the cluster of countries with large difference could be relatively low but more equalized,
while the amount of trade between Sweden and the cluster of countries with medium
difference might be greater but different in form of two-way trade.
The estimated regression model contains same country and industry
characteristics as in the previous model in section 4.1 as well as the interaction dummies for
the clusters and crisis time period 2008-2011:
(2)
22
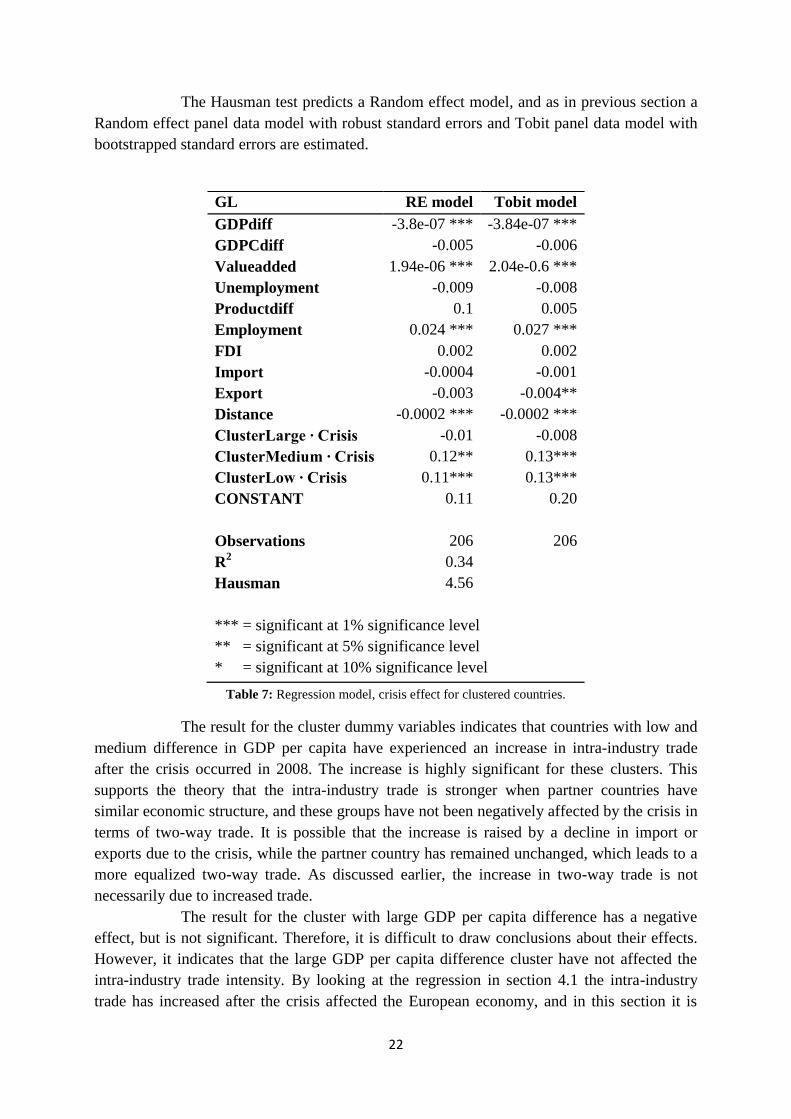
The Hausman test predicts a Random effect model, and as in previous section a
Random effect panel data model with robust standard errors and Tobit panel data model with
bootstrapped standard errors are estimated.
Table 7: Regression model, crisis effect for clustered countries.
The result for the cluster dummy variables indicates that countries with low and
medium difference in GDP per capita have experienced an increase in intra-industry trade
after the crisis occurred in 2008. The increase is highly significant for these clusters. This
supports the theory that the intra-industry trade is stronger when partner countries have
similar economic structure, and these groups have not been negatively affected by the crisis in
terms of two-way trade. It is possible that the increase is raised by a decline in import or
exports due to the crisis, while the partner country has remained unchanged, which leads to a
more equalized two-way trade. As discussed earlier, the increase in two-way trade is not
necessarily due to increased trade.
The result for the cluster with large GDP per capita difference has a negative
effect, but is not significant. Therefore, it is difficult to draw conclusions about their effects.
However, it indicates that the large GDP per capita difference cluster have not affected the
intra-industry trade intensity. By looking at the regression in section 4.1 the intra-industry
trade has increased after the crisis affected the European economy, and in this section it is
GL RE model Tobit model
GDPdiff -3.8e-07 *** -3.84e-07 ***
GDPCdiff -0.005 -0.006
Valueadded 1.94e-06 *** 2.04e-0.6 ***
Unemployment -0.009 -0.008
Productdiff 0.1 0.005
Employment 0.024 *** 0.027 ***
FDI 0.002 0.002
Import -0.0004 -0.001
Export -0.003 -0.004**
Distance -0.0002 *** -0.0002 ***
ClusterLarge ∙ Crisis -0.01 -0.008
ClusterMedium ∙ Crisis 0.12** 0.13***
ClusterLow ∙ Crisis 0.11*** 0.13***
CONSTANT 0.11 0.20
Observations 206 206
R2 0.34
Hausman 4.56
*** = significant at 1% significance level
** = significant at 5% significance level
* = significant at 10% significance level
23
evident that the low and medium GDP per capita difference economies are reasons for the
increase. Since it is not possible to draw conclusions about the countries with large GDP per
capita difference, it can be assumed that they are at least not one of the sources for the
increase.
The country and industry characteristics are not going to be discussed again,
since the result is similar to the earlier model. The difference now is that the GDP per capita
difference variable is no longer significant, however the effect should be captured in the
dummy variables. Machinery export as a share of total exports is no longer significant in the
Random-effect model either.
4.3 Country effects
So far an increase of the Swedish intra-industry trade intensity has been observed for all
European Union countries during the crisis period 2008-2011, as well as it seem to be mainly
the low and medium GDP per capita difference clusters that have been sources for the
increase. Since the large GDP per capita difference cluster was insignificant in the previous
model, the last regression model looks at each country separately.
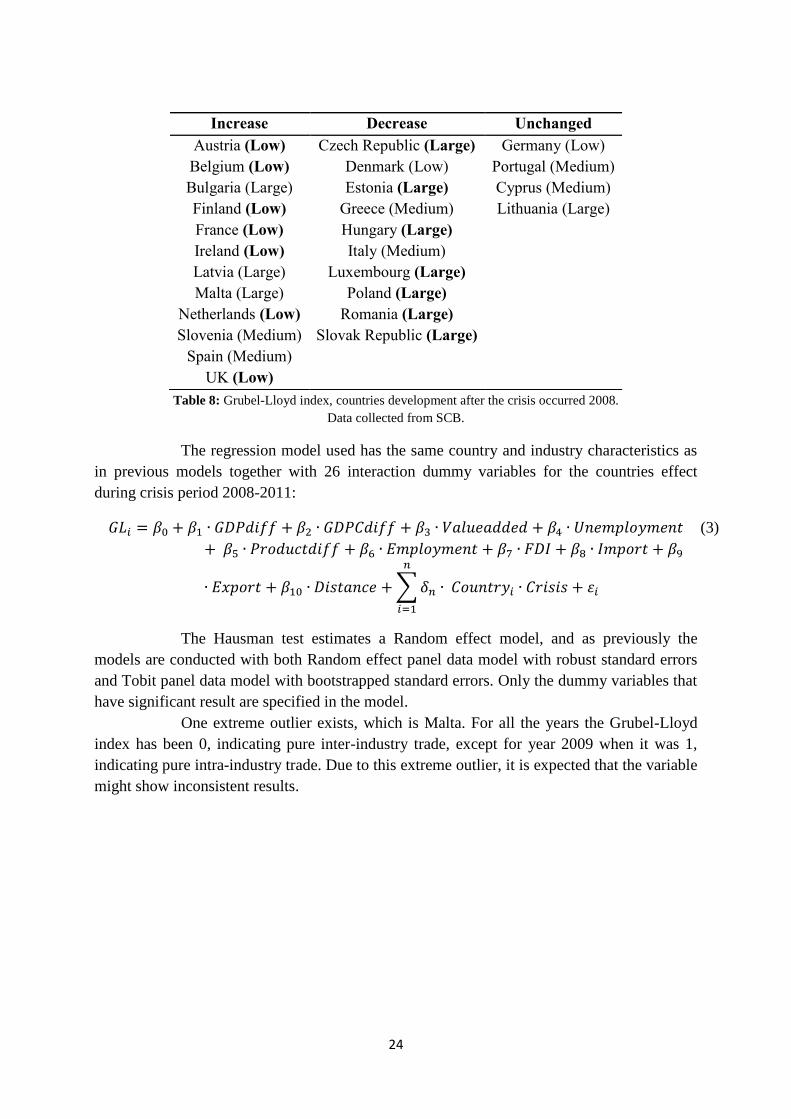
In table 8 below each country is sorted in categories to see if the countries
Grubel-Lloyd index has increased, decreased or stayed more or less unchanged during the
crisis period 2008-2011 compared to before the crisis. Full description of each countries
individual Grubel-Lloyd index difference can be observed in Appendix 3A. It is evident that
increased intra-industry trade after the crisis are dominated by countries with low GDP per
capita difference, and the countries that has a decreased intra-industry trade are mainly those
countries that has a large GDP per capita difference. This supports the hypothesis that
countries with large GDP per capita difference are those who will experience a decreased
intra-industry trade level due to the crisis.
24
Table 8: Grubel-Lloyd index, countries development after the crisis occurred 2008.
Data collected from SCB.
The regression model used has the same country and industry characteristics as
in previous models together with 26 interaction dummy variables for the countries effect
during crisis period 2008-2011:
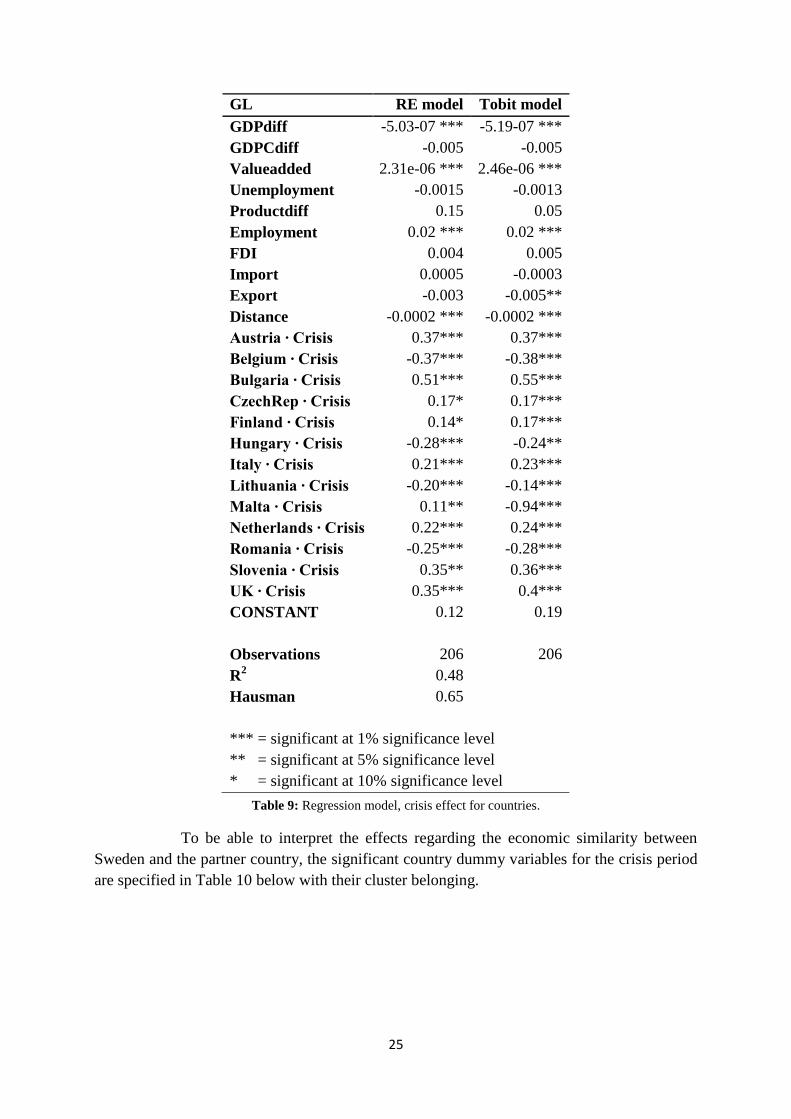
The Hausman test estimates a Random effect model, and as previously the
models are conducted with both Random effect panel data model with robust standard errors
and Tobit panel data model with bootstrapped standard errors. Only the dummy variables that
have significant result are specified in the model.
One extreme outlier exists, which is Malta. For all the years the Grubel-Lloyd
index has been 0, indicating pure inter-industry trade, except for year 2009 when it was 1,
indicating pure intra-industry trade. Due to this extreme outlier, it is expected that the variable
might show inconsistent results.
Increase Decrease Unchanged
Austria (Low) Czech Republic (Large) Germany (Low)
Belgium (Low) Denmark (Low) Portugal (Medium)
Bulgaria (Large) Estonia (Large) Cyprus (Medium)
Finland (Low) Greece (Medium) Lithuania (Large)
France (Low) Hungary (Large)
Ireland (Low) Italy (Medium)
Latvia (Large) Luxembourg (Large)
Malta (Large) Poland (Large)
Netherlands (Low) Romania (Large)
Slovenia (Medium) Slovak Republic (Large)
Spain (Medium)
UK (Low)
(3)
25
Table 9: Regression model, crisis effect for countries.
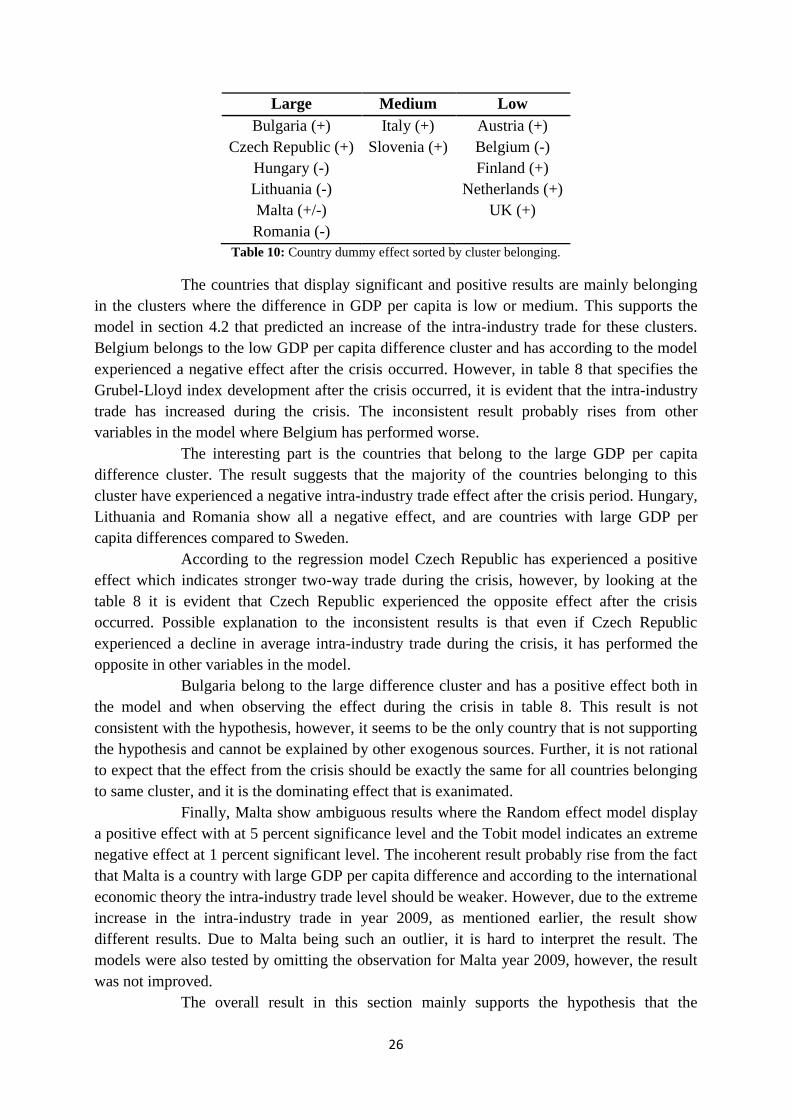
To be able to interpret the effects regarding the economic similarity between
Sweden and the partner country, the significant country dummy variables for the crisis period
are specified in Table 10 below with their cluster belonging.
GL RE model Tobit model
GDPdiff -5.03-07 *** -5.19-07 ***
GDPCdiff -0.005 -0.005
Valueadded 2.31e-06 *** 2.46e-06 ***
Unemployment -0.0015 -0.0013
Productdiff 0.15 0.05
Employment 0.02 *** 0.02 ***
FDI 0.004 0.005
Import 0.0005 -0.0003
Export -0.003 -0.005**
Distance -0.0002 *** -0.0002 ***
Austria ∙ Crisis 0.37*** 0.37***
Belgium ∙ Crisis -0.37*** -0.38***
Bulgaria ∙ Crisis 0.51*** 0.55***
CzechRep ∙ Crisis 0.17* 0.17***
Finland ∙ Crisis 0.14* 0.17***
Hungary ∙ Crisis -0.28*** -0.24**
Italy ∙ Crisis 0.21*** 0.23***
Lithuania ∙ Crisis -0.20*** -0.14***
Malta ∙ Crisis 0.11** -0.94***
Netherlands ∙ Crisis 0.22*** 0.24***
Romania ∙ Crisis -0.25*** -0.28***
Slovenia ∙ Crisis 0.35** 0.36***
UK ∙ Crisis 0.35*** 0.4***
CONSTANT 0.12 0.19
Observations 206 206
R2 0.48
Hausman 0.65
*** = significant at 1% significance level
** = significant at 5% significance level
* = significant at 10% significance level
26
Large Medium Low
Bulgaria (+) Italy (+) Austria (+)
Czech Republic (+) Slovenia (+) Belgium (-)
Hungary (-) Finland (+)
Lithuania (-) Netherlands (+)
Malta (+/-) UK (+)
Romania (-)
Table 10: Country dummy effect sorted by cluster belonging.
The countries that display significant and positive results are mainly belonging
in the clusters where the difference in GDP per capita is low or medium. This supports the
model in section 4.2 that predicted an increase of the intra-industry trade for these clusters.
Belgium belongs to the low GDP per capita difference cluster and has according to the model
experienced a negative effect after the crisis occurred. However, in table 8 that specifies the
Grubel-Lloyd index development after the crisis occurred, it is evident that the intra-industry
trade has increased during the crisis. The inconsistent result probably rises from other
variables in the model where Belgium has performed worse.
The interesting part is the countries that belong to the large GDP per capita
difference cluster. The result suggests that the majority of the countries belonging to this
cluster have experienced a negative intra-industry trade effect after the crisis period. Hungary,
Lithuania and Romania show all a negative effect, and are countries with large GDP per
capita differences compared to Sweden.
According to the regression model Czech Republic has experienced a positive
effect which indicates stronger two-way trade during the crisis, however, by looking at the
table 8 it is evident that Czech Republic experienced the opposite effect after the crisis
occurred. Possible explanation to the inconsistent results is that even if Czech Republic
experienced a decline in average intra-industry trade during the crisis, it has performed the
opposite in other variables in the model.
Bulgaria belong to the large difference cluster and has a positive effect both in
the model and when observing the effect during the crisis in table 8. This result is not
consistent with the hypothesis, however, it seems to be the only country that is not supporting
the hypothesis and cannot be explained by other exogenous sources. Further, it is not rational
to expect that the effect from the crisis should be exactly the same for all countries belonging
to same cluster, and it is the dominating effect that is exanimated.
Finally, Malta show ambiguous results where the Random effect model display
a positive effect with at 5 percent significance level and the Tobit model indicates an extreme
negative effect at 1 percent significant level. The incoherent result probably rise from the fact
that Malta is a country with large GDP per capita difference and according to the international
economic theory the intra-industry trade level should be weaker. However, due to the extreme
increase in the intra-industry trade in year 2009, as mentioned earlier, the result show
different results. Due to Malta being such an outlier, it is hard to interpret the result. The
models were also tested by omitting the observation for Malta year 2009, however, the result
was not improved.
The overall result in this section mainly supports the hypothesis that the

27
countries with small and medium GDP per capita difference have not been affected negatively
by the Eurozone crisis, while it suggests that the Swedish trade with countries with large GDP
per capita difference has declined and made the gap between trading countries greater.
The results of the country and industry characteristics are similar to the model in
section 4.2, where GDP per capita difference is insignificant and Exports in machinery sector
is insignificant in the Random-effect model. Machinery imports as a share of total imports
illustrate different effects in the Random effect and Tobit model, however, the variable is still
insignificant. Due to the similar result they are not being discussed further.
5. Conclusions
The aim of the paper is to evaluate if the Eurozone crisis has changed the intra-industry trade
between Sweden and the European Union membership countries, by analyzing the
metalworking machinery sector. The hypothesis predicts unchanged or positive intra-industry
intensity between partner countries with similar economic structures, since a decline in trade
would occur for Sweden as well as the partner countries, which would lead to similar intra-
industry trade as before the crisis. However, when there exist a larger difference between
economies the intra-industry trade is expected to decrease even further after a crisis occurs
due to increased gap between countries economic structure and consumer demand.
The first model illustrates a small and significant increase in the intra-industry
trade between Sweden and all European Union membership countries during the Eurozone
crisis. The two-way trade was expected to be unchanged or negative in advance, however, it
has become a bit more equalized. As emphasized previously, the increase could be due to
lower international trade between countries which makes the simultaneous imports and
exports between economies more equalized.
The second model analyzes the difference between countries absolute GDP per
capita differences and the hypothesis is that a decline would be evident in the cluster of
countries where the difference is greater. The large GDP per capita difference cluster is not
significant even if it indicates the expected negative effect. The countries with small and
medium differences, however, indicate an increase in the intra-industry intensity and are in
accordance with the hypothesis made in advance.
To be able to further investigate if the cluster of countries with large GDP per
capita difference are those with the greatest negative effect, the last model analyzes each
countries change during the crisis. The countries that mainly indicate a decline in intra-
industry trade are those with large GDP per capita difference, and the countries belonging to
small and medium GDP per capita difference clusters primarily indicate positive effects.
To summarize, the hypothesis of an unchanged or small change in the intra-
industry trade between countries with similar economic structure is supported. The Swedish
partner countries with small or medium GDP per capita difference has experienced an
increase of intra-industry trade, which indicates that the two-way trade has become more
equalized when the partner-country has similar economic structure as Sweden. Reasons for
why these economies have experienced a positive effect could be due to similar changes
among Sweden and these partner countries or due to long-term agreements that are less

28
sensitive of the occurrence of a crisis.
The hypothesis of decreased trade between Sweden and countries with large
GDP per capita difference display insignificant results in the second model and decline in the
last model with country dummies for the crisis period. In accordance with the trade theory this
cluster should experience weaker intra-industry trade, and the hypothesis is even further
declined intra-industry trade after the crisis due to larger gap between economies which is
supported. A potential explanation for the decrease is that Sweden was faster recovered from
the crisis, while the countries with larger GDP per capita difference rather were affected in a
greater degree by the crisis, and has not recovered which has resulted in a decline of the two-
way trade. A price-effect was the main reason for decline in international trade in OECD area
due to the crisis, and it could possible been affected the cluster of countries with large
economic dissimilarities in a larger extent which has led to decreased intra-industry trade. If
the source of the decline is raised from decreased demand from the partner countries, which
would indicate lower imports from Sweden, or if the partner countries production has
decrease which results in decreased exports to Sweden, the index does not reveal. However,
since Sweden is export dominating in the data, it could be assumed that the decline in intra-
industry trade probably rises from decreased exports for the partner country to Sweden.
The findings in this paper are similar to the previous literature, where
Toporowski (2012) find a negative effect of the Eurozone crisis when comparing intra-
industry trade between countries with larger GDP per capita levels and Rana (2008) find a
positive effect of the intra-industry after the Asian financial crisis trade among countries with
mainly similar GDP per capita levels. Economic similarities are according to the theory a
strong determinant for the intra-industry intensity which is further supported in this paper.
The limited literature regarding intra-industry trade effects after the financial
crisis is probably due to the crisis is still ongoing in the economy and a broader research field
is expected in the future. It would be interesting to evaluate the crisis effect when the
European economy is recovered and analyze if the intra-industry trade returns to its original
levels. It is also possible to evaluate if the crisis effect was different in horizontally and
vertically intra-industry aspects, as well as look into other sectors that is not export
dominating by Sweden.
29
References
Literature:
Andresen, M. A. (2003). “Empirical intra-industry trade: what we know and what we
need to know”. University of British Columbia and Institute for Canadian Urban Research
Studies.
Balassa, B. (1966). “Tariff Reductions and Trade in Manufacturers among the
Industrial Countries”. The American Economic Review , Vol. 56, No. 3 page 466-473.
Balassa, B. and Bauwens, L. (1987). ”Intra-Industry Specialisation in a Multi-Industry
Framework”. The Economic Journal, Vol. 97, No 388 (Dec 1987), page 923-939.
Bibow, J. (2012). “The Euroland crisis and Germany’s euro trilemma”. International Review
of Applied Economics, DOI:10.
Cortinhas, C. ”Intra-industry trade and business cycles in ASEAN”. Applied Economics,
2007, 39, page 893-902.
Fainštein, G. and Netšunajev, A. (2010) “Foreign Trade Patterns Between Estonia
and the EU”. International Atlantic Economic Society 2010, 6:311–324.
Grubel, H. G. and Lloyd, P. J. (1971). "The Empirical Measurement of Intra-Industry
Trade". Economic Record 47 (4), page 494–517.
Grubel, H. G. and Lloyd, P. J. (1975). “Intra-industry trade: the theory and
measurement of international trade in differentiated products”. New York: Wiley.
Ito, T. and Okubo, T. (2012). “New Aspects of Intra-industry Trade in EU countries”.
The World Economy, Vol. 35, Issue 9, page 1126-2238. September 2012.
Johansson, B. (1991). “Economic Networks and Self-Organization”. Mansell, London.
Krugman, P.R. (1994). “Rethinking international trade”. The MIT Press, Cambridge.
OECD (2010). “OECD Economic Globalisation Indicators 2010”. OECD, Publishing,
Paris. No. 57355 2010.
Papazoglou, C., Pentecost, E.J., and Marques, H. (2006). “A Gravity Model Forecast of
the Potential Trade Effects of EU Enlargement: Lessons from 2004 and Path-dependency
in Integration” The World Economy, vol. 29, no.8, page 1077-1089.
Rana, P. B. (2008). “Trade intensity and business cycle synchronization: The case of
East Asian countries*”. The Singapore Economic Review, Vol. 53, No. 2 (2008), page 279-
292.
30
Sawyer, W.C., Sprinkle, R.L. and Tochkov, K. (2010). “Patterns and determinants of
intra-industry trade in Asia”. Journal of Asian Economics 21 (2010), page 485–493.
SCB (2013). Available the 3rd
of March 2013 at http://www.scb.se/Pages/TableAnd
Chart____26625.aspx. Updated 2013-02-27.
Shahbaz, M. and Leitão, N.C. (2010). “Intra-Industry Trade: The Pakistan
Experience”. International Journal of Applied Economics, 7(1), March 2010, page 18-27.
Sharma, K. (2000). ”The Pattern and Determinants of Intra-Industry Trade in
Australian Manufacturing”. The Australian Economic Review, vol. 33, no.3, page 245-55.
The Economist (2007). “How Asia shrugged off its economic crisis”. Available the 4th
of
June 2013 at http://www.economist.com/node/9432495.
Tobin, J. (1958). “Estimation of Relationships for Limited Dependent variables”.
Econometrics, Vol. 26, No. 1 (Jan., 1958), page 24-36.
Toporowski, P. (2012). “The impact of global economic crisis on the intra-industry
trade of Visegrad Group Countries and the EU-15”. PhD Student in Warsaw School of
Economics.
Trading Economics (2012). Available the 22nd of May 2013 at
http://www.tradingeconomics.com/germany/exports
Data:
Eurostat. European Commission. Available the 24th
of March 2013 at
http://epp.eurostat.ec.europa.eu/portal/page/portal/international_trade/data/database
IMF. International Monetary Fund. Available the 13th of May 2013 at
http://www.imf.org/external/pubs/ft/weo/2012/01/weodata/index.aspx
Mapcrow. Travel distance calculator. Available the 24th
of March 2013 at
http://www.mapcrow.info/
SCB. Statistics Sweden. Available the 11th
of March 2013 at
http://www.scb.se/Pages/SSD/SSD_SelectVariables____340507.aspx?px_tableid=ssd_extern
%3aOImpExpSITC4Ar&rxid=308e82ba-b537-452a-8bc7-9e40f3ba0024
Worldbank. The World Bank Databank. Available the 18th
of March 2013 at
http://databank.worldbank.org/data/views/variableselection/selectvariables.aspx?source=worl
d-development-indicators#s_g

31
Appendix
1A. Correlation matrix
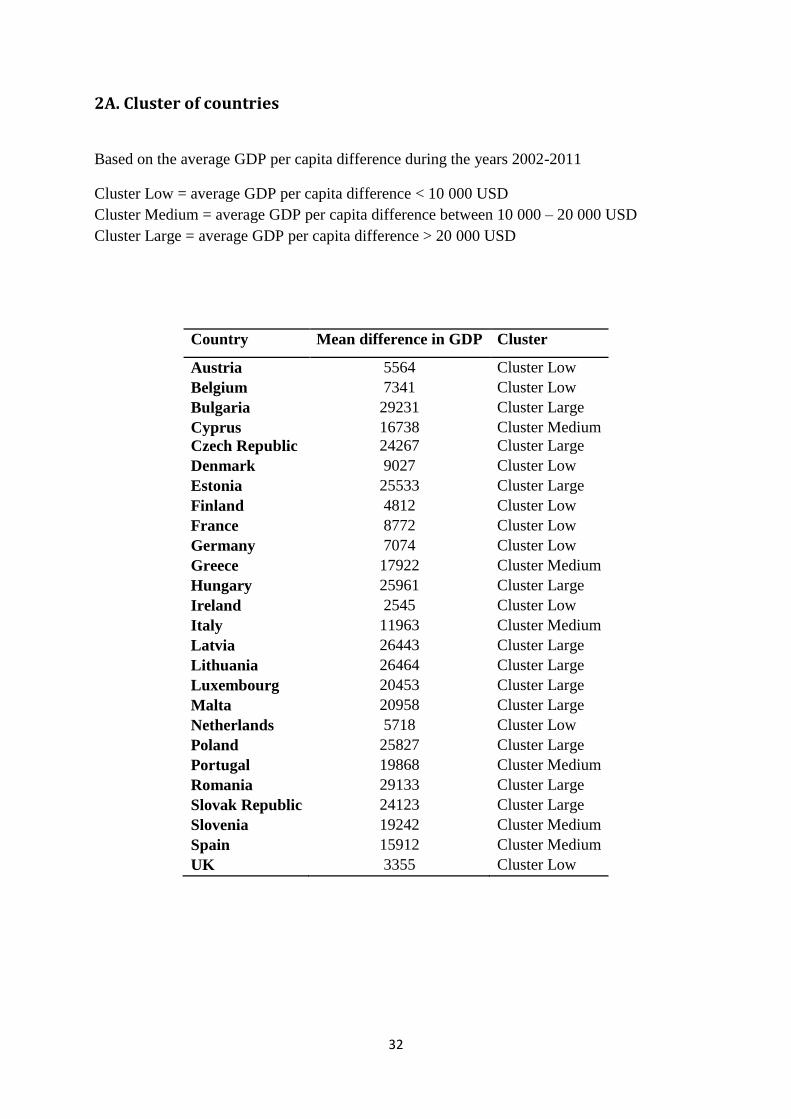
32
2A. Cluster of countries
Based on the average GDP per capita difference during the years 2002-2011
Cluster Low = average GDP per capita difference < 10 000 USD
Cluster Medium = average GDP per capita difference between 10 000 – 20 000 USD
Cluster Large = average GDP per capita difference > 20 000 USD
Country Mean difference in GDP Cluster
Austria 5564 Cluster Low
Belgium 7341 Cluster Low
Bulgaria 29231 Cluster Large
Cyprus 16738 Cluster Medium
Czech Republic 24267 Cluster Large
Denmark 9027 Cluster Low
Estonia 25533 Cluster Large
Finland 4812 Cluster Low
France 8772 Cluster Low
Germany 7074 Cluster Low
Greece 17922 Cluster Medium
Hungary 25961 Cluster Large
Ireland 2545 Cluster Low
Italy 11963 Cluster Medium
Latvia 26443 Cluster Large
Lithuania 26464 Cluster Large
Luxembourg 20453 Cluster Large
Malta 20958 Cluster Large
Netherlands 5718 Cluster Low
Poland 25827 Cluster Large
Portugal 19868 Cluster Medium
Romania 29133 Cluster Large
Slovak Republic 24123 Cluster Large
Slovenia 19242 Cluster Medium
Spain 15912 Cluster Medium
UK 3355 Cluster Low
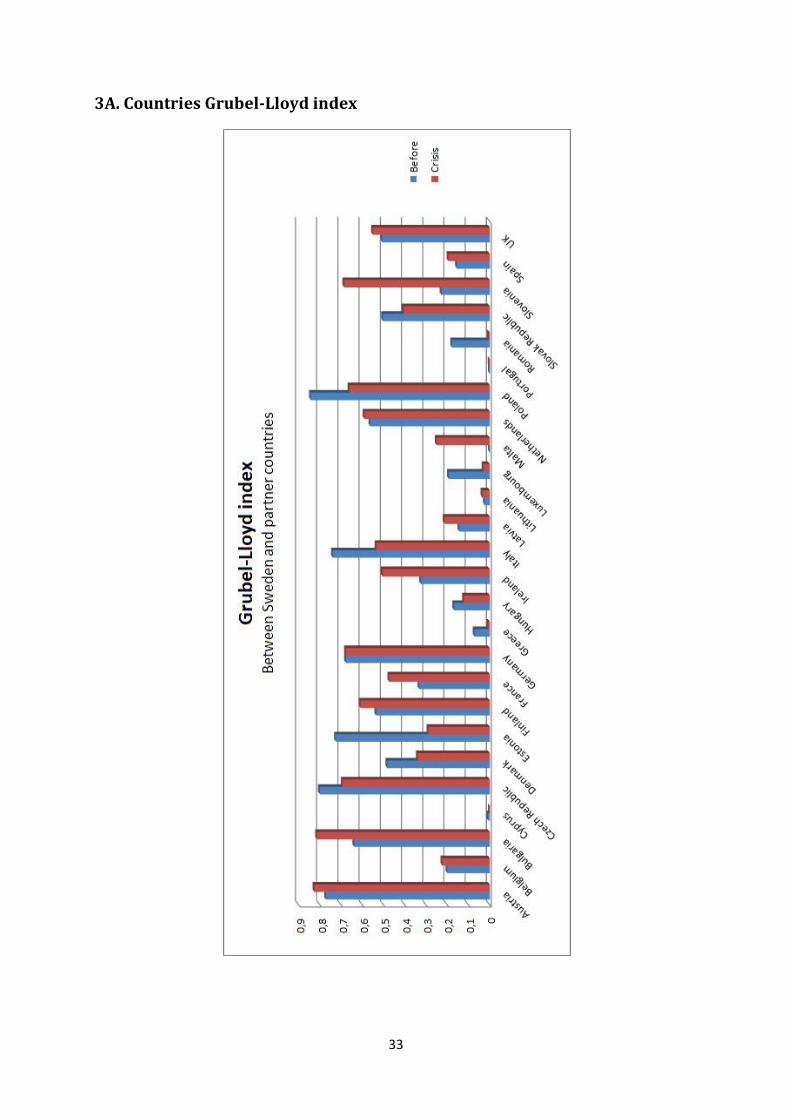
33
3A. Countries Grubel-Lloyd index

Master of Science Thesis INDEK 2013:69
KTH Industrial Engineering and Management
SE-100 44 STOCKHOLM