Embed Size (px)
Citation preview

Innocenti Working Papers
No. 95
HOW HIGH IS INFANT MORTALITY IN CENTRAL AND EASTERN EUROPE
AND THE CIS?
Nadezhda Aleshina and Gerry Redmond *
November 2003
* UNICEF Innocenti Research Centre, Florence, Italy.

Acknowledgements This paper is an extension of work originally published in “Social Monitor 2003” published by the UNICEF Innocenti Research Centre. The authors are grateful to Gáspár Fajth, Tim Heleniak and John Micklewright for comments. Copyright UNICEF, 2003
Cover design: Miller, Craig and Cocking, Oxfordshire – UK
ISSN: 1014-7837 Readers citing this document are asked to use the following form of words: Aleshina, Nadezdha, Gerry Redmond (2003), ‘How High is Infant Mortality Rate in Central and Eastern Europe and the CIS?’. Innocenti Working Paper No. 95. Florence: UNICEF Innocenti Research Centre.

UNICEF INNOCENTI RESEARCH CENTRE
The UNICEF Innocenti Research Centre in Florence, Italy, was established in 1988 to strengthen the research capability of the United Nations Children's Fund (UNICEF) and to support its advocacy for children worldwide. The Centre (formally known as the International Child Development Centre) helps to identify and research current and future areas of UNICEF's work. Its prime objectives are to improve international understanding of issues relating to children's rights and to help facilitate the full implementation of the United Nations Convention on the Rights of the Child in both industrialized and developing countries.
The Centre's publications are contributions to a global debate on child rights issues and include a wide range of opinions. For that reason, the Centre may produce publications that do not necessarily reflect UNICEF policies or approaches on some topics. The views expressed are those of the authors and are published by the Centre in order to stimulate further dialogue on child rights.
The Centre collaborates with its host institution in Florence, the Istituto degli Innocenti, in selected areas of work. Core funding for the Centre is provided by the Government of Italy, while financial support for specific projects is also provided by other governments, international institutions and private sources, including UNICEF National Committees.
The opinions expressed in this paper are those of the authors and do not necessarily reflect the policies or views of UNICEF.

1
Abstract This paper examines the measurement of infant mortality in the countries of Central and Eastern Europe and the Commonwealth of Independent States. There are worrying indications that official infant mortality counts, based on administrative data, may understate the true gravity of the problem in 15 countries in the region, including 11 out of 12 CIS countries, and four countries in South Eastern Europe. In the case of eight CIS countries in the Caucasus and Central Asia plus Romania, the evidence is strongest, not least because surveys that allow independent estimation of infant mortality have been carried out there. In the case of the remaining six countries, the evidence is more circumstantial, and based on inconsistencies within the official data themselves, combined with information on how live births are defined. However, the paper also finds that surveys are rather blunt instruments, and that the confidence intervals that surround estimates from these surveys are often large. Further work needs to be done, not only to improve the collection of official statistics on births and infant deaths in many countries across the region, but also to improve the effectiveness of surveys as a measurement tool.
Introduction
As the communist period recedes further in time, it is now clear that many of the 27 post-communist countries of Central and Eastern Europe and the Commonwealth of Independent States face continued challenges to improve the well-being of their citizens. Yet even as national incomes have fallen and poverty has increased, official data in nearly every CEE/CIS country suggest that infant mortality rates decreased through the 1990s, in many cases to within shouting distance of rates in Western Europe. Georgia, for example, posted an official infant mortality rate of 12 deaths per 1,000 live births in 2001, similar to that in Latvia, and only 5 deaths per 1,000 more than in Portugal. Is this credible?
For many countries, the short answer is ‘no’. This paper identifies 15 countries – 11 out of 12 CIS countries, plus 4 countries in South Eastern Europe – where official infant mortality rates appear to understate the true picture. In some of these countries (including Georgia), survey data suggest that real rates may be more than twice the official figure. This is a worrying finding. The infant mortality rate is a key indicator of progress towards Millennium Development Goals.1 Therefore, its accurate measurement is important. Moreover, evidence that official data understate the true picture must be taken as a sign that this international development target is in danger of not being reached.
1 There are eight major Millennium Development Goals, the fourth one of which is to reduce under
five mortality by two thirds between 1990 and 2015. In general, four in five deaths of children aged under 5 are in fact infant deaths.

2
Interrogation of official data in CEE/CIS countries is not new. The research in this paper builds on quite a large body of literature on infant mortality statistics in the Soviet Union, starting with Davis and Feshback (1980), running through to Anderson and Silver (1986), Velkoff and Miller (1995), Kingkade and Sawyer (2001) and UNICEF (2003). This existing literature lacks two elements: first, it does not present a clear picture of underestimation of infant mortality across the entire CEE/CIS region in the post-communist era, or a clear examination of the reasons that might lie behind it. Second, a rigorous analysis of the reliability of the major source of alternative estimates of infant mortality in the region – household surveys where women are asked about their reproductive histories – is also missing. It is in these two areas that this paper makes a contribution.
Why do official data understate the true picture in 15 countries? In most of these countries, the way a live birth is currently defined may reduce the infant mortality count. Mis-reporting, for example the reclassification of infant deaths as stillbirths, also appears to have increased over the 1990s. In some countries, deaths of older infants may be recorded as deaths of children aged over one year. And it is clear that in a few countries, the registration of births and infant deaths is less than complete: unregistered births and deaths are not included in official statistics. It must be added that most of this hard evidence pertains to CIS countries. Similar investigations have generally not been carried out in the countries of South Eastern Europe.
Can surveys be used to provide reliable alternative estimates of infant mortality in the CEE/CIS region? The answer is complex. For the most part, they appear accurate enough to support the contention that official data greatly understate the true infant mortality rate.
But some factors that are perhaps specific to CEE/CIS countries may increase uncertainty. With some estimates of infant mortality from survey data, the degree of uncertainty is particularly wide.
The paper is organized as follows. Section 1 discusses how infant mortality is typically measured, and presents estimates from different sources for countries in the region. Section 2 looks at the definition of ‘live birth’, which is particularly important in the CEE/CIS context. Section 3 examines misreporting of infant deaths, and Section 4 considers the problem of non-registration of births and infant deaths. In Section 5, attention is focused on uncertainty associated with survey based estimates. Section 6 concludes.
1. MEASURING INFANT MORTALITY
The infant mortality rate represents the probability that a child will die before reaching age of 1 year in a specific period of time (usually a year) and in a specific geographical area (usually a country). There are number of ways of calculating infant mortality rates. For example, the method used by the

3
Russian statistical office, Goskomstat (and generally recognised as acceptable), is:
10001
1
•
+ −
−
N
M
N
M=m
where N and M are, respectively, the number of live births in the year for which the rate is computed and the number of infant deaths that follow these births in the same year; N-1 is the number of live births in the previous year, and M-1 is the number of deaths of infants in the current year, who were born in the previous year (Goskomstat, 2002).2
Table 1 shows recent infant mortality rates for all 27 countries in the CEE/CIS region. The official rates for 2001, provided by national statistical offices and available for all countries except Tajikistan, are calculated from civil registration data on births and deaths. The rates range from 4 per 1,000 live births in Czech Republic and Slovenia, to 44 per 1,000 live births in Kyrgyzstan. Survey estimates, calculated from household surveys where women of childbearing age are asked about their reproductive histories, are available for 11 countries in the region. These surveys, Demographic Health Surveys (DHS), Multiple Indicator Cluster Surveys (MICS) Reproductive Health Surveys (RHS) and Living Standards Measurement Surveys (LSMS), have been carried out since the 1970s in many developing countries where there are usually few official data available for monitoring well-being and for planning public services such as health care. Most of the surveys used in this analysis were carried out in the late 1990s, and estimates of infant mortality refer to a particular point in time or to a 5 year period prior to the survey year. For four countries (Azerbaijan, Kazakhstan, Tajikistan and Uzbekistan) there are two independent survey estimates. In the case of two surveys, however (MICS 2000 for Albania and Uzbekistan), no period or point estimate is reported, diminishing somewhat the value of estimates from these surveys.
Table 1 indicates that in nine out of the ten countries with a period-specific survey estimate, infant mortality rates from the survey data are considerably higher than the official rates for the corresponding years. This is also true where two surveys have been carried out in one country. For Romania, the survey estimate is a third greater. In Azerbaijan, the two survey based estimates of 79 and 74 infant deaths per 1,000 live births are over four times as big as the corresponding official rates. Ukraine is the only country where the difference between the official rate and the survey estimate is small. Yet in this case, the survey estimate is likely to greatly understate the true picture, for reasons discussed at different points throughout this paper.3 2 Rates calculated using formulas such as these are simplified, and do not, for example, take account of migration. However, the impact of such factors is generally believed to be small. For a more detailed discussion of the calculation of infant mortality rates, see Shyrock et al (1976). 3 It is worth noting that surveys carried out in some countries in the region around the late 1990s,
including Bosnia-Herzegovina (MICS 2000), Moldova (RHS 1997), Russia (RHS 1996), and

4
Table 1: Official infant mortality rates and survey based estimates (deaths per 1,000 live births)
Official rate (2001)
Survey estimate
Survey name and
year
Years of survey
estimate
Average official rate for corresponding
years
Absolute difference (survey
estimate less official rate)
Tajikistan 89 MICS 2000 (1993) 47 42
Tajikistan
-
79 LSMS 2000 (1996-2000) -
Kyrgyzstan 44 61 DHS 1997 (1993-1997) 29 32
Turkmenistan 20 74 DHS 2000 (1995-2000) 33 41
Kazakhstan 40 DHS 1995 (1991-1995) 27 13
Kazakhstan 19
62 DHS 1999 (1994-1999) 24 38
Azerbaijan 79 MICS 2000 (1996) 20 59
Azerbaijan 18
74 RHS 2001 (1996-2000) 17 57
Romania 18 32 RHS 1999 (1995-1999) 21 11
Uzbekistan 49 DHS 1996 (1992-1996) 30 19
Uzbekistan 18
52 MICS 2000 Not reported
Moldova 16
Armenia 15 36 DHS 2000 (1995-2000) 15 21
Russia 15
Bulgaria 14
FR Yugoslavia 13
Albania 12 28 MICS 2000 Not reported
Georgia 12 43 RHS 1999 (1995-1999) 16 27
FYR Macedonia 12
Ukraine 11 16 RHS 1999 (1995-1999) 14 2
Latvia 11
Belarus 9
Estonia 9
Hungary 8
Lithuania 8
Poland 8
Croatia 8
Bosnia-Herzegovina 8
Slovakia 6
Slovenia 4
Czech Republic 4
Source: Official rates - UNICEF (2003), Statistical Annex Table 3.1; survey data - see Appendix I.
Serbia and Montenegro (MICS 2000), did not collect information on child and infant mortality, suggesting perhaps that official data were seen as adequate in these countries.

5
There are several exogenous reasons why we should be wary of official infant mortality rates in many countries in the region (see UNICEF, 2003). In this paper, we set aside these exogenous factors, and concentrate on the differences between official and survey data, and inconsistencies in the official data themselves. The method is as follows:
1. In nine countries, independent surveys suggest that official infant mortality rates may understate the true situation.
2. Evidence within the official data, for example unexpected patterns, may support our claim that official rates in these nine countries appear low.
3. If we find similar evidence in official infant mortality data for other countries in the CEE/CIS region for which we do not have survey data, then we may be able to suggest that the level of infant mortality in these countries is higher than the official data suggest.
In undertaking this analysis, it is worth defining explicitly what we wish to
capture. The true infant mortality rate m can be conceptualised as follows:
1000•
++
ur
ur
NN
MM=m
where Nr and Nu are registered and unregistered births, respectively, and Mr and Mu are registered and unregistered deaths. Therefore, the official infant mortality rate is calculated from Mr and Nr. The underlying assumption with official administrative data is that Nr and Mr represent 100 per cent of all births and deaths, respectively. If Mr and Nr do not capture all births and deaths, then the extent to which the official infant mortality rate is a good proxy for m can be called into question. It is a question which underlies the discussion in Sections 2, 3 and 4 below. The degree to which m can be captured from survey data is analogous. If Nr and Mr are defined as births and deaths recorded in the surveys, then survey based estimates of infant mortality will be representative of m only to the extent that sampling and non-sampling error allow. These issues are discussed in Section 5.
2. LIVE BIRTHS, STILLBIRTHS AND MISCARRIAGES
The first reason why estimates of infant mortality from official sources, and those calculated from surveys, may differ is related to definitions. If an infant is not considered to be born alive, then he or she cannot be considered to have died. Thus, the definition of ‘live birth’ is one crucial determinant of the infant mortality rate. The World Health Organization developed the following definition of a ‘live birth’ in 1950:

6
“The complete expulsion or extraction from its mother of a product of conception, irrespective of the duration of the pregnancy, which, after such separation, breathes or shows any other evidence of life, such as beating of heart, pulsation of the umbilical cord, or definite movement of voluntary muscles, whether or not the umbilical cord has been cut or the placenta is attached.” (WHO, 1992, definition 3.1)
In other words, any birth with any signs of life, however insignificant, and which is then followed by death, however quickly, should be defined as a live birth and infant death. This definition is officially recognised in most countries, both developing and developed.
Partly, perhaps, as a result of Cold War differences, the Soviet Union maintained an alternative and less rigorous definition of live birth. This was also adopted in some communist countries of Central and Eastern Europe. The differences between the WHO and Soviet definitions are highlighted on Table 2. The Soviet definition only counts breathing as a sign of life, and presumes infants who are born before the end of 28 weeks of gestation, or who weigh less than 1,000 grams at birth (there is considerable overlap between these two groups) to be non-viable – they are not counted as live births until they have survived a full seven days (or 168 hours). If they survive for less than this time, they are considered as miscarriages, and not counted at all. Table 2: Soviet and WHO definitions of live birth
Infant born after the end of the 28th week of pregnancy
No signs of life
No breath but other signs of life
Died during the first 7 days
Survived the first 7 days
USSR Stillbirth Live birth
WHO Stillbirth Live birth
Infant born before the end of the 28th week of pregnancy, or with weight under 1,000 gr. or length under 35 cm
No sign of life No breath but other signs of life
Died during the first 7 days
Survived the first 7 days
USSR Miscarriage Live birth
WHO Stillbirth Live birth
Source: Anderson and Silver (1986).

7
In some Central and East European countries, the WHO definition was introduced long before the lifting of the ‘Iron Curtain’, and after 1994, when Poland adopted the WHO definition, Bulgaria was the only European country outside of the CIS where the Soviet definition persisted.4 Table 3 shows, however, that in several CIS countries, the Soviet definition was still recently in use. Indeed, in those CIS countries where the definition of live birth was changed during the 1990s to move towards the WHO definition, it was done in a rather limited way. In Russia for example, a decree titled “On shifting to WHO definition of live birth and foetal death” (see Appendix II) was issued in 1992 by the Ministry of Health and Goskomstat. This defines as live birth a birth that shows any sign of life at any gestational age. However, the same document states that registration with the Civil Acts Register (ZAGS – Zapis ob Actah Grazhdanskogo Sostoyania), used in the calculation of official infant mortality statistics, shall be done only for the following:
• live births and stillbirths with birthweights of 1000 grams or more (or, if birthweight is unknown, length of 35 cm or more and period of gestation of 28 weeks and more)
• all infants with birthweight between 500 and 999 grams who survive 168 hours (7 days).
Thus, infants weighing less than 1000 grams who die within seven days,
even though they are considered live born, are supposed to be registered only in medical documentation of the health facility where birth and subsequent death have taken place, but not in the civil register. Therefore they are not counted in official statistics.5
4 In Bulgaria, a variation of the Soviet definition applies: infants who weigh less than 1,000 grams
are counted as miscarriages if they survive less than seven days; length and gestational age are not taken into account. In addition, all life signs, rather than just breathing, are seen as valid signs of life. 5 Indeed it has been suggested that little may be done to keep infants with a birthweight of under
1,000g alive. A recent item in a Moscow newspaper reads: ‘Aleksandr Baranov, director of the Russian Academy of Medical Sciences Center for Children's Health, said that the low quality of health care in Russia has caused the infant mortality rate to grow "continuously." Further, he said the Duma must pass the draft law "On the Security of the Health of Children in the Russian Federation" to protect premature babies. In Russia, children born weighing less than one kilogram are not registered in the Civil Registrar's Office unless they live more than 7 full days. Until a child in that weight category is seven days old, he or she is not eligible to receive expensive intensive care treatment.’ (“Doctor Lobbies for Lower Infant Mortality Rate” Vechernyaya Moskva 17 October 2003).
8
Table 3: Definitions of live birth in CIS countries (Autumn 2003)
Legal instrument Registration in medical documents
Civil Acts registration
Belarus
Decree of Ministry of Health and State Statistical Committee (1993)
Georgia Decree of Ministry of Labour, Health and Social Affairs, Ministry of Justice and Committee of Social Economic Information (1993)
Live birth: birth of product of conception, with birth weight greater than 500 grams (or length of 25 cm or more or born after 22 or more weeks of gestation) that breathes or shows any other evidence of life.
Stillbirth: Birth of a baby showing no sign of life who weighs at least 500 grams at birth (or has a length of 25 cm or more or born after 22 or more weeks of gestation)
Armenia Decree Ministry of Health (1994)
Kyrgyzstan
Instruction of Ministry of Health (2002)
Moldova Decree of Ministry of Health and State Department on Statistics (1995)
Russia* Decree of Ministry of Health and Goskomstat, (1992)
Ukraine Decree of Ministry of Health (1996)
Live birth: birth of product of conception, with birth weight greater than 500 grams that breathes or shows any other evidence of life.
Stillbirth: Birth of a baby showing no sign of life who weighs at least 500 grams at birth.
All live and still births with birth weight greater than 1000 grams (or with length of 35 cm or more, or born after 28 weeks of gestation)
All newborns weighing 500-999 grams if they survive 168 hours after birth (7 days)
Azerbaijan Soviet definition still in use for both medical and civil acts registration. Decrees soon to be issued for the adoption of WHO definition of live birth
Kazakhstan Soviet definition still in use for both medical and civil acts registration. WHO definition of live birth definition is used in two pilot regions (Almatinskaya oblast and Almaty city)
Tajikistan Soviet definition still in use for both medical and civil acts registration. Transition to WHO definition of live birth being discussed.
Uzbekistan Soviet definition still in use for both medical and civil acts registration. WHO definition of live birth is being used in one pilot oblast
Turkmenistan Soviet definition still in use for both medical and civil acts registration. Date for transition to WHO definition of live birth has not been set
* According to Information Note of MOH of Russia (2002) “On statistical counting of infant born before 28 weeks of gestation and with birth weight of 1000 gram and more surviving perinatal period (168 hours)”, any termination of pregnancy before 28 weeks of gestation are completed is classified as an abortion regardless of outcome. Thus, if child is born before 28 weeks of gestation are completed, even though he or she will be registered with Civil Acts Registration Bodies, in medical documentation this will be registered as an abortion. It is not clear whether similar rules apply in other countries.
Note: Laws and decrees governing live birth and stillbirth definition and registration are referenced in more detail in Appendix II.

9
Another document, issued by Russian Ministry of Health in 2002 to further explain “Statistical counting of children born alive before 28 weeks of gestation are completed and weighing less than 1000 grams who survive perinatal period (168 hours)” (see Appendix II) states that any pregnancy which ends before 28 weeks of gestation are completed is classified as a miscarriage (abortion). If the infant survives seven days, a medical certificate of birth is issued and the infant is registered with the Civil Acts Registry as liveborn. However, such a pregnancy will still be classified in the documentation of the health facility as a miscarriage (abortion) and not a delivery, and will be recorded as a “termination of pregnancy (before 28 weeks)”, or as a case of “medical assistance to pregnant women”. It will not be included in the number of “Total deliveries” recorded by the health facility.6
The WHO definition of live birth was “adopted” in similar fashion in Armenia, Moldova, Ukraine and Kyrgyzstan. Thus, in these countries, in practice the shift from the Soviet to the WHO definition of live birth was partial in the case of both medical and civil registration statistics.7
What difference does the Soviet definition make to infant mortality statistics? Anderson and Silver (1986) have produced perhaps the most widely cited account of the possible impact on the official infant mortality rate if countries using the Soviet definition switched to the WHO definition. According to their estimates (based on data on infant survival for the US in 1960), the infant mortality rate would jump by between 22 and 25 per cent if the birth weight and gestation criteria in the Soviet definition were made consistent with WHO criteria. Table 4 shows that in the case of four countries where the change in definition was made in the early 1990s, and where infant mortality rates were recalculated, this estimate may still have some validity, but variation between countries and over years is considerable. In Poland, the infant mortality rate increased consistently by a fifth. In Moldova, the annual increase ranged from 5 to 17 per cent (however, as Table 3 notes, the new definition in Moldova retained several elements of the Soviet definition). In Latvia (where data, however, are presented for only one year) the infant mortality rate jumped by 40 per cent. Where other post-communist countries would fit within this range of increases is difficult to say, but the impact of the Soviet definition on infant mortality rates clearly remains important.
6 If the premature infant is stillborn or survives less than 7 days, the mother is only entitled to sick
leave “under general conditions”. She is entitled to maternity leave if the infant survives 7 days or more. 7 It is worth noting that while most advanced industrialized countries progressively adopted the
WHO definition of live birth from the 1960s onwards, in these countries too, adoption of the WHO definition has often been slow and partial. During the early 1990s, some Central European countries surpassed several Western countries in terms of conforming to the WHO definition. See Gourbin and Masuy–Stroobant (1995).

10
Table 4: Estimated increase in infant mortality rate caused by switch from Soviet to WHO definitions (per cent increase)
Estonia Latvia Moldova Poland
1989 13 20
1990 14 21
1991 40 5 21
1992 17 16 21
1993 13 17 21
1994 11
1995 22
1996 11
Source: Data supplied to MONEE Project by National Statistical Offices.
3. MIS-REPORTING OF INFANT BIRTHS AND DEATHS
As noted in the previous section, under the Soviet definition, a birth must fulfil several criteria in order to be counted as a ‘live birth’. Velkoff and Miller argue that if an infant in the Soviet Union died and there was doubt regarding any of the criteria, “it would have been to the benefit of the hospital or the clinic to err on the side of stating that the infant was extremely premature, or intentionally to mis-report the birth as a stillbirth, because infant mortality rates were one criterion used to evaluate hospitals and clinics.” (1995, p.243).
Many experts agree that mis-reporting of infant deaths was widespread in the Soviet Union, and that it has continued in many of its successor states (for example, see Buckley, 1998; Yeganyan et al., 2001; Centers for Disease Control and Prevention and ORC Macro, 2003). Suspicions have also been raised in relation to some countries in South Eastern Europe, but little hard evidence has been presented (Serbanescu, Morris and Marin, 2001; Rechel and McKee, 2003). The literature notes two types of mis-reporting that reduce the infant death count: 1. The classification of live births (even according to the Soviet definition) as
stillbirths or miscarriages – referred to in the citation above of Velkoff and Miller.
2. The recording of deaths of infants aged under one year as occurring when the infant was aged over one year.8
8
A third type of mis-reporting sometimes mentioned is the classification of deaths with ‘sensitive’ causes, for example intestinal infections, as being caused by other less sensitive factors, for example respiratory illness. This does not affect the infant mortality count, and is not considered here.

11
The reader should note the difference between mis-reporting, which is a conscious act or an unintended error by medical staff, and non-registration, which is an act of omission, often by parents, but which can also reduce the infant mortality count. Issues surrounding registration are discussed in Section 4. Classification of infant deaths as stillbirths and miscarriages Because in all countries, a high proportion of infant deaths occurs within a short period after birth (that is, in the first weeks, and even days and hours), the infant mortality rate is often decomposed into early-neonatal mortality (infant dies within 6 days of birth), neonatal mortality (infant dies within 27 days after birth) and postneonatal mortality (28 to 364 days). In general, one might expect the relationship between neonatal and post-neonatal mortality rates across countries to be reasonably stable. That is, countries with similar levels of neonatal mortality should also have similar levels of post-neonatal mortality. Velkoff and Miller (1995) find that for years up to 1990, in several republics of the Soviet Union, the ratio of official post-neonatal mortality rates to neonatal mortality rates was high when compared with Western countries. Is this still the case in CIS countries? Is it the case in other countries of Central and Eastern Europe?
Table 5 shows ratios of post-neonatal to neo-natal mortality rates for 15 western European countries, and 19 countries in the CEE/CIS region. These are average ratios for available years between 1970 and 2000 when the infant mortality rate was between 10 and 20 per 1,000 live births. Countries are grouped by geographical region. Data for Western European countries set a benchmark: the sorts of expected ratios where infant mortality is accurately captured by official statistics: these range from 0.24 in Sweden (denoting 24 post neonatal deaths for every 100 neonatal deaths) to 0.64 in the UK, with an average ratio of 0.43. Average ratios in seven Central European and Baltic countries are only slightly higher, at 0.50. In the other three sub-regions on Table 5, ratios for most countries are considerably higher. Exceptions are Bosnia-Herzegovina, Croatia, FYR Macedonia and Georgia, where ratios are similar to those in Western Europe. In the other countries (Albania, Romania, Moldova, Russia, Ukraine, Armenia and Azerbaijan), given the official count of post neonatal deaths, the number of neonatal deaths appears to be understated.9
9 The alternative interpretation, that the number of post-neonatal deaths is overstated, seems
unlikely.

12
Table 5: Average Ratios of Post neonatal to neonatal mortality rates in official statistics, European and Central Asian countries, 1970-2000
Western Europe Central Europe and
Baltic states South Eastern Europe Western CIS Caucasus and Central
Asia
Average 0.43 Average 0.50 Average 0.84 Average 0.83 Average 1.76
Austria (10) 0.56
Czech Republic (5) 0.45 Albania (4) 1.80
Moldova (6) 0.96 Armenia (10) 0.85
Belgium (12) 0.51 Estonia (4) 0.57
Bosnia-Herzegovina (4) 0.45 Russia (8) 0.69 Georgia (7) 0.51
Denmark (7) 0.31 Hungary (12) 0.39 Bulgaria (21) 0.85 Ukraine (7) 0.85 Azerbajjan (2) 3.93
Finland (5) 0.26 Latvia (13) 0.69 Croatia (10) 0.39
France (11) 0.60 Lithuania (7) 0.56
FYR Macedonia (4) 0.45
Greece (11) 0.34 Poland (15) 0.40 Romania (2) 1.10
Ireland (8) 0.57 Slovenia (3) 0.48
Italy (11) 0.29
Netherlands (6) 0.37
Norway (7) 0.41
Portugal (10) 0.49
Spain (9) 0.45
Sweden (3) 0.24
Switzerland (7) 0.45
United Kingdom (5) 0.64
Source: WHO Health for All Database
Notes: Average ratios (PNNMR/NNMR) are calculated for each country for years between 1970 and 2000 when official infant mortality rates were between 10 and 20 per 1,000 live births. Number of years from which averages are calculated are in parentheses.
The evidence presented on Table 5 is generally supported by a recent analysis by Kingkade and Sawyer (2001), where information on the monthly probabilities of dying at less than four months (that is, in the first month, second month, etc.), and between four and ten months, are used to estimate the ‘true’ infant mortality rate. Their method assumes that official rates for deaths that occur up to the fourth month in CEE/CIS countries may understate the true situation, while official rates for deaths between four and ten months in infancy are generally correct. The method also assumes that the pattern of deaths up to the fourth month can be estimated using historical US and German data from points in time when their infant mortality levels (between months 4 and 10) were similar to those in the different CEE/CIS countries (see also Kingkade and Arriaga, 1997). Table 6 presents their underestimation factors, which range from close to zero per cent in most central European countries, to 25 per cent and more in most countries of South Eastern Europe and the CIS. Belarus is a notable exception, with an adjustment factor of only

13
13 per cent, similar to that of Latvia. It is worth noting also that Kingkade and Sawyer’s analysis does suggest, in contrast to the evidence on Table 5, a degree of underestimation in official rates in both FYR Macedonia and Georgia. However, it is worth noting that underestimation factors for Azerbaijan, Georgia, Tajikistan and Turkmenistan are calculated from only one observation per country. Table 6: Estimates of adjustment factors for infant mortality rates in CEE/CIS countries, 1987-2000
Average official infant mortality rate 1987-2000
Adjustment factor (per cent)
Adjusted infant mortality rate 1987-2000
Albania (4) 28.4 +110.9 59.83 Bulgaria (5) 15.1 +56.6 23.64 Croatia (6) 9.8 +0.8 9.90 FYR Macedonia (8) 27.9 +32.9 37.05 Romania (9) 23.5 +81.2 42.57 Czech Republic (6) 8.2 +0.6 8.21 Estonia (10) 12.9 +9.7 14.18 Hungary (12) 12.9 +0.5 12.94 Latvia (6) 14.7 +13.6 16.70 Lithuania (7) 11.7 +6.2 12.46 Slovakia (4) 11.6 +0.3 11.61 Slovenia (10) 7.4 +7.3 7.99 Armenia (6) 16.7 +78.9 29.90 Azerbaijan (1) 22.6 +167.3 60.51 Georgia (1) 15.5 +27.0 19.70 Kazakhstan (5) 25.6 +84.0 47.09 Kyrgyzstan (7) 61.9 +100.3 62.09 Tajikistan (1) 38.7 +102.6 78.37 Turkmenistan (1) 43.2 +69.5 73.19 Uzbekistan (2) 29.3 +98.4 58.18 Belarus (6) 12.2 +13.0 13.75 Moldova (4) 20.0 +65.0 33.07 Russia (10) 17.9 +26.5 22.61 Ukraine (7) 13.9 +54.5 21.52 Average +46.6
Source: Kingkade and Sawyer (2001), Table 2.
Note: The adjustment factors represent average adjustment for years between 1987 and 2000 to make the pattern of infant death before the fourth month, and at the fourth and tenth months, consistent with historical patterns observed in US and German life tables. The number of years’ data from which the adjustment factors are calculated are in parentheses.

14
The mismatches outlined on Tables 5 and 6 for several countries in South Eastern Europe and the CIS do not constitute proof that infant deaths are being hidden or recorded as stillbirths or miscarriages. However, they do show that the pattern of infant death does not conform to expected patterns in many countries. Moreover, they suggest that the problem of undercounting of infant mortality may not just be confined to countries of the Caucasus and Central Asia, where surveys confirm this to be the case, but also to other countries in the CIS and South Eastern Europe, where survey data are not available. Mis-reporting early neonatal deaths as stillbirths It is also possible, using official statistics, to address the more specific issue of whether early neonatal deaths are being mis-reported as stillbirths. This is done by examining the relationship between stillbirths and early neonatal deaths in the official data. Given the mortality rate that prevailed (according to official counts) in several transition countries during the 1990s, one might expect to find a ratio of about one stillbirth for every early neonatal death. A ‘stillbirths ratio’ far in excess of 1:1 suggests that some early neonatal deaths were being misreported as stillbirths (Velkoff and Miller, 1995).
Figure 1 shows stillbirths ratios for some countries and years where the official neonatal mortality rate ranged from 6.5 to 11 per 1,000 live births. Data are available for most CIS countries, but not for any countries in South Eastern Europe except Serbia and Montenegro. The expected 1:1 stillbirths ratio prevailed in Belgium and Greece in the 1970s, Estonia in the 1980s, and in Serbia and Montenegro in the 1990s. The 1:1 stillbirths ratio was also evident in Russia in the late 1980s, but it began to rise steeply from 1990. In Georgia, the ratio increased from 1992 onwards. In Turkmenistan, Ukraine and Uzbekistan, the stillbirths ratio climbed during the 1990s to about 2:1 or even 3:1.

15
Figure 1: Ratio of stillbirths to early neonatal deaths, 1970-2000
Source: WHO Health for All database.
Note: Only those countries and years are selected for which the early neonatal mortality rate was between 6.5 and 11 per 1,000 live births. Depending on the country and the year, the definition of live birth may vary.
The case of Georgia is interesting because this country officially adopted the WHO definition of live birth in 1994 (see Table 3), and because a study of birth outcomes in the year 2000 in hospitals in Tbilisi provides at least a partial independent check on what the expected stillbirths ratio should be. Asatiani (2001) examined medical records (primary medical history journals rather than medical death certificates) for 15,000 births at obstetrics clinics in Tbilisi, Georgia, in 2000 – a third of all births in Georgia in that year. In this sample, there were 22.3 stillbirths per 1,000 births, and 15.6 early neonatal deaths per 1,000 live births, giving a stillbirths ratio 1.43:1 – a far lower ratio than what the official data show, suggesting perhaps a degree of massaging of official infant death figures.
Trends in the stillbirths ratio for Armenia, Kazakhstan and Kyrgyzstan, on the other hand, are difficult to explain. In these countries, the ratio remained at about 1:1 or declined towards this level during the 1990s. At face value, this would imply accurate counting of early neonatal deaths. Given the gap between survey based estimates and official data, and the evidence of underestimation of neonatal deaths in Table 5, this idea is difficult to sustain. Moreover, small scale analyses of hospitals in Armenia and Kazakhstan tend to confirm the practice of misreporting (Ministry of Health of and UNICEF Armenia, 2002; Wuhib, 1998; Ministry of Health and ZAO, 2002). Another possibility is that in these countries, a significant number of infant deaths are simply not reported at all, for example, because they follow home births.
0.0
0.5
1.0
1.5
2.0
2.5
3.0
1970 1972 1974 1976 1978 1980 1982 1984 1986 1988 1990 1992 1994 1996 1998 2000
Ukraine
Turkmenistan
Russia
Georgia
Uzbekistan
Armenia
Estonia
Belgium
Greece
Kazakhstan
Kyrgyzstan
Serbia & Montenegro

16
Mis-reporting post neonatal deaths as child deaths Another specific type of misreporting that can be investigated with an
‘internal consistency’ check is the possibility that deaths of older infants are recorded as occurring after their first birthday, and are thus not included in the infant mortality count. Velkoff and Miller (1995) cite a study by Ksefontenova (1990) which suggests that in the Muslim republics in particular, misreporting of the infant’s age was used to reduce the infant mortality count.
We do not have official data for infant deaths by age in months, or by age in single years past their first birthday. However, it possible to compare official and survey data on neonatal, post neonatal and child mortality rates, the latter being for deaths occurring after the child’s first birthday, but before their fifth. Figure 2 shows the differences between survey based estimates and official data for eight countries. In all countries except Georgia, the difference between survey estimates and official data is greatest for neonatal deaths. This is not surprising, given the discussion above on misreporting infant deaths as stillbirths or miscarriages. What is more surprising is the finding that in six of the eight countries, the surveys appear to underestimate child deaths in comparison with official data. This finding is not easy to rationalize, except perhaps with reference to the misreporting of infant deaths as child deaths in the official data, thus boosting the child death count. One alternative explanation – that child deaths are misreported as infant deaths in the surveys – seems unlikely, for reasons discussed in Section 5.
To summarise: there is little hard evidence on misreporting of infant deaths, but available data do suggest problems in all the countries of Caucasus and Central Asia, and also in Moldova, Russia and Ukraine (evidence relating to Belarus is scarce). Problems may also exist in some South East European countries, although evidence for these countries is mixed. Misreporting does not seem to be a problem in the EU accession countries of Central Europe and the Baltic states.

17
Figure 2: Survey estimates of neonatal, post neonatal and child mortality rates (per cent difference from official rates)
Source: Official data: WHO Health for All Database, Survey data: Uzbekistan DHS 1996, Kyrgyzstan DHS 1997, Kazakhstan DHS 1999, Georgia and Romania RHS 1999, Armenia and Turkmenistan DHS 2000, and Azerbaijan RHS 2001. See Appendix I.
It is important that the reader is not given the impression of systematic
misreporting in these countries as a result of directives from ministries and high ranking bureaucrats. Certainly, incentive systems, coupled with the looser Soviet definition of live birth that gives room for some interpretation, may encourage a degree of misreporting. Equally, however, the trauma felt by medical staff who often have to care for dying infants with inadequate training and equipment, and who may feel powerless to save them, should not, perhaps, be underestimated.10
10
The authors are grateful to Iryna Mogilevkyna for this insight.
-21
-20
-7
32
-34
-23
-20
43
72
55
125
24
315
807
293
226
185
145
136
129
114
-8
147
96
-100 0 100 200 300 400 500 600 700 800 900
Azerbaijan 1996-2000
Turkmenistan 1995-2000
Kyrgyzstan 1993-97
Kazakhstan 1994-99
Uzbekistan 1992-96
Georgia 1995-99
Romania 1995-99
Armenia 1995-2000 Neonatal
Post Neonatal
Child

18
4. RELIABILITY OF REGISTRATION
The definition of a live birth, and its interpretation by medical staff, are not the only factors that can affect the official infant mortality count. As is noted in Section 2, only births and deaths that are registered are included in official statistics. In the Soviet Union and many other communist countries, parents were expected to register the births of children, except in the case of stillbirths and deaths that took place before the mother left the hospital, when it was the job of the hospital administration to make the declaration. In many countries, similar procedures exist today. To a large extent, therefore, the completeness of the registry will depend on parental willingness to register the birth and death of a child.
Problems with the registration of births and deaths in CEE/CIS countries are under-researched, and hard evidence exists only for a small number of countries. Table 7 shows 2000 survey evidence of proportions of children at 0-5 months, 6-11 months and 48-59 months who were unregistered at time of interview in seven countries in the region. In Tajikistan non-registration is particularly acute: the births of four in ten children aged between 6 months and one year, and more than one in ten children aged between four and five years (48-59 months) were not registered in 2000. The situation in Georgia is also severe, with the births of 5 per cent of children aged 48-59 months not registered. The reason for high levels of non-registration in Tajikistan and in Georgia is simple – registration at the time of the survey was costly.11 In Albania, Bosnia-Herzegovina, Moldova and Uzbekistan, on the other hand, where registration was formally free, the picture looks more benign. Table 7: Births not registered 2000, by age of child (per cent)
under 6 months
6-11 months
48-59 months
Tajikistan 55.1 39.4 12.4
Georgia 12.0 5.3 4.8
Moldova 11.5 2.0 1.6
Azerbaijan 13.6 6.0 1.2
Bosnia-Herzegovina 7.4 0.9 0.9
Albania 7.9 3.0 0.5
Uzbekistan 2.5 0.3 0.0
Source: MICS 2000 data. See Appendix I.
Note: Information on birth registration in the MICS refers to proportions of children aged under 5 years whose birth has not been registered. Includes some cases where parents are unsure whether their children’s births are registered. 11
Formal birth registration fees have recently been abolished in Tajikistan, but persist in Georgia. In Georgia, moreover, birth registration fees for infants born to mothers who are not in a registered marriage are double the fees for infants born to married mothers (personal communication, UNICEF Georgia).

19
However, the data in Table 7 refer only to living children. The proportion of children who have died whose births (and deaths) are not registered may be higher still. Evidence from a trace of over 500 medical death certificates issued by hospitals and other health facilities for Armenian infants in 2000 shows that a quarter of deaths remained unregistered. Figure 3 shows that among infants who medical staff recorded as live-born and who died at 0-6 days, registration was reasonably effective because it was the hospital’s responsibility. But among older infants, where parents were responsible for registration at civil offices, compliance was poor. It is not clear from this exercise how many of these infants’ births were also unregistered. Nonetheless, if non-registration of infant deaths occurs in some other countries in the region on a similar scale as in Armenia, then this clearly constitutes one important source of undercounting in official infant mortality rates.
Figure 3: Infant deaths in Armenia registered at medical facilities but unregistered at Civil Acts Registration Bureau, 2000 (absolute number from survey of 519 deaths)
245
111
39 4
5 8
5 8
12 5
3 8
9
0
100
200
300
400
500
600
0-6 days 7-28 days 29-365 days all infant deaths
reg is tered unregis tered
Source: Ministry of Health and UNICEF (2002) Infant mortality in Armenia: A review of procedures and registration, classification and related medical services, Ministry of Health Armenia and Republic of Armenia: Yerevan, Table 15.
Note: Medical facilities issue medical death certificates in cases where they are involved in treatment of the infant. If the infant is less than a week old, medical facilities are responsible for registering deaths with the Civil Acts Registration Bureau (CARB), which compiles official vital statistics for the National Statistical Service. If the infant is more than 6 days old at time of death, parents are responsible for registering the death directly with the CARB, without which the infant’s death will be excluded from the official count. The total number of infant deaths reported by the National Statistical Service in 2000 was 540 (Source: MONEE Project Database).
20
5. ESTIMATING INFANT MORTALITY FROM SURVEY DATA
While the preceding three sections outline issues that strongly point to undercounting of official infant mortality rates in several countries, alternative estimates, derived from survey data, cannot simply be assumed to be ‘correct’. This section seeks to add to existing literature on the survey based estimation of infant mortality in two important ways: first, to point to some specific problems in the estimation of infant mortality from survey data in former communist countries during the transition; and second (and more generally), to question some assumptions made about the indirect estimation of infant mortality from limited maternity histories. Calculating infant mortality from survey data As Table 1 shows, survey based estimates of infant mortality are based on three main survey types – the DHS, the RHS and the MICS. In addition, one LSMS conducted in Tajikistan in 1999 included a module that allows the calculation of infant mortality rates. All surveys were based on random stratified samples, and all aimed to be representative of either national populations, or of women of reproductive age (15-44 or 15-49).12
The way infant mortality rates are computed depends on what type of information is collected in a survey. The DHS, RHS and the Tajikistan LSMS ask respondents to report all their pregnancy outcomes in some detail. For all live births, date of birth, survival status and (for not surviving children) age at death were obtained. The mortality rates calculated from these surveys are based on the deaths of children over a specific time period, usually five years preceding the survey.13
In MICS, on the other hand, women are asked to report the total number of births they have had in their life and total number of children who were born alive but later died. Because no information is collected regarding dates of birth (except for the very first birth) or age at death, mortality rates can be estimated only indirectly, using a method developed by Brass (1964). This method (discussed in more detail below) produces estimates of mortality for several reference years, which are usually averaged into a final estimate, represented by a mid-point year. Non-sampling and sampling error Asking women about their children who have died is a difficult matter, not least because the death of children is invariably painful for a mother to talk about. There is a danger that some mothers may withhold some details, or 12
For information sources on the surveys, see Appendix I. 13
Data for the most recent period will include some children who have not been exposed to the risk of dying for a full year. To compensate for this, a method of synthetic cohort probabilities is used to compute probability of death for this group. A description of this procedure can be found in Sullivan et al (1994).

21
‘overlook’ some deaths, or even terminate the interview. Responses such as these will affect the quality of the survey.
Even where mothers answer all questions, they may interpret them in different ways. While respondents to all surveys are asked to report pregnancy outcomes according to the WHO definition of live birth, it is not always clear how respondents themselves interpret both questions and events. In the case of a death that occurred shortly after birth and where medical staff assisted at the birth (as is the case with most births in CEE/CIS countries), there are three possible ways how the mother might report this event to the interviewer: * she will report what she recalls herself * she will repeat what she has been told by medical personnel * she will report what has been written in the death certificate
In the first case the accuracy of report will depend on how clear her memory of event is (this is an issue in any retrospective survey). The second and third cases are of particular importance in the context of CEE/CIS countries where medical staff sometimes misreport pregnancy outcomes. If respondents were influenced by what they were told by medical staff, then the survey results will also be influenced by mis-reporting in the health system (Wuhib, 1998).
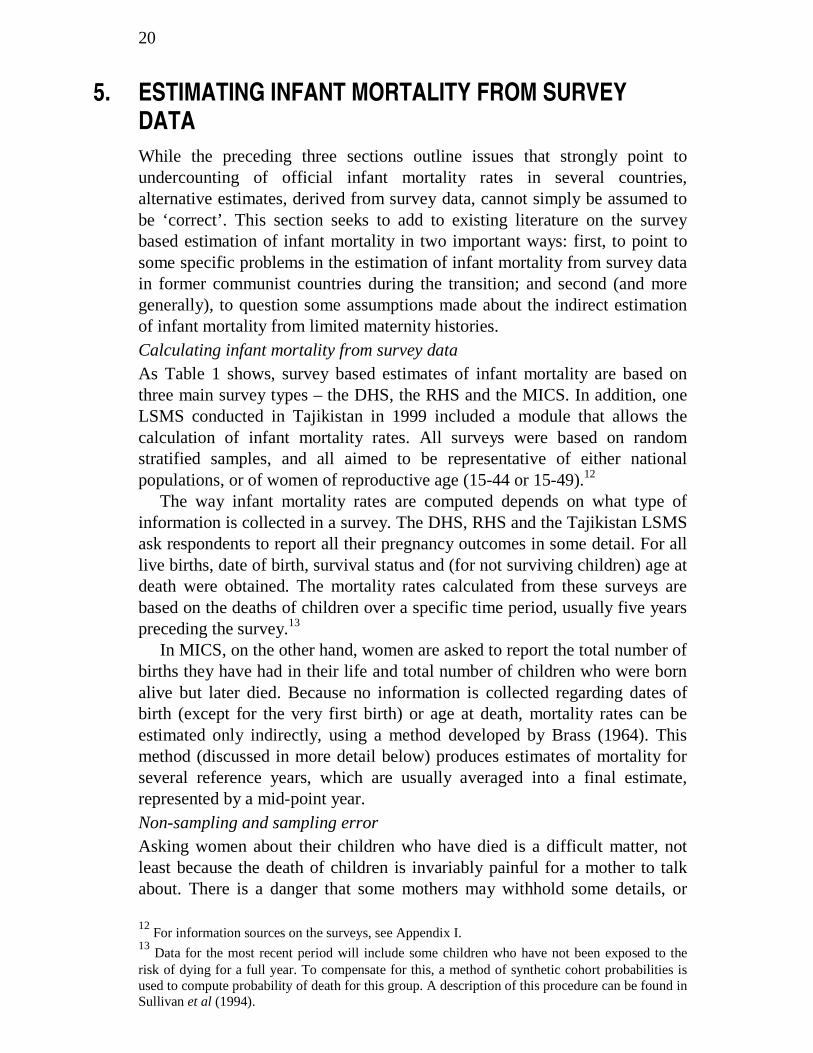
The omission by respondents of dead children from the birth history can also bias results. One indicator of omission may be the ratio of male to female infant mortality. The expected ratio of male to female deaths is between 1.16 and 1.32 (Curtis 1995). A higher ratio might indicate under-reporting of female deaths. Table 8 shows that both Georgia and Kazakhstan (1995) have a ratio of 1.8 for neonatal mortality, while Georgia, Turkmenistan and Uzbekistan have high ratios for total infant mortality. This may mean that female infant deaths are under-reported in these surveys, and that survey based estimates of infant mortality rates in these countries that understate the true total.14
The very low estimate of infant mortality from the Ukraine RHS underlines the difficulty in collecting information of this kind in surveys, and the large impact that non-reporting error can have on results. As noted in Table 1, the Ukraine RHS produces an infant mortality estimate that is very similar to the official rate. Yet the problems with the Ukraine official data discussed in Sections 2 and 3 of this paper clearly imply that the real infant mortality rate should be higher than the official rate. There seems little doubt
14
There are several other types of non-sampling error (not necessarily specific to CEE/CIS countries) that can affect infant mortality estimates. These are discussed in greater detail in Sullivan, et al, (1994).
22
therefore, that the Ukraine RHS underestimates the true level of infant mortality in that country.15 Table 8: Sex differentials in infant mortality
Infant mortality
rate Neonatal
mortality rate Post-neonatal mortality rate
Mortality ratio Male/Female
Male Female Male Female Male Female Infant Neo-natal
Post neo-natal
Romania 1999 32.1 26.3 21.0 16.0 11.1 10.3 1.2 1.3 1.1 Armenia 2000 46.1 41.9 29.4 22.7 16.7 19.3 1.1 1.3 0.9 Azerbaijan 2001 83.6 77.8 45.7 29.9 38.0 47.9 1.1 1.5 0.8 Georgia 1999 48.3 31.5 31.5 17.1 16.8 14.5 1.5 1.8 1.2 Kazakhstan 1995 46.7 34.6 24.5 13.3 22.2 21.3 1.3 1.8 1.0 Kazakhstan 1999 62.0 47.3 32.6 24.0 29.5 23.3 1.3 1.4 1.3 Kyrgyzstan 1997 71.9 60.2 36.6 29.6 35.4 30.6 1.2 1.2 1.2 Turkmenistan 2000 83.0 59.7 36.6 29.0 46.4 30.7 1.4 1.3 1.5 Uzbekistan 1996 50.2 36.7 24.1 19.3 26.1 17.4 1.4 1.2 1.5
Source: Kazakhstan DHS 1995 and 1999, Uzbekistan DHS 1996, Kyrgyzstan DHS 1997, Georgia and Romania RHS 1999, Armenia and Turkmenistan DHS 2000, and Azerbaijan RHS 2001. See Appendix I.
Account also needs to be taken of sampling error. As infant death is typically a rare event, sampling error for survey based mortality estimates can be substantial, implying great deal of uncertainty regarding the true population rate. Some uncertainty in estimates, exemplified by the width of the confidence intervals, might be caused by small sample sizes. Table 9 presents standard errors and sample sizes for countries in the region and for some developing countries outside the region with similar levels of infant mortality. Because fertility levels in the countries of the Caucasus and Central Asia are generally lower than those in many other developing countries, the number of births from which infant mortality rates are estimated also tends to be lower. The infant mortality rate estimated from the 1989 Kenya Demographic and Health Survey, for example, is 61 per 1,000 live births, similar to that in Kazakhstan. However, the sample of infants from which the Kenya infant mortality rate is calculated is 7,319, compared with 1,501 in the case of Kazakhstan. The 95 per cent confidence interval surrounding the Kenyan estimate is narrower, ranging from 52.2 to 69.3 per 1,000 live births, compared with a range of 45.3 to 78.6 for Kazakhstan.16 Nonetheless in the case of Kazakhstan and most other countries in the region, the lower bound of 15
These worries are echoed by the US Centres for Disease Control, which sponsored the survey. The Child Mortality module on the Ukraine 1999 RHS produced results that were inconsistent with expectations, for example a very low stillbirths rate and an extremely high ratio of post-neonatal deaths. While overall, the survey was judged to be satisfactory, these problems may have been the result of inadequate training of survey interviewers for the reproductive history module (personal communication, Howard Goldberg, CDC). 16
Sample size is not the only factor in determining confidence intervals. Re-weighting of the sample may also increase sampling variability. All DHSs and RHSs require re-weighting.

23
the confidence interval is still notably above the official infant mortality rate for the time period corresponding to the survey (Table 1 shoes the official rates). Exceptions are Ukraine (for reasons discussed above) and Romania, where the official rate (21 deaths per 1,000 live births) falls just within the lower bound of the 95 per cent confidence interval for the survey estimate (20 per 1,000 live births).17
Table 9: Survey sizes and sample errors
Infant mortality
rate
Standard error
95 per cent confidence
interval upper bound
95 per cent confidence
interval lower bound
Number of women
interviewed
Total fertility rate a
Number of births b
Turkmenistan, 1996-2000 73.9 5.4 84.7 63.1 7919 2.9 3696
Tajikistan, 1996-2000 78.8 6.7 92.2 65.4 2133 3.8 c 2530
Azerbaijan 1996-2000 74.4 6.4 87.2 61.6 7668 2.1 3153
Kyrgyzstan, 1993-1997 61.3 7.2 75.6 47.0 3848 3.4 2026
Kazakhstan, 1994-99 61.9 8.3 78.5 45.3 4800 2 1501
Uzbekistan, 1992-1996 49.1 6.6 62.3 35.9 4415 3.3 2455
Georgia, 1994-1999 41.6 5.7 53.0 30.2 7798 1.7 3049
Kazakhstan 1991-1995 39.7 5.6 50.9 28.5 3771 2.5 1597
Armenia, 1996-2000 36.1 5.4 46.9 25.3 6430 1.7 1657
Romania 1995-1999 31.5 6.0 43.5 19.5 6888 1.3 1792
Ukraine 1995-1999 15.2 3.0 21.1 9.3 7128 1.4 1269
Egypt 1988-1992 61.5 3.2 67.9 55.1 9864 3.9 8915
Egypt 1984-1988 73.2 4.1 81.3 65.1 8911 4.5 8898
Kenya 1985-1989 60.7 4.3 69.3 52.1 7150 6.7 7319
Burundi 1983-1987 73.7 5.3 84.3 63.1 3970 6.9 3963
Brazil 1982-1986 73.2 5.7 84.6 61.8 5892 3.4 3595
a Total fertility rate 15-49 for the three years preceding survey, expressed per woman (Ukraine - 2 years preceding survey) b Number of births in last five years preceding survey. In most survey reports, only the weighted number of births is reported. However, this is usually close to the unweighted total. c Tajikistan: fertility rate is average of official rates for 1998-2000
Sources: Authors’ calculations; Macro International (1995), pages 14-15; see also Appendix 1.
17
For discussion of the estimation of change in infant mortality over time see UNICEF (2003), pages 49-51.
24
Model error (the Brass method) Uncertainty due to sampling and non-sampling error is an inherent component of all survey based estimates. However, in the case of the indirect estimation of mortality, using techniques such as the Brass method, new sources of error are introduced, mainly as a result of some modelling assumptions that need to be made. The limited range of questions asked of MICS respondents does reduce the chances of non-response or inaccurate response discussed above. But it does also mean that this indirect estimation technique must be used to estimate infant mortality with these data. Table 1 shows that in the CEE/CIS region, MICS data have been used for this purpose in the case of Albania, Azerbaijan, Tajikistan and Uzbekistan.
The Brass method allows mortality rates to be estimated from aggregate information on the number of children born to women in 5-year age groups (15-19, 20-24 etc), and the proportion of children in each group who die. What the Brass method does is convert the observed proportion of children dead among those born to women in a certain age group into an estimate of probability of dying by some exact age, using a set of multipliers which depend on this summary information from the surveys, and data derived from model life tables. There are several versions of the Brass method. The Trussel version (1975), discussed here, is based on model life tables (developed by Coale and Demeny, 1983) which are aggregated into four groups, North, South, West and East, each describing mortality patterns in different regions of Europe and some other countries in 19th and 20th centuries. Thus the Trussel version produces four different sets of mortality estimates for each set of birth and mortality data.
Table 10 demonstrates an application of the Trussel version of the Brass method to Azerbaijan MICS data. Number of children born, average number of children per woman in each age cohort, and proportion who have died are calculated from the survey data. Multipliers derived from model life tables are then used to convert proportions of children dead into the probability of dying by the exact age of 1, 2, 3, 5, 10, 15 and 20. At the last step, model life tables are again applied to convert the probabilities of dying by ages 2 and over to a common index: the probability of dying by age 1.

25
Table 10: Application of Trussel version of the Brass Method to the data from Azerbaijan MICS 2000.
Age group
Number of children ever born
Average number of children ever born per woman
Parity ratios
Proportions dead
Multipliers
Age Probability of dying by exact age x
Common index: probability of dying by age 1
Reference dates
i P(i) P(i)/P(i+1) D(i) k x q(x)=k(i)xD(i) q(1) t(i) (1) (2) (3) (4) (5) (6) (7) (8) (9) (10) 1 15-19 59 0.044 0.069 0.068 1.253 1 0.085 0.085 2000.0 2 20-24 647 0.649 0.417 0.085 1.100 2 0.094 0.082 1998.8 3 25-29 1358 1.556 0.707 0.096 1.010 3 0.097 0.081 1996.8 4 30-34 2217 2.202 0.813 0.096 1.009 5 0.096 0.077 1994.3 5 35-39 3203 2.708 0.865 0.111 1.025 10 0.113 0.084 1991.5 6 40-44 2990 3.131 0.836 0.126 1.008 15 0.127 0.089 1988.4 7 45-49 2310 3.744 0.129 1.000 20 0.129 0.085 1985.0
Source: authors’ calculations on Azerbaijan MICS 2000 data.
Three important assumptions underly the Brass method, deviation from which may result in distorted estimates of mortality. First, the method assumes that mortality is steady or has been changing steadily over time. If there were any sharp fluctuations in mortality during the period analysed, the Brass method would fail to reflect them. Second, mortality risk is assumed to be homogenous for each age group of mother. This assumption is generally incorrect, because risk is higher with first births, which are generally to younger women. The third assumption relates to fertility: the Brass method assumes that fertility has been constant during 30-35 years preceding the survey. If fertility has been declining, the model will not be able to capture this, meaning shorter than the actual exposure to the probability of dying, and therefore multipliers (k(i) in Table 10) that are too high, leading to overestimated mortality rates. The first and third assumptions are particularly important in the CEE/CIS context, where trends in both infant mortality and fertility may have accelerated since the 1980s. For example, in all countries in the region, fertility has declined, often steeply, since the end of communism (UNICEF, 2001).
The impact of another source of variation in the Trussell version of the Brass Method, the choice of model (North, South, East or West), is also worth considering. There are no strict rules regarding which model is more appropriate for a given population. Figures 4, 5 and 6 show estimates of infant mortality for all four models as applied to the Kazakhstan DHS, the Azerbaijan MICS and the Tajikistan LSMS data. In the case of Kazakhstan and Tajikistan they also show infant mortality estimates computed directly from the same data, while for Azerbaijan, direct estimates are derived from RHS data. These direct estimates give some idea of the error that may be introduced by the simplifying assumptions of the Brass method. The North model produces the lowest estimates of IMR, and the East model gives the highest rates. Solid vertical bars on the graphs represent lower and upper

26
boundaries of 95 per cent confidence intervals for the North and East sets of estimates. The range that they show combines two components of uncertainty associated with Brass estimates: the uncertainty due to the choice of model life table and uncertainty due to sampling variability. The figures clearly show that mortality rates based on samples of young women (that is, the estimates for the most recent years prior to survey) are generally unreliable, with higher standard errors than those for older women. The most reliable estimates (with confidence intervals closest to those computed for direct estimates of infant mortality) appear to be those in the middle period, referring approximately to years 1991-1994. Even here, however, the range is wide, for example between about 70 and 110 deaths per 1,000 live births in the case of Tajikistan.
Figure 4: Kazakhstan DHS 1999, Brass estimates of infant mortality rates (jackknife standard errors)
Source: Authors’ calculations from Kazakhstan DHS 1999 data.
15-19
20-24 25-29 30-34 35-39 40-44 Age 45-49 20.0
30.0
40.0
50.0
60.0
70.0
80.0
90.0
1983 1985 1987 1989 1991 1993 1995 1997 1999
North South East West direct estimates
93
-32

27
Figure 5: Tajikistan LSMS 1999, Brass estimates of infant mortality rates (jackknife standard errors)
15-19
20-2425-2930-3435-3940-44Age 45-49
20.0
30.0
40.0
50.0
60.0
70.0
80.0
90.0
100.0
110.0
120.0
130.0
1985 1987 1989 1991 1993 1995 1997
NorthSouthEastWestdirect estimates
-19
Source: Authors’ calculations from Tajikistan LSMS 1999 data.
Figure 6: Azerbaijan MICS 2000, Brass estimates of infant mortality rates (jackknife standard errors)
Age 45-49 40-44 35-39 30-34 25-29 20-24
15-19
40.0
50.0
60.0
70.0
80.0
90.0
100.0
110.0
1984 1986 1988 1990 1992 1994 1996 1998 2000
North
South
East
West
direct estimates (RHS)
171
-1
Source: Azerbaijan RHS 2001 (see Appendix I) and authors’ calculations from Azerbaijan MICS 2000 data.

28
Discussion
While there is widespread agreement that official infant mortality rates in several CEE/CIS countries understate the true picture, there is less agreement on which countries (particularly outside of the eight countries of Caucasus and Central Asia) the problem extends to. There is also some uncertainty as to what the real level of infant mortality is in these countries. This analysis has attempted to add fresh elements to the debate on these issues.
Where do official infant mortality rates understate the true picture? Figure 7 summarises the evidence presented in this paper. Cell colour indicates for each country in the region the strength of evidence regarding the accuracy of official measures of infant mortality. The dark grey cells indicate evidence suggesting underestimation. The light grey cells denote an absence of any evidence at all, while the white cells indicate evidence supporting the official data. From this information, it seems likely to us that real infant mortality rates are poorly reflected in official counts in all countries of the CIS - except perhaps Belarus, where evidence is quite scarce. In South Eastern Europe, too, the accumulated evidence points to underestimation in official data in Albania, Bulgaria, Romania and perhaps also in FYR Macedonia. In Croatia and the Central European and Baltic countries, on the other hand, there is nothing to suggest that the official data understate the true picture.

29
Figure 7: Summary of evidence on estimation of official infant mortality rates Evidence
from large scale surveys (Table 1)
Definition of live birth (Table 3)
Ratio of post-neonatal to neonatal mortality (Table 5)
Kingkade and Sawyer's adjustment factors (Table 6)
Ratio of stillbirths to early neonatal deaths (Figure 1)
Under-estimation of child deaths in surveys (Figure 2)
Non-registration of births and deaths (Table 7)
Evidence from small scale studies*
CIS Armenia Azerbaijan Belarus Georgia Kazakhstan Kyrgyzstan Moldova Russia Tajikistan Turkmenistan Ukraine Uzbekistan South Eastern Europe Albania Bosnia-Herzegovina Bulgaria Croatia FR Yugoslavia FYR Macedonia Romania Central Europe Czech Republic Estonia Hungary Latvia Lithuania Poland Slovakia Slovenia Key
Evidence of underestimation in official data No evidence either way Evidence of accuracy in official data
* Small scale studies include the following: Armenia - Ministry of Health and UNICEF Armenia (2002); Georgia - Asatiani (2001); Kazakhstan - Wuhib (1998), and Ministry of Health and ZAO Kazakhstan (2002); Tajikistan – Guerra et al (2003).
Note: this table summarises the evidence presented in this paper regarding the underestimation of infant mortality rates in official data. A white cell indicates that evidence does not point to underestimation of official data in terms of the indicator concerned. A light grey cell indicates that there is no evidence either way from the relevant indicator about the accuracy of official data. A dark grey cell indicates that evidence for the relevant indicator suggests underestimation of official infant mortality rates.

30
How high is infant mortality? In the 11 CIS countries and four South East European countries where there is some evidence of official undercounting of infant mortality, the question remains: what is the real level? Here, this analysis can offer few definitive answers. In those countries where the Soviet definition of infant mortality has been largely maintained, the real infant mortality rate is likely to be at least a fifth higher than the official rate. Where misreporting and non-registration of births are deaths are problems, the real rate will be higher still, although difficult to quantify. Where surveys have been carried out, these should give us some clue as to the real infant mortality rate. But as this analysis shows, they are rather blunt instruments. Because fertility in CEE/CIS countries is low in comparison with that in many developing countries, the number of babies born to respondent women, from whom the infant mortality rate is estimated, is also low. Thus sampling variability and confidence intervals are wide. Moreover, there are several sources of non-sampling error. One of these, the interpretation of survey questions in CEE/CIS countries where medical staff attend most births, and where they also sometimes misreport pregnancy outcomes, has not been adequately studied. If some survey respondents report pregnancy outcomes in accordance with what they have been told by doctors, then the surveys too may underestimate the true level of infant mortality. The case of the Ukraine 1999 RHS discussed in this paper serves as a warning that infant mortality is difficult to measure, and that non-sampling error can seriously bias results.
Where indirect methods (for example, the Brass method) are used to estimate levels of infant mortality from survey data, the analysis shows that the potential for error is compounded by both sampling variability and model choice, implying a low level of certainty as to where the true population value lies. On the other hand, the analysis also shows that in Azerbaijan and Tajikistan, where two independent surveys have been carried out, one that allows direct estimation, and one that only allows indirect estimation, results are compatible, suggesting perhaps a robustness in the estimates in spite of wide confidence intervals.
Some useful policy and methodological conclusions come out of this analysis. First, as has been argued in a recent UNICEF analysis, progressive adoption of the WHO definition of live birth, and steps to reduce misreporting of infant deaths and to improve civil registration need to be taken across the CIS and South Eastern Europe (UNICEF, 2003). Second, surveys that can capture infant mortality need to be carried out in all those countries where the official rate is in doubt. Third, the surveys themselves need to be improved, in two ways in particular. More research needs to be carried out on how questions in these surveys are interpreted by respondents, and sample sizes need to be increased, so that the number of births from which infant mortality is estimated is sufficiently large, and sampling variability is reduced. This analysis shows that as things currently stand, there is little accurate

31
information on progress towards the key development goal of reducing child and infant mortality in many countries in the region. Better data are needed to fill this gap.

32
References Anderson, B., and Silver, B. (1986), “Infant Mortality in the Soviet Union:
Regional Differences and Measurement Issues”, Population and Development Review, Vol.12, No.4 (December 1986).
APM and ORC Macro (2000), Kazakhstan Demographic and Health Survey 1999, Academy of Preventive Medicine (Kazakhstan) and ORC Macro: Calverton, MD.
Asatiani, T. (2001), Analysis of Perinatal Mortality at Tbilisi Obstetric Facilities over 2000. Mimeo. Center of Clinical Effectiveness for Reproductive Health, Tbilisi.
Brass, W. (1964), “Uses of Survey Census and Survey Data to for the Estimation of Vital Rates”. Paper prepared for the African Seminar on Vital Statistics, Addis Ababa, 14-19 December. United Nations document E/CN.14/CAS.4/VS/7.
Buckley, C. (1998), “Rural/Urban Differentials in Demographic Processes: The Central Asian States”, POPULATION Research and Policy Review, Vol.17 No.1, pages 71-89.
Centers for Disease Controls and Prevention and ORC Macro (2003), Reproductive, Maternal and Child Health in Eastern Europe and Eurasia: A Comparative Report. Atlanta, GA (USA) and Calverton, MD (USA).
Coale, A. J., Demeny, P., with Vaughan, B. (1983), Regional Model Life Tables and Stable Populations. 2nd ed. New York: Academic Press.
Curtis, S. L. (1995), “Assessment of the Quality of Data Used for Direct Estimation of Infant and Child Mortality in DHS-II Surveys”. Occasional Papers No. 3. Calverton, Maryland: Macro International Inc.
Davis, and Feshback (1980), “Rising Infant Mortality in the USSR in the 1970’s”, International Population Reports, Series p-95, No.74. US Bureau of Census.
GECRCMCH and ORC Macro (2001), Turkmenistan Demographic and Health Survey 2000, Gubansoltan Eje Clinical Research Centre for Maternal and Child Health-Ministry of Health and the Medical Industry (Turkmenistan) and ORC Macro: Calverton, MD.
Goskomstat of Russia (2002), The Demographic Yearbook of Russia: Statistical Handbook, Goskomstat of Russia, Moscow.
Gourbin, C., and Masuy-Stroobant, G. (1995), “Registration of Vital Data: Are Live Births and Stillbirths Comparable All Over Europe?” Bulletin of the World Health Organization, Vol.73 No.4 (July-August 1995), pages 499-511.
Guerra, R., Napoletano, A., Ferrelli, R., Coclite, D. and Mazzacarra, A. (2003), Using Verbal Autopsy to Assess the Path of Death: Infant and Maternal Mortality in Tajikistan, UNICEF Tajikistan and Ministry of Health Tajikistan, and Istituto Superiore della Sanità, Rome.

33
Institute of Obstetrics and Gynecology and Macro International (1997), Uzbekistan Demographic and Health Survey 1996. Institute of Obstetrics and Gynecology and Macro International, Calverton Maryland.
Kiev International Institute of Sociology, CDC and USAID (2001), 1999 Ukraine Reproductive Health Survey: Final Report. Centers for Disease Control and Prevention and others: Atlanta.
Kingkade, W. and Arriaga, E. (1997), “Mortality in the New Independent States: Patterns and Impacts”, in J. Bobadilla, C. Costello and F. Mitchell (eds.), Premature Death in New Independent States. National Academy Press, Washington DC, pages 156-183.
Kingkade, W. and Sawyer, C. (2001), “Infant Mortality in Eastern Europe and the Former Soviet Union Before and After the Breakup”: Paper prepared for 2001 Meetings of the International Scientific Study of Population, Salvador de Bahia, Brazil, August 19-24.
Ksefontenova, N. Iu. (1990), “An Approach to Evaluating Reliability of Infant Mortality Statistics in the USS”. International Symposium on Demographic Processes in the USSR in the 20th Century in the Context of the European Experience, Tbilisi 8-12 October, 1990.
Macro International (1995), “Assessment of the Quality of Data Used for Direct Estimation of Infant and Child Mortality in DHS-II Surveys”, Occasional Papers No.3, Macro International.
Ministry of Health and UNICEF Armenia (2002), Infant Mortality in Armenia: A Review of Procedures for Registration, Classification and Related Medical Services. Ministry of Health Republic of Armenia and UNICEF Armenia, Yerevan (December 2002).
Ministry of Health and ZAO «Kazakh Academy of Nutrition», Kazakhstan (2002), Causes of Infant and Child Mortality in Kazakhstan, Ministry of Health Republic of Kazakhstan and Almaty Institute for Upgrading Doctors’ Qualification ZAO «Kazakh Academy of Nutrition », Kazakhstan, Almaty.
National Institute of Nutrition, Academy of Preventive Medicine of Kazakhstan and Macro International (1996), Kazakhstan Demographic and Health Survey 1995. National Institute of Nutrition and Macro International, Calverton Maryland.
NSS, MH and ORC Macro (2001), Armenia Demographic and Health Survey 2000, National Statistical Service (Armenia), Ministry of Health (Armenia) and ORC Macro: Calverton, MD.
Rechel, B. and McKee, M. (2003), Healing the Crisis: A Prescription for Public Health Action in South Eastern Europe. Information Review. European Centre on Health of Societies in Transition. London School of Hygiene and Tropical Medicine.
RIOP and ORC Macro (1998), Kyrgyz Republic Demographic and Health Survey 1997, Research Institute of Obstetrics and Pediatrics-Ministry of Health (Kyrgyzstan) and ORC Macro: Calverton, MD.

34
Serbanescu, F., Morris, L. and Marin, M. (eds.) (2001), Reproductive Health Survey Romania, 1999. Centers for Disease Control and Prevention and others, Atlanta.
Serbanescu, F., Morris, L., Stratila, M. and Bivol, O. (1998), Reproductive Health Survey Moldova, 1997. Centers for Disease Control and Prevention and others, Atlanta.
Serbanescu, F., Morris, L., Nutsubidze, N., Imnadze, P. and Shaknazarova, M. (2001), Women’s Reproductive Health Survey Georgia, 1999-2000: Final Report. Centers for Disease Control and Prevention and others, Atlanta.
Serbanescu, F., Morris, L., Rahimova, S. and Flowers, L. (2002), Reproductive Health Survey: Azerbaijan, 2001, Centers for Disease Control and Prevention and others, Atlanta.
Shryock, H., Jacob, S., Siegel, S. and Associates (1976), The Methods and Materials of Demography (Studies in Population). Academic Press Inc. San Diego, California.
SSCA and UNICEF (2000), “MICS, Multiple Indicator Cluster Survey: Azerbaijan, 2000”, State Statistics Committee (Azerbaijan) and UNICEF-Baku: Baku, Azerbaijan.
State Department of Statistics and UNICEF (2000), “MICS, Multiple Indicator Cluster Survey: Uzbekistan, 2000”, State Department of Statistics of the Ministry of Macro-Economy and Statistics (Uzbekistan) and UNICEF- Uzbekistan.
State Department of Statistics, National Center for Disease Control and UNICEF, Georgia (2000) “MICS, Multiple Indicator Cluster Survey: Georgia, 1999”, State Department of Statistics, National Center for Disease Control and UNICEF-Tbilisi: Tbilisi, Georgia .
State Statistical Agency and Center for Strategic Studies (Tajikistan), UNDP and WB (2000), Living Standards Survey in the Republic of Tajikistan (TLSS). State Statistical Agency and Center for Strategic Studies under the Office of the President (Tajikistan). United Nations Development Programme and the World Bank.
State Statistics Committee of Ukraine (undated), Multiple Indicator Cluster Survey: Full Report. UNICEF, Kiev.
Sullivan, J. M., Rutstein, S. O., and Bicego, G. T. (1994), “Infant and Child Mortality”. Demographic and Health Surveys Comparative Studies No. 15, Calverton, Maryland: Macro International Inc.
Trussel, T. J. (1975), “A Re-estimation of the Multiplying Factors for the Brass Technique for Determining Childhood Survivorship Rates”. Population Studies Vol. 29, No. 1, pages 97-108.
UNICEF (2000a), Multiple Indicator Cluster Survey Albania, 2000, UNICEF: Tirana.
UNICEF (2000b), Multiple Indicator Cluster Survey Tajikistan, 2000, UNICEF: Dushanbe.
35
UNICEF (2001), “A Decade of Transition”, Regional Monitoring Report, No.8. Florence: UNICEF Innocenti Research Centre.
UNICEF (2002), Household Survey of Women and Children Bosnia and Herzegovina 2000: A Multiple Indicator Cluster Survey, UNICEF, Sarajevo.
UNICEF (2003), “Social Monitor 2003”, Innocenti Social Monitor. Florence: UNICEF Innocenti Research Centre.
VCIOM (Russian Center for Public Opinion and Market Research) and CDC (Centers for Disease Control and Prevention) (1998), “1996 Russian Women’s Reproductive Health Survey: A Study of Three Sites”. Final Report, VCIOM and CDC, Moscow and Atlanta.
Velkoff, V. and Miller, J. (1995), “Trends and Differentials in Infant Mortality in the Soviet Union 1970-90: How Much is Due to Mis-Reporting?” Population Studies, Vol.49, No.2, pages 241-258.;
WHO (1992), “International Statistical Classification of Diseases and Related Health Problems”, Tenth Revision (ICD-10). Vol. 1 WHO, Geneva.
Wuhib T. (1998), Trip Report: Childhood Death Survey, Zhambyl Oblast, Kazakhstan, Division of International Health, EPO.
Yeganyan, R, Badurashvili, I., Andreev, E., Meslé, F., Shkolnikov, V. and Vallin, J. (2001), “Life Expectancy in Two Caucasian Countries”, Demographic Research, Vol.5, Art.7, (14 December 2001).

36
Appendix I: Survey data sources used in this article
In some cases where the authors had access to the original microdata, results used in this analysis were calculated by the authors themselves. In most cases, however, survey results used in this article are taken from publications describing the surveys conducted in the region. Surveys and the publications associated with them are listed below. Full references are in the bibliography: Armenia DHS 2000 NSS, MH and ORC Macro (2001)
Azerbaijan MICS 2000 SSCA and UNICEF (2000)
Azerbaijan RHS 2001 Serbanescu, F, L Morris, S Rahimova and L Flowers (2002)
Albania MICS 2000 UNICEF (2000a)
Bosnia and Herzegovina MICS 2000 UNICEF (2002)
Georgia RHS 2000 Serbanescu, F, L Morris, Nk Nutsubidze, P Imnadze and M Shaknazarova (2001)
Georgia MICS 2000 State Department of Statistics, National Center for Disease Control and UNICEF, Georgia (2000)
Kazakhstan DHS 1995 National Institute of Nutrition, Academy of Preventive Medicine of Kazakhstan and Macro International (1996)
Kazakhstan DHS 1999 APM and ORC Macro (2000)
Kyrgyzstan DHS 1997 RIOP and ORC Macro (1998)
Moldova RHS 1997 Serbanescu, F, Leo Morris, Mihai Stratila and Octavien Bivol (1998)
Romania RHS 1999 Serbanescu, F, L Morris and M Marin (eds) (2001)
Russia RHS 1996 VCIOM and CDC (1998)
Tajikistan LSMS 1999 State Statistical Agency and Center for Strategic Studies, UNDP and World Bank (2000)
Tajikistan MICS 2000 UNICEF (2000b)
Turkmenistan DHS 2000 GECRCMCH and ORC Macro (2001)
Ukraine RHS 1999 Kiev International Institute of Sociology, CDC and USAID (2001)
Ukraine MICS 2000 State Statistics Committee of Ukraine (undated)
Uzbekistan DHS 1996 Institute of Obstetrics and Gynecology and Macro International (1997)
Uzbekistan MICS 2000 State Department of Statistics and UNICEF (2000)
Further information on the surveys can also be found in the following websites:
DHS – www.measuredhs.com
RHS – www.cdc.gov/nccdphp/drh
MICS – www.childinfo.org
LSMS – www.worldbank.org/lsms
37
Appendix II: Legal sources for definition of live birth and stillbirths
Armenia Decree No.776/84 of 16.08.1994: Instruction On Defining the Standards for Live Births, Still Births and the Perinatal Period Belarus Ministry of Health and State Committee for Statistics and Analysis, Belarus (09.11.93), Decree N0 254/75“On shifting to WHO Standards for Live Births and Still birth”, [����������� ���� ������� ���������� �������� � �������������� ������ � ���������� � ������ ���������� �������� � 254/75 � 9 ����� 1993 �, “���������� � ���������� ��������� ����������, ������������ � ������������ ������”, �����-�����������.“ ���� �� �� ������������� !������� ���������� ���� ������� �������� ���������� � ������������”] Georgia Joint decree (N 334/o, N134, N95/s) of Ministry of Labour, Health and Social Affairs, Ministry of Justice and Committee of Social Economic Information, 9 November 1993, on "Registration of birth, stillbirth and child mortality”. Kyrgyzstan Ministry of Health , Kyrgyzstan (11.12.2002), Instruction No 551 on introduction of international live birth definition. Moldova Ministry of Health (03.03.95) and the Department of Statistics and Sociology (28.02.95), Moldova , Joint Decree No 103/No 3 “On shifting to WHO Standards for Live Births and Still birth” . Russia Ministry of Health, Russia (01.07.2002), Letter No 2510/6513-02-32, “On statistical counting of children born alive before 28 weeks of gestation are completed and weighting less than 1000 grams that survive perinatal period (168 hours)”, Moscow ["���� �������� �# � 01.07.2002 �. N 2510/6513-02-32 " ��������$���� �$��� ���$��� ������� ������ ����� (����) � ���� � 28 ������ �������� � ����� ���� � 1000 �, �������%� ������������� ����� (168 $���)". http://www.apteki.nnov.ru/docs/357/5-6-1.html] Ministry of Health and Goskomstat, Russia (04.12.92), Decree No 380/190 “On shifting to WHO Standards for Live Births and Still birth” , Moscow
38
[����������� ���� ������� � ���������� ����%������� �������� #�������� � ��������� �������� #��������, �����-����������� 4.12.92 � 380/190 « ���� �� �� ������������� !������� ���������� ���� ������� �������� ���������� � ������������», http://www.med-pravo.ru/PRICMZ/PricMZ1992/Pric318_190-92.htm] Ukraine Ministry of Health, Ukraine (19.02.96), Decree No 31 “On introduction of definitions of life birth, stillbirth and perinatal period”, Kiev [�&�&������� ��� ���'� '���(��, ) � � � , *���+������ � �&�&�������& ,����&( '���(�� (��&� �����&� 1.2 �� 1.3) 5 ��&��� 1996 �. � N 160/1185, “"� ����������� -�������&( �� ����$���� ������&(� ������������&, ��������������& �� ������������ ���&��”, http://rada.gov.ua/laws/pravo/new/termin/t_15.html ]
39
Economic and Social Policy Series The papers in the series (ISSN 1014-7837) are all available in English. Papers EPS 63 onwards are available for download as .pdf files from the IRC web site (http://www.unicef-icdc.org). Individual copies are available from: Distribution Unit, UNICEF-IRC, Piazza SS. Annunziata 12, 50122 Florence, Italy (e-mail [email protected] - Fax +39 055-24-48-17).
EPS 1 Economic Decline and Child Survival: The Plight of Latin America in the Eighties. Teresa Albanez, Eduardo Bustelo, Giovanni Andrea Cornia and Eva Jespersen. (March 1989).
EPS 2 Child Poverty and Deprivation in Industrialized Countries: Recent Trends and Policy Options. Giovanni Andrea Cornia. (March 1990). Also available in French and Spanish.
EPS 3 Education, Skills and Industrial Development in the Structural Transformation of Africa. Sanjaya Lall. (July 1990).
EPS 4 Rural Differentiation, Poverty and Agricultural Crisis in Sub-Saharan Africa: Toward An Appropriate Policy Response. Giovanni Andrea Cornia and Richard Strickland. (July 1990).
EPS 5 Increased Aid Flows and Human Resource Development in Africa. Paul Mosley. (August 1990).
EPS 6 Child Poverty and Deprivation in Italy: 1950 to the Present. Chiara Saraceno. (September 1990). Also available in Italian.
EPS 7 Toward Structural Transformation with a Human Focus: The Economic Programmes and Policies of Zambia in the 1980s. Venkatesh Seshamani. (October 1990).
EPS 8 Child Poverty and Deprivation in the UK. Jonathan Bradshaw. (October 1990).
EPS 9 Adjustment Policies in Tanzania, 1981-1989: The Impact on Growth, Structure and Human Welfare. Jumanne H. Wagao. (October 1990).
EPS10 The Causes and Consequences of Child Poverty in the United States. Sheldon Danziger and Jonathan Stern. (November 1990).
EPS 11 The Fiscal System, Adjustment and the Poor. Giovanni Andrea Cornia and Frances Stewart. (November 1990).
EPS 12 The Health Sector and Social Policy Reform in the Philippines since 1985. Wilfredo G. Nuqui. (January 1991).
EPS 13 The Impact of Economic Crisis and Adjustment on Health Care in Mexico. Carlos Cruz Rivero, Rafael Lozano Ascencio and Julio Querol Vinagre. (February 1991).
EPS 14 Structural Adjustment, Growth and Welfare: The Case of Niger, 1982-1989. Kiari Liman-Tinguiri. (March 1991).
EPS 15 The Impact of Self-Imposed Adjustment: The Case of Burkina Faso, 1983-1989. Kimseyinga Savadogo and Claude Wetta. (April 1991).
40
EPS 16 Liberalization for Development: Zimbabwe’s Adjustment without the Fund. Robert Davies, David Sanders and Timothy Shaw. (May 1991).
EPS 17 Fiscal Shock, Wage Compression and Structural Reform: Mexican Adjustment and Educational Policy in the 1980s. Fernando Valerio. (June 1991).
EPS 18 Patterns of Government Expenditure in Developing Countries during the 1980s: The Impact on Social Services. Beth Ebel. (July 1991).
EPS 19 Ecuador: Crisis, Adjustment and Social Policy in the 1980s. The Ecuadorian Centre of Social Research. (August 1991).
EPS 20 Government Expenditures for Children and Their Families in Advanced Industrialized Countries, 1960-85. Sheila B. Kamerman and Alfred J. Kahn. (September 1991).
EPS 21 Is Adjustment Conducive to Long-term Development?: The Case of Africa in the 1980s. Giovanni Andrea Cornia. (October 1991).
EPS 22 Children in the Welfare State: Current Problems and Prospects in Sweden. Sven E. Olsson and Roland Spånt. (December 1991).
EPS 23 Eradicating Child Malnutrition: Thailand’s Health, Nutrition and Poverty Alleviation Policy in the 1980s. Thienchay Kiranandana and Kraisid Tontisirin. (January 1992).
EPS 24 Child Welfare and the Socialist Experiment: Social and Economic Trends in the USSR, 1950-90. Alexandr Riazantsev, Sándor Sipos and Oleg Labetsky. (February 1992).
EPS 25 Improving Nutrition in Tanzania in the 1980s: The Iringa Experience. Olivia Yambi and Raphael Mlolwa. (March 1992).
EPS 26 Growth, Income Distribution and Household Welfare in the Industrialized Countries since the First Oil Shock. Andrea Boltho. (April 1992).
EPS 27 Trends in the Structure and Stability of the Family from 1950 to the Present: The Impact on Child Welfare. Chiara Saraceno. (May 1992).
EPS 28 Child Poverty and Deprivation in Portugal: A National Case Study. Manuela Silva. (June 1992).
EPS 29 Poverty Measurement in Central and Eastern Europe before the Transition to the Market Economy. Sándor Sipos. (July 1992).
EPS 30 The Economics of Disarmament: Prospects, Problems and Policies for the Disarmament Dividend. Saadet Deger. (August 1992).
EPS 31 External Debt, Fiscal Drainage and Child Welfare: Trends and Policy Proposals. Stephany Griffith-Jones. (September 1992).
EPS 32 Social Policy and Child Poverty: Hungary since 1945. Júlia Szalai. (October 1992).
EPS 33 The Distributive Impact of Fiscal and Labour Market Policies: Chile’s 1990-91 Reforms. Mariana Schkolnik. (November 1992).
EPS 34 Changes in Health Care Financing and Health Status: The Case of China in the 1980s. Yu Dezhi. (December 1992).
41
EPS 35 Decentralization and Community Participation for Improving Access to Basic Services: An Empirical Approach. Housainou Taal. (January 1993).
EPS 36 Two Errors of Targeting. Giovanni Andrea Cornia and Frances Stewart. (March 1993).
EPS 37 Education and the Market: Which Parts of the Neoliberal Solution are Correct? Christopher Colclough. (July 1993).
EPS 38 Policy and Capital Market Constraints to the African Green Revolution: A Study of Maize and Sorghum Yields in Kenya, Malawi and Zimbabwe, 1960-91. Paul Mosley. (December 1993).
EPS 39 Tax Reforms and Equity in Latin America: A Review of the 1980s and Proposals for the 1990s. Ricardo Carciofi and Oscar Cetrángolo. (January 1994).
EPS 40 Macroeconomic Policy, Poverty Alleviation and Long-term Development: Latin America in the 1990s. Giovanni Andrea Cornia. (February 1994).
EPS 41 Réformes Fiscales, Génération de Ressources et Equité en Afrique Subsaharienne durant les Années 1980. Kiari Liman-Tinguiri. (March 1994).
EPS 42 Tax Reform and Equity in Asia: The Experience of the 1980s. Andrea Manuelli. (April 1994).
EPS 43 Family Support Policies in Transitional Economies: Challenges and Constraints. Gáspár Fajth. (August 1994).
EPS 44 Income Distribution, Poverty and Welfare in Transitional Economies: A Comparison between Eastern Europe and China. Giovanni Andrea Cornia. (October 1994).
EPS 45 Death in Transition: The Rise in the Death Rate in Russia since 1992. Jacob Nell and Kitty Stewart. (December 1994).
EPS 46 Child Well-being in Japan: The High Cost of Economic Success. Martha N. Ozawa and Shigemi Kono. (March 1995).
EPS 47 Ugly Facts and Fancy Theories: Children and Youth during the Transition. Giovanni Andrea Cornia. (April 1995).
EPS 48 East Joins West: Child Welfare and Market Reforms in the “Special Case” of the Former GDR. Bernhard Nauck and Magdalena Joos. (June 1995).
EPS 49 The Demographic Impact of Sudden Impoverishment: Eastern Europe during the 1989-94 Transition. Giovanni Andrea Cornia and Renato Paniccià. (July 1995).
EPS 50 Market Reforms and Social Welfare in the Czech Republic: A True Success Story? Miroslav Hiršl, Ji.í Rusnok and Martin Fassmann. (August 1995).
EPS 51 The Winding Road to the Market: Transition and the Situation of Children in Bulgaria. Theodora Ivanova Noncheva. (August 1995).
EPS 52 Child Institutionalization and Child Protection in Central and Eastern Europe. Mary Anne Burke. (September 1995).

42
EPS 53 Economic Transition in the Baltics: Independence, Market Reforms and Child Well-being in Lithuania. Romas Lazutka and Zita Sniukstiene. (September 1995).
EPS 54 Economic Reforms and Family Well-being in Belarus: Caught between Legacies and Prospects. Galina I. Gasyuk and Antonina P. Morova. (December 1995).
EPS 55 The Transition in Georgia: From Collapse to Optimism. Teimuraz Gogishvili, Joseph Gogodze and Amiran Tsakadze. (September 1996).
EPS 56 Children at Risk in Romania: Problems Old and New. Elena Zamfir and C/t/lin Zamfir. (September 1996).
EPS 57 Children in Difficult Circumstances in Poland. Stanislawa Golinowska, Bo0ena Balcerzak-Paradowska, Bo0ena Kołaczek and Dorota Głogosz. (December 1996).
EPS 58 The Implications of Exhausting Unemployment Insurance Entitlement in Hungary. John Micklewright and Gyula Nagy. (September 1997).
EPS 59 Are Intergovernmental Transfers in Russia Equalizing? Kitty Stewart. (September 1997).
EPS 60 Marital Splits and Income Changes: Evidence for Britain. Sarah Jarvis and Stephen P. Jenkins. (September 1997).
EPS 61 Decentralization: A Survey from a Child Welfare Perspective. Jeni Klugman. (September 1997).
EPS 62 Living Standards and Public Policy in Central Asia: What Can Be Learned from Child Anthropometry? Suraiya Ismail and John Micklewright. (November 1997).
EPS 63 Targeting Social Assistance in a Transition Economy: The Mahallas in Uzbekistan. Aline Coudouel, Sheila Marnie and John Micklewright. (August 1998).
EPS 64 Income Inequality and Mobility in Hungary, 1992-96. Péter Galasi, (August 1998).
EPS 65 Accounting for the Family: The Treatment of Marriage and Children in European Income Tax Systems. Cathal O’Donoghue and Holly Sutherland. (September 1998).
EPS 66 Child Poverty in Spain: What Can Be Said? Olga Cantó-Sánchez and Magda Mercader-Prats. (September 1998).
EPS 67 The Education of Children with Special Needs: Barriers and Opportunities in Central and Eastern Europe. Mel Ainscow and Memmenasha Haile-Giorgis. (September 1998).
EPS 68 EMU, Macroeconomics and Children. A.B. Atkinson. (December 1998).
EPS 69 Is Child Welfare Converging in the European Union? John Micklewright and Kitty Stewart. (May 1999).
EPS 70 Income Distribution, Economic Systems and Transition. John Flemming and John Micklewright. (May 1999).

43
EPS 71 Child Poverty across Industrialized Nations. Bruce Bradbury and Markus Jäntti. (September 1999).
EPS 72 Regional Monitoring of Child and Family Well-Being: UNICEF’s MONEE Project in CEE and the CIS in a Comparative Perspective. Gáspár Fajth (January 2000).
EPS 73 Macroeconomics and Data on Children. John Micklewright. (January 2000). Available as a .pdf file only from http://www.unicef-icdc.org
EPS 74 Education, Inequality and Transition. John Micklewright (January 2000). Available as a .pdf file only from http://www.unicef-icdc.org
EPS 75 Child Well-Being in the EU – and Enlargement to the East. John Micklewright and Kitty Stewart. (February 2000).
IWP 76 From Security to Uncertainty: The Impact of Economic Change on Child Welfare in Central Asia. Jane Falkingham. (May 2000).
IWP 77 How Effective is the British Government’s Attempt to Reduce Child Poverty? David Piachaud and Holly Sutherland. (June 2000).
IWP 78 Child Poverty Dynamics in Seven Nations. Bruce Bradbury, Stephen Jenkins and John Micklewright. (June 2000).
IWP 79 What is the Effect of Child Labour on Learning Achievement? Evidence from Ghana. Christopher Heady (October 2000).
IWP 80 Integrating Economic and Social Policy: Good Practices from High-Achieving Countries. Santosh Mehrotra (October 2000).
IWP 81 The Impact of the Indonesian Financial Crisis on Children: An Analysis Using the 100 Villages Data. Lisa A. Cameron (December 2000).
IWP 82 An Analysis of the Role of Social Safety Net Scholarship in Reducing School Drop-Out During the Indonesian Economic Crisis. Lisa A. Cameron (December 2000).
IWP 83 The Family-in-Focus Approach: Developing Policy-Oriented Monitoring and Analysis of Human Development in Indonesia. Friedhelm Betke (January 2001).
IWP 84 Children in Bulgaria – Growing Impoverishment and Unequal Opportunities. Gantcheva, Roumiana and Alexandre Kolev (January 2001).
IWP 85 The Rhetoric of International Development Targets and the Reality of Official Development Assistance. Santosh Mehrotra (June 2001).
IWP 86 The Outcomes of Teenage Motherhood in Europe. Richard Berthoud and Karen Robson (July 2001).
IWP 87 Is EFA Affordable? Estimating the Global Minimum Cost of Education for All. Enrique Delamonica, Santosh Mehrotra and Jan Vandemoortele (August 2001). Available as a .pdf file only from http://www.unicef-icdc.org
IWP 88 Attitudes to Inequality after Ten Years of Transition. Gerry Redmond, Sylke Viola Schnepf and Marc Suhrcke (September 2001). Available as a .pdf file only from http://www.unicef-icdc.org

44
IWP 89 Preferences for Inequality: East vs. West. Marc Suhrcke (October 2001).
IWP 90 Social Exclusion and Children: A European View for a US Debate. John Micklewright (February 2002).
IWP 91 Poverty in the Transition: Social Expenditures and the Working-Age Poor. Jeni Klugman, John Micklewright and Gerry Redmond (March 2002).
IWP 92 A Sorting Hat That Fails? The Transition from Primary to Secondary School in Germany. Sylke Viola Schnepf (July 2002).
IWP 93 When the Invisible Hand Rocks the Cradle: New Zealand Children in a Time of Change. Alison J. Blaiklock, Cynthia A. Kiro, Michael Belgrave, Will Low, Eileen Davenport, Ian B. Hassall. (July 2002).
IWP 94 Child Poverty in English-Speaking Countries. John Micklewright. (June 2003).
IWP 95 How High is Infant Mortality in Central and Eastern Europe and the CIS? Nadya Aleshina and Gerry Redmond. (July 2003).
IWP 96 The Subterranean Child Labour Force: Subcontracted Home Based Manufacturing in Asia. Santosh Mehrotra and Mario Biggeri.
IWP 97 Social Protection in the Informal Economy: Home Based Women Workers and Outsourced Manufacturing in Asia. Santosh Mehrotra and Mario Biggeri.
#