Embed Size (px)
Citation preview
1
C H A PTER 1
HOW I CAME TO WONDER ABOUT CLIMATE CHANGE
“In the fields of observation, chance favors only the prepared mind.” —Louis Pasteur, 1854
W hat should I do if this volcano starts to erupt? I’m 19 years old, climbing to the summit of an active volcano in Alaska with my Dartmouth College professor and life-long mentor, Bob Decker. He was already recognized
as a world-class expert on active volcanoes, and he went on to be Scientist in Charge at the Hawaiian Volcano Observatory and President of the International Association of Volcanology and Chemistry of the Earth’s Interior.
We are walking up the side of Mt. Trident, a volcano named for its three prominent peaks, but we are on a new, fourth peak that has grown nearly 1000 feet (300 meters) vertically in the past ten years. We’ve studied this volcano from distant hill-tops, from circling around it in a very small airplane, and from pictures of recent eruptions in the files of the National Park Service. Now we are on the ground, exploring the details up close and personal, walking where very few people have been before.
2 | WHAT REALLY CAUSES GLOBAL WARMING?
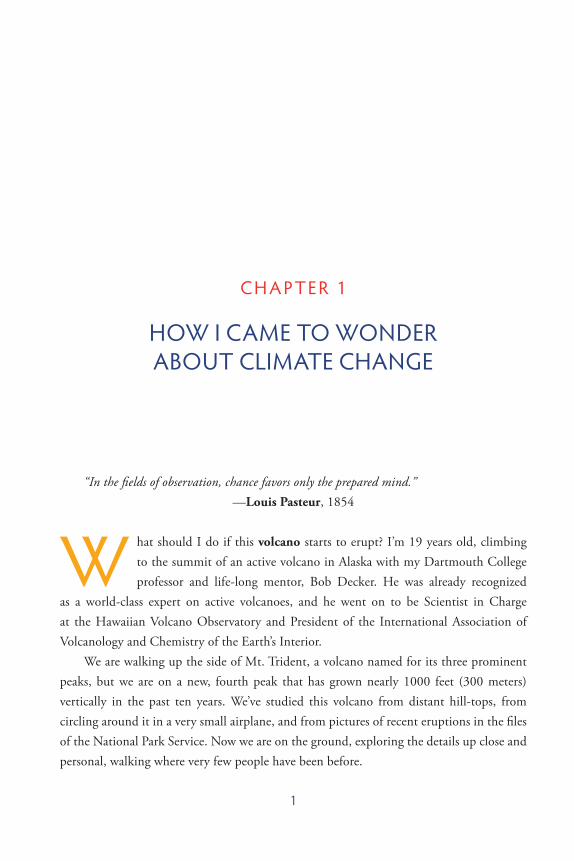
Katmai National Monument, 250 miles southwest of Anchorage, Alaska, is the size of the state of Connecticut, but it is remote country, with only one 23-mile-long dirt road, accessed by float plane. This one-lane, primitive road, still under construction in 1963, heads southeast from Brooks Camp, taking tourists to an overlook from which they can see the Valley of 10,000 Smokes and many volcanoes. We wave goodbye, to the bus driver, shoulder our packs, and hike south for two days through the Valley of 10,000 Smokes and through Katmai Pass for our first glimpse of Trident volcano (Figure 1.1).
Figure 1.1 In 1912, Mt. Katmai erupted, disgorging a huge pyroclastic flow from Novarupta, forming the Valley of 10,000 Smokes. Mt. Trident was just to the south. The red line shows the road from Brooks Camp to the Overlook.
The Valley of 10,000 Smokes was named by Robert Griggs, leader of a National Geographic Society expedition in 1916, whose objective was to explore the source of the 1912 eruption of Mt. Katmai, the largest volcanic eruption of the 20th century. Griggs had landed by ship in Katmai Bay, and had then hiked northward along the Katmai River Delta, up past Mt. Trident to Katmai Pass. “The sight that flashed into view as we surmounted the hillock was one of the most amazing visions ever beheld by mortal eye,” he wrote. “The whole valley as far as the eye could reach was full of hundreds, no thousands—literally, tens of thousands—of smokes curling up from its fissured floor.”10 A frothy cloud of volcanic gases and rock fragments, variously referred to as a pyroclastic flow, a glowing avalanche, or a nuée ardente, had flowed out of the Novarupta vent, filling the valley within minutes with deposits that, when cooled, would become a dense, flinty rock called welded tuff capped with a light, frothy rock
How I Came to Wonder About Climate Change | 3
called pumice. In 1965, I measured a thickness of the valley fill in one prominent location as 98 feet (30 m), after substantial erosion, but some think that the pyroclastic flow could have been as much as 689 feet (210 m) thick in places.11 A similar flow in 1902, just ten years before the Katmai eruption, had buried the town of St. Pierre in the Lesser Antilles arc of the Caribbean, killing 30,000 people instantly. In 1963, the Valley of 10,000 Smokes had just a few steaming vents left, and they were barely hot enough to form steam.
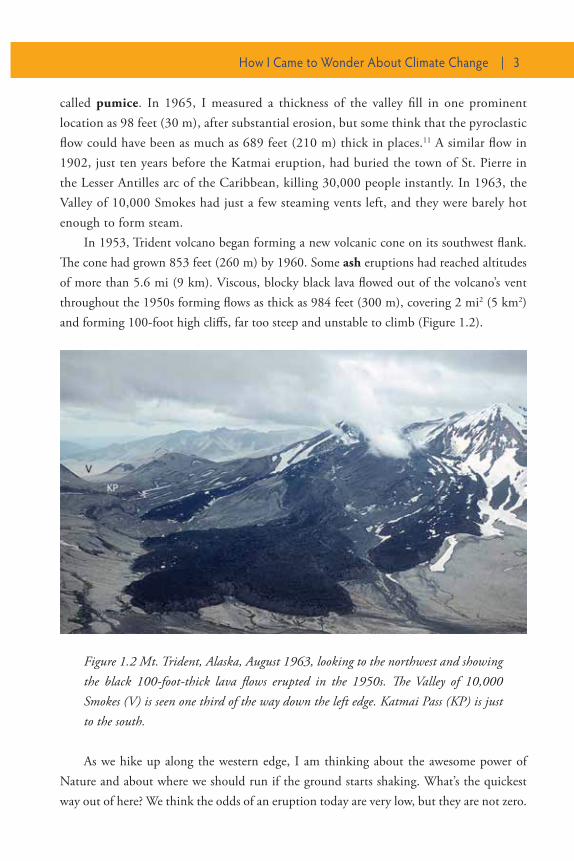
In 1953, Trident volcano began forming a new volcanic cone on its southwest flank. The cone had grown 853 feet (260 m) by 1960. Some ash eruptions had reached altitudes of more than 5.6 mi (9 km). Viscous, blocky black lava flowed out of the volcano’s vent throughout the 1950s forming flows as thick as 984 feet (300 m), covering 2 mi2 (5 km2) and forming 100-foot high cliffs, far too steep and unstable to climb (Figure 1.2).
Figure 1.2 Mt. Trident, Alaska, August 1963, looking to the northwest and showing the black 100-foot-thick lava flows erupted in the 1950s. The Valley of 10,000 Smokes (V) is seen one third of the way down the left edge. Katmai Pass (KP) is just to the south.
As we hike up along the western edge, I am thinking about the awesome power of Nature and about where we should run if the ground starts shaking. What’s the quickest way out of here? We think the odds of an eruption today are very low, but they are not zero.
4 | WHAT REALLY CAUSES GLOBAL WARMING?
I reflect on the lengths to which scientists are willing to go in order to collect quality data. Are we crazy? The volcano actually did explode just three years later.
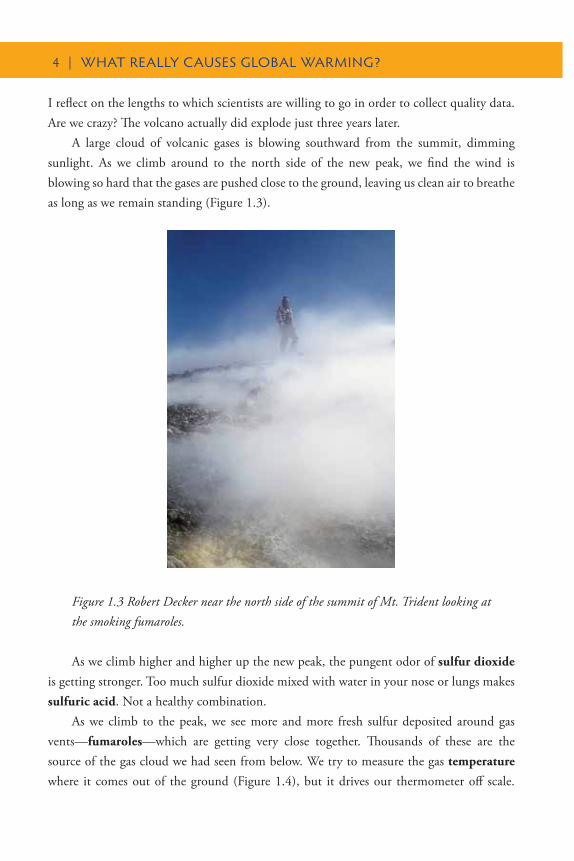
A large cloud of volcanic gases is blowing southward from the summit, dimming sunlight. As we climb around to the north side of the new peak, we find the wind is blowing so hard that the gases are pushed close to the ground, leaving us clean air to breathe as long as we remain standing (Figure 1.3).
Figure 1.3 Robert Decker near the north side of the summit of Mt. Trident looking at the smoking fumaroles.
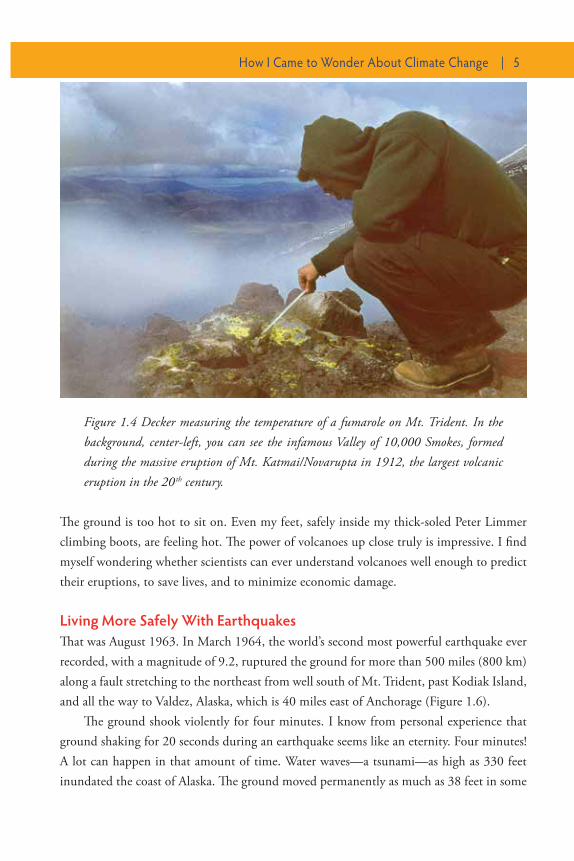
As we climb higher and higher up the new peak, the pungent odor of sulfur dioxide is getting stronger. Too much sulfur dioxide mixed with water in your nose or lungs makes sulfuric acid. Not a healthy combination.
As we climb to the peak, we see more and more fresh sulfur deposited around gas vents—fumaroles—which are getting very close together. Thousands of these are the source of the gas cloud we had seen from below. We try to measure the gas temperature where it comes out of the ground (Figure 1.4), but it drives our thermometer off scale.
How I Came to Wonder About Climate Change | 5
The ground is too hot to sit on. Even my feet, safely inside my thick-soled Peter Limmer climbing boots, are feeling hot. The power of volcanoes up close truly is impressive. I find myself wondering whether scientists can ever understand volcanoes well enough to predict their eruptions, to save lives, and to minimize economic damage.
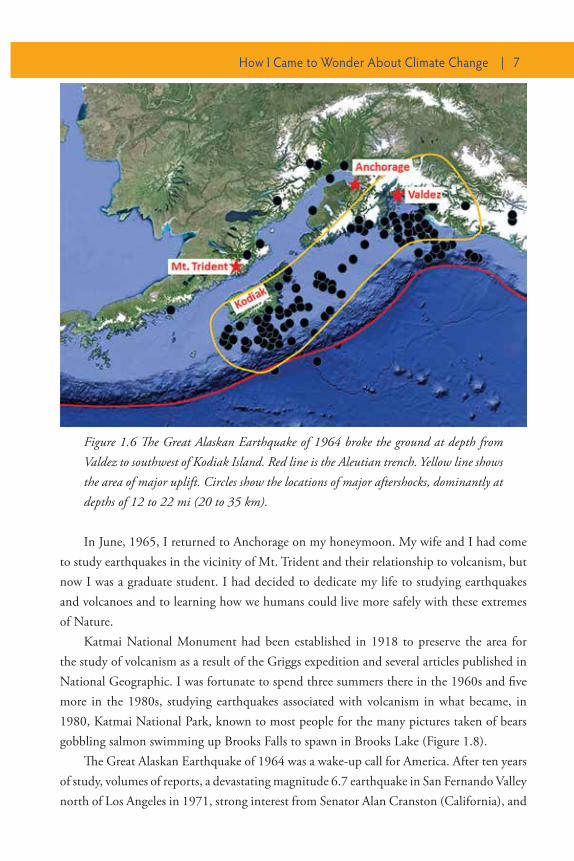
Living More Safely With EarthquakesThat was August 1963. In March 1964, the world’s second most powerful earthquake ever recorded, with a magnitude of 9.2, ruptured the ground for more than 500 miles (800 km) along a fault stretching to the northeast from well south of Mt. Trident, past Kodiak Island, and all the way to Valdez, Alaska, which is 40 miles east of Anchorage (Figure 1.6).
The ground shook violently for four minutes. I know from personal experience that ground shaking for 20 seconds during an earthquake seems like an eternity. Four minutes! A lot can happen in that amount of time. Water waves—a tsunami—as high as 330 feet inundated the coast of Alaska. The ground moved permanently as much as 38 feet in some
Figure 1.4 Decker measuring the temperature of a fumarole on Mt. Trident. In the background, center-left, you can see the infamous Valley of 10,000 Smokes, formed during the massive eruption of Mt. Katmai/Novarupta in 1912, the largest volcanic eruption in the 20th century.
6 | WHAT REALLY CAUSES GLOBAL WARMING?
locations. Landslides and destroyed buildings were widespread, but thankfully population density was low. Only 139 people were killed, most due to the water waves. In 1976, a hundred times smaller earthquake of magnitude 7.5 in densely populated Tangshan, China, is reported to have killed 655,000 people in 16 seconds of severe ground shaking.
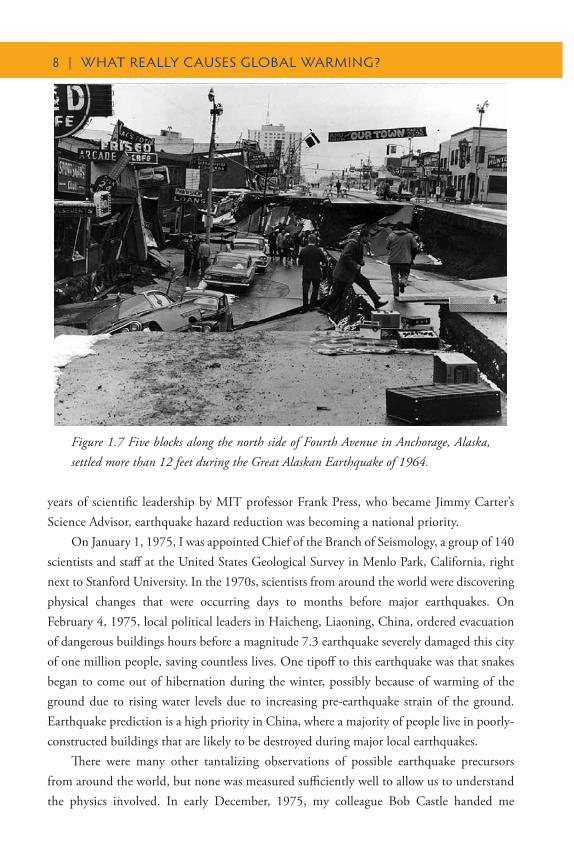
When I arrived back in Anchorage in June, I could see where five blocks of stores along the north side of Fourth Avenue had sunk 12 feet (Figure 1.7).
While I was eating dinner on the top floor of the Anchorage Westward Hotel, the waiter, with eyes as big as saucers, explained to me how everything in that large room slid from wall to wall as the building swayed back and forth for four minutes. The awesome power of the Great Alaskan Earthquake of 1964 made Mt. Trident seem pretty insignificant. By studying earthquakes, I wondered, could we predict them? Could scientists help us build communities that would be less vulnerable to Nature’s wrath?
Figure 1.5 The author examining a bread crust bomb erupted from Mt. Trident. As this 7-foot high block of lava was ejected into the air, the outside chilled, forming a crust while the inside continued to expand.
How I Came to Wonder About Climate Change | 7
In June, 1965, I returned to Anchorage on my honeymoon. My wife and I had come to study earthquakes in the vicinity of Mt. Trident and their relationship to volcanism, but now I was a graduate student. I had decided to dedicate my life to studying earthquakes and volcanoes and to learning how we humans could live more safely with these extremes of Nature.
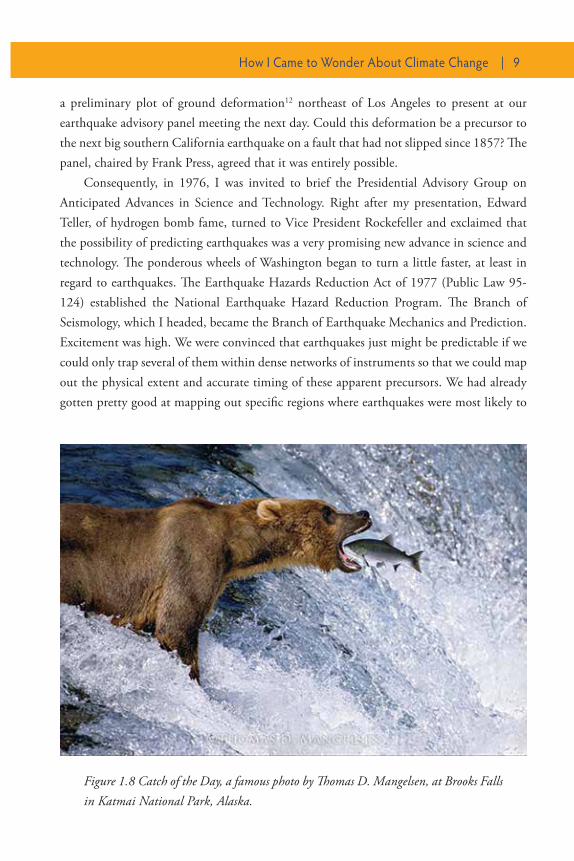
Katmai National Monument had been established in 1918 to preserve the area for the study of volcanism as a result of the Griggs expedition and several articles published in National Geographic. I was fortunate to spend three summers there in the 1960s and five more in the 1980s, studying earthquakes associated with volcanism in what became, in 1980, Katmai National Park, known to most people for the many pictures taken of bears gobbling salmon swimming up Brooks Falls to spawn in Brooks Lake (Figure 1.8).
The Great Alaskan Earthquake of 1964 was a wake-up call for America. After ten years of study, volumes of reports, a devastating magnitude 6.7 earthquake in San Fernando Valley north of Los Angeles in 1971, strong interest from Senator Alan Cranston (California), and
Figure 1.6 The Great Alaskan Earthquake of 1964 broke the ground at depth from Valdez to southwest of Kodiak Island. Red line is the Aleutian trench. Yellow line shows the area of major uplift. Circles show the locations of major aftershocks, dominantly at depths of 12 to 22 mi (20 to 35 km).
8 | WHAT REALLY CAUSES GLOBAL WARMING?
years of scientific leadership by MIT professor Frank Press, who became Jimmy Carter’s Science Advisor, earthquake hazard reduction was becoming a national priority.
On January 1, 1975, I was appointed Chief of the Branch of Seismology, a group of 140 scientists and staff at the United States Geological Survey in Menlo Park, California, right next to Stanford University. In the 1970s, scientists from around the world were discovering physical changes that were occurring days to months before major earthquakes. On February 4, 1975, local political leaders in Haicheng, Liaoning, China, ordered evacuation of dangerous buildings hours before a magnitude 7.3 earthquake severely damaged this city of one million people, saving countless lives. One tipoff to this earthquake was that snakes began to come out of hibernation during the winter, possibly because of warming of the ground due to rising water levels due to increasing pre-earthquake strain of the ground. Earthquake prediction is a high priority in China, where a majority of people live in poorly-constructed buildings that are likely to be destroyed during major local earthquakes.
There were many other tantalizing observations of possible earthquake precursors from around the world, but none was measured sufficiently well to allow us to understand the physics involved. In early December, 1975, my colleague Bob Castle handed me
Figure 1.7 Five blocks along the north side of Fourth Avenue in Anchorage, Alaska, settled more than 12 feet during the Great Alaskan Earthquake of 1964.
How I Came to Wonder About Climate Change | 9
a preliminary plot of ground deformation12 northeast of Los Angeles to present at our earthquake advisory panel meeting the next day. Could this deformation be a precursor to the next big southern California earthquake on a fault that had not slipped since 1857? The panel, chaired by Frank Press, agreed that it was entirely possible.
Consequently, in 1976, I was invited to brief the Presidential Advisory Group on Anticipated Advances in Science and Technology. Right after my presentation, Edward Teller, of hydrogen bomb fame, turned to Vice President Rockefeller and exclaimed that the possibility of predicting earthquakes was a very promising new advance in science and technology. The ponderous wheels of Washington began to turn a little faster, at least in regard to earthquakes. The Earthquake Hazards Reduction Act of 1977 (Public Law 95-124) established the National Earthquake Hazard Reduction Program. The Branch of Seismology, which I headed, became the Branch of Earthquake Mechanics and Prediction. Excitement was high. We were convinced that earthquakes just might be predictable if we could only trap several of them within dense networks of instruments so that we could map out the physical extent and accurate timing of these apparent precursors. We had already gotten pretty good at mapping out specific regions where earthquakes were most likely to
Figure 1.8 Catch of the Day, a famous photo by Thomas D. Mangelsen, at Brooks Falls in Katmai National Park, Alaska.
10 | WHAT REALLY CAUSES GLOBAL WARMING?
occur—regions known as seismic gaps, where no earthquakes had occurred for decades to centuries. Now, careful scientific observations and research might provide a way to save many lives.
Very soon, however, we began to realize that the physics of earthquake prediction might be easier than the sociology. In the midst of a research program in which you are trying to figure out reliable ways to predict earthquakes, how do you warn people that a major earthquake might occur tomorrow that could kill them, but you are only 5% certain? What action is appropriate if a devastating event is possible within a certain time interval but not highly likely? This made me reflect on our decision that it was okay to explore an active volcano up close, when we thought the likelihood of an eruption was low. Many volcanologists have done that. A few, however, did not return.
If we had credible information that an earthquake might occur, we realized that we had no choice but to communicate what we knew to the people at risk as clearly as we could, but how should we craft our message to make the information most useful? How could we help people prepare to make critical decisions rapidly if a prediction was issued?
We put instruments along many faults where earthquakes were highly likely, hoping to record at least one within a dense network of stations, but to our frustration, no earthquakes came out to play. They were apparently not on the same schedule as federal legislation.
We also found that good scientists, when faced with very sketchy data suggesting that many people could die, sometimes had trouble remaining completely objective. Each of them had a heart. They cared about the people at risk, and they seemed ready to take action even when the evidence was less than compelling. So we formed earthquake prediction review committees to help individual scientists to be as objective as possible before making critical decisions that might either save lives or cause unwarranted disruption.
Within a decade, however, with no large earthquakes occurring near our new instruments, we began to move more of the funding from prediction to hazard reduction—to making communities more resilient for when earthquakes do strike. The possibility of predicting earthquakes drove the establishment of the National Earthquake Hazard Reduction Program, but in America where most people live in wood-frame homes and well-engineered larger structures that generally survive earthquakes well, we decided that we could get more bang for the buck by reducing hazards and learning how to live more safely with major earthquakes.
Scientists still operate many thousands of instruments for locating earthquakes, monitoring potential precursors, and measuring deformation of the ground as it stores strain, which will be released in a future earthquake. Modern instrumentation is much
How I Came to Wonder About Climate Change | 11
more precise and covers much larger regions than possible in the 1970s, but predicting the moment when that strain will be released is still elusive.
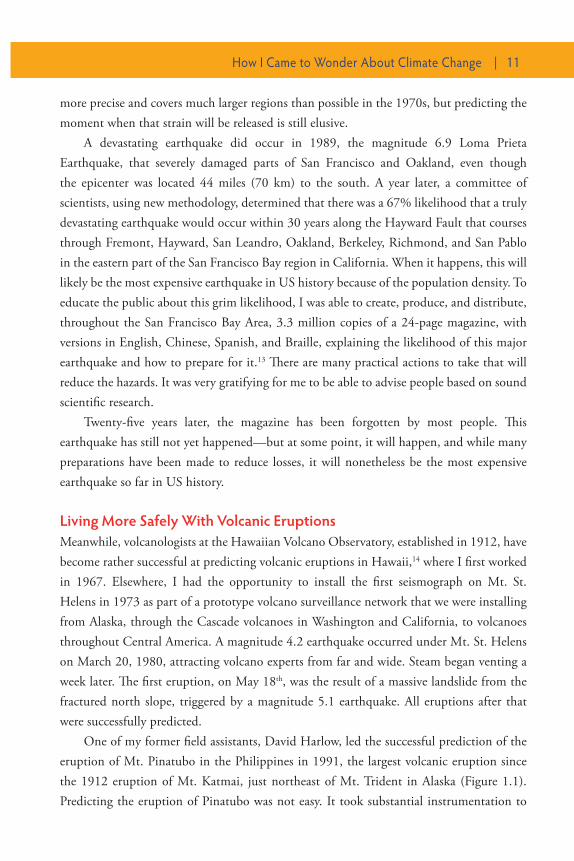
A devastating earthquake did occur in 1989, the magnitude 6.9 Loma Prieta Earthquake, that severely damaged parts of San Francisco and Oakland, even though the epicenter was located 44 miles (70 km) to the south. A year later, a committee of scientists, using new methodology, determined that there was a 67% likelihood that a truly devastating earthquake would occur within 30 years along the Hayward Fault that courses through Fremont, Hayward, San Leandro, Oakland, Berkeley, Richmond, and San Pablo in the eastern part of the San Francisco Bay region in California. When it happens, this will likely be the most expensive earthquake in US history because of the population density. To educate the public about this grim likelihood, I was able to create, produce, and distribute, throughout the San Francisco Bay Area, 3.3 million copies of a 24-page magazine, with versions in English, Chinese, Spanish, and Braille, explaining the likelihood of this major earthquake and how to prepare for it.13 There are many practical actions to take that will reduce the hazards. It was very gratifying for me to be able to advise people based on sound scientific research.
Twenty-five years later, the magazine has been forgotten by most people. This earthquake has still not yet happened—but at some point, it will happen, and while many preparations have been made to reduce losses, it will nonetheless be the most expensive earthquake so far in US history.
Living More Safely With Volcanic EruptionsMeanwhile, volcanologists at the Hawaiian Volcano Observatory, established in 1912, have become rather successful at predicting volcanic eruptions in Hawaii,14 where I first worked in 1967. Elsewhere, I had the opportunity to install the first seismograph on Mt. St. Helens in 1973 as part of a prototype volcano surveillance network that we were installing from Alaska, through the Cascade volcanoes in Washington and California, to volcanoes throughout Central America. A magnitude 4.2 earthquake occurred under Mt. St. Helens on March 20, 1980, attracting volcano experts from far and wide. Steam began venting a week later. The first eruption, on May 18th, was the result of a massive landslide from the fractured north slope, triggered by a magnitude 5.1 earthquake. All eruptions after that were successfully predicted.
One of my former field assistants, David Harlow, led the successful prediction of the eruption of Mt. Pinatubo in the Philippines in 1991, the largest volcanic eruption since the 1912 eruption of Mt. Katmai, just northeast of Mt. Trident in Alaska (Figure 1.1). Predicting the eruption of Pinatubo was not easy. It took substantial instrumentation to
12 | WHAT REALLY CAUSES GLOBAL WARMING?
locate and monitor the earthquakes under the volcano, to measure ground deformation and changes in gas emissions, and to monitor and evaluate observable changes. It took close coordination with local disaster experts and with an American general who was in charge of nearby US Clark Air Force Base. The base was evacuated just before the eruption, was damaged by the eruption, and was abandoned just after the eruption. This successful prediction took a handful of scientists working around the clock, following their intuition honed by years of experience with other volcanic eruptions that they were not able to predict. Their agony and their ecstasy is captured in an excellent documentary “In the Path of a Killer Volcano: The Eruption of Mount Pinatubo,” available on YouTube.15
Active volcanoes are now monitored around the world by local volcanologists with help from volcano experts from many other countries. Felt earthquakes and minor eruptions often occur weeks to months before an awakening volcano becomes dangerous to inhabitants of the region. Scientists are getting quite good at reacting to these early signs of activity. We are learning how to live more safely with volcanic eruptions.
Hazard maps have now been prepared for most potentially active volcanoes throughout the United States. These maps illustrate, for example, the paths of likely mud flows from Mt. Rainier into the densely populated Seattle, Washington area and airborne hazards along the Aleutian Island volcanic arc from Alaska to Russia—one of the busiest airline routes in the world.
Science, when done carefully, can save lives, can reduce losses, and can allay fears. I tell the foregoing story to emphasize that it is only since the Great Alaskan Earthquake of 1964 that scientists have made rapid progress in learning how to live more safely with earthquakes and volcanoes. I emphasize my role because I suspect that my decades of experience with earthquakes, volcanic eruptions, public policy, and public safety prepared me to notice a significant enigma in climate science and to undertake the careful and thorough investigations that led to the science described in this book. What a joy it is to work on something that makes the world safer for everyone and to be able to work outside, around the world, trying to understand Nature!
Living More Safely With ClimateThe geologic record is replete with examples of geologically sudden changes in volcanism and associated changes in climate over decades, centuries, and millennia. For example, as noted in the Overview, studies of traces of ancient volcanic activity in dated Greenland ice cores have revealed that from 100,000 to 10,000 years ago, the world suddenly popped out of a major ice age 25 times within one, two, or three decades and then each time drifted back into the ice age over centuries to millennia. These cycles occurred, on average, once
How I Came to Wonder About Climate Change | 13
every 3600 years. Such major and geologically sudden change in climate had a substantial effect on the evolution of Homo sapiens, forcing our ancestors to find ways to adapt, often by migrating. Thus, our scientific studies about how to live more safely with volcanic eruptions are useful for understanding both long-term changes in climate and, as it turns out, short-term changes in weather observed in recent years. These effects on weather will be discussed in Chapter 9.
I retired in 1998 and moved to Jackson, Wyoming, to enjoy Nature by hiking, climbing mountains, rafting rivers, and skiing, and to play my guitar and piano. In 2006, however, Nature called me back into volcanology. While working on a book on an unrelated topic, I
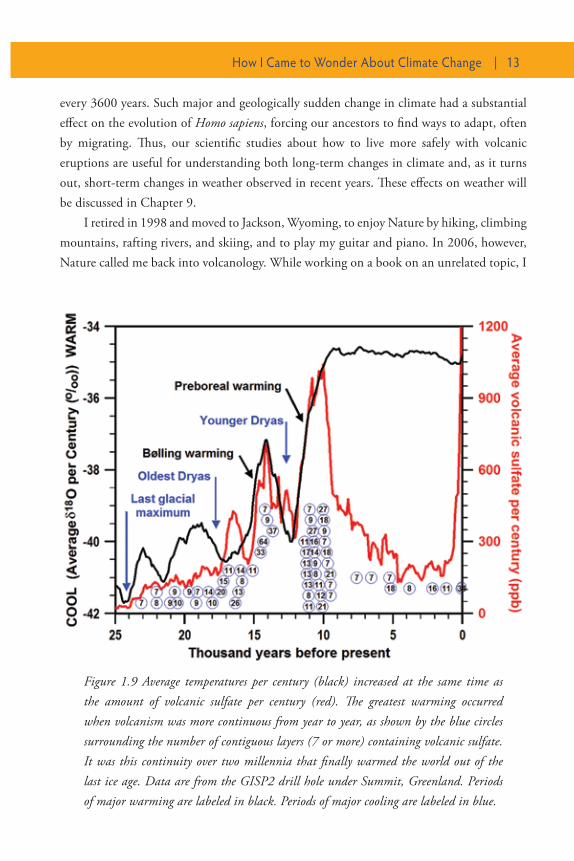
Figure 1.9 Average temperatures per century (black) increased at the same time as the amount of volcanic sulfate per century (red). The greatest warming occurred when volcanism was more continuous from year to year, as shown by the blue circles surrounding the number of contiguous layers (7 or more) containing volcanic sulfate. It was this continuity over two millennia that finally warmed the world out of the last ice age. Data are from the GISP2 drill hole under Summit, Greenland. Periods of major warming are labeled in black. Periods of major cooling are labeled in blue.
14 | WHAT REALLY CAUSES GLOBAL WARMING?
stumbled on very clear evidence that the end of the last ice age, from 11,750 to 9,375 years ago, coincided exactly with massive volcanic eruptions in Iceland (Figure 1.9).
At first, it didn’t make sense to me that these eruptions could have ended an ice age because all volcanologists and climatologists understand that major explosive volcanoes typically cool Earth by nearly one degree Fahrenheit for up to three years. Such cooling has been observed clearly after most large, explosive eruptions in written history. Griggs described such cooling following the eruption of Mt. Katmai in 1912.16 How could volcanoes cause both major cooling and major warming? It didn’t add up, but the data were good, and good, reliable data are the closest things to truth in science.
For many months, I studied the layer-by-layer record of volcanic sulfate concentrations and the oxygen isotope proxy for temperature. That record had been collected by a fine team of scientists. The data had been analyzed carefully, and the possible errors seemed very small. When I showed these data to a leading climatologist, he said “Well, clearly there is something wrong with those data because volcanoes cause cooling,” but the data were reliable. I can now say that the problem was with our understanding of climate.
After a life of climbing active volcanoes and trying to reduce the impact of natural hazards, I had a very clear gut feeling that getting to the bottom of this substantial enigma might lead to very important new insights into climate. The scientists who published these data did not seem concerned about them, but for me they were a red flag. I became obsessed. I decided to put aside almost everything else in my life in order to concentrate on trying to understand what was going on.
A major advantage of retirement is that I could concentrate on my own passions. There is no commuting, no committees to attend, no proposals to write, no promotion panels to please, no required training classes, very few interruptions, and no one to tell me regularly that the ideas I was evaluating were stupid. With the Internet, I had full access to scientific knowledge. I was free to follow my own intuition. The only caveat has been to step back regularly to be sure that I remain well grounded in trustworthy scientific observations.
I read thousands of scientific papers. I thought carefully about the foundational principles of climate change. I questioned in detail many assumptions made by many scientists, and increasingly, a few of these assumptions began to appear less sound. They did not stand up to thoughtful scrutiny, yet most scientists had considered them to be unarguable fact for nearly 150 years.
I studied many aspects of atmospheric chemistry, atmospheric physics, thermodynamics, quantum mechanics, and numerous other related fields. Being retired, I was free to follow my curiosity as to how volcanoes could cause both major cooling and major warming. The quest for understanding was fun, but for more than eight years, I
How I Came to Wonder About Climate Change | 15
went to bed exhausted and confused, waking up early the next morning full of new ideas, refreshed and ready to move forward. I was thrilled to make many new discoveries and even thrilled to discover a little later that some of my new discoveries were simply wrong. Fervent belief in your ideas drives you to work harder, but belief can be an obstacle to good science, and humility helps to keep you honest.
In science, it can be very important to tolerate ambiguity, to let things simmer, to accept possibilities as working hypotheses without having to jump to conclusions that could very well be incorrect. In life, we all need to reach conclusions so that we can decide how to move forward. Often there are time pressures. There is always the need to get on with it, to get it done so we can move on to the next problem to be solved. Scientists often draw conclusions based on their best understanding of common assumptions, based on widely accepted ideas. But when there are reliable data that raise hints of possible problems with widely held ideas, it takes time to become comfortable with new possibilities. The “whack-a-mole” scientist smashes new ideas the minute they pop up their ugly heads. The careful scientist walks a fine line between not jumping to conclusions and being productive. Intuition based on experience plays the major role in navigating along this fine line. Intuition is your brain whispering to you. Do you make time to listen?
Discovering a More Likely Cause of Global WarmingThe evidence for volcanism in the ice layers under Summit, Greenland, consists of sulfate deposits. Sulfate comes from sulfur dioxide, megatons of which are emitted during each volcanic eruption. At first, I thought that the warming was caused by the sulfur dioxide, which is observed to absorb solar energy passing through the atmosphere.17 My thinking was influenced by greenhouse warming theory, which assumes that carbon dioxide causes global warming because it is observed to absorb infrared energy radiated by Earth as it passes upward through the atmosphere and is then thought to re-radiate it back down to the surface, thus causing warming. The sulfur dioxide story, however, just wasn’t adding up quantitatively.
Eventually, after publishing two papers that developed this story, I came to realize that sulfur dioxide was actually just the “footprint” of volcanism—a measure of how active volcanoes were at any given time. The real breakthrough came when I came across a paper reporting that the lowest concentrations of stratospheric ozone ever recorded were for the two years after the 1991 eruption of Mt. Pinatubo, the largest volcanic eruption since the 1912 eruption of Mt. Katmai. As I dug deeper, analyzing ozone records from Arosa, Switzerland18—the longest running observations of ozone in the world, begun in 1927 (Figure 8.15 on page 119)—I found that ozone spiked in the years of most volcanic
16 | WHAT REALLY CAUSES GLOBAL WARMING?
eruptions but dropped dramatically and precipitously in the year following each eruption. There seemed to be a close relationship between volcanism and ozone. What could that relationship be?
The answer was not long in coming. I knew that all volcanoes release hydrogen chloride when they erupt, and I also knew that chlorine from man-made chlorofluorocarbon compounds had been identified in the 1970s as a potent agent of stratospheric ozone depletion. From these two facts, and a third one, I deduced that it must be the depletion of ozone by chlorine in volcanic hydrogen chloride—and not the absorption of solar radiation by sulfur dioxide—that was driving the warming events that followed volcanic eruptions. The third fact in the equation was the well-known interaction of stratospheric ozone with solar radiation.
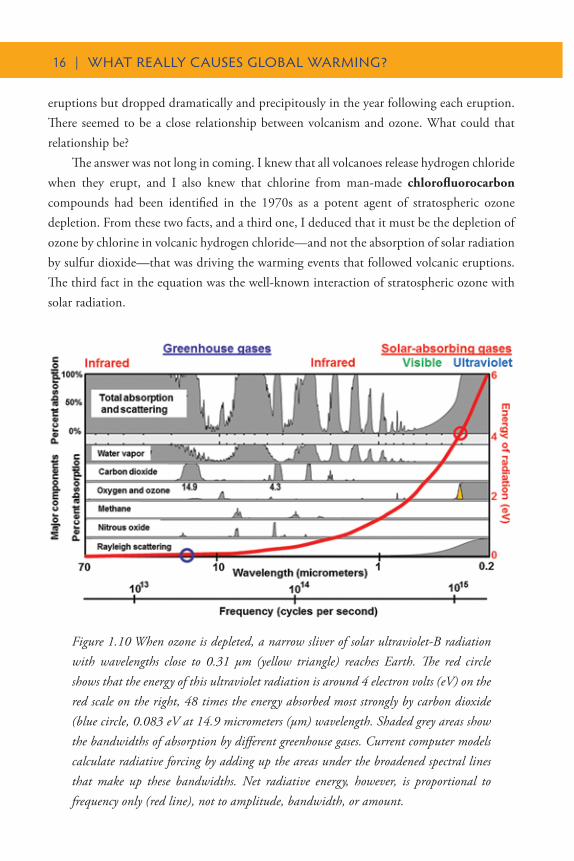
Figure 1.10 When ozone is depleted, a narrow sliver of solar ultraviolet-B radiation with wavelengths close to 0.31 µm (yellow triangle) reaches Earth. The red circle shows that the energy of this ultraviolet radiation is around 4 electron volts (eV) on the red scale on the right, 48 times the energy absorbed most strongly by carbon dioxide (blue circle, 0.083 eV at 14.9 micrometers (µm) wavelength. Shaded grey areas show the bandwidths of absorption by different greenhouse gases. Current computer models calculate radiative forcing by adding up the areas under the broadened spectral lines that make up these bandwidths. Net radiative energy, however, is proportional to frequency only (red line), not to amplitude, bandwidth, or amount.
How I Came to Wonder About Climate Change | 17
The ozone layer, at altitudes of 12 to 19 miles (20 to 30 km) up in the lower stratosphere, absorbs very energetic solar ultraviolet radiation, thereby protecting life on Earth from this very “hot,” DNA-destroying radiation. When the concentration of ozone is reduced, more ultraviolet radiation is observed to reach Earth’s surface, increasing the risk of sunburn and skin cancer. There is no disagreement among climate scientists about this, but I went one step further by deducing that this increased influx of “super-hot” ultraviolet radiation also actually warms Earth.
All current climate models assume that radiation travels through space as waves and that energy in radiation is proportional to the square of the amplitude of these waves and to the bandwidth of the radiation, i.e. to the range of wavelengths or frequencies involved. Figure 1.10 shows the percent absorption for different greenhouse-gases as a function of wavelength or frequency. It is generally assumed that the energy absorbed by greenhouse-gases is proportional to the areas shaded in gray. From this perspective, absorption by carbon dioxide of wavelengths around 14.9 and 4.3 micrometers in the infrared looks much more important than absorption by ozone of ultraviolet-B radiation around 0.31 micrometers. Climate models thus calculate that ultraviolet radiation is relatively unimportant for global warming because it occupies a rather narrow bandwidth in the solar spectrum compared to Earth’s much lower frequency, infrared radiation. The models neglect the fact, shown by the red line in Figure 1.10 and explained in Chapter 4, that due to its higher frequency, ultraviolet radiation (red circle) is 48 times more energy-rich, 48 times “hotter,” than infrared absorbed by carbon dioxide (blue circle), which means that there is a great deal more energy packed into that narrow sliver of ultraviolet (yellow triangle) than there is in the broad band of infrared. This actually makes very good intuitive sense. From personal experience, we all know that we get very hot and are easily sunburned when standing in ultraviolet sunlight during the day, but that we have trouble keeping warm at night when standing in infrared energy rising from Earth.
These flawed assumptions in the climate models are based on equations that were written in 1865 by James Clerk Maxwell and have been used very successfully to design every piece of electronics that we depend on today, including our electric grid. Maxwell assumed that electromagnetic energy travels as waves through matter, air, and space. His wave equations seem to work well in matter, but not in space. Even though Albert Michelson and Edward Morley demonstrated experimentally in 1887 that there is no medium in space, no so-called luminiferous aether, through which waves could travel, most physicists and climatologists today still assume that electromagnetic radiation does in fact travel through space at least partially in the form of waves.
18 | WHAT REALLY CAUSES GLOBAL WARMING?
They also erroneously assume that energy in these imagined waves is proportional to the square of their amplitude, which is true in matter, but cannot be true in space. They calculate that there is more energy in the broad band of low-frequency infrared radiation emitted by Earth and absorbed by greenhouse gases than there is in the narrow sliver of additional high-frequency ultraviolet solar radiation that reaches Earth when ozone is depleted (Figure 1.10). Nothing could be further from the truth.
The story got even more convoluted by the rise of quantum mechanics at the dawn of the 20th century when Max Planck and Albert Einstein introduced the idea that energy in light is quantized. These quanta of light ultimately became known as photons. In order to explain the photoelectric effect, Einstein proposed that radiation travels as particles, a concept that scientists and natural philosophers had debated for 2500 years before him. I will explain in Chapter 4 why photons traveling from Sun cannot physically exist, even though they provide a very useful mathematical shorthand.
Max Planck postulated, in 1900, that the energy in radiation is equal to vibrational frequency times a constant, as is true of an atomic oscillator, in which a bond holding two atoms together is oscillating in some way. He needed this postulate in order to derive an equation by trial and error that could account for and calculate the observed properties of radiation. Planck’s postulate led to Albert Einstein’s light quanta and to modern physics, dominated by quantum mechanics and quantum electrodynamics. Curiously, however, Planck didn’t fully appreciate the far-reaching implications of his simple postulate, which states that the energy in radiation is equal to frequency times a constant. He simply saw it as a useful mathematical trick.
As I dug deeper, it took me several years to become comfortable with those implications. It was not the way we were trained to think. It was not the way most physicists think, even today. Being retired turned out to be very useful because I could give my brain time to mull this over. Gradually, it began to make sense. The take-away message for me was that the energy in the kind of ultraviolet radiation that reaches Earth when ozone is depleted is 48 times “hotter” than infrared energy absorbed by greenhouse gases. In sufficient quantities, it should be correspondingly 48 times more effective in raising Earth’s surface temperature than the weak infrared radiation from Earth’s surface that is absorbed by carbon dioxide in the atmosphere and supposedly re-radiated back to the ground.
There simply is not enough energy involved with greenhouse gases to have a significant effect on global warming. Reducing emissions of greenhouse gases will therefore not be effective in reducing global warming. This conclusion is critical right now because most of the world’s nations are planning to meet in Paris, France, in late November 2015, to agree on legally binding limits to greenhouse-gas emissions. Such limits would be very expensive
How I Came to Wonder About Climate Change | 19
as well as socioeconomically disruptive. We depend on large amounts of affordable energy to support our lifestyles, and developing countries also depend on large amounts of affordable energy to improve their lifestyles. Increasing the cost of energy by even a few percent would have major negative financial and societal repercussions.
This book is your chance to join my odyssey. You do not need to have majored in science or even to be familiar with physics, chemistry, mathematics, or climatology. You just need to be curious and be willing to work. You also need to be willing to think critically about observations, and you may need to reevaluate some of your own ideas about climate. You will learn that there was a slight misunderstanding in science made back in the 1860s that has had profound implications for understanding climate change and physics today. It took me many years of hard work to gain this insight, and I will discuss that in Chapter 4. First, however, we need to look at some fundamental observations that cause us to wonder: Could the greenhouse warming theory of climate change actually be mistaken?

![Welcome [] · 2021. 1. 17. · Come and See Take just a moment to reflect on this scene. I wonder … what stood out for you? I wonder … what questions came to your mind? I wonder](https://img.pdfslide.net/doc/110x75/60b077dc53296363b4185476/welcome-2021-1-17-come-and-see-take-just-a-moment-to-reflect-on-this-scene.jpg)