Embed Size (px)
Citation preview
Media Psychology, 00:1–38, 2015
Copyright © Taylor & Francis Group, LLC
ISSN: 1521-3269 print/1532-785X online
DOI: 10.1080/15213269.2015.1015740
How Immersive Is Enough?A Meta-Analysis of the Effect of Immersive
Technology on User Presence
JAMES J. CUMMINGS and JEREMY N. BAILENSONDepartment of Communication, Stanford University, Stanford, California, USA
The concept of presence, or ‘‘being there’’ is a frequently em-
phasized factor in immersive mediated environments. It is often
assumed that greater levels of immersive quality elicit higher lev-
els of presence, in turn enhancing the effectiveness of a medi-
ated experience. To investigate this assumption the current meta-
analysis synthesizes decades of empirical research examining the
effect of immersive system technology on user experiences of pres-
ence. Aggregating 115 effect sizes from 83 studies, it finds that
technological immersion has a medium-sized effect on presence.
Additionally, results show that increased levels of user-tracking,
the use of stereoscopic visuals, and wider fields of view of visual
displays are significantly more impactful than improvements tomost other immersive system features, including quality of visual
and auditory content. These findings are discussed in light of
theoretical accounts of the presence construct as well as practical
implications for design.
MEDIATED ENVIRONMENTS, PRESENCE,
AND IMMERSION
Even though Ivan Sutherland (1965) published his seminal essay, ‘‘The Ulti-mate Display,’’ almost 50 years ago, the technology that is able to produce a‘‘looking glass into the mathematical wonderland’’ has only become widelyavailable in the past few years (see Blascovich & Bailenson, 2011, for a
The authors would like to give special thanks to Leo Yeykelis, Nick Yee, Joris Janssen,and Mailyn Fidler for their assistance—technical, advisory, or other—with this project.
Address correspondence to James J. Cummings, Department of Communication, StanfordUniversity, 450 Serra Mall, Building 120, Room 110, Stanford, CA 94305, USA. E-mail: [email protected]
1
Dow
nloa
ded
by [
171.
67.2
16.2
1] a
t 10:
54 0
5 Ju
ne 2
015
2 J. J. Cummings and J. N. Bailenson
historical account). Sutherland’s first head-mounted display was nicknamed‘‘the Sword of Damocles.’’ It was so large and bulky it had to be boltedinto the ceiling and users expressed fears of bodily harm if the ceilingmount happened to break while they wore it. Times have changed, and thetechnology required to achieve this looking glass is becoming cheaper andless cumbersome. However, as we transition into an era in which people aredesigning systems that immerse students, corporate collaborators, tourists,moviegoers, and videogame players into digital media experiences whichlook, sound, feel, and smell just like real ones, it is critical to understandhow technology affects experience. The purpose of this article is to examinethe degree of correlation between immersion—defined as a technologicalquality of media—and presence—defined as the psychological experienceof ‘‘being there.’’
The concept of presence, or a sense of being there, is a frequentlyemphasized factor when discussing mediated environments. The assumptionthat achieving presence should be a goal of the design of virtual environ-ments (VEs) pervades both applied and academic work. An increased senseof presence is often thought to magnify user effects (e.g., the extent to whichuser responses to virtual stimuli and virtual interactions resemble parallelresponses to real-world counterparts) and, in turn, to increase the effective-ness of mediated environment applications (e.g., the practical use of suchenvironments as tools for entertainment, learning, training, or therapy; Nunez& Blake, 2001; Price & Anderson, 2006; Slater & Wilbur, 1997; Tamborini &Bowman, 2010; Tamborini & Skalski, 2006).
Over the last 20 years researchers have defined and explicated theconcept of presence in a number of different ways (e.g., Heeter, 1992;K. M. Lee, 2004a; Lombard & Ditton, 1997; McMahan, 2003; Slater, 2009;Slater & Wilbur, 1997; Steuer, 1992; Witmer & Singer, 1998). The flagshipjournal of the field studying presence in virtual reality is aptly titled Presence:
Teleoperators and Virtual Environments. The first volume of Presence waspublished in 1992, and contains work by some of the pioneers who stillremain active leaders in the field, for example, Frank Biocca, Carrie Heeter,Jack Loomis, Sandy Pentland, and Thad Starner, to name a few. The articlesacross this issue offered an early attempt to provide theory and methodsthat describe the mental processes that occur when one gets psychologicallydrawn into a virtual world, focusing on the experience of occupying a virtualspace. Biocca (1997) was one of first to hone in on particular elements ofpresence, with K. M. Lee (2004a) later providing a more detailed explication,introducing the concepts of social presence and self-presence, distinct fromthe more traditional spatial emphasis.
Within the literature presence is often related to another similar con-cept—immersion. The exact relationship between these two concepts is attimes confusing , as authors employ the word ‘‘immersion’’ in a variety ofways. In some instances the terms appear synonymous, with ‘‘immersion’’
Dow
nloa
ded
by [
171.
67.2
16.2
1] a
t 10:
54 0
5 Ju
ne 2
015
Immersion Presence Meta-Analysis 3
used to describe the feeling of presence depicted above (e.g., McGloin,Farrar, & Krcmar, 2013). Others have instead described immersion as aspecific subcomponent of a larger presence construct (Witmer & Singer,1998). One clear distinction between presence and immersion—and the onewe draw upon in the present study—is provided by Slater and Wilbur (1997).They suggest that presence in a VE is inherently a function of the user’spsychology, representing the extent to which an individual experiences thevirtual setting as the one in which they are consciously present. On the otherhand, immersion can be regarded as a quality of the system’s technology,an objective measure of the extent to which the system presents a vividvirtual environment while shutting out physical reality. By this account, thetechnological level of immersion afforded by the VE system facilitates thelevel of psychological presence. This relationship has implications, then, forhow one might operationally design for increased presence.
Slater and Wilbur (1997) note that a system is more likely to be immer-sive—or to shut out physical reality—if it a) offers high fidelity simulationsthrough multiple sensory modalities, b) finely maps a user’s virtual bodilyactions to their physical body’s counterparts, and c) removes the participantfrom the external world through self-contained plots and narratives. Suchfeatures are thought to make the interface of the system more transparent,permitting the user to then become psychologically engaged in the virtualtask at hand rather than attending to the input mechanisms themselves. Thatis, the more immersive the system, the more likely an individual will feelpresent within the mediated environment and the more likely that the virtualsetting will dominate over physical reality in determining user responses.
THE FORMATION OF PRESENCE
A number of prominent presence scholars have put forth a theoretical modeloutlining the psychological process by which presence is experienced (Wirthet al., 2007). The model understands the formation of presence as a two-stepprocess. First, the user must draw upon spatial cues to perceive the mediatedenvironment as a plausible space. Second, the user must also then experiencehis or herself as being located within that perceived space. Only then is spa-tial presence achieved. It is in light of this process that Wirth and colleagues(2007) define presence as ‘‘a binary experience, during which perceived self-location and, in most cases, perceived action possibilities are connected to amediated spatial environment, and mental capacities are bound by the me-diated environment instead of reality’’ (p. 497). With this definition in mind,the model describes presence as a two-dimensional construct, comprised ofa) a sense of self-location and b) perceived possibilities to act.
Wirth et al. (2007) note specific media features that may assist witheach step of the formation process—both constructing the spatial mental
Dow
nloa
ded
by [
171.
67.2
16.2
1] a
t 10:
54 0
5 Ju
ne 2
015
4 J. J. Cummings and J. N. Bailenson
representation of the mediated space and then experiencing self-locationwithin that space. Many of the spatial cues used when perceiving a virtualspace are linked to the visual modality, including static monocular cues (e.g.,occlusion, visual field, texture effects), dynamic monocular cues (e.g., motionparallax), and binocular cues (e.g., stereoscopy). Additionally, the mediatedenvironment will more likely be perceived as a plausible space if thesecues are both rich in quality and have a logical consistency. Regarding thesecond step, media factors are also thought to influence the user’s abilityto perceive this virtual space as their primary spatial reference frame ratherthan that of the real world. Indeed, as noted by Balakrishnan and Sundar(2011), this model suggests that the user’s perception of both self-locationand possible actions is at least partially defined by the affordances of themediated environment. These conditions that are thought to promote spatialpresence closely align with those Slater and Wilbur (1997) cite as influentialon a system’s immersive quality. More specifically, this framework aligns withSlater’s (2009) recent description of realistic behavior in virtual reality. Hesuggests that displays and interactive capability are inseparable in determin-ing a system’s immersive quality—with immersive systems being those thatsupport sensorimotor contingencies by which user actions lead to meaningfulchanges in the environment or user perception. According to Slater, suchuser action contingencies help to elicit a place illusion, or the sense of beingthere as described in previous presence literature, while the extent to whichthe environment offers events beyond the user’s control creates the sensethat the environment is actually happening (the plausibility illusion).
HOW IMMERSIVE IS ENOUGH?: QUANTIFYING THE
BENEFITS OF IMMERSIVE QUALITY
Again, the rationale provided by Slater and Wilbur (1997) would suggest thatsystems of higher immersive quality may elicit greater psychological presence(Bowman & McMahan, 2007; Slater, Linakis, Usoh, & Kooper, 1996). As such,we might conclude that a designer seeking to maximize user presence shouldconstruct the most advanced, technologically immersive system possible.Processors with faster update rates, tracking devices with finer scales and lesscumbersome instruments, head mounted displays (HMDs) with wider fieldsof view, stereoscopic visuals and surround-sound, and avatars with photo-realistic faces, expressions, and clothing—the inclusion of these featurescould be expected to cause matching gains in a user’s sense of presence. Interms of the two-step model, this equates to more consistent and rich spatialcues leading to a greater likelihood that the user perceives the mediatedenvironment as spatial and himself as located within it.
Inclusion of all of the above features can, however, also come withcertain costs. First, there is the very real financial expense, as such features
Dow
nloa
ded
by [
171.
67.2
16.2
1] a
t 10:
54 0
5 Ju
ne 2
015
Immersion Presence Meta-Analysis 5
can cost a considerable amount of money—money that may seem wastedwhen new technologies come out an increasingly short time later, with finertracking, faster update rates, or wider fields of view. Second, there is thepragmatic issue of usability—high immersion hardware often correlates withgreater cumbersomeness and calibration requirements, for both the user(e.g., heavy equipment, placement of body markers) and the researcher ortechnician (e.g., acquiring and arranging dedicated spaces). As such, thetheoretically driven push for the most advanced system is often balanced bypractical restriction (Bowman & McMahan, 2007). Individuals constructingvirtual environments and wishing to get the biggest bang for their buck mayfind themselves asking, ‘‘How immersive is enough?’’ In other words, howmuch benefit does the newer or additional technology really add to users’sense of being physically present?
A formal meta-analysis can help answer this question by lending in-sight into the general direction and overall size of the effect of immersivetechnology on user presence. The quantitative steps for combining resultsacross a corpus of studies not only permit researchers to gain a more gestaltestimate of the effect in question, but can also provide insights into in-consistencies through the discovery of potential moderators and mediators(Rosenthal, 1991; Rosenthal & DiMatteo, 2001). Such an analysis would per-mit researchers a more nuanced characterization of the effects of immersivetechnology components, allowing us to tease out the relative added value ofa given feature. In other words, by compiling the various operationalizationsof immersion and their observed effects, a meta-analysis can better informresearchers and others investing in VEs as to what technology is enough fortheir particular projects and for optimizing return on investment. Further, ifparticular technologies are found to lead to stronger effects than others, thisprocess may lend theoretical insight into the formation of presence.
For the purpose of our meta-analysis, we intended to gauge the overalleffect of immersion on presence. Further, we have conducted multiple,separate meta-analyses for individual immersive system components (e.g.,field of view, tracking level, stereoscopy) in order to help identify whichimmersive features are particularly effective in leading to the formation ofpresence.
METHOD
Selection of Candidate Studies
The first step of a meta-analysis is defining the variables of interest, bothindependent and dependent (Rosenthal & DiMatteo, 2001). Candidate studiesfor this meta-analysis needed to include the manipulation of a VE system’slevel of immersion and the subsequent measure of presence experienced
Dow
nloa
ded
by [
171.
67.2
16.2
1] a
t 10:
54 0
5 Ju
ne 2
015
6 J. J. Cummings and J. N. Bailenson
by users. However, for theoretical and practical purposes we restricted thedefinitions of these variables in a few ways.
OPERATIONALIZATIONS OF PRESENCE
First, in operationally defining presence, for the sake of internal validitywe decided that this initial analysis should be restricted to studies in whichpresence was measured through self-report. Other measures sometimes usedinclude body vection, physiological arousal, and memory tests. However, themeaning of many of these measures is open to debate. For example, regard-ing vection posture, leaning forward can be construed as feeling presentand engaged, but leaning back could similarly indicate feeling present andsurprised. Additionally, if a user is feeling more present, there are plausiblearguments for why he or she should be able to remember both more andfewer details on a memory recall test. Therefore, although there is compellingreason to suspect the most promising measures of presence are not self-report (e.g., Bailenson et al., 2004; Slater, 2004), an initial assimilation of thebehavioral, cognitive, and physiological measures were too disparate to meetthe standards of a meta-analysis which combines like dependent variables(Rosenthal & DiMatteo, 2001).
Additionally, this meta-analysis is focused on the form of presence thatthe majority of research has been centered on, and which K. M. Lee (2004a)later explicated as spatial presence: the superordinate feeling of being locatedwithin a virtual space. Indeed, there are simply too few studies in theexisting literature that empirically examine the effect of particular immersivefeatures on social or self-presence for conducting independent meta-analysesregarding these related concepts. To this end, when compiling studies welooked for questionnaire items that generally asked about being in a spacerather than being with other people (social presence or co-presence) or aboutself-identifying as a virtual representation or extension within the mediatedspace (self-presence or body transfer).
Further, many presence questionnaires include subscales measuringother concepts alongside spatial presence that we deemed not appropriatefor this meta-analysis. For instance, some studies measured engagementor involvement, but these have been considered separate concepts for thepurpose of this analysis (a user can feel spatially present in a VE designed tobe boring without feeling engaged in it or cognitively involved). Finally,many questionnaires include items regarding emotion, affect, or arousal.These items were not included in the analysis, as valenced responses andalterations in arousal may be moderated by presence but are not directmeasures of a sense of being there. With these restrictions of dependentself-report measures in mind, we then adhered to a very specific decisiontree when reading through candidate studies: a) if presence (or the syn-onymously used terms general, spatial, or physical presence) or immersion
Dow
nloa
ded
by [
171.
67.2
16.2
1] a
t 10:
54 0
5 Ju
ne 2
015
Immersion Presence Meta-Analysis 7
were reported as stand-alone measures, they were used; if more than onewas reported, their effect sizes were aggregated (see details below); b) ifonly a composite presence score was reported (comprised of subscales forengagement, involvement, affect, or other related but distinct concepts), thenwe were forced to rely on that measure; c) if subscales were reported, wecarefully reviewed the exact questions and decided whether or not to includethem.
OPERATIONALIZATIONS OF IMMERSION
In operationally defining manipulations of immersion, we were guided bythe operationalizations of presence-inducing system factors suggested by thetwo-step formation model (Wirth et al., 2007) and corroborated with lists ofimmersive feature categories found in the literature (Bowman & McMahan,2007). In addition to this top-down process, we were also guided bottom-upby the most common, modal operationalizations of immersion found in theempirical literature. Together, this led to a definition of immersive that largelyemphasizes system configurations or specifications as opposed to aspects ofthe mediated content itself, such as narrative (Rampoldi-Hnilo, Kind, Devries,Tait, & Besecker, 1997), game elements (Song, Kim, Tenzek, & Lee, 2009),violence (Ivory and Kalyanaraman, 2007; Nowak, Krcmar, & Farrar, 2006)or emotional tone (Baños et al., 2004; Grassi, Giaggioli, & Riva, 2008). Thisresulted in the following list of immersive features to be examined throughmeta-analysis:
Tracking level. Tracking level refers to the number and types of degreesof freedom (DOF) with which a user is tracked by an immersive system. Ma-nipulations of this feature include the quality of the input method (e.g., morenatural movement tracking versus abstract controller input). It also refers tostudies that have manipulated the relative (e.g., number of DOF tracked)or absolute (e.g., capacity to take action within the mediated environmentversus simply observing the stimulus) level of tracking in order to measureits influence on feelings of presence.
Stereoscopic vision. Studies investigating this feature manipulatedwhether a given system provided users with monoscopic or stereoscopicvisuals.
Image quality. This composite variable considers a number of elementsthat influence the general quality, realism, and fidelity of visuals provided bya mediated environment. Manipulations of this feature include high versusstandard definition resolution, flicker rates, lighting types, texture mappingquality, and general level of detail or overall realism.
Field of view. This refers to the relative field of the user’s total viewwithin which the environment’s visuals extend. This feature is commonlymanipulated through blinders or the screen size of a head-mounted display(HMD). It is worth noting that, for the purpose of our analyses, this variable
Dow
nloa
ded
by [
171.
67.2
16.2
1] a
t 10:
54 0
5 Ju
ne 2
015
8 J. J. Cummings and J. N. Bailenson
also includes studies in which television or computer screen sizes weremanipulated yet screen resolution and viewing distance were held constant(in effect actually altering the relative field of view of the user).
Sound quality. A number of studies have investigated how the relativepresence of sound may influence user ratings of presence. Manipulations ofthis feature include the presence or absence of all sound, ambient sound,diegetic sound, or spatialized sound, as well as the number of sound chan-nels used.
Update rate. Studies in this category empirically examined how the rateat which the virtual environment is rendered may influence user presence.
User perspective. This feature refers to the manipulation of perspective—first person (from the eyes of the user) versus third person (over the shoulderof or behind the user’s representation or avatar)—through which the userviews the mediated environment.
Overall high versus low. Finally, this category applies to studies in whichmultiple features were manipulated across conditions, thereby producingoperational confounds, preventing the teasing apart of the relative contri-bution of a given feature. For example, a study which compares presenceexperienced while using a HMD with head tracking to that experienced whileusing a desktop PC without any such tracking falls into this category. Further,some high versus low studies compared two or more systems traditionallyconsidered immersive (e.g., a CAVE and a HMD) rather than compare onedistinctly immersive condition to one distinctly non-immersive condition.In such cases, the categorization of high versus low was based upon thedetails of the system as described by the authors (see Table 1 for examples).If a given study provided insufficient details for determining the relativeimmersiveness between the systems used the study was omitted from theanalysis.
In sum, this meta-analysis includes studies that investigated the ma-nipulation of at least one immersive system feature (as operationalized bycorroborating literature) and included a self-reported measure of spatial(general, physical) presence.
SEARCH PROCEDURES
After defining the variables of interest, the second formal step of a meta-analysis according to Rosenthal and DiMatteo (2001) is to systematicallycollect the relevant studies. To do this, we completed keyword searches inthe PsycNET and Communication and Mass Media online databases, as wellas in the Temple University ISPR Telepresence Literature Refshare database.Searches were conducted for any studies including ‘‘presence’’ and/or ‘‘im-mersion’’ and/or ‘‘virtual.’’ Additional searches were also completed for ‘‘pres-ence’’ or ‘‘immersion’’ and a list of key feature terms, including ‘‘update rate,’’‘‘stereoscopy,’’ ‘‘stereoscopic,’’ ‘‘tracking,’’ ‘‘field of view,’’ ‘‘sound,’’ ‘‘user
Dow
nloa
ded
by [
171.
67.2
16.2
1] a
t 10:
54 0
5 Ju
ne 2
015
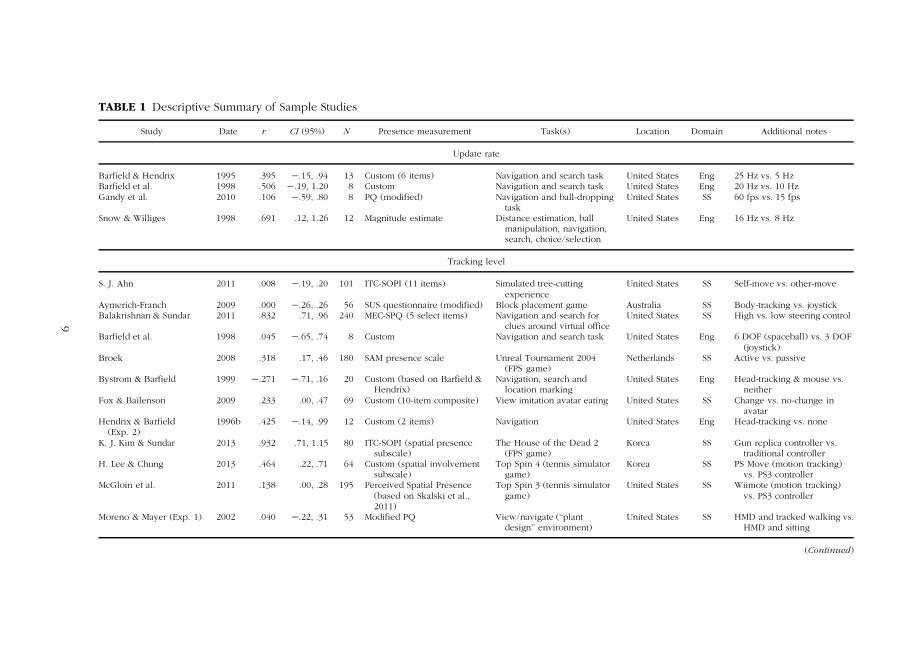
TABLE 1 Descriptive Summary of Sample Studies
Study Date r CI (95%) N Presence measurement Task(s) Location Domain Additional notes
Update rate
Barfield & Hendrix 1995 .395 �.15, .94 13 Custom (6 items) Navigation and search task United States Eng 25 Hz vs. 5 HzBarfield et al. 1998 .506 �.19, 1.20 8 Custom Navigation and search task United States Eng 20 Hz vs. 10 HzGandy et al. 2010 .106 �.59, .80 8 PQ (modified) Navigation and ball-dropping
taskUnited States SS 60 fps vs. 15 fps
Snow & Williges 1998 .691 .12, 1.26 12 Magnitude estimate Distance estimation, ballmanipulation, navigation,search, choice/selection
United States Eng 16 Hz vs. 8 Hz
Tracking level
S. J. Ahn 2011 .008 �.19, .20 101 ITC-SOPI (11 items) Simulated tree-cuttingexperience
United States SS Self-move vs. other-move
Aymerich-Franch 2009 .000 �.26, .26 56 SUS questionnaire (modified) Block placement game Australia SS Body-tracking vs. joystickBalakrishnan & Sundar 2011 .832 .71, .96 240 MEC-SPQ (5 select items) Navigation and search for
clues around virtual officeUnited States SS High vs. low steering control
Barfield et al. 1998 .045 �.65, .74 8 Custom Navigation and search task United States Eng 6 DOF (spaceball) vs. 3 DOF(joystick)
Broek 2008 .318 .17, .46 180 SAM presence scale Unreal Tournament 2004(FPS game)
Netherlands SS Active vs. passive
Bystrom & Barfield 1999 �.271 �.71, .16 20 Custom (based on Barfield &Hendrix)
Navigation, search andlocation marking
United States Eng Head-tracking & mouse vs.neither
Fox & Bailenson 2009 .233 .00, .47 69 Custom (10-item composite) View imitation avatar eating United States SS Change vs. no-change inavatar
Hendrix & Barfield(Exp. 2)
1996b .425 �.14, .99 12 Custom (2 items) Navigation United States Eng Head-tracking vs. none
K. J. Kim & Sundar 2013 .932 .71, 1.15 80 ITC-SOPI (spatial presencesubscale)
The House of the Dead 2(FPS game)
Korea SS Gun replica controller vs.traditional controller
H. Lee & Chung 2013 .464 .22, .71 64 Custom (spatial involvementsubscale)
Top Spin 4 (tennis simulatorgame)
Korea SS PS Move (motion tracking)vs. PS3 controller
McGloin et al. 2011 .138 .00, .28 195 Perceived Spatial Presence(based on Skalski et al.,2011)
Top Spin 3 (tennis simulatorgame)
United States SS Wiimote (motion tracking)vs. PS3 controller
Moreno & Mayer (Exp. 1) 2002 .040 �.22, .31 53 Modified PQ View/navigate (‘‘plantdesign’’ environment)
United States SS HMD and tracked walking vs.HMD and sitting
(Continued)
9
Dow
nloa
ded
by [
171.
67.2
16.2
1] a
t 10:
54 0
5 Ju
ne 2
015
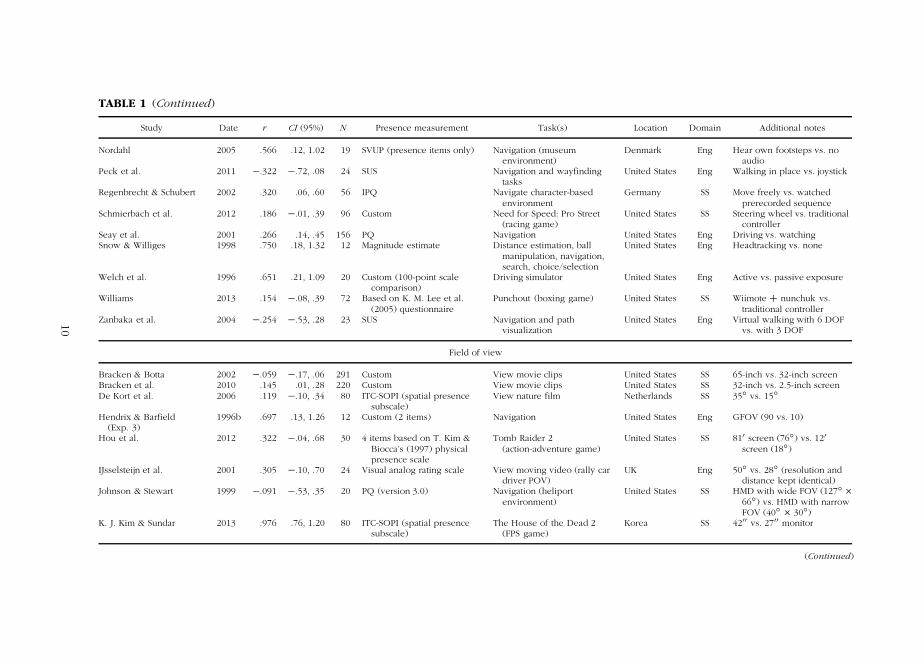
TABLE 1 (Continued)
Study Date r CI (95%) N Presence measurement Task(s) Location Domain Additional notes
Nordahl 2005 .566 .12, 1.02 19 SVUP (presence items only) Navigation (museumenvironment)
Denmark Eng Hear own footsteps vs. noaudio
Peck et al. 2011 �.322 �.72, .08 24 SUS Navigation and wayfindingtasks
United States Eng Walking in place vs. joystick
Regenbrecht & Schubert 2002 .320 .06, .60 56 IPQ Navigate character-basedenvironment
Germany SS Move freely vs. watchedprerecorded sequence
Schmierbach et al. 2012 .186 �.01, .39 96 Custom Need for Speed: Pro Street(racing game)
United States SS Steering wheel vs. traditionalcontroller
Seay et al. 2001 .266 .14, .45 156 PQ Navigation United States Eng Driving vs. watchingSnow & Williges 1998 .750 .18, 1.32 12 Magnitude estimate Distance estimation, ball
manipulation, navigation,search, choice/selection
United States Eng Headtracking vs. none
Welch et al. 1996 .651 .21, 1.09 20 Custom (100-point scalecomparison)
Driving simulator United States Eng Active vs. passive exposure
Williams 2013 .154 �.08, .39 72 Based on K. M. Lee et al.(2005) questionnaire
Punchout (boxing game) United States SS Wiimote C nunchuk vs.traditional controller
Zanbaka et al. 2004 �.254 �.53, .28 23 SUS Navigation and pathvisualization
United States Eng Virtual walking with 6 DOFvs. with 3 DOF
Field of view
Bracken & Botta 2002 �.059 �.17, .06 291 Custom View movie clips United States SS 65-inch vs. 32-inch screenBracken et al. 2010 .145 .01, .28 220 Custom View movie clips United States SS 32-inch vs. 2.5-inch screenDe Kort et al. 2006 .119 �.10, .34 80 ITC-SOPI (spatial presence
subscale)View nature film Netherlands SS 35ı vs. 15ı
Hendrix & Barfield(Exp. 3)
1996b .697 .13, 1.26 12 Custom (2 items) Navigation United States Eng GFOV (90 vs. 10)
Hou et al. 2012 .322 �.04, .68 30 4 items based on T. Kim &Biocca’s (1997) physicalpresence scale
Tomb Raider 2(action-adventure game)
United States SS 810 screen (76ı) vs. 120
screen (18ı)
IJsselsteijn et al. 2001 .305 �.10, .70 24 Visual analog rating scale View moving video (rally cardriver POV)
UK Eng 50ı vs. 28ı (resolution anddistance kept identical)
Johnson & Stewart 1999 �.091 �.53, .35 20 PQ (version 3.0) Navigation (heliportenvironment)
United States SS HMD with wide FOV (127ı �
66ı) vs. HMD with narrowFOV (40ı
� 30ı)K. J. Kim & Sundar 2013 .976 .76, 1.20 80 ITC-SOPI (spatial presence
subscale)The House of the Dead 2
(FPS game)Korea SS 4200 vs. 2700 monitor
(Continued)
10
Dow
nloa
ded
by [
171.
67.2
16.2
1] a
t 10:
54 0
5 Ju
ne 2
015
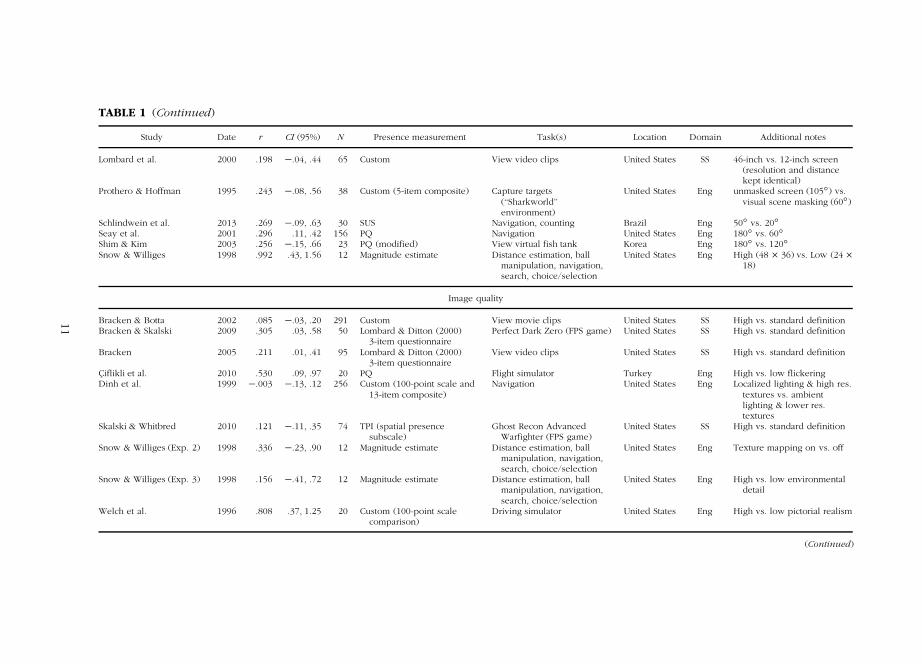
TABLE 1 (Continued)
Study Date r CI (95%) N Presence measurement Task(s) Location Domain Additional notes
Lombard et al. 2000 .198 �.04, .44 65 Custom View video clips United States SS 46-inch vs. 12-inch screen(resolution and distancekept identical)
Prothero & Hoffman 1995 .243 �.08, .56 38 Custom (5-item composite) Capture targets(‘‘Sharkworld’’environment)
United States Eng unmasked screen (105ı) vs.visual scene masking (60ı)
Schlindwein et al. 2013 .269 �.09, .63 30 SUS Navigation, counting Brazil Eng 50ı vs. 20ı
Seay et al. 2001 .296 .11, .42 156 PQ Navigation United States Eng 180ı vs. 60ı
Shim & Kim 2003 .256 �.15, .66 23 PQ (modified) View virtual fish tank Korea Eng 180ı vs. 120ı
Snow & Williges 1998 .992 .43, 1.56 12 Magnitude estimate Distance estimation, ballmanipulation, navigation,search, choice/selection
United States Eng High (48 � 36) vs. Low (24 �
18)
Image quality
Bracken & Botta 2002 .085 �.03, .20 291 Custom View movie clips United States SS High vs. standard definitionBracken & Skalski 2009 .305 .03, .58 50 Lombard & Ditton (2000)
3-item questionnairePerfect Dark Zero (FPS game) United States SS High vs. standard definition
Bracken 2005 .211 .01, .41 95 Lombard & Ditton (2000)3-item questionnaire
View video clips United States SS High vs. standard definition
Çiflikli et al. 2010 .530 .09, .97 20 PQ Flight simulator Turkey Eng High vs. low flickeringDinh et al. 1999 �.003 �.13, .12 256 Custom (100-point scale and
13-item composite)Navigation United States Eng Localized lighting & high res.
textures vs. ambientlighting & lower res.textures
Skalski & Whitbred 2010 .121 �.11, .35 74 TPI (spatial presencesubscale)
Ghost Recon AdvancedWarfighter (FPS game)
United States SS High vs. standard definition
Snow & Williges (Exp. 2) 1998 .336 �.23, .90 12 Magnitude estimate Distance estimation, ballmanipulation, navigation,search, choice/selection
United States Eng Texture mapping on vs. off
Snow & Williges (Exp. 3) 1998 .156 �.41, .72 12 Magnitude estimate Distance estimation, ballmanipulation, navigation,search, choice/selection
United States Eng High vs. low environmentaldetail
Welch et al. 1996 .808 .37, 1.25 20 Custom (100-point scalecomparison)
Driving simulator United States Eng High vs. low pictorial realism
(Continued)
11
Dow
nloa
ded
by [
171.
67.2
16.2
1] a
t 10:
54 0
5 Ju
ne 2
015
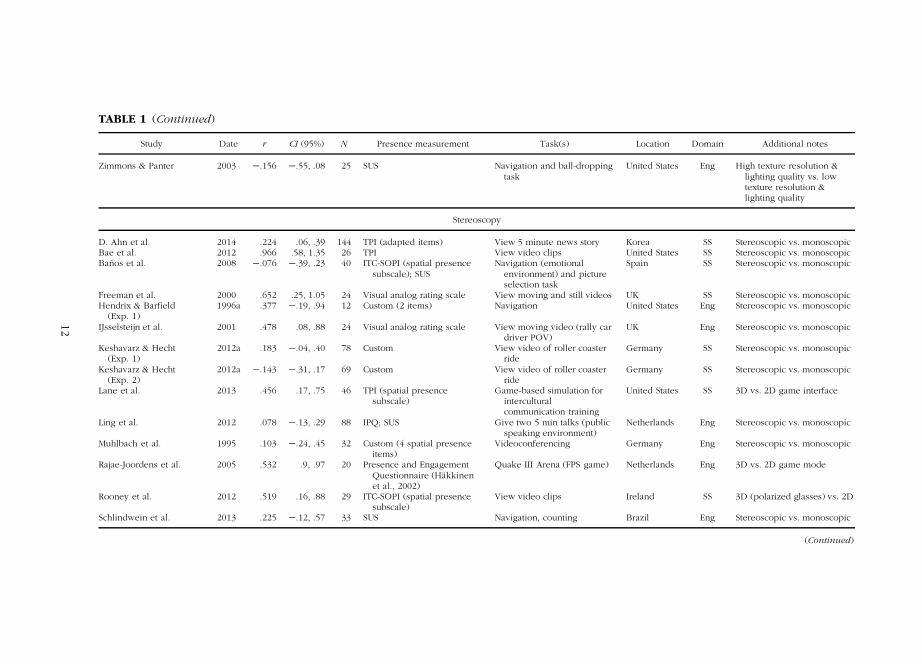
TABLE 1 (Continued)
Study Date r CI (95%) N Presence measurement Task(s) Location Domain Additional notes
Zimmons & Panter 2003 �.156 �.55, .08 25 SUS Navigation and ball-droppingtask
United States Eng High texture resolution &lighting quality vs. lowtexture resolution &lighting quality
Stereoscopy
D. Ahn et al. 2014 .224 .06, .39 144 TPI (adapted items) View 5 minute news story Korea SS Stereoscopic vs. monoscopicBae et al. 2012 .966 .58, 1.35 26 TPI View video clips United States SS Stereoscopic vs. monoscopicBaños et al. 2008 �.076 �.39, .23 40 ITC-SOPI (spatial presence
subscale); SUSNavigation (emotional
environment) and pictureselection task
Spain SS Stereoscopic vs. monoscopic
Freeman et al. 2000 .652 .25, 1.05 24 Visual analog rating scale View moving and still videos UK SS Stereoscopic vs. monoscopicHendrix & Barfield
(Exp. 1)1996a .377 �.19, .94 12 Custom (2 items) Navigation United States Eng Stereoscopic vs. monoscopic
IJsselsteijn et al. 2001 .478 .08, .88 24 Visual analog rating scale View moving video (rally cardriver POV)
UK Eng Stereoscopic vs. monoscopic
Keshavarz & Hecht(Exp. 1)
2012a .183 �.04, .40 78 Custom View video of roller coasterride
Germany SS Stereoscopic vs. monoscopic
Keshavarz & Hecht(Exp. 2)
2012a �.143 �.31, .17 69 Custom View video of roller coasterride
Germany SS Stereoscopic vs. monoscopic
Lane et al. 2013 .456 .17, .75 46 TPI (spatial presencesubscale)
Game-based simulation forinterculturalcommunication training
United States SS 3D vs. 2D game interface
Ling et al. 2012 .078 �.13, .29 88 IPQ; SUS Give two 5 min talks (publicspeaking environment)
Netherlands Eng Stereoscopic vs. monoscopic
Muhlbach et al. 1995 .103 �.24, .45 32 Custom (4 spatial presenceitems)
Videoconferencing Germany Eng Stereoscopic vs. monoscopic
Rajae-Joordens et al. 2005 .532 .9, .97 20 Presence and EngagementQuestionnaire (Häkkinenet al., 2002)
Quake III Arena (FPS game) Netherlands Eng 3D vs. 2D game mode
Rooney et al. 2012 .519 .16, .88 29 ITC-SOPI (spatial presencesubscale)
View video clips Ireland SS 3D (polarized glasses) vs. 2D
Schlindwein et al. 2013 .225 �.12, .57 33 SUS Navigation, counting Brazil Eng Stereoscopic vs. monoscopic
(Continued)
12
Dow
nloa
ded
by [
171.
67.2
16.2
1] a
t 10:
54 0
5 Ju
ne 2
015
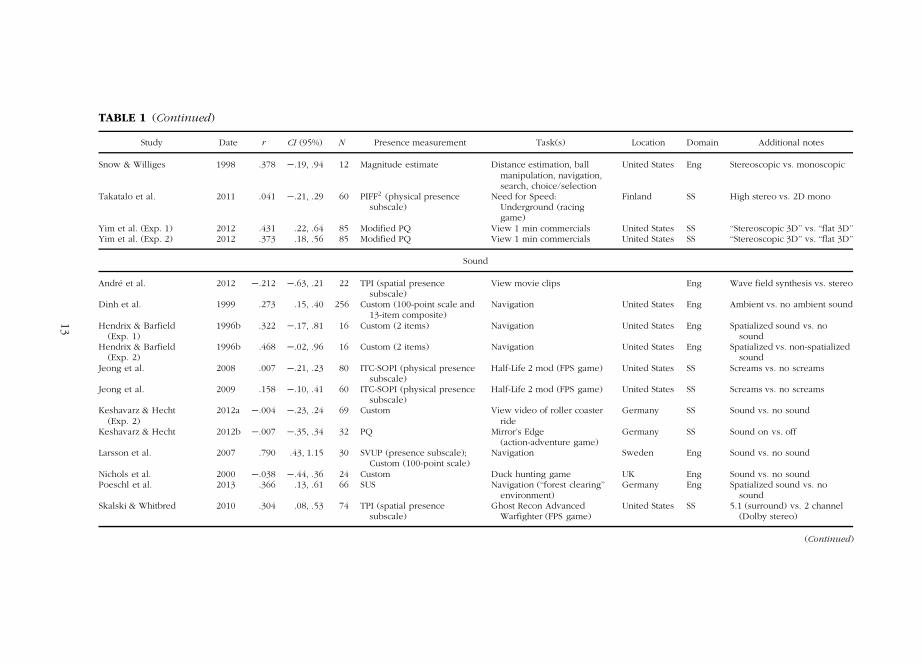
TABLE 1 (Continued)
Study Date r CI (95%) N Presence measurement Task(s) Location Domain Additional notes
Snow & Williges 1998 .378 �.19, .94 12 Magnitude estimate Distance estimation, ballmanipulation, navigation,search, choice/selection
United States Eng Stereoscopic vs. monoscopic
Takatalo et al. 2011 .041 �.21, .29 60 PIFF2 (physical presencesubscale)
Need for Speed:Underground (racinggame)
Finland SS High stereo vs. 2D mono
Yim et al. (Exp. 1) 2012 .431 .22, .64 85 Modified PQ View 1 min commercials United States SS ‘‘Stereoscopic 3D’’ vs. ‘‘flat 3D’’Yim et al. (Exp. 2) 2012 .373 .18, .56 85 Modified PQ View 1 min commercials United States SS ‘‘Stereoscopic 3D’’ vs. ‘‘flat 3D’’
Sound
André et al. 2012 �.212 �.63, .21 22 TPI (spatial presencesubscale)
View movie clips Eng Wave field synthesis vs. stereo
Dinh et al. 1999 .273 .15, .40 256 Custom (100-point scale and13-item composite)
Navigation United States Eng Ambient vs. no ambient sound
Hendrix & Barfield(Exp. 1)
1996b .322 �.17, .81 16 Custom (2 items) Navigation United States Eng Spatialized sound vs. nosound
Hendrix & Barfield(Exp. 2)
1996b .468 �.02, .96 16 Custom (2 items) Navigation United States Eng Spatialized vs. non-spatializedsound
Jeong et al. 2008 .007 �.21, .23 80 ITC-SOPI (physical presencesubscale)
Half-Life 2 mod (FPS game) United States SS Screams vs. no screams
Jeong et al. 2009 .158 �.10, .41 60 ITC-SOPI (physical presencesubscale)
Half-Life 2 mod (FPS game) United States SS Screams vs. no screams
Keshavarz & Hecht(Exp. 2)
2012a �.004 �.23, .24 69 Custom View video of roller coasterride
Germany SS Sound vs. no sound
Keshavarz & Hecht 2012b �.007 �.35, .34 32 PQ Mirror’s Edge(action-adventure game)
Germany SS Sound on vs. off
Larsson et al. 2007 .790 .43, 1.15 30 SVUP (presence subscale);Custom (100-point scale)
Navigation Sweden Eng Sound vs. no sound
Nichols et al. 2000 �.038 �.44, .36 24 Custom Duck hunting game UK Eng Sound vs. no soundPoeschl et al. 2013 .366 .13, .61 66 SUS Navigation (‘‘forest clearing’’
environment)Germany Eng Spatialized sound vs. no
soundSkalski & Whitbred 2010 .304 .08, .53 74 TPI (spatial presence
subscale)Ghost Recon Advanced
Warfighter (FPS game)United States SS 5.1 (surround) vs. 2 channel
(Dolby stereo)
(Continued)
13
Dow
nloa
ded
by [
171.
67.2
16.2
1] a
t 10:
54 0
5 Ju
ne 2
015
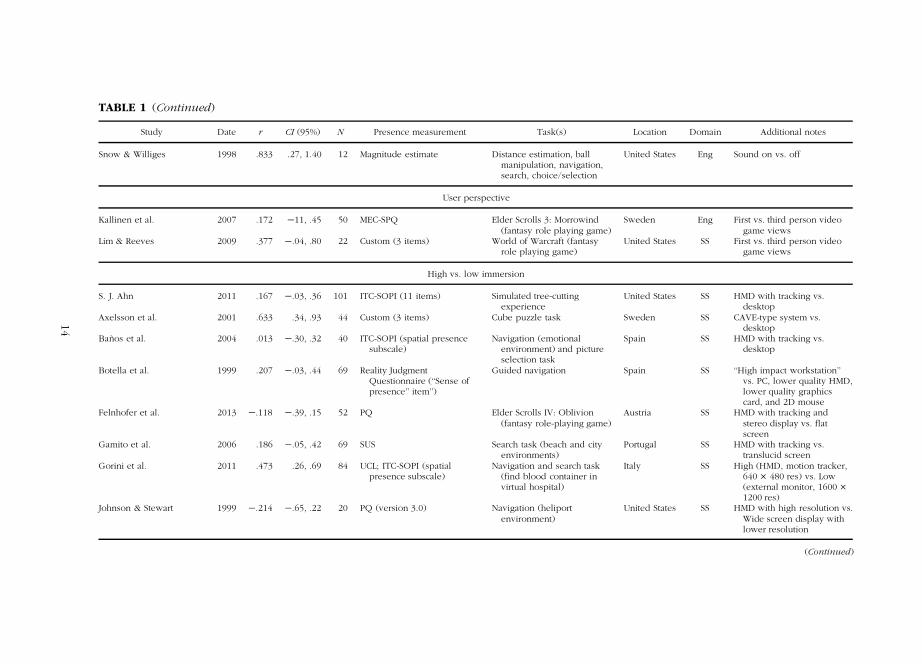
TABLE 1 (Continued)
Study Date r CI (95%) N Presence measurement Task(s) Location Domain Additional notes
Snow & Williges 1998 .833 .27, 1.40 12 Magnitude estimate Distance estimation, ballmanipulation, navigation,search, choice/selection
United States Eng Sound on vs. off
User perspective
Kallinen et al. 2007 .172 �11, .45 50 MEC-SPQ Elder Scrolls 3: Morrowind(fantasy role playing game)
Sweden Eng First vs. third person videogame views
Lim & Reeves 2009 .377 �.04, .80 22 Custom (3 items) World of Warcraft (fantasyrole playing game)
United States SS First vs. third person videogame views
High vs. low immersion
S. J. Ahn 2011 .167 �.03, .36 101 ITC-SOPI (11 items) Simulated tree-cuttingexperience
United States SS HMD with tracking vs.desktop
Axelsson et al. 2001 .633 .34, .93 44 Custom (3 items) Cube puzzle task Sweden SS CAVE-type system vs.desktop
Baños et al. 2004 .013 �.30, .32 40 ITC-SOPI (spatial presencesubscale)
Navigation (emotionalenvironment) and pictureselection task
Spain SS HMD with tracking vs.desktop
Botella et al. 1999 .207 �.03, .44 69 Reality JudgmentQuestionnaire (‘‘Sense ofpresence’’ item’’)
Guided navigation Spain SS ‘‘High impact workstation’’vs. PC, lower quality HMD,lower quality graphicscard, and 2D mouse
Felnhofer et al. 2013 �.118 �.39, .15 52 PQ Elder Scrolls IV: Oblivion(fantasy role-playing game)
Austria SS HMD with tracking andstereo display vs. flatscreen
Gamito et al. 2006 .186 �.05, .42 69 SUS Search task (beach and cityenvironments)
Portugal SS HMD with tracking vs.translucid screen
Gorini et al. 2011 .473 .26, .69 84 UCL; ITC-SOPI (spatialpresence subscale)
Navigation and search task(find blood container invirtual hospital)
Italy SS High (HMD, motion tracker,640 � 480 res) vs. Low(external monitor, 1600 �
1200 res)Johnson & Stewart 1999 �.214 �.65, .22 20 PQ (version 3.0) Navigation (heliport
environment)United States SS HMD with high resolution vs.
Wide screen display withlower resolution
(Continued)
14
Dow
nloa
ded
by [
171.
67.2
16.2
1] a
t 10:
54 0
5 Ju
ne 2
015
TABLE 1 (Continued)
Study Date r CI (95%) N Presence measurement Task(s) Location Domain Additional notes
Juan & Pérez 2009 .578 .19, .97 25 SUS (modified) Navigation (with pit falling) Spain Eng CAVE vs. HMD with trackingK. Kim et al.
(Comparison 1)2014 .406 .39, .93 53 PQ Search task (modified Stroop
task)United States Eng HMD vs. desktop
K. Kim et al.(Comparison 2)
2014 .659 .14, .68 53 PQ Search task (modified Strooptask)
United States Eng CAVE vs. desktop
Krijn et al. 2004 .486 .09, .88 25 IPQ Navigation throughacrophobic treatmentenvironments
Netherlands SS CAVE (with greater updaterate and wider FOV) vs.HMD
Larsson et al. 2001 .481 .13, .83 32 SVUP (presence subscale) Navigation and search task Sweden Eng Actor (drive, headtracking,stereo, HMD) vs. Observer(projection, mono)
Lo Priore 2003 .244 �.32, .81 12 ITC-SOPI (spatial presencesubscale)
Navigation and a series ofexecutive function tasks
Italy SS HMD with tracking vs. flatscreen with joystick
Lott et al. 2003 �.239 �.70, .22 18 PQ Lateral reaching test Canada Eng HMD vs. flat screenMoreno & Mayer (Exp. 1) 2002 .163 �.09, .41 61 Modified PQ View/navigate environment
about plant designUnited States SS HMD and tracked walking vs.
desktopMoreno & Mayer (Exp. 2) 2002 .247 .02, .48 75 Modified PQ View/navigate environment
about plant designUnited States SS HMD and tracked walking vs.
desktopMoreno & Mayer 2004 .279 .00, .56 48 Modified PQ View/navigate environment
about plant designUnited States SS HMD vs. desktop
Morina et al. 2012 .566 .27, .86 43 IPQ Environment for socialphobia treatment(simulating various realworld scenarios)
Netherlands Eng HMD with tracking vs.projection
Nichols et al. 2000 .283 �.12, .68 24 Custom Duck hunting game UK Eng HMD vs. desktopPeer et al. 2010 �.114 �.60, .38 16 Custom (single item
measuring immersiveness)Telemanipulation task (repair
burst pipe)Germany Eng HMD with tracking vs. Stereo
ProjectionPersky & Blascovich
(Exp. 1)2008 .401 .15, .65 62 8-item scale (from Swinth &
Blascovich, 2001)Custom FPS video game United States SS IVETP vs. DTP
(Continued)
15
Dow
nloa
ded
by [
171.
67.2
16.2
1] a
t 10:
54 0
5 Ju
ne 2
015
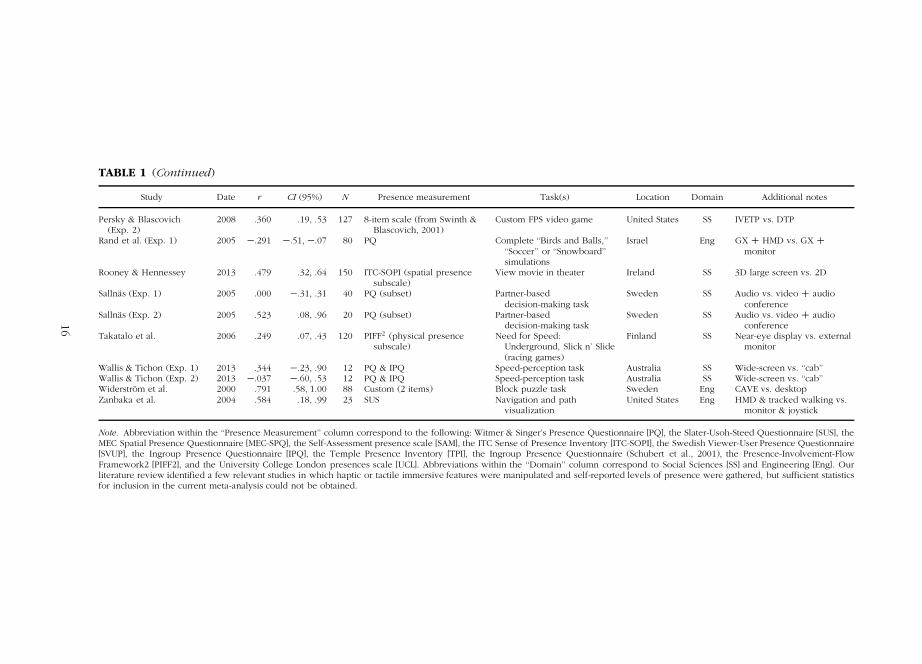
TABLE 1 (Continued)
Study Date r CI (95%) N Presence measurement Task(s) Location Domain Additional notes
Persky & Blascovich(Exp. 2)
2008 .360 .19, .53 127 8-item scale (from Swinth &Blascovich, 2001)
Custom FPS video game United States SS IVETP vs. DTP
Rand et al. (Exp. 1) 2005 �.291 �.51, �.07 80 PQ Complete ‘‘Birds and Balls,’’‘‘Soccer’’ or ‘‘Snowboard’’simulations
Israel Eng GX C HMD vs. GX C
monitor
Rooney & Hennessey 2013 .479 .32, .64 150 ITC-SOPI (spatial presencesubscale)
View movie in theater Ireland SS 3D large screen vs. 2D
Sallnäs (Exp. 1) 2005 .000 �.31, .31 40 PQ (subset) Partner-baseddecision-making task
Sweden SS Audio vs. video C audioconference
Sallnäs (Exp. 2) 2005 .523 .08, .96 20 PQ (subset) Partner-baseddecision-making task
Sweden SS Audio vs. video C audioconference
Takatalo et al. 2006 .249 .07, .43 120 PIFF2 (physical presencesubscale)
Need for Speed:Underground, Slick n’ Slide(racing games)
Finland SS Near-eye display vs. externalmonitor
Wallis & Tichon (Exp. 1) 2013 .344 �.23, .90 12 PQ & IPQ Speed-perception task Australia SS Wide-screen vs. ‘‘cab’’Wallis & Tichon (Exp. 2) 2013 �.037 �.60, .53 12 PQ & IPQ Speed-perception task Australia SS Wide-screen vs. ‘‘cab’’Widerström et al. 2000 .791 .58, 1.00 88 Custom (2 items) Block puzzle task Sweden Eng CAVE vs. desktopZanbaka et al. 2004 .584 .18, .99 23 SUS Navigation and path
visualizationUnited States Eng HMD & tracked walking vs.
monitor & joystick
Note. Abbreviation within the ‘‘Presence Measurement’’ column correspond to the following: Witmer & Singer’s Presence Questionnaire [PQ], the Slater-Usoh-Steed Questionnaire [SUS], theMEC Spatial Presence Questionnaire [MEC-SPQ], the Self-Assessment presence scale [SAM], the ITC Sense of Presence Inventory [ITC-SOPI], the Swedish Viewer-User Presence Questionnaire[SVUP], the Ingroup Presence Questionnaire [IPQ], the Temple Presence Inventory [TPI], the Ingroup Presence Questionnaire (Schubert et al., 2001), the Presence-Involvement-FlowFramework2 [PIFF2], and the University College London presences scale [UCL]. Abbreviations within the ‘‘Domain’’ column correspond to Social Sciences [SS] and Engineering [Eng]. Ourliterature review identified a few relevant studies in which haptic or tactile immersive features were manipulated and self-reported levels of presence were gathered, but sufficient statisticsfor inclusion in the current meta-analysis could not be obtained.
16
Dow
nloa
ded
by [
171.
67.2
16.2
1] a
t 10:
54 0
5 Ju
ne 2
015
Immersion Presence Meta-Analysis 17
perspective,’’ ‘‘resolution,’’ ‘‘haptics,’’ ‘‘HMD,’’ and ‘‘CAVE.’’ Similar searchesfor ‘‘presence’’ and key terms were completed using Google Scholar. Addi-tionally, we directly reviewed the full journal archives for Presence: Teleop-
erators and Virtual Environments and CyberPsychology, Behavior & Social
Networking for relevant studies. We also reviewed the full conference pro-ceedings of the International Society for Presence Researchers (ISPR) andthe IEEE Virtual Reality annual conference. From the initial list of studiesproduced through these searches, we then back-referenced through theircitations, finding additional research reports from the proceedings of an-nual conferences for the Association for Computing Machinery (ACM) andthe ACM Special Interest Group on Graphics and Interactive Techniques(SIGGRAPH), as well as articles from various journals related to human–computer interaction, human factors design, and communication science, aswell as unpublished manuscripts. A special call for relevant papers was alsoposted on the ISPR homepage soliciting researchers for information regardingany relevant studies. Finally, publication bias is inherently a concern whenconducting a meta-analysis, as nonsignificant effect sizes are commonly notreported or published. In an attempt to pursue unpublished work, authorswere emailed with direct requests for any unpublished relevant studies.
This search process yielded over two hundred studies regarding userpresence related to immersive technology. We then checked this list againstcriteria for inclusion. Specifically, in order to be included in the analysis, astudy had to meet the following criteria:
1. include the manipulation of one or more specific immersive technologyfeatures;
2. include at least one self-report measure of user presence;3. include sufficient detail to determine the relative immersiveness of the
conditions compared; and4. report an effect size or include sufficient details to calculate an effect size
based on the condition comparisons relevant to the present analysis.
Of the initial pool of studies, 38 studies were excluded because theydid not include a discrete manipulation of one or more immersive features.Studies excluded for this purpose typically manipulated factors not relatedto the system hardware (Ravaja et al., 2006). Additionally, 42 studies wereexcluded because they did not provide a self-reported measure of presence.These studies often included measures of related but different concepts—such as arousal or realism (Huang, Tsai, Sung, Lin, & Chuang, 2008)—orsocial or co-presence (Hauber, Regenbrecht, Hills, Cockburn & Billinghurst,2005; Huang, 2003), but did not measure the more general form of spatialpresence of focus in this analysis. Many of the studies excluded for failingthis criteria focused on the effect of immersion on performance rather thanuser presence (e.g., Pausch, Proffitt, & Williams, 1997). An additional four
Dow
nloa
ded
by [
171.
67.2
16.2
1] a
t 10:
54 0
5 Ju
ne 2
015
18 J. J. Cummings and J. N. Bailenson
studies were excluded because they did not provide enough details onsystem specifications to ascertain the relative immersiveness of each studycondition. Finally, five research abstracts and conference papers from theoriginal pool were excluded as they contained the same data sets fromjournal articles published at a later date and already included in our sample.For the remaining candidate studies, if the required details for calculating aneffect size were not included, direct emails were sent to the authors. Aftermultiple attempts to contact authors, 29 candidate studies were then omittedfrom our analysis due to insufficient study details. In total, we accumulated83 studies that met the criteria and also provided enough details to includein our analysis, providing 115 separate effect sizes for manipulations ofimmersive quality.
The relative inclusion of the required criteria, along with several otherstudy details, were coded by both authors. The authors initially trained ona specific coding scheme, with detailed rules on what constituted eachvalue for a given study variable, and then together discussed each studyto arrive at agreed upon values for each variable. Coded variables includedthe relative presence of the independent and dependent variables notedabove, demographic and descriptive details of the participants, aspects of themediated task (e.g., whether a spatial reasoning exercise, whether a game,whether narrative based), the presence of others during the mediated task(e.g., whether multiple users simultaneously engaged the system; whetherexperiences included digital humans in the form of avatars, agents, or otherpotential actors), the geographic location where the study was conducted,the disciplinary background of the study (whether conducted by social sci-entists or engineers, based on author affiliations and publication venue), andthe particular self-report instrument used to gauge user presence.
Statistical Analysis and Procedures
The meta-analysis was conducted using the procedures described by Rosen-thal and DiMatteo (2001) and, particularly in computing tests of heterogene-ity, those detailed by Hunter and Schmidt (1990). These procedures wereconducted for the full sample of studies as a whole as well as individuallyfor each immersive feature category.
EFFECT SIZE CALCULATIONS AND COMBINATION
In order to combine the results of the total pool of studies, an effect size wasfirst computed for each study. Some studies included multiple experiments orindependently tested multiple immersive features; in such cases each effectsize was treated as a separate entry into the current meta-analysis. We stan-dardized all effect sizes to the common metric of the correlation coefficient(r), as this is one of the more versatile effect size metrics available—not
Dow
nloa
ded
by [
171.
67.2
16.2
1] a
t 10:
54 0
5 Ju
ne 2
015
Immersion Presence Meta-Analysis 19
only is the correlation coefficient widely used, its practical importance ismore easily interpreted than that of the alternative Cohen’s d or Hedge’s g
(Rosenthal & DiMatteo, 2001).Correlation coefficients were mainly derived from the group means and
standard deviations on a given dependent variable measure. In instanceswhere these statistics were reported across multiple groups (e.g., withina 2-�-2 design, offering two separate conditions with each level of thevariable of interest), these statistics were aggregated with pooled variances.When means and standard deviations were not reported, the correlationcoefficient was derived from t values or F values in which the numeratorincluded only one degree of freedom (Rosenthal & DiMatteo, 2001). If agiven study included multiple effect sizes of interest (e.g., multiple measuresof spatial, general, or physical presence) these values were aggregated intoa single effect size. To do this, the correlation coefficients for the measureswere standardized through a Fisher Z transformation and averaged, with thataverage value then transformed back into a single correlation coefficient forthe study.
Once a single correlation coefficient (r) was computed for each studymanipulation, each was run through a Fisher Z transformation. Each trans-formed score (z) was then weighted by its respective study’s sample size.Specifically, they were weighted by the inverse variance, N-3, where N is thenumber of paired observations of the different levels of the independent vari-able in that study (Lipsey & Wilson, 2001). Note, when different conditionsincluded unequal numbers of observations, the higher value was used. Eachof these weighted, transformed scores (z weighted) was then averaged into asingle overall z score (overall z), which was then converted back into a singleoverall correlation coefficient (overall r). This value represented the overalleffect size. This process was repeated multiple times—once to combine allstudies included in the sample and then an additional time for each of theindividual immersive features listed above (i.e., once for all tracking levelstudies, once for all stereoscopy studies, and so on). This allowed us toobserve the overall effect of immersion as a whole on spatial presence, aswell as to independently determine the relative effect of each immersivefeature.
INTERPRETATION OF OVERALL EFFECT SIZE
By Cohen’s (1988) conventions a correlation coefficient of .10 can be inter-preted as a relatively small effect size, with an r of .30 being considereda medium effect size, and an r of .50 or more being a relatively largeeffect size. With this framework, the relative size of the influence of oneimmersive feature on user presence can be compared to that of another. Ofcourse, coupled with this loose rule of thumb should be consideration of thepractical significance of the effect: Features yielding small effect sizes may
Dow
nloa
ded
by [
171.
67.2
16.2
1] a
t 10:
54 0
5 Ju
ne 2
015
20 J. J. Cummings and J. N. Bailenson
be noteworthy, particularly in cases where the implementation of featuresproviding larger effect sizes are constrained by cost or other factors.
In addition to this convention, the extent to which effect sizes sig-nificantly differ from one another may be formally tested as outlined byCohen and Cohen (1983). By this procedure, two independent correlationcoefficients and their respective sample sizes can be converted to a z scoreusing a Fisher transformation. The value and direction of the z score providea measure of whether the first effect size is significantly larger or smallerthan the other. To this end, the overall effect sizes for the various immersivefeatures can be compared to each other, allowing direct comparisons of theirrelative impact on user presence.
TESTS OF HETEROGENEITY
Additionally, each overall effect size (one for the full pool of studies, plusanother for each individual immersive feature category) was subjected to atest of heterogeneity (Hunter & Schmidt, 1990). This chi-squared test providesa measure of the heterogeneity of variance in correlation coefficients acrossthe studies included in the sample. A significant result indicates that thevariance is not completely due to sampling error and that there may be po-tential moderators within the sample. In such an event, potential moderatingvariables were then independently investigated. Hunter and Schmidt (1990)alternatively note what is known as the 75% rule, which asserts that if 75%or more of the variance across correlation coefficients can be attributed tocorrected artifacts, including sampling error, then the remaining 25% is likelydue to uncorrected artifacts rather than any moderating variables. Both chi-squared tests of heterogeneity and calculations of the percent of varianceattributable to sampling error are provided in the analysis below.
RESULTS
Summary of Sample
In addition to their correlation coefficients, Table 1 includes additional de-scriptive information for all studies included in the sample. This allowedthe researchers to not only categorize studies by the particular immersivefeature each examined (which were then subjected to independent meta-analyses), but to also track values for variables that may potentially moderatethe effect sizes observed (e.g., year conducted, social science vs. engineeringdiscipline). Additional notes for a given study, such as which exact levelsof an immersive feature were compared or which dependent measures of agiven study were included in the analysis, are also indicated.
As seen in Table 1, studies that manipulated multiple features in tan-dem (overall high versus low levels of immersion) were the most common.
Dow
nloa
ded
by [
171.
67.2
16.2
1] a
t 10:
54 0
5 Ju
ne 2
015
Immersion Presence Meta-Analysis 21
Next, were those comparing the impact of the tracking level or the use ofstereoscopic vision, followed by those examining different fields of view,sound quality, and image quality. Least common were those that explicitlyinvestigated the effects of update rate or user perspective.
The tasks comprising the mediated experiences of the sample studiesincluded a range of activities, such as navigating traditional immersive virtualreality environments, playing video games, or participating in videoconfer-encing. Several studies simply required participants to enter an immersivevirtual environment, explore the virtual space freely, then exit. Others in-cluded explicit spatial reasoning tasks (10 articles, offering 20 effect sizes),in which participants were required to make distance estimations, navigate aroute as quickly as possible, or sketch a map of the environment afterwards.Twenty seven of the effect sizes collected came from studies that requiredparticipants to play a video or computer game with a particular immersivefeature manipulated.
Although not depicted in Table 1 due to limited space, it should alsobe noted that the participants included in the studies analyzed were rela-tively homogenous in nature. Of the studies included in the analysis, thevast majority relied on generic convenience samples common to university-based research. The majority of studies included roughly even gender ratios(with exceptions typically being those with particularly small sample sizes).Sixty nine of the effect sizes analyzed came from samples with a mean agebetween 18 and 30 years old, while only nine effect sizes came from studiesreporting older samples. This likely reflects that fact that 78 effect sizes camefrom convenient university-based sampling methods while only 10 camefrom studies using specially selected populations (such as expert drivers,phobic patients, and military pilots).
Conventional Interpretation of Effect Sizes
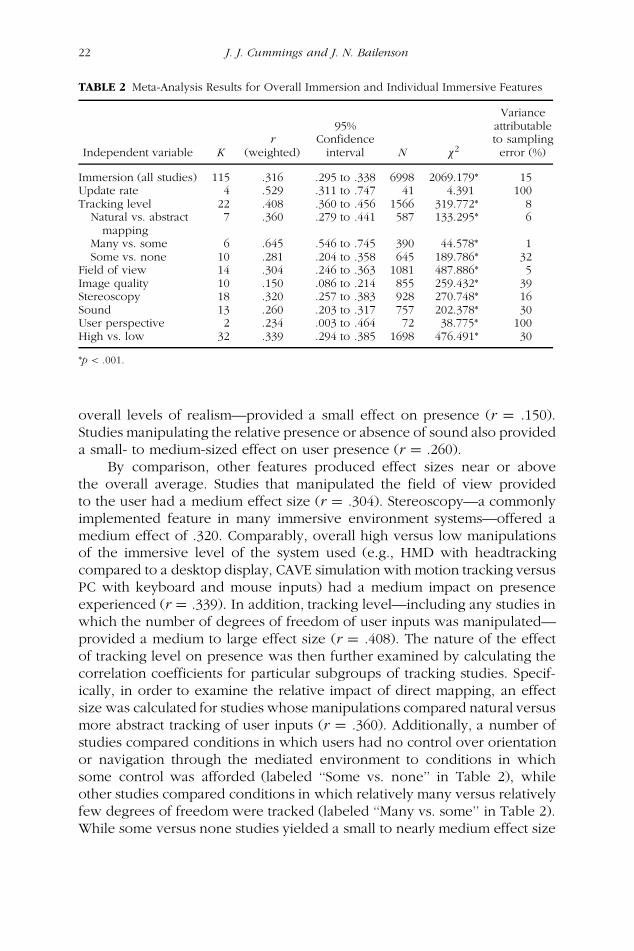
The results of the multiple meta-analyses—one combining all studies in thesample and then additional analyses for each immersion feature category—are presented in Table 2. Overall, immersive features as a whole had amedium-sized effect on spatial presence (r D .316), fitting the causal rela-tionship typically assumed to exist. However, a more nuanced understandingof this result was offered by independently examining the relative effect sizeof each immersive feature.
Two of the independent features—update rate and user perspective—included particularly small sample sizes (K in Table 2). In turn, it may beespecially risky to draw general conclusions about these features. However,we might more safely remark on the observed effect sizes for some ofthe features for which larger samples were obtained. Indeed, as seen inTable 2, certain features appear to influence presence more than others.Image quality—herein including manipulations of visual detail, quality, and
Dow
nloa
ded
by [
171.
67.2
16.2
1] a
t 10:
54 0
5 Ju
ne 2
015
22 J. J. Cummings and J. N. Bailenson
TABLE 2 Meta-Analysis Results for Overall Immersion and Individual Immersive Features
Independent variable Kr
(weighted)
95%Confidence
interval N �2
Varianceattributableto samplingerror (%)
Immersion (all studies) 115 .316 .295 to .338 6998 2069.179* 15Update rate 4 .529 .311 to .747 41 4.391 100Tracking level 22 .408 .360 to .456 1566 319.772* 8
Natural vs. abstractmapping
7 .360 .279 to .441 587 133.295* 6
Many vs. some 6 .645 .546 to .745 390 44.578* 1Some vs. none 10 .281 .204 to .358 645 189.786* 32
Field of view 14 .304 .246 to .363 1081 487.886* 5Image quality 10 .150 .086 to .214 855 259.432* 39Stereoscopy 18 .320 .257 to .383 928 270.748* 16Sound 13 .260 .203 to .317 757 202.378* 30User perspective 2 .234 .003 to .464 72 38.775* 100High vs. low 32 .339 .294 to .385 1698 476.491* 30
*p < .001.
overall levels of realism—provided a small effect on presence (r D .150).Studies manipulating the relative presence or absence of sound also provideda small- to medium-sized effect on user presence (r D .260).
By comparison, other features produced effect sizes near or abovethe overall average. Studies that manipulated the field of view providedto the user had a medium effect size (r D .304). Stereoscopy—a commonlyimplemented feature in many immersive environment systems—offered amedium effect of .320. Comparably, overall high versus low manipulationsof the immersive level of the system used (e.g., HMD with headtrackingcompared to a desktop display, CAVE simulation with motion tracking versusPC with keyboard and mouse inputs) had a medium impact on presenceexperienced (r D .339). In addition, tracking level—including any studies inwhich the number of degrees of freedom of user inputs was manipulated—provided a medium to large effect size (r D .408). The nature of the effectof tracking level on presence was then further examined by calculating thecorrelation coefficients for particular subgroups of tracking studies. Specif-ically, in order to examine the relative impact of direct mapping, an effectsize was calculated for studies whose manipulations compared natural versusmore abstract tracking of user inputs (r D .360). Additionally, a number ofstudies compared conditions in which users had no control over orientationor navigation through the mediated environment to conditions in whichsome control was afforded (labeled ‘‘Some vs. none’’ in Table 2), whileother studies compared conditions in which relatively many versus relativelyfew degrees of freedom were tracked (labeled ‘‘Many vs. some’’ in Table 2).While some versus none studies yielded a small to nearly medium effect size
Dow
nloa
ded
by [
171.
67.2
16.2
1] a
t 10:
54 0
5 Ju
ne 2
015
Immersion Presence Meta-Analysis 23
(r D .281), the many versus some studies provided a particularly large effecton presence (r D .645). Finally, update rate also had a large impact on userpresence (r D .529), though again, the representativeness of this measuremay be dubious in light of a small sample size (only four studies).
Tests of Heterogeneity of Effect Sizes and Moderator Analysis
Heterogeneity tests were conducted for each of the meta-analyses. A test wasperformed both for the overall sample as well as each of the subsamplesclustered by immersive feature. A significant chi-squared statistic suggeststhat the correlation between immersion and presence varied across studiesto such an extent that it cannot be attributed to sampling error alone. Whenthis is the case, potential moderating variables across the sample need tothen be examined.
As noted in Table 2, the overall sample of all immersion studies wassignificantly heterogeneous (p < .001). Additionally, this variance could notbe accounted for through different operationalizations of immersion, as thevast majority of all individual immersive feature subsamples also containeda significant level of heterogeneity. The only exception was update rate (asubsample comprised of four studies).
These tests were followed by a search for potential moderators thatcould help account for variance between correlations. Various potentialmoderators between the studies were examined. Several demographics re-garding study sample and background were examined, including the studyand participant geographic location, the year in which the study was con-ducted, and the mean age of the sample. Methodological variables werealso factored as potential moderators, including the sample recruitment type(common university-based convenience sample versus special populationversus other), disciplinary background of the study (i.e., whether it wasconducted by social scientists or sourced from the engineering literatureon immersive technology), and the self-reported presence instrument used(comparing custom questionnaires versus seven of the most commonly usedestablished instruments1). A number of variables regarding the tasks com-prising the studies were also tested, including whether the task includedspatial reasoning exercises, whether it involved playing a computer or videogame, and whether the virtual task environment included other digital actors(avatars, agents, video actors) or only virtual objects. Finally, the socialcontext of the study tasks was also considered, specifically whether or notparticipants engaged the mediated environment alone or simultaneously withother users. For each moderator, a Q statistic was calculated and then com-pared to a normal distribution through a chi-squared test in order to examinewhether the heterogeneity of effect sizes was significant. Though accountingfor these moderators slightly reduced the heterogeneity in correlations noneprovided statistically significant reductions in the heterogeneity of variance
Dow
nloa
ded
by [
171.
67.2
16.2
1] a
t 10:
54 0
5 Ju
ne 2
015
24 J. J. Cummings and J. N. Bailenson
of effect sizes observed across the studies. However, these results are notsurprising considering the relatively small number of studies comprising anyparticular level of the moderating variables tested.
Formal Comparison of Effect Sizes
Again, Fisher Z transformations were employed to also provide formal testsof whether the effects of two given immersive features were significantlydifferent from one another. Table 3 lists the z scores and their respectivesignificance levels for each comparison. Most notably, the effect of trackinglevel on user presence was found to be significantly larger than that of nearlyall other immersive features (with the exceptions being the effects of updaterate and user perspective, which again, may be questionable in light of theirsmall sample sizes). Stereoscopy and field of view also provided relativelystrong effects, both of which were significantly larger than that of imagequality. Indeed, the impact of image quality on presence was particularlylow in comparison to that of other features, with an effect size that wassignificantly smaller than that of update rate, tracking level, field of view,stereoscopy, sound, and overall high versus low manipulations. Similarly,the impact of sound on user presence was also relatively small comparedto that of other features, with a significantly weaker effect than update rate,tracking level, and overall high versus low manipulations.
DISCUSSION
The relationship between the immersive quality of a mediated environmentand the level of presence experienced by the user has been a topic ofconsiderable theoretical discussion and empirical investigation. This pursuitis often predicated on the assumption that greater system immersion begetsgreater user presence, which, in turn, enhances the applied effectivenessof the mediated environment, across domains including healthcare and re-habilitation (Kalyanaraman, Penn, Ivory, & Judge, 2010; Riva, 2002), learn-ing and formal education (Monahan, McArdle, & Bertolotto, 2008; Reeves,Cummings, Scarborough, & Read, 2010), and persuasion and commercialadvertising (S. J. Ahn & Bailenson, 2011; Grigorovici, 2003), to name a few.
In light of an empirical literature containing varied operationalizationsof immersion and varied operationalizations of presence this study employeda meta-analytic approach to examine the overall effect of immersion of pres-ence. Specifically, it explored how some of the most commonly employedand theoretically interesting immersive features contributed to user reportsof spatial presence. Overall, immersion was found to have a conventionallymedium-sized effect on presence, while individual immersive features werefound to vary in their effect sizes.
Dow
nloa
ded
by [
171.
67.2
16.2
1] a
t 10:
54 0
5 Ju
ne 2
015
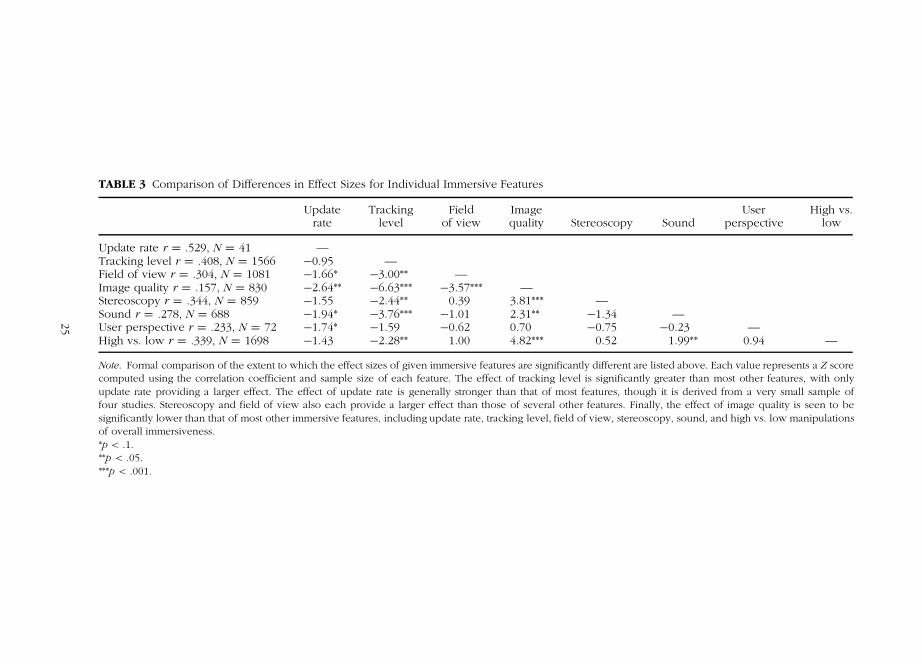
TABLE 3 Comparison of Differences in Effect Sizes for Individual Immersive Features
Updaterate
Trackinglevel
Fieldof view
Imagequality Stereoscopy Sound
Userperspective
High vs.low
Update rate r D .529, N D 41 —Tracking level r D .408, N D 1566 �0.95 —Field of view r D .304, N D 1081 �1.66* �3.00** —Image quality r D .157, N D 830 �2.64** �6.63*** �3.57*** —Stereoscopy r D .344, N D 859 �1.55 �2.44** 0.39 3.81*** —Sound r D .278, N D 688 �1.94* �3.76*** �1.01 2.31** �1.34 —User perspective r D .233, N D 72 �1.74* �1.59 �0.62 0.70 �0.75 �0.23 —High vs. low r D .339, N D 1698 �1.43 �2.28** 1.00 4.82*** 0.52 1.99** 0.94 —
Note. Formal comparison of the extent to which the effect sizes of given immersive features are significantly different are listed above. Each value represents a Z score
computed using the correlation coefficient and sample size of each feature. The effect of tracking level is significantly greater than most other features, with only
update rate providing a larger effect. The effect of update rate is generally stronger than that of most features, though it is derived from a very small sample of
four studies. Stereoscopy and field of view also each provide a larger effect than those of several other features. Finally, the effect of image quality is seen to be
significantly lower than that of most other immersive features, including update rate, tracking level, field of view, stereoscopy, sound, and high vs. low manipulations
of overall immersiveness.
*p < .1.
**p < .05.
***p < .001.
25
Dow
nloa
ded
by [
171.
67.2
16.2
1] a
t 10:
54 0
5 Ju
ne 2
015
26 J. J. Cummings and J. N. Bailenson
The relative effects of a few individual immersive features are of par-ticular note, both for the variance observed in their respective influence onpresence as well as their practical implications. A few features in particularwere found to have a relatively larger effect on spatial presence—trackinglevel, stereoscopy, and field of view. Discounting update rate (which wasalso found to have a large effect size, although based on a small sample ofstudies), tracking level, stereoscopy, and field of view have a stronger impacton user presence compared to other features, particularly image quality andresolution and sound. In other words, all else equal, given a fixed budget fordesigning an immersive system, a designer of mediated environments mightbe best advised to focus on tracking level, stereoscopic vision, and field ofview rather than higher quality visual and auditory stimuli.
However, beyond practical considerations for system designers, thefinding that particular immersive features provide greater gains than others interms of user presence also offers some interesting theoretical implications.Indeed, these results may offer some compelling evidence for the formationof presence as outlined by the spatial situational model framework pro-posed by Wirth et al. (2007). Again, this framework suggests that presenceis achieved through a two-step formative process, in which the user firstconstructs a spatialized mental model of the mediated environment (e.g.,ascertains that the environment is a space) and then comes to accept thismediated environment over grounded reality as his or her primary frame ofself-reference (e.g., ascertains that he or she is situated within that space).Completing this second step is thought to result in the experience of spatialpresence, a two-dimensional construct construed in terms of perceived self-location and perceived possibilities to act within the environment at hand.That is to say, presence and its formation, as conceived by this framework,are premised on being able to tell where you are in a space. Supporting this,in empirically testing this framework Balakrishnan and Sundar, (2011) foundthe ability to navigate oneself through the mediated environment was keyto experiencing presence.
General trends in virtual reality research and design align with thisperspective, as the majority of the field is focused on aspects of sight andsound—senses responsible for gauging relative position in a large environ-mental space (Blascovich & Bailenson, 2011). To this extent, some of themost commonly considered features, as iterated by the sample of studiesacquired here, pertain to overall improvement of visuals (in terms of reso-lution, detail, realism, etc.) and sound quality. What’s particularly interest-ing, however, is that despite the prominence of these component featuresof immersive systems, they apparently contribute relatively weakly to userpresence when compared to other features like field of view, stereoscopicvision, and tracking level.
One approach to understanding this distinction is to consider the extentto which each of these variables make a unique contribution to the user’s
Dow
nloa
ded
by [
171.
67.2
16.2
1] a
t 10:
54 0
5 Ju
ne 2
015
Immersion Presence Meta-Analysis 27
sense of presence. For instance, image quality may not be particularly crucialto one’s ability to construct a spatial model or self-locate. Surprisingly lowthresholds of detail and realism have been found to often be more thanenough to enable object identification and a sense of depth. Reeves and Nass(1996) found fidelity of visuals have no impact on user attention, recognition,or subjective experience, suggesting that people may not even notice whentechnology improves visual quality. Indeed, as Hochberg (1962) noted, ‘‘Per-fect physical fidelity is impossible and would not be of psychological interestif achieved, but perfect functional fidelity : : : is completely achievable andis of considerable psychological interest’’ (p. 30). Functionally, most viewersare able to negotiate the spatial cues of low fidelity visuals, easily linking animage to what it is supposed to represent. This capacity may be attributed toinnate properties of human perception, thereby removing the onus of fidelityfrom the media message itself (K. M. Lee, 2004b).
Bearing in mind the two-step model of presence formation, the conceptof functional fidelity may be particularly appropriate in discerning not onlywhy image and sound quality have a relatively smaller effect on presencethan other features, but also why tracking level, stereoscopy, and field ofview have a greater impact. The ability to interpret spatial cues so as toconstruct a spatial situational model is only the first step of the process;not only is physical fidelity not needed, but even if afforded through im-proved resolution, texturing, and the like, it will primarily only assist users incompleting the first step of the formative process—construing the mediatedenvironment as a spatial situation. In turn, other, different immersive featuresmay be much more important to the second step—perceiving oneself asbeing located with that space and having the possibilities to take action inor navigate through it. Tracking level, for instance, might be much moreimportant in regards to this step of presence formation. Systems that morefinely track and incorporate multiple, natural user inputs—that is, track moredegrees of freedom—likely provide users with a better sense of self-location,navigation, and action possibilities than do those with improved soundquality or visual realism. Further, the ability to discern relative depth ofvirtual objects through stereoscopy may assist users in processing the vir-tual space as one in which they are relatively positioned. Additionally, theobserved impact of field of view on user presence also makes sense inlight of this approach. When the mediated field of view encompasses afuller proportion of the user’s natural field of view, it may be easier toexperience oneself as located within that virtual space as opposed to externalreality.
In generalizing these findings to the design and implementation ofimmersive systems, it should be kept in mind that they apply to presenceas it is most generally conceptualized, what K. M. Lee (2004a) construesas spatial presence. These results may not carry over to designing medi-ated experiences for eliciting feelings of self-presence or social presence.
Dow
nloa
ded
by [
171.
67.2
16.2
1] a
t 10:
54 0
5 Ju
ne 2
015
28 J. J. Cummings and J. N. Bailenson
For example, the situational model users must construct to experience so-cial presence may depend far less on spatial cues and far more on issuesof communication channels. If so, immersive system features are perhapsnot the independent variables of concern when looking at social presence;rather, multi-modality, synchronous versus asynchronous communication,familiarity, and manipulations of artificial intelligence of agents and socialactors may be more relevant variables to consider.
One potential limitation to this meta-analysis is that it compares studiesinvolving technologies that change and improve over time. As such, the levelused to operationalize high immersion in an older study might constitute lowimmersion in more recent research. To this end, the present meta-analysisrelies on relative rather than absolute levels of immersion when comparingeffects across studies. Doing so still permits a meaningful comparison of therelative contribution of different features in eliciting a sense of presence,however, it might make it more difficult to identify an exact threshold levelat which a given immersive feature is enough or its effect plateaus. There issome comfort, however, in the fact that a reliance on relative comparisonsis inherent to meta-analyses, as well as the finding that the year of publica-tion—serving as a rough proxy for technological progress—was not seen tomoderate the overall effects observed.
Further, particular restrictions should be considered when applying thefindings yielded in this meta-analysis. Again, in examining the relationshipbetween immersive system quality and user presence we relied on self-reportmeasures. This conservative operationalization was for the sake of concep-tual parity, as required by a meta-analysis. However, additional summativeanalyses, whether quantitative or qualitative in nature, are needed to similarlyexamine any overall trends in behavioral measures of presence (such asvection or physiological activity). Similarly, operationalizations of immersionwere restricted to the most common, modal features manipulated in theliterature. As a result some potentially interesting manipulations of immersionare not considered here. Although sight- and sound-related features are themost pervasive, newly emerging forms of immersive technology—includinghaptic or even olfactory features—may become more common in comingyears. If so, a meta-analytic review of their relative contributions would bebeneficial in the future.
Other future efforts could also investigate potential moderators of therelationship between immersion and presence. The variance in effect sizesacross studies was here found to be significantly heterogeneous. The differ-ent operationalizations of immersion failed to fully account for this hetero-geneity, as did several proposed moderating variables tracked here. Whereasthe moderator analysis of a meta-analysis simply attempts to account forvariance ad hoc, future studies could intentionally isolate and empiricallymanipulate potential moderators of interest in a more controlled, experi-mental fashion.
Dow
nloa
ded
by [
171.
67.2
16.2
1] a
t 10:
54 0
5 Ju
ne 2
015
Immersion Presence Meta-Analysis 29
In ‘‘Virtually There’’ (2001), virtual reality pioneer Jaron Lanier outlinedhis vision of a world in which mediated reality would one day be capableof substituting many of the physically located elements of business, travel,and everyday interpersonal experiences. The long line of empirical workon presence, including the studies comprising the current analysis, havehelped serve to fulfill this vision: After decades of research, development,implementation, and testing, immersive technologies are advancing to thepoint that such a world is near. What we find here, in a meta-analysis of thoseefforts, is that certain immersive system features may be more important thanothers in achieving the sense of being there that ultimately drives the promiseof such technology. Future designs might therefore focus on such features—particularly tracking level, stereoscopy, and field of view—to better ensurethat users process virtual environments as actual spaces in which they feelphysically present.
NOTE
1. The included Witmer and Singer’s (1996) Presence Questionnaire, the Slater–Usoh–S-teed Questionnaire (Slater, Usoh, & Steed, 1994, 1995), the Temple Presence Inventory(Lombard, Ditton, & Weinstein, 2009), the Ingroup Presence Questionnaire (Schubert,Friedmann, & Regenbrecht, 2001), the ITC Sense of Presence Inventory (Lessiter, Free-man, Keogh, & Davidoff, 2001), the MEC Spatial Presence Questionnaire (Vorderer et al.,2004), and the Swedish Viewer-User Presence Questionnaire (Larsson, Västfjäll, & Kleiner,2001).
REFERENCES
Ahn, D., Seo, Y., Kim, M., Kwon, J. H., Jung, Y., Ahn, J., & Lee, D. (2014). The effectsof actual human size display and stereoscopic presentation on users’ senseof being together with and of psychological immersion in a virtual character.Cyberpsychology, Behavior, and Social Networking, 17, 483–487. Retrieved fromhttp://online.liebertpub.com/doi/abs/10.1089/cyber.2013.0455
Ahn, S. J. (2011). Embodied experiences in immersive virtual environments: Effects
on pro-environmental attitude and behavior (Unpublished doctoral disserta-tion), Stanford University, Palo Alto, CA.
Ahn, S. J., & Bailenson, J. N. (2011). Self-endorsing versus other-endorsing in virtualenvironments. Journal of Advertising, 40, 93–106.
André, C. R., Embrechts, J. J., Verly, J. G., Rébillat, M., & Katz, B. F. (2012, June).Sound for 3D cinema and the sense of presence. In M. A. Nees, B. N. Walker, &J. Freeman (Eds.), Proceedings of the 18th International Conference on Auditory
Display (pp. 14–21). Sonoma, CA: International Community for Auditory DisplayAxelsson, A. S., Abelin, Å., Heldal, I., Schroeder, R., & Wideström, J. (2001). Cubes
in the cube: A comparison of a puzzle-solving task in a virtual and a realenvironment. CyberPsychology & Behavior, 4, 279–286.
Dow
nloa
ded
by [
171.
67.2
16.2
1] a
t 10:
54 0
5 Ju
ne 2
015
30 J. J. Cummings and J. N. Bailenson
Aymerich-Franch, L. (2010). Presence and emotions in playing a group game ina virtual environment: The influence of body participation. Cyberpsychology,
Behavior, and Social Networking, 13, 649–654.Bae, S., Eller, C., & Lang, A. (2012). Presence, physiological arousal, and visual
recognition in 3D TV. Journal of Communication and Computer, 9, 560–567.Bailenson, J. N., Aharoni, E., Beall, A. C., Guadagno, R. E., Dimov, A., & Blascovich,
J. (2004, October). Comparing behavioral and self-report measures of embodied
agents’ social presence in immersive virtual environments. Proceedings of theInternational Society for Presence Research Annual Conference, Valencia, Spain.
Balakrishnan, B., & Sundar, S. S. (2011). Where am I? How can I get there? Impact ofnavigability and narrative transportation on spatial presence. Human–Computer
Interaction, 26, 161–204.Baños, R. M., Botella, C., Alcañiz, M., Liaño, V., Guerrero, B., & Rey, B. (2004). Im-
mersion and emotion: Their impact on the sense of presence. CyberPsychology
& Behavior, 7, 734–741.Baños, R. M., Botella, C., Rubio, I., Quero, S., Garcia-Palacios, A., & Alcaniz, M.
(2008). Presence and emotions in virtual environments: The influence of stere-oscopy. CyberPsychology & Behavior, 11, 1–8.
Barfield, W., Baird, K. M., & Bjorneseth, O. J. (1998). Presence in virtual environmentsas a function of type of input device and display update rate. Displays, 19, 91–98.
Barfield, W., & Hendrix, C. (1995). The effect of update rate on the sense of presencewithin virtual environments. Virtual Reality, 1, 3–15.
Biocca, F. (1997, August). The cyborg’s dilemma: Embodiment in virtual environ-ments. In Marsh, J. P., Nehaniy, C. L., & Gorayska, B. (Eds.), Cognitive Tech-
nology, 1997. ‘‘Humanizing the Information Age.’’ Proceeding., Second Inter-
national Conference on (pp. 12–26). Stoughton, WI: IEEE.Blascovich, J., & Bailenson, J. N. (2001). Infinite reality: Avatars, eternal life, new
worlds, and the dawn of the virtual revolution. New York, NY: HarperCollins.Botella, C., Rey, A., Perpiñá, C., Baños, R., Alcaniz, M., Garcia-Palacios, A., : : :
Alozano, J. (1999). Differences on presence and reality judgment using a highimpact workstation and a PC workstation. CyberPsychology & Behavior, 2, 49–52.
Bowman, D. A., & McMahan, R. P. (2007). Virtual reality: How much immersion isenough? IEEE Computer, 40(7), 36–43.
Bracken, C. C. (2005). Presence and image quality: The case of high-definitiontelevision. Media Psychology, 7, 191–205.
Bracken, C. C., & Botta, R. A. (2002, October). Presence and television: Form versus
content. Proceedings of the International Society for Presence Research AnnualConference, Porto, Portugal.
Bracken, C. C., Pettey, G., Guha, T., & Rubenking, B. E. (2010). Sounding out smallscreens and telepresence. Journal of Media Psychology, 22, 125–137.
Bracken, C. C., & Skalski, P. (2009). Telepresence and video games: The impact ofimage quality. PsychNology Journal, 7, 101–112.
Broek, P. (2008). To game or not to game: Examining differences in presence,
arousal and intended aggression after playing or observing a violent videogame
(Unpublished manuscript). Department of Psychology, University of Twente,The Netherlands.
Dow
nloa
ded
by [
171.
67.2
16.2
1] a
t 10:
54 0
5 Ju
ne 2
015
Immersion Presence Meta-Analysis 31
Bystrom, K. E., & Barfield, W. (1999). Collaborative task performance for learningusing a virtual environment. Presence: Teleoperators and Virtual Environments,8, 435–448.
Çiflikli, B., PIsler, V., Güdükbay, U. (2010). Increasing the sense of presence ina simulation environment using image generators based on visual attention.Presence: Teleoperators and Virtual Environments, 19, 557–568.
Cohen, J. (1988). Statistical power analysis for the behavioral sciences. Hillside, NJ:Erlbaum.
Cohen, J., & Cohen, P. (1983). Applied multiple regression/correlation analysis for
the behavioral sciences. Hillsdale, NJ: Erlbaum.De Kort, Y. A. W., Meijnders, A. L., Sponselee, A. A. G., & IJsselsteijn, W. A.
(2006). What’s wrong with virtual trees? Restoring from stress in a mediatedenvironment. Journal of Environmental Psychology, 26, 309–320.
Dinh, H. Q., Walker, N., Hodges, L. F., Song, C., & Kobayashi, A. (1999, March).Evaluating the importance of multi-sensory input on memory and the senseof presence in virtual environments. In L. Rosenblum, P. Astheimer, & D.Teichmann (Eds.), Virtual Reality, 1999. Proceedings of the IEEE (pp. 222–228). Piscataway, NJ: IEEE.
Felnhofer, A., Heinzle, A.-K., & Kothgassner, O. D. (2013, June). Game experience
and behavior in young women: A comparison of interface technologies. Pro-ceedings of the Usability Day XI, Dornbirn, Austria.
Fox, J., & Bailenson, J. N. (2009). Virtual self-modeling: The effects of vicariousreinforcement and identification on exercise behaviors. Media Psychology, 12,1–25.
Freeman, J., Avons, S. E., Meddis, R., Pearson, D. E., & IJsselsteijn, W. (2000).Using behavioral realism to estimate presence: A study of the utility of posturalresponses to motion stimuli. Presence: Teleoperators and Virtual Environments,9, 149–164.
Gamito, L., & Anastácio, M. (2006). Presence: Head mounted display vs. translucidscreen. Annual Review of CyberTherapy and Telemedicine, 4, 111–116.
Gandy, M., Catrambone, R., MacIntyre, B., Alvarez, C., Eiriksdottir, E., Hilimire, M.,: : : McLaughlin, A. C. (2010, October). Experiences with an AR evaluation testbed: Presence, performance, and physiological measurement. In T. Höllerer, V.Lepetit, & J. Park (Eds.), Mixed and Augmented Reality (ISMAR), 2010 9th IEEE
International Symposium on (pp. 127–136). Piscataway, NJ: IEEE.Gorini, A., Capideville, C. S., De Leo, G., Mantovani, F., & Riva, G. (2011). The role of
immersion and narrative in mediated presence: The virtual hospital experience.Cyberpsychology, Behavior, and Social Networking, 14(3), 99–105.
Grassi, A., Giaggioli, A., & Riva, G. (2008, October). The influence of media content
and media form in sense of presence: A preliminary study. Proceedings of theInternational Society for Presence Research Annual Conference, Padova, Italy.
Grigorovici, D. (2003). Persuasive effects of presence in immersive virtual environ-ments. In G. Riva, F. Davide, & W. IJsselsteijn (Eds.), Being there: Concepts,
effects and measurement of presence in synthetic environments (pp. 192–205).Amsterdam, The Netherlands: Ios Press.
Häkkinen, J., Vuori, T., & Paakka, M. (2002, October). Postural stability and sicknesssymptoms after HMD use. In Proceedings of IEEE International Conference on
Systems, Man and Cybernetics.
Dow
nloa
ded
by [
171.
67.2
16.2
1] a
t 10:
54 0
5 Ju
ne 2
015
32 J. J. Cummings and J. N. Bailenson
Hauber, J., Regenbrecht, H., Hills, A., Cockburn, A., & Billinghurst, M. (2005, Septem-ber). Social presence in two- and three-dimensional videoconferencing. Pro-ceedings of the International Society for Presence Research Annual Conference,London, UK.
Heeter, C. (1992). Being there: The subjective experience of presence. Presence:
Teleoperators and Virtual Environments, 1, 262–271.Hendrix, C., & Barfield, W. (1996a). Presence within virtual environments as a
function of visual display parameters. Presence: Teleoperators and Virtual En-
vironments, 5, 274–289.Hendrix, C., & Barfield, W. (1996b). The sense of presence within auditory vir-
tual environments. Presence: Teleoperators and Virtual Environments, 5, 290–301.
Hochberg, J. (1962). The psychophysics of pictorial perception. Audiovisual Com-
munication Review, 10(5), 22–54.Hou, J., Nam, Y., Peng, W., & Lee, K. M. (2012). Effects of screen size, viewing
angle, and players’ immersion tendencies on game experience. Computers in
Human Behavior, 28, 617–623.Huang, H. (2003, October). Effects of interactivity and expressiveness on perceived
social presence, memory and persuasion in interactive health communications.
Proceedings of the International Society for Presence Research Annual Confer-ence, Aalborg, Denmark.
Huang, S. F., Tsai, P. Y., Sung, W. H., Lin, C. Y., & Chuang, T. Y. (2008). Thecomparisons of heart rate variability and perceived exertion during simulatedcycling with various viewing devices. Presence: Teleoperators and Virtual En-
vironments, 17, 575–583.Hunter, J. E., & Schmidt, F. L. (1990). Methods of meta-analysis: Correcting error
and bias in research findings. Newbury Park, CA: Sage.IJsselsteijn, W., de Ridder, H., Freeman, J., Avons, S. E., & Bouwhuis, D. (2001).
Effects of stereoscopic presentation, image motion, and screen size on subjectiveand objective corroborative measures of presence. Presence: Teleoperators and
Virtual Environments, 10, 298–311.Ivory, J. D., & Kalyanaraman, S. (2007). The effects of technological advancement
and violent content in video games on players’ feelings of presence, involve-ment, physiological arousal, and aggression. Journal of Communication, 57,532–555.
Jeong, E. J., Biocca, F. A., & Bohil, C. J. (2008, October). Effects of representational
realism in 3D violent games. Proceedings of the International Society for Pres-ence Research Annual Conference, Padua, Italy.
Jeong, E. J., Biocca, F. A., & Bohil, C. J. (2009, November). Advertising effects through
violent virtual experience—Presence, arousal, brand memory and attitude in
3D violent games. Proceedings of the International Society for Presence Re-search Annual Conference, Los Angeles, CA.
Johnson, D. M., & Stewart, II, J. E. (1999). Use of virtual environments for theacquisition of spatial knowledge: Comparison among different visual displays.Military Psychology, 11, 129–148.
Juan, M. C., & Pérez, D. (2009). Comparison of the levels of presence and anxiety inan acrophobic environment viewed via HMD or CAVE. Presence: Teleoperators
and Virtual Environments, 18, 232–248.
Dow
nloa
ded
by [
171.
67.2
16.2
1] a
t 10:
54 0
5 Ju
ne 2
015
Immersion Presence Meta-Analysis 33
Kallinen, K., Salminen, M., Ravaja, N., Kedzior, R., & Saaksjarvi, M. (2007, October).Presence and emotion in computer game players during 1st person vs. 3rd
person playing view: Evidence from self-report, eye-tracking, and facial muscle
activity data. Proceedings of the International Society for Presence ResearchAnnual Conference, Barcelona, Spain.
Kalyanaraman, S., Penn, D. L., Ivory, J. D., & Judge, A. (2010). The virtual doppel-ganger: Effects of a virtual reality simulator on perceptions of schizophrenia.Journal of Nervous and Mental Disease, 198, 437–443.
Keshavarz, B., & Hecht, H. (2012a). Stereoscopic viewing enhances visually inducedmotion sickness but sound does not. Presence: Teleoperators and Virtual Envi-
ronments, 21, 213–228.Keshavarz, B., & Hecht, H. (2012b). Visually induced motion sickness and presence
in videogames: The role of sound. In W. S. Marras (Ed.), Proceedings of the
Human Factors and Ergonomics Society Annual Meeting (Vol. 56, pp. 1763–1767). Thousand Oaks, CA: Sage.
Kim, K., Rosenthal, M. Z., Zielinski, D. J., & Brady, R. (2014). Effects of virtual envi-ronment platforms on emotional responses. Computer Methods and Programs
in Biomedicine, 113, 882–893.Kim, K. J., & Sundar, S. S. (2013). Can interface features affect aggression resulting
from violent video game play? An examination of realistic controller and largescreen size. Cyberpsychology, Behavior, and Social Networking, 16, 329–334.
Kim, T., & Biocca, F. (1997). Telepresence via television: Two dimensions of tele-presence may have different connections to memory and persuasion. Journal of
Computer-Mediated Communication, 3(2). Retrieved from http://onlinelibrary.wiley.com/doi/10.1111/j.1083-6101.1997.tb00073.x/abstract
Krijn, M., Emmelkamp, P. M., Biemond, R., de Wilde de Ligny, C., Schuemie, M. J., &van der Mast, C. A. (2004). Treatment of acrophobia in virtual reality: The roleof immersion and presence. Behaviour Research and Therapy, 42, 229–239.
Lane, H. C., Hays, M. J., Core, M. G., & Auerbach, D. (2013). Learning interculturalcommunication skills with virtual humans: Feedback and fidelity. Journal of
Educational Psychology, 105, 1026–1035.Lanier, J. (2001). Virtually there. Scientific American, 284(4), 66–75.Larsson, P., Västfjäll, D., & Kleiner, M. (2001). The actor-observer effect in virtual
reality presentations. CyberPsychology & Behavior, 4, 239–246.Larsson, P., Västfjäll, D., Olsson, P., & Kleiner, M. (2007, October). When what
you hear is what you see: Presence and auditory-visual integration in virtual
environments. Proceedings of the International Society for Presence ResearchAnnual Conference, Barcelona, Spain.
Lee, H., & Chung, D. (2013). Influence of gaming display and controller on perceivedcharacteristics, perceived interactivity, presence, and discomfort. In M. Kurosu(Ed.), Human-Computer Interaction. Applications and Services (pp. 258–265).Berlin, Germany: Springer.
Lee, K. M. (2004a). Presence, explicated. Communication Theory, 14, 27–50.Lee, K. M. (2004b). Why presence occurs: Evolutionary psychology, media equation,
and presence. Presence: Teleoperators and Virtual Environments, 13, 494–505.Lee, K. M., Park, N., Jin, S., & Kang, S. (2005, May). Effects of narrative on feelings
of presence in computer-game playing. Paper presented at the annual meetingof the International Communication Association, New York, NY.
Dow
nloa
ded
by [
171.
67.2
16.2
1] a
t 10:
54 0
5 Ju
ne 2
015
34 J. J. Cummings and J. N. Bailenson
Lessiter, J., Freeman, J., Keogh, E., & Davidoff, J. (2001). A cross-media presencequestionnaire: The ITC-Sense of Presence Inventory. Presence: Teleoperators
and Virtual Environments, 10, 282–297.Lim, S., & Reeves, B. (2009). Being in the game: Effects of avatar choice and point
of view on psychophysiological responses during play. Media Psychology, 12,348–370.
Ling, Y., Brinkman, W. P., Negs, H. T., Qu, C., & Heynderickx, I. (2012). Effectsof stereoscopic viewing on presence, anxiety and cybersickness in a virtualreality environment for public speaking. Presence: Teleoperators and Virtual
Environments, 21, 254–267.Lipsey, M. W., & Wilson, D. B. (2001). Practical meta-analysis (Vol. 49). Thousand
Oaks, CA: Sage Publications.Lombard, M., & Ditton, T. (1997). At the heart of it all: The concept of presence.
Journal of Computer-Mediated Communication, 3(2). Retrieved from http://onlinelibrary.wiley.com/doi/10.1111/j.1083-6101.1997.tb00072.x/full
Lombard, M., & Ditton, T. B. (2000, March). Measuring presence: A literature-based
approach to the development of a standardized paper-and-pencil instrument.
Proceedings of the International Society for Presence Research Annual Confer-ence, Delft, The Netherlands.
Lombard, M., Ditton, T. B., & Weinstein, L. (2009, November). Measuring presence:
The Temple Presence Inventory. Proceedings of the International Society forPresence Research Annual Conference, Los Angeles, California, USA.
Lombard, M., Reich, R. D., Grabe, M. E., Bracken, C. C., & Ditton, T. B. (2000).Presence and television. Human Communication Research, 26, 75–98.
Lo Priore, C., Castelnuovo, G., Liccione, D., & Liccione, D. (2003). Experiencewith V-STORE: Considerations on presence in virtual environments for effectiveneuropsychological rehabilitation of executive functions. CyberPsychology &
Behavior, 6, 281–287.Lott, A., Bisson, E., Lajoie, Y., McComas, J., & Sveistrup, H. (2003). The effect
of two types of virtual reality on voluntary center of pressure displacement.Cyberpsychology & Behavior, 6, 477–485.
McGloin, R., Farrar, K. M., & Krcmar, M. (2011). The impact of controller natural-ness on spatial presence, gamer enjoyment, and perceived realism in a tennissimulation video game. Presence: Teleoperators and Virtual Environments, 20,309–324.
McGloin, R., Farrar, K., & Krcmar, M. (2013). Video games, immersion, and cognitiveaggression: Does the controller matter? Media Psychology, 16, 65–87.
McMahan, A. (2003). Immersion, engagement, and presence: A method for analyzing3-D video games. In M. J. P. Wolf & P. Bernard (Eds.), The video game theory
reader (pp. 67–86). New York, NY: Routledge.Monahan, T., McArdle, G., & Bertolotto, M. (2008). Virtual reality for collaborative
e-learning. Computers & Education, 50, 1339–1353.Moreno, R., & Mayer, R. E. (2002). Learning science in virtual reality multimedia
environments: Role of methods and media. Journal of Educational Psychology,94, 598–619.
Moreno, R., & Mayer, R. E. (2004). Personalized messages that promote sciencelearning in virtual environments. Journal of Educational Psychology, 96, 165–173.
Dow
nloa
ded
by [
171.
67.2
16.2
1] a
t 10:
54 0
5 Ju
ne 2
015
Immersion Presence Meta-Analysis 35
Morina, N., Beuving, J., Deiman, A., Kampmann, I. L., Brinkman, W-P., Hartanto, D.,& Emmelkamp, P. M. G. (2012, September). Social virtual environments for the
treatment of social phobia: Using different virtual reality displays. CyberPsy-chology & CyberTherapy Conference 17, Brussels, Belgium.
Muhlbach, L., Bocker, M., & Prussog, A. (1995). Telepresence in videocommuni-cations: A study on stereoscopy and individual eye contact. Human Factors:
Journal of the Human Factors and Ergonomics Society, 37, 290–305.Nichols, S., Haldane, C., & Wilson, J. R. (2000). Measurement of presence and
its consequences in virtual environments. International Journal of Human-
Computer Studies, 52(3), 471–491.Nordahl, R. (2005). Self-induced footsteps sounds in virtual reality: Latency, recogni-
tion, quality and presence. Proceedings of the International Society for Presence
Research Annual Conference, September 21–23, London, U.K.Nowak, K. L., Krcmar, M., & Farrar, K. M. (2006, August). Examining the relationship
between violent video games, presence, and aggression. Proceedings of the
International Society for Presence Research Annual Conference, Cleveland,Ohio.
Nunez, D., & Blake, E. (2001). Cognitive presence as a unified concept of virtualreality effectiveness. In S. N. Spencer (Ed.), Proceedings of the 1st International
Conference on Computer Graphics, Virtual Reality and Visualisation (pp. 115–118). New York, NY: ACM.
Pausch, R., Proffitt, D., & Williams, G. (1997). Quantifying immersion in virtualreality. In T. Whitted (Ed.), Proceedings from the ACM SIGGRAPH Annual Con-
ference, Computer Graphics (pp. 13–18). New York, NY: ACM Press/Addison-Wesley.
Peck, T. C., Fuchs, H., & Whitton, M. C. (2011). An evaluation of navigational abilitycomparing redirected free exploration with distractors to walking-in-place andjoystick locomotion interfaces. In K. Kiyokawa, G. Klinker, & B. Lok (Eds.),Virtual Reality Conference (VR), 2011 IEEE (pp. 55–62). Piscataway, NJ: IEEE.
Peer, A., Pongrac, H., & Buss, M. (2010). Influence of varied human movementcontrol on task performance and feeling of telepresence. Presence: Teleoperators
and Virtual Environments, 19, 463–481.Persky, S., & Blascovich, J. (2008). Immersive virtual video game play and presence:
Influences on aggressive feelings and behavior. Presence: Teleoperators and
Virtual Environments, 17, 57–72.Poeschl, S., Wall, K., & Doering, N. (2013, March). Integration of spatial sound
in immersive virtual environments an experimental study on effects of spatialsound on presence. In Coquillart, S., LaViola, J. J., Jr., & Schmalsteig, D. (Eds.),Proceedings of the IEEE Virtual Reality Conference 2013 (pp. 129–130). Piscat-away, NJ: IEEE Computer Society Press.
Price, M., & Anderson, P. (2007). The role of presence in virtual reality exposuretherapy. Journal of Anxiety Disorders, 21, 742–751.
Prothero, J. D., & Hoffman, H. G. (1995). Widening the field-of-view increases the
sense of presence in immersive virtual environments. (Technical Report No.TR-95, 2). Seattle, WA: Human Interface Technology Laboratory.
Rajae-Joordens, R., Langendijk, E., Wilinski, P., & Heynderickx, I. (2005, December).Added value of a multi-view auto-stereoscopic 3D display in gaming applica-
tions. In Proceedings of the International Display Workshop, Takamatsu, Japan.
Dow
nloa
ded
by [
171.
67.2
16.2
1] a
t 10:
54 0
5 Ju
ne 2
015
36 J. J. Cummings and J. N. Bailenson
Rampoldi-Hnilo, L. A., Kind, K., Devries, J., Tait, K., & Besecker, K. (1997). The
presence of presence: The influence of narrative on the perception of presence
in virtual environments. (Unpublished manuscript), Michigan State University,East Lansing, MI.
Rand, D., Kizony, R., Feintuch, U., Katz, N., Josman, N., & Weiss, P. L. T. (2005).Comparison of two VR platforms for rehabilitation: Video capture versus HMD.Presence: Teleoperators and Virtual Environments, 14, 147–160.
Ravaja, N., Saari, T., Turpeinen, M., Laarni, J., Salminen, M., & Kivikangas, M. (2006).Spatial presence and emotions during video game playing: Does it matter withwhom you play? Presence: Teleoperators and Virtual Environments, 15, 381–392.
Regenbrecht, H., & Schubert, T. E. (2002). Real and illusory interactions enhancepresence in virtual environments. Presence: Teleoperators and Virtual Environ-
ments, 11, 425–434.Reeves, B., Cummings, J. J., Scarborough, J., & Read, J. L. (2010). Government uses
for games and virtual worlds: Optimizing choices for citizens and governmentworkers in the areas of energy efficiency, educational assessment, work pro-ductivity, safety and health, and quality of information exchanges (White HouseOffice of Science and Technology Policy’s Occasional Papers in Science andTechnology Policy Series), Washington, D.C.
Reeves, B., & Nass, C. (1996). The media equation: How people treat computers, tele-
vision, and new media like real people and places. New York, NY: CambridgeUniversity Press.
Riva, G. (2002). Virtual reality for health care: the status of research. Cyberpsychology
& Behavior, 5, 219–225.Rooney, B., Benson, C., & Hennessy, E. (2012). The apparent reality of movies
and emotional arousal: A study using physiological and self-report measures.Poetics, 40, 405–422.
Rooney, B., & Hennessy, E. (2013). Actually in the cinema: A field study comparingreal 3D and 2D movie patrons’ attention, emotion, and film satisfaction. Media
Psychology, 16, 441–460.Rosenthal, R. (1991). Meta-analysis: A review. Psychosomatic Medicine, 53, 247–271.Rosenthal, R., & DiMatteo, M. R. (2001). Meta-analysis: Recent developments in
quantitative methods for literature reviews. Annual Review of Psychology, 52,59–82.
Sallnäs, E. L. (2005). Effects of communication mode on social presence, virtualpresence, and performance in collaborative virtual environments. Presence:
Teleoperators and Virtual Environments, 14, 434–449.Schlindwein, L. F. M., Hounsell, M. D. S., & Kemczinski, A. (2013). A comparative
study on aspects that influence the sense of presence in virtual environments.Revista Brasileira de Computação Aplicada, 5, 113–125.
Schmierbach, M., Limperos, A. M., & Woolley, J. K. (2012). Feeling the need for(personalized) speed: How natural controls and customization contribute toenjoyment of a racing game through enhanced immersion. Cyberpsychology,
Behavior, and Social Networking, 15, 364–369.Schubert, T., Friedmann, F., & Regenbrecht, H. (2001). The experience of presence:
Factor analytic insights. Presence: Teleoperators and Virtual Environments, 10,266–281.
Dow
nloa
ded
by [
171.
67.2
16.2
1] a
t 10:
54 0
5 Ju
ne 2
015
Immersion Presence Meta-Analysis 37
Seay, A. F., Krum, D. M., Hodges, L., & Ribarsky, W. (2001). Simulator sickness andpresence in a high FOV virtual environment. In H. Takemura, K. Kiyokawa, &G. Klinker (Eds.), Virtual Reality, 2001. Proceedings of the IEEE (pp. 299–300).Piscataway, NJ: IEEE.
Shim, W., & Kim, G. J. (2003). Designing for presence and performance: The caseof the virtual fish tank. Presence: Teleoperators and Virtual Environments, 12,374–386.
Skalski, P., Tamborini, R., Shelton, A., Buncher, M., & Lindmark, P. (2011). Mappingthe road to fun: Natural video game controllers, presence, and game enjoyment.New Media & Society, 13, 224–242.
Skalski, P., & Whitbred, R. (2010). Image versus sound: A comparison of formalfeature effects on presence and video game enjoyment. PsychNology Journal,8, 67–84.
Slater, M. (2004). How colorful was your day? Why questionnaires cannot assesspresence in virtual environments. Presence: Teleoperators and Virtual Environ-
ments, 13, 484–493.Slater, M. (2009). Place illusion and plausibility can lead to realistic behaviour in
immersive virtual environments. Philosophical Transactions of the Royal Society
B: Biological Sciences, 364, 3549–3557.Slater, M., Linakis, V., Usoh, M., & Kooper, R. (1996). Immersion, presence, and per-
formance in virtual environments: An experiment with tri-dimensional chess. InM. Green (Ed.), ACM Virtual Reality Software and Technology (VRST) (pp. 163–172). New York, NY: ACM Press.
Slater, M., Usoh, M., & Steed, A. (1994). Depth of presence in virtual environments.Presence: Teleoperators and Virtual Environments, 3, 130–144.
Slater, M., Usoh, M., & Steed, A. (1995) Taking steps: The influence of a walkingmetaphor on presence in virtual reality. ACM Transactions on Computer Human
Interaction, 2, 201–219.Slater, M., & Wilbur, S. (1997). A framework for immersive virtual environments
(FIVE): Speculations on the role of presence in virtual environments. Presence:
Teleoperators and Virtual Environments, 6, 603–616.Snow, M. P., & Williges, R. C. (1998). Empirical models based on free-modulus mag-
nitude estimation of perceived presence in virtual environments. Human Fac-
tors: The Journal of the Human Factors and Ergonomics Society, 40, 386–402.Song, H., Kim, J., Tenzek, K. E., & Lee, K. M. (2010, June). The effects of competition
on intrinsic motivation in exergames and the conditional indirect effects of
presence. Annual Conference of the International Communication Association,Singapore.
Steuer, J. (1992). Defining virtual reality: Dimensions determining telepresence. Jour-
nal of Communication, 42(4), 73–93.Sutherland, I., 1965. The ultimate display. Information processing 1965. In W. A.
Kalenich (Ed.), Proceedings of the IFIP Congress 65, 2 (pp. 506–508). Washing-ton, DC: Spartan Books.
Swinth, K. R., & Blascovich, J. (2001, June). Conformity to group norms in an
immersive virtual environment. Paper presented at the annual meeting of theAmerican Psychological Society, Toronto, Canada.
Takatalo, J., Häkkinen, J., Komulainen, J., Särkelä, H., & Nyman, G. (2006). Theimpact of the display type and content to a game adaptation. In M. Nieminen,
Dow
nloa
ded
by [
171.
67.2
16.2
1] a
t 10:
54 0
5 Ju
ne 2
015
38 J. J. Cummings and J. N. Bailenson
& M. Roykkee (Eds.), Proceedings of the 8th conference on Human-Computer
Interaction with Mobile Devices and Services (pp. 17–20). New York, NY: ACM.Takatalo, J., Kawai, T., Kaistinen, J., Nyman, G., & Häkkinen, J. (2011). User expe-
rience in 3D stereoscopic games. Media Psychology, 14, 387–414.Tamborini, R., & Bowman, N. D. (2010). Presence in video games. In Bracken, C. C.,
& Skalski, P. (Eds.) Immersed in media: Telepresence in everyday life (pp. 87–109). New York, NY: Routledge.
Tamborini, R., & Skalski, P. (2006). The role of presence in the experience of elec-tronic games. In P. Vorderer & J. Bryant (Eds.), Playing video games: Motives,
responses, and consequences (pp. 225–240). New York, NY: Routledge.Usoh, M., Catena, E., Arman, S., & Slater, M. (2000). Using presence questionnaires
in reality. Presence: Teleoperators and Virtual Environments, 9, 497–503.Vorderer, P., Wirth, W., Gouveia, F. R., Biocca, F., Saari, T., Jäncke, F., : : : , & Jäncke,
P. (2004). MEC spatial presence questionnaire (MEC-SPQ): Short documentation
and instructions for application (Report to the European Community, ProjectPresence: MEC (IST-2001-37661). Brussels, Belgium.
Wallis, G., & Tichon, J. (2013). Predicting the efficacy of simulator-based trainingusing a perceptual judgment task versus questionnaire-based measures of pres-ence. Presence: Teleoperators and Virtual Environments, 22, 67–85.
Welch, R. B., Blackmon, T. T., Liu, A., Mellers, B. A., & Stark, L. W. (1996). The effectsof pictorial realism, delay of visual feedback, and observer interactivity on thesubjective sense of presence. Presence: Teleoperators and Virtual Environments,5, 263–273.
Wideström, J., Axelsson, A. S., Schroeder, R., Nilsson, A., Heldal, I., & Abelin, Å.(2000). The collaborative cube puzzle: A comparison of virtual and real environ-ments. In E. Churchill, & M. Reddy (Eds.), Proceedings of the 3rd International
Conference on Collaborative Virtual Environments (pp. 165–171). New York,NY: ACM.
Williams, K. D. (2013). The effects of video game controls on hostility, identification,and presence. Mass Communication and Society, 16, 26–48.
Wirth, W., Hartmann, T., Böcking, S., Vorderer, P., Klimmt, C., Schramm, H., : : : ,& Jäncke, P. (2007). A process model of the formation of spatial presenceexperiences. Media Psychology, 9, 493–525.
Witmer, B. G., & Singer, M. J. (1998). Measuring presence in virtual environments: Apresence questionnaire. Presence: Teleoperators and Virtual Environments, 7,225–240.
Yim, M. Y. C., Cicchirillo, V. J., & Drumwright, M. E. (2012). The impact of stereo-scopic three-dimensional (3-D) advertising. Journal of Advertising, 41, 113–128.
Zanbaka, C. A., Lok, B. C., Babu, S. V., Ulinski, A. C., & Hodges, L. F. (2005).Comparison of path visualizations and cognitive measures relative to traveltechnique in a virtual environment. IEEE Transactions on Visualization and
Computer Graphics, 11, 694–705.Zimmons, P., & Panter, A. (2003). The influence of rendering quality on presence
and task performance in a virtual environment. In J. Chen, B. Froehlich, B.Loftin, U. Neumann, & H. Takemura (Eds.), Virtual Reality, 2003. Proceedings
of the IEEE (pp. 293–294). Piscataway, NJ: IEEE.
Dow
nloa
ded
by [
171.
67.2
16.2
1] a
t 10:
54 0
5 Ju
ne 2
015