Embed Size (px)
Citation preview

How Many Samples are Enough? Theoretical Determination of the Critical Sampling Density for a
Greek Clay Quarry.byby
K. Modis and S. StavrouK. Modis and S. Stavrou, Nat. Tech. Univ. of Athens, GREECE, Nat. Tech. Univ. of Athens, GREECE
A. ChristoforidisA. Christoforidis, HERACLES Cement Co, HERACLES Cement Co
APCOM 09 – 10-07-2009, Vancouver, CANADA

Modis et al: Theoretical Determination of the Critical Sampling Density for a Greek Clay Quarry.
2
Contents
ScopeScope About the TheoryAbout the Theory Case Study: the Sesklo Clay QuarryCase Study: the Sesklo Clay Quarry ConclusionsConclusions

Modis et al: Theoretical Determination of the Critical Sampling Density for a Greek Clay Quarry.
3
Scope

Modis et al: Theoretical Determination of the Critical Sampling Density for a Greek Clay Quarry.
4
The Objective
The objective of this work The objective of this work is to apply is to apply recently recently established theoretical established theoretical resultsresults (Modis and (Modis and Papaodysseus, 2006) in Papaodysseus, 2006) in order to estimate the order to estimate the optimum sampling grid in optimum sampling grid in a clay quarry in central a clay quarry in central Greece.Greece.
ScopeScope

Modis et al: Theoretical Determination of the Critical Sampling Density for a Greek Clay Quarry.
5
Where are we based on? The theoretical results are based The theoretical results are based
on the on the sampling theorem of sampling theorem of informationinformation which states that a which states that a band limitedband limited (i.e. (i.e. slow varyingslow varying) ) random waveform can be random waveform can be
totallytotally reconstructed by its reconstructed by its samples if the sampling rate is samples if the sampling rate is greater than a greater than a critical valuecritical value depending on its characteristics depending on its characteristics
ScopeScope
Modis et al: Theoretical Determination of the Critical Sampling Density for a Greek Clay Quarry.
6
Is it Reasonable?
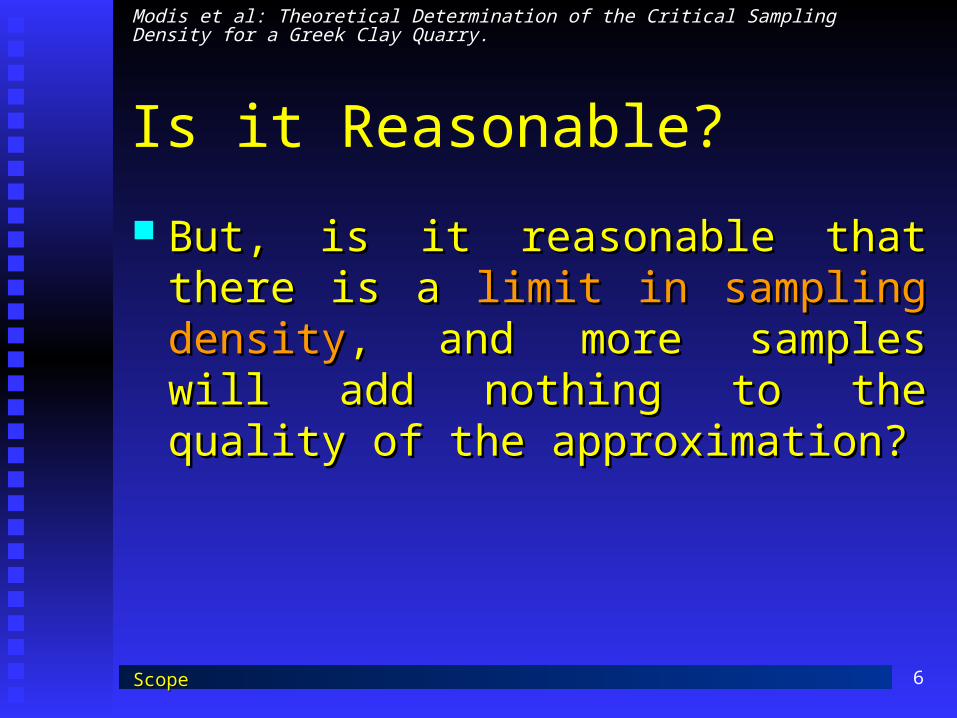
But, is it reasonable that there is a But, is it reasonable that there is a limit in limit in sampling densitysampling density, and more samples will , and more samples will add nothing to the quality of the add nothing to the quality of the approximation?approximation?
ScopeScope

Modis et al: Theoretical Determination of the Critical Sampling Density for a Greek Clay Quarry.
7
The Answer…
The answer in fact is yes, under the condition that The answer in fact is yes, under the condition that the the frequency contentfrequency content of the sampled variable is of the sampled variable is limited. Band limitedness ensures slow variation. limited. Band limitedness ensures slow variation. And it is easier to sample a slow varying And it is easier to sample a slow varying phenomenon than a rapidly varying one.phenomenon than a rapidly varying one.
There are two important facts about our approach …There are two important facts about our approach …
ScopeScope

Modis et al: Theoretical Determination of the Critical Sampling Density for a Greek Clay Quarry.
8
Important Fact 1:
It is the only way to It is the only way to estimate a estimate a theoretical theoretical limitlimit to the sampling to the sampling density, above which density, above which there is no significant there is no significant improvement to the improvement to the accuracy of estimation.accuracy of estimation.
ScopeScope

Modis et al: Theoretical Determination of the Critical Sampling Density for a Greek Clay Quarry.
9
Important Fact 2:
In the case of an In the case of an existing sampling grid, existing sampling grid, if the drill hole density if the drill hole density is close to the ideal one,is close to the ideal one, most most interpolation interpolation algorithms convergealgorithms converge to to reality.reality.
ScopeScope

Modis et al: Theoretical Determination of the Critical Sampling Density for a Greek Clay Quarry.
10
About the Theory

Modis et al: Theoretical Determination of the Critical Sampling Density for a Greek Clay Quarry.
11
About band-limitedness
According to the aforementioned sampling According to the aforementioned sampling theorem, only theorem, only band-limitedband-limited waveforms can be waveforms can be reconstructed by their samples.reconstructed by their samples.
Modis and Papaodysseus (2006) have pointed out Modis and Papaodysseus (2006) have pointed out that earth- related phenomena represented by a that earth- related phenomena represented by a variogram model variogram model with a sillwith a sill (e.g. Spherical (e.g. Spherical scheme) are scheme) are approximatelyapproximately bandlimited. bandlimited.
About the TheoryAbout the Theory

Modis et al: Theoretical Determination of the Critical Sampling Density for a Greek Clay Quarry.
12
A Simple Example
For example, the For example, the fourier transform of a fourier transform of a linear variogram/ linear variogram/ covariance model with covariance model with a sill,a sill,
(b)
1
h
γ(h)
a-a 0
1
h
R(h)
a-a
(a)
0
ωS
(ω)
0 2π/a
a
is approximately is approximately bandlimitedbandlimited
About the TheoryAbout the Theory
Modis et al: Theoretical Determination of the Critical Sampling Density for a Greek Clay Quarry.
13
A Common Example
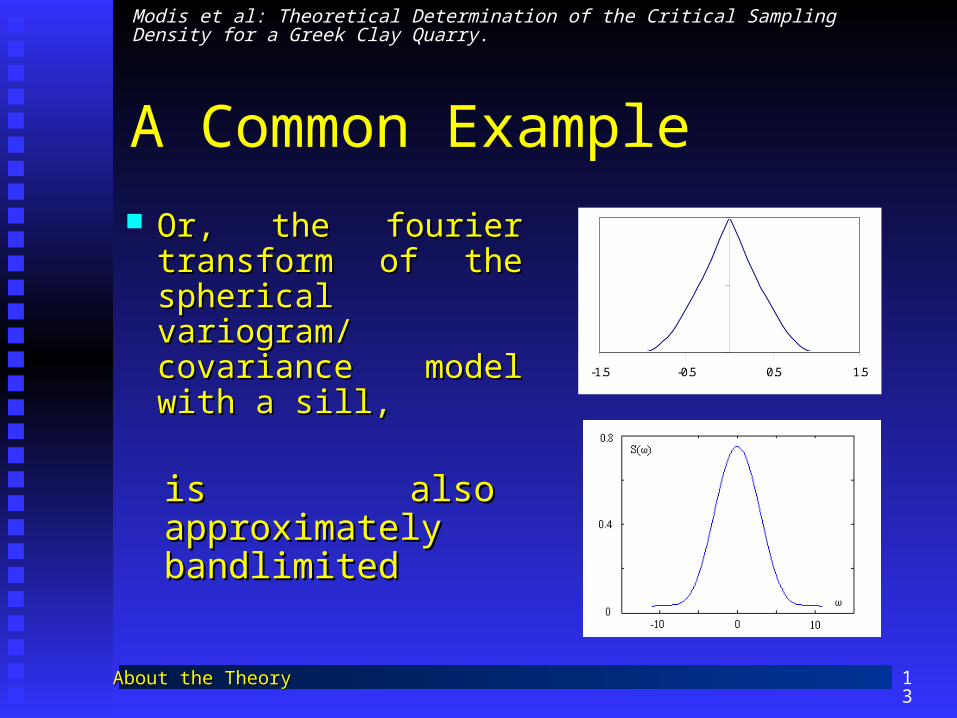
Or, the fourier Or, the fourier transform of the transform of the spherical variogram/ spherical variogram/ covariance model with covariance model with a sill,a sill,
is also approximately is also approximately bandlimitedbandlimited
-1.5 -0.5 0.5 1.5
About the TheoryAbout the Theory

Modis et al: Theoretical Determination of the Critical Sampling Density for a Greek Clay Quarry.
14
The Algorithm
In that case, it is shown that the critical sampling In that case, it is shown that the critical sampling interval equals interval equals half the range of influencehalf the range of influence of the of the underlying variogram model.underlying variogram model.
According to the above, the estimation of the According to the above, the estimation of the critical sampling rate of a spatial phenomenon is critical sampling rate of a spatial phenomenon is done in two steps:done in two steps:
About the TheoryAbout the Theory

Modis et al: Theoretical Determination of the Critical Sampling Density for a Greek Clay Quarry.
15
Step 1:
During structural analysis, During structural analysis, the the variogram/ covariance variogram/ covariance modelmodel is estimated. If it is is estimated. If it is a model without a sill, the a model without a sill, the process stops here.process stops here.
About the TheoryAbout the Theory

Modis et al: Theoretical Determination of the Critical Sampling Density for a Greek Clay Quarry.
16
Step 2:
Step Step 2.2. At the At the estimation stage, the estimation stage, the critical sampling interval is critical sampling interval is estimated by estimated by halving the halving the range of influencerange of influence of the of the underlying variogram underlying variogram model.model.
About the TheoryAbout the Theory

Modis et al: Theoretical Determination of the Critical Sampling Density for a Greek Clay Quarry.
17
Case Study: the Sesklo Clay Quarry

Modis et al: Theoretical Determination of the Critical Sampling Density for a Greek Clay Quarry.
18
The Sesklo Clay Quarry
The Sesklo quarry is The Sesklo quarry is situated near the city of situated near the city of Volos in central Greece Volos in central Greece and exploited by the and exploited by the ““HeraclesHeracles” General ” General Cement Company for Cement Company for more than 40 years. more than 40 years.
Its purpose is to supply a Its purpose is to supply a major Cement Plant.major Cement Plant.
Case Study: the Sesklo Clay QuarryCase Study: the Sesklo Clay Quarry

Modis et al: Theoretical Determination of the Critical Sampling Density for a Greek Clay Quarry.
19
Sampling
The clay deposit The clay deposit has been surveyed has been surveyed by a drilling by a drilling campaign, which campaign, which includes 45 drill includes 45 drill holesholes..
Average distance Average distance between drill holes between drill holes was was 50 m50 m
Case Study: the Sesklo Clay QuarryCase Study: the Sesklo Clay Quarry

Modis et al: Theoretical Determination of the Critical Sampling Density for a Greek Clay Quarry.
20
Physical Variable
The 388 samples (3m long) The 388 samples (3m long) were analyzed for Alwere analyzed for Al22OO3 3
which, being the most which, being the most important ingredient, was important ingredient, was used for reserves used for reserves characterization.characterization.
Case Study: the Sesklo Clay QuarryCase Study: the Sesklo Clay Quarry

Modis et al: Theoretical Determination of the Critical Sampling Density for a Greek Clay Quarry.
21
Structural analysis
An anisotropic An anisotropic spherical spherical variogram with a variogram with a sill 5.3 Alsill 5.3 Al22OO33
(%)(%)22, a horizontal , a horizontal range 180 m and a range 180 m and a vertical range 40 vertical range 40 m was fitted to m was fitted to the datathe data
0
1
2
3
4
5
6
7
8
9
0 200 400 600 800
h (m)γ(
h) A
l2O
3 (%
)2
γ(h) X dir
γ(h) XY dir
γ(h) Y dir
γ(h) DTH
γ(h) model (hor)
γ(h) model (ver)
Case Study: the Sesklo Clay QuarryCase Study: the Sesklo Clay Quarry

Modis et al: Theoretical Determination of the Critical Sampling Density for a Greek Clay Quarry.
22
Critical Sampling Density
Using our proposedUsing our proposed formula formula of halving the of halving the variogram range to estimate the optimal variogram range to estimate the optimal sampling grid size: sampling grid size:
DDss = R/2 = R/2
we get a value of we get a value of 90 m.90 m. SinceSince average distance between drill holes is average distance between drill holes is
50 m, the orebody is 50 m, the orebody is over sampledover sampled..
Case Study: the Sesklo Clay QuarryCase Study: the Sesklo Clay Quarry

Modis et al: Theoretical Determination of the Critical Sampling Density for a Greek Clay Quarry.
23
Validate the Theory
In order to examine the validity In order to examine the validity of the theory, clay reserves of the theory, clay reserves were estimated using three were estimated using three different drill hole patterns:different drill hole patterns: The 50 x 50 m “dense grid”The 50 x 50 m “dense grid” The 100 x 100 m “medium The 100 x 100 m “medium
grid”grid” The 150 x 150 m “sparse The 150 x 150 m “sparse
grid”grid”
Case Study: the Sesklo Clay QuarryCase Study: the Sesklo Clay Quarry

Modis et al: Theoretical Determination of the Critical Sampling Density for a Greek Clay Quarry.
24
Reserves Estimation
Two methods were Two methods were used for the estimation used for the estimation of clay reserves: of clay reserves: ordinary krigingordinary kriging and and inverse distance inverse distance squares (squares (IDSIDS). In all ). In all estimations, the unit estimations, the unit block size was 20 x 50 block size was 20 x 50 x 5 m. x 5 m.
Case Study: the Sesklo Clay QuarryCase Study: the Sesklo Clay Quarry

Modis et al: Theoretical Determination of the Critical Sampling Density for a Greek Clay Quarry.
25
Visual
Example of plan Example of plan maps estimated maps estimated using using IDSIDS (left) (left) and and krigingkriging (right) at +135, (right) at +135, and a 50x50 m and a 50x50 m (a), 100x100 m (a), 100x100 m (b) and 150x150 (b) and 150x150 m (c) grid m (c) grid respectivelyrespectively
Case Study: the Sesklo Clay QuarryCase Study: the Sesklo Clay Quarry

Modis et al: Theoretical Determination of the Critical Sampling Density for a Greek Clay Quarry.
26
Histograms
Histogram of differences of estimates using Histogram of differences of estimates using dense dense vs. mediumvs. medium grids (left) and grids (left) and dense vs. sparsedense vs. sparse grids grids (right) for kriging models(right) for kriging models
0
0,5
-6 -3 0 3 6
Difference Al2O3 %
Pro
babi
lity
s=1.07
0
0,5
-6 -3 0 3 6
Difference Al2O3 %
Pro
babi
lity
s=0.66
Case Study: the Sesklo Clay QuarryCase Study: the Sesklo Clay Quarry

Modis et al: Theoretical Determination of the Critical Sampling Density for a Greek Clay Quarry.
27
Correlation
Correlation Correlation of of estimates using dense vs. medium estimates using dense vs. medium grids (left) and 5 dense vs. sparse grids (right) for grids (left) and 5 dense vs. sparse grids (right) for kriging modelskriging models
R2 = 0,5945
10,00
15,00
20,00
10,00 15,00 20,00
Al2O3 %
Al 2
O3 %
R2 = 0,8438
10,00
15,00
20,00
10,00 15,00 20,00
Al2O3 %
Al 2
O3 %
Case Study: the Sesklo Clay QuarryCase Study: the Sesklo Clay Quarry

Modis et al: Theoretical Determination of the Critical Sampling Density for a Greek Clay Quarry.
28
Conclusions

Modis et al: Theoretical Determination of the Critical Sampling Density for a Greek Clay Quarry.
29
Optimization
The selection of an appropriate drill-hole network The selection of an appropriate drill-hole network according to the according to the proposed formulaproposed formula, can , can maximize maximize informationinformation required for estimation ore reserves required for estimation ore reserves and also result in considerable and also result in considerable savings in money savings in money and timeand time..
ConclusionsConclusions
Modis et al: Theoretical Determination of the Critical Sampling Density for a Greek Clay Quarry.
30
Convergence of Algorithms
If the density of the sampling grid is If the density of the sampling grid is close to or close to or greater than its criticalgreater than its critical value, the resource model value, the resource model can be produced using simpler interpolation can be produced using simpler interpolation algorithms, such as the algorithms, such as the IDSIDS, and the accuracy , and the accuracy would be similar to that derived by would be similar to that derived by geostatisticsgeostatistics..
ConclusionsConclusions

Modis et al: Theoretical Determination of the Critical Sampling Density for a Greek Clay Quarry.
31
The Sesklo Case
In this study, a variogram model generated by the In this study, a variogram model generated by the structural analysis of Alstructural analysis of Al22OO33 spatial distribution spatial distribution
was used to establish a was used to establish a critical sampling grid.critical sampling grid. From above analysis, it was shown that existing From above analysis, it was shown that existing
sampling grid was sampling grid was denser than requireddenser than required. . The optimal sampling grid proposed here, will The optimal sampling grid proposed here, will
result to significant cost savings in the result to significant cost savings in the next next drilling programdrilling program which is now in plan by the which is now in plan by the company.company.
ConclusionsConclusions

Modis et al: Theoretical Determination of the Critical Sampling Density for a Greek Clay Quarry.
32
Thank you!