Embed Size (px)
Citation preview
1
CS448B :: 25 Sep 2012
The Value of Visualization
Jeffrey Heer Stanford University
How much data (bytes) did we produce in 2010?
2010: 1,200 exabytes
Gantz et al, 2008, 2010
10x increase over 5 years
Physical Sensors Image courtesy cabspotting.org
2
Health & Medicine Records of Human Activity
Wikipedia History Flow (IBM)
3
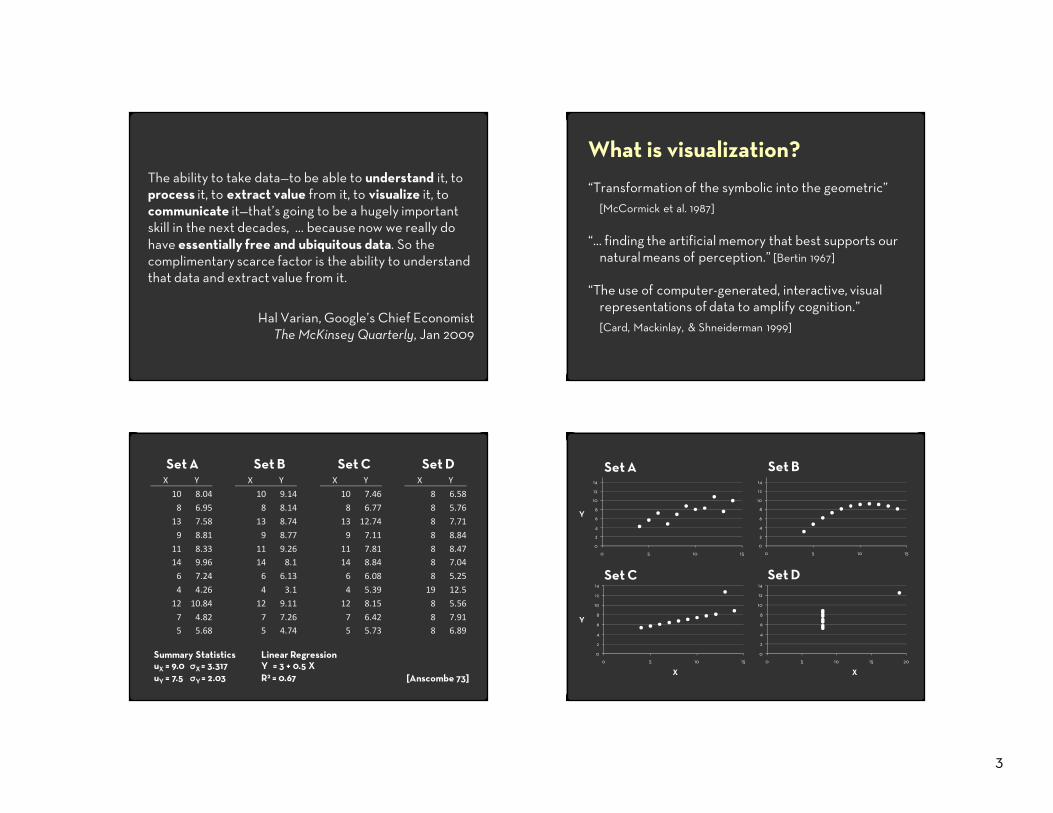
The ability to take data—to be able to understand it, to process it, to extract value from it, to visualize it, to communicate it—that’s going to be a hugely important skill in the next decades, … because now we really do have essentially free and ubiquitous data. So the complimentary scarce factor is the ability to understand that data and extract value from it.
Hal Varian, Google’s Chief EconomistThe McKinsey Quarterly, Jan 2009
What is visualization?
“Transformation of the symbolic into the geometric”[McCormick et al. 1987]
“... finding the artificial memory that best supports our natural means of perception.” [Bertin 1967]
“The use of computer-generated, interactive, visual representations of data to amplify cognition.”[Card, Mackinlay, & Shneiderman 1999]
Set A Set B Set C Set DX Y X Y X Y X Y
10 8.04 10 9.14 10 7.46 8 6.58
8 6.95 8 8.14 8 6.77 8 5.76
13 7.58 13 8.74 13 12.74 8 7.71
9 8.81 9 8.77 9 7.11 8 8.84
11 8.33 11 9.26 11 7.81 8 8.4714 9.96 14 8.1 14 8.84 8 7.04
6 7.24 6 6.13 6 6.08 8 5.25
4 4.26 4 3.1 4 5.39 19 12.5
12 10.84 12 9.11 12 8.15 8 5.56
7 4.82 7 7.26 7 6.42 8 7.915 5.68 5 4.74 5 5.73 8 6.89
[Anscombe 73]
Summary Statistics Linear RegressionuX = 9.0 σX = 3.317 Y2 = 3 + 0.5 XuY = 7.5 σY = 2.03 R2 = 0.67
0
2
4
6
8
10
12
14
0 5 10 15
0
2
4
6
8
10
12
14
0 5 10 15
0
2
4
6
8
10
12
14
0 5 10 15
0
2
4
6
8
10
12
14
0 5 10 15 20
Set A
Set C Set D
Set B
X X
Y
Y
4
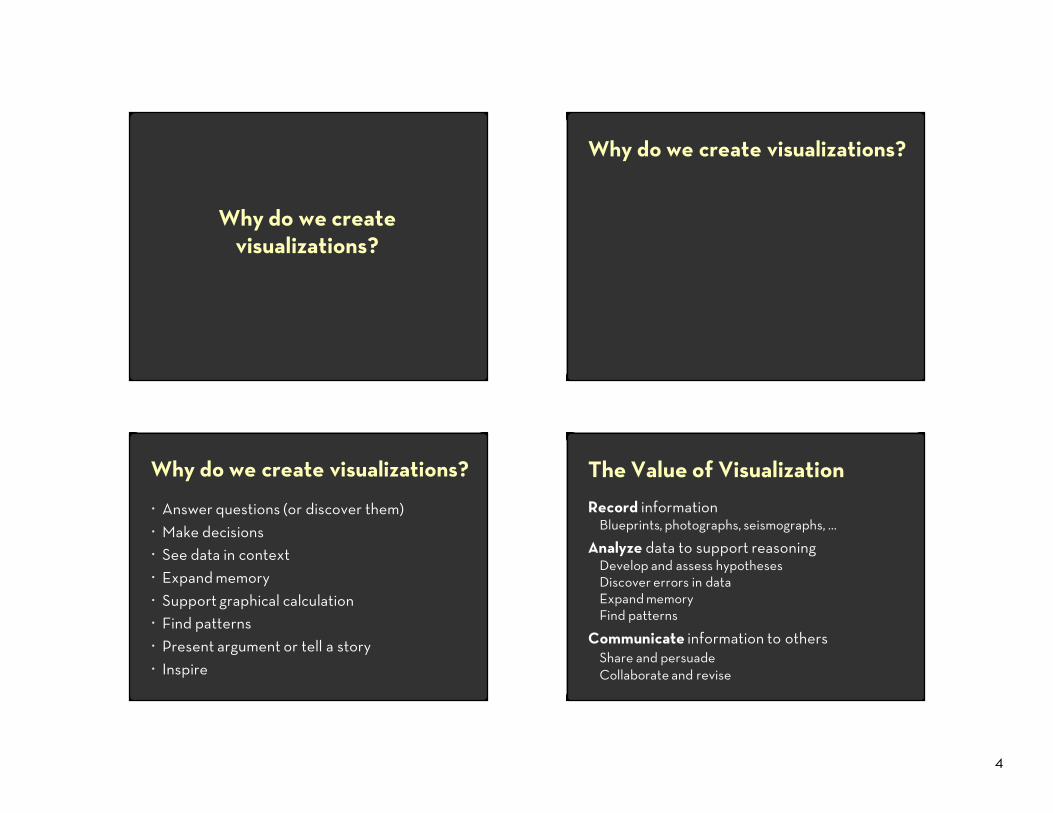
Why do we create visualizations?
Why do we create visualizations?
Why do we create visualizations?
Answer questions (or discover them)Make decisionsSee data in contextExpand memorySupport graphical calculationFind patternsPresent argument or tell a storyInspire
The Value of Visualization
Record informationBlueprints, photographs, seismographs, …
Analyze data to support reasoningDevelop and assess hypothesesDiscover errors in dataExpand memoryFind patterns
Communicate information to othersShare and persuadeCollaborate and revise
5
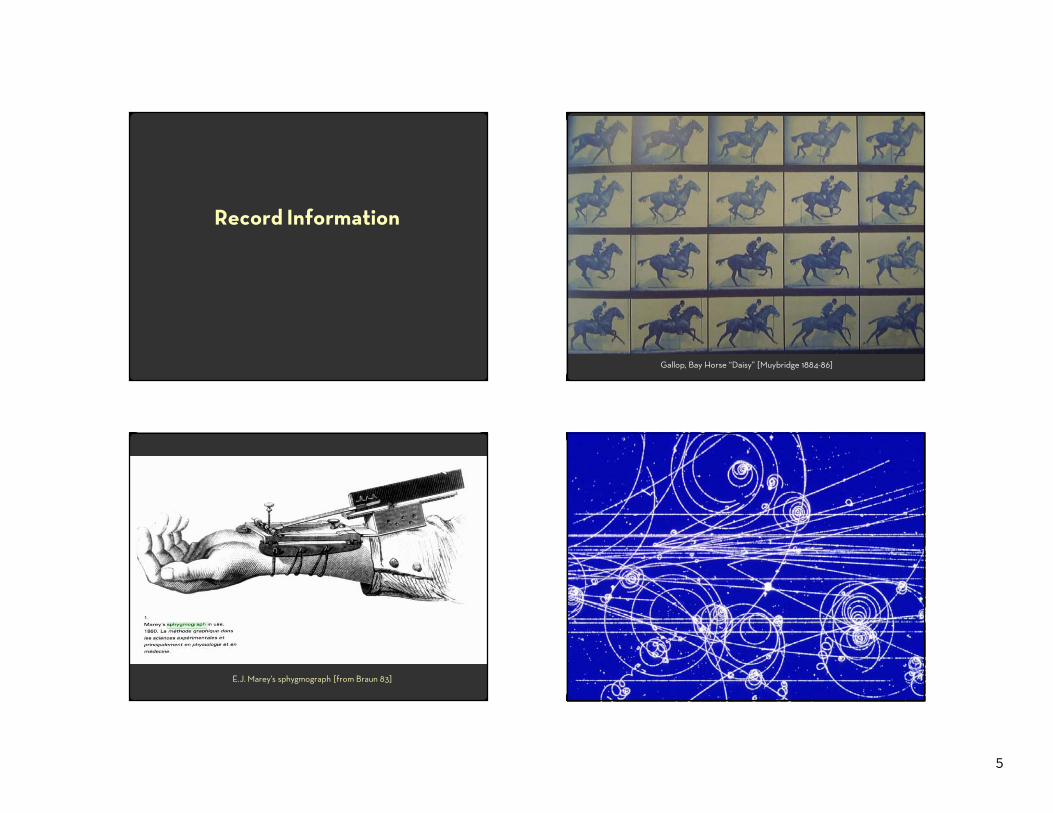
Record Information
Answer question
Gallop, Bay Horse “Daisy” [Muybridge 1884-86]
Other recording instruments
E.J. Marey’s sphygmograph [from Braun 83]
6
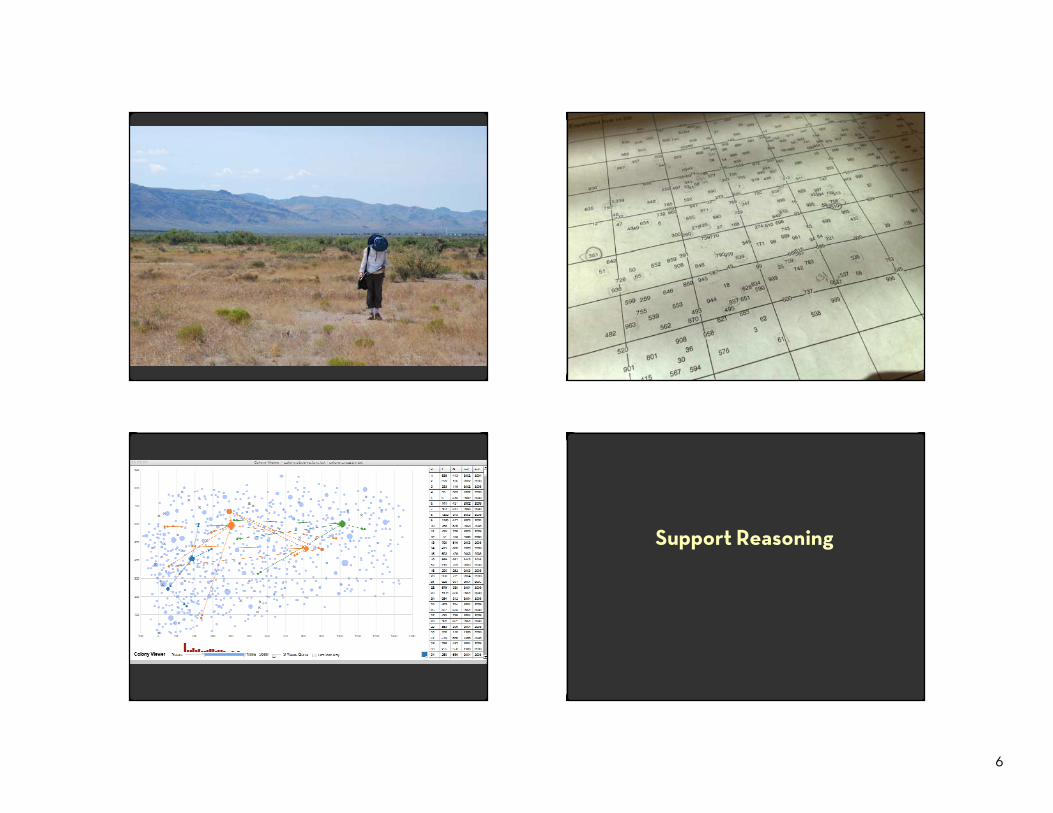
Map Example
Support Reasoning
7
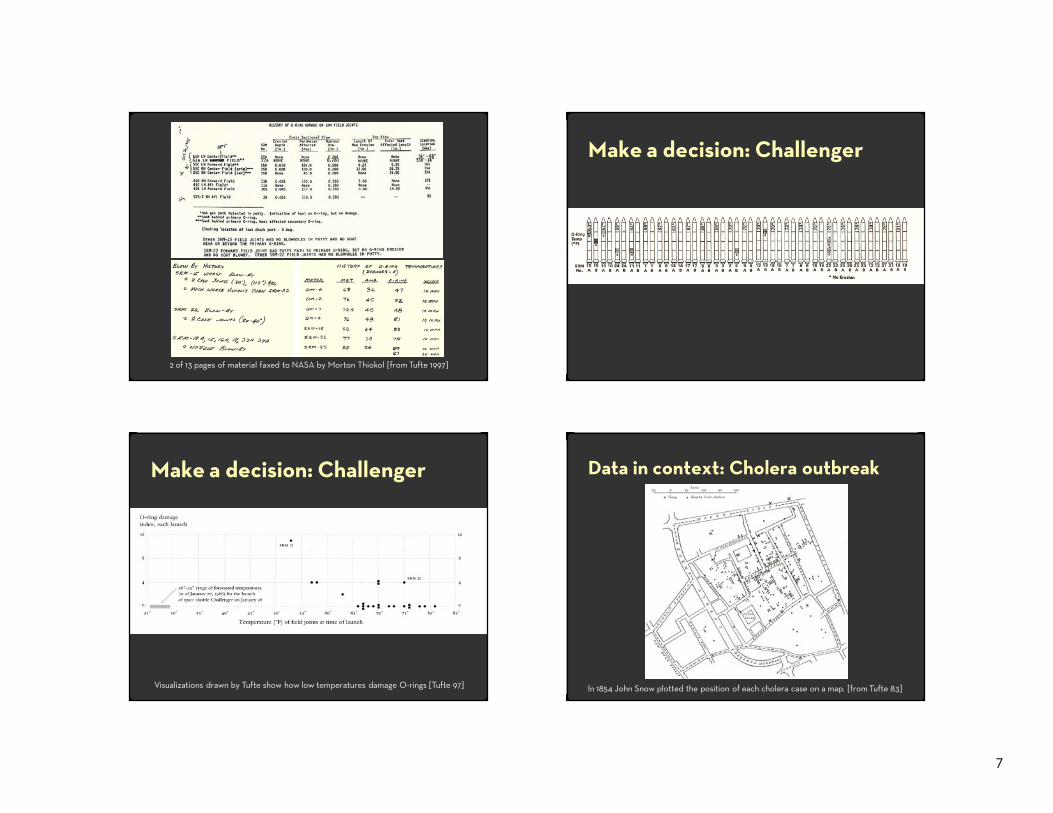
2 of 13 pages of material faxed to NASA by Morton Thiokol [from Tufte 1997]
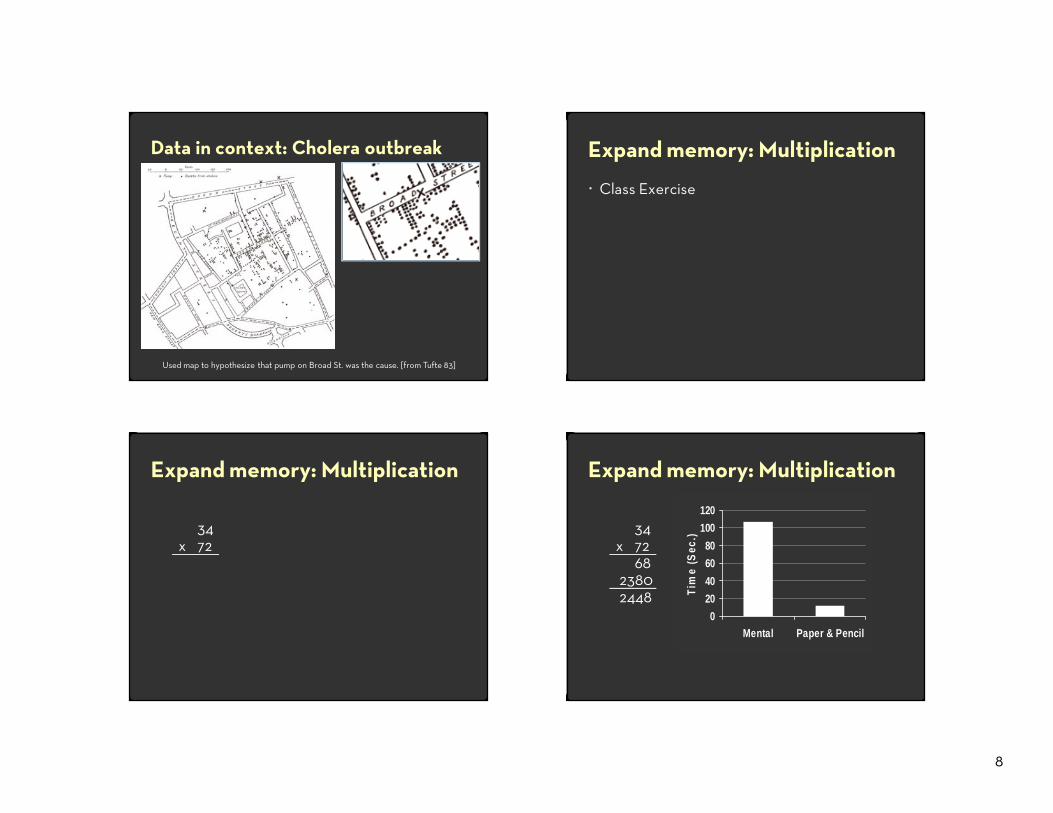
Make a decision: Challenger
Make a decision: Challenger
Visualizations drawn by Tufte show how low temperatures damage O-rings [Tufte 97]
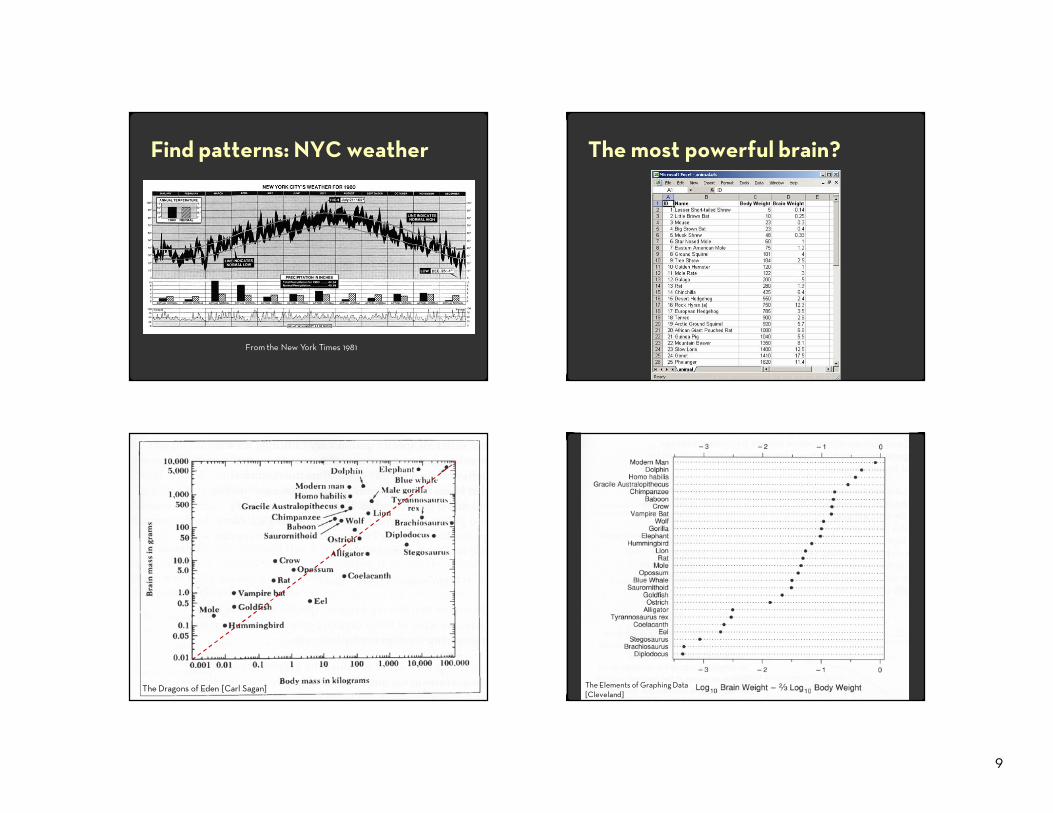
Data in context: Cholera outbreak
In 1854 John Snow plotted the position of each cholera case on a map. [from Tufte 83]
8
Data in context: Cholera outbreak
Used map to hypothesize that pump on Broad St. was the cause. [from Tufte 83]
Expand memory: Multiplication
Class Exercise
Expand memory: Multiplication
34x 72
0
20
40
60
80
100
120
Mental Paper & Pencil
Tim
e (S
ec.)
Expand memory: Multiplication
34x 72
6823802448
9
Find patterns: NYC weather
From the New York Times 1981
The most powerful brain?
Tell a story: Most powerful brain?
The Dragons of Eden [Carl Sagan]
Tell a story: Most powerful brain?
The Elements of Graphing Data[Cleveland]
10
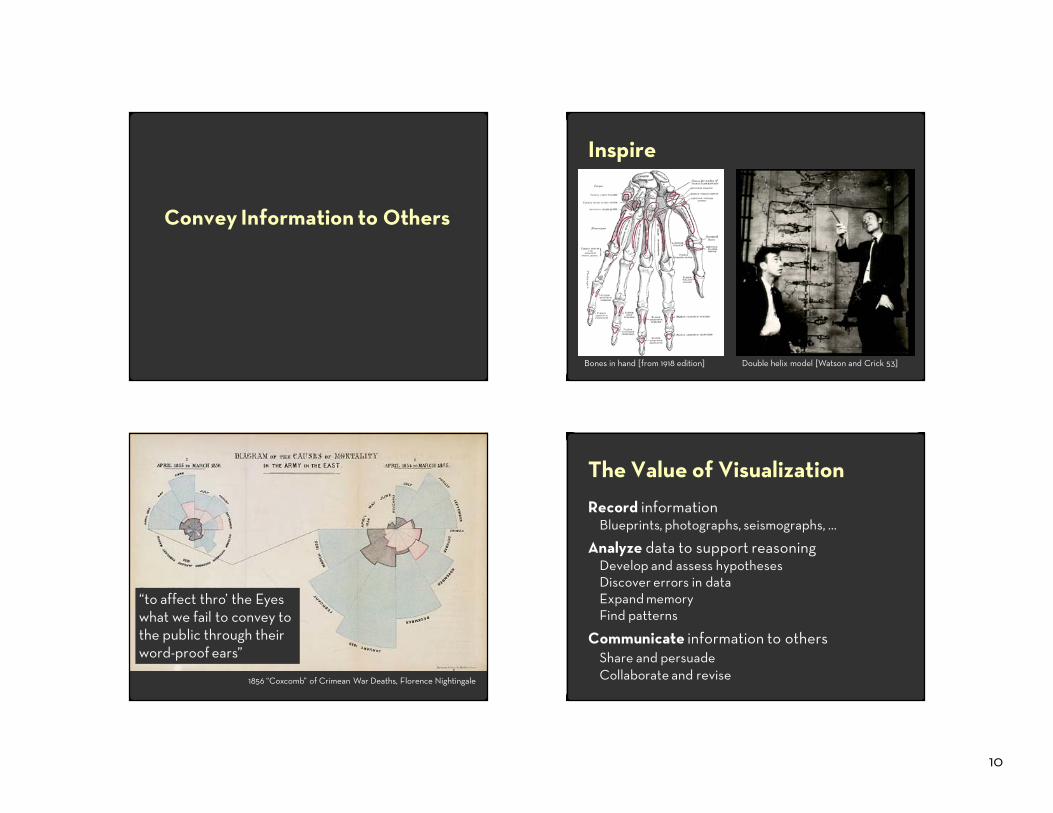
Convey Information to Others
Inspire
Bones in hand [from 1918 edition] Double helix model [Watson and Crick 53]
1856 “Coxcomb” of Crimean War Deaths, Florence Nightingale
“to affect thro’ the Eyes what we fail to convey to the public through their word-proof ears”
The Value of Visualization
Record informationBlueprints, photographs, seismographs, …
Analyze data to support reasoningDevelop and assess hypothesesDiscover errors in dataExpand memoryFind patterns
Communicate information to othersShare and persuadeCollaborate and revise
11
Visualization Research
ChallengeMore and more unseen data
Faster creation and collection
Challenge
Urban development planningwww.urbansim.org
Fluid flowctr.stanford.edu
Simulation
More and more unseen dataFaster creation and collection
Challenge
Sloan digital sky surveywww.sdss.org
Sensing
Sensor networks [Hill 02]www.xbow.com
Digital photography
More and more unseen dataFaster creation and collection
12
ChallengeMore and more unseen data
Faster creation and collectionFaster dissemination
Photo sharing/annotationflickr.com
Map of the Internet [Cheswick 99]research.lumeta.com
Group Authoringwikipedia.org
Internet
Challenge
More and more unseen dataFaster creation and collectionFaster dissemination
5 exabytes of new information in 2002 [Lyman 03]
161 exabytes in 2006 [Gantz 07]
1,200 exabytes in 2010 [Gantz 10]
Necessitates better tools and algorithms forvisually conveying information
Attention“What information consumes is rather obvious: it consumes the attention of its recipients. Hence a wealth of information creates a poverty of attention, and a need to allocate that attention efficiently among the overabundance of information sources that might consume it.”
Herb Simonas quoted by Hal Varian
Scientific AmericanSeptember 1995
Goals of visualization research
1 Understand how visualizations convey information What do people perceive/comprehend?How do visualizations correspond with mental models?
2 Develop principles and techniques for creating effective visualizations and supporting analysisAmplify perception and cognitionStrengthen tie between visualization and mental models
13
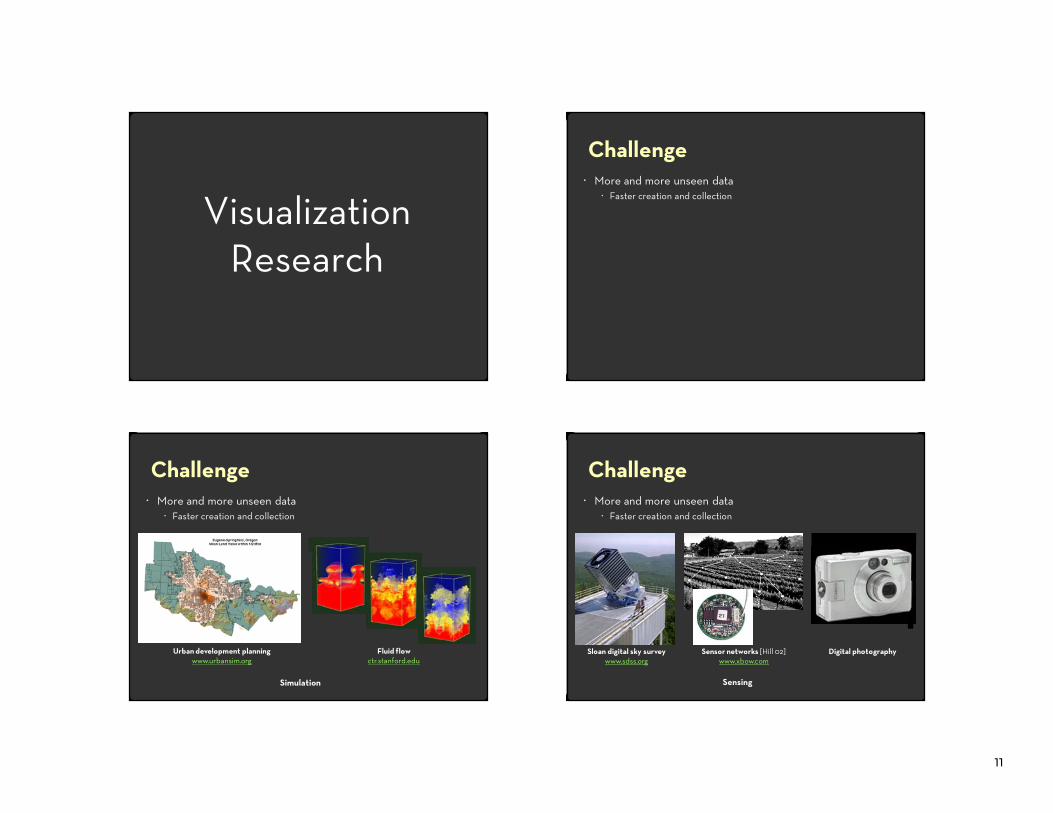
Course Topics
Data and Image Models
Sémiologie Graphique [Bertin 67]
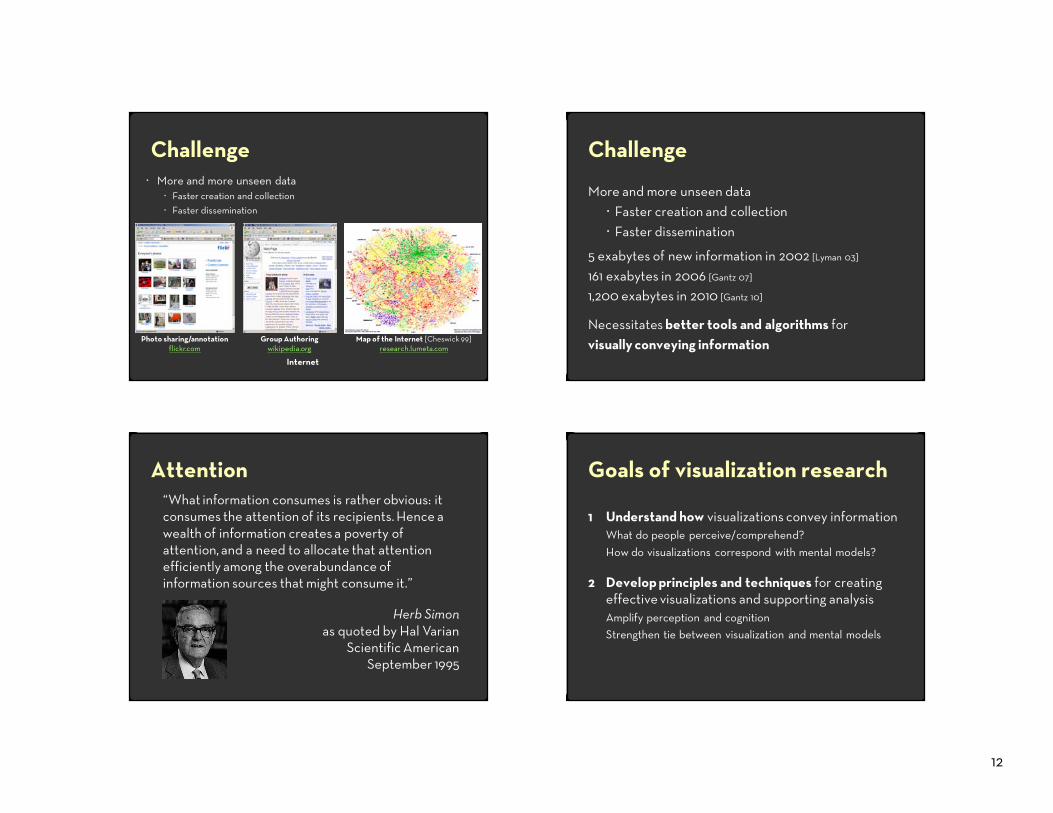
Visualization (Re-)Design
Problematic design Redesign
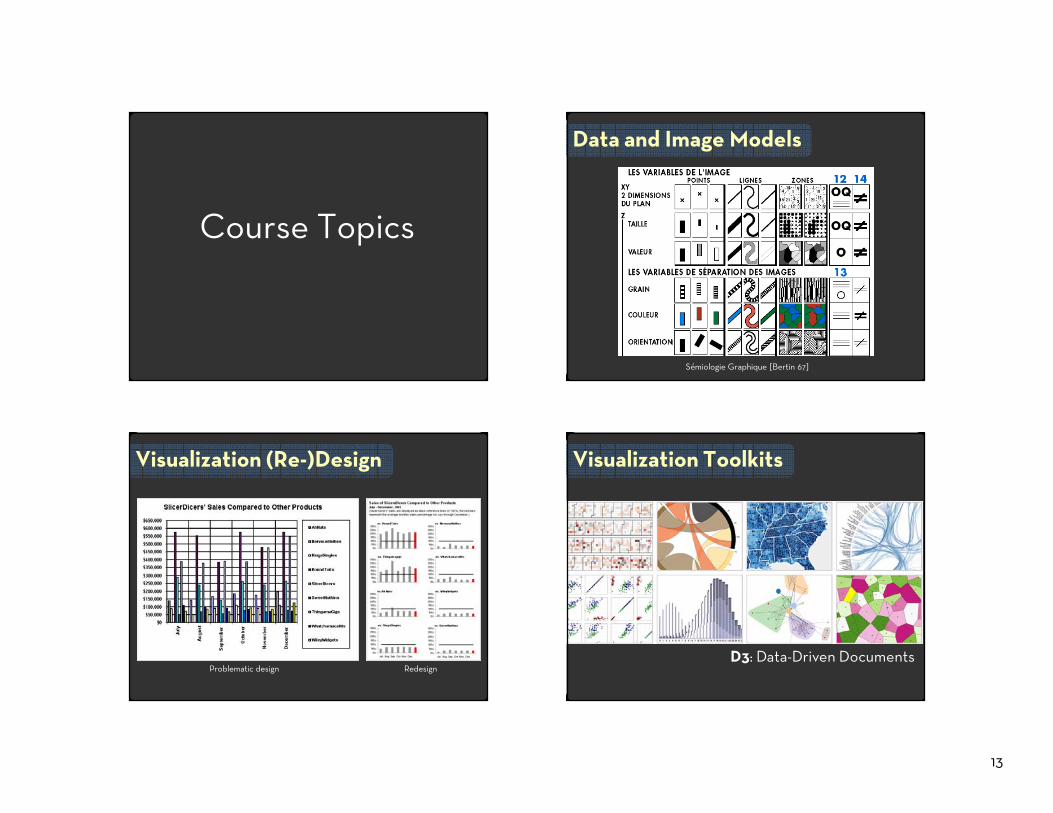
Visualization Toolkits
D3: Data-Driven Documents
14
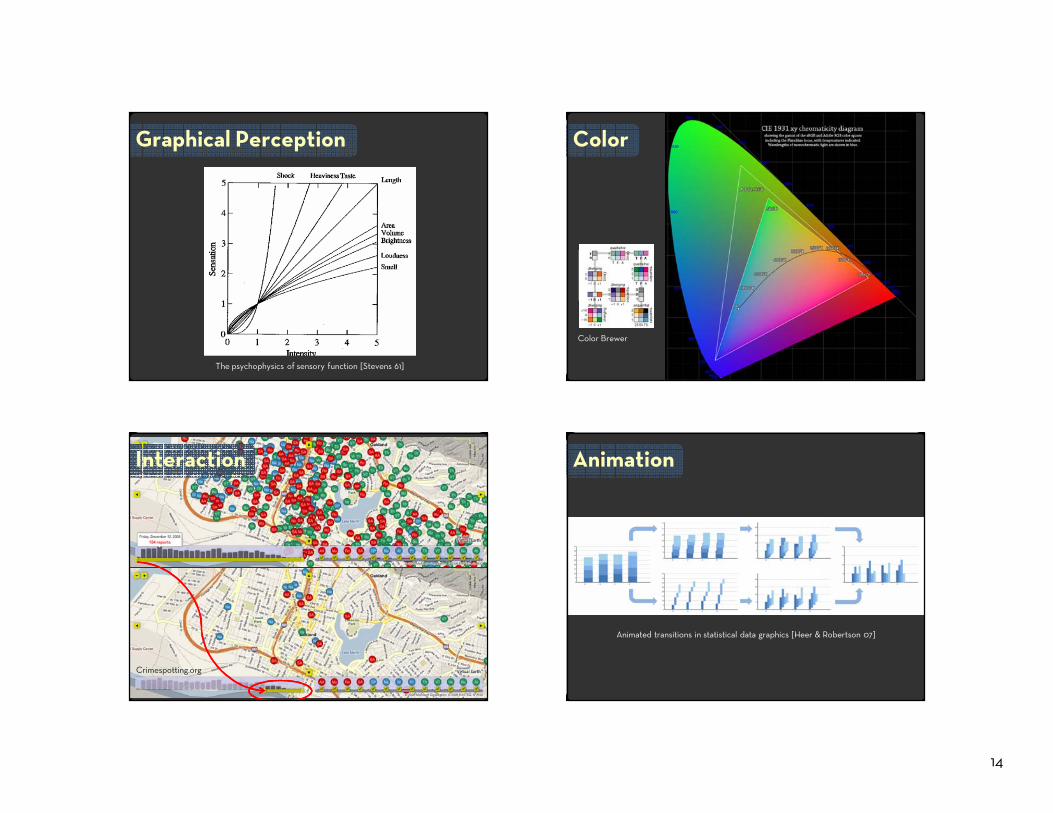
Graphical Perception
The psychophysics of sensory function [Stevens 61]
Color
Color Brewer
Interaction
Crimespotting.org
Animation
Animated transitions in statistical data graphics [Heer & Robertson 07]
15
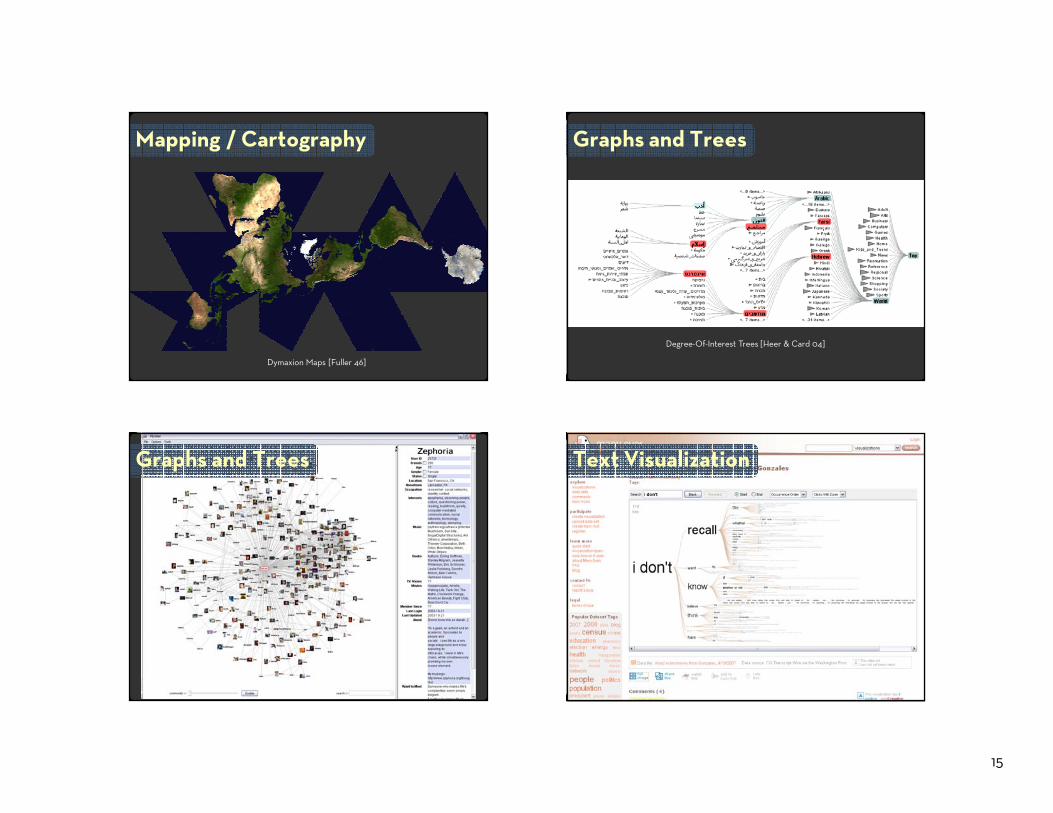
Mapping / Cartography
Dymaxion Maps [Fuller 46]
Graphs and Trees
Degree-Of-Interest Trees [Heer & Card 04]
vizsterGraphs and Trees Alberto GonzalesText Visualization
16
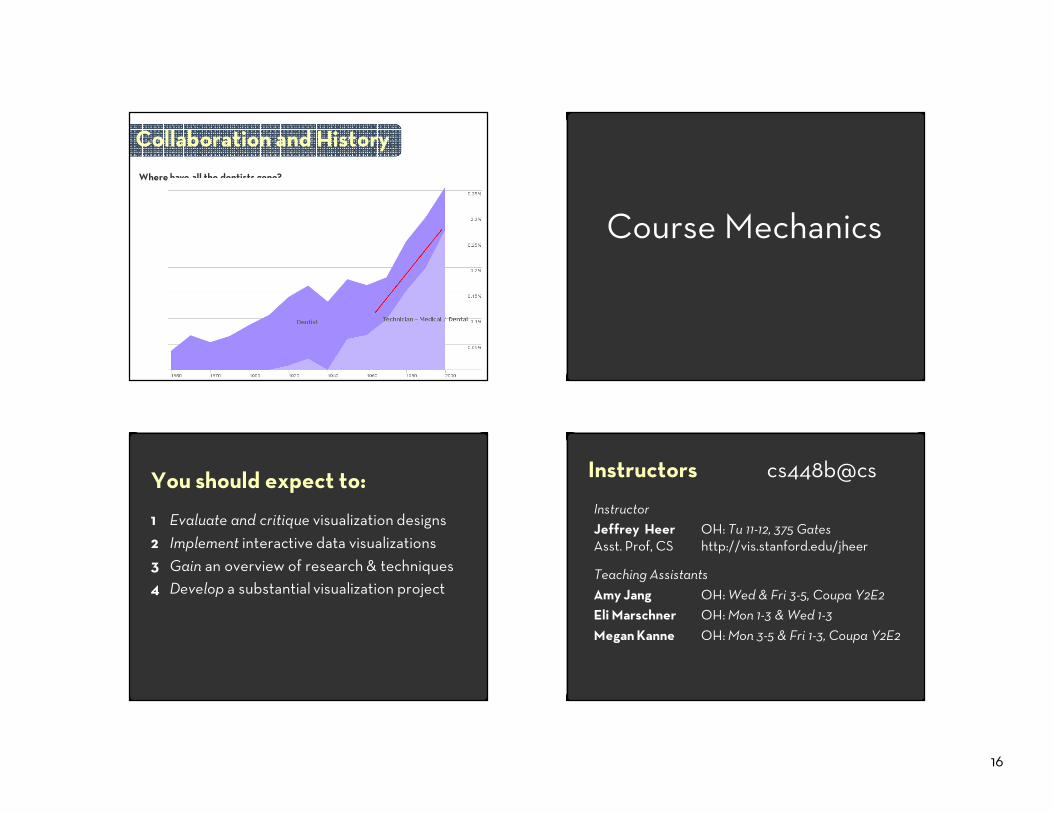
Where have all the dentists gone?
Collaboration and History
Course Mechanics
You should expect to:
1 Evaluate and critique visualization designs2 Implement interactive data visualizations3 Gain an overview of research & techniques4 Develop a substantial visualization project
Instructors cs448b@cs
InstructorJeffrey Heer OH: Tu 11-12, 375 GatesAsst. Prof, CS http://vis.stanford.edu/jheer
Teaching AssistantsAmy Jang OH: Wed & Fri 3-5, Coupa Y2E2Eli Marschner OH: Mon 1-3 & Wed 1-3Megan Kanne OH: Mon 3-5 & Fri 1-3, Coupa Y2E2
17
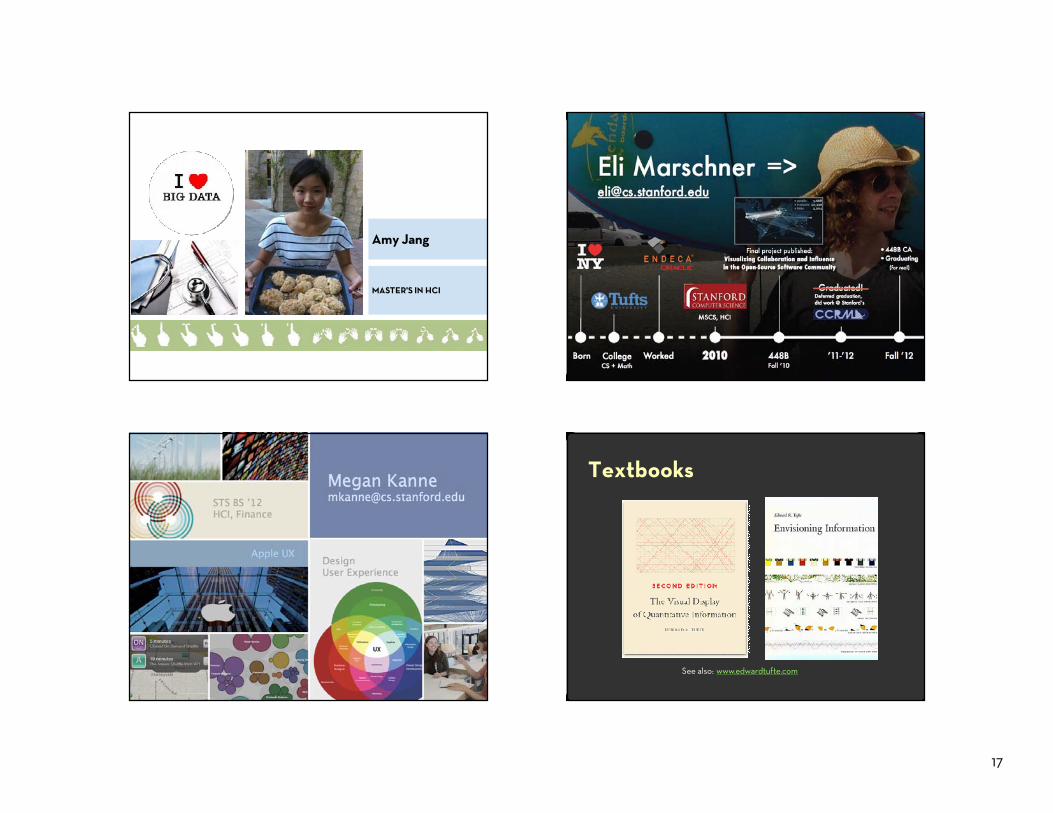
MASTER'S IN HCI
Amy Jang
Textbooks
See also: www.edwardtufte.com
18
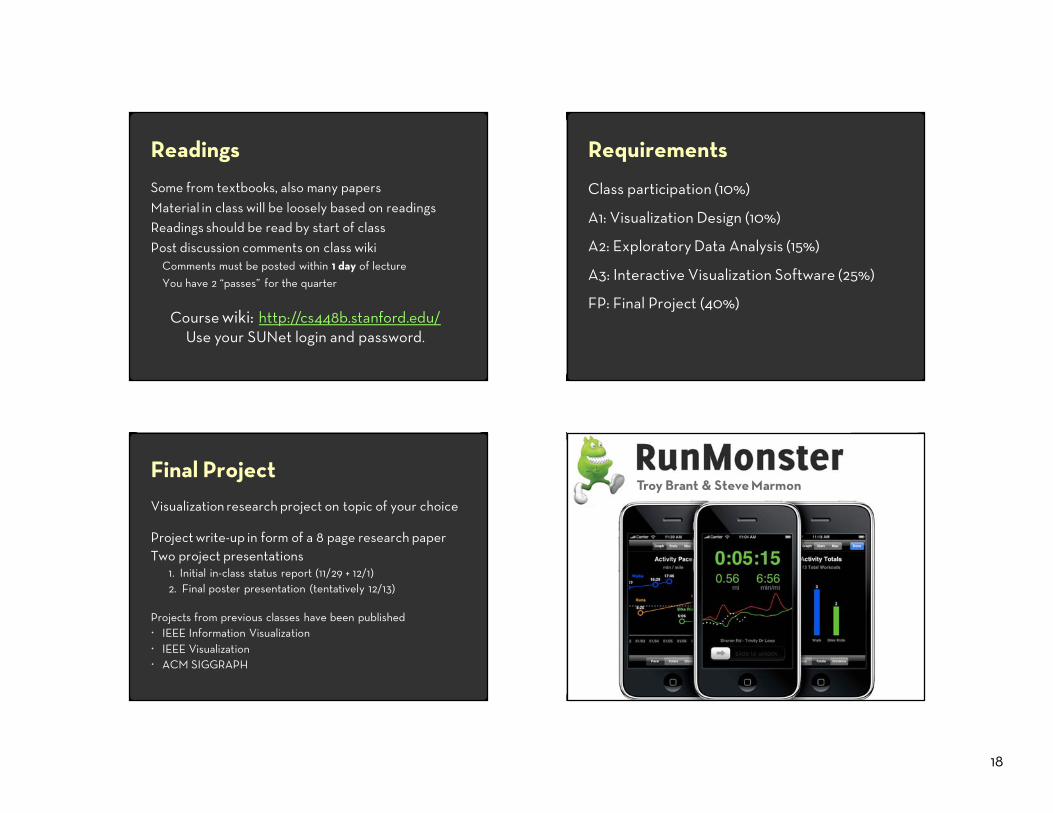
Readings
Some from textbooks, also many papersMaterial in class will be loosely based on readingsReadings should be read by start of classPost discussion comments on class wiki
Comments must be posted within 1 day of lectureYou have 2 “passes” for the quarter
Course wiki: http://cs448b.stanford.edu/Use your SUNet login and password.
Requirements
Class participation (10%)
A1: Visualization Design (10%)
A2: Exploratory Data Analysis (15%)
A3: Interactive Visualization Software (25%)
FP: Final Project (40%)
Final ProjectVisualization research project on topic of your choice
Project write-up in form of a 8 page research paperTwo project presentations
1. Initial in-class status report (11/29 + 12/1)2. Final poster presentation (tentatively 12/13)
Projects from previous classes have been published IEEE Information VisualizationIEEE VisualizationACM SIGGRAPH
Troy Brant & Steve Marmon
19
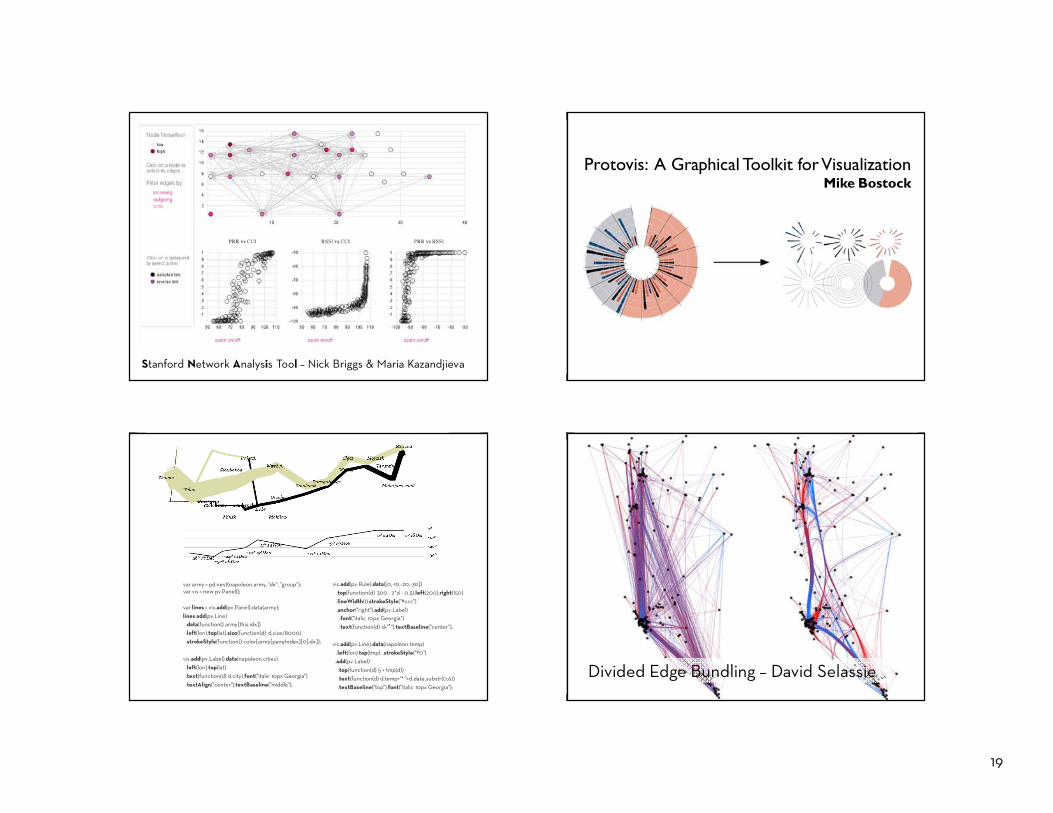
Stanford Network Analysis Tool – Nick Briggs & Maria Kazandjieva
Protovis: A Graphical Toolkit for VisualizationMike Bostock
vis.add(pv.Rule).data([0,-10,-20,-30]).top(function(d) 300 - 2*d - 0.5).left(200).right(150).lineWidth(1).strokeStyle("#ccc").anchor("right").add(pv.Label).font("italic 10px Georgia").text(function(d) d+"°").textBaseline("center");
vis.add(pv.Line).data(napoleon.temp).left(lon).top(tmp) .strokeStyle("#0").add(pv.Label).top(function(d) 5 + tmp(d)).text(function(d) d.temp+"° "+d.date.substr(0,6)).textBaseline("top").font("italic 10px Georgia");
var army = pd.nest(napoleon.army, "dir", "group“);var vis = new pv.Panel();
var lines = vis.add(pv.Panel).data(army);lines.add(pv.Line).data(function() army[this.idx]).left(lon).top(lat).size(function(d) d.size/8000).strokeStyle(function() color[army[paneIndex][0].dir]);
vis.add(pv.Label).data(napoleon.cities).left(lon).top(lat).text(function(d) d.city).font("italic 10px Georgia").textAlign("center").textBaseline("middle");
Divided Edge Bundling – David Selassie
20
Questions?
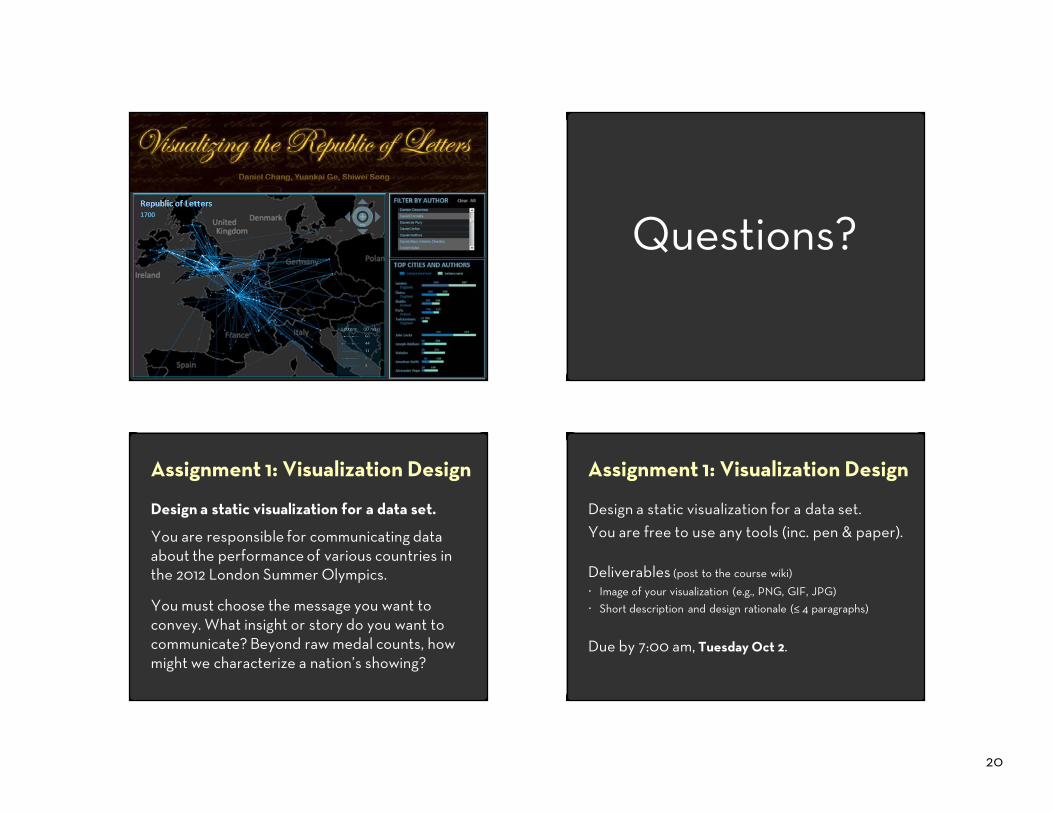
Assignment 1: Visualization Design
Design a static visualization for a data set.
You are responsible for communicating data about the performance of various countries in the 2012 London Summer Olympics.
You must choose the message you want to convey. What insight or story do you want to communicate? Beyond raw medal counts, how might we characterize a nation’s showing?
Assignment 1: Visualization Design
Design a static visualization for a data set.You are free to use any tools (inc. pen & paper).
Deliverables (post to the course wiki)
Image of your visualization (e.g., PNG, GIF, JPG)Short description and design rationale (≤ 4 paragraphs)
Due by 7:00 am, Tuesday Oct 2.