Embed Size (px)
Citation preview
How Much Do Composers Get Paid? A Report on U.S. Composer Commission Pay in 2017-2018
By David E. Farrell, DM and Loretta K. Notareschi, PhD January 2021 - Denver, CO
Abstract Responding to a dearth of published information on composer commission pay in the United States, composers David Farrell and Loretta Notareschi prepared and conducted the Composer Commission Pay Survey for U.S. composers in Fall 2019. The survey presented a range of questions about commission pay for 2017-2018, as well as composer demographics, covering topics such as fee, genre, instrumentation, duration, composer motivation, career stage, gender, race, geographical location, and more. Over 200 composers responded to the survey, providing data on 871 commissions. This report provides a literature review of existing published information on composer pay, a description of the methods employed in the survey, and an outline of the scope and limitations of the study. It also presents an analysis of the data collected in the survey, including median pay for commissions of different types and the demographic characteristics of the highest and lowest paid composers. Information on unpaid commissions is also included. While the results of this survey provide useful information for composers, commissioners, and researchers on the compensation of U.S. composers, future areas of research are suggested, including further analysis of the data collected in this survey; a survey of commissioners; and case studies of particular composers and commissioners regarding their participation in the economy of new music.
How Much Do Composers Get Paid?
A Report on U.S. Composer Commission Pay in 2017-2018 By David E. Farrell, DM and Loretta K. Notareschi, PhD January 2021 - Denver, CO How much should composers get paid for commissions? This is a question most composers have. As composers ourselves, we recently set out to find the answer. We were motivated not only by our curiosity, but also by our desire to know what is fair and equitable. Informal discussions about commission fees with fellow composers had not broadened our understanding. These conversations were frequently beset with embarrassment, defensiveness, and long-winded explanations of why the composers accepted fees that did not match their expectations. This kind of dialogue was, however, preferable to another common response: silence and unwillingness to mention numbers. Different as they may be, both reactions gave the same impression: composers were unsure what a fair commission fee would be. They did not know how much to ask for. Interacting with commissioners of new music is often difficult because of this ignorance. As a young composer, one of us was asked, “What do you charge?” When a range of numbers, believed to be modest, was suggested, the commissioner summarily dismissed them. “We’re a nonprofit,” he explained. “We can’t afford those fees.” The commission was accepted at a fraction of the suggested fee. At another point in one of our careers, a much larger commission amount, also from a nonprofit, was proffered. Indeed, throughout our careers, our commissions have been marked by one common factor: unpredictability in amount. Why does this variance exist? What factors contribute to a well-compensated commission? Does the nature of the work--its duration, its instrumentation, its style--matter most? What about the composers themselves? Does a higher degree of education lead to larger fees? Do those on the U.S. coasts receive more than those in the central U.S.? Do gender or age or race affect these unpredictable fees? The reality is that many questions surround composer pay. Some people wonder why they are not being paid more. Some people are surprised by the amounts they have been paid. Some people worry they should have gotten more, but were not bold enough to ask for it. Some composers get asked to name their number. Others are told, “this is the budget.” Some of us are making a living from our commissions. Some of us have other jobs that help pay the bills. Many
of us are jealous of people who do something different than we do and who, we suspect, are getting paid more. The questions, to put it bluntly, are fraught. Labor statistics provide little help. A simple Google search will tell you the average pay of, say, administrative assistants in your area. Yet, in our profession, we are not able to point to studies that show how much composers get paid to write music, much less how much they receive for wind band music versus choral music, for example. What information on composer pay is available? When one begins to research the question, “How much money do composers make on commissions?” one source that emerges immediately is the interactive “Commissioning Fees Calculator” in the publication NewMusicBox, published by New Music USA. This calculator is based on the document Commissioning Music: A Basic 1
Guide, written by the organization Meet the Composer, one of the predecessor organizations to New Music USA. The Guide is well-known and easily-located, and its benefits are many. It is 2
practical, with a “terse, to-the-point style...giving composers and commissioners a shared baseline at which to begin their negotiation.” It includes details of what to include in a 3
composer-commissioner contract, such as performance rights, recording rights, liability, etc. 4
The Guide also includes the information that we are hungry for--actual numbers. The “Fees and Practices by Genre” section of the document--the part that became the Calculator--includes ranges of suggested commission fees based on instrumentation and duration. The ranges can be wide--from $2,000 to $4,500 for a solo work under 10 minutes, or between $13,000 and $60,000 for a 15-minute work for full orchestra. The range of fees is explained in the document by the fact that some composers are “emerging” and just starting out, while some are “highly marketable.” 5
The document promotes good treatment of composers. It states that certain costs--copying parts or recording--should not be borne by the composer. It argues that “composing is a profession deserving adequate compensation,” and that “Income from repeated performance of concert works is speculative. Most composers depend primarily on commissions,” dispelling beliefs that financial benefits may come down the line. The suggested fee ranges seem fair; the low end 6
would be reasonable compensation for less-experienced composers, and the higher end would
1 New Music USA, “Commissioning Fees Calculator,” NewMusicBox, April 12, 2016, https://nmbx.newmusicusa.org/commissioning-fees-calculator/ 2 Meet the Composer, Commissioning Music: A Basic Guide, (New York: Meet the Composer, 2009). 3 New Music USA, “Commissioning Fees Calculator.” 4 Meet the Composer, Commissioning Music: A Basic Guide, 2-3. 5 Ibid., 4. 6 Ibid.
acknowledge the skill and fame of a well-known professional. At the same time, we both know of commissions that are paid far below the suggested ranges. If one considers the purpose of Commissioning Music: A Basic Guide--to help composers make good commission agreements--it is successful. However, after taking in the numbers in the Guide and then considering our own experiences and those of colleagues, we began to realize that we are not only asking “what should composers get paid?” but also “what do composers get paid?” What is the reality on the ground? The fees in the document are “based on Meet the Composer’s research,” but the nature of that research is unclear. What kind of research? A 7
survey of composers? A survey of commissioners? In what geographic location(s)? Big cities? Small towns? Both? What types of commissioners? Large professional orchestras? Small community choruses? Chamber ensembles? Wind ensembles? And when was the research last conducted? It is possible that answers to these questions exist, but they are not spelled out in the article that accompanies the calculator, nor are they to be found in the downloadable guide. As such, the document does not provide what we are looking for. What about other American professional organizations beyond New Music USA? The American Composers Forum is another advocacy organization that publishes guides for its members and the public, for example, “Commissioning by Individuals,” available through the Resources tab on its website. It lists the following as the range for commissioning fees: “Commissions can run 8
from several hundred dollars to many thousands” and also notes the factors that influence the fee amount (size of ensemble, composer’s reputation, etc.), and the fact that composers often charge a fee both for composition and for preparing the final score and parts. Here, again, a huge range 9
is listed, but no citation of statistics to indicate where these numbers were derived from. Another source of economic information on musicians in the United States is the federal government, which conducts an alphabet soup of surveys on pay: the Occupational Employment Statistics (OES) survey by the Bureau of Labor Statistics (BLS); the Current Employment Statistics (CES), also known as the payroll survey; and the Quarterly Census of Employment and Wages (QCEW). From their data, the BLS publishes the Occupational Outlook Handbook, which says that in 2019 there were 58,000 Music Directors and Composer jobs in the United States and the annual median wage was $51,670. These data lack the commission-level 10
7 Ibid. 8 “Commissioning by Individuals,” American Composers Forum, https://composersforum.org/resources/commissioning-by-individuals/. 9 Ibid. 10 U.S. Bureau of Labor Statistics, “Music Directors and Composers,” Occupational Outlook Handbook, Office of Occupational Statistics and Employment Projections, September 1, 2020, https://www.bls.gov/ooh/entertainment-and-sports/music-directors-and-composers.htm#tab-1.
specificity that we desire, but that is not their only problem. The category of “Music Directors and Composers” is described as those who “lead musical groups during performances and recording sessions” and “write and arrange original music in a variety of musical styles.” Such 11
a broad collection of musical activities leaves these data unusable for anyone hoping to get more information about the outlook for composers alone. The other surveys published by the government suffer from the same problem of vagueness. Data on composer income specifically are available in Joan Jeffri’s Taking Note: A Study of Composers and New Music Activity in the U.S. This 2008 investigation was sponsored by the American Music Center and the American Composers Forum. It is rigorous and contains a plethora of useful data from a survey which reached over 1,000 composers. It also includes eleven in-depth “spotlights” on various individuals and organizations and their place in the new music economy. 12
Jeffri’s financial data focuses on total composer income. The median income from all sources for professional and non-professional composers together for the years covered by the study (2005-2007) was $45,000; composers self-reported whether they were professional or non-professional. Income from composition as a percentage of total income was 19% for the professional composers and 4% for the non-professionals. As a percentage of income from composition, commissions constituted 32% for professionals and non-professionals alike. Other questions--about the sources of composer income, about challenges that composers face, about marketing--also help paint a picture of the concerns of the American composer. 13
Taking Note is an informative document, rich with data. But these data do not help to answer the question at hand: how much do composers get paid from commissions? The numbers are not granular enough; while Jeffri provides amounts of yearly income from commissions, we do not know how many works generated that income, nor their genres, instrumentation, or duration. One of the most targeted efforts to answer similar questions to ours was taken up in collaboration between Sound and Music (“the national charity for new music in the UK”) and the Australian Music Centre. Their Composer Commissioning Survey Report from 2015 details their work. Their survey gathered commissioning data from over 470 composers in the U.K., Australia, Europe, and elsewhere. These data include the average pay per commission in British pounds, which was £918 or approximately $1,256. Additionally, ranges of fees for different types of
11 Ibid. 12 Joan Jeffri, Taking Note: A Study of Composers and New Music Activity in the U.S., (Ann Arbor, MI: Inter-university Consortium for Political and Social Research [distributor], 2016), https://doi.org/10.3886/ICPSR36325.v1. 13 Ibid., 23-24.
work are presented. Alongside these quantitative data, questions regarding composer attitudes and economic trends are included. 14
These data are close to the kinds of information we are looking for, but the question remains how much U.S. composers in particular make. Also lacking in these data are a per-minute rate for music written and demographic information about the composers, other than what countries they were located in. What about race or ethnicity? Gender? Do such factors correlate with how much a composer is paid for a commission? Also, the report focuses on the size of the ensembles over other factors, and thus leaves unanswered some of our questions about which elements influence commission fees. There is also a note in the report that “a statistically significant number of respondents entered a zero figure across the questions regarding earnings.” What to make of 15
these unpaid composers? We are left to wonder. In 2019, after pondering the major available sources of information on composer pay in the United States and thinking about our unanswered questions, we decided to conduct a survey of U.S. composers to ask them how much they had been paid for concert music commissions in 2017 and 2018. Including questions about fee, instrumentation, genre, duration, and a variety of 16
demographic characteristics, the Composer Commission Pay Survey was conducted in fall 2019. Below, we lay out the methodology, scope, limitations, and results of this survey. Methodology, Scope, and Limitations One of our first tasks was to decide what questions to ask in the survey. To guide this process, we began with our broadest research questions: How much do composers get paid for commissions? What are the musical characteristics--including instrumentation, genre, and duration--of highly-paid commissions, lower-paid commissions, and unpaid commissions? What are the demographic characteristics, such as career stage, gender, race/ethnicity, and religion of highly-paid, modestly-paid, and unpaid composers? What are the motivations for composers writing music (especially those writing unpaid works)? From here, we developed a series of detailed questions for the survey regarding fee, instrumentation, genre, and duration of commissions; and career stage, gender, sexual orientation, age, geographical location, religion, race/ethnicity, and disability status of composers. We also asked composers to rank in importance various non-monetary motivations for writing music on commission.
14 Sound and Music, Composer Commissioning Survey Report 2015, Sound and Music, 2015, https://www.impulse-music.co.uk/wp-content/uploads/2017/05/Commissioning-Report-2015.pdf. 15 Ibid., 10. 16 We should note that, after we conducted our survey, we found out about a similar one conducted by Fahad Siadat. Dr. Siadat’s report is forthcoming, and we are interested to see its results.
We sought out best practices on survey writing as we constructed the study. To avoid creating biased or confusing questions, we followed guidelines from Bernard C.K. Choi and Anita W.P. Pak in their article “A Catalog of Biases in Questionnaires.” We also pondered carefully the 17
complex options available for asking about gender and sexuality, race/ethnicity, and religion, etc., consulting several sources, including the U.S. Census, Pew Research, and Survey Monkey,18
to hone in on the final version of these questions that ended up in our survey. Finally, we ran a 19
pilot survey among a small group of composers, receiving and incorporating feedback from them on the clarity of our questions. An early and important source of help for our survey construction was a conference call held by Loretta with employees of New Music USA in August 2018. Ed Harsh, the President of the organization at the time; Frank J. Oteri, Composer Advocate and Editor of NewMusicBox; and Scott Winship, Director of Grantmaking Programs, offered frank advice on what topics should be covered in a survey on composer commission pay. We gratefully acknowledge their assistance in shaping what became our investigation. One difficult-to-define element we wanted to interrogate was career level. We sought to capture a picture of how far along the composers were on their professional journey. However, to ask people directly, “Are you early-, mid-, or late-career?” would be to invite an element of subjectivity we wanted to avoid. The popular terms “emerging” and “established” also seemed too vague. Thus, we decided to use questions with objective answers to get at the notion of career stage. Specifically, we asked people if they had an agent or manager, how long ago they received their first paid commission, in what percentage of the intervening years they had received paid commissions, their level of education, and the largest size of ensemble they had ever written for. These data points, looked at in combination, give a good idea of how established someone is in the field of composition. While our survey covered broad areas of research, itss limitations must also be acknowledged. One is the lack of data collected about the types of commissioners from whom composers received commision pay. We thought about asking composers to report on the professional status and, in the case of organizations, the annual budgets of those who commissioned them, but
17 Bernard C.K. Choi and Anita W.P. Pak, “A Catalog of Biases in Questionnaires,” Preventing Chronic Disease, 2, no. 1 (January 2005): A13. 18 D’vera Cohn, “Seeking better data on Hispanics, Census Bureau may change how it asks about race,” Fact Tank: News in the Numbers, Pew Research Center, April 20, 2017, https://www.pewresearch.org/fact-tank/2017/04/20/seeking-better-data-on-hispanics-census-bureau-may-change-how-it-asks-about-race/. 19 Laura Wronski, “How to ask about religion in your surveys,” Curiosity at Work, Survey Monkey, https://www.surveymonkey.com/curiosity/how-to-ask-about-religion-in-your-surveys/.
ultimately decided that these kinds of questions would be more accurately answered by a survey of commissioners, not of composers. Many composers, after all, know little about the organizations that hire them to write music. Another limitation is the types of composers and compositions we decided to focus on. In the interest of creating a complete picture of concert music composition pay in the United States, we chose to survey composers whose commissions resulted in concert performances of live music, thus eliminating film, television, video game, and other commercial types of composition from the survey. We also chose to focus on commission income and not income from performances, which may have left out composers who create new music not in expectation of a commission fee, but rather performance income--a category that likely also includes singer-songwriters. This was not because we think commercial composers, singer-songwriters, and other types of music creators are not “composers,” but rather because they are often not paid “on commission.” An additional limitation of the survey is that, without knowing the total number of concert music composers in the United States, it is not possible to draw conclusions about its statistical significance. We did search numerous sources, including the federal government, professional organizations, and previous studies, to find out how many composers are in the United States, but none of these sources included that information. Probably the most reliable way to ascertain the number of concert composers in the United States would be by finding out from ASCAP and BMI how many concert composers are in each of their stables. They did not respond to our inquiries on this topic, however, and we believe they keep this information confidential. A final limitation worthy of mention is the reach of our survey. Our attempts to publicize the survey through national new music organizations were not successful. Thus, we built our own distribution list of composers through internet research, where composers are often most easily found on university websites. This resulted in distribution of the survey to a largely academic audience. To extend our outreach, we also spread the word on social media using Facebook ads and our personal networks. We are certainly pleased that over 200 composers participated in the survey, representing between them data on 871 commissions, but we realize that with more respondents, we would have received even more robust data. Results In the sections below, we describe the most notable results from our survey questions and include charts and tables to illustrate the data. A note about the number of respondents: many more people began the survey than finished it, and thus the number of respondents varies from question to question. For example, 455 composers indicated that they had written music on commission at the beginning of the survey,
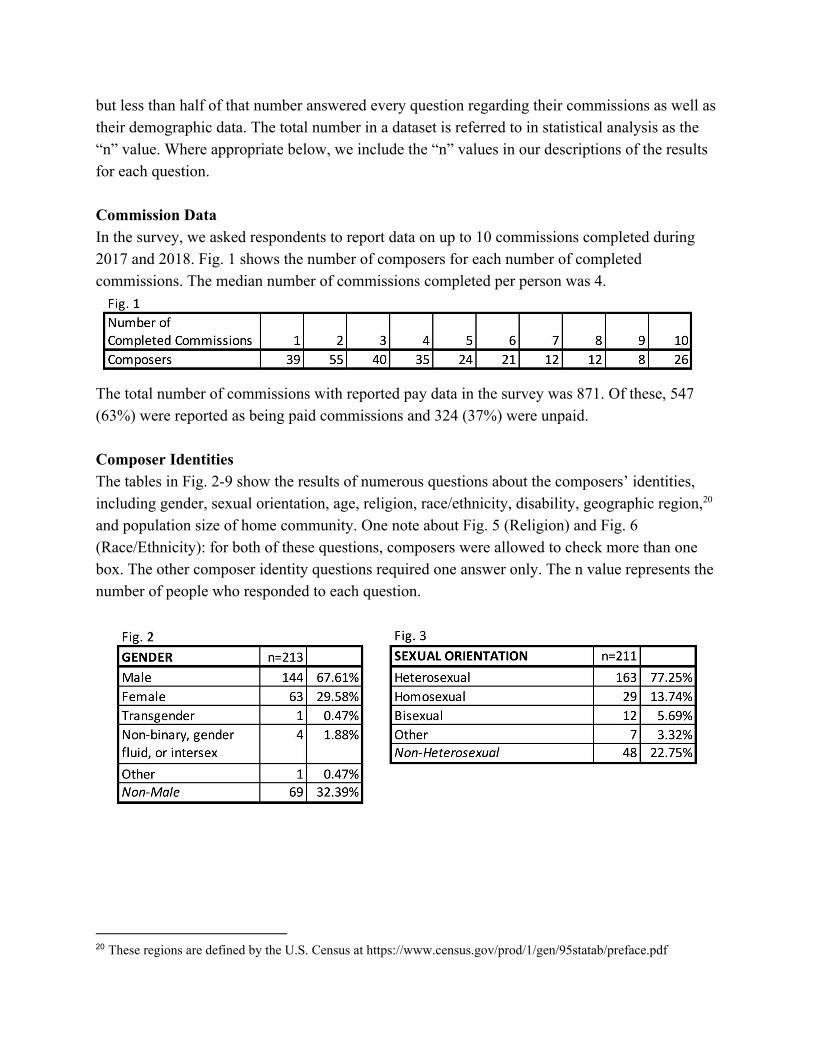
but less than half of that number answered every question regarding their commissions as well as their demographic data. The total number in a dataset is referred to in statistical analysis as the “n” value. Where appropriate below, we include the “n” values in our descriptions of the results for each question. Commission Data In the survey, we asked respondents to report data on up to 10 commissions completed during 2017 and 2018. Fig. 1 shows the number of composers for each number of completed commissions. The median number of commissions completed per person was 4.
The total number of commissions with reported pay data in the survey was 871. Of these, 547 (63%) were reported as being paid commissions and 324 (37%) were unpaid. Composer Identities The tables in Fig. 2-9 show the results of numerous questions about the composers’ identities, including gender, sexual orientation, age, religion, race/ethnicity, disability, geographic region, 20
and population size of home community. One note about Fig. 5 (Religion) and Fig. 6 (Race/Ethnicity): for both of these questions, composers were allowed to check more than one box. The other composer identity questions required one answer only. The n value represents the number of people who responded to each question.
20 These regions are defined by the U.S. Census at https://www.census.gov/prod/1/gen/95statab/preface.pdf

Career Stage As noted above, we asked a number of questions for the purpose of ascertaining the career level of the composers. These results are shown in Fig. 10-15. The n value represents the number of people who responded to each question.
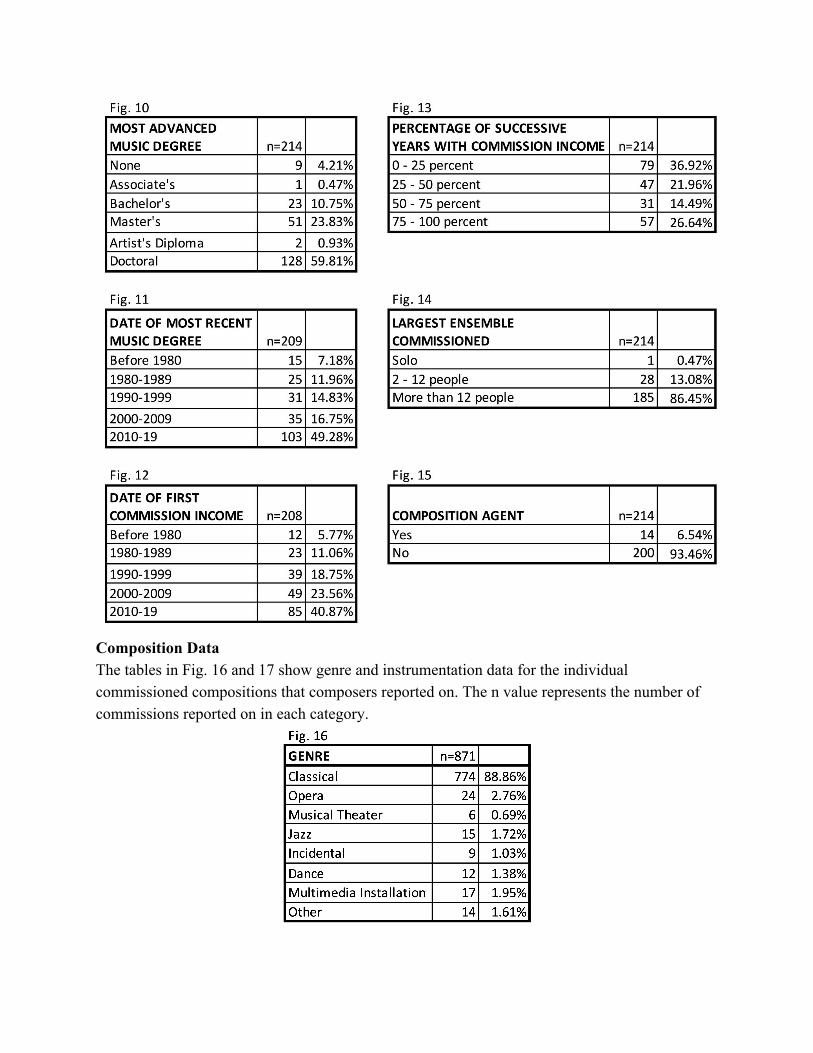
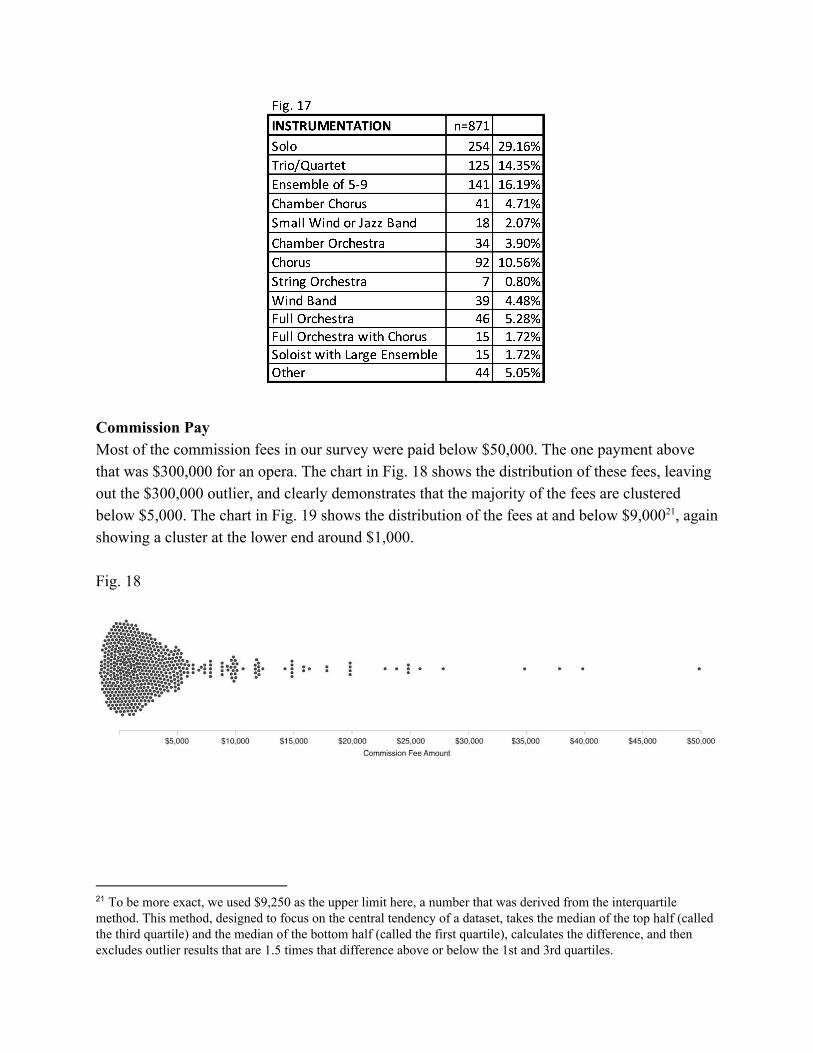
Composition Data The tables in Fig. 16 and 17 show genre and instrumentation data for the individual commissioned compositions that composers reported on. The n value represents the number of commissions reported on in each category.
Commission Pay Most of the commission fees in our survey were paid below $50,000. The one payment above that was $300,000 for an opera. The chart in Fig. 18 shows the distribution of these fees, leaving out the $300,000 outlier, and clearly demonstrates that the majority of the fees are clustered below $5,000. The chart in Fig. 19 shows the distribution of the fees at and below $9,000 , again 21
showing a cluster at the lower end around $1,000. Fig. 18
21 To be more exact, we used $9,250 as the upper limit here, a number that was derived from the interquartile method. This method, designed to focus on the central tendency of a dataset, takes the median of the top half (called the third quartile) and the median of the bottom half (called the first quartile), calculates the difference, and then excludes outlier results that are 1.5 times that difference above or below the 1st and 3rd quartiles.
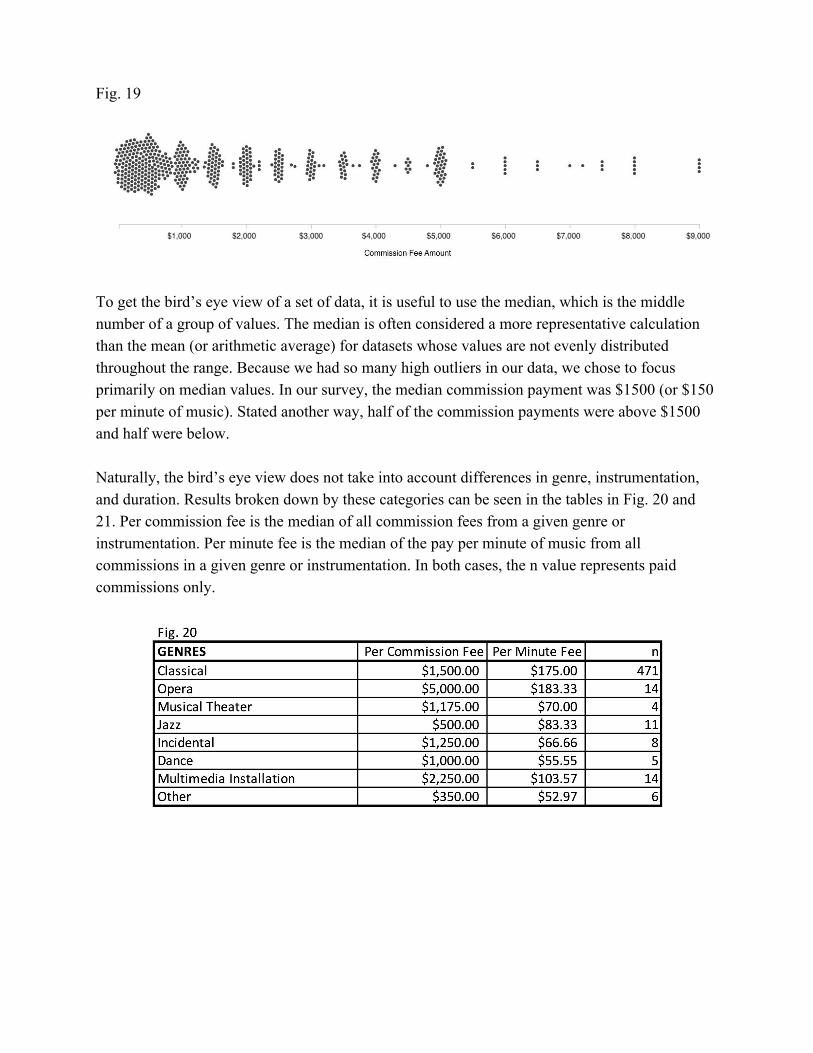
Fig. 19
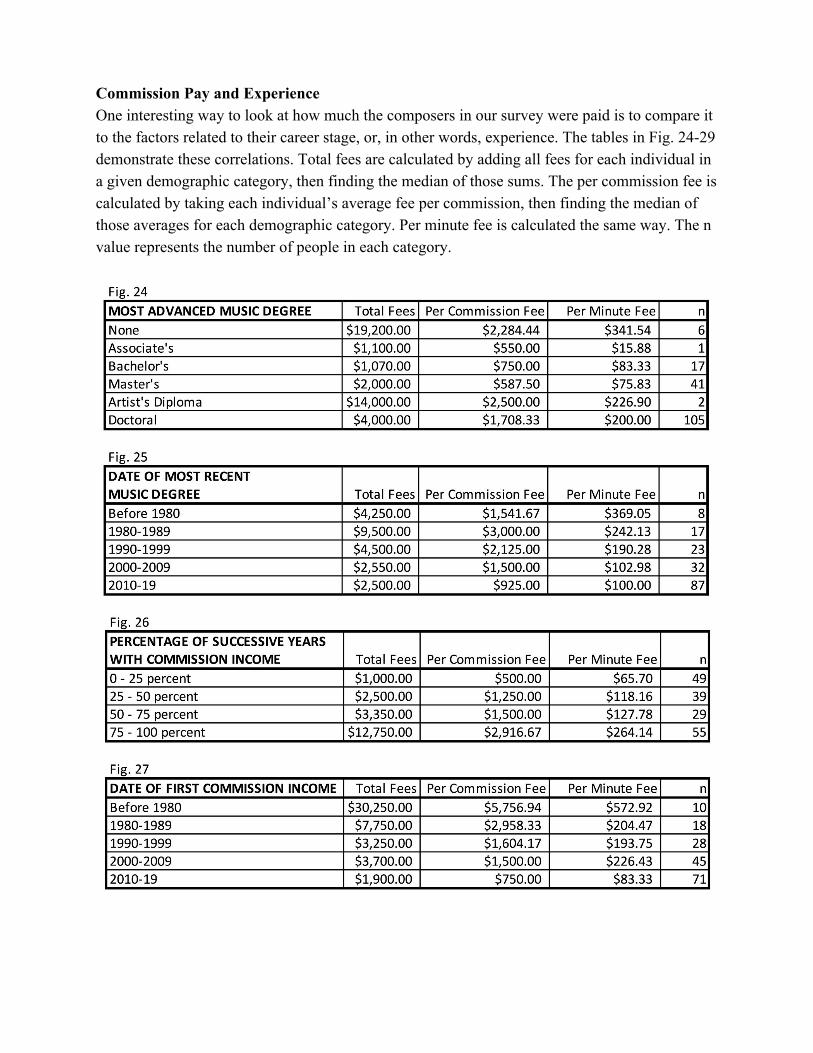
To get the bird’s eye view of a set of data, it is useful to use the median, which is the middle number of a group of values. The median is often considered a more representative calculation than the mean (or arithmetic average) for datasets whose values are not evenly distributed throughout the range. Because we had so many high outliers in our data, we chose to focus primarily on median values. In our survey, the median commission payment was $1500 (or $150 per minute of music). Stated another way, half of the commission payments were above $1500 and half were below. Naturally, the bird’s eye view does not take into account differences in genre, instrumentation, and duration. Results broken down by these categories can be seen in the tables in Fig. 20 and 21. Per commission fee is the median of all commission fees from a given genre or instrumentation. Per minute fee is the median of the pay per minute of music from all commissions in a given genre or instrumentation. In both cases, the n value represents paid commissions only.
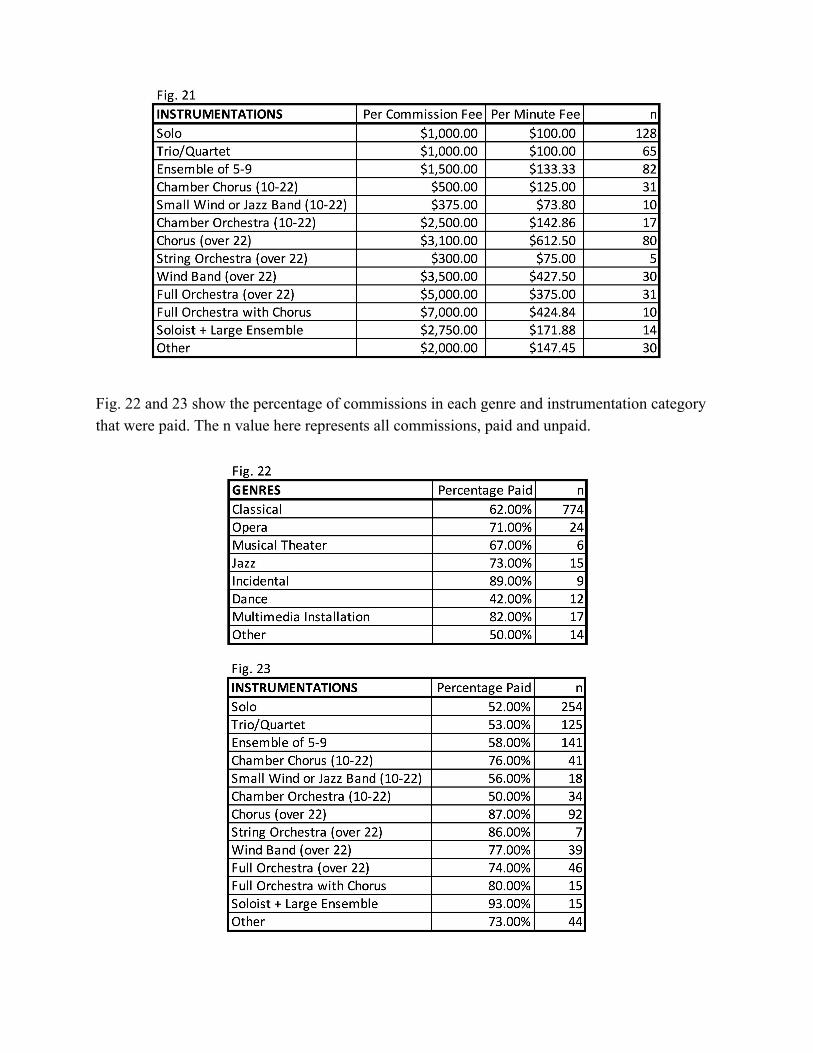
Fig. 22 and 23 show the percentage of commissions in each genre and instrumentation category that were paid. The n value here represents all commissions, paid and unpaid.
Commission Pay and Experience One interesting way to look at how much the composers in our survey were paid is to compare it to the factors related to their career stage, or, in other words, experience. The tables in Fig. 24-29 demonstrate these correlations. Total fees are calculated by adding all fees for each individual in a given demographic category, then finding the median of those sums. The per commission fee is calculated by taking each individual’s average fee per commission, then finding the median of those averages for each demographic category. Per minute fee is calculated the same way. The n value represents the number of people in each category.
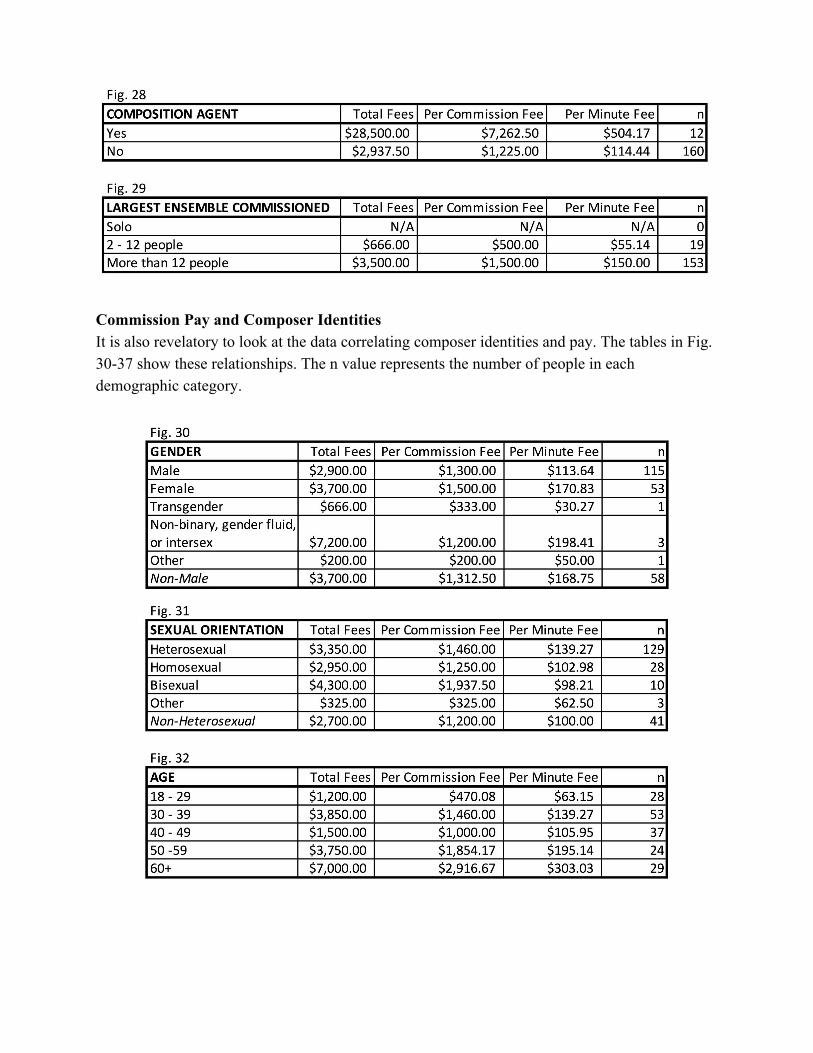
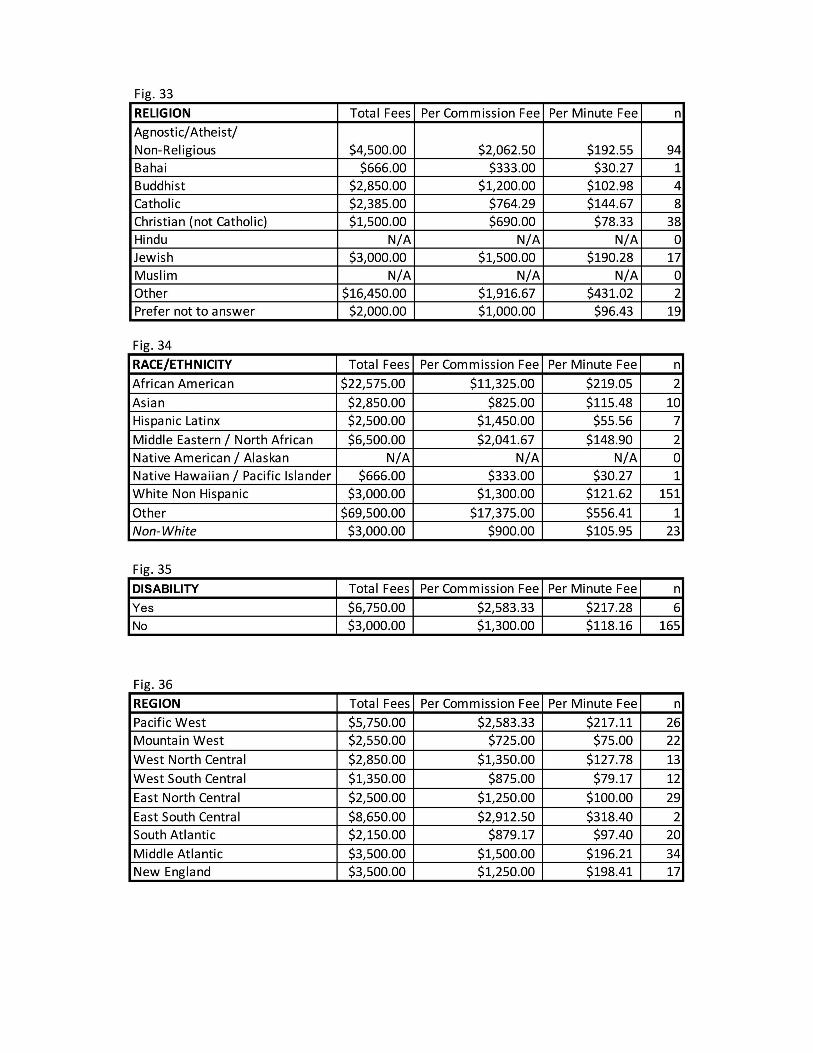
Commission Pay and Composer Identities It is also revelatory to look at the data correlating composer identities and pay. The tables in Fig. 30-37 show these relationships. The n value represents the number of people in each demographic category.
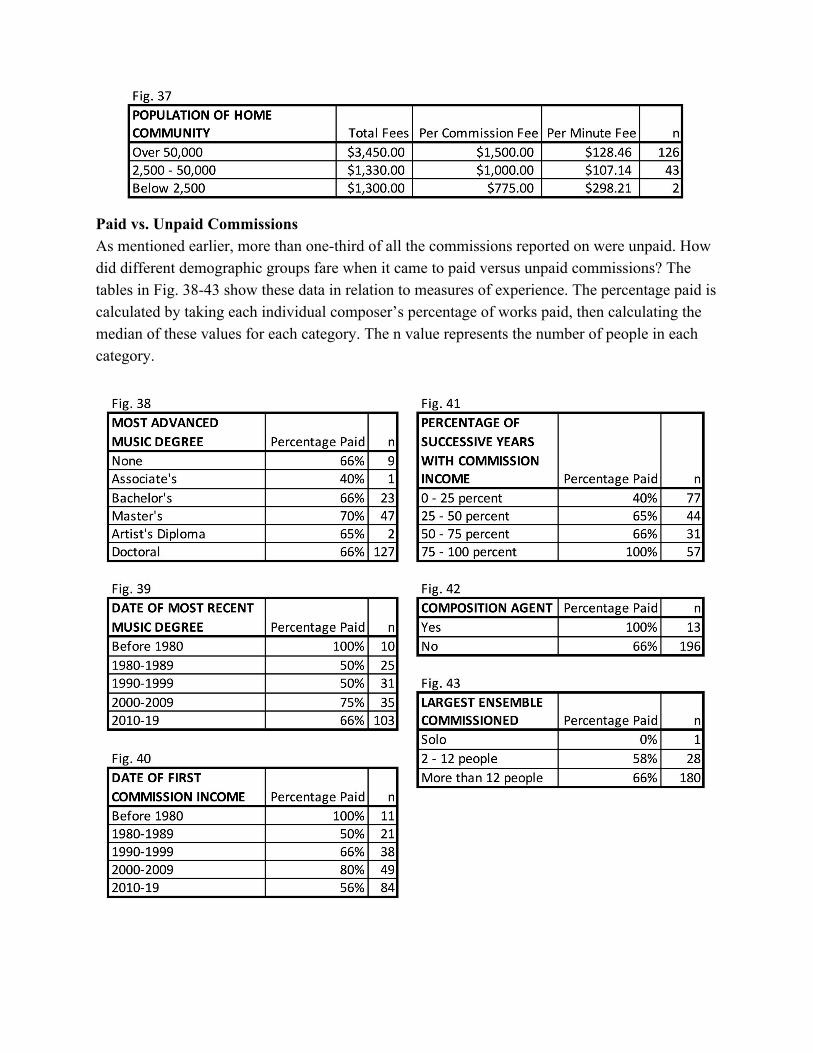
Paid vs. Unpaid Commissions As mentioned earlier, more than one-third of all the commissions reported on were unpaid. How did different demographic groups fare when it came to paid versus unpaid commissions? The tables in Fig. 38-43 show these data in relation to measures of experience. The percentage paid is calculated by taking each individual composer’s percentage of works paid, then calculating the median of these values for each category. The n value represents the number of people in each category.
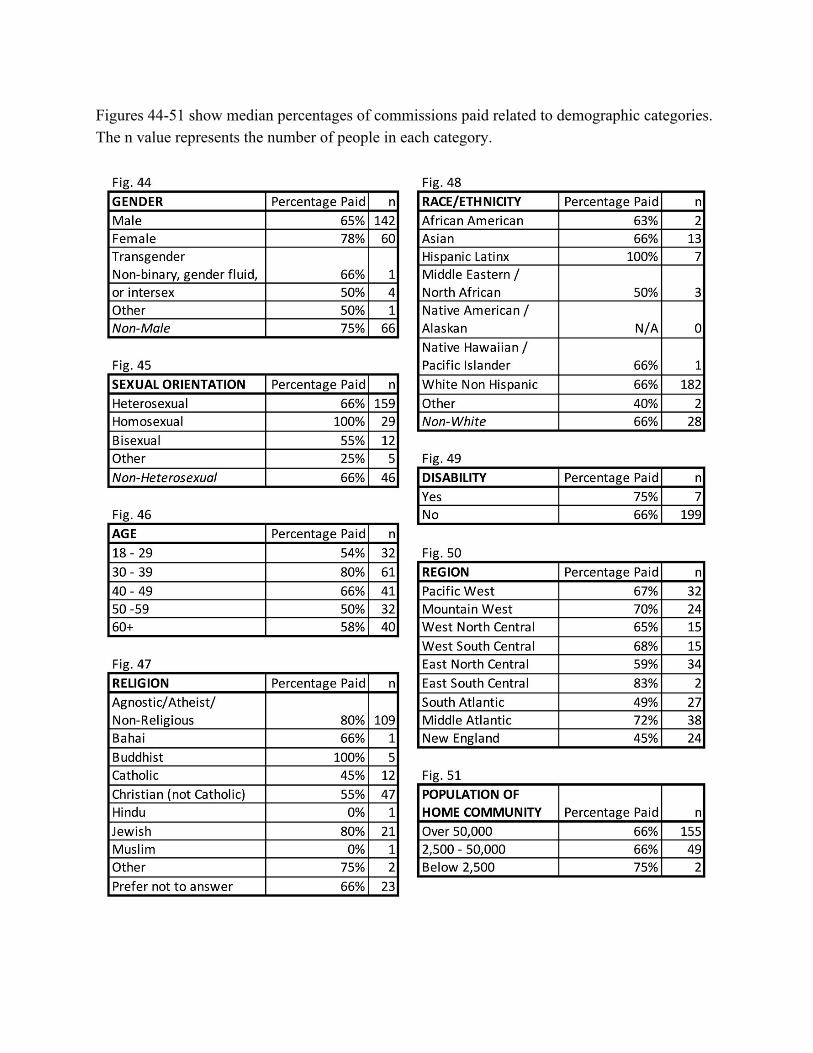
Figures 44-51 show median percentages of commissions paid related to demographic categories. The n value represents the number of people in each category.
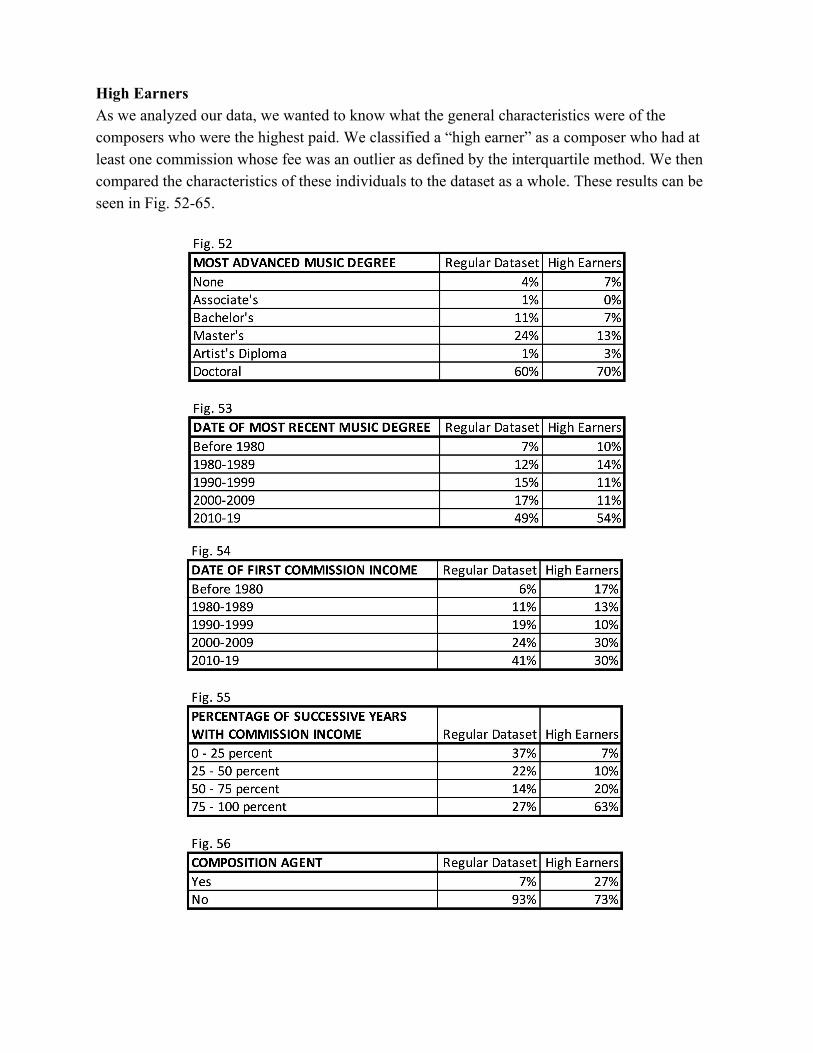
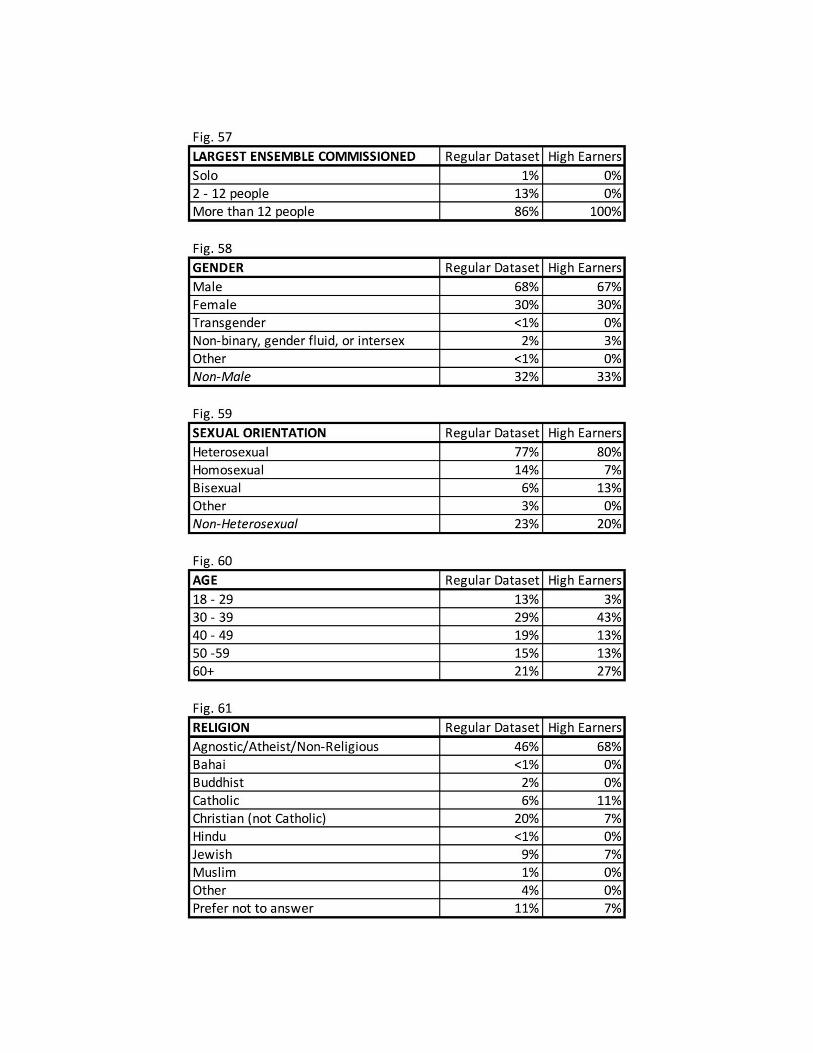
High Earners As we analyzed our data, we wanted to know what the general characteristics were of the composers who were the highest paid. We classified a “high earner” as a composer who had at least one commission whose fee was an outlier as defined by the interquartile method. We then compared the characteristics of these individuals to the dataset as a whole. These results can be seen in Fig. 52-65.
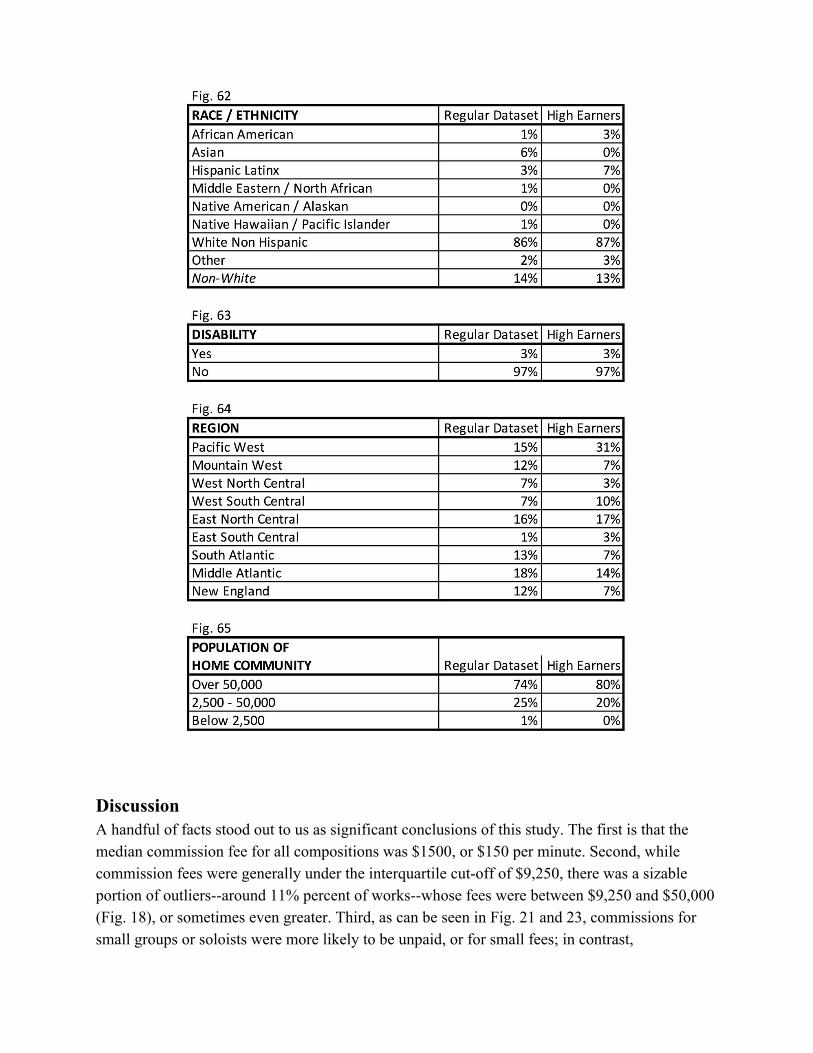
Discussion A handful of facts stood out to us as significant conclusions of this study. The first is that the median commission fee for all compositions was $1500, or $150 per minute. Second, while commission fees were generally under the interquartile cut-off of $9,250, there was a sizable portion of outliers--around 11% percent of works--whose fees were between $9,250 and $50,000 (Fig. 18), or sometimes even greater. Third, as can be seen in Fig. 21 and 23, commissions for small groups or soloists were more likely to be unpaid, or for small fees; in contrast,
commissions for large ensembles were more likely to be paid, and to command larger fees. Fourth, most outlier fees were for large ensemble commissions--the best paying large ensemble was the large choir. One of the other observations we made about our data is the relatively high number of unpaid commissions reported. Out of a total of 871 commissioned compositions, 324 (37%) were unpaid. We knew from our personal experience, and that of our composer colleagues, that unpaid commissions are common. However, the fact that more than one third of all reported commissions were unpaid was striking. Our decision to collect data on unpaid commissions, or even to use the word commission to describe unpaid works written for a specific occasion, was not without controversy. One composer wrote to us to object to the use of the word commission for unpaid work. This composer insisted that “in the real world,” professional composers never take unpaid commissions. We disagree, having found in our survey (and in our own lived experiences), that many professional composers, at all levels of experience, take a mix of paid and unpaid commissions. We should not ignore this reality that is so common in our field. Another major conclusion we were able to draw is that experience matters. As can be seen in Fig. 24-29, on several different measures of composer experience, higher pay correlated with more experience. Specifically, we found that in general more advanced degrees correlated with higher pay. Additionally, we found that those who had completed their degree longer ago were earning more on a per-minute basis. In another measure, we found that the composers who first received commission income the longest ago (before 1980) were the highest paid. Finally, we found that the most consistently-commissioned composers were also those making the most money from commissions: the composers who reported receiving commissions in 75-100% of subsequent years after their first commission reported the highest pay. Another factor that mattered for pay was geographic region. Fig. 36 shows that aside from two composers in the East South Central region, the best paid composers were the 26 respondents in the Pacific West region. The lowest paid geographic region was the Mountain West (here we should note that we, the authors, live in this region but were not respondents in the survey). When comparing our compensation data with that for society in general, two trends stood out. The first is that, unlike in society overall, where women are paid on average 82% of what men make, the women in our survey were paid more than the men. As can be seen in Fig. 30, 22
women made a median pay-per-minute of $171 (n=53) and had an average of 78% of their commissions paid (see Fig. 44). Men, on the other hand, as a group earned $114 (n=115), or 67% of the women’s per-minute pay. The men also had only 65% of their commissions paid.
22 American Association of University Women, “The Simple Truth about the Gender Pay Gap,” Research and Data, https://www.aauw.org/resources/research/simple-truth/.
The second trend has to do with pay disparity correlated with race. Racial pay gaps in society vary according to which minority group is studied, but on the whole, people of color are paid less than white people. Unfortunately, this trend was mirrored in our study, with people of color, as 23
a whole (n=23), paid a median of $106 per minute, which was 87% of the $122 per minute paid to those who identified as white, non-Hispanic (n=151) (see Fig. 34). When looked at as total pay or pay per commission, the numbers vary for both race and gender; we refer readers to the charts above for more information. Looking Ahead We present our data and conclusions as a fascinating snapshot of more than 200 composers and their 871 commissions in 2017-2018. However, this study should not be considered complete or conclusive, and we would welcome future research. Continued collection of data on composer commission fees, supported by composer advocacy groups and professional organizations, is necessary in order to obtain data that will empower composers in making informed professional decisions. Repeating this survey, or a similar one, every five years or so, would allow continued monitoring of composer pay as it changes over time. Wider distribution would give a more reliable picture over time as well. Another consideration is that we did not attempt multivariable analysis on the data we collected and feel this approach has the potential for fruitful results. A multivariable analysis might address the discrepancies in pay we found between women and men and white people and people of color by discovering whether other factors beyond gender or race influenced the pay differences (e.g. years of experience, types of ensembles, etc.). Another unanswered question in our analysis is whether there is some combination of demographic or musical factors that correlates with higher or lower pay. An additional area of research suggested by our survey relates to gender: 30% of our respondents were women, whereas, in the Jeffri study from over a decade ago, only 20% were women. It 24
would be interesting to find out if it is indeed true that more women have entered the field of composition in the past decade, and, if so, what the reasons are for this change. Another facet that deserves further study is the higher pay for women and the lower pay for composers of color. If further research reinforces the idea that pay inequalities exist in the world of new music, then we as a community are obliged to discuss how to create a more equitable economy for all. How can we level the playing field for American composers?
23Eileen Patten, “Racial, gender wage gaps persist in U.S. despite some progress,” Fact Tank: News in the Numbers, Pew Research Center, July 1, 2016, https://www.pewresearch.org/fact-tank/2016/07/01/racial-gender-wage-gaps-persist-in-u-s-despite-some-progress/ 24 Jeffri, Taking Note, 21.
Taking another cue from Jeffri’s study, it would be good to follow up on this broad research with focused inquiry into specific commissioners to find out the thinking and motivation behind their commission fees. The economy of new music presenters is intertwined with that of composers, and a broader understanding of the factors that influence those who commission new music would be revelatory. One final area of research suggested by our data is information regarding composers’ motivations for taking commissions, especially lower-paid and unpaid commissions. We did ask the composers in our study about non-monetary motivations, but those results are beyond the scope of this report. We hope to provide an addendum to this report in the future to address these topics. It would also be worthwhile to follow up, perhaps with a composer focus group, to learn more about composer mindset and to investigate the varied ways that composers make a living. In conclusion, the Composer Commission Pay Survey is one look at the status of pay for concert music composers in the United States in recent years. Our study has reinforced our belief in transparency and honesty in discussions about pay. Composers and commissioners may use this information to compare their fees with those of their peers, and, in doing so, advocate for fair pay for themselves and others. We also trust that this contribution to the field of labor research for U.S. composers will not stand alone in the future. In the long run, we hope that this and forthcoming research will empower composers with the knowledge they need to flourish in the new music economy. Acknowledgements The Composer Commission Pay Survey was planned, created, and reported on with the help of many individuals, whose assistance we gratefully acknowledge here. For help in envisioning and designing the survey, we thank Ed Harsh, Frank J. Oteri, Scott Winship, Alex Shapiro, Jazmin Muro, Christopher Roberts, Kala Pierson, and Iddo Aharony. For help with analysis, we thank Tim Trenary, Kristofor Voss, and Kris Nadler Dean. For help with editing the final report, we thank Natalie Kirschstein, Carla Aguilar, Kevin Garlow, and John Pippen. Finally, we thank all of the respondents to the survey for their generous time in recording responses. Bibliography American Association of University Women. “The Simple Truth about the Gender Pay Gap.” Research and Data. https://www.aauw.org/resources/research/simple-truth/. American Composers Forum. “Commissioning by Individuals.” American Composers Forum. https://composersforum.org/resources/commissioning-by-individuals/.
Choi, Bernard C.K. and Anita W.P. Pak. “A Catalog of Biases in Questionnaires.” Preventing Chronic Disease, 2, no. 1 (January 2005): A13. Cohn, D’vera. “Seeking better data on Hispanics, Census Bureau may change how it asks about race.” Fact Tank: News in the Numbers. Pew Research Center, April 20, 2017. https://www.pewresearch.org/fact-tank/2017/04/20/seeking-better-data-on-hispanics-census-bureau-may-change-how-it-asks-about-race/. Jeffri, Joan. Taking Note: A Study of Composers and New Music Activity in the U.S. Ann Arbor, MI: Inter-university Consortium for Political and Social Research [distributor], 2016. https://doi.org/10.3886/ICPSR36325.v1. Meet the Composer. Commissioning Music: A Basic Guide. New York: Meet the Composer, 2009. New Music USA. “Commissioning Fees Calculator.” NewMusicBox (April 12, 2016). https://nmbx.newmusicusa.org/commissioning-fees-calculator. Patten, Eileen. “Racial, gender wage gaps persist in U.S. despite some progress.” Fact Tank: News in the Numbers. Pew Research Center, July 1, 2016, https://www.pewresearch.org/fact-tank/2016/07/01/racial-gender-wage-gaps-persist-in-u-s-despite-some-progress/. Sound and Music. Composer Commissioning Survey Report 2015. Sound and Music, 2015. https://www.impulse-music.co.uk/wp-content/uploads/2017/05/Commissioning-Report-2015.pdf U.S. Bureau of the Census. Statistical Abstract of the United States: 1995 (115th edition). Washington, DC, 1995. U.S. Bureau of Labor Statistics. “Music Directors and Composers.” Occupational Outlook Handbook. Office of Occupational Statistics and Employment Projections, September 1, 2020. https://www.bls.gov/ooh/entertainment-and-sports/music-directors-and-composers.htm#tab-1. Wronski, Laura. “How to ask about religion in your surveys.” Curiosity at Work. Survey Monkey. https://www.surveymonkey.com/curiosity/how-to-ask-about-religion-in-your-surveys/.