Embed Size (px)
Citation preview
PRACE Day16 Scientific & Industrial Conference 11 May 2016
How much do tides affect
the simulated climate of
the Mediterranean Sea?
The Nemerte Project
Gianmaria SanninoENEA C.R. Casaccia (Roma)Climate Modelling and Impacts Laboratory

NEMERTE – Numerical Experiment on the Mediterranean model response to Enhanced Resolution and TidE
Project leader: Gianmaria Sannino, ENEA, ITALY
Collaborators:
Patrick Heimbach, Massachusetts Institute of Technology (MIT), UNITED STATESGabriel Jorda Sanchez, Mediterranean Institute for Advanced Studies (IMEDEA), SPAIN Vincenzo Artale, ENEA, ItalyAdriana Carillo, ENEA, ItalyEmanuele Lombardi, ENEA, ItalyGiovanna Pisacane, ENEA, Italy MariaVittoria Struglia, ENEA, Italy

FERMI@CINECAArchitecture: 10 BGQ FramesModel: IBM-BG/QProcessor type: IBM PowerA2 @1.6 GHzComputing Cores: 163840 Computing Nodes: 10240 RAM: 1GByte / core (163 PByte total)Internal Network: 5D TorusDisk Space: 2PByte of scratch space Peak Performance: 2PFlop/s
N. 7 in Top 500 rank (June 2012)
National and PRACE Tier-0 calls
NEMERTE Resource Awarded:18 Million core hours on FERMI
The mission of PRACE (Partnership for Advanced Computing in Europe) is to enable high impact scientific discovery and engineering research and development across all disciplines to enhance European competitiveness for the benefit of society. PRACE seeks to realize this mission by offering world class computing and data management resources and services through a peer review process.

OUTLINE
HOW
DID
NEMERTE
BEGIN?A fascinating story involving ocean models and HPC
Workshop– Instanbul – July2012
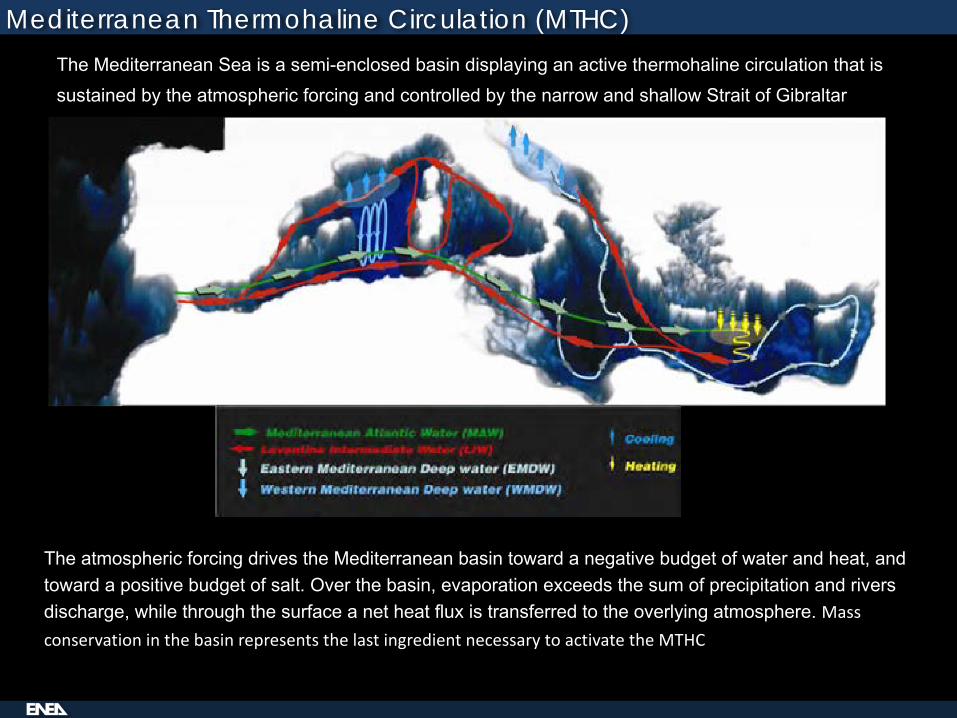
The Mediterranean Sea is a semi-enclosed basin displaying an active thermohaline circulation that is sustained by the atmospheric forcing and controlled by the narrow and shallow Strait of Gibraltar
Mediterranean Thermohaline Circulation (MTHC)
The atmospheric forcing drives the Mediterranean basin toward a negative budget of water and heat, and toward a positive budget of salt. Over the basin, evaporation exceeds the sum of precipitation and rivers discharge, while through the surface a net heat flux is transferred to the overlying atmosphere. MassconservationinthebasinrepresentsthelastingredientnecessarytoactivatetheMTHC
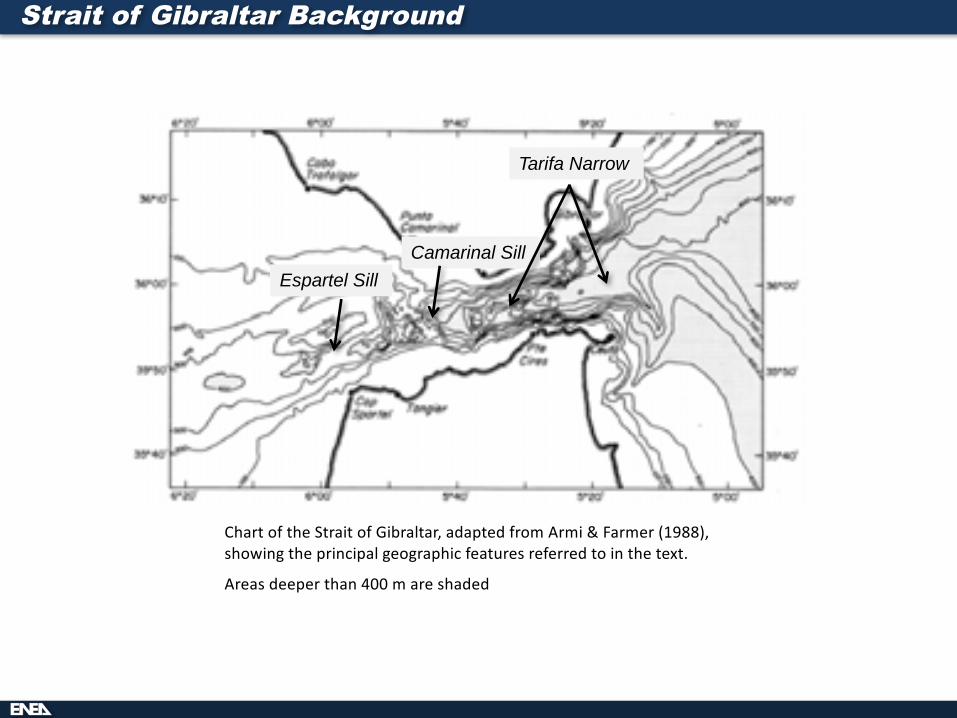
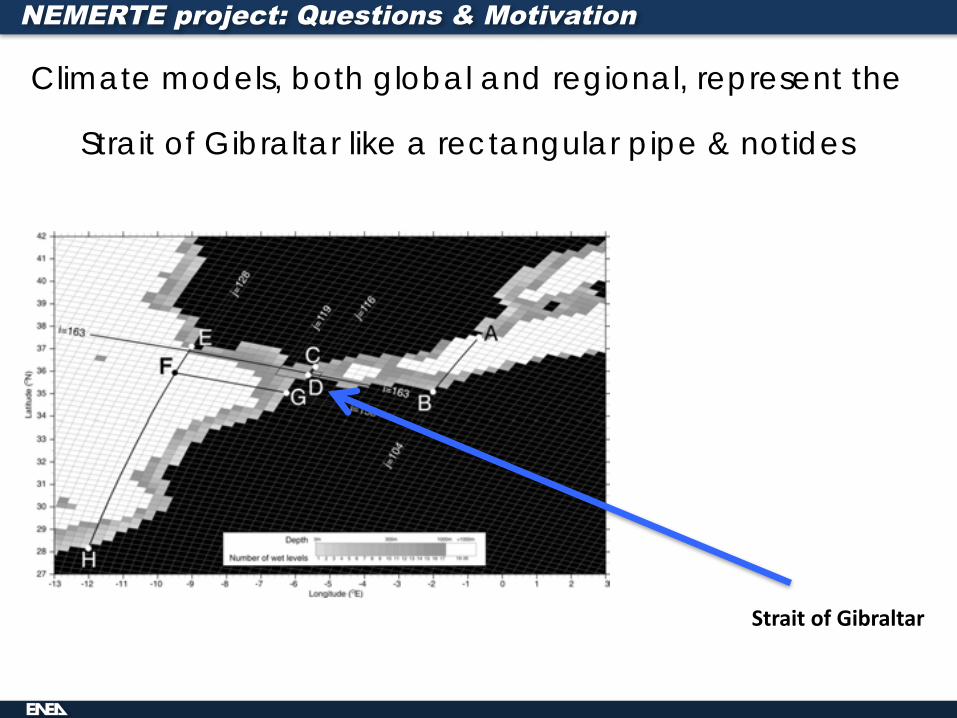
ChartoftheStraitofGibraltar,adaptedfromArmi &Farmer(1988),showingtheprincipalgeographicfeaturesreferredtointhetext.
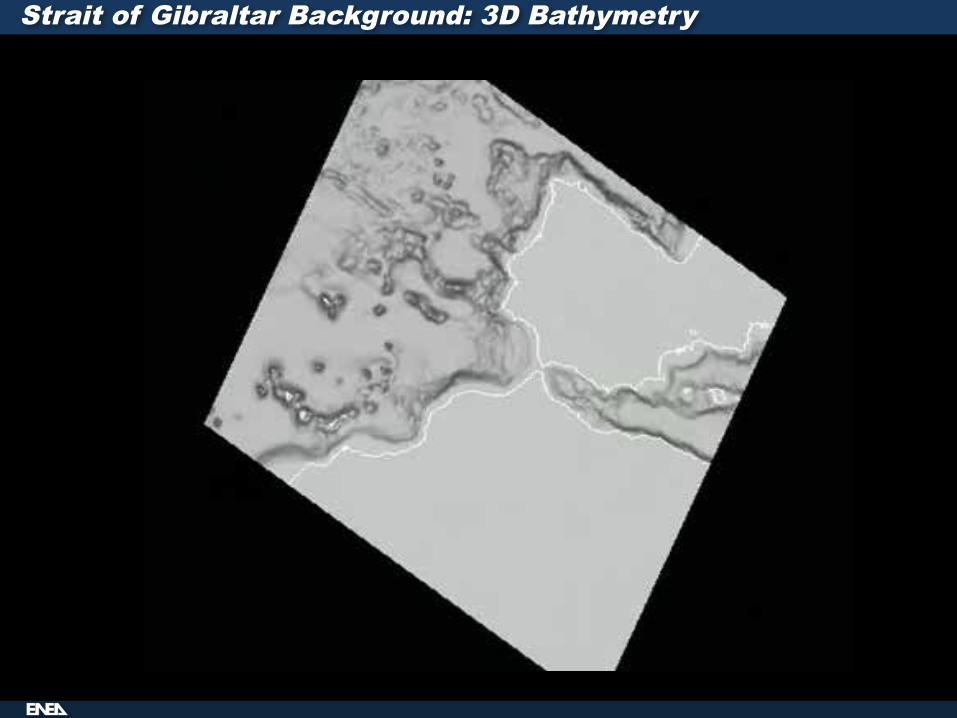
Areasdeeperthan400mareshaded
Espartel SillCamarinal Sill
Strait of Gibraltar Background
Tarifa Narrow
Workshop– Instanbul – July2012
Strait of Gibraltar Background: 3D Bathymetry
Workshop– Instanbul – July2012
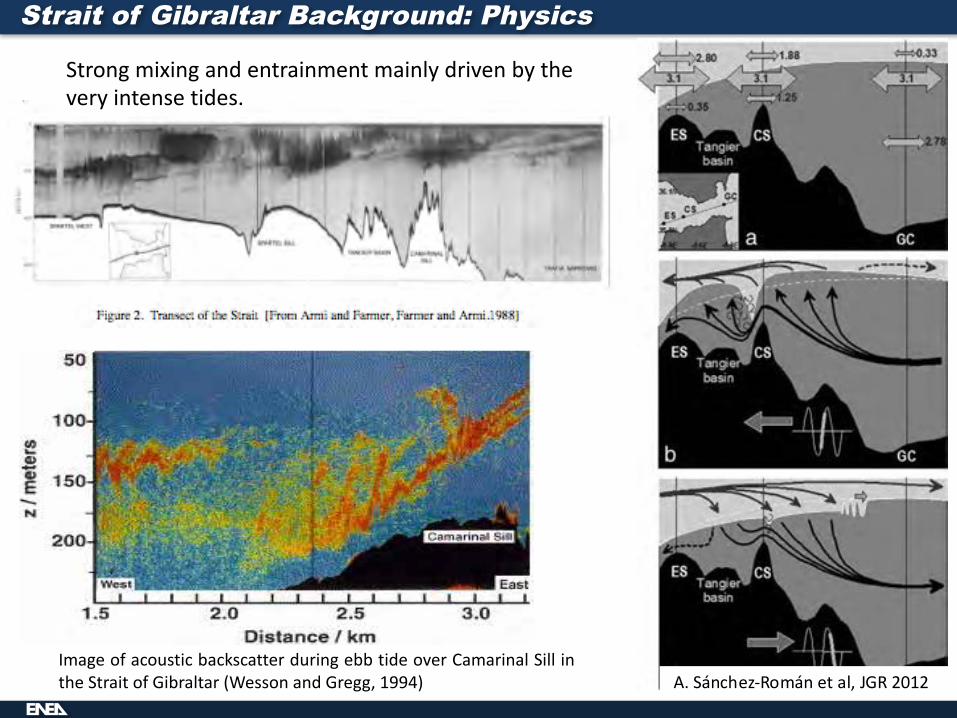
Image of acoustic backscatter during ebb tide over Camarinal Sill inthe Strait of Gibraltar (Wesson and Gregg, 1994)
Strait of Gibraltar Background: Physics
Strongmixingandentrainmentmainlydrivenbytheveryintensetides.
semidiurnal constituents and particularly for M2. The opposite behavioris found in the Atlantic layer, where amplitude increases monotonicallyfrom east to west. Phases of semidiurnal constituents also show suchmonotonic characteristic. This behavior was reported by García-Lafuente et al. (2000) between the eastern exit of the strait and themain sill of Camarinal and the analysis here not only confirms this resultbut also extends it to the western exit of the strait. Between GC and CS,the amplitude of M2 transport in theMediterranean layer is reduced bymore than 50% while it is nearly 6 times greater in the Atlantic layer atCS (Table 2). A very clear transfer of the tidal signal from theMediterra-nean to the Atlantic layer takes place between GC and CS during theflood tide and vice-versa during the ebb tide. This fact led Bray et al.(1990) to propose the conceptual model of a membrane-like interfacebetween CS and GC sections whose role would be the transfer of thetidal signal from one layer to the other. Phase difference betweenthese locations in the Atlantic layer indicates that tidal transport propa-gates fromCS to GC, a fact that is ascribed to the strong baroclinic natureof the internal tide. An inspection of values in Table 2 indicates that thesame behavior applies between CS and ES sections.
The two-layer sketches presented in Fig. 4 illustrate key aspects ofthe tidal dynamics in the strait and explain the aforementioned diver-gences. Fig. 4.a represents the hypothetical mean exchange and meaninterface position in the absence of tidal forcing. Tidal transports as-sociated with M2 within each layer (small two-headed arrows withsize proportional to the transport, which is indicated by the numbersbeside) and the total barotropic transport (large arrows with numbersinside) have been included for ES, CS and GC sections (see Fig. 1 for lo-cations). Notice that M2 transport by itself (3.1 Sv) would reverse themean flow, which is around 0.8 to 1 Sv in each layer (Baschek et al.,2001; Garcia-Lafuente et al., 2002a; Sánchez-Román et al., 2009), if itwere equally distributed among both layers. This is not the case at thestrait's boundaries because most of the tidal flow moves through thepassive, slow-flowing layer (Mediterranean layer in the east, Atlanticlayer in the west), making them reverse periodically. At these bound-aries, however, the tidal transport in the active, fast-flowing layers is in-sufficient to reverse the total flow. In CS the amplitude of M2 in anylayer is greater than 1 Sv and, except for some neap tides, the totalflow in each layer reverses during part of the tidal cycle.
Fig. 4.b sketches the flow during flood tide (thick gray line in thesea level graph) that implies westward barotropic tidal transport(thick arrow beside the graph). At this time, the flow is hydraulicallycontrolled at CS and only a limited volume of the west-going tidal flowthat has flown through GC is able to surpass the sill, the rest remainingtrapped between both sections. Consequently, the interface is pushed up-ward and forces water in the Atlantic layer to move away from the area.Part of it moves eastward, thus reducing the amplitude of tidal currentsin the upper layer at GC, but most of it goes on to the west, transferringthe signal from the Mediterranean to the Atlantic layer. Some tidal flowcan be transferred cross-strait reaching the continental shelf of both theSpanish and Moroccan coasts and promoting some coastal recirculation.This topic will be addressed in the next section. At the ES section, westof CS, the Mediterranean flow is also hydraulically controlled. In fact, thehydraulic control in ES is more permanent than in CS (Sánchez-Román,2008b; Sannino et al., 2007, 2009) and the reduced fraction of the tidaltransport crossing CS is not even able to overflow ES. Consequently, thewater accumulates in the Tangier basin forcing the flow to change to sub-critical and originating the well-known internal hydraulic jump down-stream CS (Armi and Farmer, 1988; Sanchez-Garrido et al., 2008, 2011).Once more the interface is pushed up displacing the Atlantic waterabove toward the Atlantic Ocean and completing the transfer of thelarge tidal signal that is observed in the lower layer in the east to theupper layer in the west. A first guess of the interface vertical excursionin the Tangier basin is obtained by integrating the equation
S∂η∂t ¼ Q2;E−Q2;C ð6Þ
where η is the interface depth, S is its horizontal area assumed constantand equal to the area at its mean depth in the inter-sill region (160 m),and Q2,E and Q2,C are the tidal transports in the Mediterranean layerthrough the ES and CS sections, respectively. The equation,which is appli-cable to any constituent, gives a vertical excursion of around 75 m for M2
(35 m for S2), which is an important fraction of the water depth in theTangier basin (~500 m).
During ebb tide the situation reverses, but the interpretation israther similar. The main difference is the flooding of the hydrauliccontrol in CS by the end of the flood tide when the tidal currentweakens and the subsequent release of the internal jump that propa-gates as an internal bore with the associated short-wavelength inter-nal wave packet to the east (Fig. 4.c). The flooding of CS control allowsthe accumulated Mediterranean water in the Tangier basin to floweastward, thus reversing the flow in this layer at CS, although partof the water keeps on flowing westward, smoothing out the ampli-tude of tidal currents at ES in this layer. The Mediterranean water ac-cumulated between CS and GC in the previous flood evacuates towardthe Mediterranean through GC, a process favored by the hydrauliccontrol in Tarifa narrows that prevents the large volume of Atlanticwater moving to the east during the ebb tide to cross the control sec-tion. As this water accumulates between CS and GC, it pushes down theinterface and forces the Mediterranean water below to flow back
Fig. 4. Two-layer sketch to explain tidal transport divergence in each layer. (a) Plate of themean exchange with indication of M2 tidal transport. The mean flow of around 0.8 Sv ineach layer has not been indicated to prevent the figure from being overcrowded withnumbers. (b) Illustration of the flood tide (barotropic tidal current toward the AtlanticOcean). (c) The same for ebb tide (tidal current toward the Mediterranean). See text fora more detailed explanation.
14 A. Sánchez-Román et al. / Journal of Marine Systems 98–99 (2012) 9–17
A.Sánchez-Románetal,JGR2012
Workshop– Instanbul – July2012
8<
:
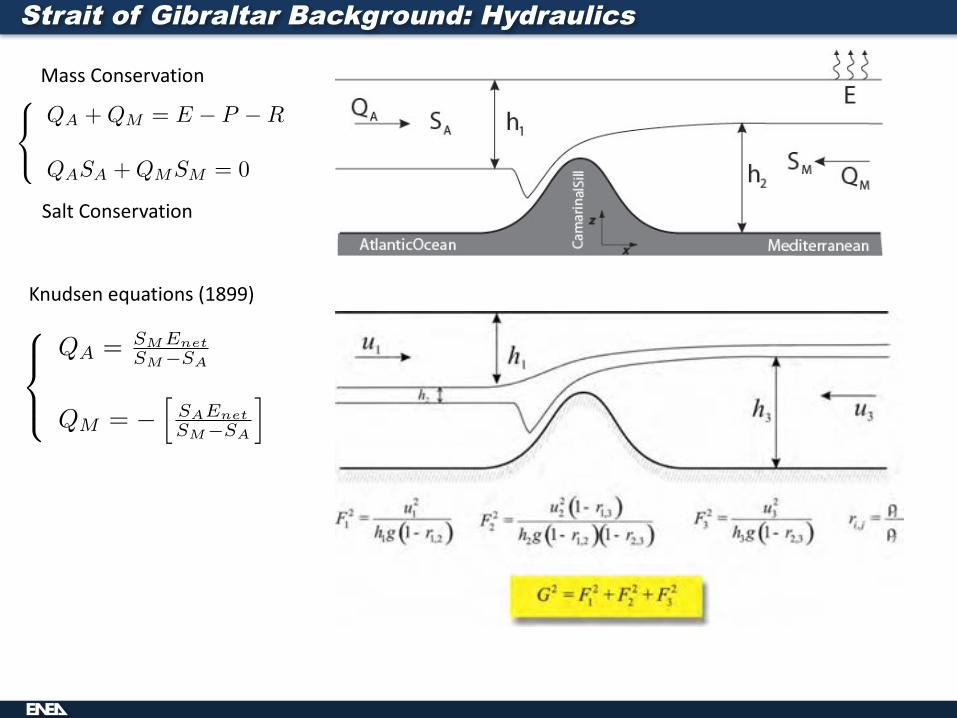
QA +QM = E � P �R
QASA +QMSM = 0(1)
Strait of Gibraltar Background: Hydraulics
MassConservation
SaltConservation
Knudsenequations(1899)8><
>:
QA = SMEnetSM�SA
QM = �hSAEnetSM�SA
i.
(1)
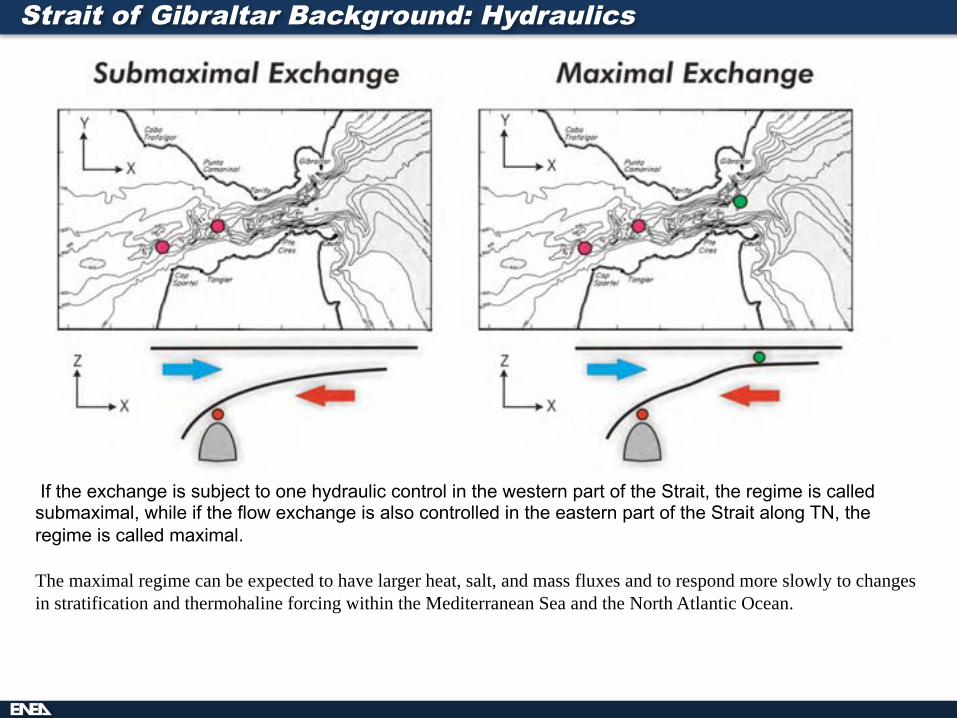
If the exchange is subject to one hydraulic control in the western part of the Strait, the regime is called submaximal, while if the flow exchange is also controlled in the eastern part of the Strait along TN, the regime is called maximal.
The maximal regime can be expected to have larger heat, salt, and mass fluxes and to respond more slowly to changes in stratification and thermohaline forcing within the Mediterranean Sea and the North Atlantic Ocean.
Strait of Gibraltar Background: Hydraulics
Workshop– Instanbul – July2012
Climate models, both global and regional, represent the
Strait of Gibraltar like a rectangular pipe & notides
NEMERTE project: Questions & Motivation
StraitofGibraltar
Workshop– Instanbul – July2012
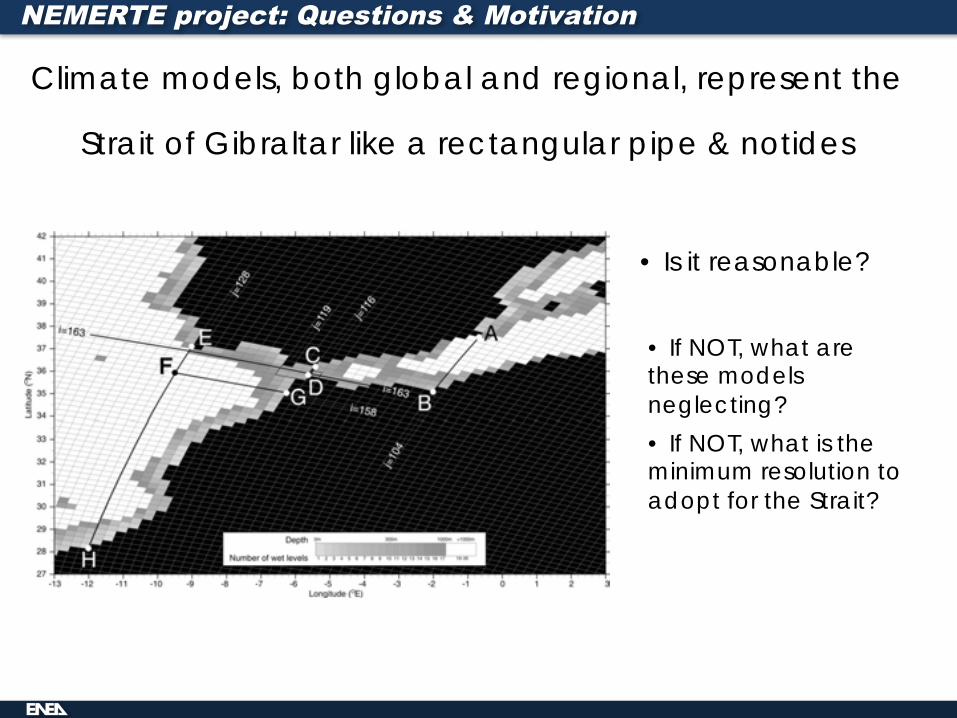
• Is it reasonable?
• If NOT, what are these modelsneglecting?• If NOT, what is the minimum resolution to adopt for the Strait?
Climate models, both global and regional, represent the
Strait of Gibraltar like a rectangular pipe & notides
NEMERTE project: Questions & Motivation
Workshop– Instanbul – July2012
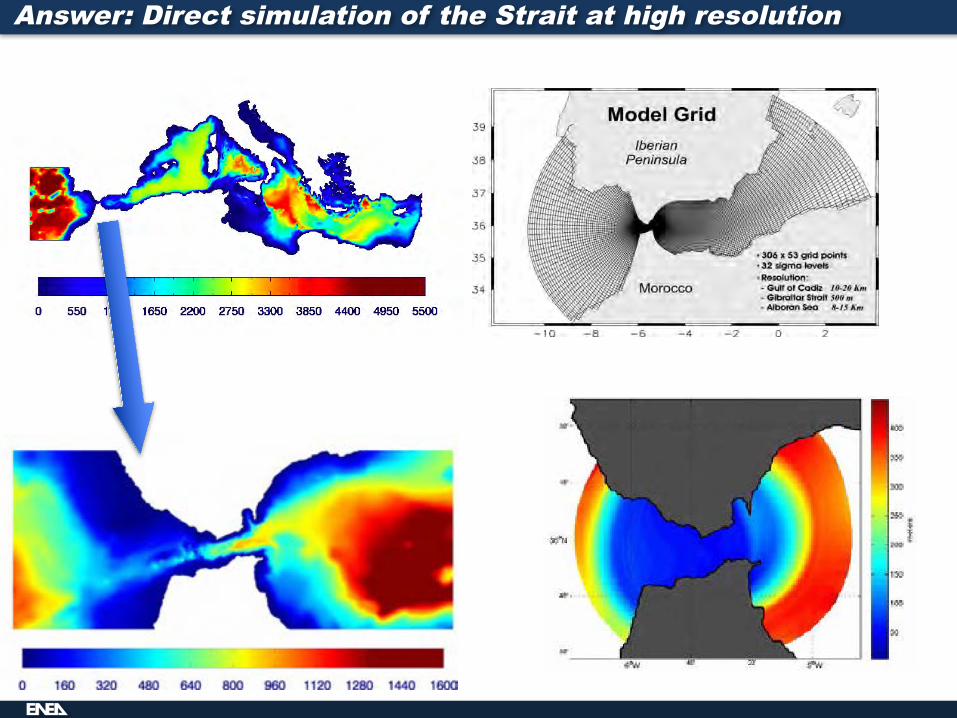
Answer: Direct simulation of the Strait at high resolution
Workshop– Instanbul – July2012
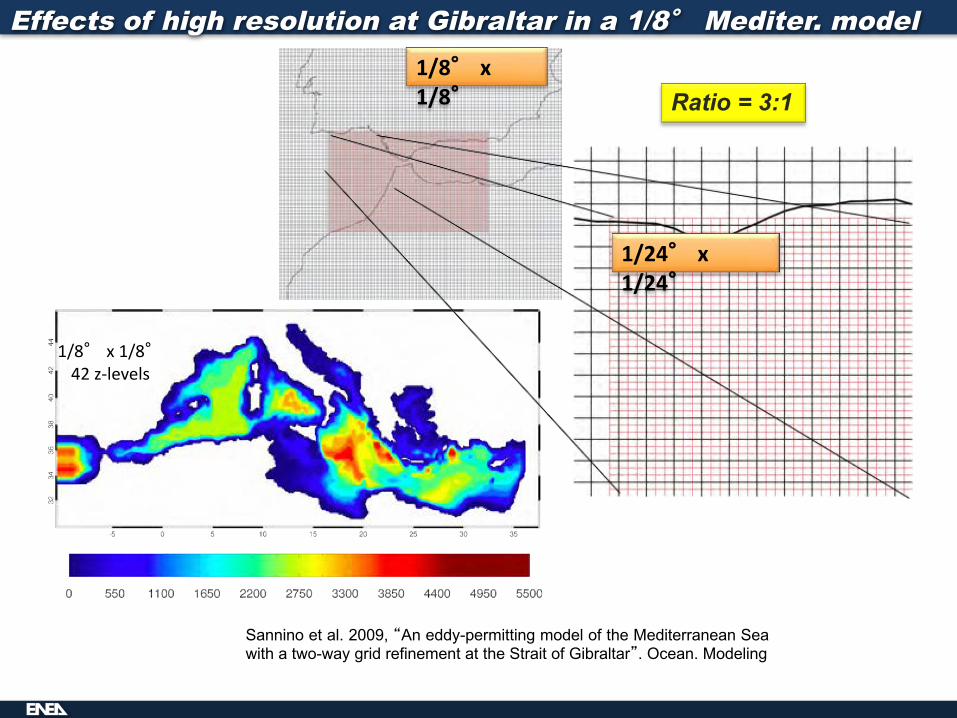
Ratio = 3:1
1/8° x1/8°42z-levels
Sannino et al. 2009, “An eddy-permitting model of the Mediterranean Seawith a two-way grid refinement at the Strait of Gibraltar”. Ocean. Modeling
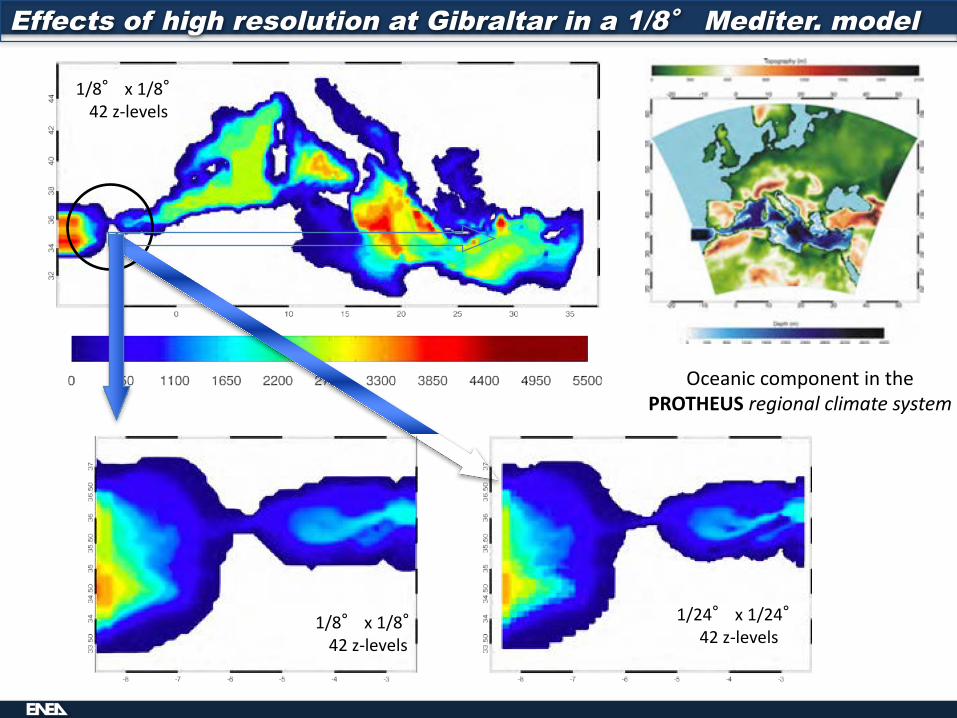
Effects of high resolution at Gibraltar in a 1/8° Mediter. model
1/24° x1/24°
1/8° x1/8°
Workshop– Instanbul – July2012
1/8° x1/8°42z-levels
1/8° x1/8°42z-levels
1/24° x1/24°42z-levels
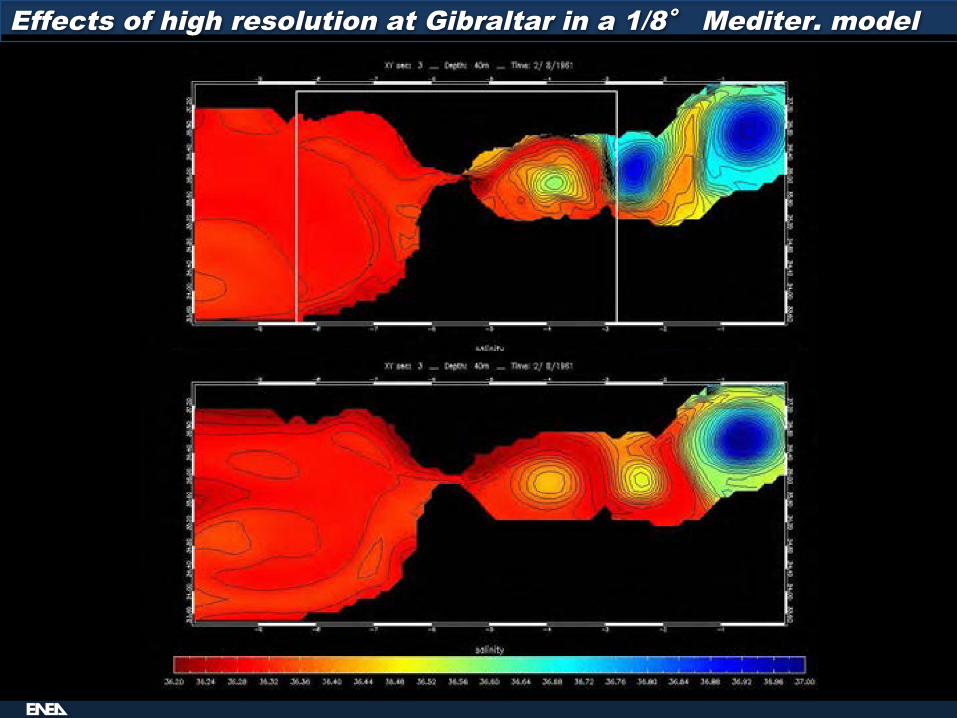
Effects of high resolution at Gibraltar in a 1/8° Mediter. model
OceaniccomponentinthePROTHEUS regionalclimatesystem
Workshop– Instanbul – July2012
Salinity field @ 40m
Effects of high resolution at Gibraltar in a 1/8° Mediter. model
Workshop– Instanbul – July2012
Sannino et al. 2009, “An eddy-permitting model of the Mediterranean Seawith a two-way grid refinement at the Strait of Gibraltar”. Ocean Modeling
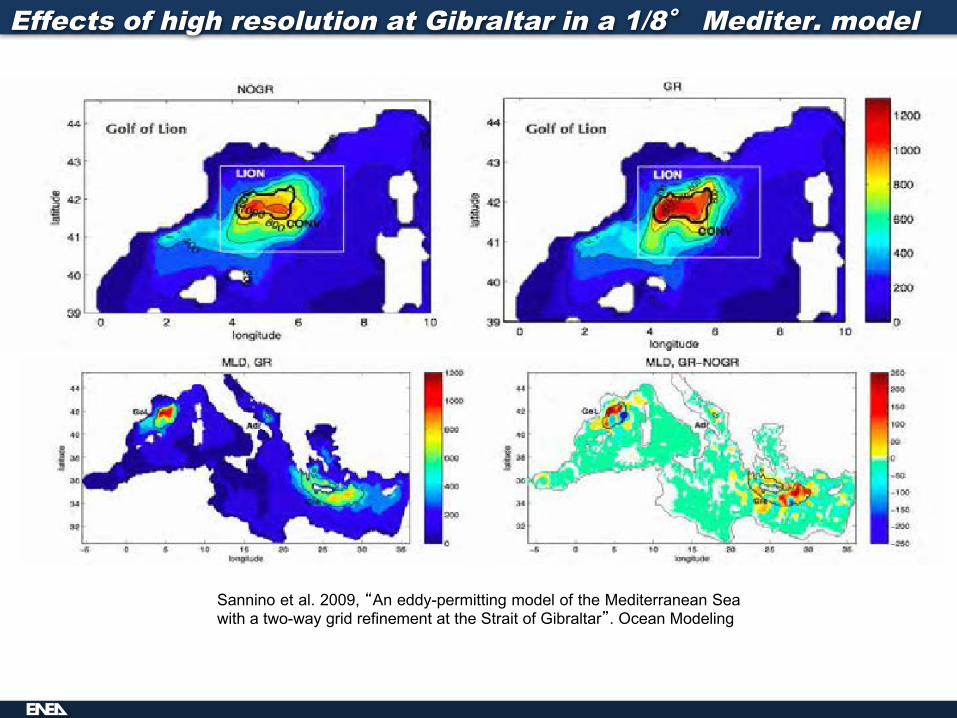
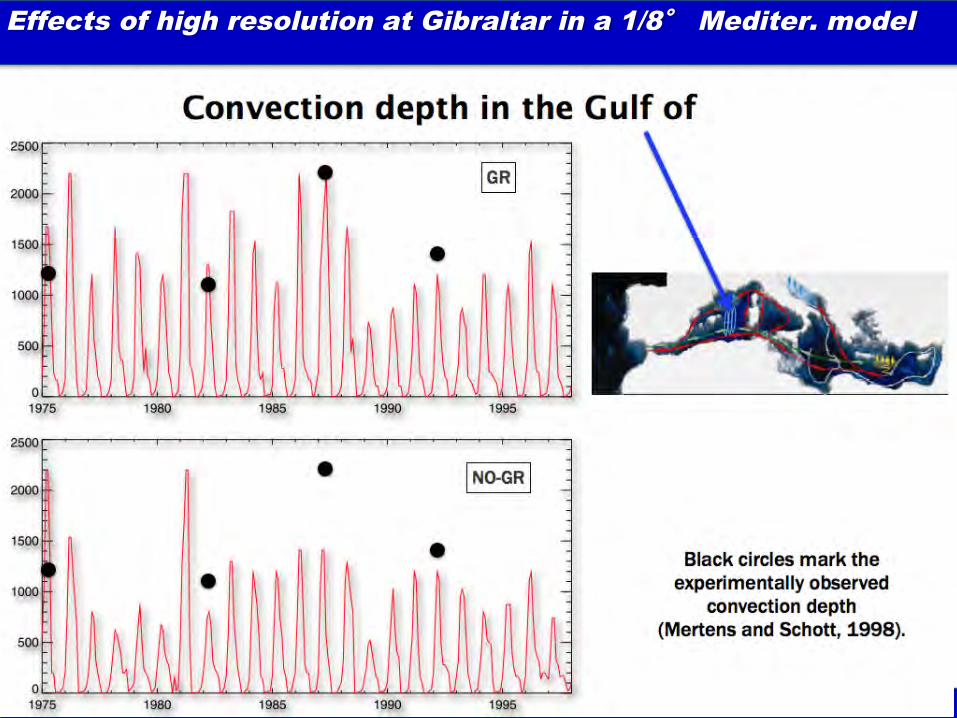
Effects of high resolution at Gibraltar in a 1/8° Mediter. model
Workshop– Instanbul – July2012
Sannino et al. 2009, “An eddy-permitting model of the Mediterranean Seawith a two-way grid refinement at the Strait of Gibraltar”. Ocean Modeling
UnresolvedissuesinMediterraneanSeaLevel
Effects of high resolution at Gibraltar in a 1/8° Mediter. model
Workshop– Instanbul – July2012
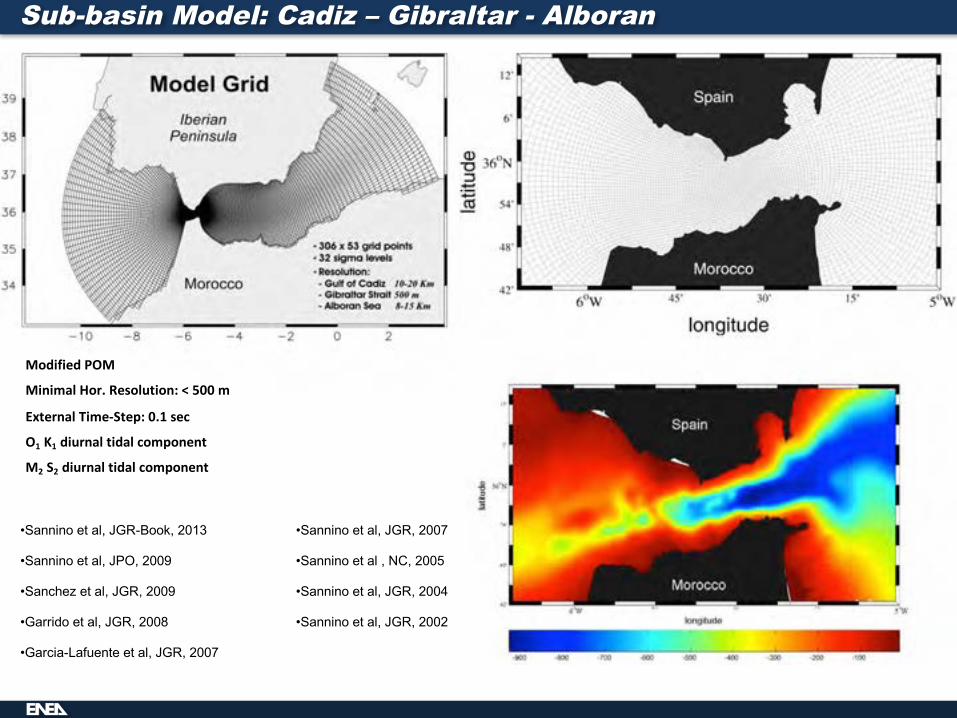
ModifiedPOM
MinimalHor.Resolution:<500m
ExternalTime-Step:0.1sec
O1 K1 diurnaltidalcomponent
M2 S2 diurnaltidalcomponent
•Sannino et al, JGR-Book, 2013
•Sannino et al, JPO, 2009
•Sanchez et al, JGR, 2009
•Garrido et al, JGR, 2008
•Garcia-Lafuente et al, JGR, 2007
•Sannino et al, JGR, 2007
•Sannino et al , NC, 2005
•Sannino et al, JGR, 2004
•Sannino et al, JGR, 2002
Sub-basin Model: Cadiz – Gibraltar - Alboran
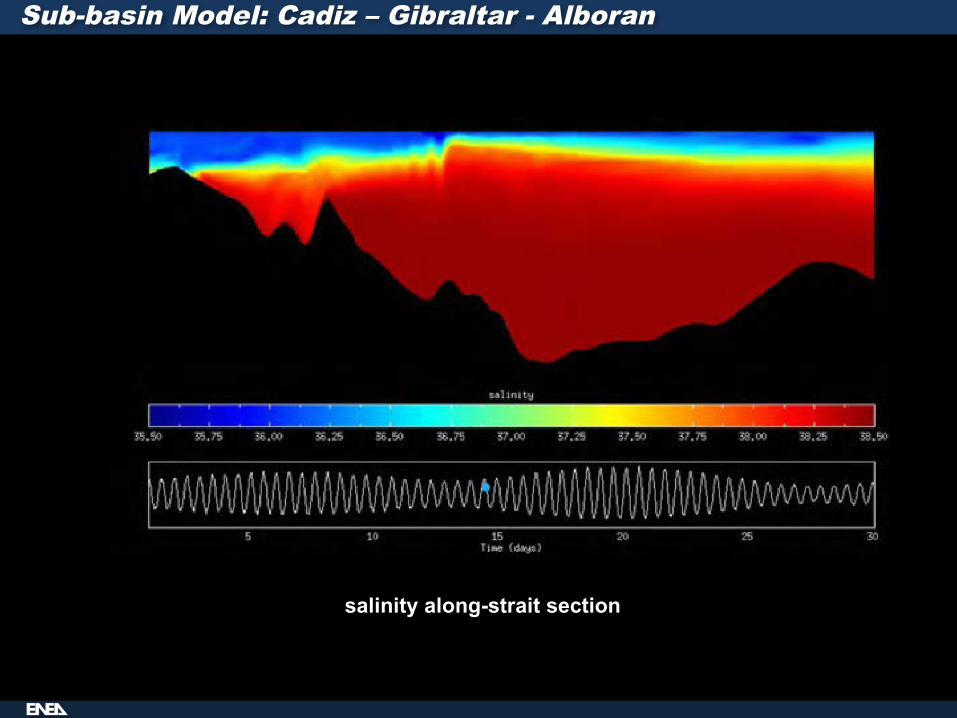
Workshop– Instanbul – July2012
salinity along-strait section
Sub-basin Model: Cadiz – Gibraltar - Alboran
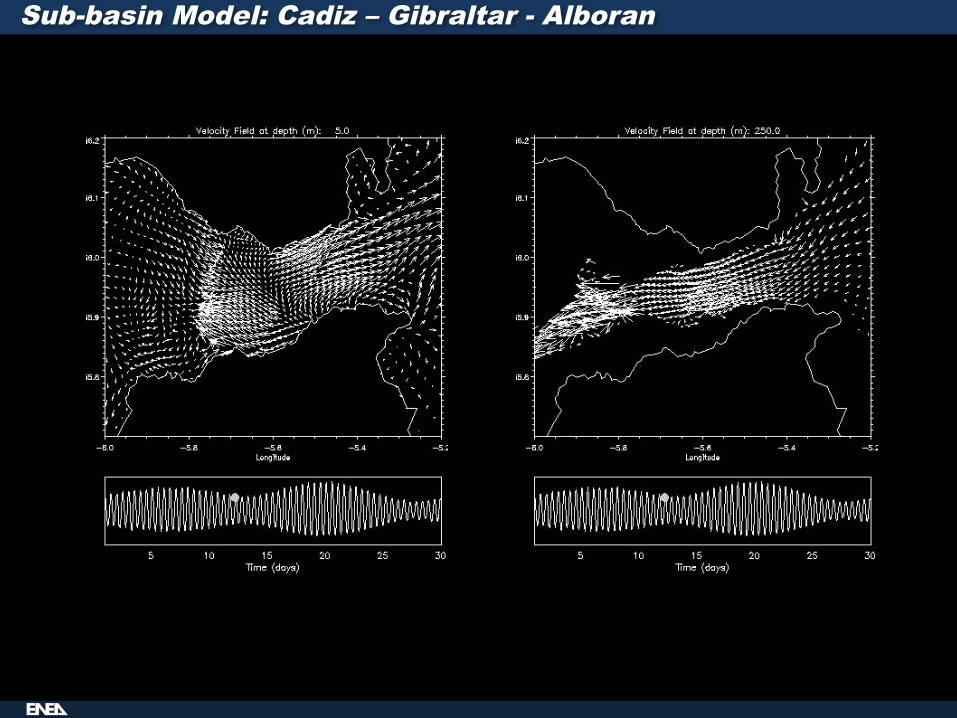
Workshop– Instanbul – July2012
Velocity @ 5 m Velocity @ 250 m
Sub-basin Model: Cadiz – Gibraltar - Alboran
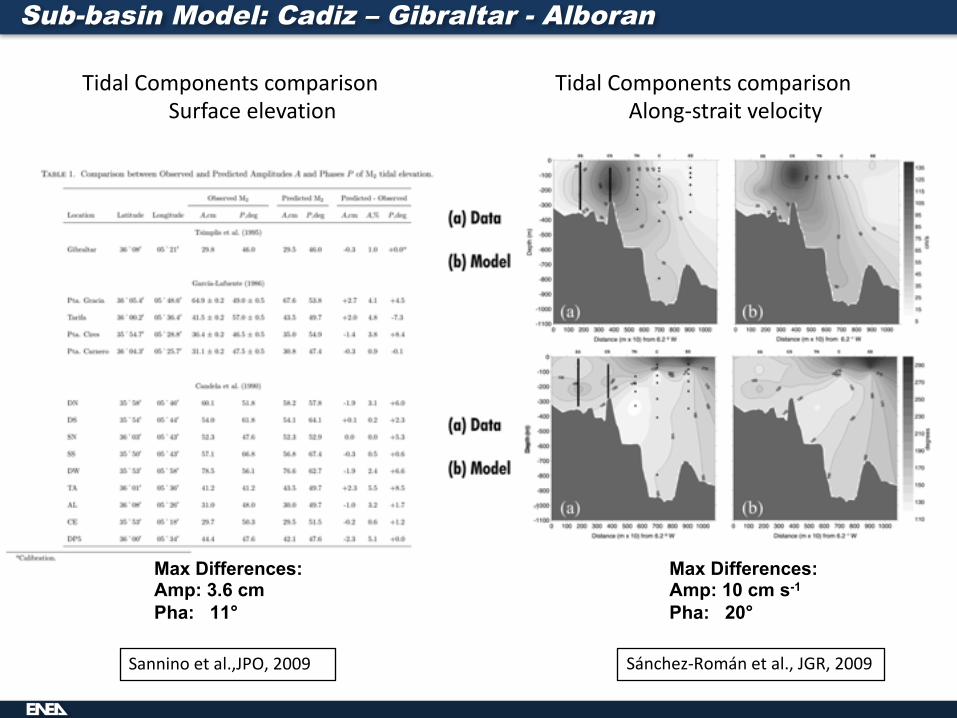
Workshop– Instanbul – July2012
Sánchez-Román etal.,JGR,2009
Max Differences:Amp: 10 cm s-1
Pha: 20°
TidalComponentscomparisonSurfaceelevation
TidalComponentscomparisonAlong-straitvelocity
Max Differences:Amp: 3.6 cmPha: 11°
Sanninoetal.,JPO,2009
Sub-basin Model: Cadiz – Gibraltar - Alboran
Workshop– Instanbul – July2012
G2 = F 21 + F 2
2
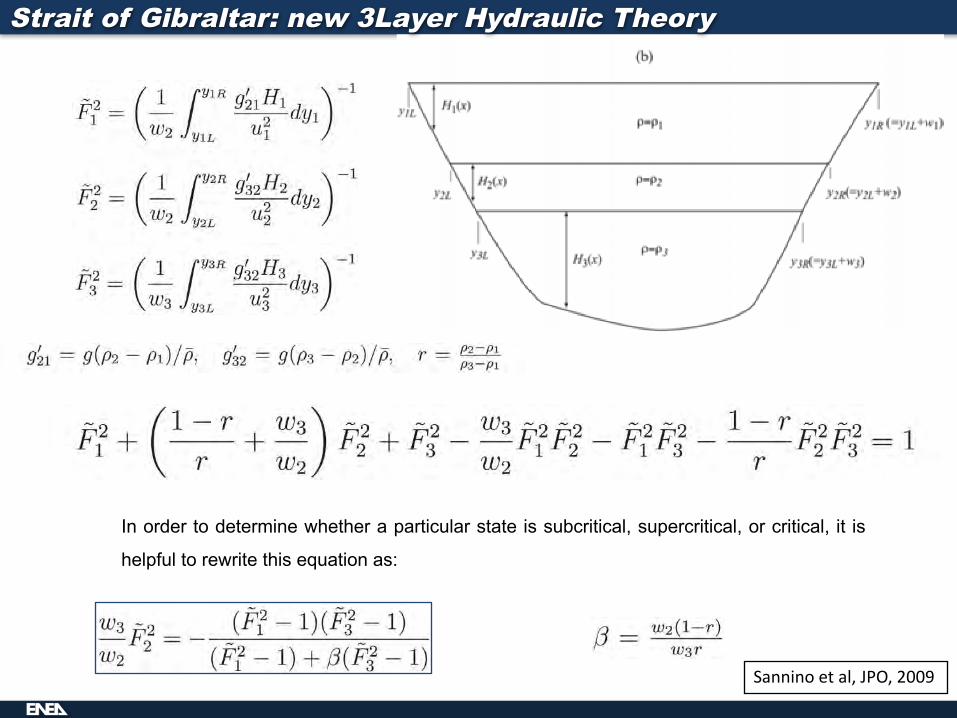
In order to determine whether a particular state is subcritical, supercritical, or critical, it is
helpful to rewrite this equation as:
where
Strait of Gibraltar: new 3Layer Hydraulic Theory
Sanninoetal,JPO,2009
Workshop– Instanbul – July2012
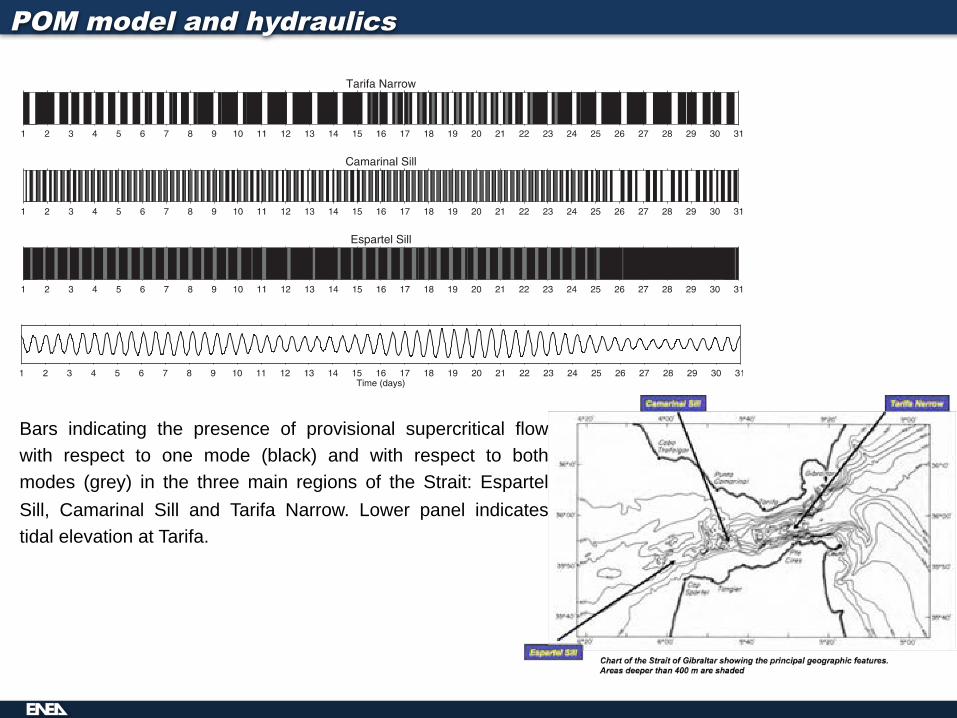
Bars indicating the presence of provisional supercritical flowwith respect to one mode (black) and with respect to bothmodes (grey) in the three main regions of the Strait: EspartelSill, Camarinal Sill and Tarifa Narrow. Lower panel indicatestidal elevation at Tarifa.
POM model and hydraulics
Workshop– Instanbul – July2012
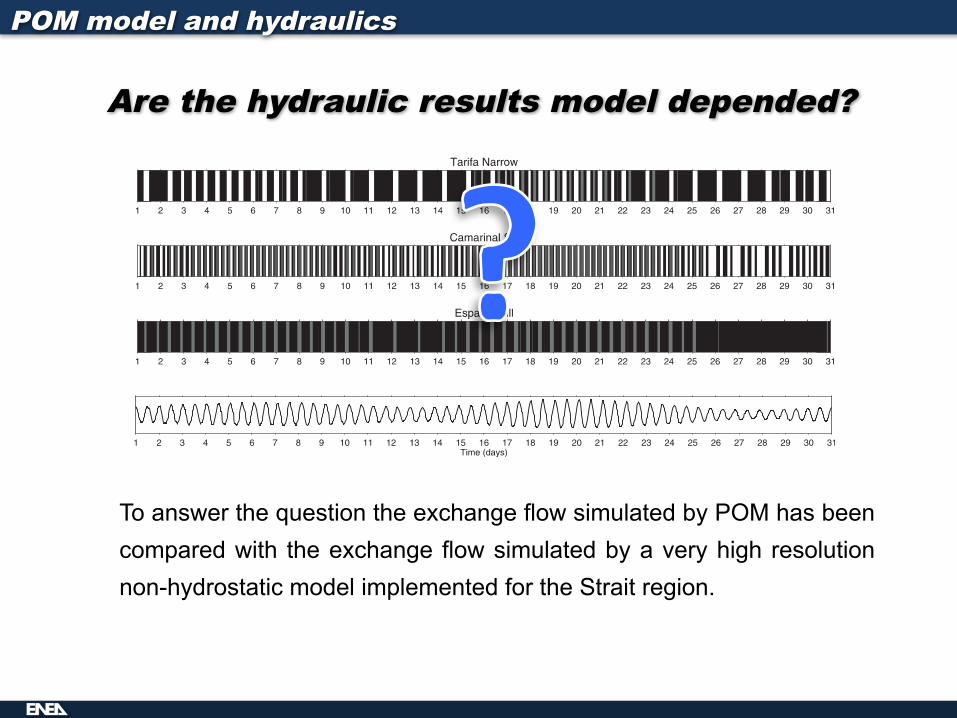
Are the hydraulic results model depended?
To answer the question the exchange flow simulated by POM has beencompared with the exchange flow simulated by a very high resolutionnon-hydrostatic model implemented for the Strait region.
POM model and hydraulics
Workshop– Instanbul – July2012
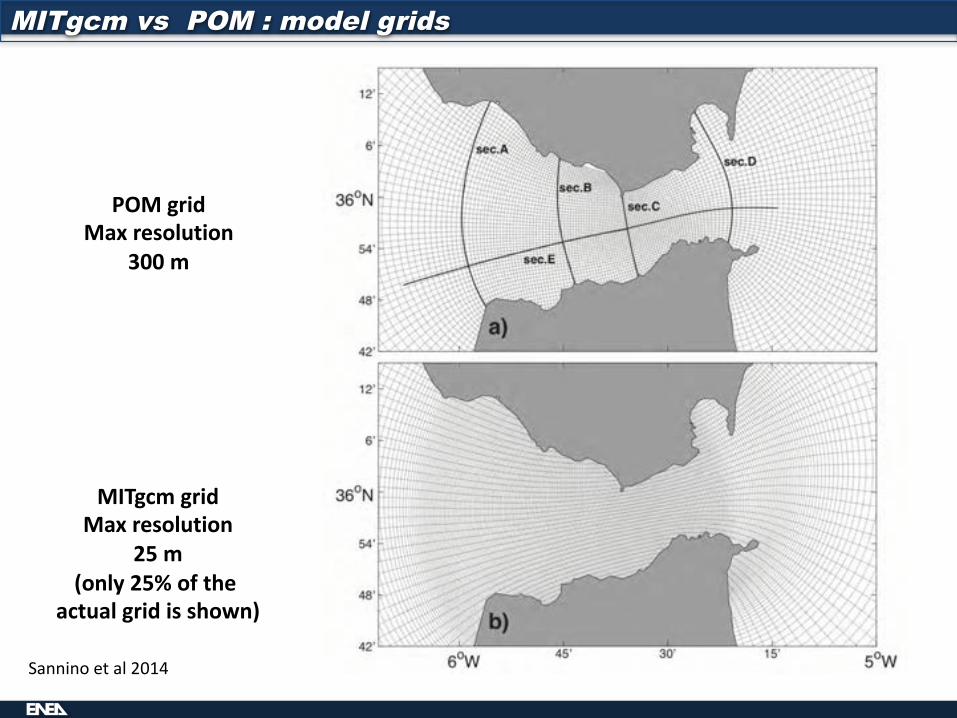
MITgcm vs POM : model grids
POMgridMaxresolution
300m
MITgcmgridMaxresolution
25m(only25%ofthe
actualgridisshown)
Sanninoetal2014
Workshop– Instanbul – July2012
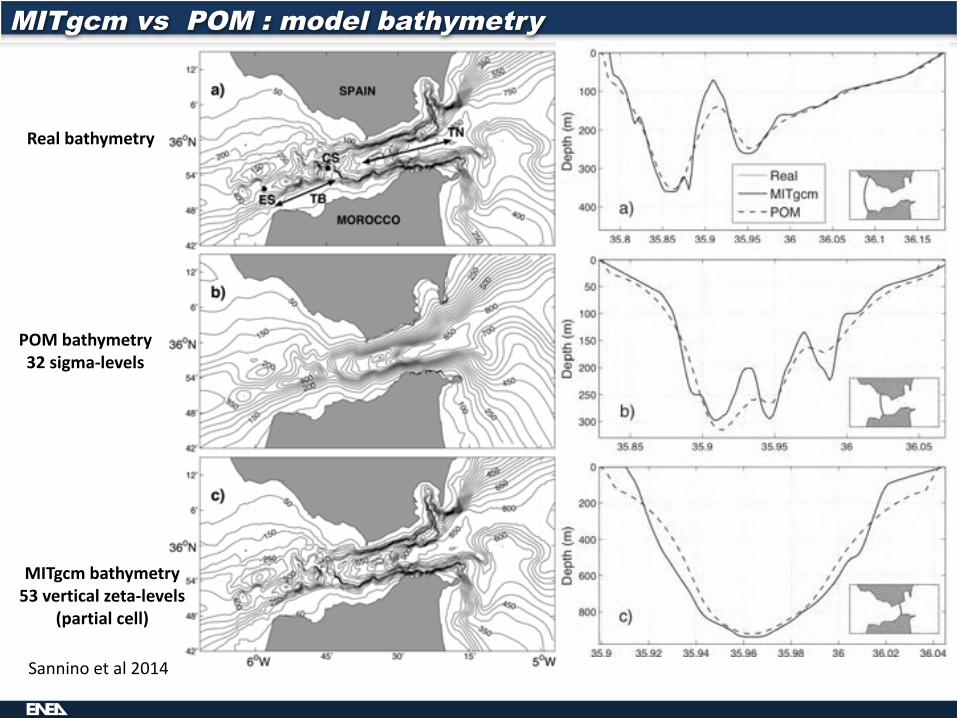
MITgcm vs POM : model bathymetry
Realbathymetry
POMbathymetry32sigma-levels
MITgcmbathymetry53verticalzeta-levels
(partialcell)
Sanninoetal2014
Workshop– Instanbul – July2012
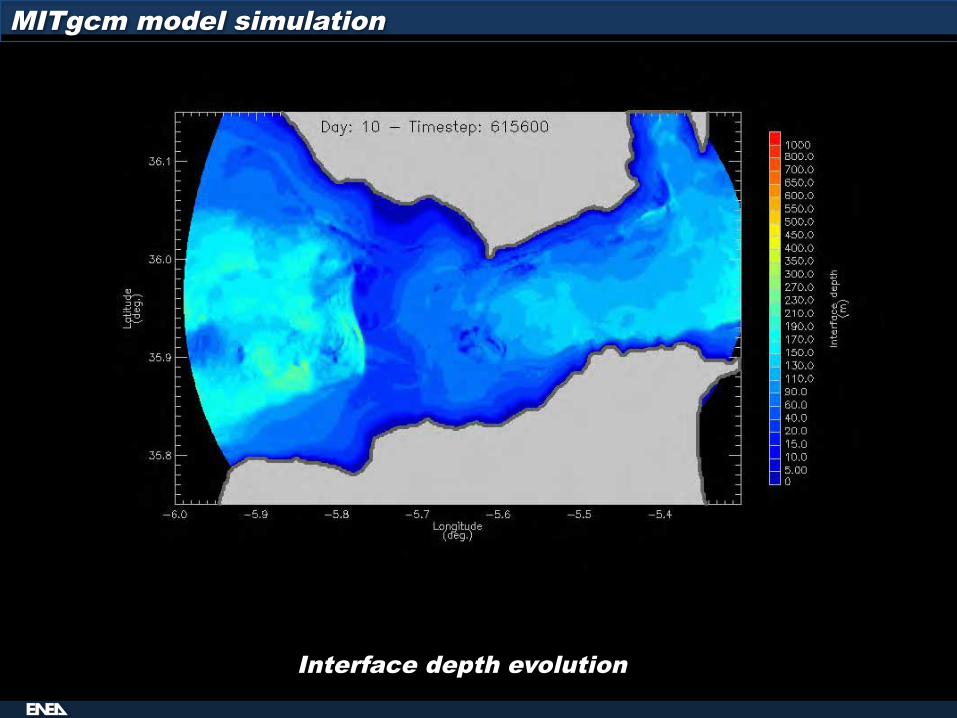
MITgcm model simulation
Interface depth evolution
Workshop– Instanbul – July2012
POM MITgcm
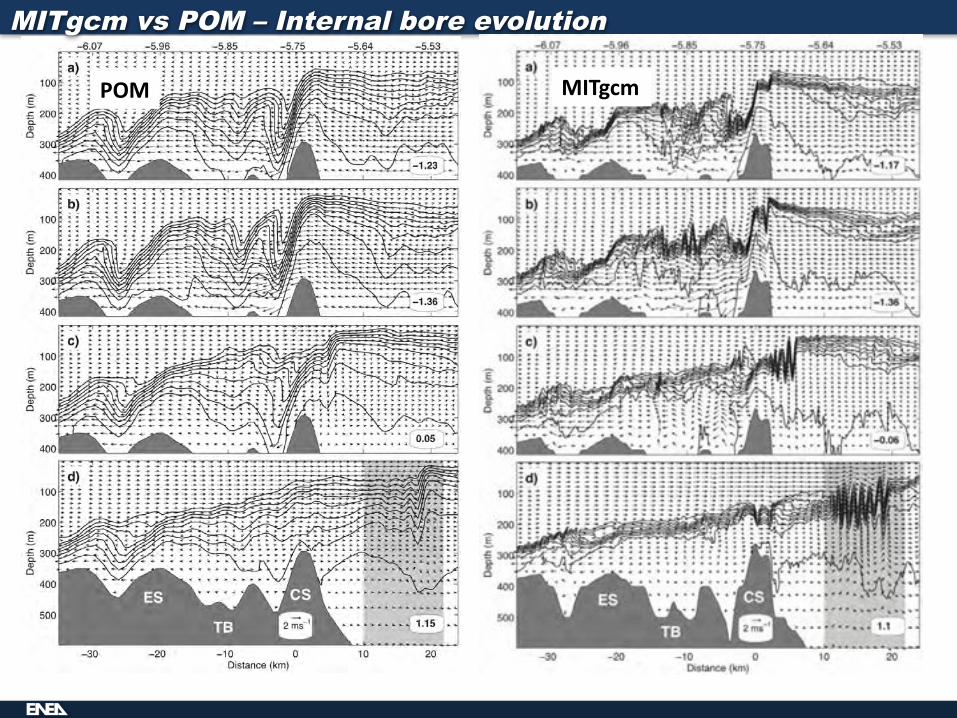
MITgcm vs POM – Internal bore evolution
Workshop– Instanbul – July2012
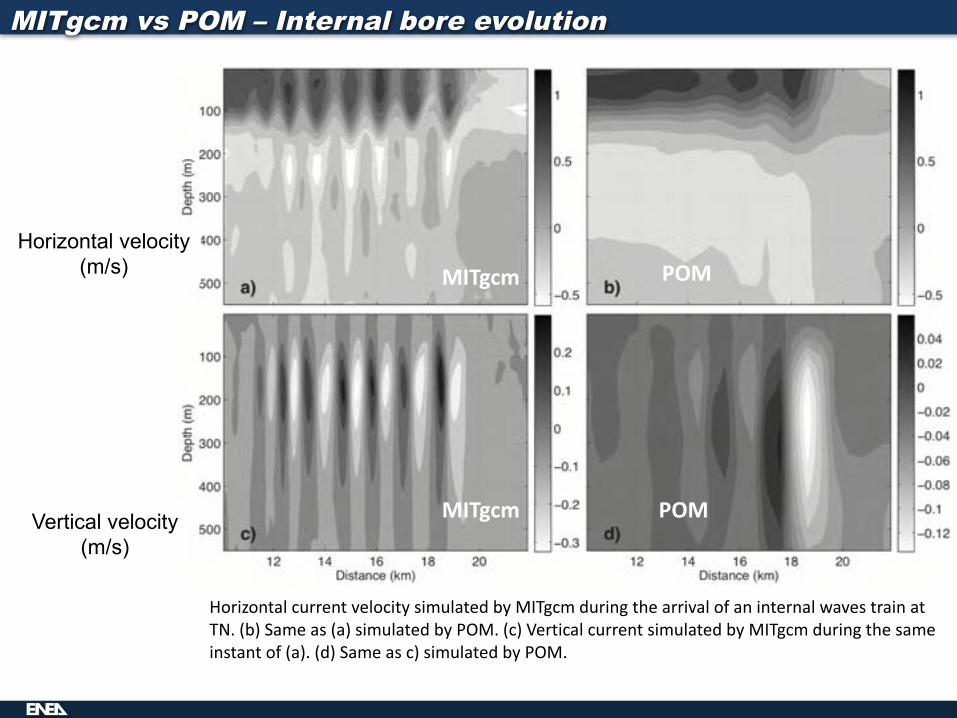
MITgcm vs POM – Internal bore evolution
Horizontal velocity(m/s)
MITgcm POMVertical velocity(m/s)
MITgcm POM
HorizontalcurrentvelocitysimulatedbyMITgcmduringthearrivalofaninternalwavestrainatTN.(b)Sameas(a)simulatedbyPOM.(c)VerticalcurrentsimulatedbyMITgcmduringthesameinstantof(a).(d)Sameasc)simulatedbyPOM.

Workshop– Instanbul – July2012
POM MITgcm
MITgcm vs POM – Internal bore evolution
Workshop– Instanbul – July2012
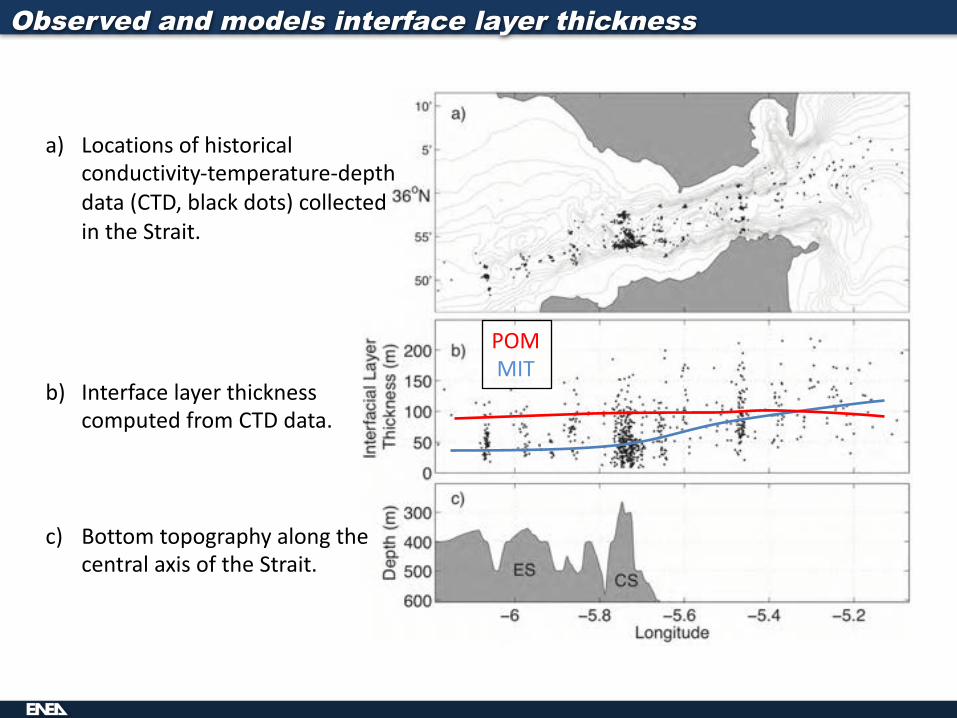
Observed and models interface layer thickness
a) Locationsofhistoricalconductivity-temperature-depthdata(CTD,blackdots)collectedintheStrait.
b) InterfacelayerthicknesscomputedfromCTDdata.
c) BottomtopographyalongthecentralaxisoftheStrait.
POMMIT
Workshop– Instanbul – July2012
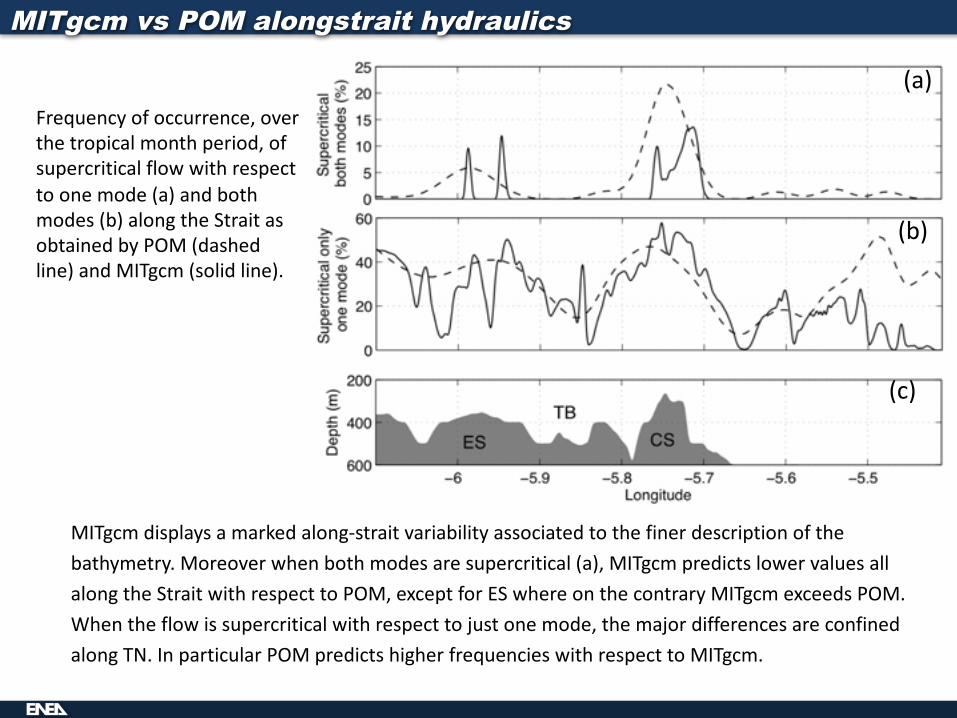
MITgcm vs POM alongstrait hydraulics
Frequencyofoccurrence,overthetropicalmonthperiod,ofsupercriticalflowwithrespecttoonemode(a)andbothmodes(b)alongtheStraitasobtainedbyPOM(dashedline)andMITgcm (solidline).
MITgcm displaysamarkedalong-straitvariabilityassociatedtothefinerdescriptionofthebathymetry.Moreoverwhenbothmodesaresupercritical(a),MITgcm predictslowervaluesallalongtheStraitwithrespecttoPOM,exceptforESwhereonthecontraryMITgcm exceedsPOM.Whentheflowissupercriticalwithrespecttojustonemode,themajordifferencesareconfinedalongTN.InparticularPOMpredictshigherfrequencieswithrespecttoMITgcm.
(a)
(b)
(c)
Workshop– Instanbul – July2012
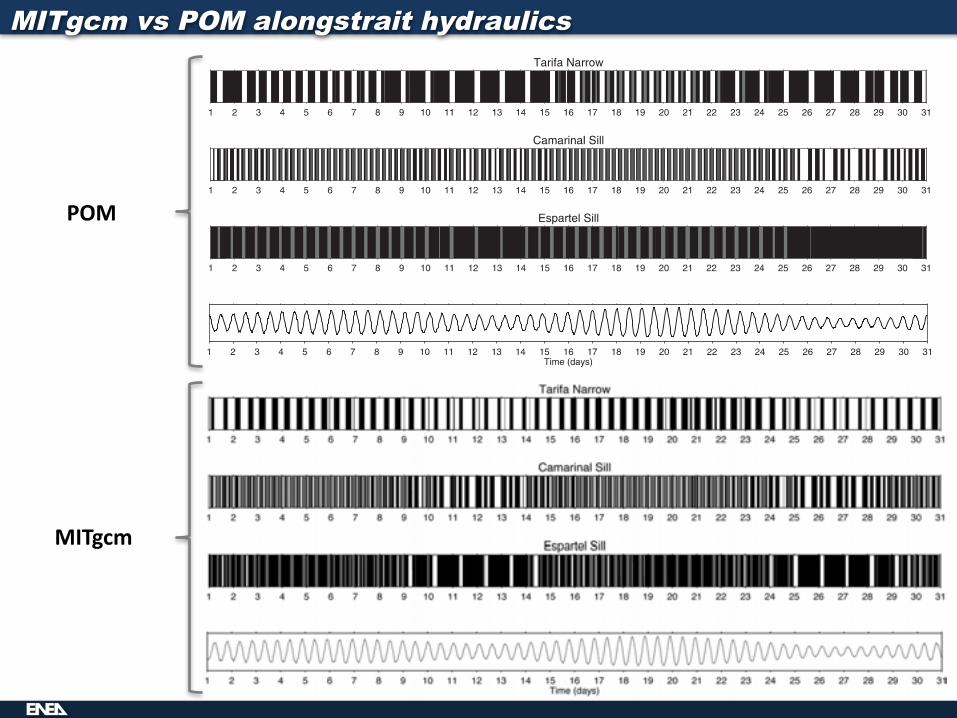
MITgcm vs POM alongstrait hydraulics
POM
MITgcm
Workshop– Instanbul – July2012
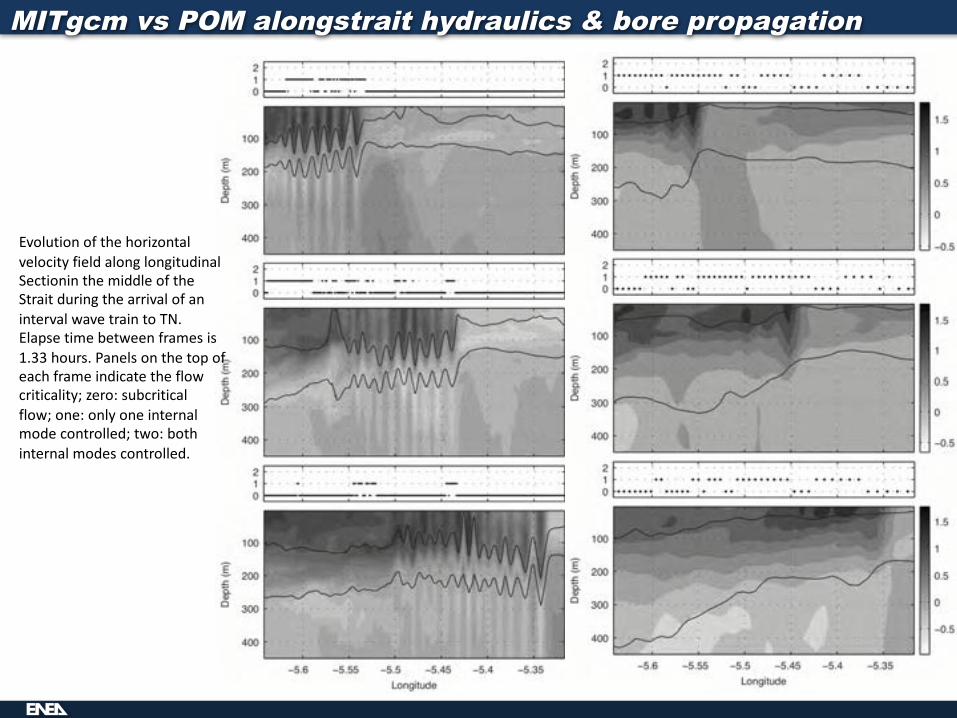
EvolutionofthehorizontalvelocityfieldalonglongitudinalSectionin themiddleoftheStraitduringthearrivalofanintervalwavetraintoTN.Elapsetimebetweenframesis1.33hours.Panelsonthetopofeachframeindicatetheflowcriticality;zero:subcriticalflow;one:onlyoneinternalmodecontrolled;two:bothinternalmodescontrolled.
MITgcm vs POM alongstrait hydraulics & bore propagation
Workshop– Instanbul – July2012
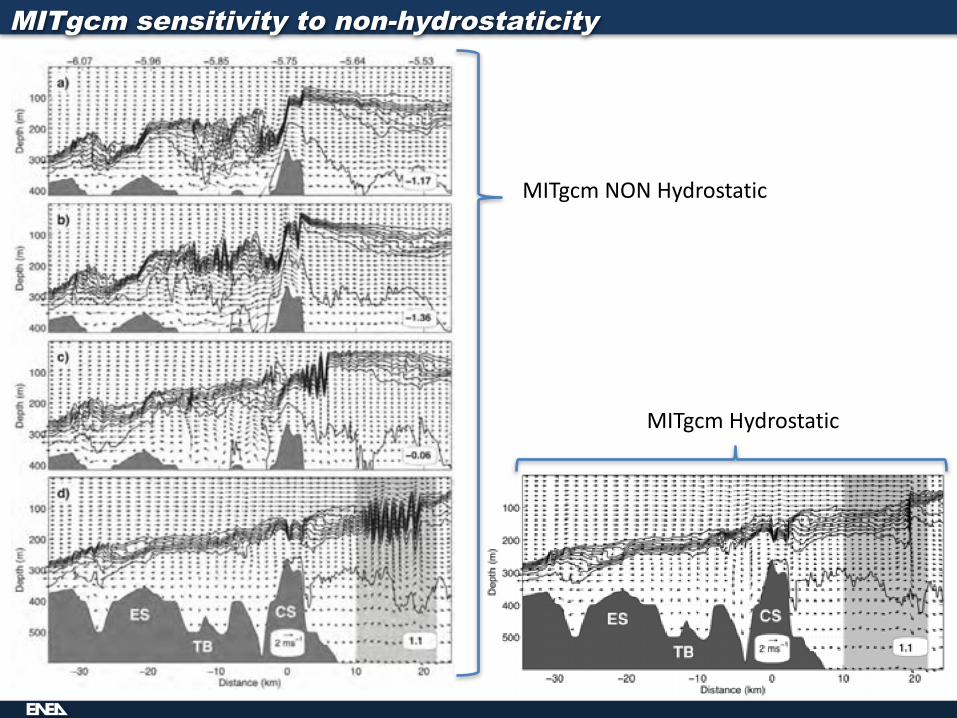
MITgcm sensitivity to non-hydrostaticity
MITgcmNONHydrostatic
MITgcmHydrostatic
Workshop– Instanbul – July2012
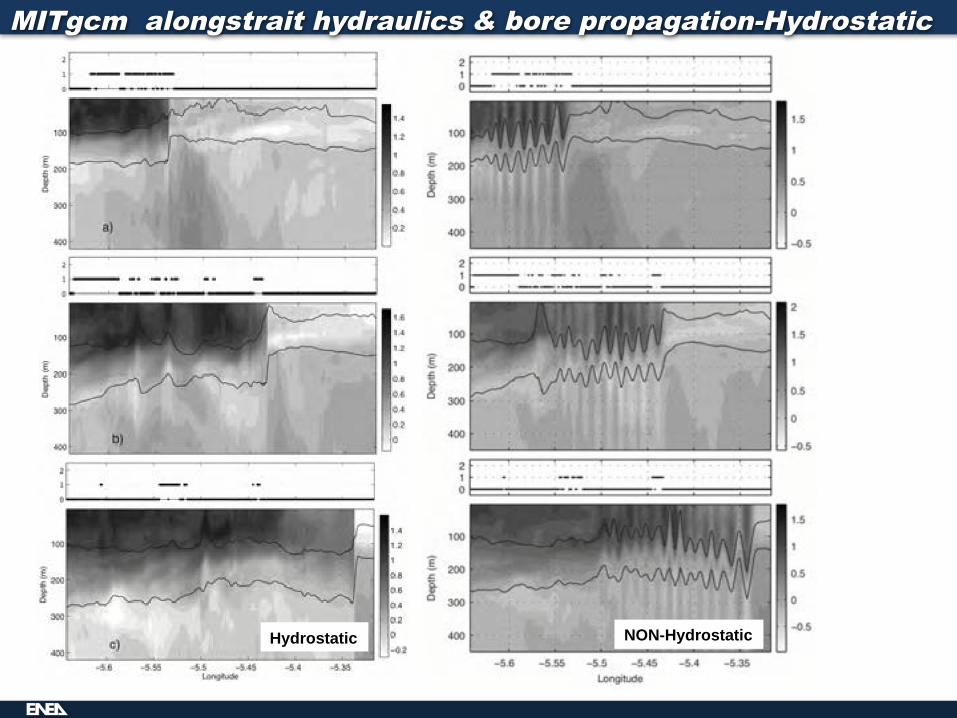
MITgcm alongstrait hydraulics & bore propagation-Hydrostatic
Hydrostatic NON-Hydrostatic
Workshop– Instanbul – July2012
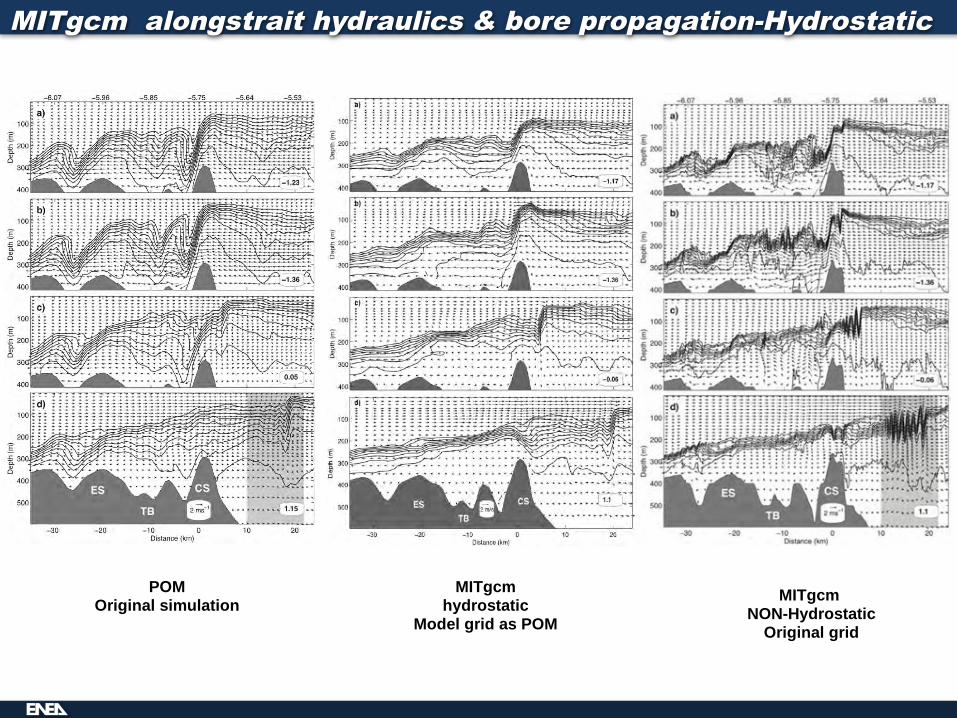
MITgcm alongstrait hydraulics & bore propagation-Hydrostatic
POMOriginal simulation MITgcm
NON-HydrostaticOriginal grid
MITgcmhydrostatic
Model grid as POM
Workshop– Instanbul – July2012
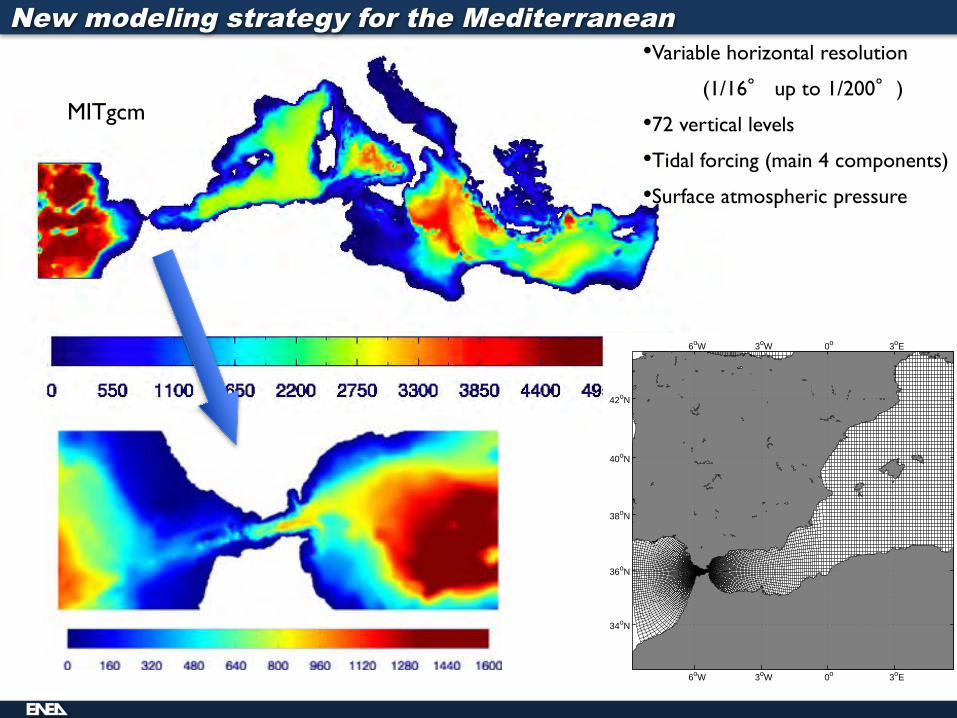
•Variable horizontal resolution
(1/16° up to 1/200°)
•72 vertical levels
•Tidal forcing (main 4 components)
•Surface atmospheric pressure
MITgcm
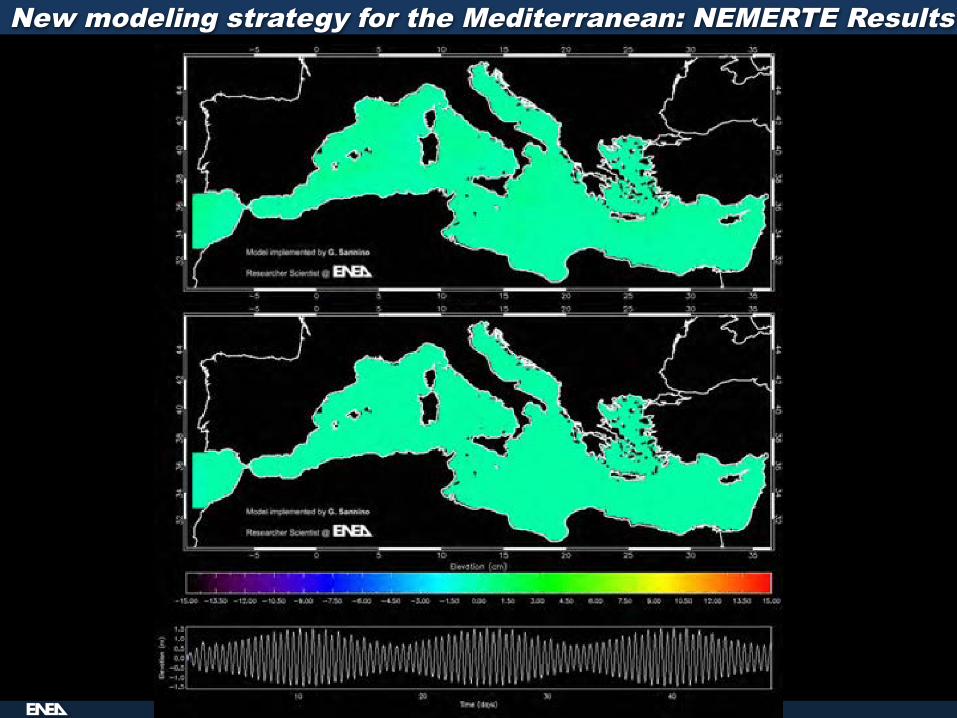
New modeling strategy for the Mediterranean
X - 6 SANNINO ET AL.: SHORT TITLE
6oW 3oW 0o 3oE
34oN
36oN
38oN
40oN
42oN
6oW 3oW 0o 3oE
34oN
36oN
38oN
40oN
42oN
Figure 2: Model grid over the Western Mediterranean Sea.
10 20 30 40 50 60Time (Days)
−3−2
−1
0
1
23
Tran
spor
t (Sv
)
10 20 30 40 50 60Time (Days)
−3−2
−1
0
1
23
Tran
spor
t (Sv
)
10 20 30 40 50 60Time (Days)
−3−2
−1
0
1
23
Tran
spor
t (Sv
)
10 20 30 40 50 60Time (Days)
−3−2
−1
0
1
23
Tran
spor
t (Sv
)
Figure 3: Atlantic (black) and Mediterranean (gray) transports computed from the tidal simulation for section at 6.22◦W(upper panel), 5.76◦W (middle panel) and 5.33◦W (lower panel).
Workshop– Instanbul – July2012
New modeling strategy for the Mediterranean: NEMERTE Results
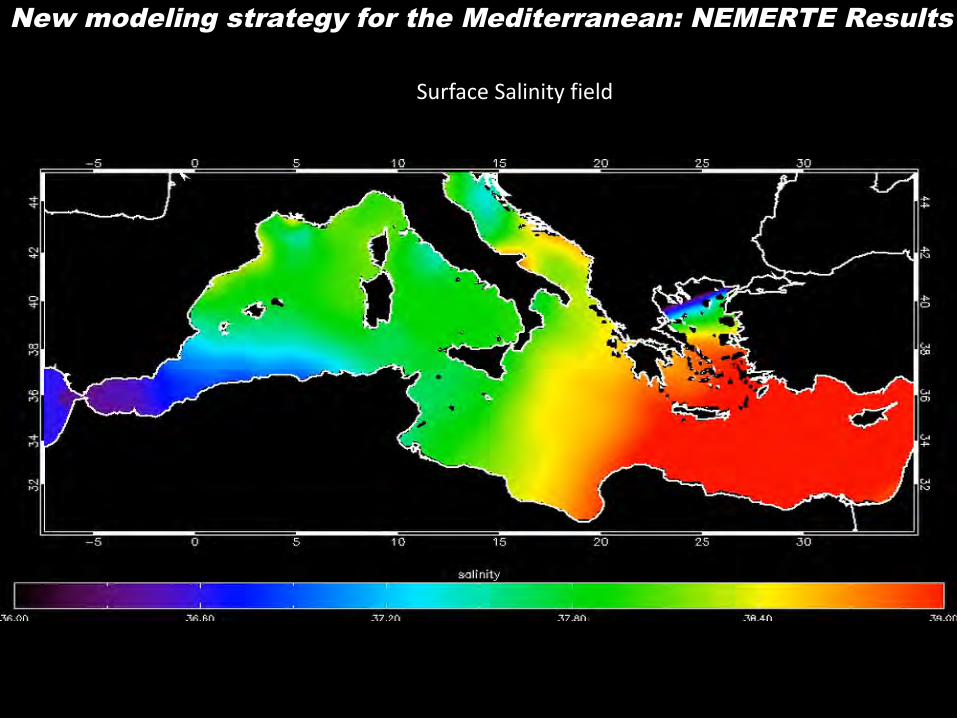
New modeling strategy for the Mediterranean: NEMERTE Results
SurfaceSalinityfield
Workshop– Instanbul – July2012
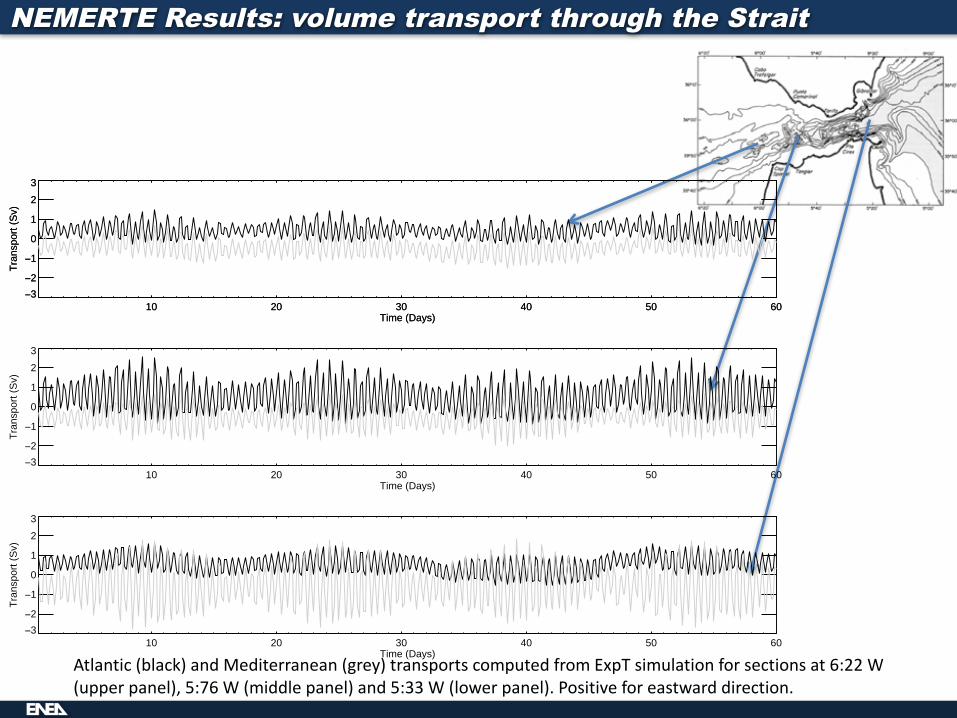
Atlantic(black)andMediterranean(grey)transportscomputedfromExpT simulationforsectionsat6:22W(upperpanel),5:76W(middlepanel)and5:33W(lowerpanel).Positiveforeastwarddirection.
NEMERTE Results: volume transport through the Strait
10 20 30 40 50 60Time (Days)
−3−2−1
0123
Tran
spor
t (Sv
)
10 20 30 40 50 60Time (Days)
−3−2−1
0123
Tran
spor
t (Sv
)
10 20 30 40 50 60Time (Days)
−3−2−1
0123
Tran
spor
t (Sv
)
10 20 30 40 50 60Time (Days)
−3−2−1
0123
Tran
spor
t (Sv
)
Workshop– Instanbul – July2012
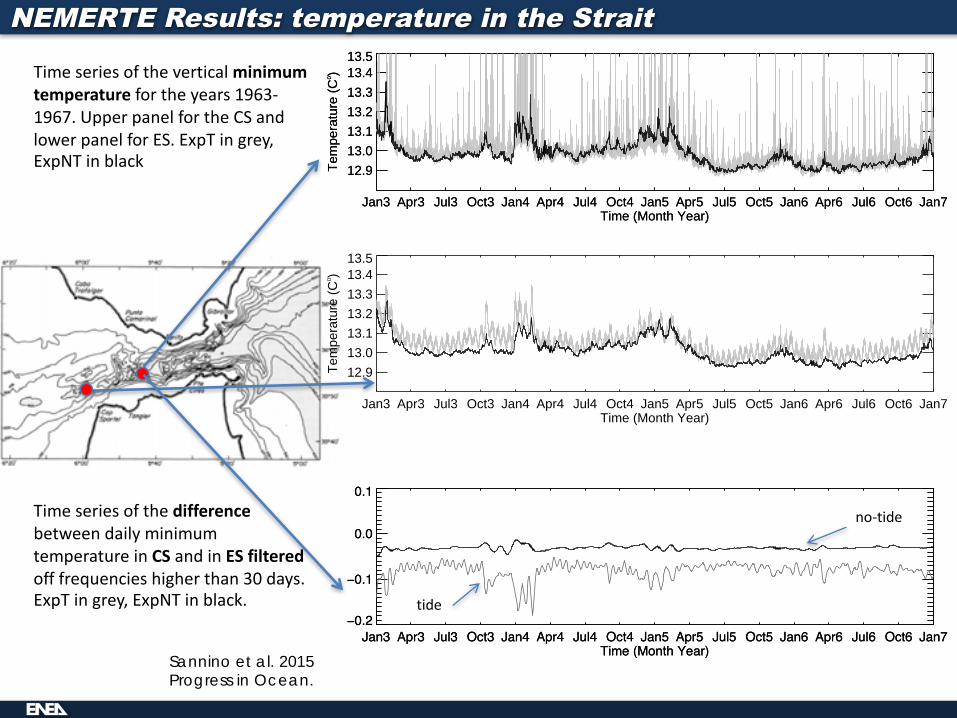
NEMERTE Results: temperature in the Strait
Timeseriesoftheverticalminimumtemperature fortheyears1963-1967.UpperpanelfortheCSandlowerpanelforES.ExpT ingrey,ExpNT inblack
Jan3 Apr3 Jul3 Oct3 Jan4 Apr4 Jul4 Oct4 Jan5 Apr5 Jul5 Oct5 Jan6 Apr6 Jul6 Oct6 Jan7Time (Month Year)
12.913.013.113.213.313.413.5
Tem
pera
ture
(C0 )
Jan3 Apr3 Jul3 Oct3 Jan4 Apr4 Jul4 Oct4 Jan5 Apr5 Jul5 Oct5 Jan6 Apr6 Jul6 Oct6 Jan7Time (Month Year)
12.913.013.113.213.313.413.5
Tem
pera
ture
(C0 )
Jan3 Apr3 Jul3 Oct3 Jan4 Apr4 Jul4 Oct4 Jan5 Apr5 Jul5 Oct5 Jan6 Apr6 Jul6 Oct6 Jan7Time (Month Year)
12.913.013.113.213.313.413.5
Tem
pera
ture
(C0 )
TimeseriesofthedifferencebetweendailyminimumtemperatureinCSandinES filteredofffrequencieshigherthan30days.ExpT ingrey,ExpNT inblack.
Jan3 Apr3 Jul3 Oct3 Jan4 Apr4 Jul4 Oct4 Jan5 Apr5 Jul5 Oct5 Jan6 Apr6 Jul6 Oct6 Jan7Time (Month Year)
−0.2
−0.1
0.0
0.1
Jan3 Apr3 Jul3 Oct3 Jan4 Apr4 Jul4 Oct4 Jan5 Apr5 Jul5 Oct5 Jan6 Apr6 Jul6 Oct6 Jan7Time (Month Year)
−0.2
−0.1
0.0
0.1
tide
no-tide
Sannino et al. 2015 Progress in Ocean.
Workshop– Instanbul – July2012
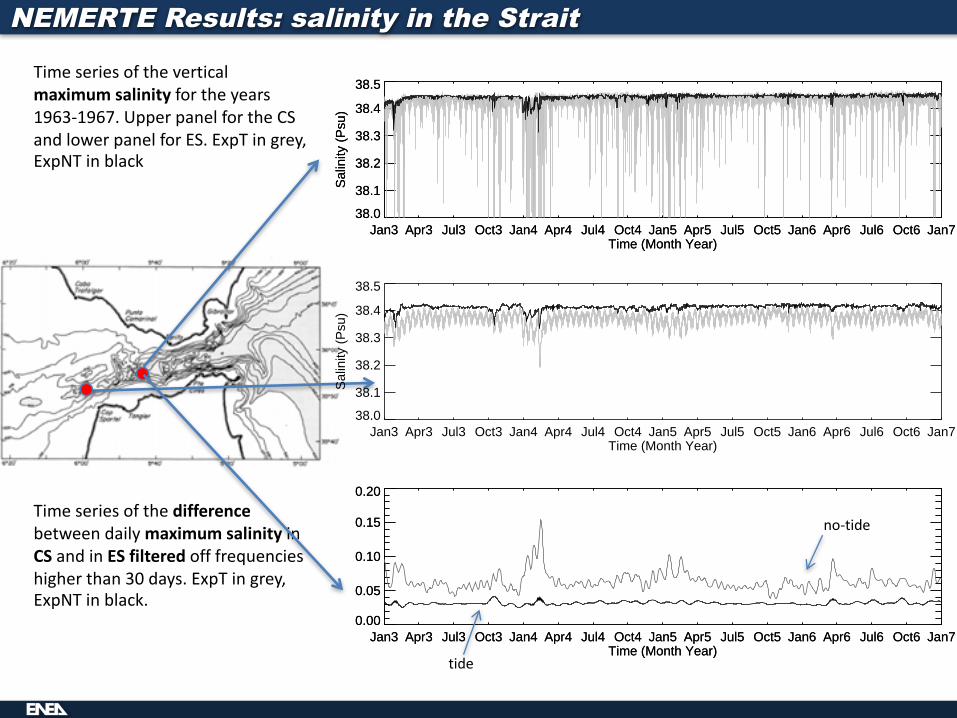
NEMERTE Results: salinity in the Strait
Timeseriesoftheverticalmaximumsalinity fortheyears1963-1967.UpperpanelfortheCSandlowerpanelforES.ExpT ingrey,ExpNT inblack
Jan3 Apr3 Jul3 Oct3 Jan4 Apr4 Jul4 Oct4 Jan5 Apr5 Jul5 Oct5 Jan6 Apr6 Jul6 Oct6 Jan7Time (Month Year)
0.00
0.05
0.10
0.15
0.20
Jan3 Apr3 Jul3 Oct3 Jan4 Apr4 Jul4 Oct4 Jan5 Apr5 Jul5 Oct5 Jan6 Apr6 Jul6 Oct6 Jan7Time (Month Year)
0.00
0.05
0.10
0.15
0.20TimeseriesofthedifferencebetweendailymaximumsalinityinCSandinES filtered offfrequencieshigherthan30days.ExpT ingrey,ExpNT inblack.
Jan3 Apr3 Jul3 Oct3 Jan4 Apr4 Jul4 Oct4 Jan5 Apr5 Jul5 Oct5 Jan6 Apr6 Jul6 Oct6 Jan7Time (Month Year)
38.038.1
38.2
38.3
38.4
38.5
Salin
ity (P
su)
Jan3 Apr3 Jul3 Oct3 Jan4 Apr4 Jul4 Oct4 Jan5 Apr5 Jul5 Oct5 Jan6 Apr6 Jul6 Oct6 Jan7Time (Month Year)
38.038.1
38.2
38.3
38.4
38.5
Salin
ity (P
su)
Jan3 Apr3 Jul3 Oct3 Jan4 Apr4 Jul4 Oct4 Jan5 Apr5 Jul5 Oct5 Jan6 Apr6 Jul6 Oct6 Jan7Time (Month Year)
38.038.1
38.2
38.3
38.4
38.5
Salin
ity (P
su)
tide
no-tide
Workshop– Instanbul – July2012
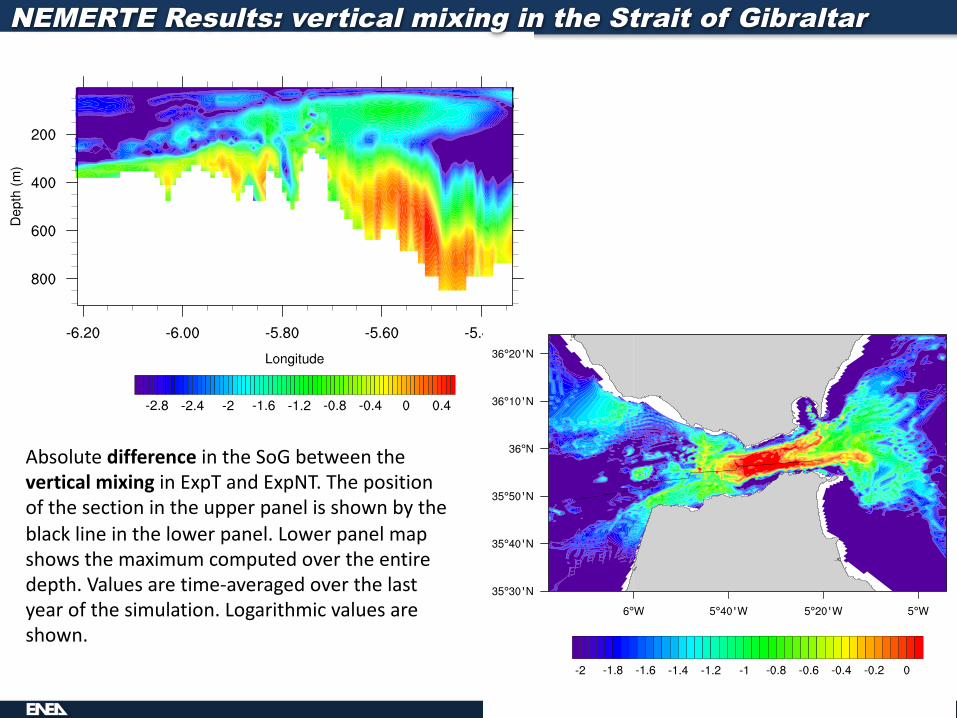
Absolutedifference intheSoGbetweentheverticalmixinginExpT andExpNT.Thepositionofthesectionintheupperpanelisshownbytheblacklineinthelowerpanel.Lowerpanelmapshowsthemaximumcomputedovertheentiredepth.Valuesaretime-averagedoverthelastyearofthesimulation.Logarithmicvaluesareshown.
NEMERTE Results: vertical mixing in the Strait of Gibraltar
Workshop– Instanbul – July2012
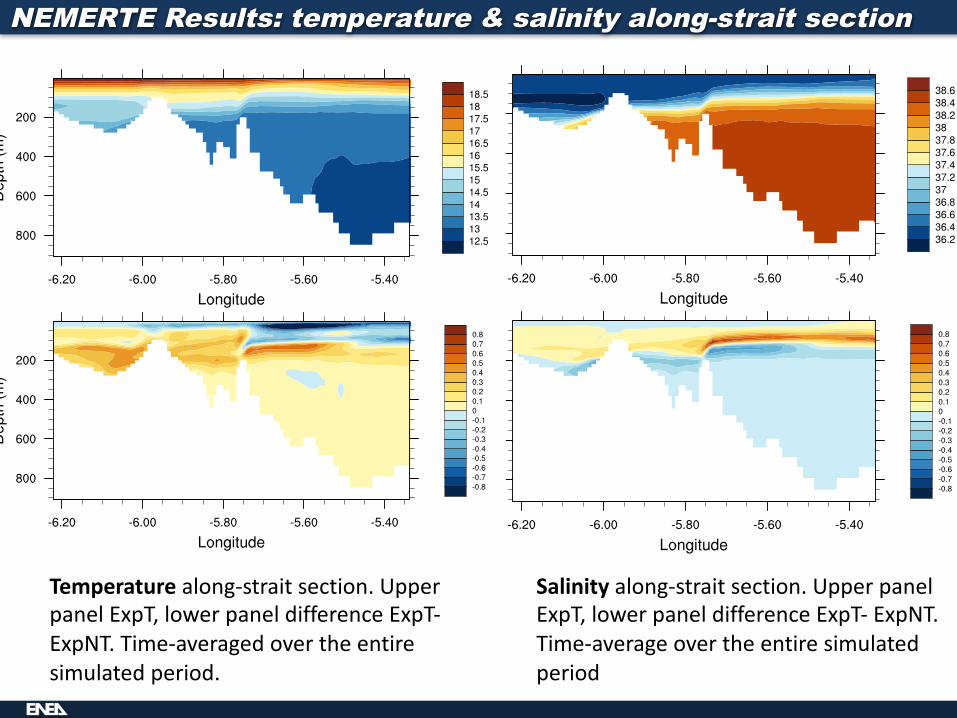
Salinity along-straitsection.UpperpanelExpT,lowerpaneldifferenceExpT- ExpNT.Time-averageovertheentiresimulatedperiod
NEMERTE Results: temperature & salinity along-strait section
Temperature along-straitsection.UpperpanelExpT,lowerpaneldifferenceExpT-ExpNT.Time-averagedovertheentiresimulatedperiod.
Workshop– Instanbul – July2012
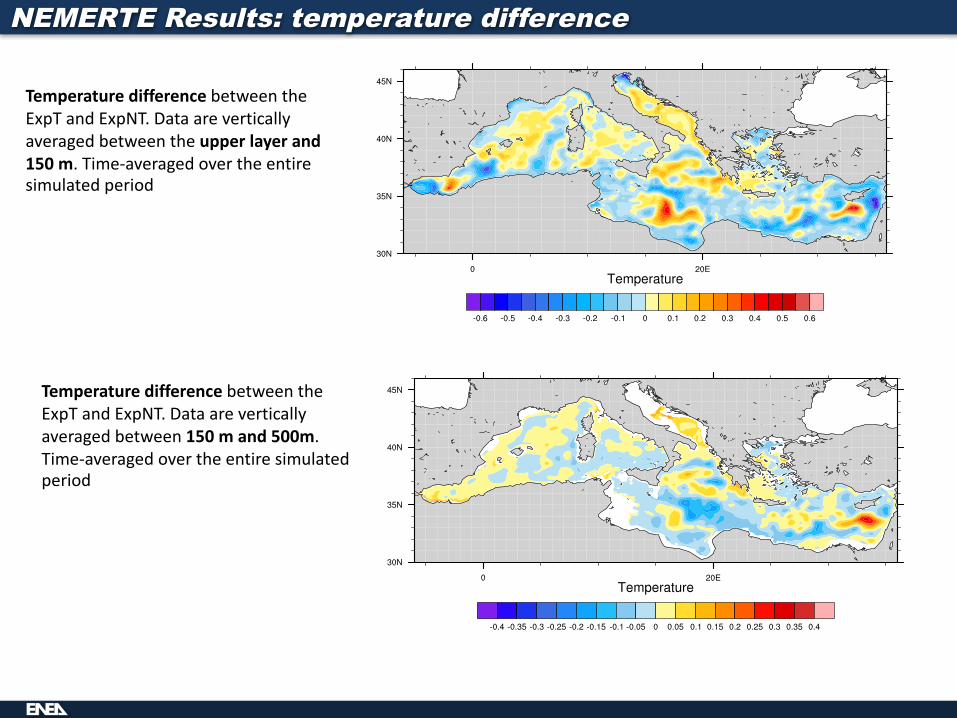
Temperaturedifference betweentheExpT andExpNT.Dataareverticallyaveragedbetweentheupperlayerand150m.Time-averagedovertheentiresimulatedperiod
TemperaturedifferencebetweentheExpT andExpNT.Dataareverticallyaveragedbetween150mand500m.Time-averagedovertheentiresimulatedperiod
NEMERTE Results: temperature difference
Workshop– Instanbul – July2012
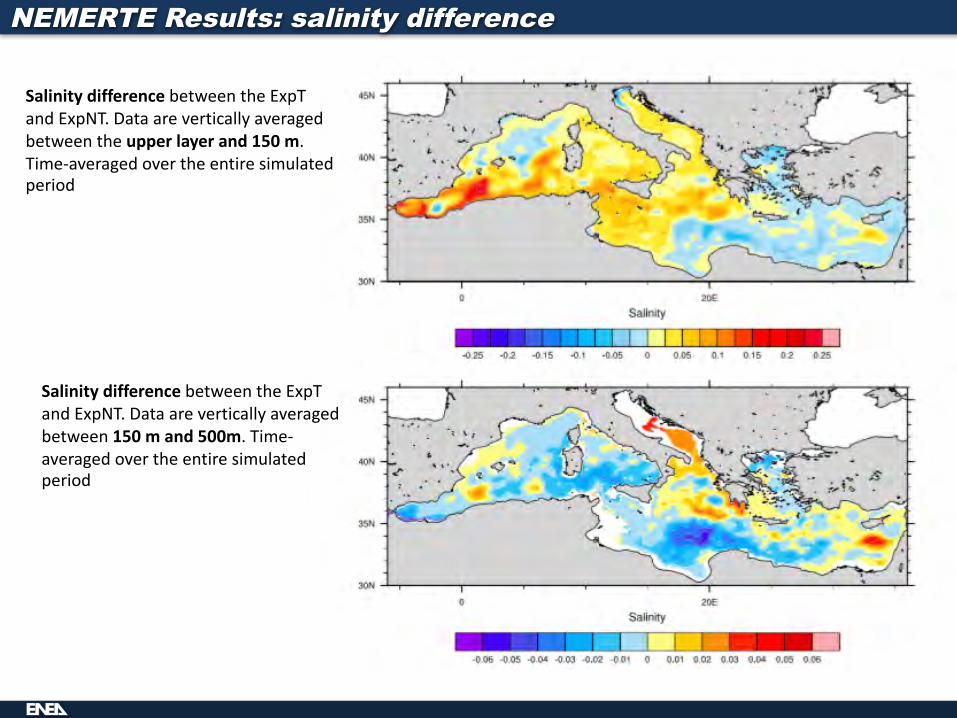
Salinitydifference betweentheExpTandExpNT.Dataareverticallyaveragedbetweentheupperlayerand150m.Time-averagedovertheentiresimulatedperiod
SalinitydifferencebetweentheExpTandExpNT.Dataareverticallyaveragedbetween150mand500m.Time-averagedovertheentiresimulatedperiod
NEMERTE Results: salinity difference
Workshop– Instanbul – July2012
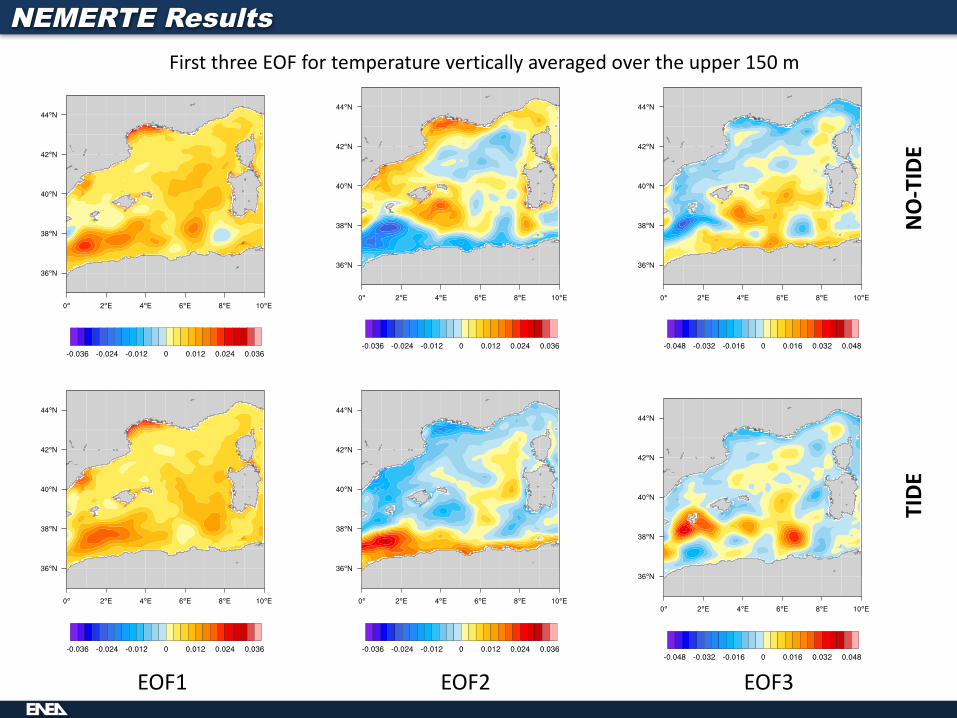
NEMERTE ResultsFirstthreeEOFfortemperatureverticallyaveragedovertheupper150m
EOF1 EOF2 EOF3
NO-TIDE
TIDE
Workshop– Instanbul – July2012
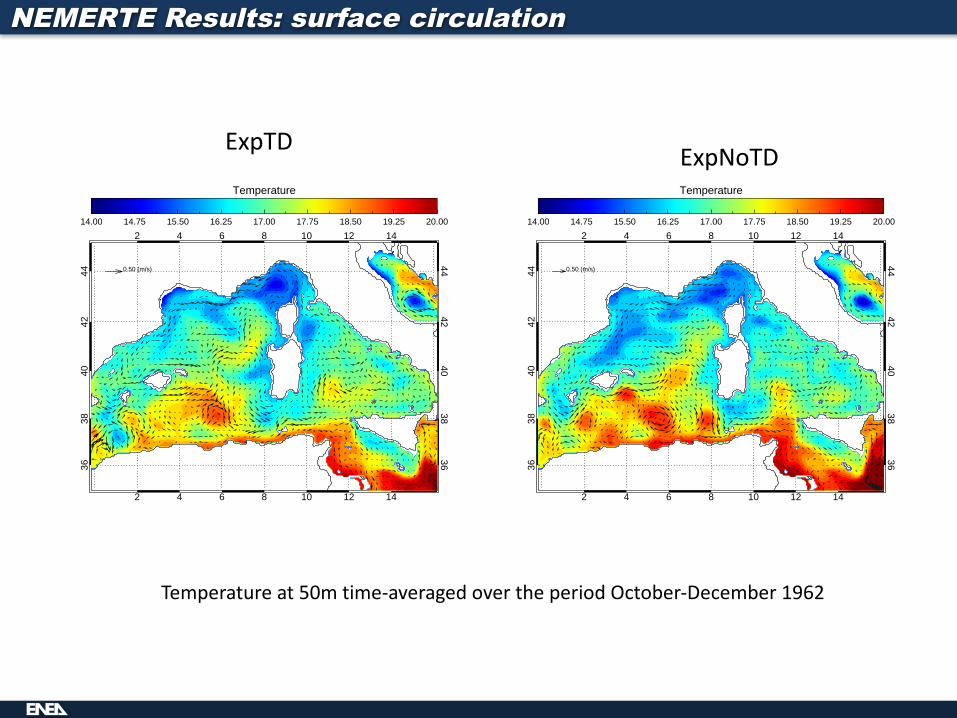
NEMERTE Results: surface circulation
Temperatureat50mtime-averagedovertheperiodOctober-December1962
2 4 6 8 10 12 14
2 4 6 8 10 12 14
3638
4042
44
3638
4042
44
Temperature
14.00 14.75 15.50 16.25 17.00 17.75 18.50 19.25 20.00
0.50 (m/s)
2 4 6 8 10 12 14
2 4 6 8 10 12 14
3638
4042
44
3638
4042
44
Temperature
14.00 14.75 15.50 16.25 17.00 17.75 18.50 19.25 20.00
0.50 (m/s)
ExpTD ExpNoTD
Workshop– Instanbul – July2012
2 4 6 8 10 12 14
2 4 6 8 10 12 14
3638
4042
44
3638
4042
44
Salinity (Psu)
36.60 36.90 37.20 37.50 37.80 38.10 38.40 38.70 39.00
0.50 (m/s)
2 4 6 8 10 12 14
2 4 6 8 10 12 14
3638
4042
44
3638
4042
44
Salinity (Psu)
36.60 36.90 37.20 37.50 37.80 38.10 38.40 38.70 39.00
0.50 (m/s)
2 4 6 8 10 12 14
2 4 6 8 10 12 14
3638
4042
4436
3840
4244
Salinity (Psu)
36.60 36.90 37.20 37.50 37.80 38.10 38.40 38.70 39.00
0.50 (m/s)
2 4 6 8 10 12 14
2 4 6 8 10 12 14
3638
4042
4436
3840
4244
Salinity (Psu)
36.60 36.90 37.20 37.50 37.80 38.10 38.40 38.70 39.00
0.50 (m/s)
2 4 6 8 10 12 14
2 4 6 8 10 12 14
3638
4042
44
3638
4042
44
Salinity (Psu)
36.60 36.90 37.20 37.50 37.80 38.10 38.40 38.70 39.00
0.50 (m/s)
2 4 6 8 10 12 14
2 4 6 8 10 12 14
3638
4042
44
3638
4042
44
Salinity (Psu)
36.60 36.90 37.20 37.50 37.80 38.10 38.40 38.70 39.00
0.50 (m/s)
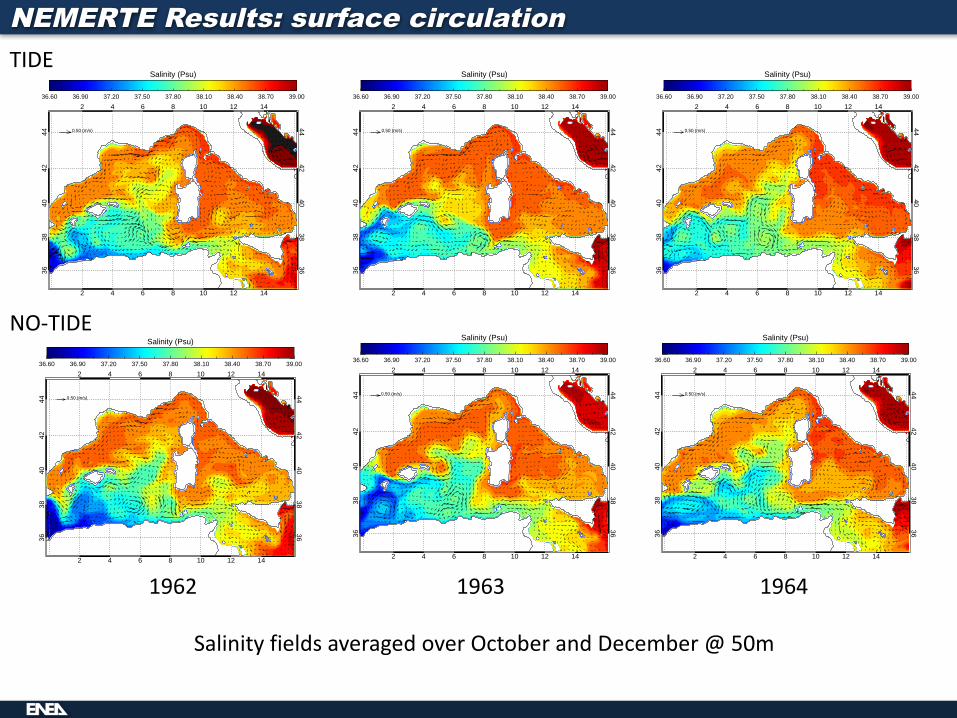
SalinityfieldsaveragedoverOctoberandDecember@50m
1962 1963 1964
TIDE
NO-TIDE
NEMERTE Results: surface circulation
Workshop– Instanbul – July2012
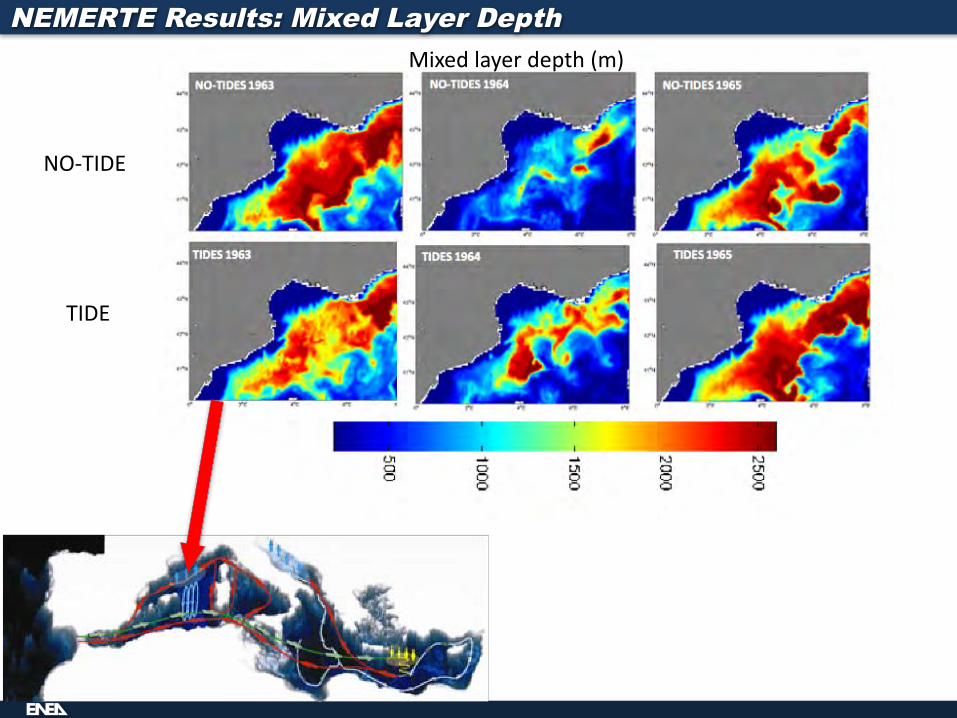
Mixedlayerdepth(m)
NO-TIDE
TIDE
NEMERTE Results: Mixed Layer Depth
Workshop– Instanbul – July2012
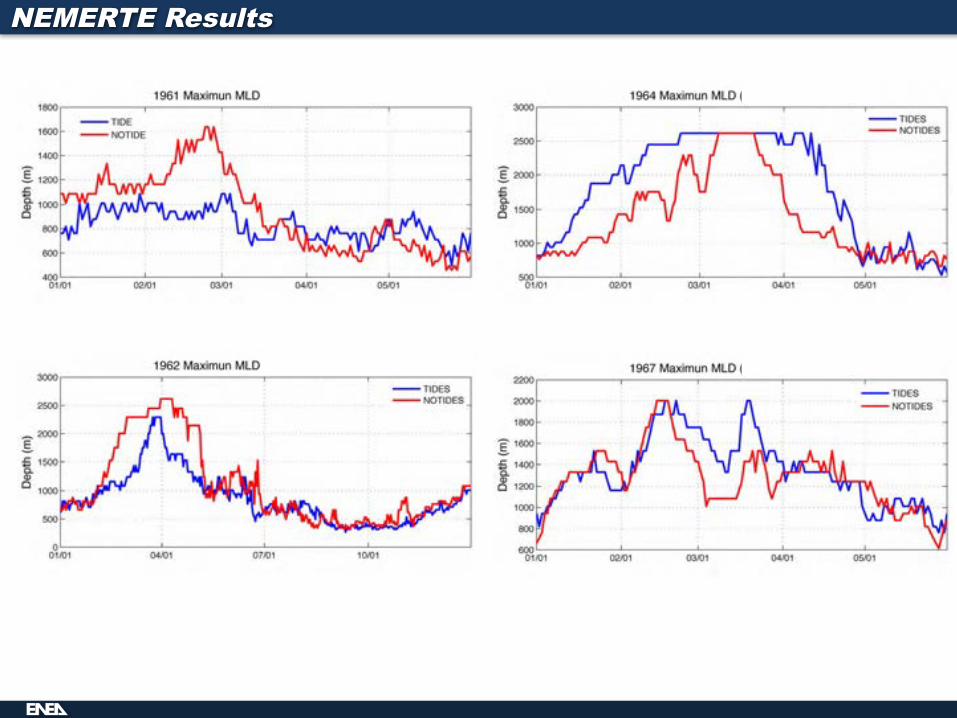
NEMERTE Results
Workshop– Instanbul – July2012
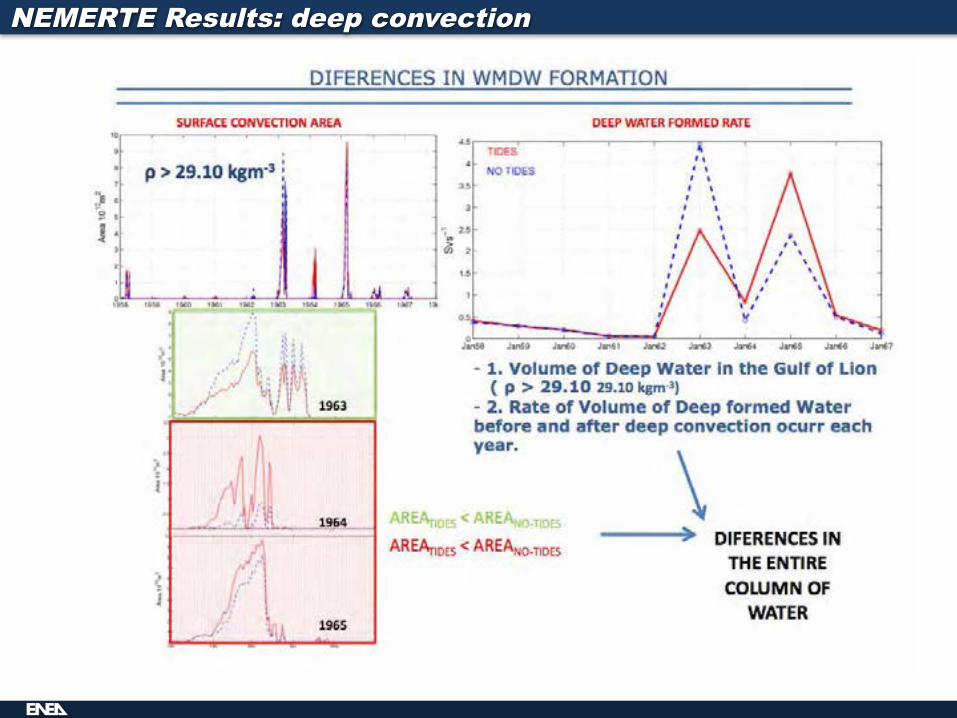
NEMERTE Results: deep convection
Workshop– Instanbul – July2012
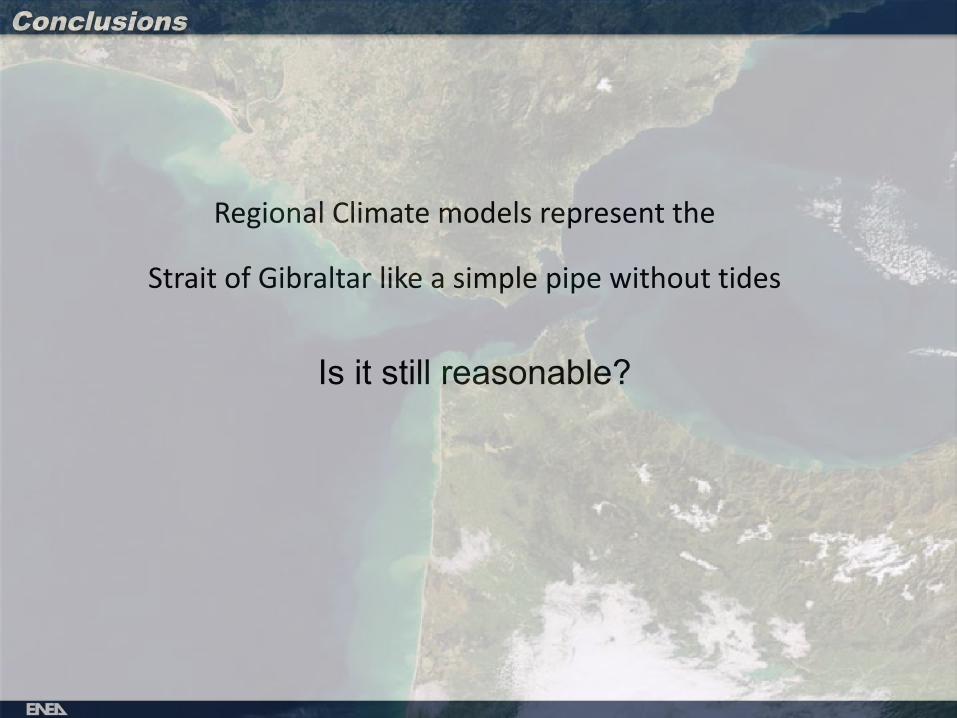
Is it still reasonable?
RegionalClimatemodelsrepresentthe
StraitofGibraltarlikeasimplepipewithouttides
Conclusions