Embed Size (px)
Citation preview
Accountability Initiative, Centre for Policy Research, Dharma Marg, Chankyapuri, New Delhi-110021Tel: +91 11 2611 5273-76 Fax : +91 11 2687 2746 Email : [email protected]
Engaging Accountability: PAISA Report Series
How Much Does India Spend Per Student on
Elementary Education?
Ambrish Dongre | Avani Kapur | Vibhu Tewary
October, 2014
1
How Much Does India Spend Per Student on Elementary Education?*
Ambrish Dongre, Avani Kapur, Vibhu Tewary**
October, 2014
Abstract
Recent years have seen significant changes in the landscape of elementary education (EE) in India.
Yet, updated estimates on public and private expenditure on EE are not available. This paper fills the
gap by providing a methodology and estimates of per student public expenditure on children enrolled
in government schools, and per student private expenditure on children enrolled in private unaided
schools, for major states in India for the year 2011-12. The paper also provides estimates of total
(public and private) expenditure on EE.
Our findings indicate that India spent 1.75% of the GDP (centre and states combined) on EE, while
private expenditure was at least 0.71% of the GDP in 2011-12. Richer states spent less on EE as a %
of their GDP but more in terms of absolute amounts, compared to the poorer states. Preliminary
analysis indicates a strong relationship between per student public expenditure and learning levels.
But this does not mean that more expenditure is needed to improve learning levels because
government expenditure on EE is highly inefficient. It produces low levels of outcomes at high
expenditure. Changing this requires prioritising learning outcomes and demanding accountability
toward learning outcomes from all officials, above everything else.
* This work is part of a much larger research work, PAISA District Studies-2013 (forthcoming)
carried out by the Accountability Initiative. The authors would like to thank Yamini Aiyar (Director,
Accountability Initiative) for her continuous support. The authors can be contacted at
[email protected]/ [email protected], and [email protected].
** All the authors were with the Accountability Initiative when this research was carried out.
Currently, Ambrish is a Fellow at Centre for Policy Research, and Senior Researcher, Accountability
Initiative, New Delhi. Avani is Senior Research and Program Analyst at Accountability Initiative,
New Delhi. Vibhu is pursuing higher studies at Duke University, USA.
2
1 Introduction
The last few years have seen significant changes in the quantum and composition of financing the
elementary education (henceforth, EE) sector in India. Traditionally, financing EE was the primary
responsibility of individual state governments. But the launch of the Sarva Shiksha Abhiyan (SSA) in
2001 has resulted in a significant increase in Government of India's (GOI) funding for EE. In fact,
between 2001 and 2013, GOI's EE budget increased over 11-fold from Rs. 3,577 crore to Rs. 39622
crore1. Consequently, while states still contribute the larger share of education expenditure, their
share in the total has been declining after 2000 (from 87.7% in 2000-01 to 75.3% in 2010-11)2,3
. In
2010, Parliament passed the Right to Free and Compulsory Education (RTE) Act - making it an
obligation on states to ensure that every child between six and fourteen years of age is in a school.
The passing of the RTE Act and the obligations on state governments to implement it has resulted in
an increasing reliance, particularly amongst fiscally weaker states, on GOI funds (Accountability
Initiative 2013; 2012).
In addition to the changing nature of public expenditure on EE, private expenditure on EE has also
increased. The recent District Information System for Education (DISE) numbers indicate that 36%
of the students at elementary level are enrolled in schools operated by private management (aided
and unaided) (Mehta 2013). Between 2007 and 2013, the percentage of children in private schools in
rural India increased from 20% to 29% (ASER 2013). Some states like Kerala have nearly 70% of
their children from rural areas in private schools. Households are also spending on education beyond
just school fees. 24% of children in rural India attend paid tuitions. In fact, more than half the
children in rural parts of Bihar, West Bengal and Odisha take paid tuitions (ASER 2013).
However, despite these changes, updated estimates on the public and private expenditure on EE are
not available. This paper attempts to fill this gap. It provides a methodology and estimates of per
student public expenditure on those who are enrolled in government schools, and per student private
expenditure on those who are enrolled in private schools for 20 major states in India for the year
2011-124. Going further, the paper also provides estimates of total public expenditure and total
private expenditure, and hence total expenditure on EE in India.
1 www.Indiabudget.nic.in
2 Figures are for total education, not just elementary. However, given that elementary education now constitutes the
largest share of total elementary education, it is reflective of the overall trend. 3 MHRD 2013. Figures for 2010-11 are revised estimates.
4 2011-12 has been used as it was the latest financial year for which expenditure data is available from state budget
documents.
3
Our findings indicate that India spent 1.75% of the GDP (centre and states combined) on EE, while
private expenditure, admittedly an underestimation, was 0.71% of the GDP. Richer states spent less
on EE as a % of their GDP, compared to the poorer states. There is significant variation across states
in public expenditure per government school student and private expenditure per private school
student. Variation in public expenditure per government school student is higher than variation in
private expenditure per private school student. On an average, higher the per capita income, higher is
the public and private expenditure per government school student and per private school student,
respectively. Differences in public expenditure on teacher salaries per government school student are
also an important reason why public expenditure per government school student differs so
dramatically across the states. Preliminary analysis shows that higher per student public expenditure
(and per student private expenditure) is associated with higher proportion of students being able to
read or do math of a particular level. But we argue that this fact should not be taken to mean that
more expenditure is needed to improve learning levels because government expenditure on EE is
highly inefficient. It produces low levels of outcomes at high expenditure. Changing this requires
reorganising the financial architecture by prioritising learning outcomes and demanding
accountability toward learning outcomes from all officials, above everything else.
The remaining paper is divided into the following sections. Section 2 discusses estimation of public
expenditure on elementary education. Section 3 describes methodology for calculating private
expenditure. Section 4 discusses the main findings and Section 5 concludes.
2. Estimation of Public Expenditure on Elementary Education (EE)
Initially, education (including EE) was the primary responsibility of individual state governments. In
1976, education was included in the Concurrent List of the Constitution, making it joint
responsibility of both, GOI and state governments5.
Expenditure on EE comes primarily from state governments. States incur most of the recurring
expenditure on teacher salaries as well as state-specific entitlement schemes. Calculating expenditure
by state governments requires going through individual state budget documents, many of which are
not easily available online6. Collating is further complicated by the fact that each state budget reports
educational expenditure differently. For instance, while some states such as Karnataka and Tamil
5 The Concurrent list consists of 52 items, the legislation of which rests with both the Central government as well as state
governments 6 For more details, see http://accountabilityindia.in/accountabilityblog/2438-rants-public-finance-junkie
4
Nadu have separate departments for EE, in case of others such as Kerala, it is given under several
major heads of accounts which includes „general education‟, „technical education‟, „sports and youth
services‟ and „art and culture‟ (De and Endow 2008). Moreover, expenditure on EE is funded not just
though the education department. For instance, Department of Tribal Welfare provides money for
scholarship, uniforms and even building schools, which need to be included in calculating total
expenditure on EE. Other departments funding elementary education include Ministry of Railways,
Defence, Labour and Employment, Social Justice & Empowerment, Culture, Tribal Development,
Development of North Eastern Region and Department of Women & Child Development. In fact, in
recent years, a significant share of expenditure on EE is incurred by departments other than
department of education, and their proportion has been increasing over time (MHRD 2013)7.
In recent years, GOI has increased its contribution to EE through the launch of Centrally Sponsored
Schemes (CSS) such as Sarva Shiksha Abhiyan (SSA), Kasturba Gandhi Balika Vidyalaya (KGBV)
and the Mid-Day Meal (MDM) scheme8. CSS have some key features. First, GOI and state
governments share funding for CSS. For instance, funds for SSA are shared in 65:35 ratio, while
funds for cooking cost under MDM have a 75:25 ratio 9
. Second, CSSs may have different modes of
fund transfer. Funds for SSA are routed through an autonomous implementation society (known as
the State Implementation Society (SIS)) and thus, do not flow through the state treasury. In contrast,
funds for MDM are routed via the state treasury. Detailed financial information on these CSS is
available on individual scheme websites.
Given the multiple sources and manner of funding for EE, calculating total expenditure becomes
complicated. The next sub-section described the methodology we‟ve adopted to calculate public
expenditure on EE.
7 Other departments constituted 32% of the total share of revenue expenditure on education as a whole in 2011-12.
8 Centrally Sponsored Schemes (CSS) are those that are funded directly by the Central ministries/ departments and
implemented by States or their agencies. This assistance tends to be in areas that are predominantly or have traditionally
been State subjects, where the Centre wishes to motivate States to take up programmes and provides additional funding. 9 For special category states, the ratio is 90:10.
5
2.1 Methodology to calculate Public Expenditure on EE
Calculating total public expenditure on EE involves adding a) expenditure incurred in the state
budget available from individual state budget documents, and b) funds flowing through the SIS, from
the Approved Annual Plan and Budget (AWP&B) for SSA10,11
.
Data for EE was manually collected from state budget documents. In order to ensure that we
included the entire quantum of expenditure, we extracted the specific head of account for EE
(2202.01 – revenue expenditure, and 4202.01.201 – capital expenditure) rather than looking only at
the department of education. The total expenditure on EE in the state budget, however, includes the
state expenditure for SSA but does not include GOI expenditure for SSA. In order to avoid double
counting, the state expenditure for SSA was netted out.
Finally, the last step entailed adding the total expenditure incurred under SSA which, as previously
mentioned, is transferred through state autonomous bodies. Total SSA expenditure (GOI and state
share) was collected from AWP&B documents and Project Approval Board (PAB) minutes,
available on the SSA portal12
. Since PAB minutes are revised frequently based on the supplementary
plan, in order to obtain the most updated figures for a particular year, we have used the PAB minutes
for the next year. For instance, PAB 2012-13 has been used to obtain 2011-12 figures for
expenditures. It is important to note that for some states since the PAB meetings occur before the end
of the financial year, the expenditure figures may be actual expenditure till January and then
anticipated expenditure for February and March13
.
Table 1 (column 1) gives the total public expenditure on EE. In 2011-12, Uttar Pradesh spent the
highest at Rs. 18,126 crores, followed by Maharashtra at over Rs. 15,000 crores. On the other hand,
smaller states of Himachal Pradesh, Punjab and Uttarakhand spent less than Rs. 2,000 crores.
10
State budget includes expenditures incurred on MDM and other CSS such as Strengthening of Teacher Training
Institutions that flow through the state treasury. Since funds for SSA flowed through the society route, they were added
separately. The calculations may miss out some expenditure incurred under general category (where it is difficult to
extract the exact expenditure on elementary education), but these would be minimal. 11
The AWP&B is the total estimated annual work plan submitted by respective state governments to GOI‟s planning
board known as the PAB. Once approved, the AWP&B forms the basis of release of funds under SSA and expenditures
incurred. 12
www.ssa.nic.in 13
An alternative methodology can be collating total elementary education expenditure from the state budget and simply
adding the GOI release for SSA. This would be a simpler method as it would not require netting out state share of SSA
from the state budgets. However, SSA has a significant degree of under-spending. Not all GOI releases are spent. Thus,
adding GOI releases could be an overestimate of expenditure. Hence, we prefer the methodology used in this paper.
6
Per Student Expenditures
Looking at total expenditure however, can be misleading as there is significant variation in student
population across states. Thus, in order to get a more comparative picture, we calculate public
expenditure on EE per student enrolled in government schools14
. It is derived by dividing total public
expenditure by total enrolment in elementary sections (Sections I-VIII) in government schools. Total
enrolment was obtained from DISE State Report Cards 2011-1215
.
The results are in column 3 of Table 1, and discussed in section 4. Median expenditure per student is
Rs. 12768. Chhattisgarh is just below the median, while Gujarat is just above the median.
3 Methodology to estimate Private Expenditure on EE
This section describes the methodology to estimate private expenditure i.e. expenditure incurred by
the households on school fees, exams fees, tuition fees, any other fees, conveyance, books,
stationery, uniform, private coaching etc. We use data from 64th
round of NSS since it is the latest
data which provides information on expenditure on education by households16
.
Our method consists of first, calculating per student private expenditure for those who attend
government schools (including local body schools) and private schools (aided and unaided),
separately. We adjust these numbers for inflation between 2007-08 and 2011-12. Next we estimate
number of students enrolled in government schools and private schools in 2011. Multiplication of per
student expenditure and number of students gives total private expenditure on those who attend
government schools and private schools separately. Adding these gives us total private expenditure
(for all those who are enrolled in schools, whether public or private). Finally, dividing aggregate
14
Note that public expenditure per student enrolled in elementary sections of government schools as estimated here is an
over-estimation since the numerator includes expenditure on private aided schools, while denominator doesn‟t include
students in private aided schools. This over-estimation is a matter of concern mainly for states like Kerala, Maharashtra
and Tamil Nadu where a significant proportion of students are enrolled in such schools. The other option was to include
number of students in private aided schools in the denominator. However, money towards private aided schools is only
for teacher salaries, and would have resulted in underestimation of public expenditure per student enrolled in government
schools. Further, this would have created problems in estimating private expenditure on EE, which would be clear in
section 3. 15
It is important to note here that we are not calculating the per-child expenditure but the per-student. While expenditure
on elementary may include expenditure on out of school children (OOSC), we have not included the number of OOSC in
calculating per student expenditures. This however should not make a significant difference as expenditure on
mainstreaming OOSC is very small proportion of total elementary education expenditure. 16
Education in India: 2007-08 – Participation and Expenditure, NSS 64th
round, July 2007-June 2008
7
private expenditure by total number of students enrolled in private schools gives per student private
expenditure.
An easier method could have been directly calculating (combined) per student private expenditure
without distinguishing between the type of school in which they are enrolled, and adjusting it for
inflation. But we avoid this method because (combined) per student private expenditure is essentially
a weighted average of per student private expenditure of those who are enrolled in government and
private schools weighted by proportion of students attending government and private schools. Since
these proportions are likely to have changed substantially, it would be inappropriate to use
(combined) per student private expenditure.
The step-by-step process undertaken to calculate private expenditure on elementary education is
outlined below:-
Step 1: Estimating per student private expenditure attending government schools, and private
schools, 2007-08
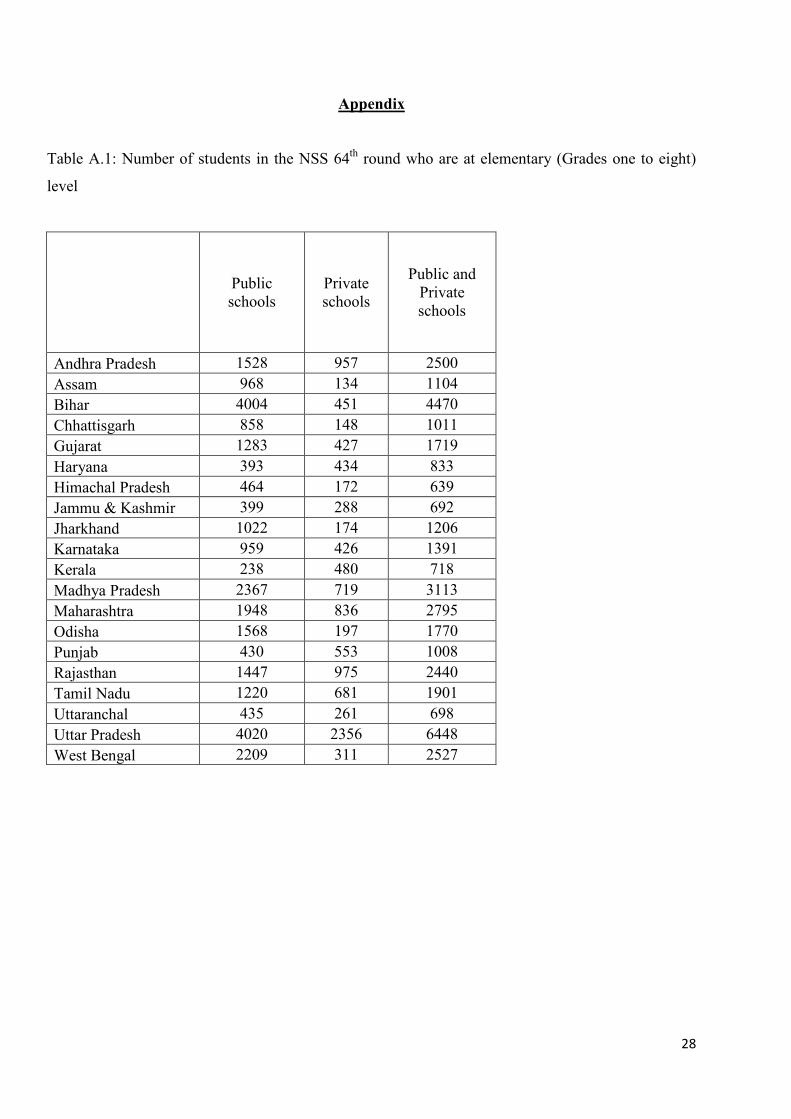
First, we estimate per student private expenditure for students in grades one to eight, attending
government schools, and private schools (i.e. private and private aided) separately, using 2007-08
NSS round (see columns 1 and 2 of Table 2)17
. With the implementation of the RTE act, Government
schools no longer charge any fees, and provide textbooks and uniforms to the enrolled children free
of cost. Hence, we have excluded school fees, exam fees, and cost of books and uniforms, while
calculating private expenditure for children attending Government schools.
Step 2: Estimating GDP deflators and inflation between 2007-08 and 2011-12
Next, per student private expenditure numbers obtained for 2007-08 are updated for the year 2011-12
using inflation numbers calculated on the basis of state-specific GDP deflators18
. The GDP deflators
are calculated as the ratio of current state GDP to constant state GDP for 2007-08 and 2011-
12.Inflation rate was thus calculating using the following formula:
(GDP Deflator2011-12- GDP Deflator2007-08) / GDP Deflator2007-08 (I)
17
Number of observations is indicated in table A.1 in appendix. 18
Data on GSDP has been obtained from Central Statistical Organization website, downloaded in July, 2013.
8
Step 3: Estimating per student private expenditure attending government schools, and private
schools, 2011-12
Step 1 and 2 enable us to obtain inflation adjusted private expenditure on EE for students attending
private schools (column 3 of Table 2), and inflation adjusted private expenditure on EE for students
attending government schools (column 4 of Table 2). Median expenditure per student attending
private schools is Rs. 5959. Chhattisgarh is just below the median, while Maharashtra is just above
the median.
In order to obtain aggregate private expenditures, we need to multiply per student private
expenditures by number of students enrolled in government schools and private schools, i.e.
Total Private Expenditure for students attending private schools =
Per capita private expenditure for students attending private schools * number of students enrolled
in private schools (II)
Total Private Expenditure for students attending government schools =
Per capita private expenditure for students attending government schools * number of students
enrolled in government schools (III)
Enrolment in government schools is easily available from DISE State Report cards19
. But number of
students enrolled in private schools at the elementary level needs to be estimated20
.
Step 5: Estimating number of students enrolled in private schools
We adopt the following strategy to obtain the number of students enrolled in private schools at
elementary level:
a. Obtain number of children in the age group of 6 to 14 years from 2011 Census21
.
b. Obtain percentage of out of school children in rural areas from ASER 2011 survey22
.
19
DISE State Report Cards, 2011-12 were used for the calculations. These are available online at:
http://www.dise.in/Downloads/Publications/Publications%202011-12/State%20Report%20Cards%202011-12.pdf
Accessed on August 16, 2014. 20
Though coverage of private unaided schools by DISE has improved over time, it‟s not complete. 21
http://www.censusindia.gov.in/2011census/population_enumeration.aspx Accessed on December 19, 2013 22
ASER survey is generally carried out between September and November every year.
9
c. Assume that percentage of out of school children is same in rural and urban areas, and thus,
obtain number of children in the age group of 6 to 14 years who are enrolled in school23
.
d. Subtract number of children enrolled in government schools (obtained from DISE) from total
number of children in the age group of 6-14 years enrolled in school (obtained in (c) above),
which gives us number of children enrolled in private schools24
.
All these steps are illustrated in Table 3. Column 6 of Table 3 shows that private schools are highly
prevalent across the country. Out of twenty major states, ten states have more than half their students
in private schools. In Kerala, 79% students attend a private school. Both, Tamil Nadu and
Maharashtra have a high percentage as well, with 60% students attending private schools.
The critical step here is the assumption (c) that proportion of out of school children is identical in
rural and urban areas, which is unlikely to be the case25
. This assumption leads to overestimation of
number of out of school children in urban areas, and hence overall number and proportion of out of
school children. As a result, we underestimate number of children enrolled in private schools.
Therefore, estimates obtained in this paper are lower bound of true private expenditure on EE.
Step 6: Estimating total Private Expenditure for students attending private schools
Once we have obtained number of students enrolled in private schools, the next step is to calculate,
state-wise, total private expenditure for students enrolled in private schools (as per (II)), and total
private expenditure for students enrolled in government schools (as per (III)). The figures are in
columns 1 and 2 of Table 4.
Step 7: Estimating total Private Expenditure for students (whether enrolled in government or private
schools)
Addition of private expenditure for those who are enrolled in private schools, and private expenditure
for those who are enrolled in government schools gives us aggregate private expenditure for all
23
No current estimate of proportion of out of schools children in urban areas is available. 24
A concern here is that not all of the students enrolled in the elementary sections would be in the age group of 6-14
years. 25
Analysis of data from NSS 64th
round suggests that proportion of out of school children is higher in rural areas
compared to urban areas.
10
students who are enrolled in schools at elementary level, government or private (column 3 of Table
4)
Step 8: Estimating Private expenditure per student (whether enrolled in government or private
schools)
We divide total private expenditure on EE by number of school going children in age-group of 6-14
to obtain private expenditure per student (column 4 of Table 4).
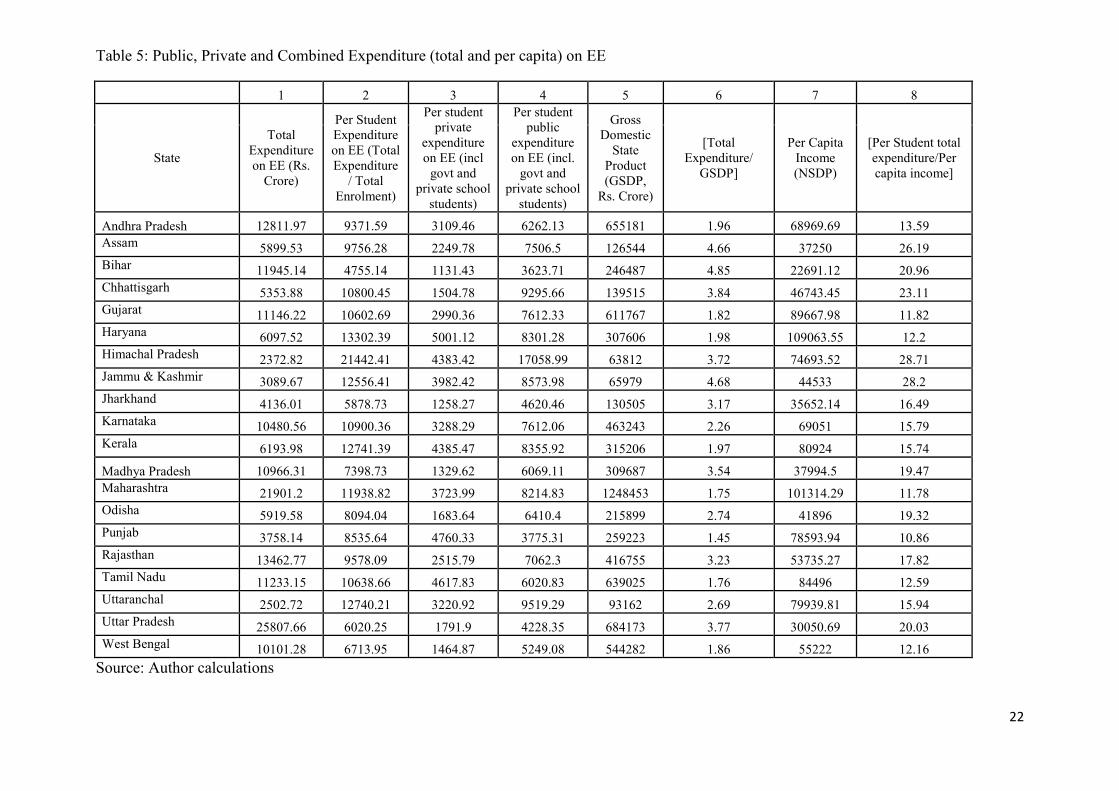
Finally, having calculated both, total public and total private expenditure on EE, we obtain total
expenditure on EE (indicated in column 1 of Table 5). Diving total expenditure by number of
students enrolled in elementary sections give us per student expenditure on EE (column 2 of Table
5). This per student expenditure is nothing but an addition of per student private expenditure (column
3), and per student public expenditure (column 4) on EE. Note that per student public expenditure is
derived as total public expenditure on EE divided by number of students enrolled in elementary
sections, whether private or government. This number is different from public expenditure per
student enrolled in government schools (as reported in column 3 of Table 1).
The next section discusses some of the main findings emerging from this data from the perspective of
adequacy and prioritisation of spending on EE, composition and effects on learning outcomes
4 Stylized facts
4.1 India, as a whole, spends around 2.5% of its GDP on EE26
.
As early as 1966, the education commission chaired by D. S. Kothari had recommended that India
should allocate at least 6 percent of its national income to education. Similar sentiments have been
reiterated since then including in the Common Minimum Programme (CMP) of the UPA government
(Tilak 2007).
EE constitutes the largest share of total education financing, 50% in 2011-12. Our calculations
indicate that India spends 1.75% of its GDP on EE27
. This is higher than in 2007-08 and 2008-09
26
Note that the analysis excludes the states in the North-east and the Union Territories (UTs).
11
when total public expenditure (Centre and State) as a proportion of GDP was 1.51% and 1.52%,
respectively (MHRD 2011, MHRD 2012)28
. Increased share of EE in GSDP indicates that
expenditure on EE has grown more than growth in GSDP. Private expenditure constitutes 0.71%
of overall GSDP. Thus, India, as a whole, spends almost 2.5% of its GDP on EE.
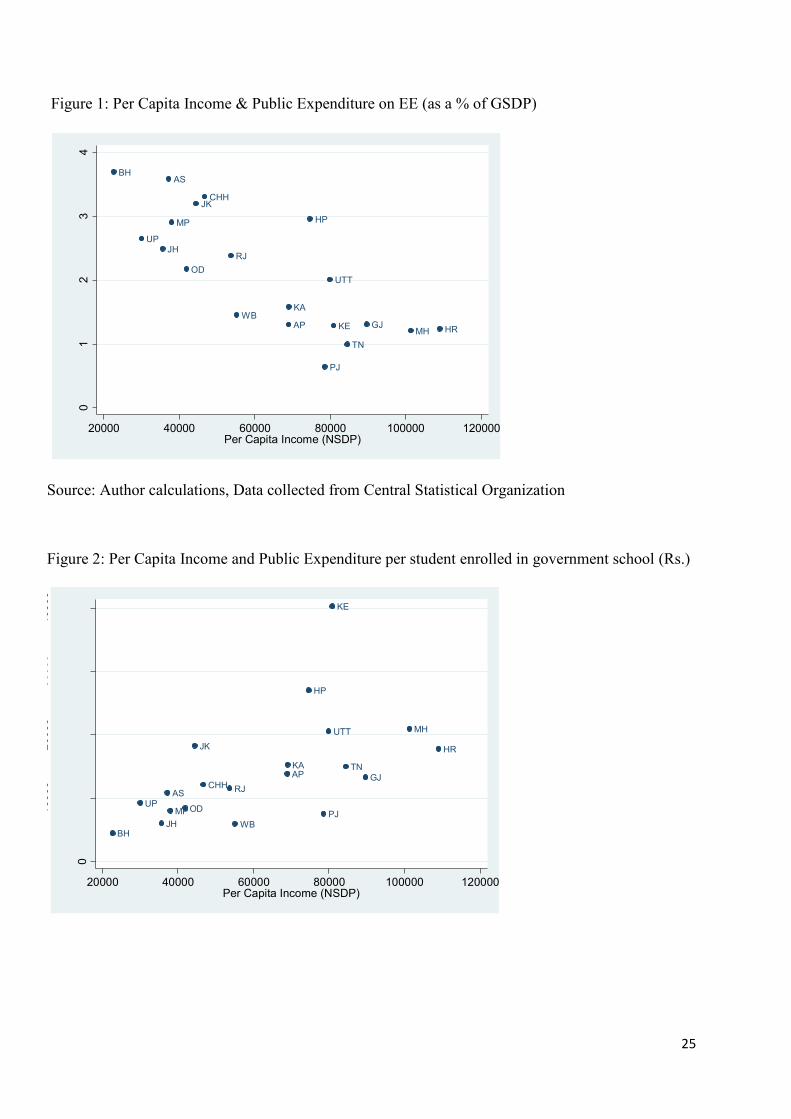
4.2 Higher the per capita income, lower is the public expenditure on EE, as a proportion of GSDP.
While expenditure on EE constitutes the largest share of total education spending, there are
differences across states on the proportion of total incomes spent on EE.
Figure 1 shows that higher the per capita income, lower is the proportion of GSDP spent on EE.
Bihar which has the lowest per capita income in the country spends about 3.7% of its GSDP on EE,
while Haryana, the state with the highest per capita income spends 1.24%. Punjab and Himachal
Pradesh offer interesting comparisons. Even though their per capita incomes don‟t differ
dramatically, Himachal Pradesh spends 2.96% of its GSDP, while Punjab spends only 0.64%.
4.3 Per capita income is also an important determinant of absolute levels of per student public
spending.
While there is an inverse relationship between per capita income and expenditure on EE (as a % of
GSDP), in absolute terms, it‟s the opposite- higher per capita income is associated with, on an
average, higher amount spent per student in government schools, as shown in Figure 229
. Kerala
spends highest amount per student enrolled in government schools, followed by Himachal Pradesh,
Maharashtra, and Uttaranchal. On the other hand, Bihar, West Bengal and Jharkhand are the lowest
spenders. Surprisingly, Punjab which ranks much higher in terms of per capita income, spends much
lower amount per student enrolled in government schools compared to all relatively less developed
states except the three mentioned above.
27
We add up the spending on EE and divide it by sum of GSDP. 28
See Mehrotra (2004) for an international comparison of spending on elementary education as a % of GNP. Further, see
Chakrabarti and Joglekar (2006), Tilak (2006) and Tilak (2007) for past trends on spending on public education (not just
elementary) as a % of GDP.
29 Similarly, on an average, higher the per capita income, higher is the amount spent per student enrolled in private
school. Households in Himachal Pradesh, Punjab and Haryana spend the highest per student enrolled in private schools.
On the other hand, households in Uttar Pradesh, Madhya Pradesh, Bihar and Jharkhand spend the lowest amount per
student enrolled in private schools. Results are available with the author.
12
These numbers raise important questions. Low expenditure (in relative and absolute terms) on EE,
especially in poorer States can be due to low resource base, relatively low priority attached to EE or
(relatively) higher number of school-age children (Mehrotra 2004). One of the important goals of
CSSs such as SSA was to address the issue of low resource base and fiscal constraint faced by the
States to increase their expenditure on EE. Consequently, as mentioned in the beginning, GOI
funding for EE increased significantly. Per capita income, however, continue to play an important
role in per student spending across states, even today. Further research would be needed to
understand whether this difference is a consequence of fiscally weaker states still trying to “catch-
up” with states with higher per capita income or whether there is a “substitution effect” i.e., states, in
reaction to increased central funding, may be using centre's CSS money to substitute their own
expenditure (from their own tax collection). Consequently, this results in „crowding out‟ of state‟s
own expenditure and increasing dependence of central financing. (Mukherjee 2013; Chakraborty,
Mukherjee and Amarnath, 2009). How would the future Finance Commissions tackle this divergence
remains to be seen30
.
Next, we break down public expenditure on EE to understand its composition, and thereby reveal
choices made by the state about where and how they allocate and spend this money.
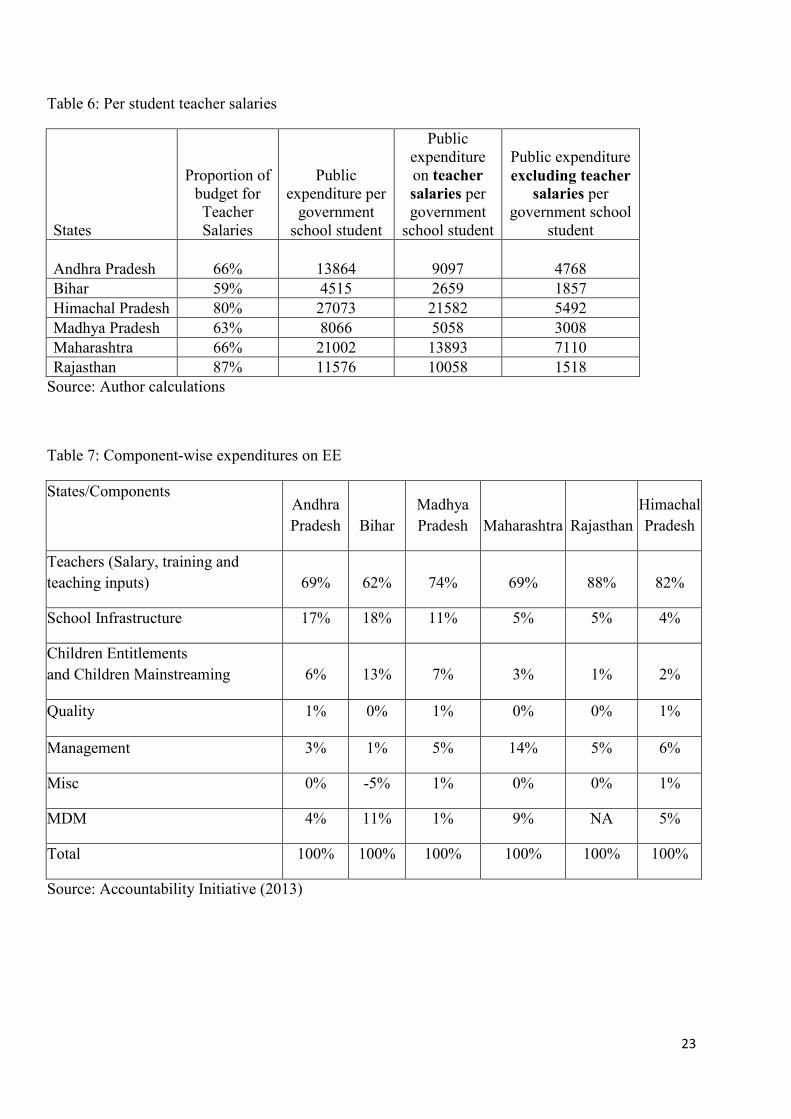
4.4 Expenditure on teacher salaries constitutes the largest share of overall EE budget at state
level.
Expenditure on teacher salaries constitutes the largest share of overall EE budget at state level. An
analysis of EE budget of six states indicates that expenditure on teacher salary is at least around 60%
of total EE budget (column 1, Table 6)31
. In states like Rajasthan, share of teacher salary is close to
90%32
.
Expenditure on teacher salaries is determined by proportion of regular and para teachers, and their
respective pay-scales. There is wide variation across states in both these aspects. States such as Bihar
and Madhya Pradesh have higher proportion of para-teachers who are paid much lower than regular
30
One potential option can be the equalisation grants undertaken for the first time in the 12th
Finance Commission. 31
A more detailed data on public expenditure on EE was collected for these six states. 32
A number of research studies (Kingdon 2005, Muralidharan and Kremer 2007, Goyal and Pandey 2009) have shown
that teacher salaries also contribute to differences between per student public expenditures on those going to government
schools versus per student private expenditure on those going to private schools. In fact, after the Sixth Pay Commission,
private school teachers are, on average paid, less than 1/6th to 1/8th the salary of government school teachers (Goyal and
Pandey 2009, Muralidharan 2014).
13
teachers. Surveys conducted by Accountability Initiative reveal that para-teachers in Nalanda and
Purnea (in Bihar) receive Rs. 6400-6800 per month, while the regular teachers receive around Rs.
23,000 to 28,000, on an average. Corresponding figures are around Rs. 6,000 and Rs. 17,800 for
Sagar in Madhya Pradesh (Accountability Initiative 2013). This allows the states to hire a larger
number of teachers at much lower cost, keep teacher expenditure per student relatively low (column
3, Table 6). More importantly, it gives the states some flexibility to spend on other components
which they deem essential for provision of EE. Thus, as can be seen in Table 7, in Bihar and Andhra
Pradesh, total expenditure on teachers (salaries, training and teaching inputs) was relatively lower
than in Rajasthan and Himachal Pradesh. Consequently, both states spent a larger proportion on
school infrastructure at nearly 20%. Interestingly, Bihar also spends a significant proportion of its
total EE expenditure on children entitlements schemes to incentivise children to enrol and attend a
school (Accountability Initiative, 2013).
Finally, the following sub-section explores the relation between expenditure and learning outcomes.
Note that the observations here are based on very preliminary analysis. The limited purpose here is to
point out possible directions in which research can be extended, and not to draw any conclusions.
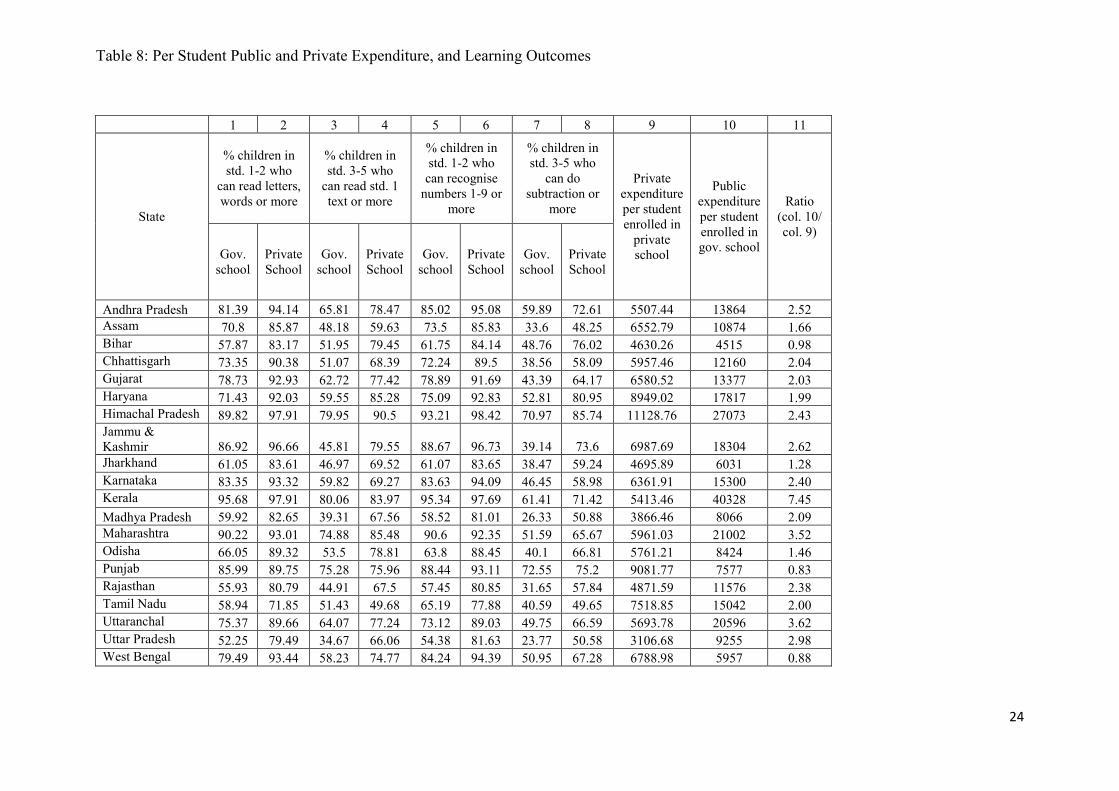
4.5 Is there a relationship between Expenditure and Learning Outcomes
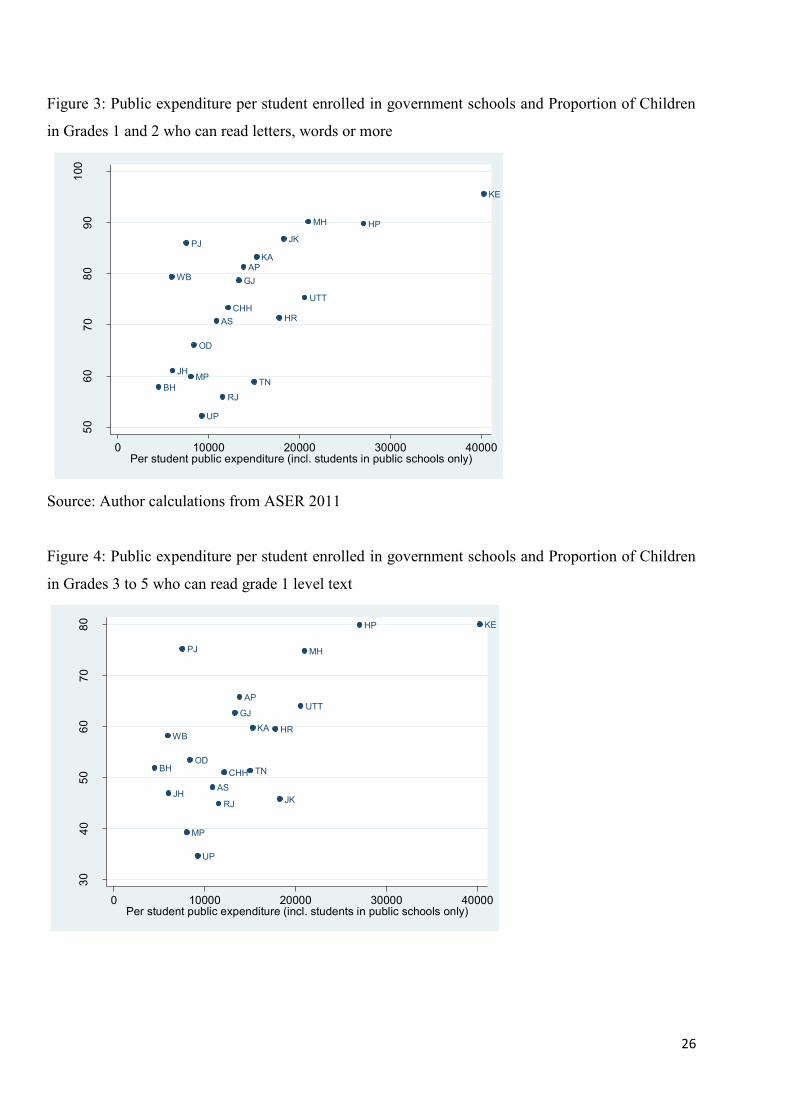
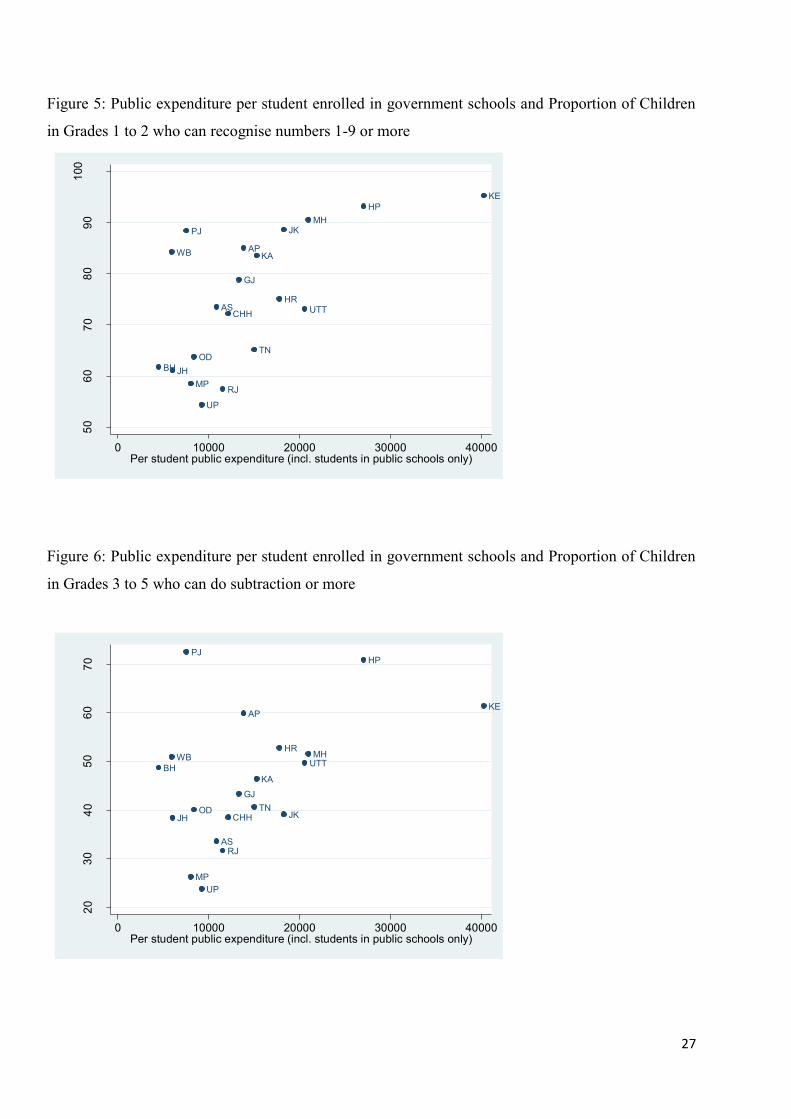
Figures 3-6 show the relation between public expenditure per student in government school, and
reading and math levels of students (calculated from ASER 2011)33
,34
. The figures indicate a positive
relation between the two, i.e. higher per student public expenditure is associated with higher
proportion of students being able to read/ do math at a particular level35
.
Does it imply that more should be spent per student in a government school if we want to improve
the learning outcomes? Not really. We must look at what the opportunity costs or alternative uses are
of this expenditure. Even though a full-fledged analysis is beyond the purview of this paper, a simple
example would be comparing per student costs and learning outcomes in government and private
schools as shown in Table 8. It indicates that, in every state, learning outcomes in private schools are
better than the government schools, while per student spending is much lower as compared to
33
Results are similar when ASER 2012 numbers are used. 34
We have looked at expenditures rather than allocations as allocations reflect intention to spend and do not reflect the
reality of both quantum of funds available as well as state capacity for expenditure. 35
The relationship holds even after controlling for per capita income (results not shown here). Similar relationship is
found between private expenditure on those who attend private schools and learning outcomes.
14
government schools36
. This „double‟ inefficiency ends up imposing a huge burden on India,
amounting to 2.78% of GDP37
. This reveals that there is a dire need to ask hard questions, and take
tough decisions to make expenditure more „efficient‟, to get more bang for the buck, so to speak.
Since 2012, there has been some important policy shifts. The 12th Five Year Plan explicitly
articulated learning improvement to be a key policy goal. This was followed by MHRDs renewed
articulation of the importance of meeting the learning challenge. Consequently, MHRD launched the
„Padhe Bharat, Badhe Bharat‟ scheme with a focus on learning. But is this going to be enough to
solve the „learning challenge‟?
This scheme is a good starting point but the need of the hour is to rework the education system such
that it moves away from its preoccupation with input delivery to one that prioritises learning
outcomes. This pre-occupation has left us in a situation where means to an end have become an end
itself. How to get the system to prioritise learning outcomes not just in policy documents but also in
actual practice, i.e. in terms of plans, finances and actions of education bureaucracy all the way down
to schools is going to India's greatest challenge in elementary education in the next few years.
36
The difference in learning outcomes persists even when students‟ background characteristics are taken into account,
although the magnitude declines. See Dr. Wilima Wadhaw‟s article in ASER 2009. For more on effects on learning
outcomes of attending private schools vis-a-vis government schools, see Desai et al (2008), French and Kingdon (2010),
Goyal (2009), Muralidharan and Sundararaman (2013), and Singh (2013). This literature confirms that private schools
are more effective in improving learning outcomes. 37
For details about this startling finding, see Pritchett and Aiyar 2014, forthcoming
15
References
Accountability Initiative (2012): PAISA Report. Centre for Policy Research, New Delhi.
Accountability Initiative (2013): PAISA District Studies (2013), Centre for Policy Research, New
Delhi (forthcoming).
ASER Centre (2011): Annual Status of Education Report. New Delhi.
ASER Centre (2013): Annual Status of Education Report. New Delhi.
Chakrabarti A and R Joglekar (2006): "Determinants of Expenditure on Education: An Empirical
Analysis Using State Level Data", Economic and Political Weekly Vol. 41, No. 15 (Apr. 15-21,
2006), pp. 1465-1472.
Chakraborty, P, A Mukherjee and H. K. Amarnath (2009): "Macro Policy Reform and Sub National
Finance: Why is the Policy Space of the States Shrinking? ", Economic and Political Weekly,
Vol.XLIV, No.14, New Delhi
De, A and T Endow (2008): "Public Expenditure on Education in India: Recent Trends and
Outcomes", RECOUP Working Paper No. 18, Collaborative Research and Dissemination (CORD),
New Delhi.
Desai, S, A Dubey, R Vanneman and R Banerjee (2008): “Private Schooling in India: A New
Educational Landscape”, Brookings-NCAER India Policy Forum, Vol. 5, The Brookings Institution.
French, R and G Kingdon (2010): “The Relative Effectiveness of Private and Government Schools in
Rural India: Evidence from ASER Data”, DoQSS Working Paper, No. 10-03, Institute of Education,
University of London.
Goyal, S (2009): “Inside the House of Learning: The Relative Performance of Public and Private
Schools in Orissa”, Education Economics, 17(3), pp 315-327
16
Goyal, S and P Pandey (2009): "How do Government and Private Schools Differ? Findings from
Two Large Indian States", South Asia Human Development Sector Report 30, World Bank,
Washington DC. Available online at:
http://datatopics.worldbank.org/hnp/files/edstats/INDwp09b.pdf
Kingdon, G. (2005): "Private and Public Schooling: The Indian Experience", prepared for conference
Mobilizing the Private Sector for Public Education (Conference Volume - forthcoming). Kennedy
School of Government, Harvard University, 2006.
http://www.hks.harvard.edu/pepg/PDF/events/MPSPE/PEPG-05-15geeta.pdf
Mehrotra, S (2004): "Reforming public spending on education and mobilising resources: Lessons
from international experience", Economic and Political Weekly, Vol 39 No. 09, February 28, 2004,
pp 987-997.
Mehta, A. C. (2013): "Elementary Education in India: Progress Towards UEE: Analytical Tables,
2012-13", National University of Educational Planning and Administration and Department of
School Education and Literacy, Ministry of Human Resource Development, Government of India.
Ministry of Human Resource Development (2013): Analysis of Budgeted Expenditure on Education
2009-10 to 2011-12, Ministry of Human Resource Development, Government of India, New Delhi.
Ministry of Human Resource Development (2012): Analysis of Budgeted Expenditure on Education
2008-09 to 2010-11, Ministry of Human Resource Development, Government of India, New Delhi.
Ministry of Human Resource Development (2011): Analysis of Budgeted Expenditure on Education
2007-08 to 2009-10, Ministry of Human Resource Development, Government of India, New Delhi.
Mukherjee, A (2013): "Targeting Education Financing on the Marginalized: Lessons from
Implementation of Sarva Shiksha Abhiyan and Right to Education in India", Background paper
prepared for Education for All Global Monitoring Report 2013/4, UNESCO.
Muralidharan, K (2014): "Understanding the relative effectiveness of government and private
schools in India", Ideas for India. Available at: http://ideasforindia.in/article.aspx?article_id=245
[Accessed 17 Aug. 2014].
17
Muralidharan, K and M Kremer (2007): "Public and Private Schools in Rural India", Prepared for
conference Mobilizing the Private Sector for Public Education (Conference Volume - forthcoming).
Kennedy School of Government, Harvard University, 2006.
http://econweb.ucsd.edu/~kamurali/papers/Published%20Edited%20Volume%20Chapters/Public%2
0and%20private%20schools%20in%20rural%20india%20%28Final%20Pre-Publication%29.pdf
Muralidharan, K, J Das, A Holla, A Mohpal (2014): "The Fiscal Cost of Weak Governance:
Evidence from Teacher Absence in India", NBER Working Paper No. 20299. July 2014.
Muralidharan, K and V Sundararaman (2013): “The Aggregate Effect of School Choice: Evidence
from a Two-Stage Experiment in India”, NBER Working Paper no. 19441, National Bureau of
Economic Research, Cambridge, MA.
Singh, A (2013): “Size and Source of the Private School Premium in Test Scores in India”, Mimeo,
University of Oxford.
Tilak, J. B. (2006): "On Allocating 6 percent of GDP to Education", Economic and Political Weekly
Vol. 41, No. 7 (Feb. 18-24, 2006), pp. 613-618.
Tilak, J. B. (2007): "The Kothari Commission and Financing of Education", Economic and Political
Weekly Vol. 41, No. 7 (Feb. 18-24, 2006), pp. 613-618.
18
Table 1: Public Expenditure on EE (2011-12)
1 2 3
State
Total Public
Expenditure
(Rs. crore)
Enrolment in
Government
Schools
(According
to DISE)
Per govt.
school
student
public
expenditure
(incl.
students
only in
public
schools;
excluding
private
aided
schools)
Andhra Pradesh 8561 6175060 13864
Assam 4539 4174185 10874
Bihar 9265 20519815 4515
Chhattisgarh 4608 3789376 12160
Gujarat 8003 5982181 13377
Haryana 3805 2135714 17817
Himachal Pradesh 1883 695417 27073
Jammu & Kashmir 2110 1152609 18304
Jharkhand 3251 5390338 6031
Karnataka 7319 4783689 15300
Kerala 4062 1007249 40328
Madhya Pradesh 8244.5 10221216 8066
Maharashtra 15188 7231470 21002
Odisha 4688 5565229 8424
Punjab 1662 2193899 7577
Rajasthan 8283.5 7155509 11576
Tamil Nadu 6357 4226225 15042
Uttaranchal 1870 907931 20596
Uttar Pradesh 18126 19585396 9255
West Bengal 7897 13256933 5957
Source: Author calculations
19
Table 2: Private Expenditure on EE - 2007-08 and 2011-12
1 2 3 4
State
Private
expenditure per
student (Private
Aided and
unaided)- NSS
2007-08
Private
expenditure
per student
(Governmen
t and
Local)- NSS
2007-08
Private
expenditure
per student
(Private
Aided and
unaided)-
Inflation
adjusted,
2011-12
Private
expenditure
per student
(Government
and Local)-
Inflation
Adjusted,
2011-12
Andhra Pradesh 4050.67 146.01 5507.44 198.52
Assam 4871.78 237.36 6552.79 319.26
Bihar 3233.42 242.29 4630.26 346.97
Chhattisgarh 4559.37 101.54 5957.46 132.67
Gujarat 5023.02 207.19 6580.52 271.44
Haryana 6260.33 332.88 8949.02 475.84
Himachal Pradesh 8034.73 285.21 11128.76 395.04
Jammu & Kashmir 4919.76 402.68 6987.69 571.93
Jharkhand 3869.00 172.25 4695.89 209.06
Karnataka 4664.68 135.03 6361.91 184.16
Kerala 4101.34 342.48 5413.46 452.05
Madhya Pradesh 2984.25 144.92 3866.46 187.76
Maharashtra 4425.29 212.46 5961.03 286.19
Odisha 4382.88 306.36 5761.21 402.71
Punjab 6772.28 305.13 9081.77 409.18
Rajasthan 3242.36 162.42 4871.59 244.03
Tamil Nadu 5634.55 203.05 7518.85 270.95
Uttaranchal 4316.50 260.34 5693.78 343.41
Uttar Pradesh 2284.67 168.35 3106.68 228.92
West Bengal 4927.57 541.95 6788.98 746.68
Source: Author calculations using NSS 2007-08
20
Table 3: Estimating Number & Proportion of Students in Private Schools (Elementary Level)
1 2 3 4 5 6
State
Enrolment
in
Government
Schools
(According
to DISE)
% Out of
school
Children
(6-14)-
ASER
2011
Population
6-14
(Census
2011)
Total
Enrolment
Private
enrolment
(Total
Enrolment -
Government
Enrolment)
% of
children
enrolled in
private
schools
(private &
private
Aided)
Andhra Pradesh 6175060 2.80% 14064894 13671076.97 7496016.97 54.83
Assam 4174185 4.19% 6311350 6046904.44 1872719.44 30.97
Bihar 20519815 2.95% 25884060 25120480.23 4600665.23 18.31
Chhattisgarh 3789376 2.40% 5078983 4957087.41 1167711.41 23.56
Gujarat 5982181 2.66% 10799915 10512637.26 4530456.26 43.10
Haryana 2135714 1.37% 4647445 4583775.00 2448061.00 53.41
Himachal Pradesh 695417 0.55% 1112722 1106602.03 411185.03 37.16
Jammu & Kashmir 1152609 2.46% 2522690 2460631.83 1308022.83 53.16
Jharkhand 5390338 4.65% 7378660 7035552.31 1645214.31 23.38
Karnataka 4783689 2.79% 9890833 9614878.76 4831189.76 50.25
Kerala 1007249 0.08% 4865196 4861303.84 3854054.84 79.28
Madhya Pradesh 10221216 2.23% 15159950 14821883.12 4600667.12 31.04
Maharashtra 7231470 1.08% 18544808 18344524.07 11113054.07 60.58
Odisha 5565229 3.71% 7595282 7313497.04 1748268.04 23.90
Punjab 2193899 1.56% 4472651 4402877.64 2208978.64 50.17
Rajasthan 7155509 4.49% 14716568 14055794.10 6900285.10 49.09
Tamil Nadu 4226225 0.85% 10649321 10558801.77 6332576.77 59.97
Uttaranchal 907931 1.09% 1986077 1964428.76 1056497.76 53.78
Uttar Pradesh 19585396 6.13% 45667504 42868086.00 23282690.00 54.31
West Bengal 13256933 4.32% 15724524 15045224.56 1788291.56 11.89
Source: Author calculations
21
Table 4: Total & Per Student Private Expenditure (2011-12)
1 2 3 4
State
Total
Private
Expenditure
for Students
attending
Private
schools (Rs.
Crore)
Total Private
Expenditure for
students
attending Public
Schools (Rs.
Crore)
Total Private
Expenditure for
students
attending private
schools and
public schools
(Rs. Crore)
Per student
private
expenditure (Rs.)
Andhra Pradesh 4128.39 122.59 4250.97 3109.46
Assam 1227.15 133.27 1360.42 2249.78
Bihar 2130.23 711.97 2842.20 1131.43
Chhattisgarh 695.66 50.27 745.93 1504.78
Gujarat 2981.28 162.38 3143.66 2990.36
Haryana 2190.77 101.63 2292.40 5001.12
Himachal Pradesh 457.60 27.47 485.07 4383.42
Jammu & Kashmir 914.01 65.92 979.93 3982.42
Jharkhand 772.57 112.69 885.27 1258.27
Karnataka 3073.56 88.09 3161.65 3288.29
Kerala 2086.38 45.53 2131.91 4385.47
Madhya Pradesh 1778.83 191.91 1970.74 1329.62
Maharashtra 6624.53 206.96 6831.48 3723.99
Odisha 1007.21 224.12 1231.33 1683.64
Punjab 2006.14 89.77 2095.91 4760.33
Rajasthan 3361.54 174.61 3536.15 2515.79
Tamil Nadu 4761.37 114.51 4875.88 4617.83
Uttaranchal 601.55 31.18 632.73 3220.92
Uttar Pradesh 7233.18 448.35 7681.54 1791.90
West Bengal 1214.07 989.86 2203.93 1464.87
Source: Author calculations
22
Table 5: Public, Private and Combined Expenditure (total and per capita) on EE
1 2 3 4 5 6 7 8
State
Total
Expenditure
on EE (Rs.
Crore)
Per Student
Expenditure
on EE (Total
Expenditure
/ Total
Enrolment)
Per student
private
expenditure
on EE (incl
govt and
private school
students)
Per student
public
expenditure
on EE (incl.
govt and
private school
students)
Gross
Domestic
State
Product
(GSDP,
Rs. Crore)
[Total
Expenditure/
GSDP]
Per Capita
Income
(NSDP)
[Per Student total
expenditure/Per
capita income]
Andhra Pradesh 12811.97 9371.59 3109.46 6262.13 655181 1.96 68969.69 13.59
Assam 5899.53 9756.28 2249.78 7506.5 126544 4.66 37250 26.19
Bihar 11945.14 4755.14 1131.43 3623.71 246487 4.85 22691.12 20.96
Chhattisgarh 5353.88 10800.45 1504.78 9295.66 139515 3.84 46743.45 23.11
Gujarat 11146.22 10602.69 2990.36 7612.33 611767 1.82 89667.98 11.82
Haryana 6097.52 13302.39 5001.12 8301.28 307606 1.98 109063.55 12.2
Himachal Pradesh 2372.82 21442.41 4383.42 17058.99 63812 3.72 74693.52 28.71
Jammu & Kashmir 3089.67 12556.41 3982.42 8573.98 65979 4.68 44533 28.2
Jharkhand 4136.01 5878.73 1258.27 4620.46 130505 3.17 35652.14 16.49
Karnataka 10480.56 10900.36 3288.29 7612.06 463243 2.26 69051 15.79
Kerala 6193.98 12741.39 4385.47 8355.92 315206 1.97 80924 15.74
Madhya Pradesh 10966.31 7398.73 1329.62 6069.11 309687 3.54 37994.5 19.47
Maharashtra 21901.2 11938.82 3723.99 8214.83 1248453 1.75 101314.29 11.78
Odisha 5919.58 8094.04 1683.64 6410.4 215899 2.74 41896 19.32
Punjab 3758.14 8535.64 4760.33 3775.31 259223 1.45 78593.94 10.86
Rajasthan 13462.77 9578.09 2515.79 7062.3 416755 3.23 53735.27 17.82
Tamil Nadu 11233.15 10638.66 4617.83 6020.83 639025 1.76 84496 12.59
Uttaranchal 2502.72 12740.21 3220.92 9519.29 93162 2.69 79939.81 15.94
Uttar Pradesh 25807.66 6020.25 1791.9 4228.35 684173 3.77 30050.69 20.03
West Bengal 10101.28 6713.95 1464.87 5249.08 544282 1.86 55222 12.16
Source: Author calculations
23
Table 6: Per student teacher salaries
States
Proportion of
budget for
Teacher
Salaries
Public
expenditure per
government
school student
Public
expenditure
on teacher
salaries per
government
school student
Public expenditure
excluding teacher
salaries per
government school
student
Andhra Pradesh 66% 13864 9097 4768
Bihar 59% 4515 2659 1857
Himachal Pradesh 80% 27073 21582 5492
Madhya Pradesh 63% 8066 5058 3008
Maharashtra 66% 21002 13893 7110
Rajasthan 87% 11576 10058 1518
Source: Author calculations
Table 7: Component-wise expenditures on EE
States/Components
Andhra
Pradesh Bihar
Madhya
Pradesh Maharashtra Rajasthan
Himachal
Pradesh
Teachers (Salary, training and
teaching inputs) 69% 62% 74% 69% 88% 82%
School Infrastructure 17% 18% 11% 5% 5% 4%
Children Entitlements
and Children Mainstreaming 6% 13% 7% 3% 1% 2%
Quality 1% 0% 1% 0% 0% 1%
Management 3% 1% 5% 14% 5% 6%
Misc 0% -5% 1% 0% 0% 1%
MDM 4% 11% 1% 9% NA 5%
Total 100% 100% 100% 100% 100% 100%
Source: Accountability Initiative (2013)
24
Table 8: Per Student Public and Private Expenditure, and Learning Outcomes
1 2 3 4 5 6 7 8 9 10 11
State
% children in
std. 1-2 who
can read letters,
words or more
% children in
std. 3-5 who
can read std. 1
text or more
% children in
std. 1-2 who
can recognise
numbers 1-9 or
more
% children in
std. 3-5 who
can do
subtraction or
more
Private
expenditure
per student
enrolled in
private
school
Public
expenditure
per student
enrolled in
gov. school
Ratio
(col. 10/
col. 9)
Gov.
school
Private
School
Gov.
school
Private
School
Gov.
school
Private
School
Gov.
school
Private
School
Andhra Pradesh 81.39 94.14 65.81 78.47 85.02 95.08 59.89 72.61 5507.44 13864 2.52
Assam 70.8 85.87 48.18 59.63 73.5 85.83 33.6 48.25 6552.79 10874 1.66
Bihar 57.87 83.17 51.95 79.45 61.75 84.14 48.76 76.02 4630.26 4515 0.98
Chhattisgarh 73.35 90.38 51.07 68.39 72.24 89.5 38.56 58.09 5957.46 12160 2.04
Gujarat 78.73 92.93 62.72 77.42 78.89 91.69 43.39 64.17 6580.52 13377 2.03
Haryana 71.43 92.03 59.55 85.28 75.09 92.83 52.81 80.95 8949.02 17817 1.99
Himachal Pradesh 89.82 97.91 79.95 90.5 93.21 98.42 70.97 85.74 11128.76 27073 2.43
Jammu &
Kashmir 86.92 96.66 45.81 79.55 88.67 96.73 39.14 73.6 6987.69 18304 2.62
Jharkhand 61.05 83.61 46.97 69.52 61.07 83.65 38.47 59.24 4695.89 6031 1.28
Karnataka 83.35 93.32 59.82 69.27 83.63 94.09 46.45 58.98 6361.91 15300 2.40
Kerala 95.68 97.91 80.06 83.97 95.34 97.69 61.41 71.42 5413.46 40328 7.45
Madhya Pradesh 59.92 82.65 39.31 67.56 58.52 81.01 26.33 50.88 3866.46 8066 2.09
Maharashtra 90.22 93.01 74.88 85.48 90.6 92.35 51.59 65.67 5961.03 21002 3.52
Odisha 66.05 89.32 53.5 78.81 63.8 88.45 40.1 66.81 5761.21 8424 1.46
Punjab 85.99 89.75 75.28 75.96 88.44 93.11 72.55 75.2 9081.77 7577 0.83
Rajasthan 55.93 80.79 44.91 67.5 57.45 80.85 31.65 57.84 4871.59 11576 2.38
Tamil Nadu 58.94 71.85 51.43 49.68 65.19 77.88 40.59 49.65 7518.85 15042 2.00
Uttaranchal 75.37 89.66 64.07 77.24 73.12 89.03 49.75 66.59 5693.78 20596 3.62
Uttar Pradesh 52.25 79.49 34.67 66.06 54.38 81.63 23.77 50.58 3106.68 9255 2.98
West Bengal 79.49 93.44 58.23 74.77 84.24 94.39 50.95 67.28 6788.98 5957 0.88
25
Figure 1: Per Capita Income & Public Expenditure on EE (as a % of GSDP)
Source: Author calculations, Data collected from Central Statistical Organization
Figure 2: Per Capita Income and Public Expenditure per student enrolled in government school (Rs.)
BH
UPJH
AS
MP
OD
JKCHH
RJ
WBAP
KA
HP
PJ
UTT
KE
TN
GJMH HR
01
23
4
Public
Expenditure
as a
pro
port
ion o
f G
SD
P (
%)
20000 40000 60000 80000 100000 120000Per Capita Income (NSDP)
BH
UP
JH
AS
MP OD
JK
CHH RJ
WB
APKA
HP
PJ
UTT
KE
TN
GJ
MH
HR
0
100
00
200
00
300
00
400
00
Pu
blic
Exp. p
er
stu
de
nt in
go
vern
men
t scho
ol
20000 40000 60000 80000 100000 120000Per Capita Income (NSDP)
26
Figure 3: Public expenditure per student enrolled in government schools and Proportion of Children
in Grades 1 and 2 who can read letters, words or more
Source: Author calculations from ASER 2011
Figure 4: Public expenditure per student enrolled in government schools and Proportion of Children
in Grades 3 to 5 who can read grade 1 level text
BH
WB
JH
PJ
MP
OD
UP
AS
RJ
CHH
GJ
AP
TN
KA
HR
JK
UTT
MH HP
KE
50
60
70
80
90
100
% c
hild
ren in
std
1-2
(g
ov s
cho
ols
) w
ho
ca
n
read
lette
rs, w
ord
s o
r m
ore
0 10000 20000 30000 40000Per student public expenditure (incl. students in public schools only)
BH
WB
JH
PJ
MP
OD
UP
AS
RJ
CHH
GJ
AP
TN
KA HR
JK
UTT
MH
HP KE
30
40
50
60
70
80
% c
hild
ren in
std
3-5
(g
ov s
cho
ols
) w
ho
ca
n
read
std
. 1
text o
r m
ore
0 10000 20000 30000 40000Per student public expenditure (incl. students in public schools only)
27
Figure 5: Public expenditure per student enrolled in government schools and Proportion of Children
in Grades 1 to 2 who can recognise numbers 1-9 or more
Figure 6: Public expenditure per student enrolled in government schools and Proportion of Children
in Grades 3 to 5 who can do subtraction or more
BH
WB
JH
PJ
MP
OD
UP
AS
RJ
CHH
GJ
AP
TN
KA
HR
JK
UTT
MH
HP
KE
50
60
70
80
90
100
% c
hild
ren in
std
1-2
(g
ov s
cho
ols
) w
ho
ca
n
recog
nis
e n
um
be
rs 1
-9 o
r m
ore
0 10000 20000 30000 40000Per student public expenditure (incl. students in public schools only)
BH
WB
JH
PJ
MP
OD
UP
ASRJ
CHH
GJ
AP
TN
KA
HR
JK
UTTMH
HP
KE
20
30
40
50
60
70
% c
hild
ren in
std
3-5
(g
ov s
cho
ols
) w
ho
ca
n
do s
ub
tra
ction
or
mo
re
0 10000 20000 30000 40000Per student public expenditure (incl. students in public schools only)
28
Appendix
Table A.1: Number of students in the NSS 64th
round who are at elementary (Grades one to eight)
level
Public
schools
Private
schools
Public and
Private
schools
Andhra Pradesh 1528 957 2500
Assam 968 134 1104
Bihar 4004 451 4470
Chhattisgarh 858 148 1011
Gujarat 1283 427 1719
Haryana 393 434 833
Himachal Pradesh 464 172 639
Jammu & Kashmir 399 288 692
Jharkhand 1022 174 1206
Karnataka 959 426 1391
Kerala 238 480 718
Madhya Pradesh 2367 719 3113
Maharashtra 1948 836 2795
Odisha 1568 197 1770
Punjab 430 553 1008
Rajasthan 1447 975 2440
Tamil Nadu 1220 681 1901
Uttaranchal 435 261 698
Uttar Pradesh 4020 2356 6448
West Bengal 2209 311 2527