Embed Size (px)
Citation preview
How Much Information? “Big Data”
Research Findings for Consumer and
Enterprise Information
Big Data 2015 Research Event Center for Large Scale Data Systems Research Yahoo! Great America Campus Santa Clara, CA September 23, 2011
Jim Short and Chaitan Baru San Diego Supercomputer Center University of California, San Diego Sept 23, 2011
What is HMI? • A research program at UCSD and SDSC
▫ Next generation Lyman and Varian studies (2000, 2003)
• Sponsored by an industry consortium • Our goal: to create a methodology and census of
consumer and enterprise information ▫ How much is there?
▫ Of what types?
▫ How is it created and where does it go?
▫ Next phase: Where is value created and retained?
• What was produced in Phase 1? ▫ Methodology and baseline numbers, cases and implications
• Where are you taking it? ▫ Where information value is created and retained
2
Agenda • Review HMI’s Key Findings
▫ Consumer Information Report ▫ Enterprise Server Report
• Including: ▫ Three metrics for measuring consumer information ▫ A new way to measure server activity that aggregates capacity
over very different kinds of servers, using a common metric ▫ New data on price/performance across different benchmarks and
server classes ▫ Identify methods for defining and measuring data and
information value
• Future Research
3
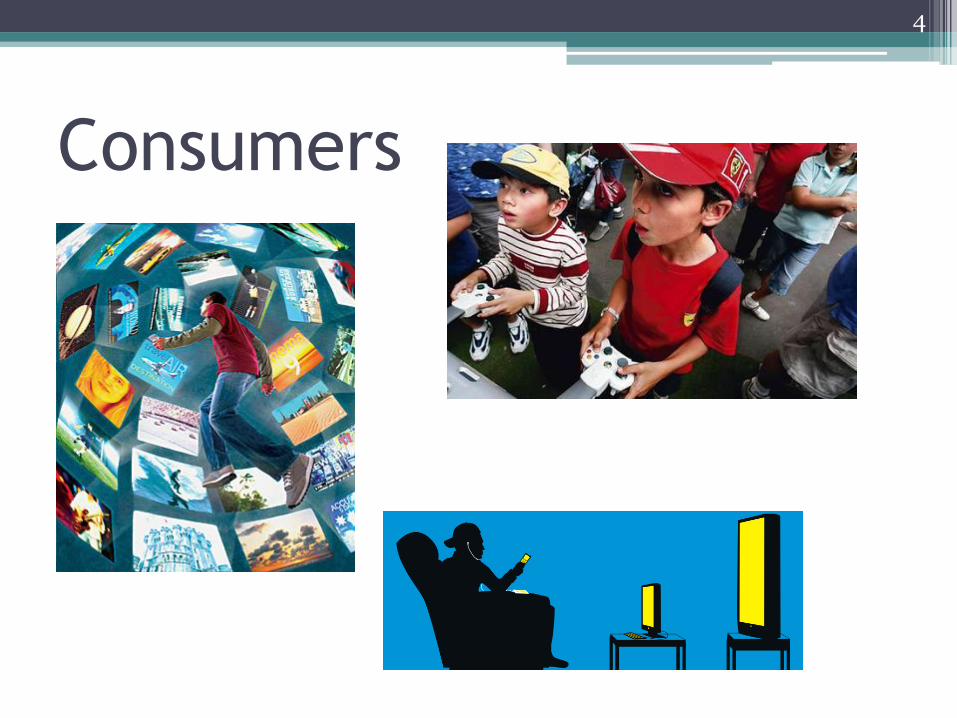
Consumers
4
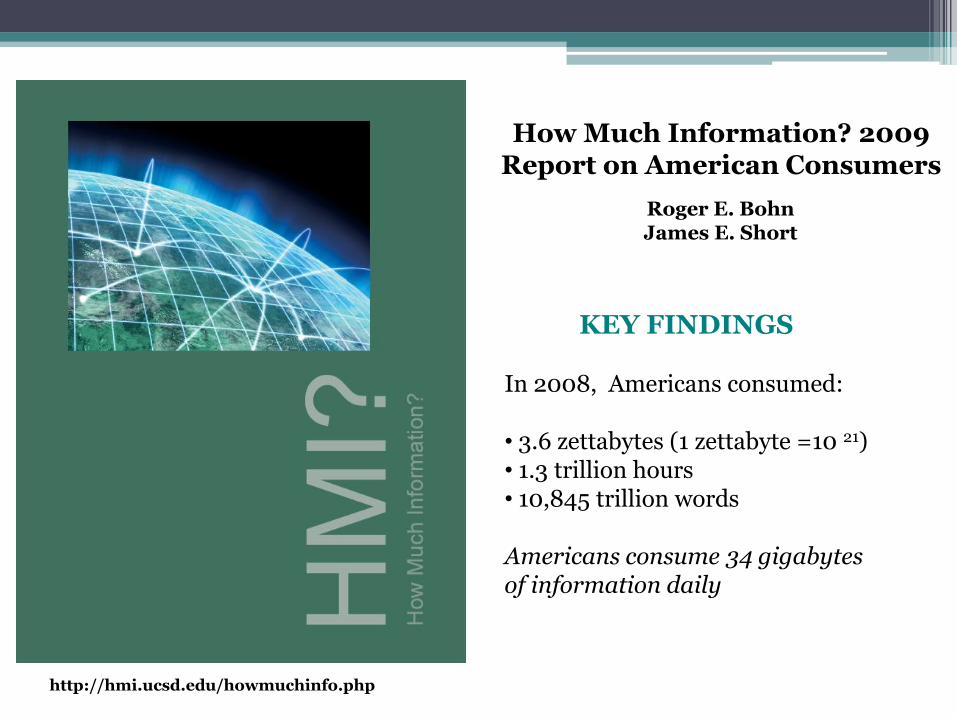
How Much Information? 2009 Report on American Consumers
Roger E. Bohn James E. Short
KEY FINDINGS
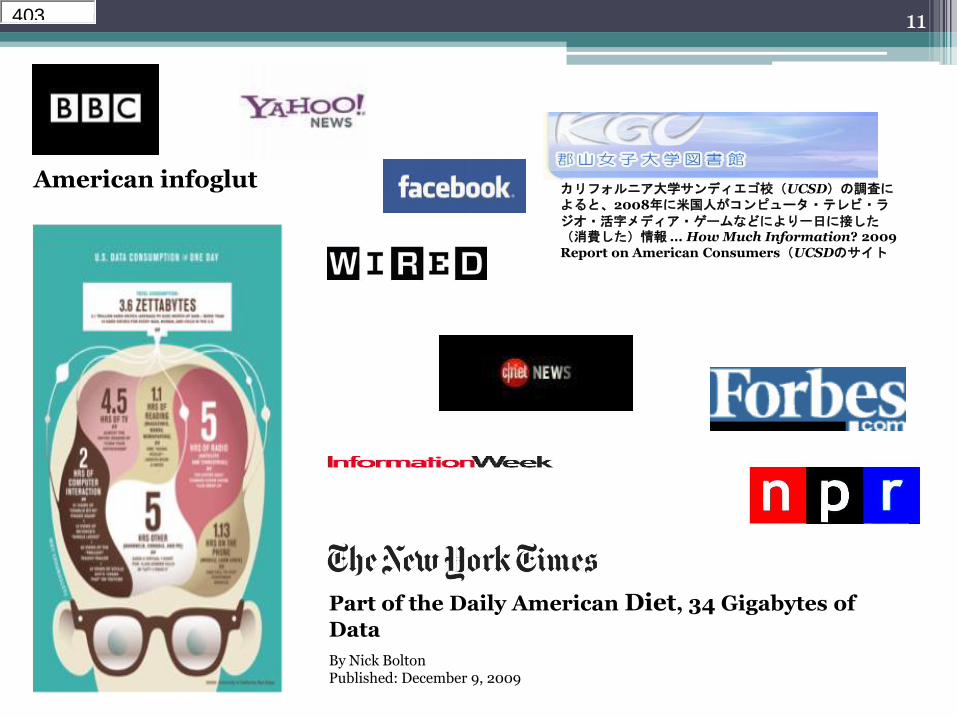
In 2008, Americans consumed: • 3.6 zettabytes (1 zettabyte =10 21) • 1.3 trillion hours • 10,845 trillion words
Americans consume 34 gigabytes of information daily
http://hmi.ucsd.edu/howmuchinfo.php
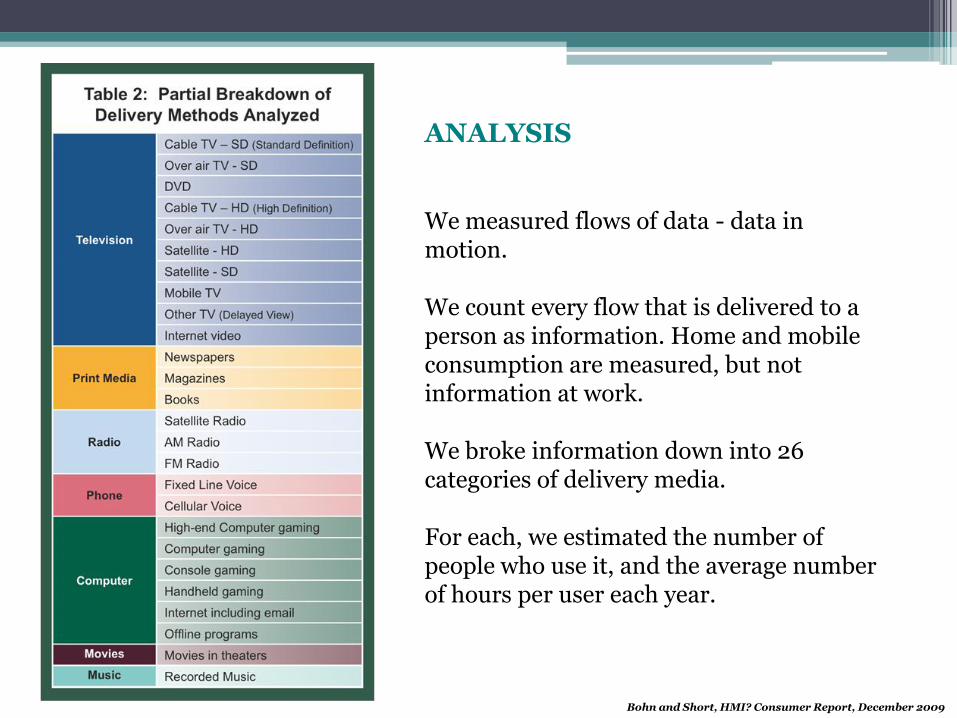
ANALYSIS We measured flows of data - data in motion. We count every flow that is delivered to a person as information. Home and mobile consumption are measured, but not information at work. We broke information down into 26 categories of delivery media. For each, we estimated the number of people who use it, and the average number of hours per user each year.
Bohn and Short, HMI? Consumer Report, December 2009
7
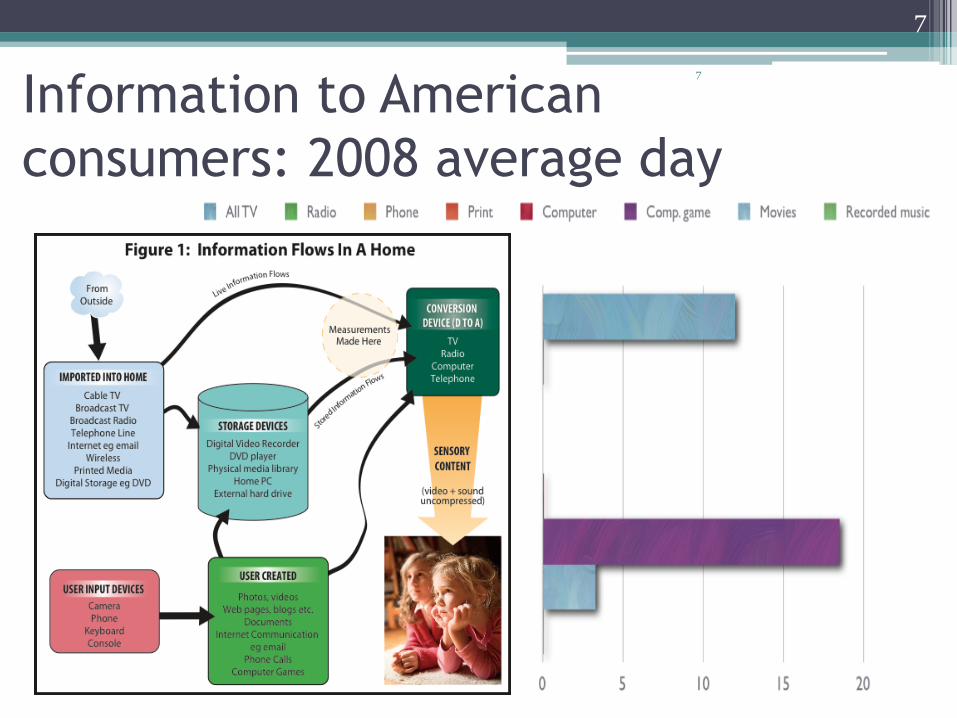
Information to American
consumers: 2008 average day
7

8
34 GB, 12 hours, 100000 words
InfoC in
GB/day
InfoW in
words/day
Hours per
day
TV (incl. DVR,
Internet, mobile) 12.0 44,342 4.9
Radio 0.1 8,315 2.2
Phone 0.01 5,269 0.7
Print 0.01 8,659 0.6
Computer 0.08 27,122 1.9
Computer games 18.5 2,459 0.9
Movies 3.3 198 0.03
Recorded music 0.08 1,112 0.45
Total 34.0 ~100,000 ~ 12
8
9
10
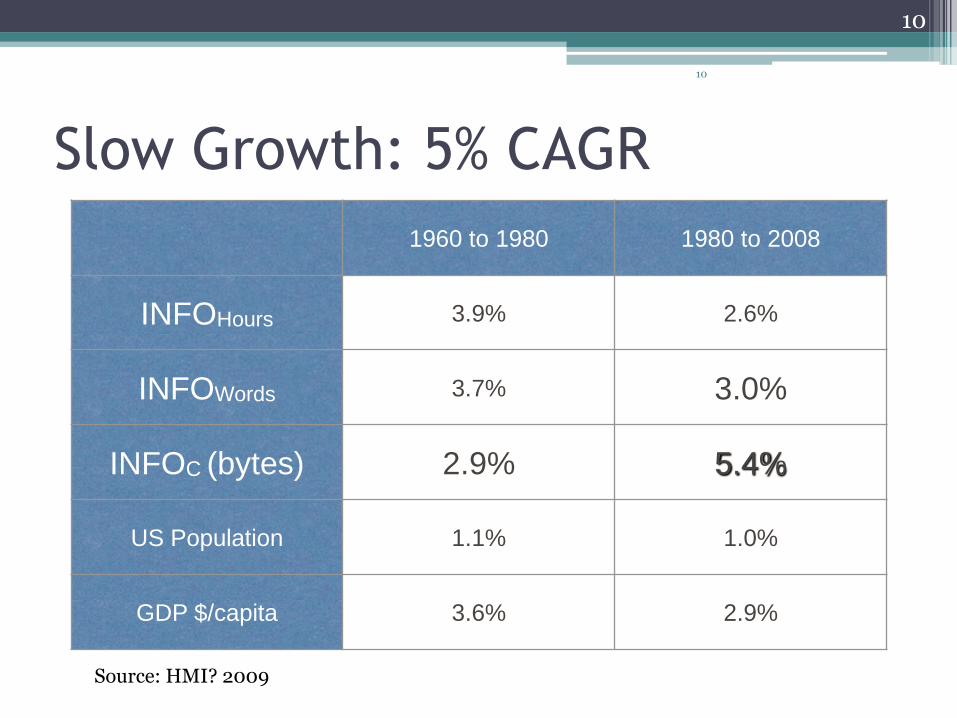
Slow Growth: 5% CAGR
1960 to 1980 1980 to 2008
INFOHours 3.9% 2.6%
INFOWords 3.7% 3.0%
INFOC (bytes) 2.9% 5.4%
US Population 1.1% 1.0%
GDP $/capita 3.6% 2.9%
Source: HMI? 2009
10
11
Part of the Daily American Diet, 34 Gigabytes of
Data
By Nick Bolton Published: December 9, 2009
カリフォルニア大学サンディエゴ校(UCSD)の調査によると、2008年に米国人がコンピュータ・テレビ・ラ
ジオ・活字メディア・ゲームなどにより一日に接した(消費した)情報 ... How Much Information? 2009 Report on American Consumers(UCSDのサイト
American infoglut
Part of theBy NICK Bhttp://wwwdefaultDEC 10 2The New Ynytimes.co403
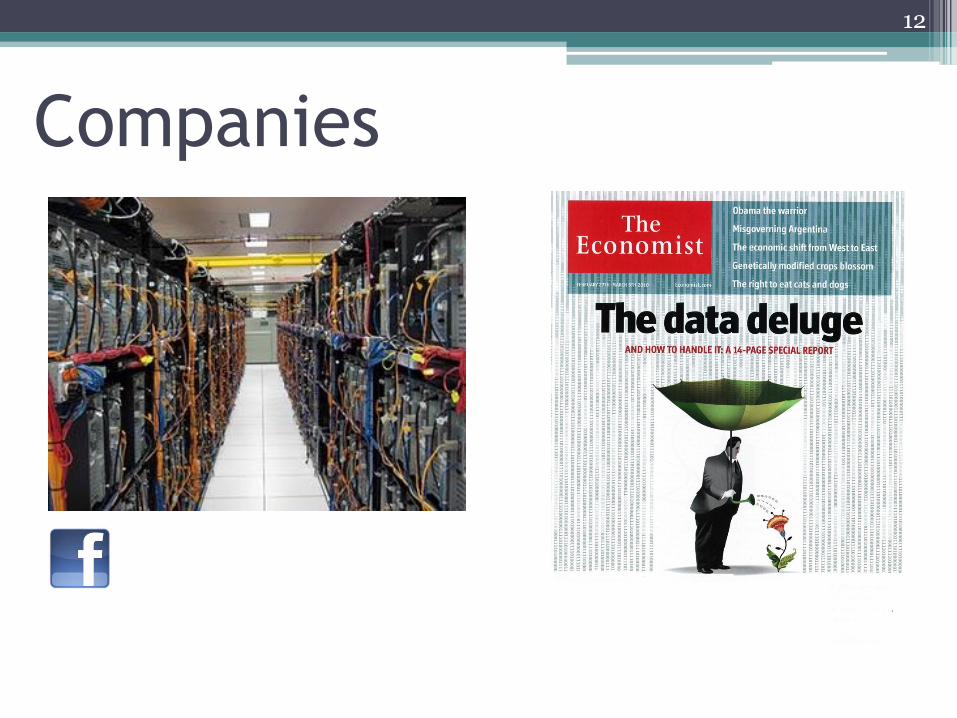
Companies
12
13
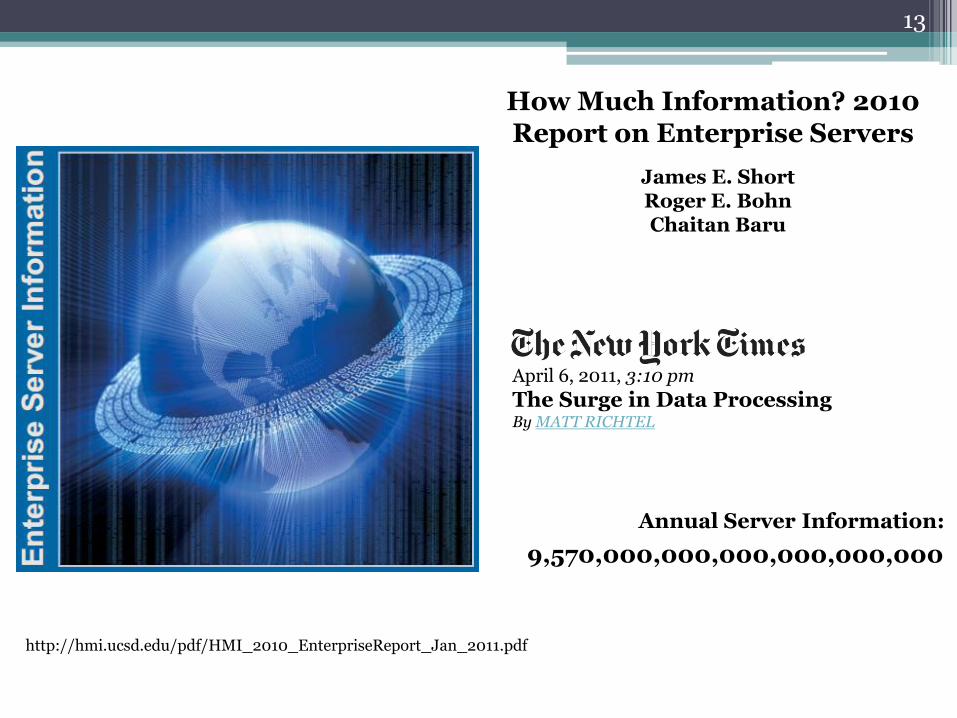
How Much Information? 2010 Report on Enterprise Servers
James E. Short Roger E. Bohn Chaitan Baru
http://hmi.ucsd.edu/pdf/HMI_2010_EnterpriseReport_Jan_2011.pdf
9,570,000,000,000,000,000,000
Annual Server Information:
April 6, 2011, 3:10 pm
The Surge in Data Processing By MATT RICHTEL
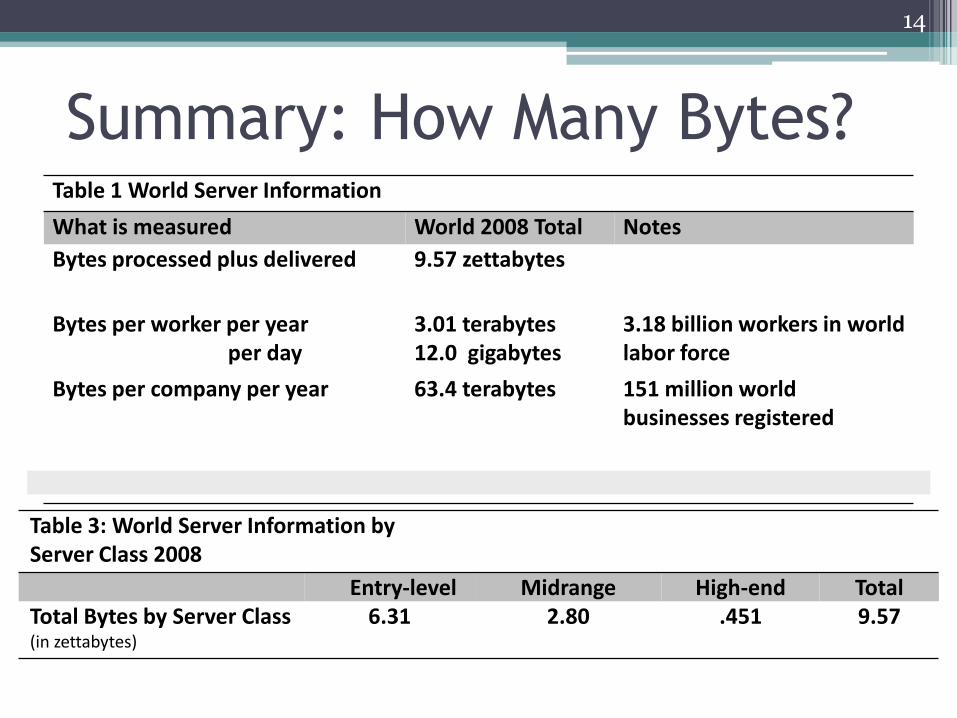
Summary: How Many Bytes? Table 1 World Server Information
What is measured World 2008 Total Notes
Bytes processed plus delivered 9.57 zettabytes
Bytes per worker per year per day
3.01 terabytes 12.0 gigabytes
3.18 billion workers in world labor force
Bytes per company per year 63.4 terabytes 151 million world businesses registered
Table 3: World Server Information by Server Class 2008
Entry-level Midrange High-end Total Total Bytes by Server Class 6.31 2.80 .451 9.57 (in zettabytes)
14
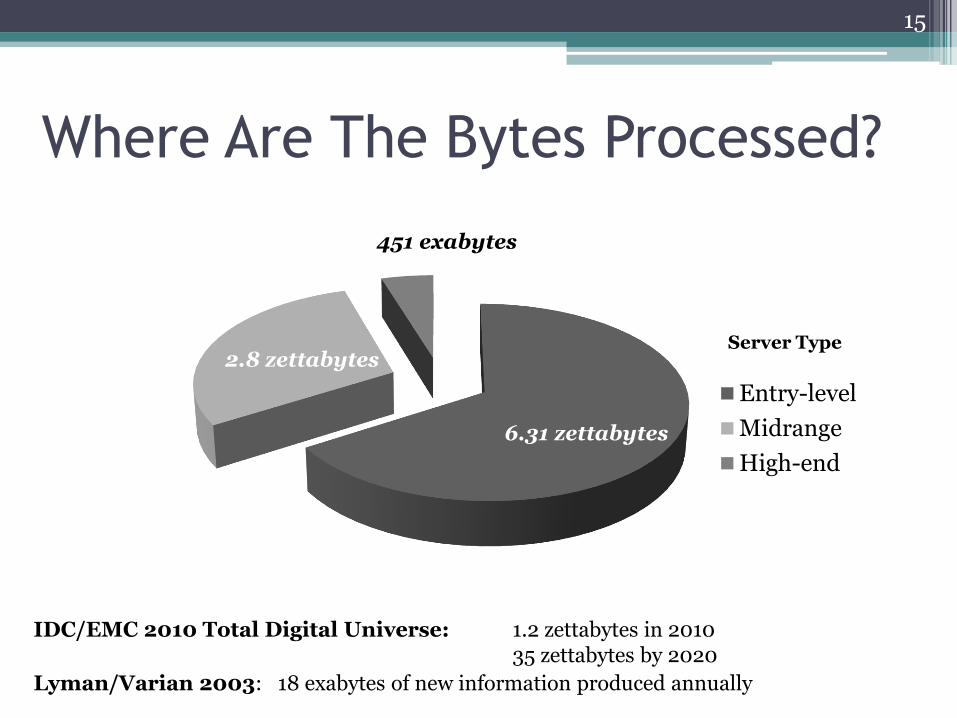
Where Are The Bytes Processed?
15
Entry-level
Midrange
High-end
Server Type
6.31 zettabytes
2.8 zettabytes
451 exabytes
IDC/EMC 2010 Total Digital Universe: 1.2 zettabytes in 2010 35 zettabytes by 2020
Lyman/Varian 2003: 18 exabytes of new information produced annually
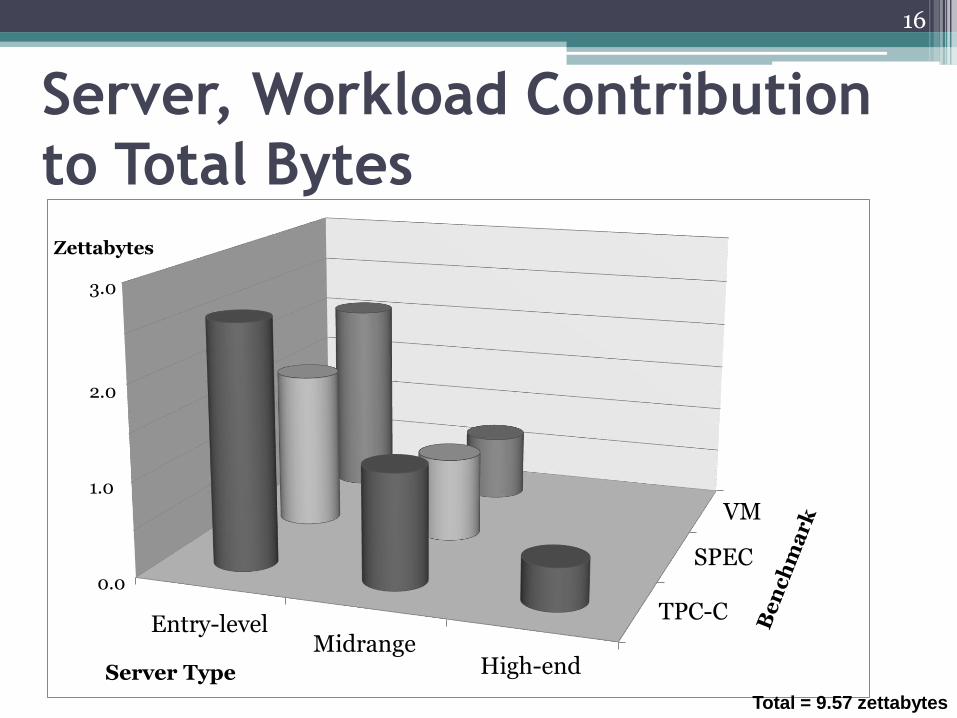
Server, Workload Contribution
to Total Bytes
16
TPC-C
SPEC
VM
Entry-level Midrange
High-end Server Type
Total = 9.57 zettabytes
3.0
2.0
1.0
0.0
Zettabytes
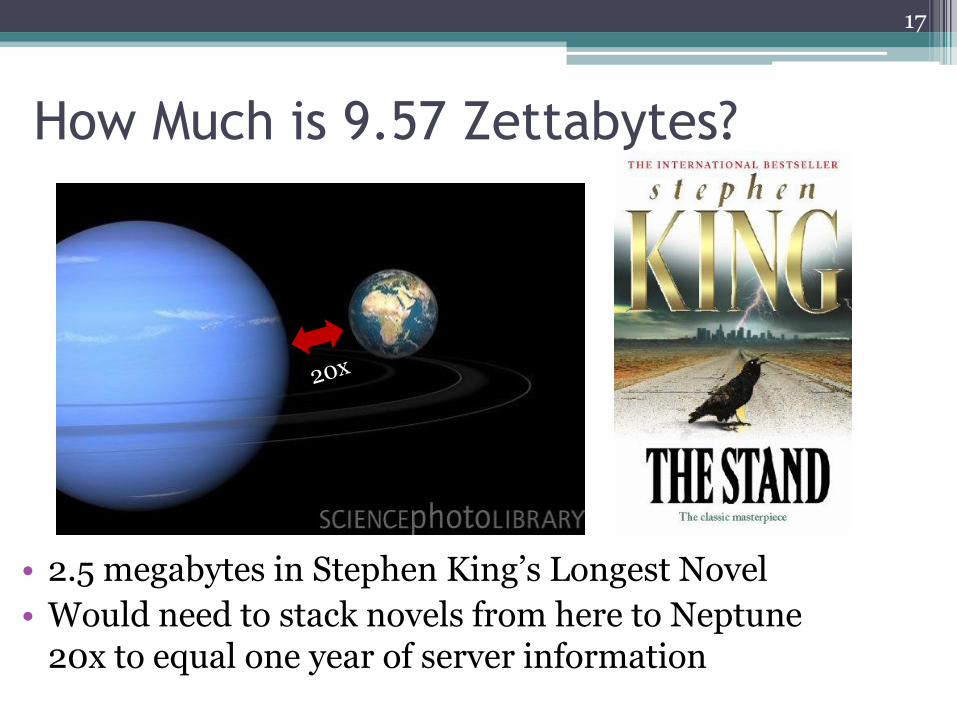
How Much is 9.57 Zettabytes?
• 2.5 megabytes in Stephen King’s Longest Novel
• Would need to stack novels from here to Neptune 20x to equal one year of server information
17
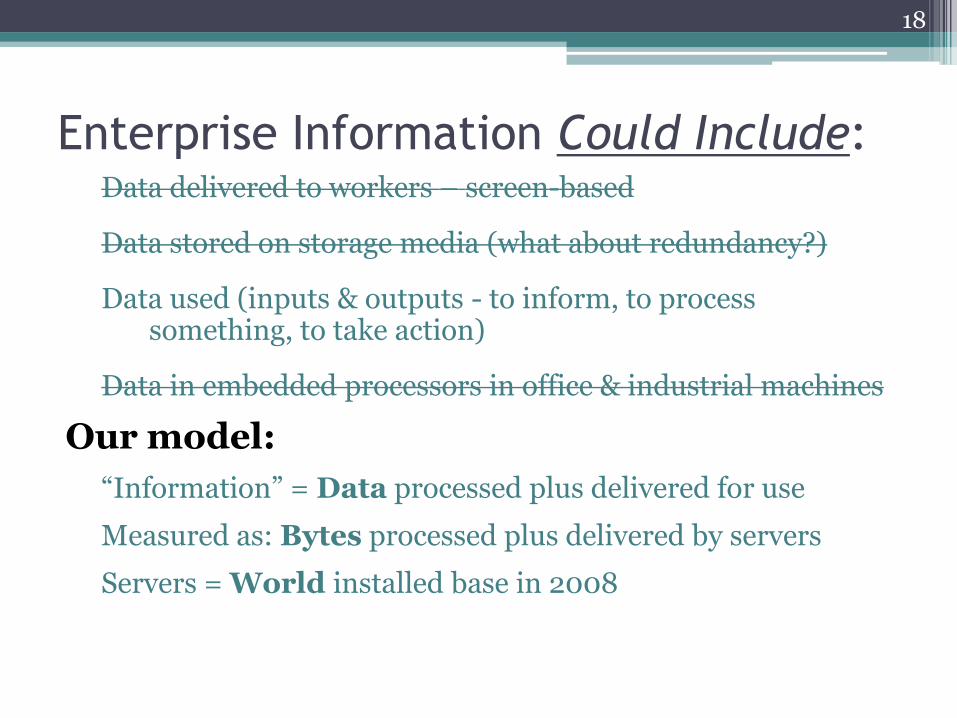
Enterprise Information Could Include: Data delivered to workers – screen-based
Data stored on storage media (what about redundancy?)
Data used (inputs & outputs - to inform, to process something, to take action)
Data in embedded processors in office & industrial machines
Our model:
“Information” = Data processed plus delivered for use
Measured as: Bytes processed plus delivered by servers
Servers = World installed base in 2008
18
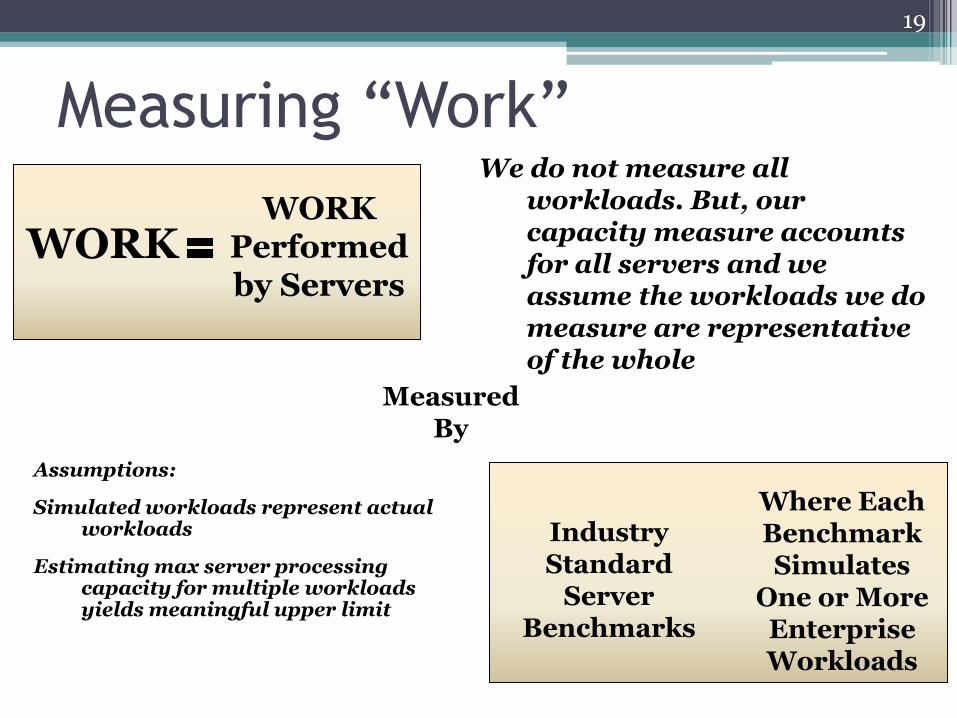
Measuring “Work”
Assumptions:
Simulated workloads represent actual workloads
Estimating max server processing capacity for multiple workloads yields meaningful upper limit
WORK WORK
Performed by Servers
Measured By
Industry Standard
Server Benchmarks
Where Each Benchmark Simulates
One or More Enterprise Workloads
We do not measure all workloads. But, our capacity measure accounts for all servers and we assume the workloads we do measure are representative of the whole
19
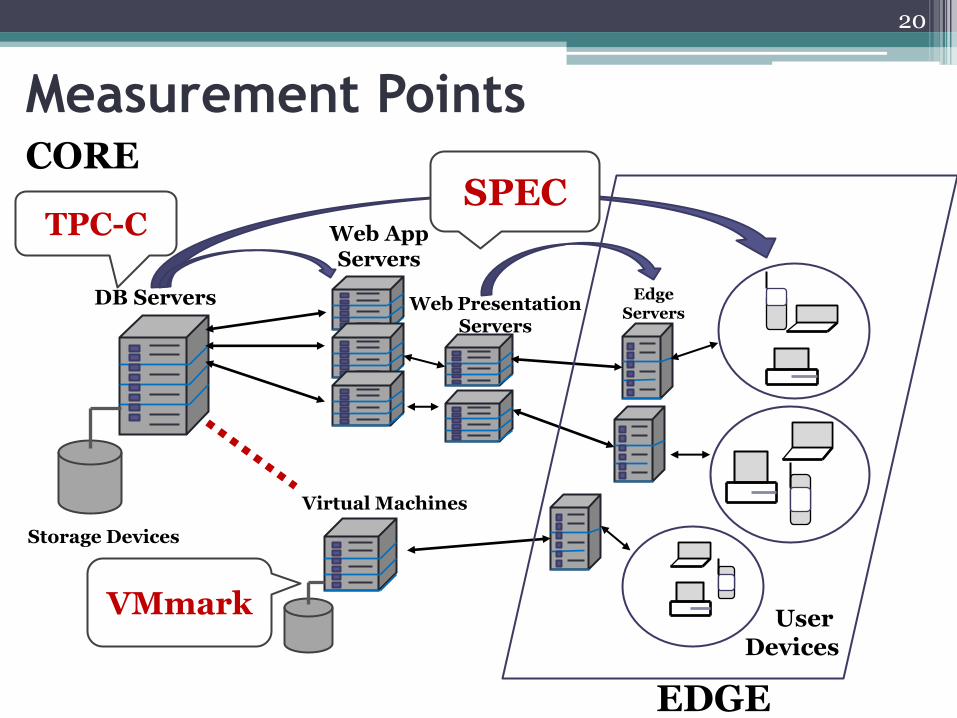
Measurement Points
DB Servers
Web App Servers
Web Presentation Servers
Edge Servers
Storage Devices
User Devices
Virtual Machines
SPEC
VMmark
TPC-C
EDGE
CORE
20
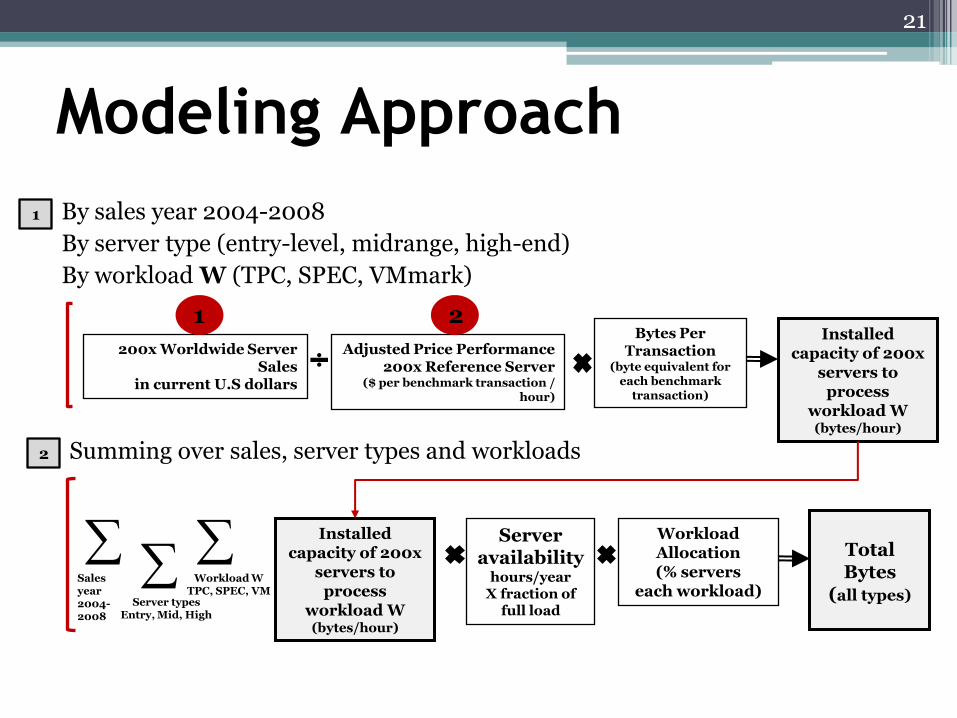
Modeling Approach
Adjusted Price Performance 200x Reference Server
($ per benchmark transaction / hour)
200x Worldwide Server Sales
in current U.S dollars
By server type (entry-level, midrange, high-end)
By workload W (TPC, SPEC, VMmark)
1
2
Workload Allocation (% servers
each workload)
Bytes Per Transaction
(byte equivalent for each benchmark
transaction)
Total Bytes
(all types)
Server availability
hours/year X fraction of
full load
By sales year 2004-2008
Installed capacity of 200x
servers to process
workload W (bytes/hour)
Installed capacity of 200x
servers to process
workload W (bytes/hour)
Sales year 2004-2008
Workload W TPC, SPEC, VM
Server types Entry, Mid, High
Summing over sales, server types and workloads
1 2
21
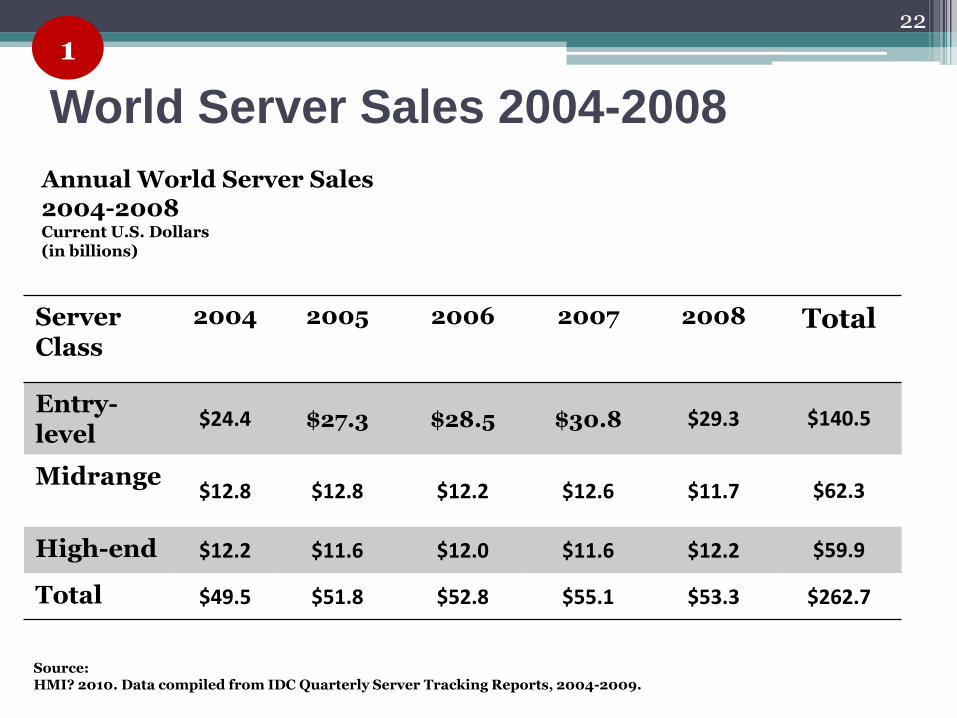
World Server Sales 2004-2008
Server Class
2004 2005 2006 2007 2008 Total
Entry-level
$24.4 $27.3 $28.5 $30.8 $29.3 $140.5
Midrange $12.8 $12.8 $12.2 $12.6 $11.7 $62.3
High-end $12.2 $11.6 $12.0 $11.6 $12.2 $59.9
Total $49.5 $51.8 $52.8 $55.1 $53.3 $262.7
Annual World Server Sales 2004-2008 Current U.S. Dollars (in billions)
Source: HMI? 2010. Data compiled from IDC Quarterly Server Tracking Reports, 2004-2009.
22
1
COST ANALYSIS
• We used the detailed TPC-C pricing sheets to break down the costs of the System Under Test (SUT) into the cost of the Server Hardware and other components
• To accord with our server sales numbers, we recalculated price performance using only the costs of the server hardware (current dollars)
• Further cost performance (storage, network) analyses are possible and planned
2 23
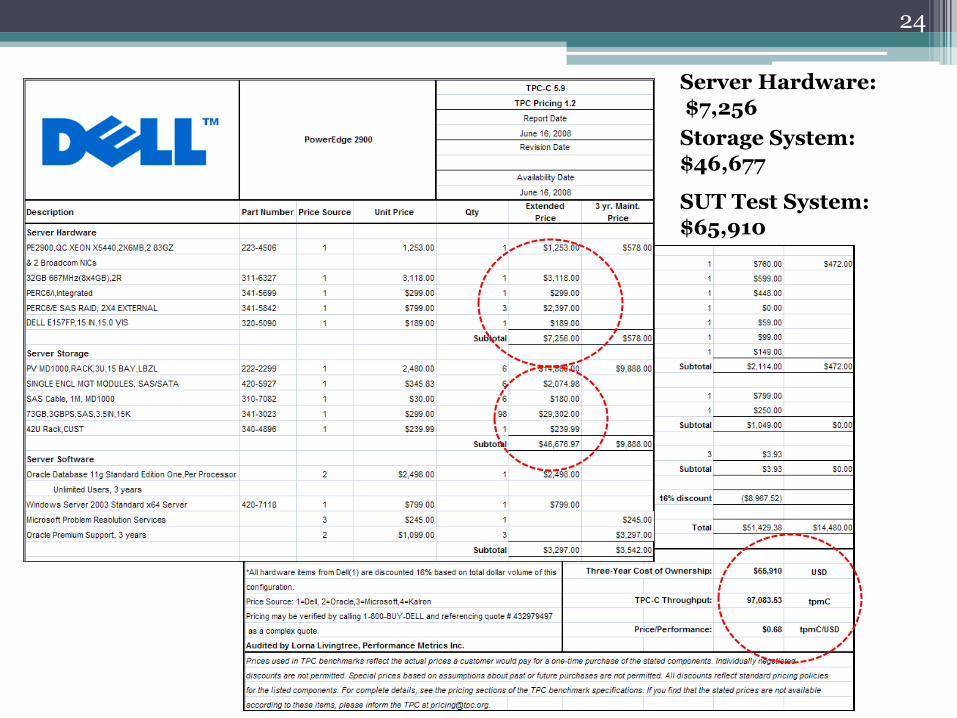
Server Hardware: $7,256
SUT Test System: $65,910
Storage System: $46,677
24
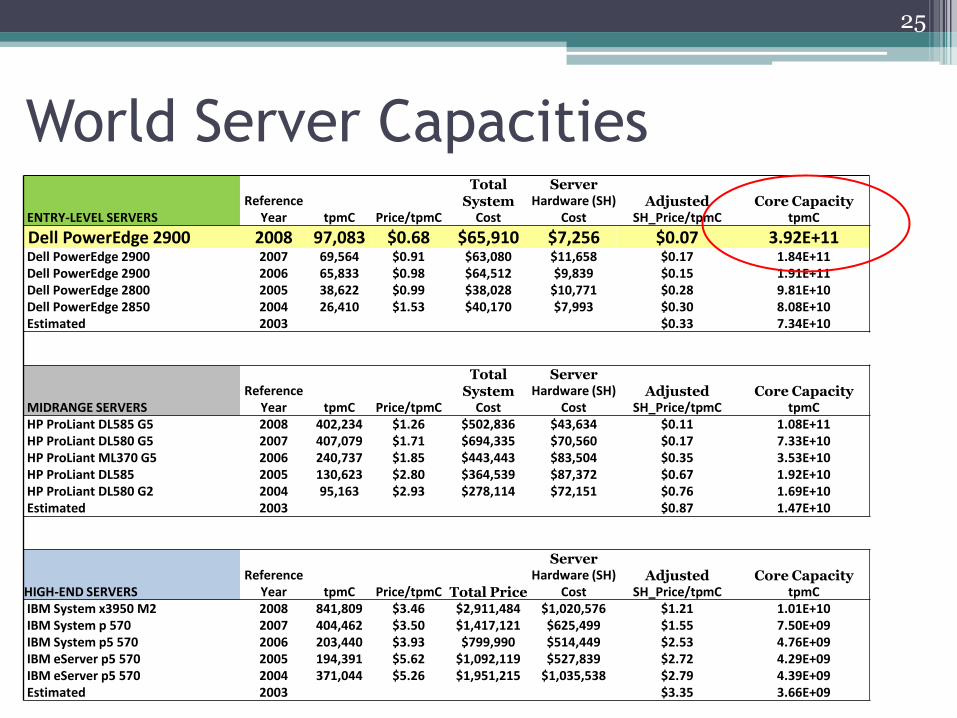
World Server Capacities
25
ENTRY-LEVEL SERVERS Reference
Year tpmC Price/tpmC
Total System
Cost
Server Hardware (SH)
Cost Adjusted
SH_Price/tpmC Core Capacity
tpmC
Dell PowerEdge 2900 2008 97,083 $0.68 $65,910 $7,256 $0.07 3.92E+11 Dell PowerEdge 2900 2007 69,564 $0.91 $63,080 $11,658 $0.17 1.84E+11 Dell PowerEdge 2900 2006 65,833 $0.98 $64,512 $9,839 $0.15 1.91E+11 Dell PowerEdge 2800 2005 38,622 $0.99 $38,028 $10,771 $0.28 9.81E+10 Dell PowerEdge 2850 2004 26,410 $1.53 $40,170 $7,993 $0.30 8.08E+10 Estimated 2003 $0.33 7.34E+10
MIDRANGE SERVERS Reference
Year tpmC Price/tpmC
Total System
Cost
Server Hardware (SH)
Cost Adjusted
SH_Price/tpmC Core Capacity
tpmC HP ProLiant DL585 G5 2008 402,234 $1.26 $502,836 $43,634 $0.11 1.08E+11 HP ProLiant DL580 G5 2007 407,079 $1.71 $694,335 $70,560 $0.17 7.33E+10 HP ProLiant ML370 G5 2006 240,737 $1.85 $443,443 $83,504 $0.35 3.53E+10 HP ProLiant DL585 2005 130,623 $2.80 $364,539 $87,372 $0.67 1.92E+10 HP ProLiant DL580 G2 2004 95,163 $2.93 $278,114 $72,151 $0.76 1.69E+10 Estimated 2003 $0.87 1.47E+10
HIGH-END SERVERS Reference
Year tpmC Price/tpmC Total Price
Server Hardware (SH)
Cost Adjusted
SH_Price/tpmC Core Capacity
tpmC IBM System x3950 M2 2008 841,809 $3.46 $2,911,484 $1,020,576 $1.21 1.01E+10 IBM System p 570 2007 404,462 $3.50 $1,417,121 $625,499 $1.55 7.50E+09 IBM System p5 570 2006 203,440 $3.93 $799,990 $514,449 $2.53 4.76E+09 IBM eServer p5 570 2005 194,391 $5.62 $1,092,119 $527,839 $2.72 4.29E+09 IBM eServer p5 570 2004 371,044 $5.26 $1,951,215 $1,035,538 $2.79 4.39E+09 Estimated 2003 $3.35 3.66E+09
New Way To Measure
Capacity • Aggregate capacity over very different kinds of
servers
• Assume companies spend dollars for server capacity efficiently
• Measure capital cost per unit of benchmarked performance
• Then we translate different benchmarks into a common unit: bytes
26
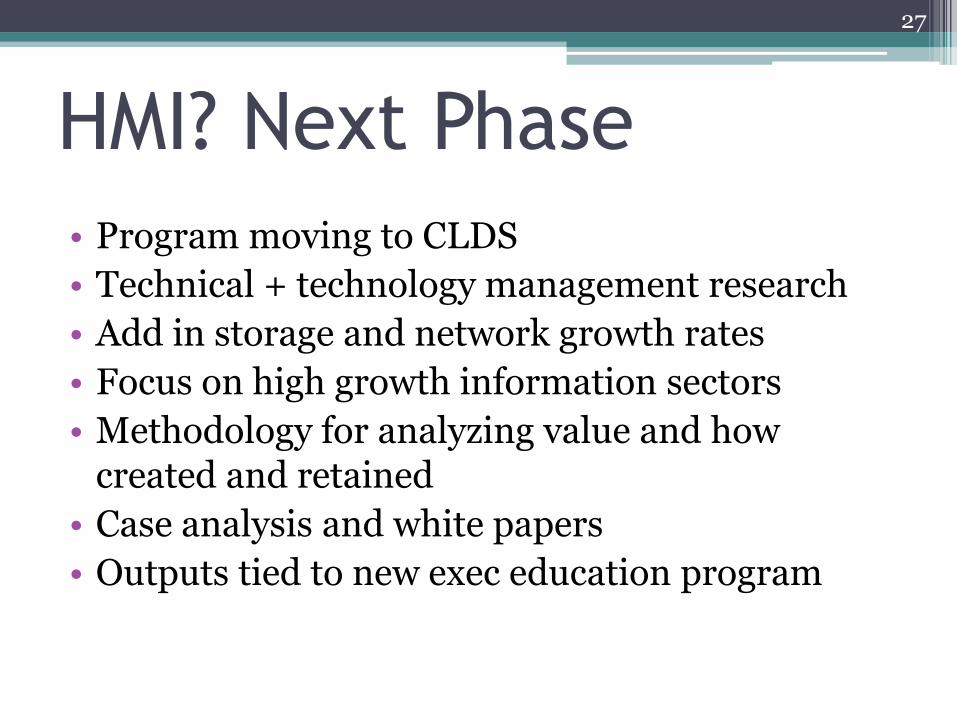
HMI? Next Phase
• Program moving to CLDS
• Technical + technology management research
• Add in storage and network growth rates
• Focus on high growth information sectors
• Methodology for analyzing value and how created and retained
• Case analysis and white papers
• Outputs tied to new exec education program
27
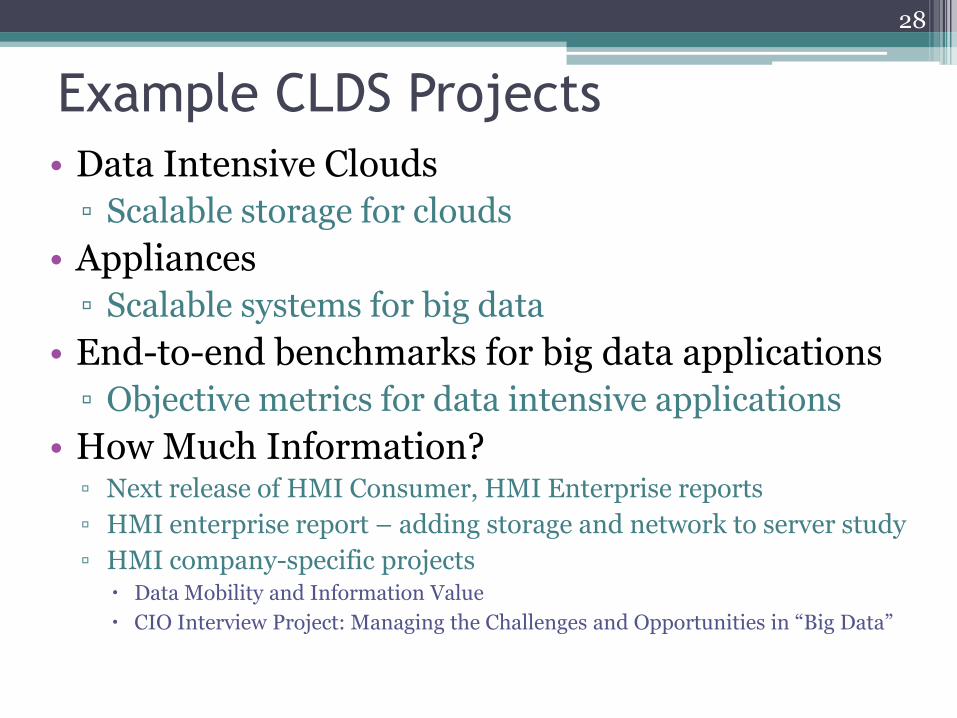
Example CLDS Projects
• Data Intensive Clouds
▫ Scalable storage for clouds
• Appliances
▫ Scalable systems for big data
• End-to-end benchmarks for big data applications
▫ Objective metrics for data intensive applications
• How Much Information? ▫ Next release of HMI Consumer, HMI Enterprise reports
▫ HMI enterprise report – adding storage and network to server study
▫ HMI company-specific projects Data Mobility and Information Value
CIO Interview Project: Managing the Challenges and Opportunities in “Big Data”
28
For More Information
• Chaitanya Baru [[email protected]]
• Jim Short [[email protected]]
Director, Industry Relations, SDSC
• Ron Hawkins [[email protected]]
29