Embed Size (px)
Citation preview

06-029
Copyright © 2006 by Ilyana Kuziemko and Eric Werker
Working papers are in draft form. This working paper is distributed for purposes of comment and discussion only. It may not be reproduced without permission of the copyright holder. Copies of working papers are available from the author.
How Much Is a Seat on the Security Council Worth? Foreign Aid and Bribery at the United Nations
Ilyana Kuziemko Eric Werker


1
Forthcoming: Journal of Political Economy
How Much is a Seat on the Security Council Worth? Foreign Aid and Bribery at the United Nations
By ILYANA KUZIEMKO AND ERIC WERKER*
June 2006
ABSTRACT
Ten of the fifteen seats on the U.N. Security Council are held by rotating members serving two-year terms. We find that a country’s U.S. aid increases by 59 percent and its U.N. aid by 8 percent when it rotates onto the council. This effect increases during years in which key diplomatic events take place (when members’ votes should be especially valuable) and the timing of the effect closely tracks a country’s election to, and exit from, the council. Finally, the U.N. results appear to be driven by UNICEF, an organization over which the United States has historically exerted great control.
* Department of Economics, Harvard University, Cambridge, MA 02138 and Harvard Business School, Boston, MA 02163. E-mails: [email protected]; [email protected]. First version: October 2004. We would like to thank Alberto Alesina, Marvin Danielson, Martin Feldstein, Edward Glaeser, Michael Hiscox, Lakshmi Iyer, Ian Johnstone, Larry Katz, Michael Kremer, Steve Levitt, Sendhil Mullainathan, Shanna Rose, Bruce Russett, Jesse Shapiro, Ken Shepsle, James Sutterlin, two anonymous referees, and seminar participants at Chicago GSB, George Mason, Harvard Business School, Harvard Economics, Michigan, MIT, the NBER, Oxford, the University of Toronto, Washington University, and Yale for valuable comments and advice. Ilyana and Eric would like to acknowledge financial support from the National Science Foundation and the National Bureau of Economic Research, Working Group on the Economics of National Security, respectively.

2
I. Introduction
Since its inception in 1945, the United Nations has entrusted questions of global
peacemaking to the Security Council. Given the council’s power to authorize multilateral
sanctions and military action, its members have played a role in some of the most significant
world events of the past sixty years, from the Korean War to the recent Gulf Wars. Though
critics often argue that the Security Council lacks relevance or resolve, membership on the
council remains a coveted prize among U.N. member states. While five of the council’s 15 seats
are held by permanent members, the remaining ten are reserved for countries serving two-year
terms, and the competition for these rotating seats can be intense (Malone 2000).
The desire to participate more meaningfully in world affairs might motivate countries to
fight for a spot on the Security Council. It is also possible, however, that rotating members are
able to extract rents during their time on the council. Thus, rotating members could trade their
votes for political or financial favors during the two years in which they enjoy a boost to their
diplomatic importance. Indeed, the U.S. reportedly issued “promises of rich rewards” to rotating
members in exchange for their support during the run-up to the 2003 invasion of Iraq (Renfrew
2003). While the Security Council would seem to present a natural setting to study issues of
bribery and deal-making, economists have largely ignored the question of whether council
membership is related to foreign aid payments. This omission is especially surprising given the
advantages of the discontinuous nature of rotating membership for empirical identification.
That there might exist a link between membership on the Security Council and foreign
aid is a serious charge. As Article 24 of the U.N. Charter states, member nations “confer on the
Security Council primary responsibility for the maintenance of international peace and security,
and agree that in carrying out its duties under this responsibility the Security Council acts on
their behalf.” Since the Security Council is entrusted to act on behalf of all members of the
United Nations, council members are expected to advocate for the global good—not to extract
rents in order to line their own coffers.
In this paper, we investigate whether the pattern of aid payments to rotating members of
the council is consistent with vote buying. There are at least three reasons why we might
observe a connection between foreign aid and council membership. First, as the discussion
above suggests, council members may be trading their votes for cash. Second, and less

2
nefarious, is the possibility that membership on the Security Council simply enables a country to
bring its needs to the attention of the world community. If the economic needs of developing
nations gain salience when they serve as rotating members, then aid and Security Council tenure
could be positively correlated even in the absence of vote trading. Third, a correlation between
Security Council membership and aid might be driven by an omitted variable: a country’s
becoming more integrated in the world community might increase both its probability of serving
on the Security Council and its annual aid receipts. Testing for a correlation between council
membership and foreign aid, and differentiating among these three hypotheses, will be the focus
of the empirical work in this paper.
Using country-level panel data, we find a large positive effect of Security Council
membership on foreign aid receipts. On average, a non-permanent member of the council enjoys
a 59 percent increase in total aid from the United States and an 8 percent increase in total
development aid from the United Nations. Further results lend strong support to the bribery
hypothesis over the two alternative hypotheses mentioned above. First, we find that aid to
Security Council members is significantly larger during key diplomatic years—that is, years in
which the United Nations receives an especially large amount of media coverage, or in which a
major international event occurs. The variation used to identify this effect is plausibly
exogenous; it is driven by the fact that some countries serve on the Security Council during
relatively calm years while others, by chance, are fortunate enough to serve during a year in
which a key resolution is debated and their vote becomes more valuable.
Second, aid payments sharply increase in the year that a country is elected to the Security
Council, remain high throughout the two-year term, and return to their earlier level almost
immediately upon completion of the term. The sharp increase challenges the notion that the
correlation is being driven by an unobserved, secular change in a country’s international
influence or diplomatic savoir-faire. Similarly, the rapid return to baseline aid levels after a
country has completed its tenure suggests that the aid is not due to a newfound awareness of the
country’s needs. Instead, the discontinuous pattern of aid suggests that Security Council
countries experience a windfall of aid only during the period when they enjoy increased
influence in the United Nations.
We also examine the politics of aid decisions within the U.N. bureaucracy. While
Security Council members have increased access to politically salient information, they have no

3
greater access to the U.N. agencies that disburse development aid. Thus, the connection we find
between council membership and aid receipts might imply that council members are willing to
trade their vote for favors: they promote another country’s interests in the Security Council in
exchange for development aid from a U.N. agency over which the other country has influence.
By decomposing U.N. development aid into its agency-level components, we find that
UNICEF—an agency long controlled by the United States—seems to drive the Security Council
effect. Accordingly, our results suggest that the U.S. attempts to influence rotating members
both with direct foreign aid payments as well as with funds channeled through a U.N. agency it
influences.
The results of this paper are consistent with previous empirical studies that demonstrate a
political component to the allocation of foreign aid. Alesina and Dollar (2000) find that political
and strategic variables explain a large share of the direction of foreign aid flows. Meernik,
Krueger, and Poe (1998) contend that security issues were more important for U.S. aid allocation
during the Cold War than following it, and that democracy promotion has since risen in
prominence as a determinant of aid. Previous studies on foreign aid and voting in the U.N.
General Assembly find mixed results and do little to identify the direction of causality (Wittkopf
1973; Rai 1980; Kegley and Hook 1991; Wang 1999).
Our results are also pertinent to two contentious debates currently taking place amongst a
wider audience. The first is the long-standing debate about the effectiveness of foreign aid (see
for example Easterly 2001), a debate reignited by the recent push for the G-8 nations to increase
foreign aid by $50 billion (BBC 2005). As our results indicate that strategic interests have a
causal impact on foreign aid decisions, they suggest a possible explanation for the disappointing
track record of aid: as donor countries use aid strategically, they do not prioritize humanitarian
concerns when crafting aid packages. Therefore, the weak historical relationships between aid
and poverty alleviation may not suggest that more targeted, development-oriented aid will
similarly fail in the future.
Second, our paper contributes to the debate over U.N. reform. The oil-for-food scandal
(Hsieh and Moretti 2006; Heaton 2006) and the refusal of the Security Council to authorize the
2003 invasion of Iraq have been used by critics to demonstrate the organization’s corruptibility,
on the one hand, or irrelevance, on the other. Additionally, calls have been made to drastically
change the structure of the Security Council. Our results suggest the potential need for an

4
additional set of reforms—namely, measures that would help insulate the rotating members from
the financial influence of the greater powers.
The remainder of the paper is organized as follows. In Section II we relate this paper to
the literature on U.S. congressional committees, noting that because of the highly discontinuous
nature of Security Council membership, the U.N. setting provides econometrically cleaner tests
of the hypothesis that committee membership confers tangible benefits. In Section III we
describe the data and our empirical strategy. In Section IV we report the results of the impact of
Security Council membership on foreign aid receipts, specifically U.S. and U.N. aid. Section V
offers concluding remarks.
II. The Political Economy of the U.N. Security Council
Structure of the Security Council
The U.N. Security Council is the primary organ of the United Nations responsible for the
maintenance of peace and security. Among all U.N. organs, the Security Council is the only one
with the authority to make decisions that bind all member states of the United Nations and, to
some extent, non-members as well (Bailey and Daws 1998, 4). Among the powers of the
Security Council are the abilities to invoke sanctions, apply military action, and recommend the
appointment of the U.N. Secretary-General.
The council is made up of five permanent members, or the P5—China, France, Russia,
the United Kingdom, and the United States—as well as ten non-permanent members. Nine votes
cast in favor of a resolution are required for a resolution to pass (including the concurring votes
of the P5 in substantive matters), and each of the P5 has the power to veto a resolution (Article
27 of the U.N. Charter).
Service on the council is by no means random. A Security Council member must first be
nominated by its regional caucus and then approved by a two-thirds vote of the General
Assembly (G.A.). Each year, five non-permanent members join the Security Council and five
members leave; retiring members are not eligible for immediate re-election (Article 23(2)). The
elections occur approximately three months before the term starts on January 1, though countries
may make their candidacy known well beforehand. Five of the ten non-permanent members are

5
typically from Africa and Asia, one is from Eastern Europe, two are from Latin America and the
Caribbean, and two are from Western Europe, Canada, Australia, and New Zealand (Malone
2000). According to the U.N. Charter, the G.A. is instructed to pay “due regard… to the
contribution of Members of the United Nations to the maintenance of international peace and
security and to the other purposes of the Organization” (Article 23(1)). In practice, this has
meant that regional powers like Japan and Brazil tend to serve more frequently than less
influential states such as Laos or Paraguay. Each regional caucus can devise its own procedure
for deciding which nation(s) to nominate, but is still constrained to choose nations that will
ultimately gain the two-thirds approval required in the General Assembly. Appendix I lists the
number of years that countries in our dataset have served on the Security Council.
There is extensive competition and jostling for the non-permanent seats, with some
countries mounting expensive campaigns to get elected to the council (Malone, 2000). The
observed campaigning suggests that these countries might expect a net reward during their
tenure.
However, there are several reasons to doubt that countries systematically get more aid
while on the council. First, countries that campaign for election to the council may seek the non-
financial benefits of council membership, such as access to information or sway over
international affairs. Moreover, the President of the council—a title that rotates among the
members—has some control over the agenda and the order of voting over amendments on the
table (Bailey and Daws 1998, 130-131). Second, if sticks instead of carrots were used to
influence non-member votes, then countries serving on the council might worry that their foreign
aid will fall if they do not vote as they are told. Indeed, Yemen saw its U.S. aid cut when it
refused to vote in favor of the council’s authorization of the use of force against Iraq in 1991.
Third,, it has been suggested that because non-permanent members of the council do not have
veto power, they may not be worth bribing at all. O’Neill (1996) applies the Shapley-Shubik
index—which measures the percentage of total power attributed to a member based on voting
rules—to the Security Council. He finds that each of the five permanent members has 19.6
percent of the power, while each of the ten non-permanent members has less than 0.2 percent.
Finally, O’Neill’s critique notwithstanding, a strict realist interpretation of international
organizations would argue that the Security Council merely reflects the balance of power in the
international system and does not have any independent impact on world affairs.

6
Committee Membership and Political Spoils
The potential connection between Security Council membership and foreign aid parallels
existing work on congressional committee membership and geographically-targeted federal
spending. A large literature in political science investigates whether representatives who sit on
powerful committees or subcommittees are able to “bring home the bacon,” which appears to
improve the incumbent’s chance of reelection (Levitt and Snyder 1997). In perhaps the classic
work in this field, Ferejohn (1974) finds that members of public works committees get more new
projects for their constituencies than do nonmembers, and that this effect is even stronger for
appropriations subcommittee members and committee chairs. This committee-member effect
has also been found for military spending in states and districts that are represented on defense
committees (Ray 1981; Rundquist, Lee, and Rhee 1996; Carsey and Rundquist 1999; Rundquist
and Carsey 2002). Given that legislators can extract constituency benefits from committee
service, it follows that there should be competition for service on the most lucrative committees.
Indeed, this appears to be the case. Groseclose and Stewart (1998) and Stewart and Groseclose
(1999) provide estimates of the most valuable committees, and find that positions on the House
Ways and Means and Appropriations committees and the Senate Finance and Appropriations
committees were the most coveted.
Surprisingly, there have been no studies posing similar questions in the international
arena. The U.N. Security Council is arguably the world’s most prominent international
committee. Unlike Appropriations committees, the Security Council does not distribute funds
per se. Thus, if countries were to receive extra funds from the United Nations, it could be
through logrolling. If donor countries were to disburse extra bilateral aid, it could be with the
intention to buy support to form winning or blocking coalitions. Both of these practices have
also been modeled by congressional scholars, and appear to be important parts of legislative
activity (Riker 1962; Shepsle 1974; Stratmann 1992; Groseclose and Snyder 1996).
Nonetheless, it should be more difficult to find evidence of committee influence through an
indirect channel (logrolling and vote-buying) than through a direct channel (appropriations).
Perhaps the largest challenge in the empirical literature on congressional committee
influence is determining the direction of causality (Ray 1981). After all, it may not be the
membership on the defense committee that generates the allocation of district-level military

7
spending, but rather the fact that congressmen who represent districts with defense spending are
more likely to seek assignment to defense committees (Rundquist, Rhee, Fox, and Lee 1997).
Several features of the Security Council offer advantages in estimating the relationship
between membership and financial gain. Unlike members of Congress, members of the Security
Council cannot serve successive terms. Thus, even if admission to the council is not exogenous,
exit from the council is. Moreover, given that serving on the council is a relatively rare event,
we can track the changes in aid as they correspond to election to, and service on, the Security
Council, to determine the direction of causality. Certainly, it is possible for governments to
adjust their aid on short notice in order to influence other countries. The U.S. government has
funds that can be allocated at the discretion of the administration (even if many of them are
earmarked for a specific developmental purpose, such as child health).1 Moreover, Congress can
stipulate in its annual recommendation that certain countries receive a minimum amount of aid,
and that such amounts be distributed within 30 days of the act’s passage.
Another feature of the Security Council that benefits this inquiry is that the value of
serving on the council fluctuates from year to year. The Security Council has been relatively
more prominent in years of importance to the international community, such as the period
leading up to the U.S. invasion of Iraq, than in years when the order of business does not go
beyond posturing about Western Sahara or Myanmar. The value of a vote on the council should
fluctuate with the importance of the Security Council in world affairs. Thus, though a country’s
propensity to serve on the council is by no means random, world events during its tenure are
largely a product of chance.
It is these discontinuities—in the duration of service and the importance of the council in
world affairs—that we will exploit in order to measure the value of serving as a non-permanent
member of the U.N. Security Council.
III. Data and Specifications
Data
We construct two panel datasets to test our hypotheses. In both cases, we limit our
1 See, for instance, United States Congress (2001).

8
analysis to developing countries (those not classified as high-income countries by the World
Bank in 2003) who were members of the United Nations but not part of the P5 (that is, we
exclude China). The first dataset contains U.S. foreign aid data from 1946 to 2001, from the
“Greenbook,” the U.S. Overseas Loans & Grants database compiled by USAID. From the
Greenbook, we sum two variables, “Total Economic Assistance Loans and Grants” and “Total
Military Assistance Loans and Grants,” and convert the flows to constant dollars using the urban
CPI to reflect the price to the United States of administering the aid. Only positive values of aid
are reported; we assign a value of zero to non-reported flows.2 Of the country-years in our
sample, over three-fourths received economic aid, and nearly one half received military aid.
In this dataset, we use two primary political controls. The first, representing “outlier”
political activity, captures whether a war with at least 1000 battle deaths was occurring in the
recipient country; these data come from the Department of Peace and Conflict Research at
Uppsala University and the International Peace Research Institute, Oslo (PRIO) (Gleditsch et al
2002). Less than one tenth of the country-years in our sample were characterized by such
conflict. The second control, which captures ideological swings in a country, is the Polity2
dictatorship/democracy score from the Polity IV dataset (Marshall and Jaggers 2002). A score of
10 reflects a perfect democracy and a score of -10 reflects a perfect autocracy. The average
score in our dataset is -1.93, indicating a country that is more autocratic than democratic. Both
of these controls extend back to 1946, although they are not available for all countries.
Unfortunately, few other useful control variables go back to 1946. The economic control, the log
of real GDP per capita using the Laspeyres weighting, is from the Penn World Tables and begins
in 1950 for a subset of the countries.
The second dataset contains flows of Official Development Assistance (ODA) from the
United Nations, compiled by the OECD beginning in 1960. To generate our variable of interest,
we sum ODA over all U.N. agencies and convert this figure to constant dollars using the ratio of
the recipient country’s real GDP to nominal GDP. Over 96 percent of the country-years in our
sample received U.N. aid. Fortunately, better economic control variables are available from
1960 onward. We include the same political controls as above and add the log of real per capita
GDP from the World Development Indicators.
2 We set zero and negative aid flows to $1 for the log specification. Appendix II, discussed later, shows that the results are robust to several different treatments of the zero-aid-flow observations.

9
Importantly, U.S. aid data represent authorizations and obligations while U.N. data
captures actual aid disbursed. Thus our measure of U.S. aid should more closely track
contemporaneous intent, while measured U.N. aid may lag intent by a period.
Empirical Strategy
A positive association between foreign aid and council memberships would hardly be
conclusive evidence of the vote-for-aid deals that we have hypothesized. Any omitted variable
at the country level associated with both a country’s propensity to serve on the council and its
ability to extract aid from donor nations would lead to biased coefficients, almost certainly in the
positive direction. Thus, our basic empirical strategy is to look within countries across time and
measure how their aid receipts changed as a function of their Security Council status. This
estimation can be captured by the following equation, using a logarithmic specification following
Alesina and Dollar (2000):
(1) ln(Aidirt) = α + β*SCMemberit + γ*Xit + Wrt + ηt + µi + εit,
where i indexes countries, r indexes regions, t indexes years, SCMember is a dummy variable
coded as one if country i is serving on the Security Council in year t, X is a vector of time-
varying political and economic controls for each country, W is a regional quartic time trend,3 η is
a vector of year fixed effects, and µ is a vector of country fixed effects. In the results that follow,
we set Aid to equal either U.S. foreign aid or U.N. development aid.
Changes in the average level of foreign aid across time will be absorbed by the year fixed
effects. Moreover, any omitted variable that affects a country’s average aid level will be
absorbed by the country fixed effects. However, if a country’s propensity to serve on the
Security Council changed during the time covered in our data and this change was correlated in
some way with its pattern of aid receipts, then an OLS estimate of β would be biased. We
address this concern in two ways. First, we interact the SCMember variables with a measure of
3 The regions are Europe and Central Asia, East Asia and the Pacific, Sub-Saharan Africa, Latin America and the Caribbean, and Other. We include a linear time trend for Egypt, recognizing the dramatic increases in aid to Egypt following the Camp David Accord; Israel is not part of the dataset as it was a high-income country in 2003. Recognizing that Egypt should be treated as a special case in foreign aid estimations is consistent with major recent papers (Alesina and Dollar 2000; Burnside and Dollar 2000). In Appendix II we will test our main results using region-year dummies.
10
how important that year happened to be in the Security Council. As discussed in Section 2,
assignment to the Security Council is not strictly random, but world events during a country’s
tenure are essentially exogenous. As countries typically begin their campaigns for Security
Council membership years before they actually serve, it would be nearly impossible for countries
to “time” their campaigns to correspond with world events that might make their tenure
especially lucrative. (For example, Cameroon and Angola surely had no way of knowing that
they would serve during the Bush Administration’s push for Gulf War II.) This estimation is
specified by the following equation:
(2) ln(Aidirt) = α + β1*SCMemberit + β2*SCMEMBERit*ImportantYeart + γ*Xit + Wrt + ηt
+ µi + εit.
ImportantYeart is proxied by the total number of New York Times articles in year t with the
words “United Nations” and “Security Council” in the article, searched through the ProQuest®
historical database. A graph of the NYT variable since 1946 is provided in Figure 1. For our
main specification, we rank the years according to their citation frequency and then separate
them into three categories: high, medium and low importance years. We also experiment with
other definitions of a year’s importance as robustness checks.
If the effect on aid of being on the Security Council is purely driven by countries exerting
their influence in ways that are correlated with both gaining a seat on the council and procuring
more aid, rather than a true treatment effect captured by the interaction term, then we should see
estimates of β2 statistically indistinguishable from zero. If, instead, the effect on aid is being
driven by the interaction term, then we can conclude that the Security Council effect on aid is
likely causal and not driven by omitted variables.
One final check we perform is to examine the pattern of aid receipts not only during a
country’s membership on the Security Council, but also during the years immediately before and
after its tenure. We refer to this estimation as the “event-time specification” and it is described
by the following equation:
(3) ln(Aidirt) = α + β-1*Τ−1it + β0*T0it + β1*T1it + β2*T2it + β3*T3it + β4*T4it +
γ*Xit + Wrt + ηt + µi + eit,

11
where T-1 is a dummy variable indicating the year before a country is elected to the Security
Council (and two years before its term actually starts), T0 corresponds to the year of election, T1
and T2 correspond to the two years of service on the council, and T3 and T4 correspond to the
two years immediately following the two-year term.
This specification allows us to address the concern that unobserved country-specific
trends in both a country’s ability to extract aid and its probability of serving on the council are
driving the positive association between council membership and aid. In the year before a
country’s election, any significant increase in aid would undermine the hypothesis that council
membership itself is driving the results. Similarly, aid levels remaining high in the years
following council service might suggest that rotating countries had permanently raised awareness
of their needs, and not that they had used their temporary power to extract bribes. If β0, β1, and
β2 were much larger than the other coefficients (or β1, β2, and β3 for U.N. aid due to its measuring
disbursement rather than authorization), however, the striking correlation between aid levels and
the exact years during which rotating members had elevated influence would render this
alternative story less credible.
IV. Estimating the Value of a Seat
U.S. Foreign Aid
Table 2 shows the estimation results for variations on equations (1), (2), and (3), using
U.S. foreign aid as the dependent variable. In the specification in column 1, aid is regressed only
on the SC Member dummy; as expected, the coefficient is implausibly high, as it captures not
only vote-buying aid but also the non-random selection of U.S. aid recipients to the council.
Column 2 adds country and year fixed effects as well as regional trends; the results indicate that
council membership is associated with a 47 log-point, or 59 percent, increase in U.S. aid.
Columns 3 and 4 make use of variation in the importance of council decisions from year to year.
As mentioned above, we divide the years in the sample into three roughly equal groups based on
the number of New York Times articles containing the terms “United Nations” and “Security

12
Council.”4 Column 3 suggests that during those years in which the Security Council was least in
the news, council members received essentially no additional U.S. aid relative to their baseline.
During years in which the council received moderate press coverage, the reward to being on the
council was positive, but not significant. However, during the years in which the council’s
proceedings were most newsworthy, the increase in aid receipts to council members was positive
and highly significant. The point estimate suggests that counties lucky enough to serve during
these years enjoyed a nearly 170% increase in U.S. aid. Column 4 shows that the addition of
political controls does not change the results. In column 5 we add the log of GDP per capita
which reduces the sample by over one quarter. Although this reduces the size of the coefficient
on the most newsworthy years, it remains statistically significant.
We also experiment with a different approach to identifying the effect of council
membership: examining the variation in aid during as well as immediately before and after a
country’s two-year term. The point estimates, reported in column 6, suggest that in the year
before a country is elected, aid is not any higher than the baseline level. The year of election and
the two years of actual service exhibit the largest increases in aid, with the election year and
second year highly statistically significant. Aid levels essentially return to pre-election levels in
the two years following council service. Furthermore, the difference in aid payments during the
“treatment period” (the year of election and the two years of service on the Council) and aid
payments during the “control period” (the three years before and after the treatment period) is
positive and statistically significant (details of this estimation and hypothesis test can be found
in the notes to Table2). Thus, the pattern of aid over time suggests that aid increases are
intimately tied to council election and membership.
We next investigate whether the results in column 4 are robust to using alternative
measures of a year’s diplomatic importance. The results and significance hold if we redefine an
important year as one that corresponds to key events in the Security Council and international
diplomacy more generally; these years are 1946 (first year of the United Nations), 1950 (Korean
War), 1956 (Suez crisis), 1960 (U2 spy plane; Congo) 1962 (Cuban Missile crisis), 1967 and
1973 (Israeli-Arab wars), 1982 (Falklands, Lebanon), 1991 (Gulf War I), and 1999 (Kosovo).
The signs, if not the significance levels, hold if we define an important year as a year in which an
4 Somewhat important years include 1953, 1957, 1962, 1963, 1966, 1967, 1969, 1971, 1973, 1975-76, 1979, 1980, 1985, 1988, 1995-96, and 1999. Important years include 1946-52, 1954-56, 1958, 1960-61, 1964-65, 1968, 1982,

13
interstate military conflict involving more than three states and more than 1,000 deaths began.
The results are also robust to a number of additional manipulations, as reported in
Appendix II, columns 1-4; these include: (1) limiting the regression to positive aid values, (2)
resetting the log of non-positive aid from zero to ten,5 (3) including dummy variables for
country-years with zero aid, and (4) substituting region-year dummies for the regional quartics.
In other words, the log specification’s inherent sensitivity to small changes in absolute
magnitude that are close to zero does not appear to be driving the results. The results are also
robust to alternative sample selection rules. In Appendix III, columns 1-4, we find that the main
results are robust to: (1) dropping countries that never served on the Security Council between
1946 and 2004, (2) including high-income countries, (3) excluding country-years with real GDP
per capita greater than $10,000 in the particular year of the observation rather than in 2003, and
(4) dropping the year of the Iraqi invasion of Kuwait and the year of the resulting Gulf War
(1990 and 1991, respectively).6
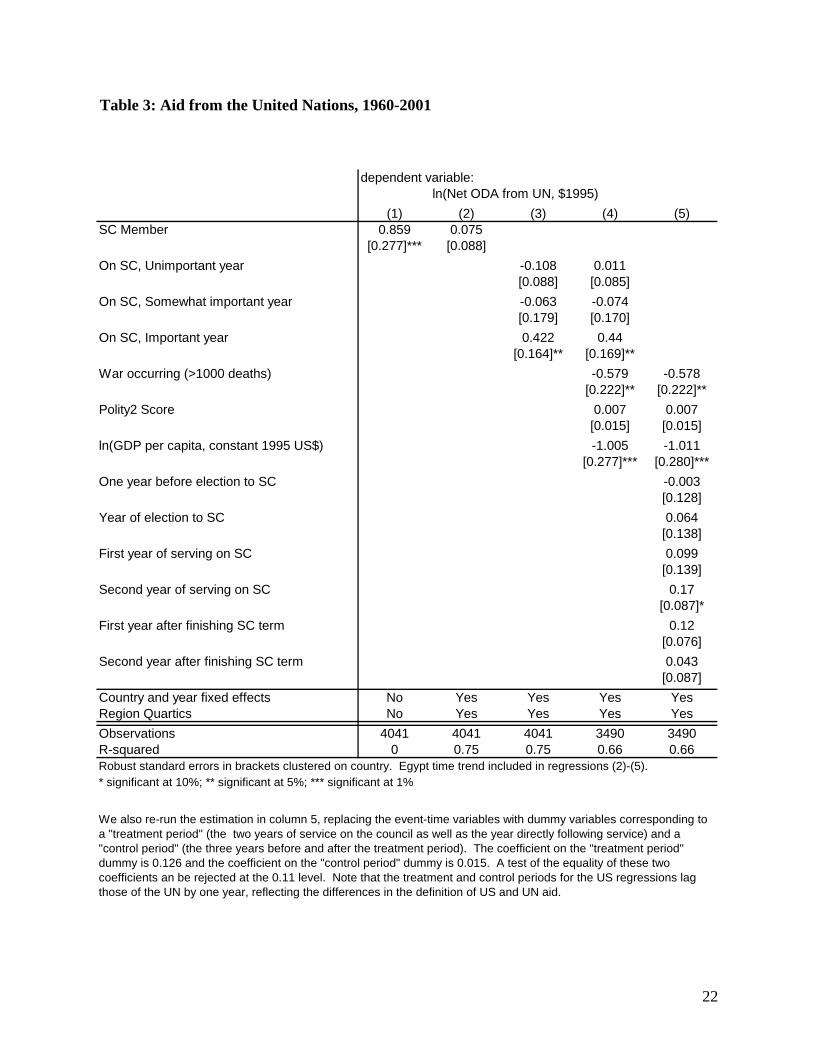
U.N. Results
Table 3 shows results parallel to those in Tables 2, but with total U.N. development aid as
the dependent variable. The coefficients of interest in Table 3 follow a similar pattern to those in
Table 2, but are universally smaller in magnitude. For U.N. aid, the main effect of serving on the
council is weakly positive, but serving on the council during an important year predicts a
sizeable and statistically significant increase in aid of 42 log points, or 53 percent.
The timing of U.N. aid is slightly different from that of U.S. aid, consistent with its
measuring actual disbursement as opposed to authorization. U.N. aid does not increase as
substantially during the year of election to the council, and does not fall back to baseline levels
until the second year after council service has ended. As with U.S. aid, we find that the
difference between U.N. aid payments during the “treatment period” and the “control period” is
positive (though less statically significant) and again consign details to the notes of Table 3.
Most important, however, is that for both U.N. and U.S. aid, there is no evidence of
heightened aid in the year before election, there is a significant increase in aid during the second
1990-94, and 1998. 5 The smallest positive value of the log of aid is approximately 9.5, or $13,000. 6 As a further robustness check, in an extension to an earlier version of this paper, Tamura and Kunieda (2005) reach the same conclusions using different specifications.

14
year of the term, and aid levels essentially return to pre-election levels within two years of a
country’s exit from the council. That the coefficients of interest for the U.N. regressions are
smaller makes intuitive sense: the United States can distribute foreign aid in accordance with its
strategic interests without garnering the formal support of other countries, whereas bureaucrats
hailing from multiple nations must cooperate to dispense U.N. aid.7
Figure 2 provides a graphical representation of the results in the last columns of Tables 2
and 3. The y-axis has been scaled such that aid in the year before a country’s election to the
council is normalized to $100. The most notable increase in aid comes during the second year of
tenure. Though the return to baseline is somewhat slower for U.N. aid, both types of aid trend
towards pre-election levels within two years of a country’s departure from the council.
Components of U.N. Aid
It is conceptually easy to imagine a causal mechanism underlying the U.S. aid results.
When a matter of importance comes before the Security Council, Congress (or the president via
the Congress) can authorize aid to a country in exchange for, or in encouragement of, its support
for the U.S. position.
The mechanism underlying the connection between council membership and U.N. aid is
not so clear. The Security Council does not directly control the purse strings of any of the
committees that distribute U.N. aid. Each of these committees has its own bureaucracy and
leadership, and is ostensibly independent of the council. Of course, in reality, politics may affect
the aid process. For example, there is the possibility of log-rolling. A non-member could offer a
rotating member the following deal: put the non-member’s issue on the council agenda in
exchange for an increase in aid from, say, the World Food Programme, over which the non-
member happens to have influence. An alternative but not necessarily competing hypothesis is
that few U.N. members have even this behind-the-scenes power, and that the U.N. budget is
effectively controlled by the great powers.
In order to explore the black box of U.N. development aid distribution, we decompose
the U.N. aid variable into its components. The five U.N. agencies with the highest distributions
7 Somewhat important years include 1962-63, 1966-67, 1969, 1972-73, 1975-76, 1979-80, 1985, 1988, 1995-96. Important years include 1960-61, 1964-65, 1968, 1971, 1982, 1990-94, 1998-99. The U.N. results are robust to

15
are the World Food Programme (WFP), the U.N. Development Programme (UNDP), UNICEF,
the U.N. High Commissioner for Refugees (UNHCR), and the U.N. Regular Programme of
Technical Assistance (UNTA). It is noteworthy that among these agencies, the United States
historically has had the largest influence over UNICEF. Every executive director of UNICEF
since 1947 has been American, and some of UNICEF’s policy actions are taken in consultation
with the U.S. State Department (U.S. Department of State 2003). The extent of U.S. favoritism
for UNICEF was revealed in a memorable manner in 1995 when then-Senate Foreign Relations
Committee Chairman Jesse Helms recommended “terminating or greatly reducing” funds for
every U.N. organization except UNICEF (Bennis 1996, 71).
U.S. leadership has also been important, though less so, in the UNDP. An American ran
the agency every year until 2000, when Mark Malloch Brown of the UK, a Washington veteran,
took over. The United States has often been the largest donor to the UNDP, though in
percentage terms it donates much less than it does to UNICEF.
Table 4 displays the results of regressing ODA from these five U.N. agencies on Security
Council membership and controls using our preferred specification (from column 4 of Table 3).
The agency displaying the strongest pattern is clearly UNICEF. Countries serving on the council
during an unimportant year experience no notable increase in their UNICEF aid. During an
important year, a developing country sitting on the Security Council can expect a 49 log point, or
63 percent increase, in their ODA from UNICEF. Aid from the UNDP follows a similar pattern,
though the magnitudes are smaller and insignificant, while the remaining agencies display no
apparent relationship between aid flows and council membership.
What do these results imply about the politics of U.N. aid disbursement? Seeing how the
Security Council effect is limited to UNICEF and, to a lesser extent, the UNDP, the findings do
not seem to describe a setting in which many smaller players are trading influence for aid. Of
course a more detailed analysis of agency leadership and vote patterns might uncover more
subtle manifestations of log-rolling. However, these results do provide positive support for the
U.S. power hypothesis. As some of the funding for U.N. agencies is in the form of voluntary
contributions earmarked by donors for specific projects, these findings should not be seen as
evidence that the United States is abusing its leadership at U.N. agencies to spend other donors’
defining the importance of the year with the multinational conflict construction. Appendices II and III report the robustness checks on treatment of zeroes and sample selection.

16
monies in the U.S. national interest. Yet the findings are suggestive that the United States is
using UNICEF, and possibly the UNDP, as a vehicle in the conduct of its foreign policy.
V. Conclusion
Thus far, we have argued that non-permanent members of the U.N. Security Council
receive extra foreign aid from the United States and the United Nations, especially during years
when the attention focused on the council is greatest. Our results suggest that council
membership itself, and not simply some omitted variable, drives the aid increases. On average,
the typical developing country serving on the council can anticipate an additional $16 million
from the United States and $1 million from the United Nations During important years, these
numbers rise to $45 million from the United States and $8 million from the United Nations.
Finally, the U.N. finding may actually be further evidence of U.S. influence: UNICEF, an
organization over which the United States has historically had great control, seems to be driving
the increase in U.N. aid.
Ideally, a study of vote-buying in the United Nations would test for the ability of Security
Council aid to influence actual voting. Unfortunately, this is difficult for two reasons. First, we
cannot observe the counter-factual: how the country would have voted in the absence of vote-
buying activity. Second, votes themselves are strategic. Agenda setters typically know, before
putting a resolution up for a vote, the preferences of each member. Perhaps this is why most
Security Council resolutions are passed unanimously, and why failed resolutions are rare—recall
that the 2003 resolution to authorize the invasion of Iraq never actually came to a vote. Due to
these identification problems, we believe that actual outlays of aid are the most trustworthy way
to measure the presence of vote-buying in the Security Council. By providing extra aid to non-
permanent members of the council, especially during years when council votes are especially
important, agenda setters have implicitly revealed their faith in the Security Council’s relevance
in world affairs.

17
REFERENCES
Alesina, Alberto and David Dollar. 2000. “Who gives aid to whom and why?” Journal of Economic Growth. 5 (1): 33-63.
Bailey, Sydney D. and Sam Daws. 1998. The Procedure of the U.N. Security Council. Oxford:
Clarendon Press. BBC. 2005. “G8 leaders agree $50bn aid boost.” 8 July 2005. UK edition. Bennis, Phyllis. 1996. Calling the shots: how Washington dominates today’s U.N. New York:
Olive Branch Press. Burnside, Craig and David Dollar. 2000. “Aid, Policies, and Growth.” American Economic
Review. 90 (4): 867-868. Carsey, Thomas M. and Barry Rundquist. 1999. “The reciprocal relationship between state
defense interest and committee representation in Congress.” Public Choice. 99: 455-463. Easterly, William. 2001. The Elusive Quest for Growth: Economists’ Adventures and
Misadventures in the Tropics. Cambridge, MA: MIT Press. Ferejohn, John A. 1974. Pork Barrel Politics. Stanford, CA: Stanford University Press. Gleditsch, Nils Petter, Peter Wallensteen, Mikael Eriksson, Margareta Sollenberg & Håvard
Strand. 2002. “Armed Conflict 1946-2001: A New Dataset.” Journal of Peace Research. 39 (5): 615-637.
Groseclose, Tim and James M. Snyder, Jr. 1996. “Buying Supermajorities.” American Political
Science Review. 90 (2), Jun 1996: 303-315. Groseclose, Tim and Charles Stewart III. 1998. “The Value of Committee Seats in the House,
1947-91.” American Journal of Political Science. 42 (2), Apr 1998: 453-474. Heaton, Paul. 2006. “Oil for What? Illicit Iraqi Oil Contracts and the U.N. Security Council.”
Manuscript, Department of Economics, University of Chicago. Hsieh, Chang-Tai and Enrico Moretti. 2006. “Did Iraq Cheat the United Nations? Underpricing,
Bribes, and the Oil for Food Program.” Quarterly Journal of Economics. Forthcoming. Kegley, Charles W. and Steven W. Hook. 1991. “U.S. Foreign Aid and U.N. Voting: Did
Reagan’s Linkage Strategy Buy Deference or Defiance?” International Studies Quarterly. 35 (3), Sep 1991: 295-312.
Lee, Frances E. 2000. “Senate Representation and Coalition Building in Distributive Politics.”
American Political Science Review. 94 (1), Mar 2000: 59-72.

18
Levitt, Steven D. and James M. Snyder, Jr. 1997. “The Impact of Federal Spending on House Election Outcomes.” Journal of Political Economy. 105 (1), Feb 1997: 30-53.
Malone, David M. 2000. “Eyes on the Prize: The Quest for Nonpermanent Seats on the U.N.
Security Council.” Global Governance. 6 (1), Jan-Mar 2000: 3-24. Marshall, Monty G. and Keith Jaggers. 2002. Polity IV Dataset. [Computer file; version
p4v2002] College Park, MD: Center for International Development and Conflict Management, University of Maryland.
Meernik, James, Eric L. Krueger, and Steven C. Poe. 1998 “Testing Models of U.S. Foreign
Policy: Foreign Aid during and afterh the Cold War.” Journal of Politics. 60 (1), Feb 1998: 63-85.
O’Neill, Barry. 1996. “Power and Satisfaction in the United Nations Security Council.” Journal
of Conflict Resolution. 40 (2), Jun 1996: 219-237. Rai, Kul B. 1980. “Foreign Aid and Voting in the U.N. General Assembly, 1967-1976.” Journal
of Peace Research. 17 (3): 269-277. Ray, Bruce A. 1981. “Military Committee Membership in the House of Representatives and the
Allocation of Defense Department Outlays.” Western Political Quarterly. 34 (2), Jun 1981: 222-234.
Renfrew, Barry. 2003. “France battles U.S. to line up U.N. votes.” Associated Press. 1 Mar
2003. Riker, W.H. 1962. The Theory of Political Coalitions. New Haven: Yale University Press. Rundquist, Barry, Jeong-Hwa Lee, and Jungho Rhee. 1996. “The Distributive Politics of Cold
War Defense Spending: Some State-Level Evidence.” Legislative Studies Quarterly. 21 (2): 265-281.
Rundquist, Barry, Jungho Rhee, S. Fox, and Jeong-Hwa Lee. 1997. “Modeling state
representation on defense committees in Congress: 1959-1989.” American Politics Quarterly. 25: 35-55.
Rundquist, Barry S. and Thomas M. Carsey. 2002. Congress and Defense Spending: The
Distributive Politics of Military Procurement. Norman, OK: University of Oklahoma Press.
Shepsle, Ken. 1974. “On the Size of Winning Coalitions.” American Political Science Review.
68, Jun 1974: 505-518. Stewart, Charles III and Tim Groseclose. 1999. “The Value of Committee Seats in the United
States Senate, 1947-91.” American Journal of Political Science. 43 (3), Jul 1999: 963-

19
973. Stratmann, Thomas. 1992. “The Effects of Logrolling on Congressional Voting.” American
Economic Review. 82 (5), Dec 1992: 1162-1176. Tamura, Fumiko and Takuma Kunieda. 2005. “Vote-Buying Behavior in the Security Council:
Theory and Evidence from U.S. Foreign Aid.” Manuscript, Department of Economics, Brown University.
United States Congress. 2001. “Making appropriations for foreign operations, export financing,
and related programs for the fiscal year ending September 30, 2002, and for other purposes.” 107th Congress, 1st Session. Washington, DC : U.S. GPO.
United States Department of State. 2003. United States Participation in the United Nations: A
Report by the Secretary of State to the Congress for the Year 2002. Washington, DC: U.S. Government Printing Office.
Wang, T.Y. 1999. “U.S. Foreign Aid and U.N. Voting: An Analysis of Important Issues.”
International Studies Quarterly. 43: 199-210. Wittkopf, Eugene R. 1973. “Foreign Aid and United Nations Votes: A Comparative Study.”
American Political Science Review. 67 (3), Sep 1973: 868-888.

20
Table 1: Data, Means, and Variances Dataset 1: 1946-2001Variable Observations Mean Standard DeviationSC Member 5425 0.06 0.24NYT articles 5425 416.50 251.76War occurring (>1000 deaths) 5156 0.09 0.28Polity2 Score 4902 -1.93 6.62ln(GDP per capita, $1996) 3824 7.78 0.80ln(Total aid and loans from US, $1996) 5425 12.35 6.33Total aid and loans from US, $1996 million 5425 26.45 127.19
Dataset 2: 1960-2001Variable Observations Mean Standard DeviationSC Member 4041 0.06 0.24NYT articles 4041 374.09 179.19War occurring (>1000 deaths) 3774 0.08 0.27Polity2 Score 3583 -1.22 6.84ln(GDP per capita, $1995) 3943 6.82 1.08ln(Net ODA from UN, $1995) 4041 15.18 3.42Net ODA from UN, $1995 million 4041 13.86 25.44Net ODA from WFP, $1995 million 4041 3.79 11.32Net ODA from UNDP, $1995 million 4041 3.03 4.33Net ODA from UNICEF, $1995 million 4041 1.98 5.07Net ODA from UNHCR, $1995 million 4041 2.01 7.70Net ODA from UNTA, $1995 million 4041 0.86 1.07

21
Table 2: Economic and Military Aid from the United States, 1946-2001
dependent variable:ln(Total aid and loans from US, $1996)
(1) (2) (3) (4) (5) (6)SC Member 1.527 0.466
[0.379]*** [0.239]*On SC, Unimportant year -0.086 0.03 0.337
[0.436] [0.407] [0.423]On SC, Somewhat important year 0.432 0.474 0.478
[0.282] [0.294] [0.256]*On SC, Important year 0.99 0.993 0.741
[0.440]** [0.455]** [0.397]*War occurring (>1000 deaths) 0.007 -0.058 -0.051
[0.535] [0.624] [0.624]Polity2 Score 0.101 0.037 0.038
[0.034]*** [0.028] [0.028]ln(GDP per capita, $1996) -0.993 -1.009
[0.887] [0.888]One year before election to SC -0.045
[0.204]Year of election to SC 0.42
[0.213]*First year of serving on SC 0.44
[0.321]Second year of serving on SC 0.715
[0.260]***First year after finishing SC term 0.202
[0.363]Second year after finishing SC term 0.15
[0.331]Country and year fixed effects Yes Yes Yes Yes Yes YesRegion Quartics No Yes Yes Yes Yes YesObservations 5425 5425 5425 4902 3616 3616R-squared 0 0.64 0.64 0.61 0.6 0.6Robust standard errors in brackets clustered on country. Egypt time trend included in regressions (2)-(6).* significant at 10%; ** significant at 5%; *** significant at 1%
We also re-run the estimation in column 6, replacing the event-time variables with dummy variables corresponding to a "treatment period" (the year of election and the two years of service) and a "control period" (the three years before and after the treatment period). The coefficient on the "treatment period" dummy is 0.548 and the coefficient on the "control period" dummy is 0.048. A test of the equality of these two coefficients can be rejected at the 0.01 level.
22
Table 3: Aid from the United Nations, 1960-2001
dependent variable:ln(Net ODA from UN, $1995)
(1) (2) (3) (4) (5)SC Member 0.859 0.075
[0.277]*** [0.088]On SC, Unimportant year -0.108 0.011
[0.088] [0.085]On SC, Somewhat important year -0.063 -0.074
[0.179] [0.170]On SC, Important year 0.422 0.44
[0.164]** [0.169]**War occurring (>1000 deaths) -0.579 -0.578
[0.222]** [0.222]**Polity2 Score 0.007 0.007
[0.015] [0.015]ln(GDP per capita, constant 1995 US$) -1.005 -1.011
[0.277]*** [0.280]***One year before election to SC -0.003
[0.128]Year of election to SC 0.064
[0.138]First year of serving on SC 0.099
[0.139]Second year of serving on SC 0.17
[0.087]*First year after finishing SC term 0.12
[0.076]Second year after finishing SC term 0.043
[0.087]Country and year fixed effects No Yes Yes Yes YesRegion Quartics No Yes Yes Yes YesObservations 4041 4041 4041 3490 3490R-squared 0 0.75 0.75 0.66 0.66Robust standard errors in brackets clustered on country. Egypt time trend included in regressions (2)-(5).* significant at 10%; ** significant at 5%; *** significant at 1%
We also re-run the estimation in column 5, replacing the event-time variables with dummy variables corresponding to a "treatment period" (the two years of service on the council as well as the year directly following service) and a "control period" (the three years before and after the treatment period). The coefficient on the "treatment period" dummy is 0.126 and the coefficient on the "control period" dummy is 0.015. A test of the equality of these two coefficients an be rejected at the 0.11 level. Note that the treatment and control periods for the US regressions lag those of the UN by one year, reflecting the differences in the definition of US and UN aid.

23
Table 4: Aid from the United Nations by Agency, 1960-2001
dependent variable:ln(Net ODA, $1995) from:
WFP UNDP UNICEF UNHCR UNTA(1) (2) (3) (4) (5)
On SC, Unimportant year -0.525 -0.107 -0.155 0.105 0.037[0.454] [0.176] [0.434] [0.499] [0.080]
On SC, Somewhat important year 0.313 -0.287 0.307 0.432 -0.023[0.502] [0.235] [0.242] [0.547] [0.078]
On SC, Important year -0.202 0.227 0.488 0.278 0.136[0.511] [0.216] [0.240]** [0.418] [0.115]
War occurring (>1000 deaths) -0.579 -0.853 -0.488 -0.701 -0.649[0.605] [0.397]** [0.422] [0.661] [0.362]*
Polity2 Score 0.041 0.019 0.026 0.021 -0.003[0.031] [0.018] [0.025] [0.041] [0.012]
ln(GDP per capita, constant 1995 US$) -2.025 -0.712 -1.247 -0.883 -0.527[0.641]*** [0.392]* [0.456]*** [0.584] [0.255]**
Country and year fixed effects Yes Yes Yes Yes YesRegion Quartics Yes Yes Yes Yes YesObservations 3509 3501 3503 3515 3502R-squared 0.73 0.87 0.86 0.69 0.94Robust standard errors in brackets clustered on country. Egypt time trend included in all regressions.* significant at 10%; ** significant at 5%; *** significant at 1%

24
Figure 1: The New York Times Variable
0
200
400
600
800
1000
1200
1400
1600
1800
1940 1950 1960 1970 1980 1990 2000 2010
Number of articles on "United Nations" and"Security Council" in New York Times
First year of UN
Korean War
Suez
U2, Congo
Falklands, Lebanon
Iraq I
Numerous Peacekeeping
Kosovo

25
Figure 2: Aid to Non-Permanent Security Council Members in Event Time
$80
$100
$120
$140
$160
$180
$200
-1 0 1 2 3 4
Year (0=election to council)
Nor
mal
ized
aid
(yea
r bef
ore
elec
tion
= $1
00)
US foreign aidUN ODA

26
Appendix I: Who Serves on the Security Council
CountryYears on Security
Council, 1946-2001 CountryYears on Security
Council, 1946-2001Africa AsiaEgypt, Arab Rep. 9 Japan 16Nigeria 6 India 12Tunisia 6 Pakistan 10Zambia 6 Malaysia 5Algeria 4 Turkey 5Congo, Dem. Rep. 4 Bangladesh 4Cote d'Ivoire 4 Indonesia 4Ethiopia 4 Iraq 4Gabon 4 Jordan 4Ghana 4 Nepal 4Kenya 4 Philippines 4Mali 4 Syrian Arab Republic 4Morocco 4 Bahrain 2Senegal 4 Iran, Islamic Rep. 2Zimbabwe 4 Korea, Rep. 2Mauritius 3 Kuwait 2Uganda 3 Lebanon 2Benin 2 Oman 2Botswana 2 Sri Lanka 2Burkina Faso 2 Thailand 2Burundi 2 United Arab Emirates 2Cameroon 2 Yemen, Rep. 2Cape Verde 2 Singapore 1Congo, Rep. 2Djibouti 2 Eastern EuropeGambia, The 2 Poland 9Guinea 2 Yugoslavia, Fed. Rep. 7Guinea-Bissau 2 Ukraine 6Libya 2 Romania 5Madagascar 2 Bulgaria 4Mauritania 2 Hungary 4Namibia 2 Belarus 2Niger 2 Czech Republic 2Rwanda 2 Slovenia 2Sierra Leone 2Somalia 2 Latin America and the CaribbeanSudan 2 Brazil 16Tanzania 2 Argentina 14Togo 2 Colombia 11Liberia 1 Panama 8
Venezuela, RB 8Western Europe and Other Chile 6Canada 12 Cuba 6Italy 10 Ecuador 6Netherlands 9 Peru 6Australia 8 Bolivia 4Belgium 8 Costa Rica 4Norway 7 Guyana 4Denmark 6 Jamaica 4Germany 6 Nicaragua 4Spain 6 Mexico 3Sweden 6 Honduras 2New Zealand 5 Paraguay 2Austria 4 Trinidad and Tobago 2Finland 4 Uruguay 2Ireland 4Portugal 4Greece 2 due to their high income.Malta 2
Countries in italics are not included in the base sample

27
Appendix II: Robustness Checks on Treatment of Zeroes and Regional Trends
dependent variable: ln(Total aid and loans from US, $1996) ln(Net ODA from UN, $1995)
(1) (2) (3) (4) (1) (2) (3) (4)On SC, Unimportant year -0.526 -0.324 -0.478 0.013 -0.06 -0.033 -0.054 0
[0.190]*** [0.217] [0.180]*** [0.381] [0.060] [0.066] [0.061] [0.080]On SC, Somewhat important year 0.288 0.281 0.197 0.424 0.107 0.055 0.115 -0.06
[0.124]** [0.120]** [0.128] [0.336] [0.053]** [0.073] [0.052]** [0.177]On SC, Important year 0.337 0.619 0.457 0.997 0.135 0.231 0.134 0.394
[0.157]** [0.196]*** [0.143]*** [0.467]** [0.072]* [0.096]** [0.073]* [0.170]**War occurring (>1000 deaths) -0.041 -0.059 -0.087 -0.065 -0.206 -0.355 -0.25 -0.594
[0.202] [0.274] [0.194] [0.559] [0.111]* [0.137]** [0.113]** [0.225]***Polity2 Score 0.041 0.056 0.036 0.1 -0.002 0.002 0 0.005
[0.011]*** [0.015]*** [0.011]*** [0.038]*** [0.006] [0.008] [0.005] [0.015]ln(GDP per capita, constant 1995 US$) -0.588 -0.725 -0.594 -0.972
[0.115]*** [0.153]*** [0.115]*** [0.279]***Did not receive any aid -14.339 -14.678
[0.225]*** [0.304]***Country and year fixed effects Yes Yes Yes Yes Yes Yes Yes YesRegion Quartics Yes Yes Yes No Yes Yes Yes NoRegion Year Interactions No No No Yes No No No YesLog of nonpositive aid values set to Dropped 10 0 0 Dropped 10 0 0Observations 4127 4902 4902 4902 3424 3490 3490 3490R-squared 0.71 0.67 0.96 0.63 0.78 0.76 0.94 0.69Robust standard errors in brackets clustered on country. Egypt time trend included in all regressions.* significant at 10%; ** significant at 5%; *** significant at 1%

28
Appendix III: Robustness Checks on Sample Selection
dependent variable: ln(Total aid and loans from US, $1996) ln(Net ODA from UN, $1995)
(1) (2) (3) (4) (1) (2) (3) (4)On SC, Unimportant year 0.038 0.028 0.295 -0.005 -0.001 0.065 0.01 0.002
[0.397] [0.396] [0.421] [0.412] [0.081] [0.092] [0.084] [0.078]On SC, Somewhat important year 0.475 0.197 0.315 0.48 -0.063 -0.07 -0.082 -0.046
[0.308] [0.365] [0.238] [0.294] [0.172] [0.173] [0.170] [0.172]On SC, Important year 0.983 1.137 0.669 0.845 0.338 0.49 0.45 0.338
[0.446]** [0.441]** [0.336]** [0.465]* [0.138]** [0.160]*** [0.171]*** [0.173]*War occurring (>1000 deaths) -0.694 -0.197 -0.023 -0.14 -0.202 -0.468 -0.559 -0.453
[0.620] [0.512] [0.618] [0.560] [0.080]** [0.237]* [0.222]** [0.199]**Polity2 Score 0.076 0.177 0.041 0.107 -0.014 0.014 0.008 0.014
[0.035]** [0.044]*** [0.028] [0.035]*** [0.010] [0.017] [0.015] [0.016]ln(GDP per capita, constant 1995 US$) -0.686 -1.406 -1.006 -0.683
[0.182]*** [0.424]*** [0.276]*** [0.225]***Country and year fixed effects Yes Yes Yes Yes Yes Yes Yes YesRegion Quartics Yes Yes Yes Yes Yes Yes Yes YesSample CriteriaMethod of excluding high income countries 2003 GDP Not excl Annual GDP 2003 GDP 2003 GDP Not excl Annual GDP 2003 GDPNever served on the Security Council excluded? Yes No No No Yes No No NoGulf War period (1990-91) excluded? No No No Yes No No No YesObservations 3724 5975 3869 4688 2634 3692 3542 3181R-squared 0.6 0.61 0.63 0.61 0.6 0.61 0.66 0.67Robust standard errors in brackets clustered on country. Egypt time trend included in all regressions. High-income countries excluded in 2003 based on World Bank classification. Excluded with annual data if real GDP per capita greater than $10,000.* significant at 10%; ** significant at 5%; *** significant at 1%