Embed Size (px)
Citation preview

No. 2008-03-B
OFFICE OF ECONOMICS WORKING PAPER U.S. INTERNATIONAL TRADE COMMISSION
Robert Koopman* Zhi Wang*
U.S. International Trade Commission
Shang-jin Wei Columbia University and NBER
March 2008
*The authors are with the Office of Economics of the U.S. International Trade Commission. Office of Economics working papers are the result of the ongoing professional research of USITC Staff and are solely meant to represent the opinions and professional research of individual authors. These papers are not meant to represent in any way the views of the U.S. International Trade Commission or any of its individual Commissioners. Working papers are circulated to promote the active exchange of ideas between USITC Staff and recognized experts outside the USITC, and to promote professional development of Office staff by encouraging outside professional critique of staff research.
Address correspondence to: Office of Economics
U.S. International Trade Commission Washington, DC 20436 USA
How Much of Chinese Exports Is Really Made in China?
Assessing Foreign and Domestic Value-Added in Gross Exports

How much of Chinese exports is really made in China? Assessing foreign and domestic value-added in gross exports
Robert Koopman and Zhi Wang United States International Trade Commission
Shang-Jin Wei
Columbia University, CEPR, and NBER
Abstract
As China’s juggernaut export machine employs many imported inputs, there are many policy questions for which it will be crucial to know the extent of domestic value added (DVA) in its exports. The best known approach is the concept of “vertical specialization” proposed by Hummels, Ishii and Yi (2001) (HIY for short). This approach is not appropriate for countries that engage in a lot of processing exports such as China, Mexico, and Vietnam. We develop a general formula for computing domestic and foreign contents when processing exports are pervasive. Because the new formula requires some input-output coefficients not typically available from a conventional input-output table, we propose a mathematical programming procedure to estimate these coefficients by combining information from detailed trade statistics with input-output tables. By our estimation, the share of foreign content in China’s exports is at about 50%, almost twice as high as the estimate from the HIY formula. There are also interesting variations across sectors and firm ownership. Those sectors that are likely labeled as relatively sophisticated such as electronic devices have particularly high foreign content (about 80%). Foreign-invested firms also tend to have higher foreign content in their exports than domestic firms. Key words: domestic content, foreign content, processing exports JEL Classification Numbers: F1, C67, C82
Corresponding author: Zhi Wang, Research Division, Office of Economics, United States International Trade Commission, Room 603F, 500 E Street SW, Washington, DC 20436. E-mail: [email protected].
The authors are grateful to Leonard Cheng, Judith Dean, Pieter Bottelier, Kun-fu Zhu and seminar participants at the International Trade Commission for helpful comments, and John Klopfer for editorial assistance. The views in the paper are those of the authors and are not the official views of the USITC, or of any other organization that the authors are or have been affiliated with.

1
1. Introduction
The People’s Republic of China is the archetype of a national economy that is
well integrated into a global production chain. It imports raw material, equipment, and
other intermediate inputs, and then exports a big fraction of its output (on the order of
37% of GDP in 2006) to the world market. China’s export/GDP ratio is extraordinarily
high for a large economy, when compared with 8% for the United States and 13% for
India in the same year. With a reputation as a “world factory,” China is a top supplier of
manufacturing outsourcing for many global companies.
Imported inputs used in the production for exports reduce the share of value
added generated by domestic producers in a nation’s exports. Consider the example of
iPod, which China assembles for Apple and exports to the United States and other
countries. In trade statistics, the Chinese export value for a unit of a 30GB video model in
2006 was about $150. However, the best estimate of the value added attributable to
producers in China was only $4, with the remaining value added coming from the United
States, Japan, and other countries (Linden, Kraemer, and Dedrick, 2007; and Varian,
2007).
For many policy issues, it is important to assess the extent of domestic content in
exports. For example, what is the effect of a currency appreciation on a country’s exports?
The answer depends crucially on the share of domestic content in the country’s exports.
Other things equal, a given exchange rate appreciation would have a smaller effect on
trade volume, the lower the share of domestic content in the exports. As another example,
what is the effect of trading with China on US income inequality? The answer depends in
part on whether China simply exports products that are intensive in low-skilled labor or
whether China’s exports are more sophisticated. Rodrik (2006) notes that the per capita
income typically associated with the kind of goods bundle that China exports is much
higher than China’s actual income. He interprets this as evidence that the skill content of
China’s exports is likely to be much higher than its endowment may imply. Schott (2008)
documents an apparent fast increase in the similarity between the Chinese export
structure and that of high-income countries, and interprets it as evidence of a rise in the

2
level of sophistication embedded in Chinese exports. However, if the domestic content in
China’s exports is low, especially in sectors that would have been considered
sophisticated or high-skilled in the United States, then imports from China may still
generate a large downward pressure on the wage of the low-skilled Americans after all
(as pointed out by Krugman, 2008).
How would one assess foreign versus domestic content in a country’s exports?
Hummels, Ishii, and Yi (2001) (HIY for short in subsequent discussion) propose a
concept of vertical specialization (VS) in a country’s trade, defined as "the imported
input content of exports, or equivalently, foreign value added embodied in exports," and
provide a formula to compute VS share based exclusively on a country’s input-output
table. For a sample of 14 countries (not including China), they calculate that the average
share of foreign value added in exports was about 21% in 1990. Yi (2003) shows that a
dramatic increase in vertical specialization after the Second World War is likely to be
responsible for a faster growth of world trade relative to world GDP over the last five
decades. Other recent applications of the vertical specialization concept include Goh and
Olivier (2004), Chinn (2005), U.S. National Research Council (2006), and Dean, Fung,
and Wang (2007).
A key assumption needed for the HIY formula to work is that the intensity in the
use of imported inputs is the same between production for exports and production for
domestic sales. This assumption is violated in the Chinese case due to pervasive
processing exports. Processing exports are characterized by imports for exports with
favorable tariff treatment: firms import parts and other intermediate materials from
abroad, with tariff exemptions on the imported inputs and other tax preferences from
local or central governments, and, after processing or assembling, export the finished
products to the international market. The policy preferences for processing exports
usually lead to a significant difference in the intensity of imported intermediate inputs in
the production for processing exports and in other productions (for domestic final sales
and normal exports). Since processing exports have accounted for more than 50% of
Chinese exports every year at least since 1996 (see Column 1 of Table 1 for detail), the
HIY formula is likely to lead to a significant under-estimation of the share of foreign

3
value added in its exports. In fact, most economies offer tariff reductions or exemptions
on imported intermediate inputs used in production for exports. Ignoring processing
exports is likely to lead to estimation errors, especially for economies that engage in a
massive amount of tariff/tax-favored processing trade, such as Mexico and Vietnam.
Table 1: Processing Manufacturing Exports (excluding HS Chapters 1-27), 1996-2006 Year Share of
processing exports in total exports (100*PE/TE)
Share of Processing & assembling
Share of Processing with imported materials
Share of processing imports in total imports
Ratio of processing imports to processing exports(100*PM/PE)
Processing trade surplus as share of processing exports (100*[PE-PM]/PE)
1996 62.1 18.0 44.1 47.6 71.1 28.9 1997 60.2 17.9 42.3 53.1 67.0 33.0 1998 62.0 18.3 43.7 52.0 63.3 36.7 1999 61.2 19.9 41.3 47.9 64.7 35.3 2000 59.6 17.9 41.7 46.6 65.9 34.1 2001 59.7 17.2 42.5 43.0 62.7 37.3 2002 58.8 15.6 43.2 45.6 67.4 32.6 2003 58.5 13.2 45.4 44.0 66.7 33.3 2004 58.0 12.0 46.0 45.3 66.6 33.4 2005 57.0 11.3 45.7 48.3 64.6 35.4 2006 54.5 9.9 44.6 47.9 61.7 38.3
Source: Authors computed from China Customs Trade statistics, General Customs Administration of China. In this paper, we aim to make three contributions. First, we develop a formula for computing shares of foreign and domestic value added in a country’s exports when processing exports are pervasive. The HIY formula is a special case of this general formula. Second, because some of the input-output coefficients called for by the new formula are not generally available from conventional input-output tables, we propose a mathematical programming method to estimate these coefficients by combining information from trade statistics (which separate processing and normal trade) with standard input-output (I/O) tables. Third, we apply our methodology to the Chinese data in 1997, 2002, and 20061. We estimate that the share of foreign value added in Chinese manufactured exports is at about 50%, almost twice as high as that implied by the HIY formula. There are also interesting variations across sectors and firm ownership. Those sectors that are likely labeled as relatively sophisticated such as computers, telecommunication equipments, and electronic devices have particularly high foreign
1 Note that the 2002 Input-Output Table is the latest such table available; the next table— the 2007 benchmark IO table— is scheduled to be released in 2010. Our 2006 estimates make use of the 2006 trade statistics but of the 2002 I/O table.

4
content (about 80%). Foreign-invested firms also tend to have higher foreign content in their exports than do Chinese domestic firms.
Besides the papers on vertical specialization in the international trade literature,
this paper is also related to the I/O literature. In particular, Chen et al. (2004) and Lau et
al (2007) are the first to develop a “non-competitive” type I/O model for China (i.e., one
in which imported and domestically produced inputs are accounted for separately) and to
incorporate processing exports explicitly. However, these papers do not describe a
systematic way to infer separate input-output coefficients for production of processing
exports versus those for other final demands. It is therefore difficult for others to replicate
their estimates or apply their methodology to other countries. In addition, they use an
aggregated version of China’s 1995 and 2002 input-output tables, respectively, to
perform their analysis, with 20 some goods producing industries. We provide a more up-
to-date and more disaggregated assessment of foreign and domestic values added in
Chinese exports with 83 goods producing industries. Finally, they impose an assumption
in estimating the import use matrix from the competitive type I/O table published by
China’s National Statistical Bureau: within each industry, the mix of the imported and
domestic inputs is the same in capital formation, intermediate inputs, and final
consumption. We relax this assumption by refining a method proposed in Dean, Fung,
and Wang (2007) that combines China’s processing imports statistics with United
Nations Broad Economic Categories (UNBEC) classification.
The rest of the paper is organized as follows. Section 2 presents a conceptual
framework for estimating shares of domestic and foreign value added in a country’s
exports when processing exports are pervasive. It also describes a mathematic
programming procedure to systematically infer a set of I/O coefficients called for by the
new formula but not typically available from a conventional I/O table. Section 3 presents
the estimation results for Chinese exports. Finally, Section 4 offers concluding remarks.
5
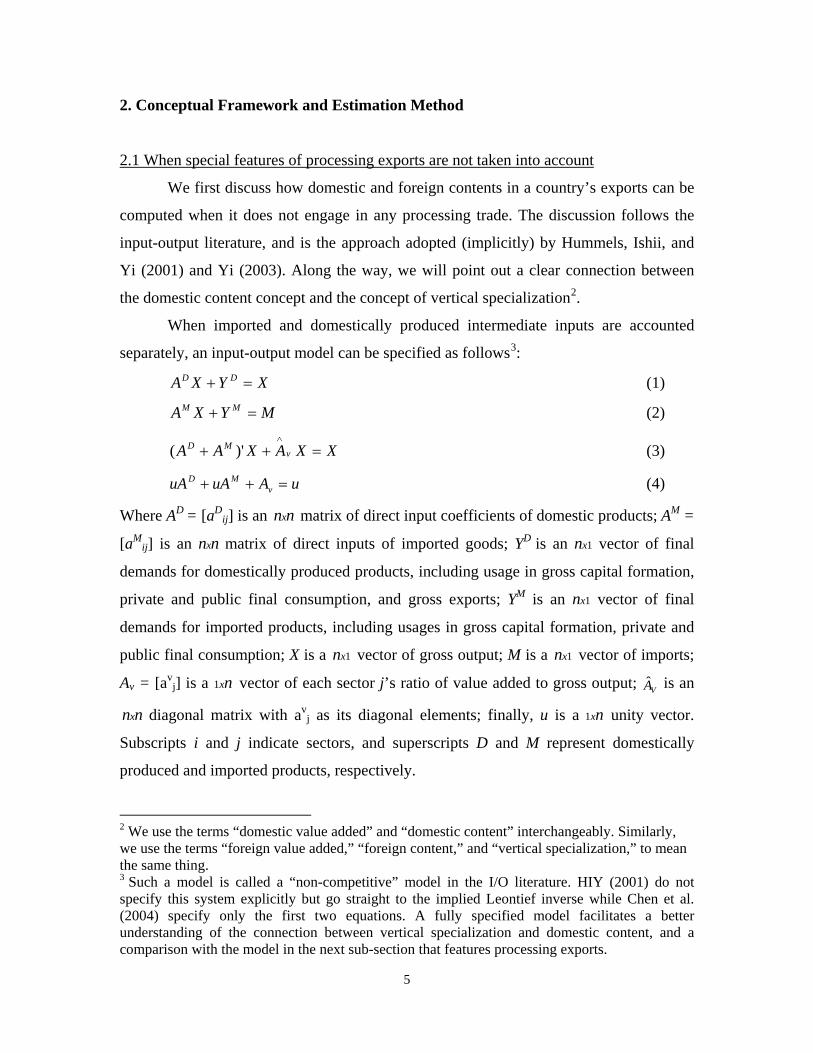
2. Conceptual Framework and Estimation Method
2.1 When special features of processing exports are not taken into account
We first discuss how domestic and foreign contents in a country’s exports can be
computed when it does not engage in any processing trade. The discussion follows the
input-output literature, and is the approach adopted (implicitly) by Hummels, Ishii, and
Yi (2001) and Yi (2003). Along the way, we will point out a clear connection between
the domestic content concept and the concept of vertical specialization2.
When imported and domestically produced intermediate inputs are accounted
separately, an input-output model can be specified as follows3:
XYXA DD =+ (1)
MYXA MM =+ (2)
XXAXAA vMD =++
∧
)'( (3)
uAuAuA vMD =++ (4)
Where AD = [aDij] is an xn n matrix of direct input coefficients of domestic products; AM =
[aMij] is an xn n matrix of direct inputs of imported goods; YD is an 1xn vector of final
demands for domestically produced products, including usage in gross capital formation,
private and public final consumption, and gross exports; YM is an 1xn vector of final
demands for imported products, including usages in gross capital formation, private and
public final consumption; X is a 1xn vector of gross output; M is a 1xn vector of imports;
Av = [avj] is a 1xn vector of each sector j’s ratio of value added to gross output; ˆ
VA is an
xn n diagonal matrix with avj as its diagonal elements; finally, u is a 1xn unity vector.
Subscripts i and j indicate sectors, and superscripts D and M represent domestically
produced and imported products, respectively.
2 We use the terms “domestic value added” and “domestic content” interchangeably. Similarly, we use the terms “foreign value added,” “foreign content,” and “vertical specialization,” to mean the same thing. 3 Such a model is called a “non-competitive” model in the I/O literature. HIY (2001) do not specify this system explicitly but go straight to the implied Leontief inverse while Chen et al. (2004) specify only the first two equations. A fully specified model facilitates a better understanding of the connection between vertical specialization and domestic content, and a comparison with the model in the next sub-section that features processing exports.

6
Equations (1) and (2) define two horizontal balance conditions for domestically
produced and imported products respectively. A typical row k in Equation (1) specifies
that total domestic production of product k should be equal to the sum of the sales of
product k to all users in the economy (to be used as intermediate inputs or for final sales
to these users), the final sales include domestic consumption and capital formation, plus
exports of product k. A typical row h in Equation (2) specifies that the total imports of
product h should be equal to the sum of the sales of product h to all users in the economy,
including intermediate inputs for all sectors, plus final domestic consumption and capital
formation. Equation (3) is a vertical balance conditions, and Equation (4) describes an
adding-up constraint for the input-output coefficients. Collectively, they imply that the
total output (X) in any sector k has to be equal to the sum of direct value added in sector k,
and the cost of intermediate inputs from all domestically produced and imported products.
From equation (1) we have
DD YAIX 1)( −−= (5) 1)( −− DAI is the well-known Leontief Inverse, a matrix of coefficients for the
total domestic intermediate product requirement. Define a vector of share of domestic
content, or domestic value added, in a unit of domestically produced products, DVS =
{dvsj}, a 1xn vector, as the additional domestic value added generated by one additional
unit of final demand of domestic products (ΔYD = u’).
1)(/ −∧∧
−=ΔΔ= Dv
Dv AIAYXADVS (6)
Equation (6) indicates that the domestic content for an I/O industry is the corresponding
column sum of the coefficient matrix for total domestic intermediate goods requirement,
weighted by the direct value-added coefficient of each industry.
Under the condition that all exports and domestic sale have the same input-output
coefficients, the share of domestic content in final demand and the share of domestic
content in total exports should be the same. So Equation (6) is also the formula for the
share of domestic content in total exports for each industry. As Chen et al (2004) points
out, there is a good intuition behind the DVS formula. When one extra unit of product for
final demand is produced at home, both direct and indirect values added are generated.
The indirect value added comes from the domestic value added embedded in all the

7
domestically produced intermediate inputs. Each of them is produced with direct and
indirect value added involved. Therefore, the total domestic value added induced by one
extra unit of domestic product is equal to the sum of direct domestic value added and
multiple rounds of indirect domestic value added. Expressing this process
mathematically, we have:
1)(
....−−=
++++=D
v
DDDv
DDv
Dvv
AIA
AAAAAAAAAADVS (7)
The last step invokes the formula for the convergence of matrix power series of DA .
Define a vector of share of foreign content (or foreign value added) in final
demand for domestically produced products by FVS = u – DVS. By making use of
Equation (4), it can be verified that
FVS = 1)( −−− Dv AIAu 1)( −−= DM AIuA (8)
For each industry, this is the column sum of the coefficient matrix for total
intermediate import requirement. This turns out to be the exact same formula used to
compute vertical specialization by HIY (2001). In other words, the concepts of vertical
specialization and of foreign content are identical.
2.2 Domestic Content in Exports When Processing Trade is Prevalent
We now turn to the case in which tariff-favored processing exports are prevalent,
which have a different intensity in the use of imported inputs than do domestic final sales
(and normal exports). Conceptually, we wish to keep separate track of the I/O
coefficients of the processing exports from those of domestic final sales and normal
exports. For now, we ignore the fact that these I/O coefficients may not be directly
available, and will discuss a formal approach to estimate them in the next subsection.
The expanded I/O table with a separate account for processing exports is
represented by Figure 1.

8
Figure 1: Input-output table with separate production account for processing trade
Intermediate use
Production for domestic use & normal exports
Production of processing exports
Final use (C+I+G+E)
Gross Output or Imports
DIM 1,2,…, N 1,2,…, N 1 1 Production for domestic use & normal exports (D)
1 . . . N
DDZ
DPZ
DY
PEX −
Domestic Intermediate Inputs
Processing Exports (P)
1 . . . N
0
0
PE
PE
Intermediate Inputs from Imports
1 . . . N
MDZ
MPZ
MY
M
Value-added
1
DV PV
Gross output
1
PEX −
PE
We use superscript P and D, respectively, to represent processing exports, and
domestic sales & normal exports. Define ddijz = Domestically produced intermediate good
i used by sector j for domestic sales and normal exports; dpijz = Domestically produced
intermediate good i used by sector j for processing exports; mdijz = Imported intermediate
good i used by sector j for domestic sales and normal exports; mpijz = Imported
intermediate good i used by sector j for processing exports; djv = Value added by
domestic and normal export production in industry j ; pjv = Value added by processing
export production in industry j. Then direct I/O coefficients for this expanded I/O model
can be written as:

9
][][ pjj
ddijdd
ijDD
exz
aA−
== , ][][ pjj
mdijmd
ijMD
exz
aA−
== , ][][ pjj
djvd
jDv ex
vaA
−==
][][],[][],[][ pj
pjvp
jPvp
j
mpijmp
ijMP
pj
dpijdp
ijDP
ev
aAez
aAez
aA ======
Where i represent a row and j represents a column. This expanded I/O model can be
formally described by the following system of equations:
⎥⎥⎦
⎤
⎢⎢⎣
⎡=
⎥⎥⎦
⎤
⎢⎢⎣
⎡ −⎥⎦
⎤⎢⎣
⎡ −−P
D
P
PDPDD
EY
EEX
IAAI
0 (9)
MYEAEXA MPMPPMD =++− )( (10)
PPDv
PMDDD EXEXAEXAA −=−+−+∧
)()()'( (11)
PPMv
PMPDP EEAEAA =++∧
))'( (12)
PDkuAuAuA kv
MkDk ,==++ (13)
This is a generalization of the model discussed in the previous subsection.
Equations (9)-(10) are a generalization of Equations (1)-(2), and Equations (11)-(12) are
a generalization of Equation of (3), with a separate account for processing exports. In a
slight abuse of notation, we now re-define YD to be final domestic sales plus normal
exports while excluding processing exports. Equation (13) is the new adding up
constraint for the I/O coefficients.
The analytical solution of the system is
⎥⎥⎦
⎤
⎢⎢⎣
⎡⎥⎦
⎤⎢⎣
⎡ −−=
⎥⎥⎦
⎤
⎢⎢⎣
⎡ −−
P
DDPDD
P
P
EY
IAAI
EEX
1
0 (14)
The generalized Leontief inverse for this expanded model can be computed as
follows:
⎥⎦
⎤⎢⎣
⎡ −−=⎥
⎦
⎤⎢⎣
⎡=⎥
⎦
⎤⎢⎣
⎡ −−=
−−−
IAAIAI
BBBB
IAAI
BDPDDDD
PPPD
DPDDDPDD
0)()(
0
111
(15)
Substituting equation (15) into equation (14), we have:
pDPDDDDDP EAAYAIEX 11 )1()( −− −+−=− (16)

10
Substituting equation (16) into equation (10), the total demand for imported
intermediate inputs is: pMPPDPDDMDDDDMDM EAEAAAYAIAYM +−+−=− −− 11 )1()( (17)
It has three components: the first term is total imported content in final domestic sale and
normal exports, and the second and the third terms are indirect and direct imported
content in processing exports, respectively.
We can compute vertical specialization (VS) or foreign content share in
processing and normal exports in each industry separately: T
MPDPDDMD
DDMDT
P
D
uAAAuAAIuA
VSSVSS
+−−
=−
−
1
1
)1( )( (18)
The total foreign content share in a particular industry is the sum of the two weighted by
the share of processing and non-processing exports sp and u-sp:
P
DPP
VSSVSS
ssuVSS ),( −= (19)
The foreign content (or foreign value-added) share in a country’s total exports is:
teEAAAAu
teEEAIuATVSS
PMPDPDDMD
PDDMD ))1(()( 11 +−+
−−= −− (20)
Where te is a scalar, the country’s total exports. Equation (19) is a generalization of
Equation (8), the formula to compute industry-level share of vertical specialization.
Equation (20) is a generalization of the formula for country-level share of vertical
specialization proposed by HIY (2001, page 80). In particular, either when DDA = DPA
and MDA = MPA , or when EP/te = 0, Equation (20) reduces to the HIY formula for VS.
Similarly, the domestic content share for processing and normal exports at the
industry level can be computed separately:
T
Pv
DPDDDv
DDDv
DPDDDDpv
Dvv
T
P
D
AAAIAAIA
IAAIAI
AABADVSDVS
+−−
=
⎥⎦
⎤⎢⎣
⎡ −−==
−
−
−−−
1
1
11
)()(
0)()(
)(
(21)
The total domestic content share in a particular industry is a weighted sum of the
two:

11
P
DPP
DVSDVS
ssuDVS ),( −= (22)
The domestic content share in a country’s total exports is:
teEAAAA
teEEAIATDVS
PP
VDPDDD
V
PDDD
V ))1(()( 11 +−+−
−= −− (23)
Either when DDA = DPA and DvA = P
vA , or when EP/te = 0, Equation (22) reduces
to Equation (6). Note we can easily verify that for both processing and normal exports,
the sum of domestic and foreign content shares is unity (see Appendix for details).
2.3 Estimation Issues
Equations (21-23) allows us to compute the shares of domestic content in
processing and normal exports for each industry as well as in a country’s total exports.
However, statistical agencies typically only report a traditional I/O matrix, AD, and
sometimes AM, but not ADP, ADD, AMP and AMD separately. Therefore, we have to develop
a method to estimate ADP, ADD, AMP and AMD based on available information. Or,
equivalently, we have to estimate [zijdd], [zij
dp], [zijmd], and [zij
md], respectively, instead of
[aijdd], [aij
dp], [aijmd], and [aij
mp]. In this sub-section, we propose to do this via a quadratic
programming model by combining information from trade statistics and conventional I/O
tables.
The following data are observable from a standard I/O table and enter our
programming model as constants: ix = Gross output of sector i; ijz = Goods i used as
intermediate inputs in sector j; jv = Value-added in sector j; and im = Total imports of
sector i goods; and iy =Total final demand except for exports of goods i. We combine
information from a standard I/O table and trade statistics to determine the values for pim
= Imports of sector i good used as intermediate inputs to produce processing exports
(with the share estimated from trade statistics); dim = Imports of sector i goods used as
intermediate inputs for domestic production and normal exports (with the share also
estimated from trade statistics); nie = Normal exports of sector i and p
ie = Processing
exports of sector i (with the share obtained from trade statistics). To be precise, we use

12
information from an I/O table to determine sector-level total imports/exports, and
information from trade statistics to determine the relative proportion of processing and
normal exports within a sector. Using the data from I/O table to determine sector-level
total imports/exports helps to ensure that the balance conditions in official I/O account
are always satisfied and the I/O table with separate processing exports account estimated
from our model always sum to the published official table. Other parameters of the model
can be inferred from the variables already discussed: miy = Final demand of goods i from
imports (residuals of im - pim - d
im ); diy = Final demand of goods i provided by
domestic production (residual of iy - miy ). i and j are indices of sectors from 1 to K.
We wish to estimate within-industry transactions [zijdd], [zij
dp], [zijmd], and [zij
md], as
well as sector-level value added [vjd], and [vj
p]. We can make initial guesses about their
values based on trade statistics and coefficients from a conventional I/O table. These
guesses are referred to as “initial values” below. However, these guesses are not
guaranteed to satisfy various economic and statistical restrictions on the data. Therefore,
we cast the estimation problem as a constrained optimization. Using the notations
previously defined, our programming model is specified by the following objective
function subject to ten constraints:
∑∑∑∑
∑∑∑∑∑∑
=
= =
−
== =
−+
−−
−++
−
K
jpj
pj
pj
dj
dj
dj
K
1=jmpij
mpij
mpij
K
=i
K
=i
K
i
K
jmdij
mdij
mdij
dpij
dpij
dpij
K
j
K
1=iddij
ddij
ddij
K
i
K
j
vvv
v
vv +
zzz
+
zzz
z
zz
zzz
= S
1
222
11
1 1
22
1
2
1 1
0)0(
0)0(
0)0(
)0(0
)0(0
)0(Min
(24)
Where z’s and v’s are variables to be estimated, those variables with a 0 in the suffix
denote initial values.
e x =eyzz pi i
ni
di
dpij
K
j
ddij −+
=
++∑ )(1
(25)
m =yzz imi
mpij
K
j
mdij ++∑
=
)(1
(26)
e x =vzz pj j
dj
mdij
K
j
ddij −
=
++∑ )(1
(27)

13
e =vzz pj
pj
mpij
K
i
dpij ++∑
=
)(1
(28)
mz di
K
j
mdij = ∑
=1 (29)
mz pi
K
j
mpij = ∑
=1 (30)
mmzzz pi
di
K
jij
dpij
K
j
ddij = )()(
11+−+ ∑∑
==
(31)
zzzzz ijmpij
mdij
dpij
ddij =+++ (32)
vvv jpj
dj =+ (33)
yyy imi
di =+
(34)
The economic meanings of these ten constraints are straightforward. Equations (25)
and (26) are row sum constraints for the expanded I/O account. They state that total gross
output of sector i has to equal to the sum of domestic intermediaries, final demand and
exports (both processing and normal exports) in that sector. Similarly, total imports have
to equal imported intermediate inputs plus imports delivered to final users. Equations
(27) and (28) are column sum constraints for the expanded I/O account. They define the
value of processing exports in sector j as the sum of domestic and imported intermediate
inputs as well as primary factors used in producing processing exports; these four groups
of constraints correspond to equations (9)-(12) in the extended I/O model respectively.
Equations (29) to (34) are a set of adding up constraints to ensure that the solution from
the model is consistent with official statistics on sector-level trade and within-industry
transactions.
The initial values for the variables are derived from the I/O industry level information.
In particular, those for intermediate imports are generated by allocating dim and p
im in
proportion to input i’s usage in sector j:

14
diK
jij
ijmdij
piK
jij
ijmpij m
z
zzm
z
zz
∑∑== 00 (35)
The initial values for domestically produced intermediates are generated in two
steps. First, we estimate total domestic product i used as intermediate inputs in sector j as
a residual of total intermediate inputs and imported intermediate inputs:
dijz = ijz - ( md
ijz + mpijz ) = dd
ijz + dpijz (36)
Second, we assume a proportional usage:
ddijz0 =
j
pjjd
ij xex
z)( −
(37)
dpijz0 =
j
pjd
ij xe
z (38)
The initial values for direct value added in the production for processing exports in sector
j ( pjv0 ), are generally set to be the residuals implied by Equation (28). However, we set a
minimum value at the sum of labor compensation and depreciation in a sector multiplied
by the share of processing exports in that sector’s total output. In other words, the initial
value pjv0 is set to equal the greater of the residuals from Equation (28) or the minimum
value. The initial value for direct value added in the production for domestic sales and
normal exports ( djv0 ) is set as the difference between jv (from the I/O table) and p
jv0 .
The proportion of processing to non-processing exports in each industry is obtained from
the customs export statistics. The partition of imports is based on a combination of
custom import statistics and UN BEC classification. In the application to Chinese data,
we also conduct some sensitivity checks to using alternative initial values. It turns out
that these alternative initial values do not materially alter our basic conclusions. We
implement this quadratic programming model in GAMS(Brooke et al, 2005), related
computer programs and data files will be available at The USITC website for
downloading.

15
3. Estimation Results
After describing the data sources, we report and discuss the estimation results for
shares of domestic and foreign content in Chinese exports at the aggregate level, and by
sector and by firm ownership.
3.1 Data
Inter-industry transaction and (direct) value-added data are from China’s 1997 and
2002 benchmark I/O tables published by the National Bureau of Statistics of China
(NBS). We use detailed exports and imports data from 1997, 2002, and 2006 from the
General Customs Administration of China to help differentiate the processing and normal
trade in each sector. The trade statistics are first aggregated from the 8-digit HS level to
China’s I/O industry level, and then used to compute the share of processing exports in
each I/O industry. Modifying a method from Dean, Fung and Wang (2007), we partition
all imports in a given industry into three parts based on the distinction between
processing and normal imports in the trade statistics, and on the UN BEC classification
scheme: (a) intermediate inputs in producing processing exports; (b) intermediate inputs
for normal exports and other domestic final sales; and (c) those used in gross capital
formation and final consumption. A summary of these trade statistics as a percentage of
China’s total imports during 1996-2006 is reported in Table 2, which shows a downward
trend for the use of imported inputs in producing processing exports, but a moderately
upward trend in their use in producing normal trade and domestic final sales. Detailed
trade statistics as a percentage of China’s total imports for each I/O industry in both 1997
and 2002 is listed in Appendix tables A-C.

16
Table 2: Final Use of Chinese Imports (in percent of total imports), 1997-2006
Source: Authors’ calculations based on the United Nation Broad Economic Categories (UNBEC) classification scheme, and Chinese trade statistics on normal and processing imports. Note: “Normal use” refers to “normal exports and domestic sales.” The UNBEC scheme classifies each HS 6-digit product into one of three categories: “intermediate inputs,” “capital goods,” and “final consumption.” For the first two categories, we further decompose the imports into two subcategories: “processing imports” by customs declaration are classified as for processing exports, and the remaining imports are classified as for normal use. Capital goods are part of the final demand in a conventional I/O model. However, this classification may under-estimate the import content of exports. We therefore also experiment with classifying a fraction of the capital goods as inputs used in current year of production. This is discussed in Section 3.2. 3.2 Domestic and foreign contents in total exports Table 3 shows decomposition results for foreign and domestic value-added shares
in 1997 and 2002. Preliminary estimates for 2006 are also included4. For comparison,
the results from the HIY method that ignore processing trade are also reported. The
aggregate domestic value added share in China’s merchandise exports was 52.3% in
1997, and 50.7% in 2006. For manufacturing products, these shares are slightly lower in
levels but trending upward moderately at 47.6% in 1997 and 49.4% in 2006, respectively,
indicating that China uses more imported intermediate inputs to produce manufacturing
4 We consider the estimates preliminary because the calculation relies on the trade statistics from 2006 but the I/O table from 2002. The 2002 I/O table is the most recent benchmark table currently available. The next benchmark table - the 2007 table – is scheduled to be released in 2010.Therefore, 2006 estimates are not directly comparable to 1997 and 2002 estimates.
Share of Intermediates Share of Capital goods Year
for processing exports for normal use for processing exports for normal use
Share of final Consumption
1996 46.2 26.8 8.1 16.7 2.2
1997 51.2 28.2 12.1 7.3 1.2 1998 50.8 28.2 10.0 9.8 1.3
1999 43.7 34.9 11.2 8.3 1.9 2000 39.4 41.2 9.1 8.5 1.7
2001 36.6 41.2 11.6 8.7 1.8 2002 38.3 38.5 10.3 11.1 1.8
2003 35.4 41.2 11.0 10.8 1.6 2004 35.1 42.3 9.1 12.0 1.5
2005 36.6 42.9 8.2 10.8 1.5 2006 35.7 43.5 10.0 9.1 1.7

17
goods than other exports. In general, the direct domestic value-added shares are less than
half of the total domestic value-added shares. However, the indirect foreign value-added
share was relatively small; most of the foreign content comes from directly imported
foreign inputs.
Table 3 Shares of domestic and foreign value added in total exports (%)
The HIY Method The KWW Method 1997 2002 2006* 1997 2002 2006* All Merchandise Total Foreign value-added 17.6 25.1 26.3 47.7 46.1 49.3 Direct foreign value-added 8.9 14.7 15.7 46.1 42.4 45.7 Total Domestic Value-added 82.4 74.9 73.7 52.3 53.9 50.7 Direct domestic value-added 29.4 26.0 25.3 23.7 20.1 19.2 Manufacturing Goods Only
Total Foreign value-added 19.0 26.4 27.1 52.4 48.7 50.6 Direct foreign value-added 9.7 15.6 16.3 50.9 45.0 47.0 Total Domestic Value-added 81.1 73.6 72.9 47.6 51.3 49.4 Direct domestic value-added 27.5 24.6 24.6 21.2 18.5 18.4
Source: Authors’ estimates. Note: The HIY method refers to estimates from using the approach in Hummels, Ishii, and Yi (2001). The KWW method refers to estimates from using the approach developed in this paper that takes into account special features of processing exports. The estimates for 2006 are preliminary as they use the trade statistics in 2006 but the I/O table in 2002, which is the latest available. The next one (the 2007 benchmark table) is scheduled to be released in 2010.
Relative to the numbers from the HIY’s method, our procedure produces a much
higher share of foreign value added in Chinese gross exports (approximately double) and
shows a different trend over time. To be more precise, estimates from the HIY method
show that the foreign content share (total VS share) increased steadily from 17.6% in
1997 to 26.3% in 2006 for all merchandise exports, and from 19.0% to 27.1% for
manufacturing only during the same period. In contrast, our estimates reveal no clear
trend for foreign content (with the share of foreign value added in all merchandise
exports falling from 47.7% in 1997 to 46.2% in 2002, and bouncing back to 49.3% in
2006, and a similar fluctuation for the share in manufacturing exports, it fell from 52.4%
in 1997 to 48.7% in 2002 but bounced back to 50.6 in 2006 , Overall, the HIY method
appears to incorrectly estimate both the level and the trend in domestic versus foreign
content in Chinese exports.

18
What accounts for the difference between ours and HIY approaches? There are at
least three factors drive the change of foreign content of the country’s total exports: (1)
the relative proportions of its total imports used as intermediate inputs in producing
processing exports and domestic sales & normal exports; (2) the share of processing
exports in its total exports; and (3) the sector composition of its exports. Because
processing exports tend to use substantially more imported inputs, and processing exports
account for a major share of China’s total exports, the HIY indicator is likely to
substantially underestimate the true for foreign content in China’s exports. This explains
the level of domestic content by our measure is much lower than that of the HIY
indicator. On the other hand, as exporting firms (both those producing for normal exports
and those for processing exports) gradually increase their intermediate inputs sourcing
from firms within China or multinationals move their upstream production to be near
their downstream production, the extent of domestic content in exports rose over time.
However, because exports from industries with relatively lower domestic content often
grow faster due to dramatic inflow of foreign direct investment, the composition of a
countries total exports may play as an offsetting factor to reduce the share of domestic
value-added in the country’s total exports, as the case of China after its WTO entry. As
Chinese government start to reduce the policy incentives for both FIE and processing
exports at the end of 2006, we may see a trend of increasing domestic contents in Chinese
exports again in the years to come.
Our interpretation is confirmed by a separate calculation of DVA shares for
processing and normal exports (Table 4). There is a roughly six percentage point increase
in the total foreign value-added share for domestic sales and normal exports between
1997 and 2006, which is consistent with the trend indicated by HIY measure. However,
in processing exports we see that more domestic-produced inputs were used in 2002 than
in 1997, with a reduction of imported contents by about seven percentage points, but it
bounded back to the 1997 level in 2006 because the share of wholly foreign owned
enterprises (whose exports has the lowest DVA share) in Chinese exports dramatically
increased from 29.4% to 39.3%, (table 6) from 2002 to 2006.
19
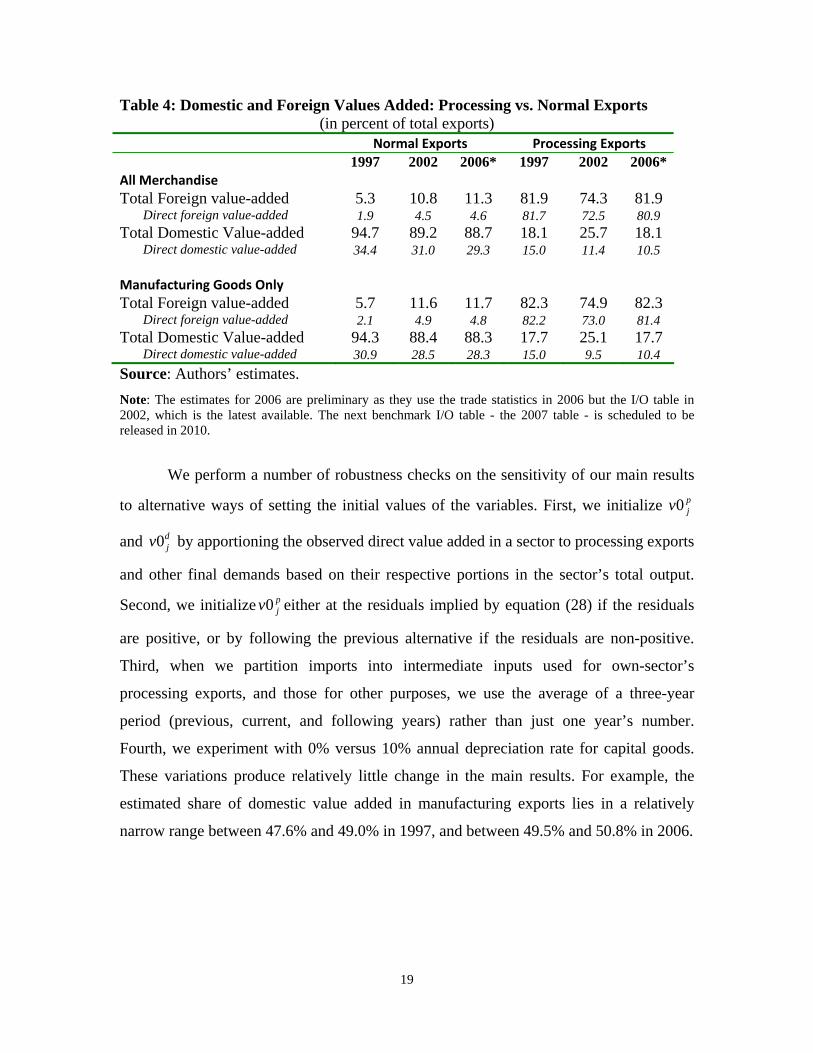
Table 4: Domestic and Foreign Values Added: Processing vs. Normal Exports (in percent of total exports)
Normal Exports Processing Exports 1997 2002 2006* 1997 2002 2006* All Merchandise Total Foreign value-added 5.3 10.8 11.3 81.9 74.3 81.9 Direct foreign value-added 1.9 4.5 4.6 81.7 72.5 80.9 Total Domestic Value-added 94.7 89.2 88.7 18.1 25.7 18.1 Direct domestic value-added 34.4 31.0 29.3 15.0 11.4 10.5 Manufacturing Goods Only
Total Foreign value-added 5.7 11.6 11.7 82.3 74.9 82.3 Direct foreign value-added 2.1 4.9 4.8 82.2 73.0 81.4 Total Domestic Value-added 94.3 88.4 88.3 17.7 25.1 17.7 Direct domestic value-added 30.9 28.5 28.3 15.0 9.5 10.4 Source: Authors’ estimates. Note: The estimates for 2006 are preliminary as they use the trade statistics in 2006 but the I/O table in 2002, which is the latest available. The next benchmark I/O table - the 2007 table - is scheduled to be released in 2010.
We perform a number of robustness checks on the sensitivity of our main results
to alternative ways of setting the initial values of the variables. First, we initialize pjv0
and djv0 by apportioning the observed direct value added in a sector to processing exports
and other final demands based on their respective portions in the sector’s total output.
Second, we initialize pjv0 either at the residuals implied by equation (28) if the residuals
are positive, or by following the previous alternative if the residuals are non-positive.
Third, when we partition imports into intermediate inputs used for own-sector’s
processing exports, and those for other purposes, we use the average of a three-year
period (previous, current, and following years) rather than just one year’s number.
Fourth, we experiment with 0% versus 10% annual depreciation rate for capital goods.
These variations produce relatively little change in the main results. For example, the
estimated share of domestic value added in manufacturing exports lies in a relatively
narrow range between 47.6% and 49.0% in 1997, and between 49.5% and 50.8% in 2006.

20
3.3 Domestic content by sector
To see if there are interesting patterns at the sector level, Table 5 reports, in
ascending order, the estimated share of domestic value added in manufacturing exports in
2002 together with each sector’s share in the country’s total manufacturing exports. We
choose to report the results from 2002 because they use the latest I/O table released.
Similar results for 1997 and 2006 are omitted to save space. Note, however, that the
pairwise correlation between the 1997 and 2002 estimates at the sector-level is very high
(Figure 2).
Figure 2 Correlation between 1997 and 2002 DVA Shares in China’s Manufacturing Exports
Among the 61 manufacturing industries in the table, 13 have a share of domestic
value-added less than 50 percent, and collectively account for nearly 44 percent of
China’s manufacturing exports in 2002. Many low-DVA industries are likely to be
labeled as relatively sophisticated, such as computers and accessories,
telecommunications equipment, measuring instruments and electronic devices. A
common feature of these industries is that processing exports account for over two-thirds
of their exports and foreign invested enterprises played an overwhelming role. This
0
10
20
30
40
50
60
70
80
90
100
10 20 30 40 50 60 70 80 902002 DVA share
1997
DV
A sh
are
TDV97 = 0.86TDV02 Adj. R2=0.94 Obs. = 54 t-statistics: (29.2)

21
suggests that the appearance of a sophisticated export structure in China is largely a
statistical mirage.
Table 5 Domestic Value-added Share in Manufacturing Exports by Sector, 2002 Non -processing Processing Weighted sum
Industries
Processing exports in percent of industry exports
FIE exports in percent of industry exports
Direct domestic value-added
Total Domestic Value-added
Direct domestic value-added
Total Domestic Value-added
Direct domestic value-added
Total Domestic Value-added
Share in China’s total exports to the World
Electronic computer 99.1 99.4 14.5 80.6 3.9 3.9 4.0 4.6 1.3
Telecommunication equipment 91.2 88.4 28.1 82.8 5.4 8.4 7.4 14.9 3.4
Cultural and office equipment 93.4 71.6 6.1 70.7 12.8 15.5 12.4 19.1 4.6
Other computer peripheral equipment 99.2 87.6 40.7 81.0 8.4 19.1 8.7 19.7 6.2
Electronic element and device 89.7 87.5 31.7 86.9 12.7 14.8 14.7 22.2 3.6
Radio, television and communication equipment and apparatus
90.6 62.3 35.5 77.9 8.2 31.2 10.8 35.5 5.6
Household electric appliances 79.1 56.9 27.5 88.0 7.1 23.7 11.4 37.2 2.1
Plastic products 64.5 51.2 26.2 82.8 10.3 12.5 16.0 37.4 2.6
Generators 76.8 55.8 26.1 87.1 11.1 25.2 14.6 39.6 1.0
Instruments, meters and other measuring equipment
68.6 51.8 40.8 89.2 14.2 20.7 22.5 42.2 2.0
Printing, reproduction of recording media
83.0 62.7 42.5 90.7 19.9 33.3 23.8 43.1 0.3
Other electric machinery and equipment
66.8 60.1 28.4 88.3 10.6 25.2 16.5 46.1 6.1
Leather, fur, down and related products
54.3 50.3 24.1 92.3 8.8 12.0 15.8 48.7 4.9
Man-made chemical products 58.3 65.4 21.9 79.0 10.1 30.2 15.0 50.5 0.3
Toys, sporting and athletic and recreation products
72.9 57.3 43.5 89.0 19.4 39.7 25.9 53.0 3.3
Arts and crafts products 53.8 36.9 29.8 90.5 13.5 22.8 21.0 54.1 1.3
Special chemical products 46.9 48.4 24.2 81.9 12.3 24.1 18.6 54.8 0.9
Petroleum and nuclear processing 32.1 24.9 15.4 78.2 5.6 8.2 12.2 55.7 0.9
Ship building 95.8 21.0 26.1 84.7 15.8 55.5 16.3 56.8 0.7
Metal products 43.2 45.6 24.8 88.8 10.3 16.7 18.5 57.7 4.8
Other general industrial machinery 43.7 43.7 28.4 89.7 13.4 18.0 21.9 58.4 3.7
Paper and paper products 50.7 57.0 29.8 88.9 12.7 29.7 21.2 58.9 0.6
Nonferrous metal smelting 45.0 17.4 22.4 87.6 10.8 26.1 17.2 59.9 0.9
Other transport equipment 41.2 50.5 26.0 84.4 12.9 26.1 20.6 60.4 1.3
Rubber products 53.1 44.4 29.9 90.2 12.4 35.4 20.6 61.1 1.7
Other manufacturing products 48.8 39.1 30.1 90.7 12.8 30.2 21.7 61.2 0.6
Other special industrial equipment 39.9 44.0 27.9 89.1 12.9 21.7 21.9 62.1 1.4
Steel-smelting 58.8 86.1 25.6 89.8 13.2 43.8 18.3 62.7 0.0
Nonferrous metal pressing 46.9 48.7 17.2 84.6 7.8 43.9 12.8 65.5 0.4

22
Wearing apparel 45.1 39.2 30.6 91.2 11.9 37.6 22.1 67.0 7.5
Motor vehicles 37.8 28.4 26.4 88.2 8.8 33.8 19.8 67.6 0.2
Parts and accessories for motor vehicles and their engines
34.3 54.9 27.2 88.5 10.9 28.7 21.6 68.0 0.7
Chemical products for daily use 36.3 43.6 32.7 86.5 9.6 36.3 24.4 68.3 0.4
Other electronic and communication equipment
84.9 84.9 11.8 54.1 28.9 71.2 26.3 68.6 2.0
Cotton textiles 28.7 28.8 24.4 90.5 10.9 14.7 20.5 68.8 3.5
Chemical fibers 20.5 29.2 21.6 81.2 9.4 24.6 19.1 69.6 0.0
paints, varnishes and similar coatings, printing ink and mastics
29.1 44.4 23.1 83.7 8.8 36.5 18.9 70.0 0.5
Stationary and related products 39.4 42.6 28.2 86.9 12.3 44.7 21.9 70.3 0.2
Woolen textiles 37.7 42.6 24.1 91.9 9.3 35.3 18.6 70.5 0.4
Glass and glass products 33.0 48.8 35.9 87.6 16.8 37.7 29.6 71.1 0.6
Knitted and crocheted fabrics and articles
31.6 34.1 32.1 90.8 14.0 34.5 26.4 73.0 6.3
Alloy iron smelting 40.8 13.1 28.0 87.0 14.1 58.7 22.3 75.5 0.3
Chemical pesticides 6.2 14.4 25.8 78.2 11.8 34.3 24.9 75.5 0.2
Textiles productions 24.0 31.8 27.3 90.3 14.1 30.0 24.1 75.8 1.6
Boiler, engines and turbine 26.6 28.4 30.4 86.3 13.6 46.9 26.0 75.8 0.4
Railroad transport equipment 19.9 5.9 28.5 86.7 14.9 33.1 25.8 76.0 0.1
Furniture 47.2 56.8 28.7 88.5 12.9 62.3 21.2 76.1 1.8
Products of wood, bamboo, cane, palm, straw
19.6 45.6 28.1 87.8 11.6 30.4 24.9 76.5 1.1
Iron-smelting 23.7 3.0 23.2 88.1 11.6 53.9 20.5 79.9 0.1
Basic chemicals 11.7 18.8 29.3 86.8 12.9 29.5 27.3 80.1 2.1
Medical and pharmaceutical products 16.9 28.7 39.0 91.1 11.5 33.8 34.3 81.4 0.8
Agriculture, forestry, animal husbandry and fishing machinery
17.8 20.8 28.9 88.0 14.4 52.9 26.3 81.8 0.1
Hemp textiles 19.5 19.5 23.7 90.8 12.5 49.1 21.5 82.7 0.3
Pottery, china and earthenware 11.4 33.1 32.8 89.5 15.1 35.8 30.7 83.4 0.7
Metalworking machinery 13.3 27.0 32.3 88.7 16.8 49.4 30.2 83.4 0.2
Steel pressing 16.0 16.8 26.6 90.0 12.5 48.7 24.3 83.4 0.4
Chemical fertilizers 4.5 21.7 23.5 86.6 9.9 27.7 22.9 84.0 0.1
Fireproof materials 19.1 49.8 41.5 92.2 15.9 52.9 36.6 84.7 0.1
Other non-metallic mineral products 14.0 35.7 34.1 91.7 17.2 53.4 31.7 86.4 0.4
Cement, lime and plaster 7.0 77.7 27.9 91.2 20.3 22.9 27.4 86.4 0.1
Coking 2.6 5.3 34.3 92.7 13.9 52.2 33.8 91.6 0.3
Total manufacturing Goods except food
55.7 52.0 31.0 89.2 11.4 25.7 20.1 53.9 100.0
Source: Authors’ estimates
The next 15 industries have their share of domestic value-added in the range of 51
to 65 percent; they collectively accounted for 22 percent of China’s total manufacturing

23
exports in 2002. Several labor-intensive sectors are in this group, such toys and sports
products, and arts and crafts products.
The remaining 33 industries have relatively high shares of domestic value-added.
However, they as a group produced only about one third of China’s manufacturing
exports in 2002. Apparel, the country’s largest labor intensive exporting industry, which
by itself was responsible for 7.5 percent of the country’s total manufacturing exports in
2002, is at the top of this group with a share of domestic content at 67 percent. The 20
industries at the bottom of Table 5 collectively produced only about 11 percent of
China’s manufacture exports in 2002.
3.4 Domestic content in exports by firm ownership
Since foreign-invested firms account for over half of China’s exports, it may be
interesting to compare the share of domestic content in exports between them and other
Chinese firms. Because we lack information on separate input-output coefficients by firm
ownership, our estimation assume that they are the same on this dimension. The variation
in the share of domestic content comes from different degrees of reliance on processing
exports with a sector, and differences in the sector composition of their exports.
Estimates of the domestic content shares by firm ownership are presented in Table
6. The results show that exports by wholly foreign owned enterprises exhibit the lowest
share of domestic valued-added (at 33% in 2002 but declined to 28% in 2006), followed
by Sino-foreign joint venture companies (about 45% in both 2002 and 2006). Exports
from Chinese private enterprises embodied the highest domestic content shares (84% and
82% in 2002 and 2006, respectively), while those from the state-owned firms were in the
middle (about 70% in both years). Note that these estimates represent the best guesses
based on currently available information; better estimates can be derived once
information on I/O coefficients by firm ownership becomes available.

24
Table 6: Shares of Domestic Value Added in Exports by Firm Ownership (%)
Share of Total Domestic Value-
added
Share of Direct Domestic Value-
added
Share of processing exports
in total exports
Share of exports by firm ownership in
China's total exports
2002 Wholly Foreign Owned 32.6 14.2 87.9 29.4 Joint Venture Firms 44.1 16.4 71.0 22.6 State Owned Firms 69.7 25.2 31.8 37.9 Collectively Owned Firms 72.3 24.5 28.1 5.8 Private Firms 83.7 28.3 8.7 4.3 All Firms 53.8 20.1 55.9 100.0 2006* Wholly Foreign Owned 27.8 13.3 85.3 39.3 Joint Venture Firms 44.8 17.5 63.1 18.6 State Owned Firms 70.0 24.6 27.1 19.8 Collectively Owned Firms 70.9 24.2 24.7 4.3 Private Firms 82.0 27.4 10.3 18.0 All Firms 50.9 19.3 53.6 100.0 Source: Authors’ estimates. Note: The estimates for 2006 are preliminary as they use 2006 trade statistics but the 2002 I/O table, which is the latest available. The next benchmark I/O table (the 2007 table) is scheduled to be released in 2010.
3.5 DVA shares in Chinese exports by trading partners
By assuming domestic and foreign value added shares in per unit gross exports
are the same for all destination countries in each IO industry and export regime, we can
further estimate the domestic value-added share in China’s exports to each of its major
trading partners. The decomposition results for China’s total merchandise exports to each
of its major trading partners are reported in Table 7 in increasing order of the estimated
domestic value-added share. Note, however, the variation by destination in this method
is caused solely by China’s export structure to each of its trading partners (exports to
each individual country/region vary by sector and trade regime structures), not the direct
input intensities of imported intermediates in producing such exports.
Hong Kong, the United States, Singapore, and Taiwan are at the top of the table,
with less than 50 percent of China’s domestic value-added embodied in its exports to
these four destinations. Since a large portion of Chinese exports to Hong Kong are re-
exports to the United States, the U.S. accounted for more than one third of China’s

25
exports market in 2002. The lower domestic value-added share in its exports to the U.S.
may partially explain why Chinese exports continued their rapid expansion in the U.S.
market despite RMB gradually appreciation since July 2005. China’s exports to the U.S.
have started to slow down since late 2007, likely because of other economic factors and
policy measures adopted by the Chinese government during last year.5
Table 7 Domestic Value-added Share in Chinese Gross Merchandise Exports to its Major Trading Partners, in percent, 2002
Non processing Processing Weighted-sum Region description
Share of processing exports in total exports to destination
Direct domestic value-added
Total Domestic Value-added
Direct domestic value-added
Total Domestic Value-added
Direct domestic value-added
Total Domestic Value-added
Share in total exports to the World
Hong Kong 74.0 30.5 89.1 11.5 24.4 16.4 41.2 17.5
United States 67.2 29.6 88.8 11.1 24.6 17.1 45.6 21.6
Singapore 62.7 28.3 86.8 11.0 22.2 17.5 46.3 2.1
Taiwan 59.6 33.6 89.0 11.3 23.4 20.3 49.9 2.0
Japan 59.2 33.2 90.6 11.8 29.0 20.5 54.1 15.0
Old EU15 54.8 29.8 89.0 11.5 25.7 19.7 54.3 14.9
Canada 48.0 30.1 89.5 11.1 26.8 21.0 59.4 1.3
Korea Rep 45.4 35.1 90.2 12.2 27.6 24.7 61.8 4.8
Australia & New Zealand 41.6 30.2 89.1 11.0 26.2 22.2 62.9 1.6
Mexico 42.1 30.5 89.2 12.8 29.9 23.1 64.2 0.9
Rest of Southeast Asia 36.6 32.7 88.1 11.1 24.0 24.8 64.7 5.1
Rest of West Europe 42.9 29.9 89.7 12.7 32.2 22.5 65.0 0.4
New EU10 39.5 29.9 90.0 12.3 31.6 22.9 66.9 1.3
Rest of World 52.7 29.1 88.8 15.0 49.1 21.6 67.9 0.0
Brazil 35.0 32.4 88.2 12.7 30.6 25.5 68.0 0.5
Rest of East Asia 35.5 36.5 90.3 11.9 31.1 27.8 69.3 0.5
India 24.0 33.4 88.9 10.5 22.9 27.9 73.1 0.8
Eastern Europe/Central Asia 20.4 30.0 88.8 11.3 26.3 26.2 76.1 0.6
Rest of Latin Amer/Caribbean 20.3 29.6 88.6 11.4 28.8 25.9 76.5 1.6
Middle East/North Africa 19.4 29.5 88.6 11.4 28.0 26.0 76.9 3.6
Sub-Saharan Africa 15.5 30.0 88.9 11.0 25.9 27.0 79.1 1.4
Rest of South Asia 13.8 29.0 87.7 11.5 26.0 26.6 79.2 0.8
Former Soviet Union 15.2 30.1 90.2 12.8 28.2 27.5 80.7 1.6
World 55.7 31.0 89.2 11.4 25.7 20.1 53.9 100.0
Source: Authors’ estimates.
5 China has taken a series of policy measures to change its preferences to processing trade and foreign invested enterprises since the end of 2006.

26
Another interesting feature in Table 7 is that China’s exports to developing
countries embody much higher domestic valued added than its exports to OECD
countries, but exports with higher domestic value-added (more than two thirds of the
gross value of its exports) constituted of less than 13 percent of its total exports of goods
in 2002. Nearly 75 percent of its exports that year had an average DVA of less than 55
percent and over 40 percent of its exports with less than half DVA on average. These
results further confirm that China has become a processing and assembling center in
many global supply chains in the recent period.
4. Concluding Remarks
The use of imported inputs in the production for exports reduces domestic content in a
nation’s exports. By being able to receive tariff exemptions on imported inputs,
processing exports are likely to have especially low domestic value added per unit of
exports.
In this paper, we first present a general framework in assessing the shares of
domestic and foreign value added in a country’s exports when tariff-favored processing
exports are pervasive. This formula nests the existing best known approach (HIY, 2001)
as a special case. Because some of the I/O coefficients called for by the new formula are
not readily available from conventional I/O tables, we propose an easy-to-replicate
mathematical programming procedure to estimate these coefficients by combining
information from detailed trade statistics (which records processing and normal
exports/imports separately) with conventional input-output tables. This methodology
should be applicable to Vietnam, Mexico, and may other countries that engage in a
significant amount of processing exports.
By applying our methodology to Chinese data, we have found several interesting
patterns. First, we estimate that the level of foreign content in Chinese exports is close to
50%, almost twice as high as what we calculate by using the HIY formula. Second, we
find interesting heterogeneity across sectors: those sectors that are likely to be labeled as
sophisticated or high-skilled, such as computers, electronic devices, and
telecommunication equipment, tend to have especially low shares of domestic content.

27
Conversely, many sectors that are relatively intensive in low-skilled labor, such as
apparel, are likely to exhibit a high share of domestic content in China’s exports. Finally,
we find that foreign invested firms (including both wholly-owned foreign firms and Sino-
foreign joint venture firms) tend to have a relatively low share of domestic content in
their exports.
There are several areas in which future research can improve upon the estimation
in this paper. First, we assign initial values of the direct domestic value added for
processing exports at the industry level based on the information in a conventional I/O
table. If a firm-level survey data becomes available that tracks the direct value added for
processing and normal exports separately, we can improve the accuracy of our estimates.
Second, as an inherent limitation of an I/O table, the input-output coefficients are
assumed to be fixed - that’s the nature of a Leontief technology - rather than be allowed
to respond to price changes. This could be problematic when a big change in export
volume, such as what China has been experiencing, induces a change in the world market
price for imported inputs, which in turn could trigger a change in the underlying
production technology and in the corresponding I/O coefficients. These could be fruitful
areas for future research.

28
Appendix Based on the I/O coefficients’ additive condition (equation 13), we can easily show that
the domestic and foreign value-added shares in both normal and processing exports sum
to unity. That is, both types of exports can be decomposed completely into domestic and
foreign contents.
From equations (18) and (21), for normal trade: 111 ))(()()( −−− −+=−+−=+ DD
vMDDDMDDDD
vDD AIAuAAIuAAIAVSSDVS (A1)
Substituting equation (13), the I/O coefficients additive condition DDD
vMD uAuAuA −=+ into (A1) we have:
uAIAIuAIuAuVSSDVS DDDDDDDDDD =−−=−−=+ −− 11 ))(())(( (A2)
similarly, for processing trade:
uAuAAAIAIu
AuAAAIAuA
uAAAIuAAAAIAVSSDVS
Pv
MPDPDDDD
Pv
MPDPDDDv
MD
MPDPDDMDPv
DPDDDv
PP
=++−−=
++−+=
+−++−=+
−
−
−−
1
1
11
))((
))((
)()(
(A3)
Reference Banister, Judith, (2005), “Manufacturing employment in China” BLS Monthly Labor Review (July) Brooke, Kendrick, Meeraus, and Raman, 2005, “GAMS -- User's Guide” GAMS Development Cooperation, Washington, DC. Chen, X., L. Cheng, K.C. Fung and L. J. Lau. 2004. “The Estimation of Domestic Value-Added and Employment Induced by Exports: An Application to Chinese Exports to the United States,” Stanford University. Chinn, Menzie D., 2005, “Supply Capacity, Vertical Specialization and Tariff Rates: The Implications for Aggregate U.S. Trade Flow Equations,” NBER working paper 11719. Dean, Judith M., K.C. Fung, and Zhi Wang, 2007, “Measuring the Vertical Specialization in Chinese Trade,” Office of Economics Working Paper No. 2007-01-A, U.S. International Trade Commission. Goh, Ai-Ting, and Jacques Olivier, 2004, “International Vertical Specialization, Imperfect Competition and Welfare,” HEC School of Management (France) working paper.

29
Koopman, Robert, Zhi Wang and Shang-jin Wei, 2008, “How much Chinese exports is really made in China – Assessing foreign and domestic value-added in gross exports,” Office of Economics Working Paper No. 2008-03-B, U.S. International Trade Commission. Krugman, Paul, 2008, “Trade and Wages, Reconsidered,” paper prepared for the Brookings Paper on Economic Activity, Princeton University manuscript, February. http://www.princeton.edu/~pkrugman/pk-bpea-draft.pdf. Lau, L.J., X. Chen, L. K. Cheng, K. C. Fung, Y. Sung, C. Yang, K. Zhu, J. Pei and Z. Tang. “Non-Competitive Input-Output Model and Its Application: An Examination of the China-U.S. Trade Surplus” Social Science in China, 2007(5): 91-103 (in Chinese). Lawrence, Robert, 2008, Blue Collar Blues: Is Trade to Blame for Rising US Income Inequality? Peterson Institute for International Economics. Linden, Greg, Kenneth L, Kraemer, and Jason Dedrick, 2007, “What Captures Value in a Global Innovation System?” The Paul Merage School of Business, UC Irvine, working paper. Hummels, D., J. Ishii and K. Yi. 2001. “The Nature and Growth of Vertical Specialization in World Trade,” Journal of international economics 54:75-96. National Research Council , 2006, Analyzing the U.S. Content of Imports and the Foreign Content of Exports. Committee on Analyzing the U.S. Content of Imports and the Foreign Content of Exports. Center for Economics, Governance, and International Studies, Division of Behavioral and Social Sciences and Education. Washington, DC: The National Academies Press. Rodrik, Dani, 2006, “What’s so special about China’s exports?” China & World Economy. 14(5): 1-19, September/October. Schott, Peter, 2008, “The relative sophistication of Chinese exports,” Economic Policy 53:5-49, January. Varian, Hal R., 2007, “An iPod Has Global Value. Ask the (Many) Countries That Make it,” The New York Times, June 28. Wang, Zhi, and Shang-Jin Wei, 2008, “What accounts for the rising sophistication of China’s exports?” NBER Working Paper 13771, February.
Xu, Bin, 2007, “Measuring China’s export sophistication,” China Europe International Business School working paper. Yi, Kei-Mu, 2003. “Can Vertical Specialization Explain the Growth of World Trade?” Journal of Political Economy, vol. 111, 1: 52-102.

30
Appendix Table A Final Use of Total Imports by China’s IO Industries, in percent, 2002
IO Industry description Share of Intermediates for processing exports
Share of Intermediates for normal use
Share of Capital goods for normal use
Share of Capital goods for Processing exports
Share of final Consumption
Agriculture 11.7 76.1 12.2 Forestry 66.0 34.0 0.0 Logging and transport of timber and bamboo 4.0 96.0 Animal Husbandry 22.6 74.2 3.1 0.0 Fishery 6.0 0.5 93.5 Technical services for agriculture, forestry, livestock and fishing 52.4 47.6 Mining and Washing of Coal 0.9 99.1 Extraction of Petroleum and Natural Gas 6.8 93.2 Ferrous metal ore mining 5.9 94.1 Non-ferrous metal ore mining 12.6 87.4 Salt mining 9.8 90.2 Non-metal minerals and other mining 57.0 43.0 Grain mill products 71.0 24.7 4.3 Forage 1.9 95.4 2.7 vegetable oil refining 4.0 91.4 4.6 Sugar manufacturing 32.1 66.7 1.2 Slaughtering and meat processing 9.2 25.4 65.4 Fish and fish productions 53.8 31.5 14.7 All other food manufacturing 15.5 27.1 57.4 Wines, spirits and liquors 1.8 2.2 96.1 Soft drink and other beverage 5.5 26.5 68.0 Tobacco products 0.5 0.1 99.4 Cotton textiles 84.6 15.4 0.0 Woolen textiles 83.5 16.4 0.1 Hemp textiles 98.0 1.9 0.0 Textiles productions 89.5 9.7 0.8 Knitted and crocheted fabrics and articles 95.5 1.3 3.3 Wearing apparel 87.2 0.0 12.8 Leather, fur, down and related products 89.8 8.3 1.8 Products of wood, bamboo, cane, palm, straw 59.1 40.9 Furniture 28.0 42.7 7.3 1.8 20.3 Paper and paper products 36.9 62.8 0.3 Printing, reproduction of recording media 59.4 12.5 28.1 Stationary and related products 31.1 60.9 8.0 Toys, sporting and athletic and recreation products 71.7 1.8 0.4 10.1 16.0 Petroleum and nuclear processing 2.4 97.2 0.5 0.0 Coking 3.7 96.3 Basic chemicals 15.8 84.2 Chemical fertilizers 0.1 99.9 Chemical pesticides 5.2 94.8 paints, varnishes and similar coatings, printing ink and mastics 50.4 49.6 0.0 Man-made chemical products 61.7 38.3 Special chemical products 53.0 45.4 0.0 0.0 1.5 Chemical products for daily use 33.9 53.1 12.9 Medical and pharmaceutical products 5.8 40.1 54.1 Chemical fibers 28.3 71.7 Rubber products 42.5 54.2 3.3 Plastic products 70.6 25.3 4.1 Cement, lime and plaster 14.0 86.0

31
IO Industry description Share of Intermediates for processing exports
Share of Intermediates for normal use
Share of Capital goods for normal use
Share of Capital goods for Processing exports
Share of final Consumption
Glass and glass products 59.0 39.9 1.0 Pottery, china and earthenware 39.8 55.4 4.8 Fireproof materials 33.6 66.4 Other non-metallic mineral products 42.9 56.3 0.8 Iron-smelting 5.4 94.6 Steel-smelting 36.2 63.8 Steel pressing 40.3 59.7 Alloy iron smelting 7.7 92.3 Nonferrous metal smelting 30.1 69.9 Nonferrous metal pressing 68.4 31.6 Metal products 38.8 37.8 6.8 16.0 0.5 Boiler, engines and turbine 8.8 64.2 21.7 5.2 0.1 Metalworking machinery 3.7 9.5 28.1 58.8 Other general industrial machinery 15.5 26.3 27.1 30.4 0.6 Agriculture, forestry, animal husbandry and fishing machinery 2.3 10.7 62.4 17.2 7.4 Other special industrial equipment 4.0 8.5 37.0 50.0 0.5 Railroad transport equipment 0.3 31.9 67.8 0.0 Motor vehicles 0.6 2.1 87.7 9.3 0.3 Parts and accessories for motor vehicles and their engines 2.1 97.9 Ship building 8.0 40.3 45.7 5.3 0.7 Other transport equipment 5.4 27.4 67.2 0.1 Generators 22.9 12.5 28.3 36.2 Household electric appliances 63.6 23.5 1.0 0.5 11.3 Other electric machinery and equipment 37.2 24.8 12.0 25.7 0.3 Telecommunication equipment 4.2 17.4 74.6 3.8 0.0 Electronic computer 91.8 8.2 Other computer peripheral equipment 54.4 12.4 20.4 12.9 Electronic element and device 80.6 17.7 0.2 1.5 Radio, television and communication equipment and apparatus 76.3 4.3 8.2 6.9 4.4 Other electronic and communication equipment 45.0 50.9 3.5 0.6 Instruments, meters and other measuring equipment 16.3 5.1 26.5 50.7 1.4 Cultural and office equipment 54.1 11.2 18.6 14.5 1.6 Arts and crafts products 93.3 1.4 5.3 Other manufacturing products 91.4 5.4 0.2 0.0 3.0 Scrap and waste 8.3 91.7 Total Merchandise 38.2 38.8 11.1 10.2 1.7
Source: Author’s aggregation. UN BEC classification and processing trade information from China custom trade statistics were combined to identify the purpose of final use.

32
Appendix Table B Final Use of Total Imports by China’s IO Industries, in percent, 1997
Description
Share of Intermediates for processing exports
Share of Intermediates for normal use
Share of Capital goods for normal use
Share of Capital goods for Processing exports
Share of final Consumption
Crop cultivation 43.7 51.7 4.7 Forestry 45.9 26.2 27.8 Livestock and livestock products 69.9 29.3 0.7 0.1 Fishery 16.7 0 83.3 Other agricultural products 77.8 10.6 11.5 Coal mining and processing 36 64 Crude petroleum products 22.2 77.8 Natural gas products 100 Ferrous ore mining 53.4 46.6 Non-ferrous ore mining 57.2 42.8 Salt mining 43.9 56.1 Non-metal minerals and other mining 84.7 15.3 Logging and transport of timber and bamboo 27.5 72.5 Grain mill products, vegetable oil and forage 23.6 76 0.4 Sugar refining 51.1 48.4 0.5 Slaughtering , meat processing, eggs and dairy products 71.6 22.8 5.6 Prepared fish and seafood 93.3 1.7 5 Other food products 43.3 21.8 34.9 Wines, spirits and liquors 5.8 3.9 90.3 Non-alcoholic beverage 69.3 2.5 28.1 Tobacco products 1.4 0.1 98.5 Cotton textiles 98.7 1.3 0 Woolen textiles 93.7 6.2 0 Hemp textiles 95.4 4.6 0 Silk textiles 96.2 3.8 0 Knitted mills 98 1.1 0.9 Other textiles 98.6 1.4 0 Wearing apparel 97.4 0 2.5 Leather, furs, down and related products 98.3 1 0.7 Sawmills and fibreboard 72.3 27.7 Furniture and products of wood, bamboo, cane, palm, straw, etc. 57.7 16.1 6 4 16.3 Paper and products 54.1 45.7 0.1 Printing and record medium reproduction 76.2 22.6 1.1 Cultural goods 16 83.3 0.6 Toys, sporting and athletic and recreation products 64.8 0.4 4.2 23.4 7.2 Petroleum refining 8.9 91.1 Coking 13.9 86.1 Raw chemical materials 53.1 46.9 Chemical fertilizers 0.3 99.7 Chemical pesticides 6.9 0.8 92.3 Organic chemical products 50.7 49.3 0 Chemical products for daily use 64.2 20.8 15 Other chemical products 78.6 21.3 0 0 0.2

33
Description
Share of Intermediates for processing exports
Share of Intermediates for normal use
Share of Capital goods for normal use
Share of Capital goods for Processing exports
Share of final Consumption
Medical and pharmaceutical products 16.9 28.6 54.4 Chemical fibers 79.8 20.2 0 Rubber products 73.7 25.8 0.5 Plastic products 88.6 9.2 2.2 Cement 12.4 87.6 Cement and asbestos products 68.1 31.9 Bricks, tiles, lime and light-weight building materials 52.7 47.3 0 Glass and glass products 78.6 20.4 1 Pottery, china and earthenware 66.8 29.9 3.3 Fireproof products 67 33 Other non-metallic mineral products 83.8 15.6 0.6 Iron-smelting 78.1 21.9 Steel-smelting 23.8 76.2 Steel processing 62.1 37.9 Alloy iron smelting 52.5 47.5 Nonferrous metal smelting 45 55 Nonferrous metal processing 83.3 16.7 Metal products 58.9 19.7 2.5 18.3 0.6 Boiler, engines and turbine 23.9 48.4 13.4 14.2 0.2 Metalworking machinery 10.2 9.3 17.9 62.6 Other general industrial machinery 22.8 14.1 18.6 44.2 0.2 Agriculture, forestry, animal husbandry and fishing machinery 9.9 4 37.1 46.4 2.7 Other special industrial equipment 12.9 5.6 16.7 64.7 0.1 Railroad transport equipment 11.1 28.2 59.8 0.8 Motor vehicles 4.1 64.5 25.6 5.8 0.1 Ship building 12 4.9 25.6 56.6 0.9 Aircraft 2.7 17.1 78 1.4 0.8 Bicycle 89.6 10 0.4 Other transport machinery 17.5 81.8 0.7 Generators 29.6 5.5 19.5 45.3 Household electric appliances 40.8 11.3 4.4 35 8.5 Other electric machinery and equipment 54.3 11.6 9.5 23.9 0.7 Electronic computer 69.2 3.9 13.4 13.5 Electronic appliances 93.5 2.6 1.8 2 0.1 Electronic element and device 74.9 17.4 0.8 6.8 Other electronic and communication equipment 18.5 25.4 47 3.5 5.5 Instruments, meters and other measuring equipment 37.3 5 24.5 33 0.2 Cultural and office equipment 89.5 3.2 4.6 2.4 0.3 Arts and crafts products 89.3 2.2 8.5 Other manufacturing products 96.6 2.1 0 0 1.3 Total Merchandise 51.2 28.2 7.3 12.1 1.2
Source: Author’s aggregation. UN BEC classification and processing trade information from China custom trade statistics were combined to identify the purpose of final use.

34
Appendix Table C Final Use of Total Imports by Major Source Countries, 2002
Region Description Share of Intermediates for processing exports
Share of Intermediates for normal use
Share of Capital goods for normal use
Share of Capital goods for Processing exports
Share of final Consumption
Share of processing exports
Share in total imports from the World
Australia & New Zealand 27.5 65.7 2.1 0.7 4.0 41.7 2.2
Brazil 10.1 84.2 2.4 1.0 2.4 34.5 1.1
Canada 16.7 63.8 14.5 2.5 2.5 47.9 1.3
Rest of East Asia 26.5 43.1 0.2 0.2 30.0 36.6 0.2
Eastern Europe/Central Asia 8.4 86.8 2.0 1.0 1.8 20.4 0.3
New EU10 35.7 42.3 12.7 6.4 2.9 40.4 0.3
Old EU15 18.2 39.5 27.0 12.6 2.7 54.7 13.7
Former Soviet Union 8.9 84.1 5.8 0.1 1.0 15.0 3.9
Hong Kong 74.9 9.3 2.7 10.8 2.2 74.6 3.7
India 26.4 69.4 1.6 0.6 2.0 23.4 0.8
Japan 46.9 27.3 10.2 15.1 0.7 58.5 19.0
Korea Rep 47.4 31.9 10.6 9.8 0.4 45.2 10.5
Rest of Latin America & Caribbean
11.4 86.2 0.4 0.1 1.9 20.4 1.5
Middle East/North Africa 13.4 84.5 1.0 0.9 0.2 19.4 3.8
Mexico 56.9 29.5 8.4 3.4 1.9 41.7 0.4
Rest of West Europe 15.9 38.1 20.8 17.9 7.2 42.5 1.0
Rest of South Asia 84.8 13.4 0.0 0.3 1.5 14.0 0.2
Rest of Southeast Asia 49.2 40.6 2.6 4.9 2.7 37.9 8.6
Singapore 43.7 37.0 8.5 9.8 1.1 63.5 2.4
Sub-Saharan Africa 16.1 83.4 0.2 0.0 0.2 15.7 1.4
Taiwan province 60.0 17.7 4.3 17.7 0.3 60.9 14.1
United States 25.5 35.3 26.2 9.2 3.8 67.4 9.5
Rest of World 26.9 54.7 0.6 0.3 17.5 52.3 0.0
World Total 38.5 38.3 11.2 10.4 1.7 55.9 100.0
Source: Author’s aggregation. UN BEC classification and processing trade information from China custom trade statistics were combined to identify the purpose of final use.

35
Appendix Table D Domestic and foreign value-added embodied in Chinese gross merchandise exports, in percent, 2002
Split Method HIY Method IO industry description Direct
foreign value-added
Direct domestic value-added
Total Foreign value-added
Total Domestic Value-added
Direct foreign value-added
Direct domestic value-added
Total Foreign value-added
Total Domestic Value-added
Agriculture 2.3 64.8 5.5 94.5 1.9 65.4 6.2 93.8 Forestry 3.1 64.5 5.8 94.2 1.8 65.5 5.4 94.6 Logging and transport of timber and bamboo 3.8 60.7 6.6 93.4 2.8 60.7 7.0 93.0 Animal Husbandry 2.0 45.3 5.2 94.8 1.2 45.7 5.6 94.4 Fishery 1.8 54.8 5.6 94.4 1.6 55.0 6.7 93.3 Technical services for agriculture, forestry, livestock and fishing 18.2 47.8 21.0 79.0 2.3 54.8 7.3 92.7 Mining and Washing of Coal 2.0 56.9 5.7 94.3 3.3 56.9 8.6 91.4 Extraction of Petroleum and Natural Gas 3.7 69.5 6.2 93.8 2.9 71.1 6.6 93.4 Ferrous metal ore mining 6.2 46.3 10.6 89.4 5.6 46.3 11.9 88.1 Non-ferrous metal ore mining 8.4 38.5 14.6 85.4 5.0 39.9 13.8 86.2 Salt mining 3.0 63.6 6.2 93.8 2.6 63.9 7.5 92.5 Non-metal minerals and other mining 20.8 37.9 25.1 74.9 4.7 44.6 12.3 87.7 Grain mill products 43.5 13.4 46.2 53.8 3.0 20.1 8.7 91.3 Forage 19.7 16.4 23.7 76.3 5.9 18.1 12.4 87.6 vegetable oil refining 16.9 17.8 21.4 78.6 4.6 21.7 10.7 89.3 Sugar manufacturing 34.0 13.6 38.7 61.3 3.2 31.2 8.7 91.3 Slaughtering and meat processing 7.0 14.7 11.0 89.0 2.2 16.1 7.9 92.1 Fish and fish productions 13.6 20.4 17.3 82.7 2.4 24.9 8.3 91.7 All other food manufacturing 20.8 23.2 25.3 74.8 5.1 26.8 12.7 87.4 Wines, spirits and liquors 16.6 35.7 20.2 79.8 2.8 40.7 8.6 91.4 Soft drink and other beverage 13.4 28.5 18.9 81.1 4.5 31.7 13.1 86.9 Tobacco products 2.8 72.8 4.3 95.7 0.7 76.3 2.6 97.4 Cotton textiles 26.3 20.5 31.3 68.8 8.5 23.7 18.6 81.4 Woolen textiles 24.9 18.6 29.5 70.5 6.3 23.5 14.9 85.1 Hemp textiles 11.4 21.5 17.3 82.7 5.1 23.6 14.1 85.9 Textiles productions 18.8 24.1 24.2 75.8 10.7 26.0 21.3 78.7 Knitted and crocheted fabrics and articles 21.7 26.4 27.0 73.0 10.3 27.9 21.0 79.0 Wearing apparel 28.4 22.1 33.0 67.0 10.5 27.1 20.9 79.2 Leather, fur, down and related products 48.7 15.8 51.3 48.7 13.5 20.5 23.5 76.5 Products of wood, bamboo, cane, palm, straw 17.6 24.9 23.5 76.5 8.2 27.8 17.3 82.7 Furniture 17.5 21.2 23.9 76.1 7.8 26.4 18.1 81.9 Paper and paper products 37.2 21.2 41.1 58.9 7.2 29.5 15.5 84.5 Printing, reproduction of recording media 54.6 23.8 56.9 43.1 5.6 42.0 13.9 86.1 Stationary and related products 23.5 21.9 29.7 70.3 8.4 26.9 19.6 80.4 Toys, sporting and athletic and recreation products 43.4 25.9 47.0 53.0 10.9 31.8 21.4 78.6 Petroleum and nuclear processing 41.2 12.2 44.3 55.7 18.7 15.3 24.9 75.1 Coking 4.1 33.8 8.4 91.6 2.9 34.3 9.4 90.6 Basic chemicals 14.6 27.3 19.9 80.1 9.2 28.9 17.2 82.8 Chemical fertilizers 8.8 22.9 16.0 84.0 7.8 23.5 18.6 81.5 Chemical pesticides 16.9 24.9 24.5 75.5 12.7 25.7 23.3 76.7 paints, varnishes and similar coatings, printing ink and mastics 22.7 18.9 30.0 70.0 10.5 22.8 22.1 77.9 Man-made chemical products 43.6 15.0 49.5 50.5 13.5 21.6 25.9 74.1 Special chemical products 40.4 18.6 45.2 54.8 13.3 23.6 23.9 76.1 Chemical products for daily use 25.9 24.4 31.7 68.3 8.0 31.9 18.3 81.7 Medical and pharmaceutical products 13.9 34.3 18.6 81.4 5.3 38.7 12.5 87.5 Chemical fibers 22.0 19.1 30.4 69.6 13.8 21.6 26.4 73.6 Rubber products 35.2 20.6 38.9 61.1 7.3 27.7 15.6 84.4 Plastic products 58.9 16.0 62.6 37.4 14.6 25.1 27.9 72.1 Cement, lime and plaster 7.9 27.4 13.6 86.4 4.8 27.9 13.6 86.4

36
Split Method HIY Method IO industry description Direct
foreign value-added
Direct domestic value-added
Total Foreign value-added
Total Domestic Value-added
Direct foreign value-added
Direct domestic value-added
Total Foreign value-added
Total Domestic Value-added
Glass and glass products 23.9 29.6 28.9 71.1 8.4 35.2 16.8 83.2 Pottery, china and earthenware 10.7 30.7 16.6 83.4 5.9 32.2 14.9 85.2 Fireproof materials 10.5 36.6 15.3 84.7 3.8 41.4 10.9 89.1 Other non-metallic mineral products 8.3 31.7 13.7 86.4 4.0 33.9 12.0 88.0 Iron-smelting 14.8 20.5 20.1 79.9 7.0 23.2 14.2 85.8 Steel-smelting 32.7 18.3 37.3 62.7 5.2 25.6 13.0 87.0 Steel pressing 10.3 24.3 16.6 83.4 5.0 26.5 13.8 86.2 Alloy iron smelting 18.9 22.3 24.6 75.5 7.1 27.3 15.4 84.6 Nonferrous metal smelting 35.8 17.2 40.1 59.9 7.4 22.0 15.9 84.1 Nonferrous metal pressing 27.7 12.8 34.5 65.5 9.2 16.9 20.4 79.7 Metal products 37.9 18.5 42.4 57.7 7.0 23.7 17.1 82.9 Boiler, engines and turbine 18.3 26.0 24.2 75.8 9.6 30.1 19.2 80.8 Metalworking machinery 10.5 30.2 16.6 83.4 8.1 32.2 17.7 82.3 Other general industrial machinery 37.4 21.9 41.6 58.4 7.5 27.5 18.0 82.0 Agriculture, forestry, animal husbandry and fishing machinery 11.6 26.3 18.3 81.8 6.7 28.8 16.9 83.1 Other special industrial equipment 33.3 21.9 37.9 62.1 9.3 27.4 19.2 80.8 Railroad transport equipment 18.1 25.8 24.0 76.0 7.4 28.4 17.5 82.5 Motor vehicles 26.6 19.8 32.4 67.6 6.1 26.4 17.2 82.8 Parts and accessories for motor vehicles and their engines 26.4 21.6 32.0 68.0 6.6 26.9 17.4 82.6 Ship building 38.4 16.3 43.3 56.8 12.7 23.8 23.1 77.0 Other transport equipment 34.4 20.6 39.6 60.4 10.9 25.0 22.3 77.7 Generators 57.5 14.6 60.4 39.6 10.5 23.5 21.4 78.6 Household electric appliances 59.4 11.4 62.8 37.2 10.5 23.9 23.0 77.0 Other electric machinery and equipment 49.5 16.5 53.9 46.1 9.9 24.4 21.8 78.2 Telecommunication equipment 84.0 7.4 85.1 14.9 24.2 23.5 37.9 62.1 Electronic computer 95.3 4.0 95.4 4.6 35.2 13.2 51.5 48.5 Other computer peripheral equipment 78.9 8.7 80.4 19.7 35.0 20.8 46.2 53.8 Electronic element and device 76.8 14.7 77.8 22.2 23.4 26.1 33.3 66.7 Radio, television and communication equipment and apparatus 61.1 10.8 64.5 35.5 34.6 19.4 45.6 54.4 Other electronic and communication equipment 25.5 26.3 31.4 68.6 31.7 26.0 40.2 59.8 Instruments, meters and other measuring equipment 55.6 22.5 57.8 42.2 14.6 32.1 24.3 75.7 Cultural and office equipment 80.0 12.4 80.9 19.1 40.0 10.6 56.8 43.2 Arts and crafts products 42.4 21.0 46.0 54.1 7.0 27.8 16.5 83.5 Other manufacturing products 34.7 21.7 38.8 61.2 6.9 28.6 16.3 83.8 Total Merchandise 42.4 20.1 46.1 53.9 15.0 26.0 25.4 74.6
Source: Authors’ estimates.

37
Appendix Table E Domestic and foreign value-added embodied in Chinese gross merchandise exports, in percent, 1997
Split Method HIY Method
IO industry description Direct foreign value-added
Direct domestic value-added
Total Foreign value-added
Total Domestic Value-added
Direct foreign value-added
Direct domestic value-added
Total Foreign value-added
Total Domestic Value-added
Crop cultivation 3.5 64.5 5.3 94.7 2.5 65.0 6.0 94.0Forestry 2.4 72.7 3.6 96.4 1.4 73.3 3.7 96.3Livestock and livestock products 4.0 49.2 6.1 93.9 2.7 49.6 6.3 93.7Fishery 6.5 58.9 8.5 91.6 2.2 60.6 6.0 94.0Other agricultural products 7.8 54.9 9.4 90.6 1.8 57.2 5.3 94.7Coal mining and processing 1.4 51.4 4.0 96.0 3.7 51.4 9.2 90.8Crude petroleum products 1.0 75.2 2.5 97.5 2.5 75.2 5.4 94.6Natural gas products 2.6 54.2 5.5 94.6 4.5 54.2 10.2 89.8Ferrous ore mining 3.3 33.7 7.1 92.9 8.4 33.7 16.0 84.0Non-ferrous ore mining 7.7 34.9 10.7 89.3 4.4 36.1 11.5 88.5Salt mining 1.3 59.7 3.5 96.5 2.1 60.0 7.3 92.7Non-metal minerals and other mining 18.8 36.3 21.4 78.6 4.9 40.1 11.9 88.1Logging and transport of timber and bamboo 5.4 60.1 7.0 93.0 2.4 62.1 5.9 94.1Grain mill products, vegetable oil and forage 49.0 12.7 50.6 49.4 3.7 18.7 9.1 90.9Sugar refining 78.6 12.2 79.0 21.0 3.3 18.7 9.1 90.9Slaughtering , meat processing, eggs and dairy products 10.6 14.4 13.6 86.4 1.8 15.3 7.6 92.4Prepared fish and seafood 17.1 22.3 19.4 80.6 1.1 25.1 6.0 94.0Other food products 24.1 26.9 26.4 73.6 3.8 31.3 9.7 90.3Wines, spirits and liquors 17.5 29.0 20.0 80.0 3.1 32.9 9.0 91.0Non-alcoholic beverage 15.5 27.0 18.4 81.6 3.7 29.7 10.5 89.5Tobacco products 7.9 52.1 9.6 90.4 2.0 55.8 5.8 94.2Cotton textiles 34.4 24.0 36.5 63.5 8.5 28.3 18.2 81.8Woolen textiles 56.6 20.0 57.6 42.5 5.8 33.5 12.3 87.7Hemp textiles 26.1 25.3 28.3 71.7 6.3 27.9 12.5 87.6Silk textiles 5.6 24.1 8.6 91.4 2.6 24.9 10.8 89.2Knitted mills 23.9 26.5 26.2 73.8 9.0 28.1 18.5 81.5Other textiles 51.5 17.6 52.9 47.1 5.7 25.9 11.6 88.4Wearing apparel 39.0 30.3 40.4 59.6 6.8 36.1 15.3 84.7Leather, furs, down and related products 61.9 17.5 62.8 37.3 11.6 22.6 20.6 79.4Sawmills and fibreboard 20.7 27.4 23.2 76.8 6.4 30.5 13.3 86.7Furniture and products of wood, bamboo, cane, palm, straw, etc. 37.6 21.6 39.7 60.3 7.3 26.3 16.4 83.6Paper and products 51.5 22.3 52.8 47.2 5.3 29.4 12.4 87.7Printing and record medium reproduction 66.1 21.1 66.8 33.2 6.3 37.4 13.6 86.4Cultural goods 50.7 27.4 51.9 48.1 6.4 41.1 13.7 86.3Toys, sporting and athletic and recreation products 60.4 24.7 61.2 38.8 10.2 27.9 20.0 80.0Petroleum refining 50.4 14.4 51.8 48.2 15.2 22.0 20.3 79.7Coking 4.4 22.7 7.6 92.4 2.5 23.0 9.7 90.3Raw chemical materials 5.8 31.9 9.0 91.0 3.1 32.9 10.1 89.9Chemical fertilizers 5.6 22.1 9.7 90.3 5.2 22.4 14.7 85.3Chemical pesticides 20.6 20.5 24.4 75.6 4.9 23.0 14.6 85.4Organic chemical products 19.9 20.5 24.4 75.6 8.6 22.2 18.3 81.8Chemical products for daily use 36.0 27.7 38.3 61.7 4.5 37.8 12.3 87.7Other chemical products 35.0 21.3 37.5 62.5 8.1 25.7 15.8 84.2Medical and pharmaceutical products 15.8 32.9 18.4 81.6 3.0 36.9 9.5 90.5Chemical fibers 63.3 15.0 64.9 35.1 14.8 23.3 25.2 74.8Rubber products 60.7 17.4 61.7 38.3 8.6 25.0 17.1 82.9Plastic products 65.6 16.0 67.0 33.1 12.9 24.3 23.6 76.4Cement 5.1 23.6 8.9 91.1 3.9 24.0 12.7 87.3Cement and asbestos products 47.4 19.0 49.2 50.8 2.4 26.8 11.1 88.9

38
Split Method HIY Method
IO industry description Direct foreign value-added
Direct domestic value-added
Total Foreign value-added
Total Domestic Value-added
Direct foreign value-added
Direct domestic value-added
Total Foreign value-added
Total Domestic Value-added
Bricks, tiles, lime and light-weight building materials 9.3 37.4 12.2 87.8 3.6 39.6 10.3 89.7Glass and glass products 35.6 25.2 37.8 62.2 4.5 30.7 12.4 87.6 Pottery, china and earthenware 13.0 35.5 16.0 84.0 3.3 37.8 10.6 89.4Fireproof products 7.6 27.4 11.0 89.0 3.6 28.5 11.6 88.4Other non-metallic mineral products 17.0 27.9 19.8 80.3 3.0 30.9 10.6 89.4Iron-smelting 36.4 17.3 38.4 61.6 5.7 22.3 12.9 87.1Steel-smelting 66.9 16.8 67.7 32.3 3.9 23.7 11.6 88.4Steel processing 73.4 13.6 74.2 25.8 5.9 21.0 15.1 84.9Alloy iron smelting 41.5 18.1 43.6 56.4 5.5 21.4 14.2 85.8Nonferrous metal smelting 35.0 16.4 37.2 62.8 4.6 19.5 12.5 87.6Nonferrous metal processing 40.4 12.2 42.9 57.1 7.2 15.4 16.7 83.3Metal products 38.2 19.5 40.8 59.2 5.9 23.3 15.4 84.6Boiler, engines and turbine 28.8 28.9 31.4 68.6 7.4 34.6 15.5 84.5Metalworking machinery 20.1 28.7 23.1 76.9 5.8 31.9 14.5 85.5Other general industrial machinery 37.2 29.0 39.2 60.8 5.3 37.7 13.3 86.8Agriculture, forestry, animal husbandry and fishing machinery 9.4 21.0 13.8 86.2 6.5 21.8 17.2 82.8Other special industrial equipment 36.1 25.9 38.4 61.6 7.6 32.5 16.3 83.7Railroad transport equipment 39.8 22.5 42.1 57.9 5.5 26.3 15.2 84.8Motor vehicles 35.7 20.0 38.6 61.4 5.2 25.7 15.3 84.7Ship building 70.9 22.6 71.4 28.7 8.1 28.7 17.6 82.4Aircraft 29.2 38.8 31.3 68.7 23.5 42.4 28.0 72.0Bicycle 72.1 12.8 73.1 26.9 6.5 18.8 18.0 82.0Other transport machinery 38.2 20.4 40.9 59.1 6.2 27.4 16.3 83.7Generators 74.1 15.9 74.7 25.3 7.9 26.2 17.8 82.2 Household electric appliances 72.6 14.2 73.5 26.6 8.7 26.3 19.7 80.3Other electric machinery and equipment 68.3 13.9 69.5 30.5 9.0 19.7 20.0 80.0Electronic computer 86.3 12.2 86.4 13.6 24.5 23.4 36.7 63.3Electronic appliances 84.7 10.9 85.0 15.0 21.5 19.8 33.5 66.5 Electronic element and device 73.9 17.1 74.4 25.6 14.6 29.7 23.6 76.4Other electronic and communication equipment 80.0 15.4 80.4 19.6 18.3 27.3 30.0 70.0Instruments, meters and other measuring equipment 62.3 25.8 63.0 37.0 10.6 36.3 19.1 80.9Cultural and office equipment 82.6 16.3 82.7 17.3 15.6 19.8 26.9 73.1Arts and crafts products 48.2 22.1 49.7 50.3 6.1 29.8 14.2 85.9Other manufacturing products 58.9 22.9 59.9 40.1 5.5 34.3 13.7 86.3Total Merchandise 46.1 23.7 47.7 52.3 9.0 29.4 17.9 82.1
Source: Authors’ estimates.