Embed Size (px)
Citation preview

Working Paper Series Congressional Budget Office
Washington, D.C.
How Nominal Foreign Currency Depreciation Against the U.S. Dollar Affects U.S. Wealth
Dorian Carloni Congressional Budget Office
Working Paper 2018-05
June 2018
To enhance the transparency of the work of the Congressional Budget Office and to encourage external review of that work, CBO’s working paper series includes papers that provide technical descriptions of official CBO analyses as well as papers that represent original, independent research by CBO analysts. Papers in that series are available at http://go.usa.gov/ULE. This paper has not been subject to CBO’s regular review and editing process. The views expressed here should not be interpreted as CBO’s.
I thank Alan Auerbach, Wendy Edelberg, Daniel Fried, Janet Holtzblatt, John McClelland, Elena Patel, and Jay Shambaugh for their helpful comments.
www.cbo.gov/publication/53931

Abstract
Foreign currency depreciation against the U.S. dollar would affect the wealth holdings of U.S. residents in several ways. Specifically, I analyze the effects of a one-time large depreciation of 20 percent. If foreign currencies depreciated by 20 percent against the U.S. dollar, the value of U.S. holdings of foreign assets would decrease by an estimated $2,451 billion and the value of U.S. liabilities to foreigners by $168 billion (values are based on 2015 holdings and values). On net, the total worth of U.S. households would decrease by $2.3 trillion—a drop of 2.2 percent. Second, the wealth effect would be larger for equity held in foreign direct investment (FDI) and foreign portfolio assets than for debt assets: FDI assets would decrease in value by $907 billion; portfolio equity assets, by $1,222 billion; and foreign debt assets, by $246 billion. Third, the gross wealth effect of the exchange rate adjustment would be largely concentrated in the top income decile of U.S. households. If foreign currencies were to depreciate by 20 percent in relation to the U.S. dollar, the dollar value of U.S. holdings of foreign assets would decrease by $1,503 billion for households in the top income decile, compared with $336 billion for households in the ninth income decile and $10 billion for households in the bottom income decile. As a result, the value of total assets held would decrease by 2.2 percent for the top income decile, by 2.3 percent for the ninth decile, and by 1.1 percent for the bottom income decile. Some simplifying assumptions underlie those results, thereby limiting their application. However, the results are nonetheless useful for thinking about the distributional effects of policies affecting the nominal exchange rate. This paper gives an example of such a policy: a border adjustment tax. Keywords: foreign exchange, depreciation, currencies, wealth JEL Classification: D31, E21, F3, F31

Contents
Introduction ................................................................................................................................ 1
Analytic Method ......................................................................................................................... 3
Depreciation of Foreign Currencies and U.S. Wealth............................................................... 3
Sources of Data on Wealth ...................................................................................................... 4
Total Measure of Wealth Effects ............................................................................................. 5
Measure of Wealth Effect in Distributional Analysis ............................................................... 7
Measures of Types of Assets and Liabilities ............................................................................ 8
Unit of Observation and Measure of Income ......................................................................... 11
Wealth Effect on U.S. Holdings of Foreign Assets .................................................................... 12
How Portfolio Assets Affect U.S. Holdings ........................................................................... 12
How Nonportfolio Assets Affect U.S. Holdings .................................................................... 14
How Foreign Direct Investment Affects U.S. Holdings ......................................................... 15
Wealth Effect on Foreign Holdings of U.S. Assets .................................................................... 16
Total Wealth Effect on U.S. Liabilities to Foreigners ............................................................ 17
Comparison With Previous Estimates .................................................................................... 17
Example of Policy Affecting Nominal Exchange Rates: A Border Adjustment Tax ................... 18
How a 20 Percent BAT Affects Nominal Exchange Rates ..................................................... 18
How a 20 Percent BAT Affects U.S. Wealth ......................................................................... 19
Discussion ................................................................................................................................ 21
Table......................................................................................................................................... 24
Figures ...................................................................................................................................... 25
Appendix .................................................................................................................................. 32
Income Measure .................................................................................................................... 32
Imputation of Assets Held Through Defined Benefit Retirement Plans .................................. 33
Equity and Debt Composition of Portfolio Holdings.............................................................. 33
References Cited ....................................................................................................................... 35

1
Introduction The U.S. dollar has been the most exchanged currency in recent years: In 2016, 23.1 percent of total currency transactions on foreign exchange markets were between the U.S. dollar and the euro, 17.8 percent between the U.S. dollar and the Japanese yen, and 9.3 percent between the U.S. dollar and the British pound (Bank for International Settlements 2016). High trading volumes have sometimes been associated with noticeable adjustments in nominal exchange rates between the U.S. dollar and foreign currencies and have changed the relative value of those currencies. For example, the euro depreciated by 24 percent against the U.S. dollar between March 2014 and March 2015 and appreciated by 12 percent between March 2017 and November 2017.
Changes in the nominal exchange rate between the U.S. dollar and foreign currencies can affect U.S. economic activity—for example, by changing the cost of imported intermediate goods, the demand for domestic investment, and the demand for exported goods and services. This paper focuses on how changes in the nominal exchange rate also affect the wealth held by U.S. residents (both businesses and households). For example, a depreciation of foreign currencies in relation to the U.S. dollar decreases the dollar value of U.S. holdings of assets denominated in foreign currencies, thereby reducing the net wealth of U.S. residents. Such depreciation also decreases the dollar value of foreign holdings of U.S. assets (which are liabilities to U.S. residents) denominated in foreign currencies, increasing the net wealth of U.S. residents. How large each of those offsetting effects is remains an empirical question.
Several factors underlie fluctuations in the nominal exchange rates, including current account balances and differences among countries in inflation and interest rates as well as in political and economic stability. By affecting some of those outcomes, monetary and fiscal policies implemented in the United States can therefore affect the value of the nominal exchange rate between the U.S. dollar and foreign currencies. This paper examines how a 20 percent depreciation of foreign currencies with respect to the U.S. dollar affects the wealth of U.S. residents. Specifically, I address three questions regarding the depreciation of foreign currencies:
■ How does it affect the value of U.S. residents’ assets and liabilities denominated in foreign currencies?
■ How does it affect the value of U.S. residents’ assets denominated in foreign currencies, by type of asset?
■ How does it affect households across different income deciles?
A depreciation of foreign currencies by 20 percent against the U.S. dollar would reduce the value of U.S. holdings of foreign assets by an estimated $2,451 billion and the value of U.S. debt liabilities to foreigners (that is, foreign holdings of U.S. assets) by $168 billion. The dollar values

2
of assets and wealth effects in this paper are based on 2015 data and have not been adjusted for the effects of inflation or other changes in prices or asset holdings since then. On net, the dollar value of U.S. wealth would decrease by $2,283 billion, or 2.2 percent of U.S. households’ total net worth.
In addition, I estimate that the wealth effect would be larger for equity held in foreign direct investment (FDI) and foreign portfolio assets than for debt assets. The value of FDI assets would decrease by $907 billion, and foreign portfolio equity assets would decrease by $1,222 billion. In contrast, the value of foreign debt assets would drop by $246 billion.
Finally, my analysis indicates that the wealth effect of large foreign currencies’ depreciation would be largely concentrated in the top income decile of U.S. households. If foreign currencies were to depreciate by 20 percent with respect to the U.S. dollar, the dollar value of U.S. holdings of foreign assets (without considering the change in U.S. debt liabilities to foreigners) would have decreased by $1,503 billion for households in the top income decile, compared with $336 billion for households in the ninth income decile and $10 billion for households in the bottom income decile. As a result, the value of total assets held would decrease by 2.2 percent for the top income decile, by 2.3 percent for the ninth decile, and by 1.1 percent for the bottom income decile.
The estimates of the wealth effects are relevant for evaluating distributional effects of monetary and fiscal policies that affect nominal exchange rates. Here I consider the implications of my findings for a 20 percent border adjustment tax (BAT). A BAT is a feature of consumption taxes around the world and ensures that goods and services are taxed where they are consumed rather than where they are produced. All else being equal, a BAT imposes a tax on imported commodities but exempts exported commodities from that tax, thus raising the price of imports and lowering the price of exports. Higher import prices lower the demand for foreign commodities and therefore the demand for foreign currencies, causing foreign currencies to depreciate in comparison with the domestic currency. Lower export prices increase the demand for domestic commodities and therefore the demand for the domestic currency, also causing foreign currencies to depreciate against the domestic currency.
However, both the results of the paper and their application to policy changes hinge on some simplifying assumptions and do not take into account several factors. First, I assume that the depreciation of foreign currencies is uniform across foreign currencies. Second, my analysis does not take into account behavioral responses, which would affect both the magnitude of the overall wealth effect and differences across income groups. Finally, my analysis incorporates two assumptions: that the distribution of foreign assets held by U.S. households can be approximated by the distribution of their total nonresidential assets and that the currency composition of their foreign assets is uniform across households in different income groups.

3
Analytic Method In this paper, I estimate how a one-time 20 percent depreciation of foreign currencies with respect to the U.S. dollar would affect the value of foreign wealth held by U.S. residents, net of the effect on U.S. liabilities to foreigners. I also estimate how that effect varies by asset type and by household income group. My analysis incorporates the assumption that all currencies depreciate uniformly in relation to the U.S. dollar and does not take into account the additional wealth effects produced by policies affecting the nominal exchange rate between the U.S. dollar and foreign currencies.
Depreciation of Foreign Currencies and U.S. Wealth The main analysis consists of evaluating how a 20 percent depreciation of foreign currencies with respect to the U.S. dollar (or equivalently, a 25 percent appreciation of the dollar with respect to foreign currencies) would affect U.S. wealth, under the assumption that all currencies depreciate uniformly against the U.S. dollar. Making that assumption simplifies the empirical analysis, but identifying a policy that would achieve that outcome is difficult. Other factors—such as responses by foreign central banks, differences in the impacts across countries of U.S. policies on bilateral financial flows, and macroeconomic feedback effects—would probably cause foreign currencies to depreciate at different rates in comparison with the U.S. dollar. For example, foreign countries using a fixed exchange rate to mediate between their domestic currency and the U.S. dollar would try to neutralize the initial depreciation of the domestic currency by purchasing more domestic currency and selling U.S. dollars.
In addition, my analysis abstracts from any additional wealth effects produced by policies that cause foreign currencies to depreciate against the U.S. dollar. For example, a policy producing an increase in the demand for the U.S. dollar over foreign currencies could cause U.S. assets to have a lower rate of return than foreign assets, thereby affecting U.S. wealth. If investors were pushing for equal returns in any currency (an interest parity framework), depreciating currencies would probably have higher returns in equilibrium, which would increase the market value of securities. In addition, a depreciation of foreign currencies with respect to the U.S. dollar would probably help consumers of U.S. imports and hurt producers of U.S. exports, which would decrease the value of shares issued by exporting companies and decrease the wealth of U.S. households holding those shares.
The effect of foreign currencies’ depreciation on U.S. wealth is measured in U.S. dollars. The analysis ignores the real effect of changes in import prices on the purchasing power of U.S. residents, focusing exclusively on changes in the nominal dollar value of wealth. Therefore, an appreciation of the U.S. dollar with respect to foreign currencies does not affect the purchasing power of U.S. wealth denominated in U.S. dollars. In contrast, a corresponding depreciation of foreign currencies in relation to the U.S. dollar produces a negative effect on the dollar value of U.S. wealth denominated in foreign currencies, reducing the purchasing power of that wealth in the United States.

4
Sources of Data on Wealth My analysis combines information on the amount and currency composition of total U.S. holdings of foreign assets and foreign holdings of U.S. assets with information on the distribution of assets across U.S. households. Because 2015 is the most recent year for which information on the currency composition of U.S. holdings of foreign assets is available, the total wealth effect of the depreciation of foreign currencies is measured using 2015 data. For consistency, the distribution of assets across U.S. households also is measured using 2015 data.
The total wealth effect of foreign currencies’ depreciation is estimated by combining information from two data sources. Estimates of foreign assets held by U.S. residents and U.S. assets held by foreigners are based on data from the Bureau of Economic Analysis (BEA) Net International Investment Position Table 1.2.1 The currency composition of foreign assets held by U.S. residents is estimated using data from the Treasury International Capital (TIC) System. The Treasury collects data on a residency basis, assigning each security in the TIC System to the country where the entity issuing that security is legally a resident.2 The data include two sets of annual surveys for long-term and short-term securities holdings and two other surveys measuring short-term holdings of banks and other financial institutions:
■ Forms SHC (claims survey) and SHL (liabilities survey) describe the currency composition of portfolio assets and liabilities.
■ Forms B and C report the currency composition of short-term assets and liabilities collected from U.S. banks, other U.S. financial institutions, and nonfinancial institutions.
For each year, the claims survey contains information on U.S. portfolio holdings of foreign securities as of December, whereas the liabilities survey contains information on foreign portfolio holdings of U.S. securities as of June.3 BEA’s totals on portfolio and nonportfolio debt assets (which BEA defines as “other investment”) are based on TIC data for the same totals. Therefore, information from those two sources is highly consistent.
The distribution of foreign assets by household income group is approximated using the Federal Reserve’s 2016 Survey of Consumer Finances (SCF). That year’s SCF records information on assets held by U.S. households in 2015 and contains detailed information on ownership of portfolio assets, nonportfolio short-term assets, and business equity assets.4 The data also provide
1 Bureau of Economic Analysis (2017) defines how BEA totals in the international investment position accounts are constructed. 2 Alternatively, one could classify securities by the nationality of the issuer’s ultimate parent, which is, for example, the approach followed by the International Monetary Fund’s balance of payments accounts and international investment positions. 3 A comprehensive description of the TIC data, how they have evolved, and their strengths and limitations is provided by Bertaut and Judson (2014). 4 This paper later describes the method used to allocate the wealth effect on U.S. businesses among U.S. households.

5
extensive information on the equity and debt composition of both directly and indirectly held assets. Finally, the income information recorded in the SCF is crucial for my analysis, which ranks households by a measure of adjusted market income plus Social Security income. A disadvantage of the SCF is that it does not contain information on the wealth of individuals listed in the Forbes 400—a ranking of the richest 400 people in the United States—or on the value of portfolio assets held through defined benefit (DB) plans. Therefore, I supplement the SCF data with the Forbes data for 2015 and assume that the composition of that wealth is the same as that of the top 0.1 percent of wealth holders in the SCF.5 In my analysis, I add the wealth of Forbes 400 individuals to the estimate of the total wealth held by the top income decile of U.S. households.6 In addition, I impute portfolio assets held in DB plans by using information on DB coverage from the SCF.7
Total Measure of Wealth Effects For estimates of total wealth effects, the definition of wealth is based on the foreign asset and liability categories in BEA’s net international investment income position tables. According to BEA, at the end of 2015 U.S. residents held $20.9 trillion in foreign nonderivative assets, whereas foreigners held $28.3 trillion in U.S. assets. To put those figures in perspective, data from the Federal Reserve indicate that total assets held in the United States amounted to $207.7 trillion at the end of 2015. At that time, liabilities held in the United States totaled $199.2 trillion.8
More specifically, U.S. residents hold foreign portfolio equity and debt assets, foreign nonportfolio debt assets, FDI assets, and reserves in foreign currencies.9 Similarly, U.S. assets held by foreigners (which are liabilities to U.S. residents) include portfolio equity and debt assets, foreign nonportfolio debt assets, and FDI assets.
I exclude derivative assets from my analysis because their currency composition is not known. That omission is unlikely to significantly affect the estimated total wealth effect for three reasons. First, derivative assets are not a major component of cross-border investment positions. 5 Using instead the wealth composition of top 0.01 percent of wealth holders to approximate the wealth composition of Forbes 400 individuals has very little impact on the results of my analysis. The composition of the top 0.01 percent of wealth holders is estimated using the capitalization method to income data from the Internal Revenue Service, as reported in Saez and Zucman (2016). 6 The wealth of the Forbes 400 was 3 percent of total family wealth in 2013 according to Bricker and colleagues (2016). See www.forbes.com/forbes-400/ for the 2016 list. 7 See the appendix for details on the imputation method. 8 See Board of Governors of the Federal Reserve System (2016a). Nonfinancial sectors include households and nonprofit organizations and nonfinancial businesses as well as federal, state, and local governments. 9 Resident businesses are entities incorporated in the United States and exclude foreign corporations with U.S. operations. According to the Treasury’s definition (used in the TIC data and therefore in the BEA data): “The residency of an entity is determined by the country in which the entity is legally incorporated or otherwise resident, as opposed to the nationality of an entity, which is determined by residency of the entity’s ultimate parent. For example, if a U.S. firm owns a subsidiary incorporated in the Cayman Islands, any securities issued by the subsidiary would be reported as Cayman Islands securities and not U.S. securities” (p. 1). See Board of Governors of the Federal Reserve System (2016c).

6
Hau and Rey (2008) estimate that only 10 percent of foreign equity positions are hedged. Further, BEA data show that foreign derivative assets held by U.S. residents in the fourth quarter of 2015 amounted to $2.4 trillion, or 10.3 percent of total foreign assets held by U.S. residents. In the same period, U.S. derivative assets held by foreigners amounted to $2.3 trillion, or 7.6 percent of total U.S. assets held by foreign residents.10 Moreover, less than 15 percent of derivative assets at the end of 2015 were foreign exchange derivatives. Second, as emphasized in Lane and Shambaugh (2010), currency hedging through derivative contracts might be limited: Much of the trade in derivative contracts is between domestic residents, which does not alter the total net exposure of the economy. If the counterparty in a derivative contract is another U.S. resident, the currency risk still resides within the United States. Third, any hedging that comes through balancing derivative assets and liabilities would limit the effect of derivatives on the wealth effects estimated in the paper.11
I take into account foreign ownership of FDI assets held by U.S. businesses. Recent estimates indicate that a significant share of U.S. equity is held by foreign shareholders in U.S. corporations. For example, Rosenthal and Austin (2016) estimate that in 2015 slightly more than 24 percent ($5.5 trillion of $22.8 trillion) of C corporate shares were held by foreigners. Rosenthal (2017) estimates that, when considering both portfolio and FDI assets held in U.S. corporations, foreign investors own about 35 percent of U.S. corporate stock. In my analysis, I assume that foreigners hold 35 percent of U.S. businesses’ FDI assets abroad. However, I ignore foreign ownership of portfolio assets held by U.S. residents abroad because data from BEA and TIC do not divide those holdings between U.S. households and U.S. businesses. Adjusting the value of U.S. FDI assets by taking into account foreign ownership of U.S. businesses decreases the size of the wealth effect on U.S. households. Taking into account foreign ownership of portfolio assets held by U.S. residents abroad would further decrease the wealth effect I estimate for U.S. residents.
Because of data limitations, I ignore U.S. ownership of foreign businesses. That omission is unlikely to have a large effect on my results because a large fraction of U.S. liabilities to foreigners is denominated in U.S. dollars.
Finally, my measure of wealth effects focuses on changes in the nominal value of U.S. wealth holdings and ignores the potential effects through changes in domestic prices and wages resulting from fluctuations in nominal exchange rates. Changes in domestic wages and prices 10 In the Treasury’s TIC data, foreign residents are defined as residents of foreign countries, including foreign-resident custodians and foreign-resident central securities depositories (including residents of Canada, Mexico, and offshore centers); international organizations with extraterritorial status (even if located in the United States); foreign subsidiaries of U.S. entities and foreign-resident branches of U.S. banks; offshore and other non-U.S. funds; and entities or individuals that file an IRS Form W-8, indicating that they are foreign residents. See Board of Governors of the Federal Reserve System (2016b). 11 Because of data limitations, no previous studies document the value of derivative assets held by U.S. households of different income groups. The SCF pools holdings of futures contracts, stock options, and derivatives, which does not allow the precise measurement of derivative asset holdings.
7
would affect the real value of U.S. holdings of foreign assets, as well as the purchasing power of U.S. holdings of domestic assets.
Measure of Wealth Effect in Distributional Analysis The measure of wealth effect used in the distributional analysis relies exclusively on the effect of the exchange rate on U.S. holdings of foreign assets (excluding derivative and reserves assets). My analysis disregards the effect of the exchange rate on foreign holdings of U.S. assets for two reasons. First, the effect is smaller than the effect on U.S. holdings of foreign assets because most of those assets are denominated in U.S. dollars (Table 1). Second, the SCF lacks enough information to allocate U.S. residents’ liabilities to foreigners.
To calculate the wealth effect for each income decile, I divide each decile’s total financial holdings into their component asset classes from the SCF. In particular, I measure asset ownership for each SCF household by using information from the survey on portfolio equity and debt assets, nonportfolio debt assets (which include transaction accounts, certificates of deposit [CDs], loans, and cash holdings), and business equity in closely held C corporations. For each type of asset, I then derive the total wealth effect of the exchange rate change on its dollar value from the total value and currency composition of that asset. Finally, I apply the total wealth effects for each asset type to the total portfolios of each income decile to estimate how exchange rate changes are likely to affect the distribution of wealth across income levels.
The total wealth effect estimated using the BEA and TIC data refers to effects on foreign assets held by both U.S. households and U.S. businesses. However, the SCF contains information on assets held by U.S. households but lacks data on both the composition of assets held by U.S. businesses and the relationships between U.S. households and U.S. businesses. U.S. businesses own not only FDI assets but also portfolio assets in both domestic and foreign companies: For example, the Federal Reserve reported that in 2015 households owned about half the value of outstanding U.S. stock, with the remaining stocks held by U.S. businesses (Board of Governors of the Federal Reserve System 2016a). Because households are the ultimate owners of U.S. businesses, any profits of those businesses are returned to households.12
I allocate ownership of U.S. businesses’ FDI assets to U.S. households according to the distribution, by income group, of portfolio assets and business equity in closely held C corporations. I allocate foreign portfolio assets held by U.S. businesses to U.S. households as though those assets were directly held by SCF households. For example, because SCF households in the top income decile own 65.6 percent of total portfolio equity assets, I allocate 65.6 percent of portfolio equity assets held by U.S. businesses to U.S. households in the top income decile.
12 Distributing the effect on U.S. businesses to their shareholders is consistent with the approach used by the Joint Committee on Taxation (2013) for distributing the short-run burden of the corporate income tax.

8
In addition, the SCF does not distinguish between U.S. households’ indirect holdings of domestic and foreign assets, a large fraction of which are held through portfolio assets in retirement funds and pooled investment funds. Therefore, I assume that the distribution of total asset holdings measured in the SCF is the same as the distribution of foreign asset holdings. That assumption probably leads to underestimating the wealth effect on high-income households because investors in foreign assets are more likely to belong to top income groups. For example, a recent study used SCF information on direct holdings of foreign assets. The findings indicated that foreign stock owners were substantially wealthier, more educated, and less risk averse than households that focused on domestic stocks only.13 In contrast, that assumption leads to overestimating the wealth effect on high-income households if those households have equity invested in foreign assets with lower exposure to fluctuations in foreign currencies.
Finally, the SCF does not describe the currency composition of assets. Therefore, I assume that the currency composition of foreign assets measured at the total level from the TIC data (and shown in Table 1) applies uniformly to each income group. My analysis therefore does not capture any differences across U.S. households in the country of investment or in the fraction of their foreign assets denominated in foreign currencies.
Measures of Types of Assets and Liabilities Using data from BEA and the Treasury, I estimated the proportion of various asset types and liabilities held in foreign currencies. From the information in the SCF, I allocated the effect of the depreciation of foreign currencies on U.S. wealth to U.S. households across income groups.
Portfolio Assets and Liabilities. The categories of portfolio holdings are the same in BEA and TIC’s international investment data: cross-border positions in equity, long-term debt, and short-term debt securities, excluding those included in nonportfolio assets, direct investment, or reserve assets. BEA’s totals for portfolio holdings are compatible to the data reported in the TIC’s SHC and SHL forms. Therefore, I first use information from those forms to determine the currency composition of portfolio assets and liabilities. I then use BEA’s information on total assets and liabilities held in the fourth quarter of 2015 to compute the fraction of BEA’s portfolio equity and debt assets and liabilities denominated in foreign currencies.
Portfolio holdings in the SCF consist of direct holdings of stocks and bonds and indirect holdings through pooled investment funds; defined contribution retirement funds, such as 401(k) and individual retirement account plans; money market mutual funds; and other managed assets.
13 See Nechio (2014). Evidence from the SCF on direct holding of foreign assets also includes Kyrychenko and Shum (2009). That paper shows that the share of foreign stockholders as a percentage of all investors with directly held stock was 10.7 percent in 2004; that a substantial home bias exists for most U.S. households, even if one includes holdings in mutual fund and retirement accounts; and that within the group of foreign stockholders, the average ratio of foreign to total directly held stocks falls in the range of 30 to 50.

9
I supplement that information with the total portfolio holdings of Forbes 400 individuals and of DB pension funds.
The SCF also includes information on how portfolio holdings are split between equity and debt securities. For direct portfolio holdings, the separation between equity and debt reflects the distinction between stocks and bonds. In contrast, the SCF allocates indirect portfolio holdings to equity or debt on the basis of responses to survey questions about the asset composition of their portfolio. For example, holdings in mutual funds are assumed to be fully invested in equity assets if they are described as stock mutual fund or other mutual funds, whereas holdings in combination mutual funds are split equally between equity and debt assets.14
For Forbes 400 individuals, I assume that their assets are split between portfolio equity and debt assets in the same ratio as that of the top 0.1 percent of the SCF wealth distribution. For DB plans, I impute the composition of portfolio assets by using recent estimates on the asset composition of DB plans. Those estimates suggest that assets held through DB plans are invested more conservatively than assets in defined contribution plans: On average, roughly 45 percent of DB plans were invested in equity assets in 2012.15
Nonportfolio Debt Assets and Liabilities. Holdings of short-term nonportfolio debt assets and liabilities are included in BEA’s “other investment” category, which includes currency and deposits, loans, and commercial claims such as trade credit and advances. BEA’s “other investment” total is based largely on TIC B and C forms and is therefore very comparable to TIC totals.16 For example, nonportfolio debt liabilities to foreigners were $5,163 billion in the TIC data published on June 30, 2015, and $5,237 billion in the BEA data for the second quarter of 2015.
The TIC B form includes information on the currency denominations of nonportfolio short-term claims and liabilities reported by U.S. banks and other financial institutions; the TIC C form includes comparable information on claims and liabilities of nonfinancial institutions, which are involved mainly in production of goods and nonfinancial services. Combining the information on the currency composition of claims and liabilities for financial and nonfinancial institutions allows me to determine the share of BEA’s “other investment” denominated in foreign currencies.
For the distributional analysis, I construct a measure of nonportfolio debt assets by first identifying the assets in the SCF that are covered in BEA’s “other investment” category. Specifically, I start with the SCF-reported amounts in transaction accounts, CDs, and other short-term financial assets. Transaction accounts include checking and savings accounts, money
14 See the appendix for a full description of the SCF allocation criteria to equity and debt assets. 15 Estimates for the composition of DB pension funds in 2012 are provided by the Center for Retirement Research at Boston College, using data from IRS Form 5500 (Munnell, Aubry, and Crawford [2015]). 16 See the appendix for more details on what types of claims and liabilities are included in TIC forms B and C.

10
market deposit accounts, and call accounts at brokerage firms. However, I exclude money market mutual funds, which I instead categorize as portfolio debt assets. The SCF does not explicitly distinguish between negotiable and nonnegotiable CDs, but CDs measured in the SCF are probably nonnegotiable because negotiable CDs have a large face value and are typically purchased by institutional investors rather than individuals.17 Consistently, BEA classifies only nonnegotiable CDs as “other investment,” and negotiable CDs are classified as portfolio assets. My definition of other short-term financial assets includes loans and cash holdings, which make up a small part of BEA’s subcategories for “currency and deposits” and “loans,” included in “other investment.”
Foreign Direct Investment. BEA defines FDI as a category of cross-border investment in which a resident of one country owns or controls 10 percent or more of a nonresident entity’s voting securities. That threshold separates FDI assets from portfolio assets.
I assume throughout my analysis that FDI assets are entirely denominated in foreign currencies and that depreciation of those currencies affects the entire value of FDI assets and liabilities reported by BEA.18 That assumption might lead to overestimating the effect of foreign currencies’ depreciation on U.S. FDI assets.
First, not all FDI assets of U.S. multinational corporations (MNCs) might be denominated in foreign currencies, but the currency composition of those holdings has not been documented. For example, FDI assets held in tax havens for profit shifting might be significantly less sensitive to exchange rate fluctuations than FDI assets held in other locations. Similarly, and because traded goods between the United States and foreign countries are denominated largely in U.S. dollars, foreign affiliates of U.S. businesses might hold some of their assets in U.S. dollars.
Second, U.S. MNCs might be able to protect themselves from fluctuations in the value of foreign currencies through financial hedging.19 Financial hedging refers to the ability of U.S. MNCs to hedge against currency fluctuations by purchasing foreign exchange derivative assets. Such derivative assets amounted to $342 billion in the fourth quarter of 2015 and can be used to sell foreign currencies at a future date at a price agreed upon in the present. Financial hedging instruments include over-the-counter currency-hedging instruments such as currency forwards
17 The minimum face value of negotiable CDs is $100,000. Distinct from nonnegotiable CDs, negotiable CDs are highly liquid and can be sold in secondary markets. 18 Previous studies also incorporate the assumption that FDI assets are entirely denominated in foreign currencies. See Lane and Shambaugh (2010) and Bénétrix, Lane, and Shambaugh (2015). 19 The literature identifies three types of currency risks that MNCs face: translation or accounting risk, transaction risk, and economic risk. Translation risk refers to the impact of exchange rate changes on the valuation of foreign assets (mainly foreign subsidiaries) and liabilities on a multinational company’s consolidated balance sheet. Transaction risk refers to the effect on the value of foreign currency–denominated transactions that have already been concluded and agreed on a payment settled at a future date. Economic risk is the effect of the exchange rate on a firm’s future expected future cash flows.

11
and currency swaps, as well as exchange-traded products such as currency options.20 Previous studies, which include Makar and Huffman (1997) and Papaioannou (2006), show that the use of foreign exchange derivatives among U.S. MNCs is positively correlated with their level of foreign currency exposure and that U.S. MNCs hedge against currency risk mainly by purchasing currency-forward contracts.
Measuring how the wealth effect of the depreciation of foreign currencies on FDI assets is distributed across U.S. households is complicated because the SCF does not include information on which households own shares in U.S. MNCs with FDI assets.21 I assume that changes in the dollar value of FDI assets are distributed to U.S. households in proportion to their holdings of portfolio assets and business equity in closely held C corporations because changes in the value of U.S. MNCs fall on households, the ultimate owners of U.S. businesses.
Unit of Observation and Measure of Income My distributional analysis ranks U.S. households according to the SCF definition of “household.” In the SCF, a household unit includes a primary economic unit (PEU) and everyone else in the household. The PEU consists of the person or couple (whether married or living together as partners) who either own the residence or who signed the lease for it as well as any dependents living at home.22
I rank SCF households on the basis of a measure of their household income and assume that Forbes 400 individuals belong to the top income decile.23 Household income includes market income and social insurance and accounts for differences in household size. Market income includes labor income, business income, capital gains, capital income excluding capital gains, and other income.24 Social insurance income includes Social Security benefits, Medicare income, and unemployment insurance benefits.
I then adjust the income measure by the square root of household size, as is done in CBO’s reports on the distribution of household income. Accounting for the number of individuals living in each household is important because larger households generally need more income to support 20 A currency forward is a contract in which one party commits to buying a currency for future delivery at a price set today. A cross-currency swap is an agreement between two parties to exchange the principal amount of a loan in one currency and the interest applicable on it during a specified period for a corresponding amount and applicable interest in a second currency. A currency option is a contract that grants the buyer the right, but not the obligation, to buy or sell a specified currency at a specified exchange rate on or before a specified date. 21 In addition, the effect of changes in the dollar value of FDI assets on U.S. households would possibly depend on how changes in the value of FDI assets are passed through to consumers, employees, and U.S. shareholders. 22 The definition of PEU is broader than the Census “family” concept because it includes nonrelatives who are dependents of the head of the unit, but it is narrower than the Census “household” concept because it excludes others living in the residence who are not dependent on the PEU’s head. 23 Previous studies have documented the positive correlation between income and wealth. See Jesse Bricker and others (2016). The authors argue that “income concentration and wealth concentration are both contentious issues, and many see the two measures as strongly correlated” (p. 25). 24 This measure of income is consistent with the one used in CBO’s recent analysis on the distribution of household income. See Perese and Habib (2017). See the appendix of this paper for the imputation methods.

12
a given standard of living. At the same time, larger households benefit from economies of scale: When an additional individual joins the household, the average per capita income needed to maintain the same standard of living decreases. Dividing income by the square root of household size (rather than simply by household size) takes into account the effect produced by economies of scale.
Wealth Effect on U.S. Holdings of Foreign Assets A 20 percent appreciation of the U.S. dollar would result in a decrease of an estimated $2,451 billion in the value of foreign assets held by U.S. residents—12 percent of the value of their total foreign assets (Table 1). The effect on U.S. holdings of foreign assets would be larger for equity assets than for debt assets. The value of FDI assets would decline by $907 billion; portfolio equity assets, by $1,222 billion; and foreign debt assets, by $246 billion.
Because foreign assets are a small share of U.S. residents’ total assets, the value of their total domestic and foreign assets would fall by just 2.1 percent.25 Specifically, SCF households’ total asset value equaled $110.5 trillion in 2015, of which 48.6 percent was financial assets and the remaining assets were nonfinancial assets including housing, vehicle, business equity, and real estate equity. The wealth effect of foreign currencies’ depreciation on SCF households’ assets would be small because foreign assets denominated in foreign currencies are a small fraction of total SCF households’ financial assets.
When the effects on all asset types are totaled, households in the top income decile would be the most affected by the depreciation of foreign currencies. Overall, those households have total net worth of $64.1 trillion and hold $67.5 trillion in assets (Figure 1). Households in the top income group also hold a large fraction of total assets affected by foreign currencies’ depreciation (Figure 2). I estimate that $1,503 billion (or 61.3 percent) of the total wealth effect would fall on households in the top income decile, $336 billion on households in the ninth income decile, and $10 billion on households in the bottom income decile (Figure 3a).
The wealth effect of foreign currencies’ depreciation as a percentage of total wealth also would increase with income, largely because financial assets are a larger fraction of total assets for households in higher income deciles. I estimate that the value of total assets would decrease by 2.2 percent for households in the top income decile, by 2.3 percent for households in the ninth income decile, and by 1.1 percent for households in the bottom income decile (Figure 3b).
How Portfolio Assets Affect U.S. Holdings Among developed economies, U.S. residents hold the largest amount of foreign portfolio assets. Data from the International Monetary Fund’s Coordinated Portfolio Investment Survey (CPIS),
25 The percent change in the value of U.S. net worth would be comparable to the percent change in the value of U.S. assets. I estimate that net U.S. wealth would decrease by $2.3 trillion, or 2.2 percent of total SCF households’ net worth in 2015.

13
which measures holdings of foreign portfolio assets across a large set of countries, show that in December 2015 the value of U.S. holdings of foreign portfolio assets was more than twice the size of those of Luxembourg, the second-largest holder.26 According to BEA’s estimates for the last quarter of 2015, U.S. residents held $9,606 billion in foreign portfolio assets, of which $6,828 billion was equity and $2,778 billion was debt that consisted of assets. In addition, among the top reporting economies (United States, Luxembourg, United Kingdom, Japan, Germany, France, Netherlands, Cayman Islands, China, and Switzerland), only the United States and China held more foreign portfolio equity than debt.
U.S. holdings of foreign portfolio equity assets are largely concentrated in advanced economies, with most portfolio equity assets held by U.S. residents issued by entities based in the United Kingdom, Japan, Switzerland, and Ireland. Foreign portfolio equity assets include stocks traded on foreign markets, and are therefore denominated in foreign currencies, and American depositary receipts, which are shares in a foreign corporation that are traded on U.S. stock exchange markets and are denominated in U.S. dollars.
U.S. holdings of foreign portfolio debt assets are primarily long-term debt securities issued by foreign private institutions with residence in the Cayman Islands, Canada, and the United Kingdom.27 Using the TIC data, I estimate that 87 percent of portfolio debt assets held by U.S. residents were long-term debt assets. A large fraction of both short-term and long-term debt assets were issued by private entities rather than by foreign governments: 74.1 percent of long-term debt assets and 82.6 percent of short-term debt assets.
The currency composition of equity and debt held by U.S. residents in foreign portfolios differs. Foreign portfolio equity assets held by U.S. residents are denominated mainly in foreign currencies: from the TIC data, I estimate that 89.6 percent of portfolio equity asset holdings are denominated in foreign currencies, with the remaining assets held through American depositary receipts (Table 1). In contrast, foreign portfolio debt assets held by U.S. investors are denominated largely in U.S. dollars. Using the TIC data, I estimate that at the end of 2015 only 22.5 percent of U.S. residents’ holdings of foreign portfolio debt assets were denominated in foreign currencies.
Both direct and indirect holdings of portfolio assets are held largely by households in the top income decile (Figure 4). Households in the top income decile own $6,110 billion ($484,995 per household, on average) in direct portfolio holdings, a large fraction of which are stock holdings, and $22,773 billion (about $1.8 million per household, on average) in indirect portfolio holdings, most of which are held through retirement funds.
26 About 80 countries or geographic regions participated in the December 2015 CPIS survey, including most industrial and many financial center countries. For more details, see the International Monetary Fund’s CPIS data landing page, http://data.imf.org/CPIS. 27 Long-term debt securities are those issued with an original time to maturity in excess of one year.

14
Portfolio equity assets are more concentrated at the top of the income distribution than portfolio debt assets. I estimate that households in the top income decile hold 65.8 percent of equity assets and 53.6 percent of debt assets. Households in the bottom income decile hold only 0.4 percent of total portfolio equity assets and 0.5 percent of total portfolio debt assets (Figure 5a).
In combination, I estimate that a 20 percent depreciation of foreign currencies with respect to the U.S. dollar would result in the following:
■ $804 billion of the $1,222 billion total wealth effect on foreign portfolio equity holdings would fall on U.S. households in the top income decile,
■ $167 billion would fall on households in the ninth income decile, and
■ $5 billion would fall on households in the bottom income decile.
In addition, $66 billion of the $124 billion total wealth effect on portfolio debt would fall on the top income decile, $21 billion on the ninth income decile, and $1 billion on the bottom income decile (Figure 5b).
Overall, a large fraction of the estimated total wealth effect on U.S. holdings of foreign portfolio assets would therefore be felt by households in the top income decile. With a 20 percent depreciation of foreign currencies in relation to the U.S. dollar, the portfolio wealth of households in the top income decile would decrease by $870 billion. In contrast, U.S. households in the ninth income decile would experience a $188 billion decrease in their foreign portfolio wealth, and households in the bottom income decile would see their foreign portfolio wealth decline by $6 billion.
How Nonportfolio Assets Affect U.S. Holdings From BEA estimates, U.S. holdings of debt in foreign nonportfolio assets amounted to $3,977 billion in the last quarter of 2015. I estimate that 58 percent of those assets were loans to foreigners, 41 percent consisted of currency and deposits in foreign countries, and the remaining 1 percent were trade and credit advances in relation to foreign counterparties. Most of those assets were held by U.S. banks and other U.S. financial institutions and were denominated in U.S. dollars.
TIC data show that U.S. banks and other U.S. financial institutions held $3,614 billion in foreign nonportfolio debt assets, of which $3,064 billion was financial institutions’ own financial claims on foreigners and $550 billion was claims on behalf of U.S. customers. Most of those claims were on residents of the United Kingdom, followed by claims on residents of the Cayman Islands, Japan, and Canada. In contrast, U.S. nonfinancial institutions held only $60 billion in foreign nonportfolio debt assets at the end of 2015. On the basis of TIC’s information,

15
$15 billion was financial claims on foreigners, and $45 billion was commercial claims including trade receivables and advance payments.
Among nonportfolio claims of U.S. banks and other U.S. financial institutions on foreigners, $3,181 billion (or 88 percent of total claims) was denominated in U.S. dollars. Of those claims, $2,706 billion was financial institutions’ own claims on foreigners and $475 billion was claims on behalf of their U.S. customers. Similarly, nonportfolio claims of U.S. nonfinancial institutions on foreigners also were denominated largely in U.S. dollars—an estimated $52 billion (or 86.7 percent of total claims), with the remaining claims denominated in euros ($2.3 billion), Canadian dollars ($1.6 billion), British pounds ($1.2 billion), and Japanese yen ($0.3 billion).
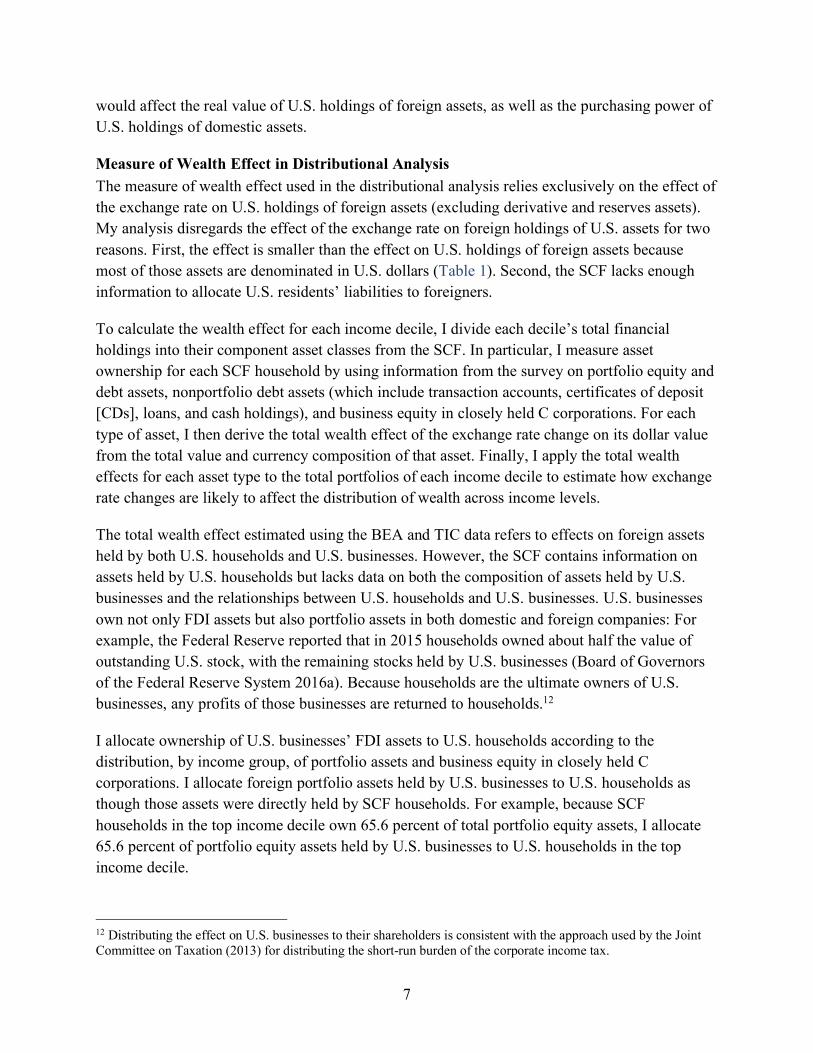
The ownership of nonportfolio debt assets in the SCF is very concentrated at the top of the income distribution (Figure 6a). Households in the top income decile own $3,046 billion ($241,771 per household, on average) in short-term debt assets, mainly transaction accounts such as checking, savings, and money market accounts. I estimate that households in the top income decile own 57.5 percent of total assets, compared with 13.0 percent in the ninth income decile and 0.6 percent in the bottom income decile.
As a result, I estimate that a large fraction of the total burden on foreign nonportfolio debt assets would fall on households in the top income decile. With a 20 percent depreciation of foreign currencies with respect to the U.S. dollar, $70 billion would fall on the top income decile, $16 billion on the ninth income decile, and $1 billion on the bottom income decile (Figure 6b).
How Foreign Direct Investment Affects U.S. Holdings According to BEA’s data on U.S. net international investment position, U.S. FDI amounted to $6,978 billion in the fourth quarter of 2015. About 83 percent of FDIs consisted of corporate equity assets, with the remaining 17 percent being corporate debt assets. In addition, BEA’s table on 2015 FDI holdings by country of ultimate beneficiary owner (UBO) shows that the Netherlands ($783 billion), the United Kingdom ($625 billion), and Luxembourg ($553 billion) were the major recipients of FDI from the United States.28 Other large recipients of U.S. FDI include countries listed as tax havens, such as Ireland ($334 billion), Bermuda ($305 billion), and the Cayman Islands ($287 billion).
If U.S. FDI assets in foreign countries were all denominated in foreign currencies and MNCs did not adopt financial or operational hedging strategies, the total wealth effect of a large depreciation of foreign currencies would be significant. With a 20 percent depreciation of foreign currencies in relation to the U.S. dollar, I estimate that the dollar value of FDI held by U.S. residents would decrease by $907 billion. As noted, that amount is probably an upper bound on 28 BEA defines a UBO as “the person that ultimately owns or controls the U.S. affiliate. A ‘person’ may be an individual, company, government, trust, partnership, etc. More formally, the UBO is that person, proceeding up a U.S. affiliate’s ownership chain, beginning with and including the foreign parent, that is not owned more than 50 percent by the person above it. The UBO may be located in the United States.”

16
the effect of foreign currencies’ depreciation on U.S. wealth. For example, assuming that all FDI assets held by U.S. businesses in large tax havens were denominated in dollars would lower the wealth effect on FDI assets to $593 billion.29
How the wealth effect of foreign currencies’ depreciation on FDI would be distributed among households with different income levels depends on which U.S. households own shares in MNCs. Although the SCF does not measure that, I estimate that the ownership of FDI assets is concentrated largely among the top income decile of households, which owns 62.0 percent of total assets (Figure 7a). In contrast, I estimate that households in the ninth income decile own 14.6 percent of U.S. FDI assets, and households in the bottom income decile hold 0.4 percent of those assets.
In total, I find that with a 20 percent depreciation of foreign currencies with respect to the U.S. dollar, the wealth effect (in dollars) on FDI assets would be concentrated in the top decile. The wealth of U.S. households in the top income decile would decrease by $563 billion, whereas it would decrease by $132 billion for households in the ninth decile and by $4 billion for households in the bottom decile (Figure 7b).
Wealth Effect on Foreign Holdings of U.S. Assets At the end of 2015, the value of total U.S. assets held by foreigners exceeded the value of foreign assets held by U.S. residents. BEA estimates that foreigners held $28.3 trillion in U.S. assets. The largest share of those assets ($10.6 trillion) consisted of portfolio debt assets, followed by FDI ($6.5 trillion), portfolio equity assets ($6.2 trillion), and other investment assets ($5.1 trillion). In addition, TIC’s data show that the largest foreign holders of U.S. portfolio debt assets were residents of China and Japan, whereas the major holders of portfolio equity assets were residents of the Cayman Islands, the United Kingdom, and Canada. In contrast, U.S. short-term nonportfolio debt assets were held mainly by residents of the Cayman Islands, the United Kingdom, and Japan. BEA’s table on 2015 FDI holdings by country of UBO shows that the United Kingdom, Japan, and Canada were the largest holders of FDI assets in the United States.
Despite the large value of U.S. residents’ liabilities to foreigners, I show that the effect of foreign currencies’ depreciation on the dollar value of those assets would be limited, primarily because the share of those assets denominated in foreign currencies is small. Specifically, U.S. portfolio equity and FDI assets held by foreigners are denominated entirely in U.S. dollars, whereas only a small fraction of debt assets are denominated in foreign currencies (Table 1). In addition, because of data limitations, I cannot distribute that change in value to U.S. households by income group.
29 This calculation takes into account FDI assets in the Netherlands, Luxembourg, Ireland, Bermuda, Cayman Islands, and Switzerland. The combined U.S. FDI assets in those countries was $2.4 trillion in 2015.

17
Total Wealth Effect on U.S. Liabilities to Foreigners I estimate that only 3 percent of foreign holdings of U.S. assets are denominated in foreign currencies, as shown in Table 1. As a result, a 20 percent depreciation of foreign currencies with respect to the U.S. dollar would decrease the value of U.S. liabilities to foreigners by $168 billion. With my assumptions on the currency composition of portfolio equity and FDI assets, that effect would come entirely from foreign holdings of portfolio debt assets ($122 billion) and short-term nonportfolio debt assets ($46 billion).
On the basis of information reported in the 2015 TIC SHL form, foreign residents invested $9,503 billion in U.S. long-term debt securities and $955 billion in U.S. short-term debt securities. A large share of those holdings was denominated in U.S. dollars: Using TIC data, I estimate that 93.8 percent of long-term debt securities and 98.0 percent of short-term debt securities held by foreigners were denominated in U.S. dollars. Combining short-term and long-term portfolio debt liabilities to foreigners, I estimate that only 5.8 percent of the value of foreign holdings of U.S. portfolio debt securities was denominated in foreign currencies.
Short-term nonportfolio debt liabilities to foreigners, which BEA classifies as “other investment,” also were denominated largely in U.S. dollars and included liabilities of both financial and nonfinancial institutions that are legally incorporated or otherwise based in the United States. Liabilities of U.S. banks and other financial institutions to foreigners included liabilities to foreign official institutions, foreign banks, international and regional organizations, and other foreign entities. Liabilities of nonfinancial institutions also included commercial liabilities such as trade payables and advance receipts. I estimate that only 4.5 percent of U.S. short-term debt liabilities to foreigners were denominated in foreign currencies (Table 1). More specifically, only 4.4 percent of U.S. banks and financial institutions’ liabilities and 7.4 percent of nonfinancial institutions’ liabilities to foreigners were denominated in foreign currencies.
Comparison With Previous Estimates My estimate on the share of foreign holdings of U.S. assets denominated in foreign currencies is lower than the amounts calculated by Lane and Shambaugh (2010) and Bénétrix, Lane, and Shambaugh (2015). Those two studies do not focus specifically on the United States but offer evidence on the currency composition of assets and liabilities across a large set of countries. Bénétrix, Lane, and Shambaugh (2015) estimate that in 2012, the latest year covered in their dataset, roughly 25 percent of U.S. debt liabilities and 16 percent of total U.S. liabilities to foreigners were denominated in foreign currency.
Two main reasons account for the differences between their estimates and mine. First, to ease comparison across countries, Bénétrix, Lane, and Shambaugh (2015) computed the currency composition of debt liabilities by using locational data from the Bank of International

18
Settlements (BIS).30 Significant differences in definition and coverage between the TIC and BIS data help account for differences in estimated currency composition.31 Second, Bénétrix, Lane, and Shambaugh (2015) did not distinguish between portfolio and nonportfolio debt liabilities but instead approximated the currency composition of total debt liabilities with the currency composition of short-term debt liabilities measured in the BIS data. By contrast, my analysis distinguishes between portfolio and nonportfolio debt liabilities, whose currency composition can be measured separately in the TIC data.
Example of Policy Affecting Nominal Exchange Rates: A Border Adjustment Tax Both fiscal and monetary policies can affect nominal exchange rates between the United States and its trading partners. One example of such a policy is a border adjustment component of a destination-based cash-flow tax. A BAT is a feature of consumption taxes around the world and ensures that goods and services are taxed where they are consumed rather than where they are produced. In the United States, a BAT has been discussed in the context of broader tax reform but was not included in the tax legislation enacted in December 2017.
When applied to international transactions, a BAT is estimated to affect the exchange rate between the country implementing the border adjustment and the other countries with which it trades.32 If implemented in the United States with no other changes to the tax code, a BAT would impose a tax on imported goods and services, which would increase the price of imported commodities. Higher import prices would make foreign goods and services more expensive for U.S. residents, reducing demand for those imported products. In contrast, a BAT would exempt exported goods and services from taxation, reducing the price of exported commodities. Lower export prices would make U.S. commodities more affordable to foreigners, increasing demand for U.S. goods and services. Both the decrease in the demand for foreign commodities and the increase in the demand for U.S. commodities would cause the demand for foreign currencies to decrease with respect to the demand for U.S. dollars. As a result, foreign currencies would depreciate against the U.S. dollar.
How a 20 Percent BAT Affects Nominal Exchange Rates Although the effect of a BAT, if enacted in the United States, on foreign currencies’ exchange rates has been much discussed, little research has been done to estimate the magnitude of that
30 Using the BIS locational data, I estimate that the quarterly average for the share of foreign currency–denominated liabilities to foreigners was 25.6 percent in 2012 and 26.8 percent in 2015. 31 BIS locational bank statistics focus on outstanding claims and liabilities of internationally active banks and capture around 95 percent of all cross-border interbank business. However, they miss cross-border banking done without the intervention of international banking facilities or direct transactions between nonfinancial lenders and borrowers. In the last quarter of 2015, U.S. banks’ debt liabilities to foreigners amounted to $3,602 billion in the BIS data, whereas the BEA total for “other investment” was $5,062 billion. 32 Not all border adjustments apply to commodities traded internationally. For example, state retail sales taxes are also border adjusted.

19
effect. Some analysts have focused more on the real exchange rate than on the nominal rate. Although not explicitly stated, the policy analyses of Auerbach and Holtz-Eakin (2016) and Feldstein (2017) are consistent with a full adjustment of the real exchange rate—an adjustment that depends on both the nominal exchange rate adjustment and other mechanisms of adjustment (for example, changes in net-of-tax prices of traded commodities). Other commentators have speculated that nominal exchange rates would not react significantly to a BAT because, for example, the daily turnover in foreign exchange markets is a large multiple of the amount involved in trade-related transactions. Some analysts also note that the size of the exchange rate adjustment depends on the currency in which traded commodities are invoiced and on the exchange rate regime applied in foreign countries.33
A possible source of information on how a BAT would affect the nominal exchange rate might be the findings from studies of value added-taxes (VATs), which are border-adjusted, in other countries. The findings from that research are mixed, however, with a variety of estimated effects of introducing VATs on exchange rates.34 In addition, the evidence on VATs in other OECD countries would not necessarily apply to the United States because of the different institutional setting. For example, differences in how countries design and implement a BAT, the overall structure of their tax system, and their openness to trade and capital flows all probably contribute to the exchange rate adjustment. Measuring how a BAT affects the nominal exchange rate is further complicated by the uncertainty surrounding the timing of the exchange rate adjustment and by the introduction of other contemporaneous changes in the tax system.
How a 20 Percent BAT Affects U.S. Wealth The nominal exchange rate adjustment, after the imposition of a BAT in the United States, would most likely produce a one-time effect on the wealth of U.S. residents by changing the dollar value of their assets and liabilities denominated in foreign currencies.35 Specifically, the dollar
33 For a more detailed discussion, see Rogoff (2017) and Kellar, Korenko, and Hellkamp (2017). For a discussion on how a BAT could affect the exchange rate between the United States and China, which has a floating exchange rate with the United States, see Setser (2017). 34 Using data on 30 countries from the Organisation for Economic Co-operation and Development (OECD) for the 1965–2009 period, De Mooij and Keen (2012) found that VATs did not affect those countries’ trade balances, consistent with full real exchange rate adjustment to a border-adjusted tax. Other researchers obtained similar results: Keen and Syed (2006) studied the export performance of OECD countries over the 1967–2003 period and found that VATs did not affect short-run or long-run net exports. Freund and Gagnon (2017) focused on the introduction of the VAT in 35 advanced economies in the 1980–2015 period and found evidence consistent with full real exchange rate adjustment. In contrast, Mihir A. Desai and James Hines Jr. used data from 136 countries in 2000 and showed that reliance on a VAT was associated with fewer exports and imports (Value-Added Taxes and International Trades: The Evidence [unpublished, 2005]). Similarly, Nicholson (2010) used data on 29 OECD countries in the 1997–2008 period and found that border-adjusted taxation reduces trade volumes of both exports and imports, with different effects across industries. 35 A BAT also would provide a windfall to foreign holders of U.S. assets. See Viard (2017). The focus of this paper is on the effect on U.S. residents and does not explicitly consider how a BAT affects the value (in foreign currencies) of wealth held by foreigners.

20
value of both U.S. holdings of foreign assets and foreign holdings of U.S. assets would decrease, affecting the net wealth held by U.S. residents.
If the nominal exchange rate was to fully adjust to a 20 percent BAT in the United States, foreign currencies would depreciate by 20 percent against the U.S. dollar. According to my analysis, the value of U.S. wealth would drop by $2,283 billion. That estimate is higher than that in Auerbach (2017).36 He used information about total foreign assets held by U.S. residents and total U.S. assets held by foreigners in 2016 from BEA and from Bénétrix, Lane, and Shambaugh (2015) to estimate the effect of full exchange rate adjustment to a 20 percent BAT. Auerbach found that U.S. wealth would have decreased by $2,115 billion had the border adjustment been implemented in 2016—about $168 million less than what I estimated.
Two likely reasons account for the gap between Auerbach’s estimates and mine. First, he included derivative assets and liabilities in his analysis and assumed that derivatives have the same currency composition as nonderivative assets. By contrast, my analysis excludes derivative assets because their currency composition is not known. Second, Auerbach and I used different data sources. On one hand, Auerbach’s estimates are based on more recent total data on cross-border holdings. On the other hand, my study draws on more detailed and consistent information on the currency composition of those holdings: I measure the currency composition of assets and liabilities by using 2015 BEA and TIC data, whereas Auerbach applied estimates from Bénétrix, Land, and Shambaugh (2015) for the currency composition of U.S. cross-border holdings to the 2016 totals from BEA. In addition, Auerbach relied on Rosenthal and Austin’s (2016) estimate of the foreign ownership of U.S. businesses (24.3 percent), whereas I use Rosenthal’s (2017) more recent estimates of that share (35 percent). A direct implication is that the wealth effect I estimate on FDI assets held by U.S. residents is smaller.
An important limitation of those findings, like previous studies that have estimated how changes in exchange rates affect wealth, is that many possible effects on wealth are not considered. First, ignoring the effect of a BAT on domestic prices has important implications for both the size and the distribution of the wealth effect on U.S. households. If taken into account, price changes would affect the value of both domestic and foreign assets held by U.S. households and the purchasing power of their income. The effect on domestic prices would depend on the magnitude of the exchange rate adjustment and on how the Federal Reserve dealt with changes in domestic prices. Prices would not change if the exchange rate adjusted to fully offset the effect of the BAT on the prices of traded goods and services.37 In contrast, a partial exchange rate adjustment to a
36 Gaertner, Hoopes, and Maydew (2018) examine a different type of wealth effect of a BAT: how import-intensive publicly traded firms affect share prices. In particular, their analysis shows that retail and other import-intensive industries experience significant drops in share prices on days of high online search activity for the expression “border adjustment tax.” 37 The trade neutrality of a BAT with full exchange rate adjustment is discussed in Auerbach and Holtz-Eakin (2016). That theoretical result relies on prices being able to flexibly adjust to the BAT, regardless of the currency in

21
BAT would cause import prices to increase, possibly raising the overall price of commodities consumed by U.S. households and businesses. Domestic prices would be unlikely to increase if the Federal Reserve offset the increase in domestic prices by tightening its monetary policy.
Second, a BAT would affect U.S. wealth through channels other than the exchange rate adjustment and would redistribute resources in ways other than through changes in the value of foreign wealth. If no other changes occurred in the tax code, a BAT would affect the relative value and therefore the demand for domestic and foreign assets, which would probably affect the relative rates of return on those assets. Changes to those rates of return would have additional effects on the value of assets held by U.S. households. Furthermore, introducing a BAT in the current U.S. tax system would probably transfer resources from shareholders of importing firms to shareholders of exporting firms, whose worldwide tax liabilities would probably fall as a consequence of a BAT.38 In addition, low-income households would find the higher prices a relatively large strain on resources because consumption is a larger share of their income.
Finally, a BAT would probably not be enacted in isolation. For example, it could be implemented as part of a consumption-based tax, such as a cash-flow tax. Moving from the current U.S. corporate income tax to a cash-flow tax would exempt investment from being taxed, which would probably produce additional effects on U.S. wealth and the U.S. economy more broadly.39 The overall effect of those policies across income groups is uncertain and depends only partly on the effects of the exchange rate adjustment. Taking into account those changes would not only allow a more realistic assessment of how a BAT would affect the U.S. economy but also complicate the analysis significantly. A more comprehensive analysis is left to future research.
Discussion According to my analysis, a 20 percent depreciation of foreign currencies with respect to the U.S. dollar would decrease U.S. wealth by $2,283 billion. Specifically, the value of foreign assets held by U.S. residents would decrease by $2,451 billion, whereas the value of U.S. assets held by foreigners would decrease by $168 billion. In addition, I show that the effect on foreign assets held by U.S. residents would fall largely on equity assets and that U.S. households in the top income decile would be the most affected by large depreciations of foreign currencies. In total, I estimate that households’ net worth would decrease by 2.2 percent.
With this paper’s focus on changes in nominal exchange rates, the results are useful for thinking about how the wealth of U.S. residents would be affected by policies that influence the exchange which those prices are quoted. See Buiter (2017) for a broader discussion on the exchange rate implications of BAT neutrality. 38 However, exporting firms would see no change in their worldwide tax liability if they are now in a loss position or can offset their U.S. tax liability by claiming the foreign tax credit. 39 For a broad overview of the effects of moving from a corporate income tax to a destination-based cash-flow tax, see Auerbach (2010) and Devereux and de la Feria (2014).

22
rate between the U.S. dollar and foreign currencies. For example, fiscal policies are generally associated with fluctuations in nominal and real exchange rates.40
Some of the assumptions made in this paper probably lead to overestimating the total wealth effect of a 20 percent depreciation of foreign currencies with respect to the U.S. dollar. As noted, the estimated effect on FDI assets is probably an upper bound because it ignores foreign ownership of U.S. businesses, financial and operational hedging of U.S. MNCs, and the possibility that a fraction of FDI assets might be denominated in U.S. dollars rather than foreign currencies. In addition, ignoring foreign ownership of U.S. corporations also leads to overestimating the wealth effect on U.S. households.
Furthermore, certain assumptions in the analysis may affect the interpretation of the estimated distribution of the wealth effect. I assume that the distribution of assets observed in the SCF reflects the distribution of foreign assets and that the currency composition of foreign assets is uniform across income groups. Those assumptions would lead me to underestimate the effect on high-income households if the distribution of foreign assets is more unequal than that of total assets, or if a larger share of high-income households’ foreign assets are denominated in U.S. dollars rather than in foreign currencies.
As a result of data limitations, I allocate foreign assets held by U.S. businesses to U.S. households on the basis of the SCF distribution of portfolio assets and business equity in closely held C corporations. Because those assets are held largely by high-income households, the strategy I use allocates the wealth effect on U.S. businesses’ FDI and portfolio assets to high-income households, which increases the overall wealth effect on those households. In addition, my analysis ignores differences in behavioral responses. My analysis, for example, would overestimate the wealth effect on high-income households if those households are hedging against currency risk more effectively than low-income households.
The results of this paper can inform the analysis of the wealth effects of policies affecting the nominal exchange rate between the United States and foreign currencies. However, the study did not allow for other channels through which the wealth of U.S. residents could be affected by a policy change. For example, by changing the relative demand for U.S. and foreign assets, a BAT could affect the value of U.S. assets held by U.S. households. In addition, a less-than-full real exchange rate adjustment to a BAT could affect the price of traded goods, which would then affect the value of shares issued by U.S. importing and exporting firms. Furthermore, a BAT-induced substantial appreciation of the U.S. dollar would increase the value of liabilities in
40 Recent empirical evidence for the United States suggests that contractionary fiscal policies (such as decreases in government spending) would cause current account balances to improve and the U.S. dollar to depreciate against foreign currencies. However, the effect of fiscal policies on exchange rates depends on several factors, including the size and condition of the economy and how financial markets interpret budget deficits and monetary policy. The literature includes mixed evidence on those factors. For evidence consistent with the “twin deficit,” see Kitchen (1996). For evidence on the “twin divergence,” see Kim and Roubini (2008).

23
foreign countries with debt issued in U.S. dollars, which could increase default rates on assets held by U.S. residents in those foreign countries. Incorporating those additional wealth effects would yield a more comprehensive picture of the wealth effects of a BAT.

24
Table
Table 1. Total Wealth Effect of Nominal Foreign Currency Depreciation
Source: Author’s calculations, using 2015 data from the Bureau of Economic Analysis and the Treasury International Capital. Data in this table exclude financial derivatives, for which currency composition is uncertain.
*The wealth effect reported in the table reflects the assumption that 35 percent of U.S. foreign direct investment (FDI) abroad is owned by foreigners.

25
Figures
Figure 1. Distribution of U.S. Households’ Net Worth and Assets
(a) Distribution of Net Worth
(b) Distribution of Total Assets
Source: Author’s calculations, using 2016 Survey of Consumer Finances.
Net worth is a measure of total assets minus total liabilities. Total assets include both financial and nonfinancial assets. Financial assets include transaction accounts, pooled investment funds, retirement accounts, cash value life insurance, other managed assets, and other financial assets. Nonfinancial assets include vehicles, housing, and real estate and business equity, as well as other nonfinancial assets.

26
Figure 2. Distribution of Households’ Asset Value, by Asset Category
Source: Author’s calculations, using 2016 Survey of Consumer Finances.
The distribution of nonportfolio debt assets is estimated from information on transaction accounts, certificates of deposit, loans, and cash holdings. The distribution of portfolio debt assets is estimated from information on directly held bonds and savings bonds and on portfolio debt assets held through pooled investment funds, retirement accounts (both direct benefit [DB] and direct contribution [DC]), money market mutual funds, and other managed accounts. The distribution of portfolio equity assets is estimated from information on directly held stocks and on portfolio equity assets held through pooled investment funds, retirement accounts (DB and DC), and other managed accounts. The distribution of foreign direct investment (FDI) equity is estimated using information on portfolio assets and business equity in closely held C Corporations.

27
Figure 3. Wealth Effect of Nominal Foreign Currency Depreciation on U.S. Holdings of Foreign Assets
(a) Dollar Amount
(b) Percentage Decrease in Households’ Assets
Source: In panel a, the wealth effect by asset type and income group is computed by multiplying the total wealth effect for that asset type (measured using Bureau of Economic Analysis and Treasury International Capital) by each income group’s share of total assets of that same type in the 2016 Survey of Consumer Finances (SCF). The total wealth effect is equal to the sum of the wealth effects on the different asset types. Panel b shows total wealth effects divided by SCF total assets for each income decile.
FDI = foreign direct investment.

28
Figure 4. Distribution of U.S. Households’ Portfolio Holdings
(a) Direct Portfolio Holdings
(b) Indirect Portfolio Holdings
Source: Author’s calculations, using 2016 Survey of Consumer Finances.

29
Figure 5. Wealth Effect of Nominal Foreign Currency Depreciation on Portfolio Assets
(a) Share of Total Portfolio Assets
(b) Total Change in Dollar Value of U.S. Holdings of Foreign Portfolio Assets
Source: In panel a, the distribution of portfolio debt assets is estimated using information from the 2016 Survey of Consumer Finances (SCF) on directly held bonds and saving bonds and on portfolio debt assets held through pooled investment funds, retirement accounts (both direct benefit [DB] and direct contribution [DC]), money market mutual funds, and other managed accounts. The distribution of portfolio equity assets is estimated using data from the SCF on directly held stocks and on portfolio equity assets held through pooled investment funds, retirement accounts (DB and DC), and other managed accounts. In panel b, the wealth effect is computed for each asset type and income group by multiplying the total wealth effect for that asset type (measured using Bureau of Economic Analysis and Treasury International Capital data) by each income group’s share of total assets of that same type in the SCF.
30
Figure 6. Wealth Effect of Nominal Foreign Currency Depreciation on Nonportfolio Debt Assets
(a) Distribution of Nonportfolio Debt Assets
(b) Wealth Effect of Foreign Currency Depreciation on Nonportfolio Debt Assets
Source: In panel a, I estimate the distribution of nonportfolio debt assets from information on transaction accounts, certificates of deposit, and other financial assets (which in my analysis include loans and cash holdings). In panel b, I compute the wealth effect by income group by multiplying the total wealth effect on nonportfolio debt assets (measured using Bureau of Economic Analysis and Treasury International Capital data) by each income group’s share of total Survey of Consumer Finances nonportfolio debt assets.

31
Figure 7. Wealth Effect of Nominal Foreign Currency Depreciation on FDI Assets
(a) Distribution of FDI Assets
(b) Wealth Effect of Foreign Currency Depreciation on FDI Assets
Source: In panel a, I use the 2016 Survey of Consumer Finances (SCF) to estimate holdings of portfolio assets and business equity in each income group, which I use to allocate the total wealth effect on foreign direct investment (FDI) assets to SCF households. In panel b, I compute the wealth effect by income group by multiplying the total wealth effect on FDI assets (measured using Bureau of Economic Analysis data) by each income group’s share of total SCF assets considered in panel a.

32
Appendix
The measure of income used to rank households includes market income and income from social insurance programs and is adjusted to take into account differences in household size. Assets held through defined benefit (DB) plans are not measured in the Survey of Consumer Finances (SCF) and are therefore imputed. Assumptions on the equity and debt composition of portfolio holdings rely primarily on the SCF’s definitions.
Income Measure The measure of income used to rank households is a measure of adjusted market income plus social insurance benefits.1 Market income includes labor income, business income, capital gains, capital income excluding capital gains, and other income. Capital income other than capital gains includes taxable interest and dividends, nontaxable interest, positive rental income, and the share of corporate income taxes borne by owners of capital. Labor income includes wages and salaries; the share of corporate income taxes paid by workers; the employer’s share of Social Security, Medicare, and federal unemployment insurance payroll taxes; and employer-paid health insurance premiums.2
The share of corporate income tax on workers is imputed by allocating 2015 total corporate income tax receipts (line 9 of Table 3.2 in the national income and product accounts [NIPAs] from the Bureau of Economic Analysis, equal to $326.7 billion) to SCF households on the basis of their share of total labor income.3 The employer’s share of Social Security taxes and the federal unemployment insurance tax are imputed by assuming that each individual in the primary economic unit (PEU) of a household earns the same wage income, whereas Medicare tax on the employer is imputed as 1.45 percent of the SCF household’s wage income. 4 Finally, the employer-paid health insurance is imputed by allocating 2015 total private group health insurance from NIPA Table 7.8 ($672.0 billion in 2015) to households on the basis of their reported employer-sponsored health coverage.
Social insurance benefits include benefits from Social Security, Medicare, and unemployment insurance and worker’s compensation benefits. Social Security benefits are reported in the SCF; Medicare benefits are imputed by allocating 2015 total Medicare income estimated in NIPA
1 This measure of income is consistent with the one used in the Congressional Budget Office’s recent analysis on the distribution of household income. See Congressional Budget Office (2018). 2 For CBO’s definition of adjusted market income, see Congressional Budget Office (2013). 3 For a description of CBO’s assumptions on the incidence of the corporate income tax, see Congressional Budget Office (2012). The report states, “CBO chose to allocate 25 percent of the burden of the corporate income tax to workers and assigned that amount to households in proportion to their labor income. CBO allocated the remaining 75 percent to owners of capital and assigned that tax to households in proportion to their income from interest, dividends, adjusted capital gains, and rents” (p. 17). 4 In 2015, the Social Security payroll tax on the employer was equal to 6.2 percent tax on the first $118,500 of wage income, whereas the federal unemployment insurance tax was 6 percent on the first $7,000 of wage income.

33
Table 3.12 ($633.7 billion) to eligible households; income from unemployment insurance and worker’s compensation are reported as a total in the SCF.
I then adjust the income measure by the square root of household size, which includes the number of individuals in the PEU and individuals outside the PEU.
Imputation of Assets Held Through Defined Benefit Retirement Plans My imputation procedure follows the approach used in Saez and Zucman (2016) and Bricker and colleagues (2016). First, I use the SCF to determine how total DB pension wealth in the Financial Accounts of the United States should be divided between current and future pensioners. For each SCF head of household and spouse, I count the total number of people currently receiving DB pension payments and the total number of people with a DB plan that they will draw down in the future. I then use those shares to allocate a total dollar amount to SCF current and future DB pensioners. The Federal Reserve’s Financial Accounts of the United States for the fourth quarter of 2015 show that $11.6 trillion was held in DB accounts. In my analysis, I assign $6.3 trillion to current pensioners and $5.3 trillion to future pensioners.
Second, I use survey responses on pension dollars received for current pensioners and previous year’s wages for future pensioners to distribute those allocations across SCF households. More specifically, I assign pension wealth for current pensioners proportional to each household’s share of total DB pension benefits received in the past year. I distribute future pension wealth proportional to each household’s share of total future pensioner wages.
Equity and Debt Composition of Portfolio Holdings As defined in the SCF, equity portfolio assets include the following:
■ Directly held stock;
■ Stock mutual funds—full value if described as stock mutual fund or other mutual funds and 1/2 value if described as combination mutual funds;
■ Individual retirement accounts (IRAs)/Keoghs—full value if mostly invested in stock, 1/2 value if split between stocks/bonds or stocks/money market, 1/3 value if split between stocks/bonds/money market;
■ Thrift-type retirement accounts—full value if mostly invested in stock, 1/2 value if split between stocks and interest-earning assets;
■ Savings accounts classified as 529 or other accounts that may be invested in stocks; and

34
■ Other managed assets with equity interest (annuities, trusts, managed investment accounts)—full value if mostly invested in stock, 1/2 value if split between stocks/mutual funds and bonds/CDs or “mixed/diversified,” 1/3 value if “other.”
Equity portfolio assets in my analysis also include the following:
■ Equity assets held in DB accounts (45.24 percent of total DB assets) and
■ Portfolio equity assets held by Forbes 400 individuals.
As defined in the SCF, debt portfolio assets include the following:
■ Directly held bonds and savings bonds,
■ Nonequity assets invested in quasi-liquid retirement accounts (IRAs/Keoghs and thrift-type retirement accounts),
■ Nonequity assets invested in mutual funds, and
■ Nonequity assets invested in other managed assets.
Portfolio debt assets in my analysis also include the following:
■ Debt assets held in DB accounts (54.76 percent of total DB assets),
■ Portfolio debt assets held by Forbes 400 individuals, and
■ Assets held through money market mutual funds.

35
References Cited
Auerbach, Alan J. 2010. A Modern Corporate Tax (Center for American Progress, The Hamilton Project, December), https://tinyurl.com/cap-auerbach122010 (PDF, 3.4 MB).
———. 2017. Notes on the US Wealth Effect of Border Adjustment (February), https://tinyurl.com/auerbach2017 (PDF, 197 KB).
Auerbach, Alan J., and Douglas J. Holtz-Eakin. 2016. “The Role of Border Adjustments in International Taxation,” in American Action Forum (November), www.americanactionforum.org/research/14344/.
Bank for International Settlements. 2016. Triennial Central Bank Survey: Foreign Exchange Turnover in April 2016 (September), www.bis.org/publ/rpfx16fx.pdf (319 KB).
Bénétrix, Agustín S., Philip R. Lane, and Jay C. Shambaugh. 2015. “International Currency Exposures, Valuation Effects and the Global Financial Crisis,” Journal of International Economics, vol. 96, suppl. 1 (July), pp. S98–S109, https://doi.org/10.1016/j.jinteco.2014.11.002.
Bertaut, Carol C., and Ruth Judson. 2014. Estimating U.S. Cross-Border Securities Positions: New Data and New Methods, International Finance Discussion Paper 1113 (August), www.federalreserve.gov/pubs/ifdp/2014/1113/.
Board of Governors of the Federal Reserve System. 2016a. Financial Accounts of the United States: Flow of Funds, Balance Sheets, and Integrated Macroeconomic Accounts, Fourth Quarter 2015 (Federal Reserve Statistical Release, March), www.federalreserve.gov/releases/z1/20160310/z1.pdf (2.7 MB).
———. 2016b. Federal Reserve Bank of New York, Foreign Portfolio Holdings of U.S. Securities as of June 30, 2015 (May), http://ticdata.treasury.gov/Publish/shl2015r.pdf (1.8 MB).
———. 2016c. Federal Reserve Bank of New York, U.S. Portfolio Holdings of Foreign Securities as of December 31, 2015 (October), https://go.usa.gov/xQQs2 (PDF, 1 MB).
Bricker, Jesse, Alice Henriques, Jacob Krimmel, and John Sabelhaus. 2016. “Measuring Income and Wealth at the Top Using Administrative and Survey Data,” Brookings Papers on Economic Activity, vol. 47, no. 1 (Spring), pp. 261–331, https://tinyurl.com/BPEAv47n1.

36
Buiter, Willem H. 2017. “Exchange Rate Implications of Border Tax Adjustment Neutrality,” Economics: The Open-Access, Open-Assessment E-Journal, vol. 11 (December), pp. 1–41, http://doi.org/10.5018/economics-ejournal.ja.2017-12.
Bureau of Economic Analysis. 2017. “Chapter 11: International Investment Position Accounts,” in U.S. International Economic Accounts: Concepts and Methods, https://tinyurl.com/BEAconcmethch11 (PDF, 809 KB).
Congressional Budget Office. 2012. The Distribution of Household Income and Federal Taxes, 2008 and 2009 (July), www.cbo.gov/publication/43373.
———. 2013. The Distribution of Household Income and Federal Taxes, 2010 (December), www.cbo.gov/publication/44604.
———. 2018. Distribution of Household Income, 2014 (March), www.cbo.gov/publication/53597.
De Mooij, Ruud, and Michael Keen. 2012. “‘Fiscal Devaluation’ and Fiscal Consolidation: The VAT in Troubled Times,” in Fiscal Policy After the Financial Crisis (University of Chicago Press), pp. 443–485.
Devereux, Michael, and Rita de la Feria. 2014. Defining and Implementing a Destination-Based Corporate Tax, Working Paper 14/07 (Oxford University Centre for Business Taxation, May), http://eureka.sbs.ox.ac.uk/5081/1/WP1407.pdf (613 KB).
Feldstein, Martin. 2017. “The House GOP’s Good Tax Trade-Off,” Wall Street Journal (January 6), https://tinyurl.com/WSJfeldstein2017.
Freund, Caroline, and Joseph Gagnon. 2017. Effects of Consumption Taxes on Real Exchange Rates and Trade Balances, Working Paper 17-5 (Peterson Institute for International Economics, April), https://tinyurl.com/freundgagnon2017.
Gaertner, Fabio B., Jeffrey L. Hoopes, and Edward L. Maydew. 2018. Shareholder Wealth Effects of Border Adjustment Taxation (rev. May), https://doi.org/10.2139/ssrn.2956740.
Hau, Harald, and Helene Rey. 2008. “Home Bias at the Fund Level,” American Economic Review vol. 98, no. 2 (May), pp. 333–338, http:/doi.org/10.1257/aer.98.2.333.
Joint Committee on Taxation. 2013. Modeling the Distribution of Taxes on Business Income, JCX-14-13 (October 16), www.jct.gov/publications.html?func=startdown&id=4528 (PDF, 245 KB).

37
Keen, Michael, and Murtaza H. Syed. 2006. Domestic Taxes and International Trade: Some Evidence, Working Paper 6-47 (International Monetary Fund), http://doi.org/10.5089/9781451863079.001.
Kellar, Karl L., George Korenko, and Lori A. Hellkamp. 2017. “Border Adjustments in the Destination-Based Cash-Flow Tax: A Bold Proposal With Unanswered Questions,” Bloomberg BNA (February 16), https://tinyurl.com/kellar2017 (PDF, 127 KB).
Kim, Soyoung, and Nouriel Roubini. 2008. “Twin Deficit or Twin Divergence? Fiscal Policy, Current Account, and Real Exchange Rate in the U.S.,” Journal of International Economics, vol. 74, no. 2 (March), pp. 362–383, https://doi.org/10.1016/j.jinteco.2007.05.012.
Kitchen, John. 1996. “Domestic and International Financial Market Responses to Federal Deficit Announcements,” Journal of International Money and Finance, vol. 15, no. 2 (April), pp. 239–254, https://doi.org/10.1016/0261-5606(96)00003-4.
Kyrychenko, Vladyslav, and Pauline Shum. 2009. “Who Holds Foreign Stocks and Bonds? Characteristics of Active Investors in Foreign Securities,” Financial Services Review, vol. 18, no. 1, p. 1, https://tinyurl.com/kyrychenko2009 (PDF, 426 KB).
Lane, Philip R., and Jay C. Shambaugh. 2010. “Financial Exchange Rates and International Currency Exposures,” American Economic Review, vol. 100, no. 1 (March), pp. 518–540, http://doi.org/10.1257/aer.100.1.518.
Makar, Stephen D., and Stephen P. Huffman. 1997. “Foreign Currency Risk Management Practices in U.S. Multinationals,” Journal of Applied Business Research, vol. 13, no. 2, pp. 73–86, https://doi.org/10.19030/jabr.v13i2.5763.
Munnell, Alicia H., Jean-Pierre Aubry, and Caroline V. Crawford. 2015. “Investment Returns: Defined Benefit vs. Defined Contribution Plans,” Issue in Brief 15-21 (December), https://tinyurl.com/munnell2015 (PDF, 391 KB).
Nechio, Fernanda. 2014. Foreign Stock Holdings: The Role of Information, Working Paper 2010-26 (Federal Reserve Bank of San Francisco Working Paper Series, September), www.frbsf.org/economic-research/files/wp10-26bk.pdf (579 KB).
Nicholson, Michael W. 2010. Value-Added Taxes and U.S. Trade Competitiveness, FREIT Working Paper (July), https://tinyurl.com/freitwp072010 (PDF, 535 KB).
Papaioannou, Michael G. 2006. Exchange Rate Risk Measurement and Management: Issues and Approaches for Firms, Working Paper 06/255 (International Monetary Fund, November 1), https://tinyurl.com/papaioannou2006.
38
Perese, Kevin, and Bilal Habib. 2017. “Methodological Improvements for CBO’s Analysis of the Distribution of Household Income” (presentation to the Distributional Tax Analysis Conference, Washington, D.C., September 13), www.cbo.gov/publication/53095.
Rogoff, Kenneth. 2017. “Trump’s Virtual Wall,” Project Syndicate (March 8), https://tinyurl.com/projsynd03082017.
Rosenthal, Steven. 2017. “Slashing Corporate Taxes: Foreign Investors Are Surprise Winners,” Tax Notes, vol. 157, no. 4 (October 23), pp. 559–564, https://tinyurl.com/taxnotesv157n4.
Rosenthal, Steven, and Lydia Austin. 2016. “The Dwindling Taxable Share of U.S. Corporate Stock,” Tax Notes, vol. 151, no. 6 (May 16), https://ssrn.com/abstract=2877431.
Saez, Emmanuel, and Gabriel Zucman. 2016. “Wealth Inequality in the United States Since 1913: Evidence From Capitalized Income Tax Data,” Quarterly Journal of Economics, vol. 131, no. 2 (May), pp. 519–578, https://doi.org/10.1093/qje/qjw004.
Setser, Brad W. 2017. “How Serious Is the Threat to Global Financial Stability From a Border-Adjustment Tax?” Council on Foreign Relations, Follow the Money Blog (February 14), https://tinyurl.com/cfrftmb02142017.
Viard, Alan D. 2017. “If We’re Going to Do a Border Adjustment, Let’s Do It Right,” U.S. News & World Report (January 12), https://tinyurl.com/usnwr-bordadj.